Embed Size (px)
Citation preview
Inverses of Functions
Maximizing Algebra II Performance Student Lesson: Inverses of Functions
290
Student Lesson: Inverses of Functions
TEKS: 2A.1 Foundations for functions. The student uses properties and attributes of
functions and applies functions to problem situations.
2A.1A The student is expected to identify the mathematical domains and ranges of functions and determine reasonable domain and range values for continuous and discrete situations;
2A.1B The student is expected to collect and organize data, make and interpret scatterplots, fit the graph of a function to the data, interpret the results, and proceed to model, predict, and make decisions and critical judgments.
2A.2 Foundations for functions. The student understands the importance of the skills required to manipulate symbols in order to solve problems and uses the necessary algebraic skills required to simplify algebraic expressions and solve equations and inequalities in problem situations.
2A.2A The student is expected to use tools including factoring and properties of exponents to simplify expressions and to transform and solve equations.
2A.4 Algebra and geometry. The student connects algebraic and geometric representations of functions.
2A.4A The student is expected to identify and sketch graphs of parent functions, including linear (f(x) = x), quadratic (f(x) = x2), exponential (f(x) = ax), and logarithmic (f(x) = logax) functions, absolute value of x (f(x) = |x|), square root of x (f(x) = √x), and reciprocal of x (f(x) = 1/x).
2A.4B The student is expected to extend parent functions with parameters such as a in f(x) = a/x and describe the effects of the parameter changes on the graph of parent functions.
2A.4C The student is expected to describe and analyze the relationship between a function and its inverse.
Objectives: At the end of this student lesson, students will be able to:
find the inverse of a given function; describe the inverse relations and functions using graphs, tables, and algebraic methods;
TAKS™ Objectives Supported: While the Algebra 2 TEKS are not tested on TAKS, the concepts addressed in this lesson reinforce the understanding of the following objectives.
• Objective 1: Functional Relationships • Objective 2: Properties and Attributes of Functions • Objective 10: Mathematical Processes and Mathematical Tools

Inverses of Functions
Maximizing Algebra II Performance Student Lesson: Inverses of Functions
291
Materials Prepare in Advance:
Transparency 1 and Transparency 2 Student copies of Know When to Hold ‘Em, Know When to Fold ‘Em, Multiple
Representations of Inverses and How Cheesy. For each student group of 3 - 4 students:
Several sheets of patty paper
For each student: Graphing calculator 1 copy per student of Rising Water 1 copy per student of Know When to Hold ‘Em 1 copy per student of Know When to Fold ‘Em 1 copy per student of Multiple Representations of Inverses 1 copy per student of How Cheesy
Engage The Engage portion of the lesson is designed to provide students with a concrete introduction to the concept of inverses. This part of the lesson is designed for whole group instruction and input. At the end of the Engage phase, students should be able to identify which transformations yield a functional relationship and which yield a non-functional relationship. 1. Distribute one copy of Rising Water to each student and post the Transparency: Vince
Bayou. Pose the question on the activity sheet to students and allow them a few minutes to record their responses.
2. Distribute patty paper and one copy of the Know When to Hold ‘Em activity sheet to each
student. 3. Prompt students to trace each graph onto a sheet of patty paper. Also prompt them to trace
and label the axes on their patty paper. 4. Demonstrate for students taking the top-right corner of the
patty paper in your right hand and the bottom-left corner in your left hand and flipping the patty paper over so that the top-left corner and the bottom-right corner of the patty paper change places (see figure at right).
5. Prompt students to align the origin on the patty paper with
the origin of their original graph and align the axes on the patty paper with the axes on the graph. While observing the original position and the new position of the graph they should answer the related questions.

Inverses of Functions
Maximizing Algebra II Performance Student Lesson: Inverses of Functions
292
6. Facilitate the activity using the Facilitation Questions.
Explore The Explore portion of the lesson provides the student with an opportunity to explore concretely the concept of inverses of functions. This part of the lesson is designed for groups of three to four students. At the end of the Explore phase, students should be able to describe the graphs of inverse relations as reflections across the line y = x. Students should also be able to identify whether or not two relations are inverses. 1. Distribute the Know When to Fold ‘Em activity sheet. 2. Prompt students to cut out each of the graphs so that they are on separate pieces of paper.
Note: An alternate method is to trace the graphs onto patty paper, including the axes then fold the patty paper to find lines of symmetry.
3. Prompt students to fold the paper to find and record all possible lines of symmetry for the
graphs shown and the equation for each possible line of symmetry. 4. Prompt students to select and record, in the table, the coordinates of any four points on the
original graph. Then record the coordinates of the image of each point. Recall that in transformations (both geometric and algebraic), the original figure is called the pre-image and the transformed figure is called the image.
5. Facilitate the activity using the Facilitation Questions.
Facilitation Questions – Engage Phase • When you create your new graph what is changing?
Responses may vary. Sample responses may include: The position of the curve changes; the equation of the curve changes; the intercepts change.
• When you create your new graph what is staying the same? Responses may vary. Sample responses may include: A linear function remains linear and a nonlinear function remains nonlinear.
• How can you determine if a relation is a function? Responses may vary. Determine whether there are multiple y-values for the same x-value (the vertical line test).
• Is your new graph always a function? Why or why not? No. For linear functions the new plot is a function; however, for the quadratic functions tested, the new plots have two different y-values for the same x-value.
Inverses of Functions
Maximizing Algebra II Performance Student Lesson: Inverses of Functions
293
Explain The Explain portion of the lesson is directed by the teacher to allow the students to formalize their understanding of the TEKS addressed in the lesson. In this phase, debrief the Know When to Fold ‘Em activity sheet from the Explore. Use the Facilitation Questions to prompt student groups to share their responses. At the end of the Explain phase, students should be able to communicate multiple representations of inverses of functions and relations and use multiple methods to find and describe inverse relations. Formalize
• The relations you explored are called inverse relations. When the domain and the range of two relations are reversed, they are called inverse relations.
• The inverse of a function may or may not be a function. • The graph of the inverse of a function is the reflection of the function across the line
y = x.
Facilitation Questions – Explore Phase • How can you use paper folding to determine a line of symmetry?
Responses may vary. Fold so that the two graphs coincide. The fold is the line of symmetry.
• What patterns do you notice in the table values? Responses may vary. Students should notice that the x and y values are reversed.
• How is the equation of the line of symmetry related to the pattern you discovered in your table values? Responses may vary. Students should connect the equation y = x to the reversing of the x and y values in the tables.
Facilitation Questions – Explain Phase
• How did you determine whether the relations, y = 2x – 8 and 1 42
y x= + are related to
each other in the same way the plots in graphs 1, 2, 3 and 4 are related to each other? Responses may vary. Students may have used graphs, tables, mapping or symbolic manipulation to answer the question. An example of each method is shown below.
• How did you determine whether the relations, 2 2y x= + and 2y x= ± − are related to each other in the same way the plots in graphs 1, 2, 3 and 4 are related to each other? Responses may vary. Students may have used graphs, tables, mapping or symbolic manipulation to answer the question. An example of each method is shown below.
• When two relations are related to each other in the same way the plots in graphs 1, 2, 3 and 4 are related to each other are both relations always functions? How do you know? No. This is shown by counter example. For the relations, 2 2y x= + and 2y x= ± − ,
2y x= ± − is not a function.
Inverses of Functions
Maximizing Algebra II Performance Student Lesson: Inverses of Functions
294
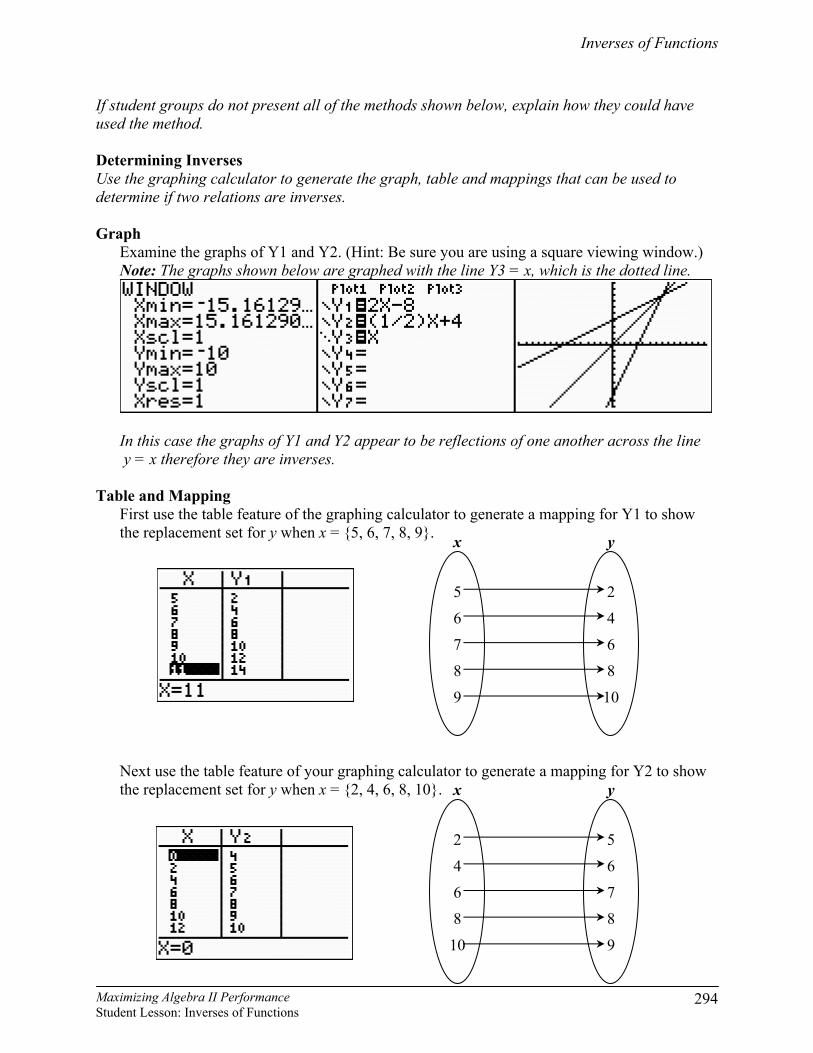
If student groups do not present all of the methods shown below, explain how they could have used the method. Determining Inverses Use the graphing calculator to generate the graph, table and mappings that can be used to determine if two relations are inverses. Graph
Examine the graphs of Y1 and Y2. (Hint: Be sure you are using a square viewing window.) Note: The graphs shown below are graphed with the line Y3 = x, which is the dotted line.
In this case the graphs of Y1 and Y2 appear to be reflections of one another across the line y = x therefore they are inverses.
Table and Mapping First use the table feature of the graphing calculator to generate a mapping for Y1 to show the replacement set for y when x = {5, 6, 7, 8, 9}.
Next use the table feature of your graphing calculator to generate a mapping for Y2 to show the replacement set for y when x = {2, 4, 6, 8, 10}.
5
6
7
8
9
x
2
4
6
8
10
y
2
4
6
8
10
x
5
6
7
8
9
y
Inverses of Functions
Maximizing Algebra II Performance Student Lesson: Inverses of Functions
295
In this case the domain and the range for the two mappings are reversed; therefore, the two relations are inverses.
Symbolically Symbolically, x (which represents the domain values) and y (which represents the range values) are interchanged.
2 8
2 8
1 42
y x
x y
y x
= −
= −
= +
Elaborate The Elaborate portion of the lesson provides an opportunity for the student to apply the concepts of the TEKS within a new situation. This part of the lesson is designed for groups of three to four students. At the end of the Elaborate phase, students will be able to determine the correct representations of function inverses and whether the inverse of a function is also a function. 1. Distribute the Multiple Representations of Inverses activity sheet. Students should follow
the directions to solve the problems and answer the questions. 2. Use the Facilitation Questions to redirect students as necessary.
Facilitation Questions – Elaborate Phase • How can you determine the inverse of a function?
Students could reflect the graph of the function across the line y = x then determine the equation of the reflected line. Symbolically, students could reverse the domain (x) and range (y) then solve for y using inverse operations.
• How can you determine if the inverse of a function is a function? Responses may vary. Determine whether there are multiple y-values for the same x-value (the vertical line test).
• Given two functions, how can you determine if one is the inverse of the other? Responses may vary. Students could graph each relation and determine if y = x is a line of symmetry, use the table feature on the calculator to compare mappings, or reverse the domain (x) and range (y) then solve for y using inverse operations.
Original function
Step 1: Interchange the variables.
Step 2: Solve for y in terms of x using inverse operations.

Inverses of Functions
Maximizing Algebra II Performance Student Lesson: Inverses of Functions
296
Evaluate The Evaluate portion of the lesson provides the student with an opportunity to demonstrate his or her understanding of the TEKS addressed in the lesson. 1. Provide each student with the How Cheesy performance assessment. 2. Provide a time limit for completion of the assessment. Students should justify their answers
through graphs, tables, and/or algebraic methods. 3. Upon completion of the assessment, a rubric should be used to assess student understanding
of the concepts addressed in the lesson.

Inverses of Functions
Maximizing Algebra II Performance Student Lesson: Inverses of Functions
297
Rising Water Answer Key
The United States Geological Survey (USGS) maintains stream flow data for rivers, creeks, and streams across the United States. One type of data they record is the gage height of a particular stream. Gage height is the height on a gage above a given zero-point. The following graph shows gage height over time for Vince Bayou near Pasadena, Texas, for February 2007.
If the date were on the vertical axis and the gage height were on the horizontal axis, what would the new graph look like? Sketch your results. Possible Response:
Inverses of Functions
Maximizing Algebra II Performance Student Lesson: Inverses of Functions
298
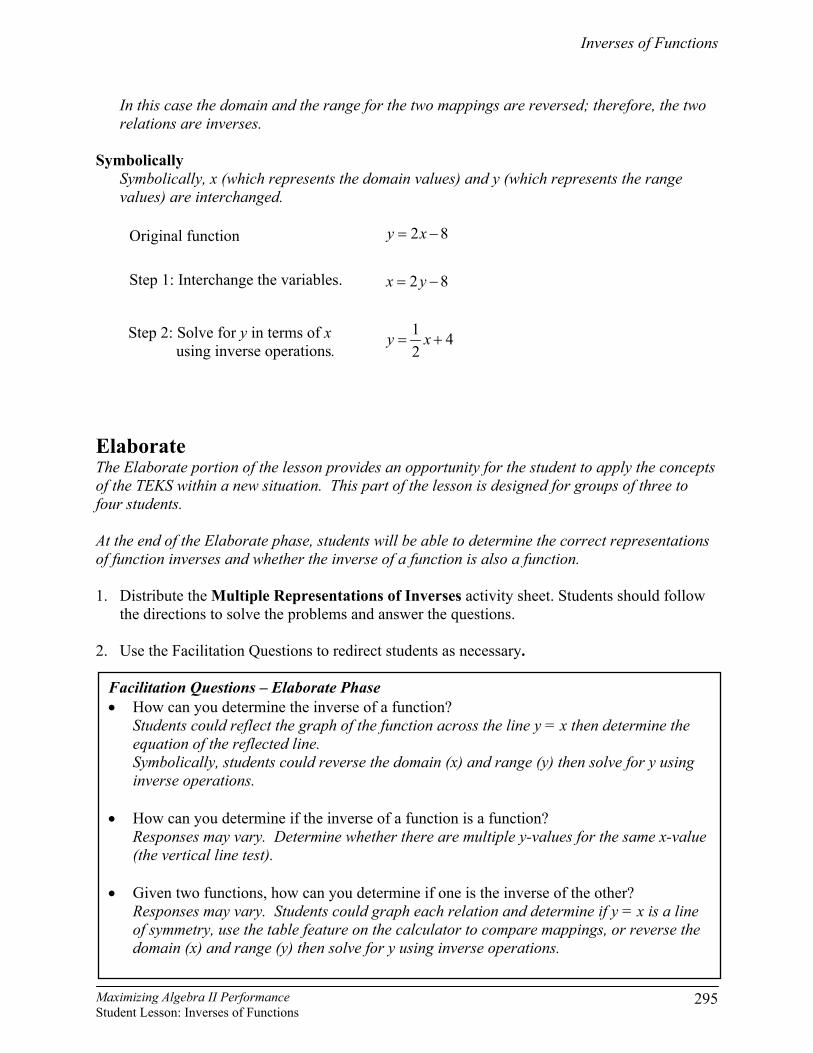
Know When to Hold ‘Em Answer Key
For each graph, trace the graph onto a sheet of patty paper. Be sure to trace the plot and the axes then label your axes on your patty paper. Take the top-right corner of your patty paper in your right hand and the bottom-left corner in your left hand and flip the patty paper over so that the top-left corner and the bottom-right corner of the patty paper change places. Align the origin on the patty paper with the origin of your original graph and align the axes on the patty paper with the axes on the graph. While observing the original position and the new position of the plot, answer the related questions.
1. How is the new graph similar to the original graph? How are they different? Responses may vary. Sample responses may include: The position of the graph changes; the equation of the graph changes; the intercepts change. The domain became the range; the range became the domain.
2. Is the new graph a function? How do you know? Yes. The new graph is a function since for each y-value there is only one x-value (the new graph passes the vertical line test).
3. How is the new graph similar to the original graph? How are they different? Responses may vary. Sample responses may include: The position of the graph changes; the equation of the graph changes; the intercepts change. The domain became the range; the range became the domain.
4. Is the new graph a function? How do you know? Yes. The new graph is a function since for each y-value there is only one x-value (the new graph passes the vertical line test).
Graph 1
Graph 2
Inverses of Functions
Maximizing Algebra II Performance Student Lesson: Inverses of Functions
299
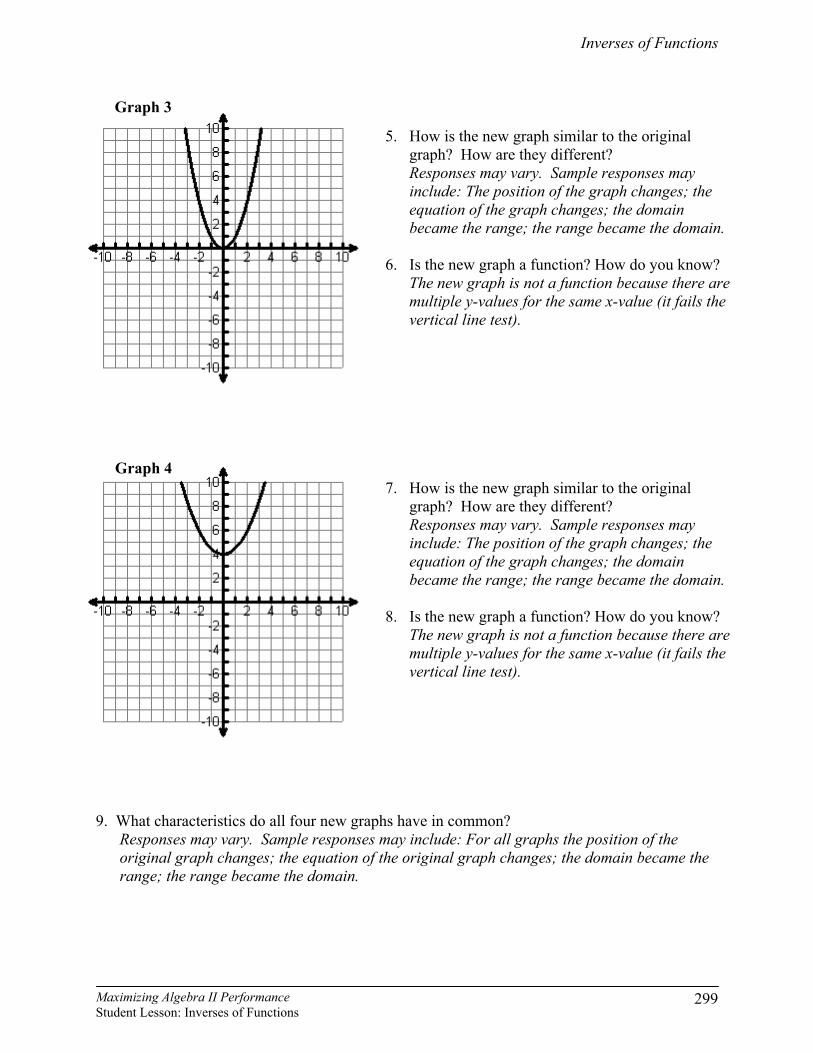
9. What characteristics do all four new graphs have in common?
Responses may vary. Sample responses may include: For all graphs the position of the original graph changes; the equation of the original graph changes; the domain became the range; the range became the domain.
5. How is the new graph similar to the original graph? How are they different? Responses may vary. Sample responses may include: The position of the graph changes; the equation of the graph changes; the domain became the range; the range became the domain.
6. Is the new graph a function? How do you know?
The new graph is not a function because there are multiple y-values for the same x-value (it fails the vertical line test).
7. How is the new graph similar to the original graph? How are they different? Responses may vary. Sample responses may include: The position of the graph changes; the equation of the graph changes; the domain became the range; the range became the domain.
8. Is the new graph a function? How do you know?
The new graph is not a function because there are multiple y-values for the same x-value (it fails the vertical line test).
Graph 3
Graph 4

Inverses of Functions
Maximizing Algebra II Performance Student Lesson: Inverses of Functions
300
10. Revisit the graph from Rising Water. Trace the graph and both axes (don’t forget to label your axes) onto a sheet of patty paper then flip the traced graph just like you did with Graphs 1 – 4. Sketch your results. Possible Response:
11. How does your flipped graph compare to your prediction from Rising Water? Explain any
similarities or differences. Responses may vary.

Inverses of Functions
Maximizing Algebra II Performance Student Lesson: Inverses of Functions
301
Know When to Fold ‘Em Answer Key
Cut out each of the graphs so that they are on separate pieces of paper. For each graph, fold the paper to find all possible lines of symmetry for the graphs shown. Identify the equation for each possible line of symmetry. In the table record the coordinates of four points on the original graph. Then record the coordinates of the image of each point.
TIP: It may be easier to trace the graphs onto patty paper, including the axes. Fold the patty paper to find lines of symmetry.
1. What is/are the equation(s) of the line(s) of symmetry for Graph 1? Responses may vary. Students should identify the line y = x.
2. Complete the table. Sample values are given.
Original Image
x y x y −5 −9 −9 −5 −3 −7 −7 −3 −1 −5 −5 −1 1 −3 −3 1
3. What is/are the equation(s) of the line(s) of symmetry for Graph 2? Responses may vary. Students should identify the line y = x.
4. Complete the table.
Sample values are given. Original Image
x y x y −2 10 10 −2 2 2 2 2 4 −2 −2 4 8 −10 −10 8
Graph 1
Graph 2
Inverses of Functions
Maximizing Algebra II Performance Student Lesson: Inverses of Functions
302
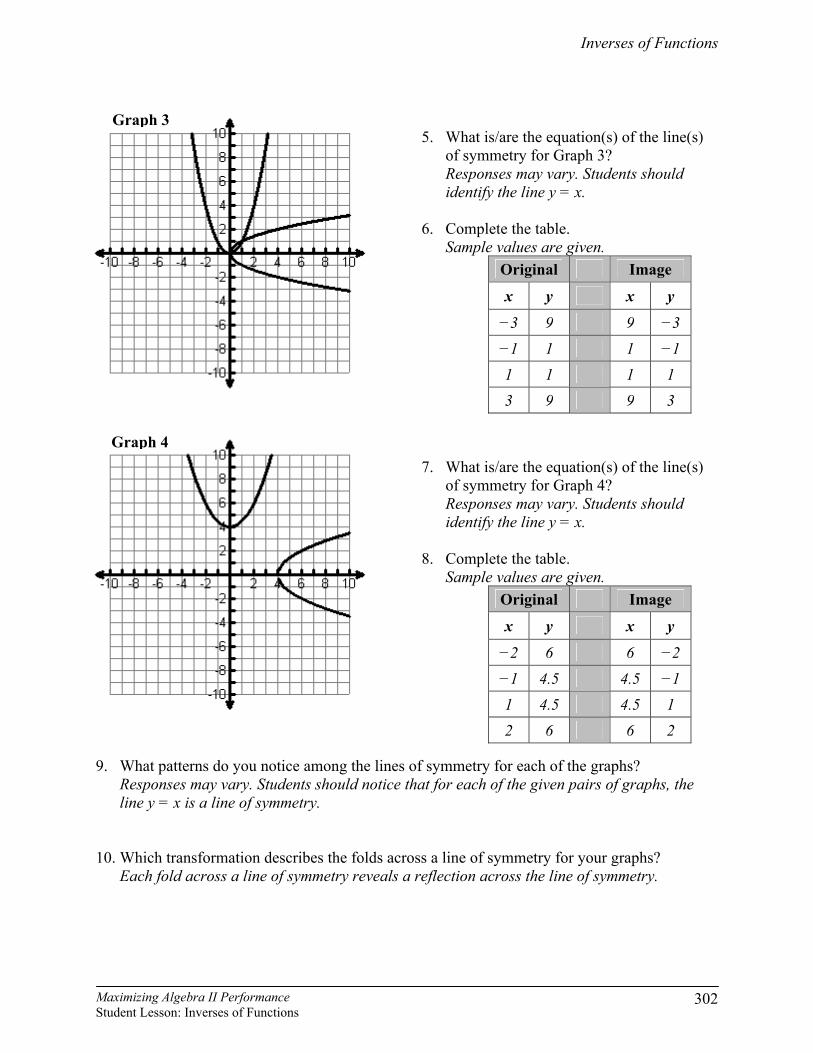
9. What patterns do you notice among the lines of symmetry for each of the graphs?
Responses may vary. Students should notice that for each of the given pairs of graphs, the line y = x is a line of symmetry.
10. Which transformation describes the folds across a line of symmetry for your graphs?
Each fold across a line of symmetry reveals a reflection across the line of symmetry.
5. What is/are the equation(s) of the line(s) of symmetry for Graph 3? Responses may vary. Students should identify the line y = x.
6. Complete the table. Sample values are given.
Original Image
x y x y −3 9 9 −3 −1 1 1 −1 1 1 1 1 3 9 9 3
7. What is/are the equation(s) of the line(s) of symmetry for Graph 4? Responses may vary. Students should identify the line y = x.
8. Complete the table.
Sample values are given. Original Image
x y x y −2 6 6 −2 −1 4.5 4.5 −1 1 4.5 4.5 1 2 6 6 2
Graph 3
Graph 4

Inverses of Functions
Maximizing Algebra II Performance Student Lesson: Inverses of Functions
303
11. How are the x- and y-coordinates from the original related to the x- and y-coordinates of its image? How could you represent this relationship symbolically? The x-coordinates from the first graph become the y-coordinates for the second graph, and the y-coordinates from the first graph become the x-coordinates for the second graph. Symbolically, this relationship can be represented using the transformation mapping
( ) ( ): , ,T x y y x→ .
12. Are the relations, y = 2x – 8 and 1 42
y x= + related to each other in the same way as graphs
1, 2, 3 and 4 are related to each other? How do you know? Yes. Students may have graphed each relation and determine if y = x is a line of symmetry or used the table feature on the calculator to compare mappings.
13. Are the relations, y = 2x – 8 and 1 42
y x= + both functions? How do you know?
Yes. Both relations are functions since in both cases for each y-value, there is only one x-value.
14. Are the relations, 2 2y x= + and 2y x= ± − related to each other in the same way the plots
in graphs 1, 2, 3 and 4 are related to each other? How do you know? Yes. Students may have graphed each relation and determine if y = x is a line of symmetry or used the table feature on the calculator to compare mappings.
15. Are the relations, 2 2y x= + and 2y x= ± − both functions? How do you know? The relation 2 2y x= + is a function; however, the relation 2y x= ± − is not a function because there are multiple y-values for the same x-value (i.e., it fails the vertical line test).
Inverses of Functions
Maximizing Algebra II Performance Student Lesson: Inverses of Functions
304
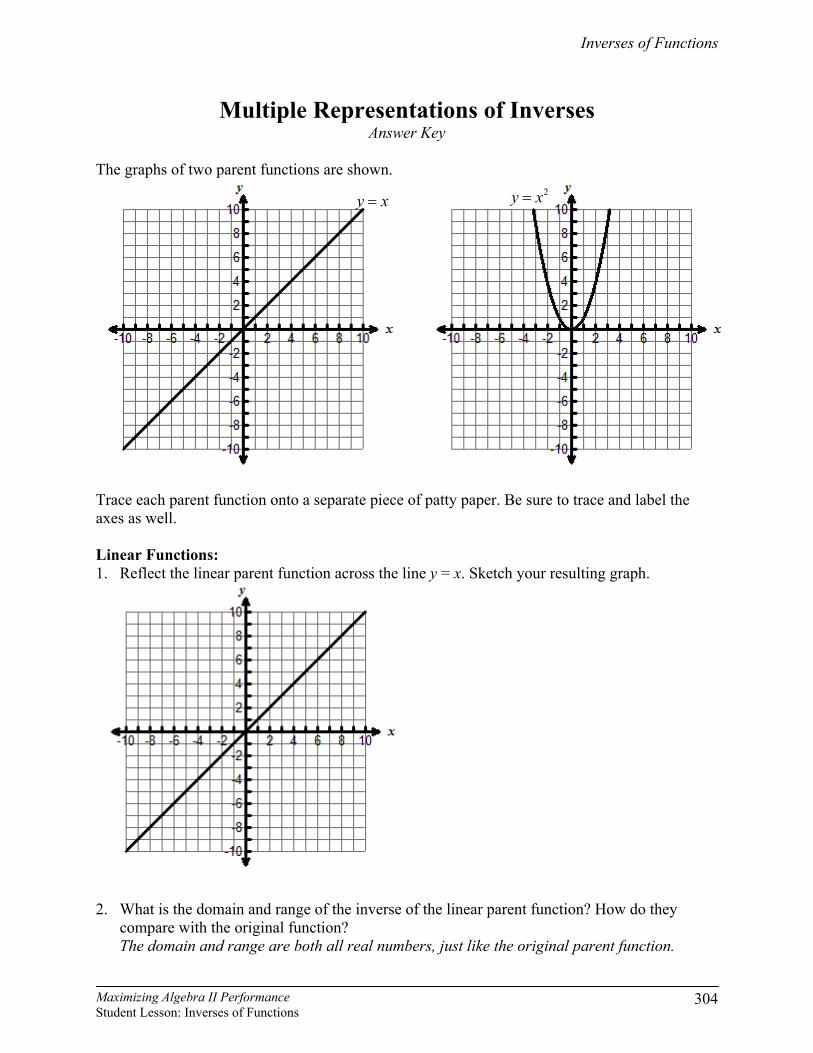
Multiple Representations of Inverses Answer Key
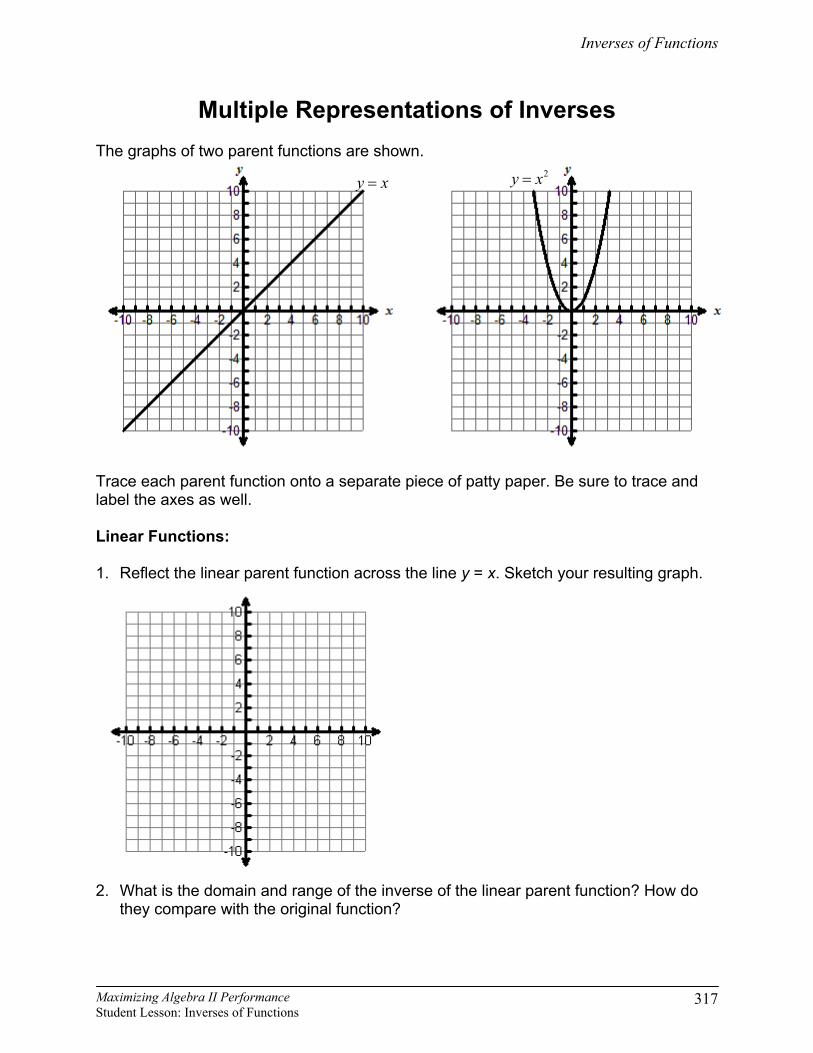
The graphs of two parent functions are shown. Trace each parent function onto a separate piece of patty paper. Be sure to trace and label the axes as well. Linear Functions: 1. Reflect the linear parent function across the line y = x. Sketch your resulting graph.
2. What is the domain and range of the inverse of the linear parent function? How do they compare with the original function? The domain and range are both all real numbers, just like the original parent function.
2y x=y x=

Inverses of Functions
Maximizing Algebra II Performance Student Lesson: Inverses of Functions
305
3. Is the inverse of the linear parent function also a function? How do you know? Yes, the inverse is also a function since for each x-value there is only one corresponding y-value.
4. What kind of function is the inverse of a linear function?
The inverse is also a linear function.
5. What is the inverse of the function 2 75
y x= − ?
( )5y x 72
= + or 5 35y x2 2
= +
6. How did you determine the inverse?
Students could reflect the graph of the function across the line y = x then determine the equation of the reflected line. Symbolically, students may reverse the domain (x) and range (y) then solve for y using inverse operations.
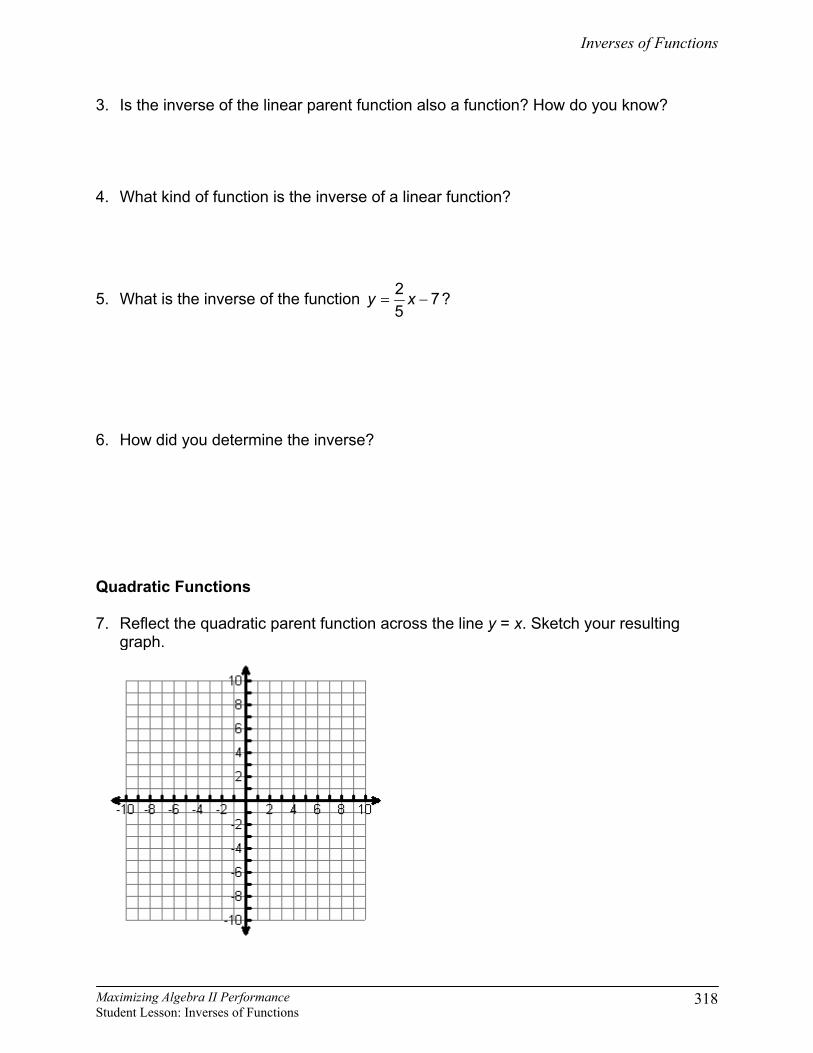
Quadratic Functions 7. Reflect the quadratic parent function across the line y = x. Sketch your resulting graph.
8. What is the domain and range of the inverse of the quadratic parent function? How do they
compare with the original function? The domain is {x: x ≥ 0}; the range is all real numbers. The domain of the original parent function became the range of the inverse. The range of the original parent function became the domain of the inverse.
Inverses of Functions
Maximizing Algebra II Performance Student Lesson: Inverses of Functions
306
9. Is the inverse of the quadratic parent function also a function? How do you know? No. For most x-values (all except x = 0), there are two corresponding y-values. For example, when x = 4, y = +2 and −2.
10. If the inverse is not a function, how can we restrict the domain and/or range so that the inverse is a function? If we only consider the range {y: y ≥ 0}, then the inverse becomes a function.
11. What kind of function is the inverse of a quadratic function?
The inverse of a quadratic function is a square root function.
12. What is the inverse function of the function ( )23 1 2y x= − − + ?
x 2y 13−
= +−
or x 2y 13−
= −−
Typically, the principal (positive) square root is used as the inverse of a quadratic function.
13. How did you determine the inverse? Students could reflect the graph of the function across the line y = x then determine the equation of the reflected curve. Symbolically, students may reverse the domain (x) and range (y) then solve for y using inverse operations.
Inverses of Functions
Maximizing Algebra II Performance Student Lesson: Inverses of Functions
307
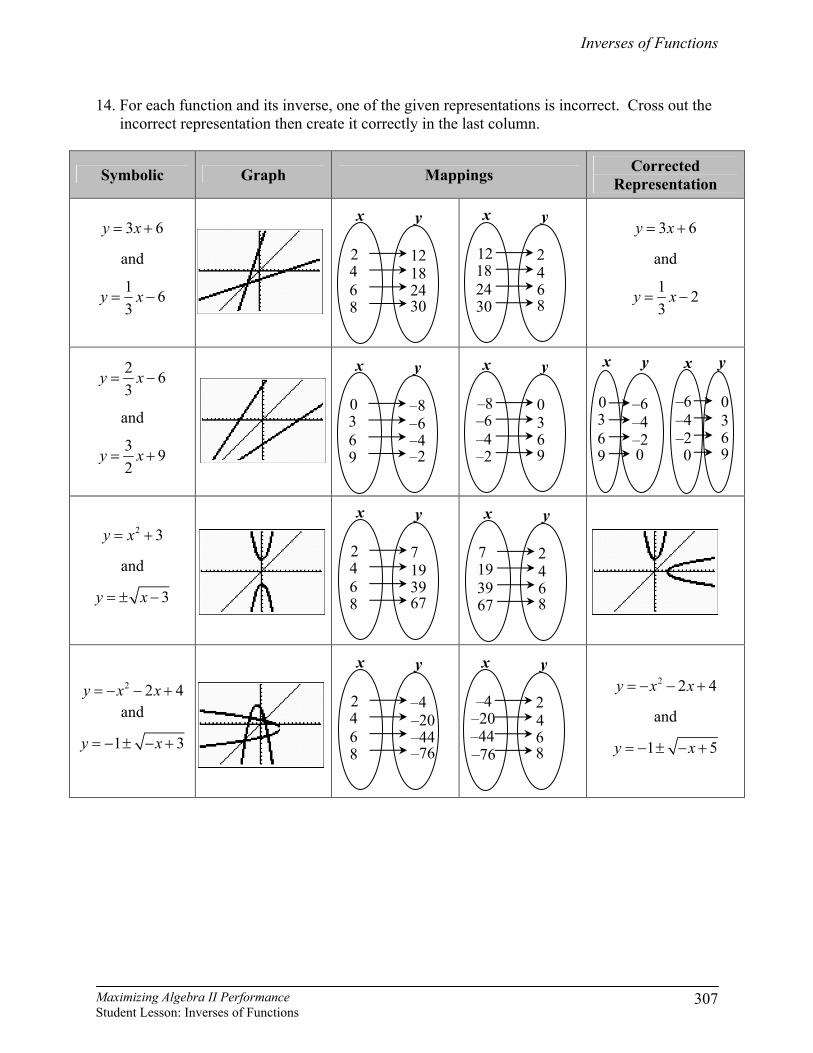
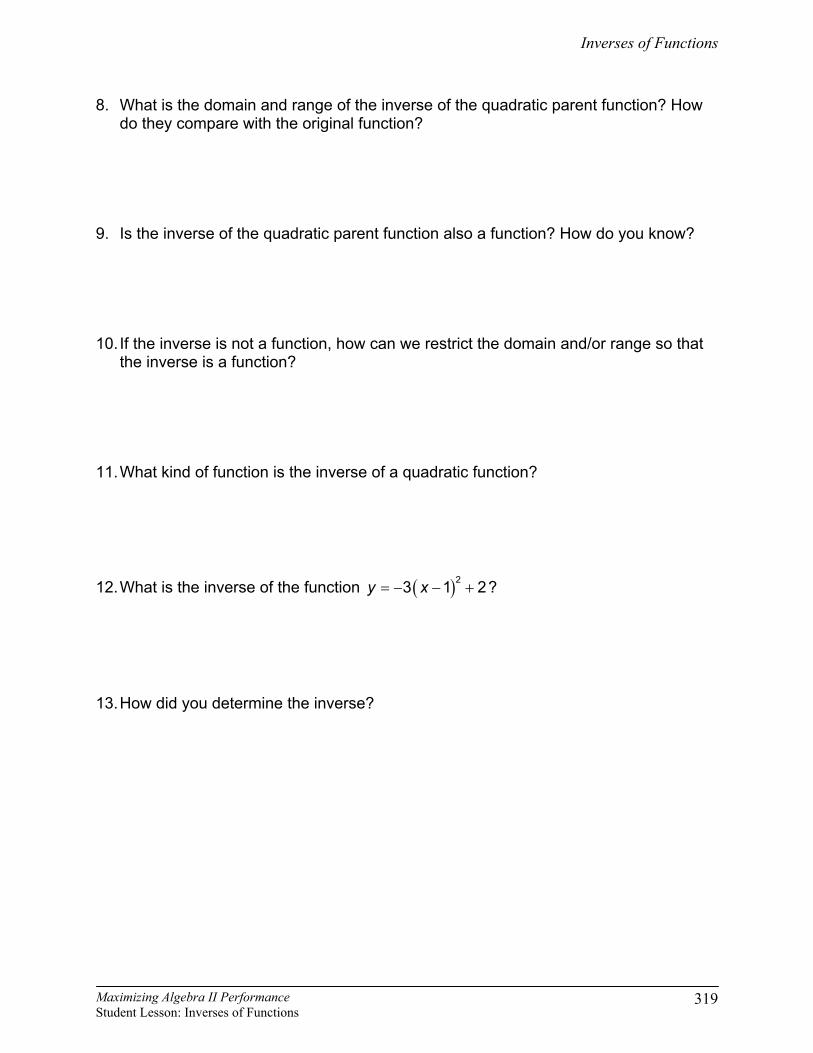
14. For each function and its inverse, one of the given representations is incorrect. Cross out the incorrect representation then create it correctly in the last column.
Symbolic Graph Mappings Corrected Representation
3 6y x= +
and
1 63
y x= −
3 6y x= +
and
1 23
y x= −
2 63
y x= −
and
3 92
y x= +
2 3y x= +
and
3y x= ± −
2 2 4y x x= − − +and
1 3y x= − ± − +
2 2 4y x x= − − +
and
1 5y x= − ± − +
x y
–20
–76–44
–4 2468
x y
18
3024
12 2468
x y
3
96
0 –8–6–4–2
x y
–6
–2–4
–8 0369
x y
4
86
2 7193967
x y
19
6739
7 2468
x y
4
86
2 –4–20–44–76
x y
4
86
2 12182430
x y
3
9 6
0 –6 –4 –2 0
x y
–4
0–2
–6 0369

Inverses of Functions
Maximizing Algebra II Performance Student Lesson: Inverses of Functions
308
How Cheesy Answer Key
At the Cheesy Cheese Cake Store the charge to deliver a cheese cake to a party is determined by the number of miles the party is from the Cheesy Cheese Cake Store. There is fixed administrative charge of $10 plus $0.45 for each mile driven one way. The amount charged can be modeled by the function y = 0.45x + 10 where x is the number of miles driven one way and y is the total charge. On a recent delivery Craig charged a customer $19.90, but when he went to fill out his delivery log, he could not remember the number of miles he drove. How many miles did Craig drive? Justify your answer using the inverse of the function y = 0.45x + 10.
Craig drove 22 miles.

Inverses of Functions
Maximizing Algebra II Performance Student Lesson: Inverses of Functions
309
Transparency: Vince Bayou
Inverses of Functions
Maximizing Algebra II Performance Student Lesson: Inverses of Functions
310
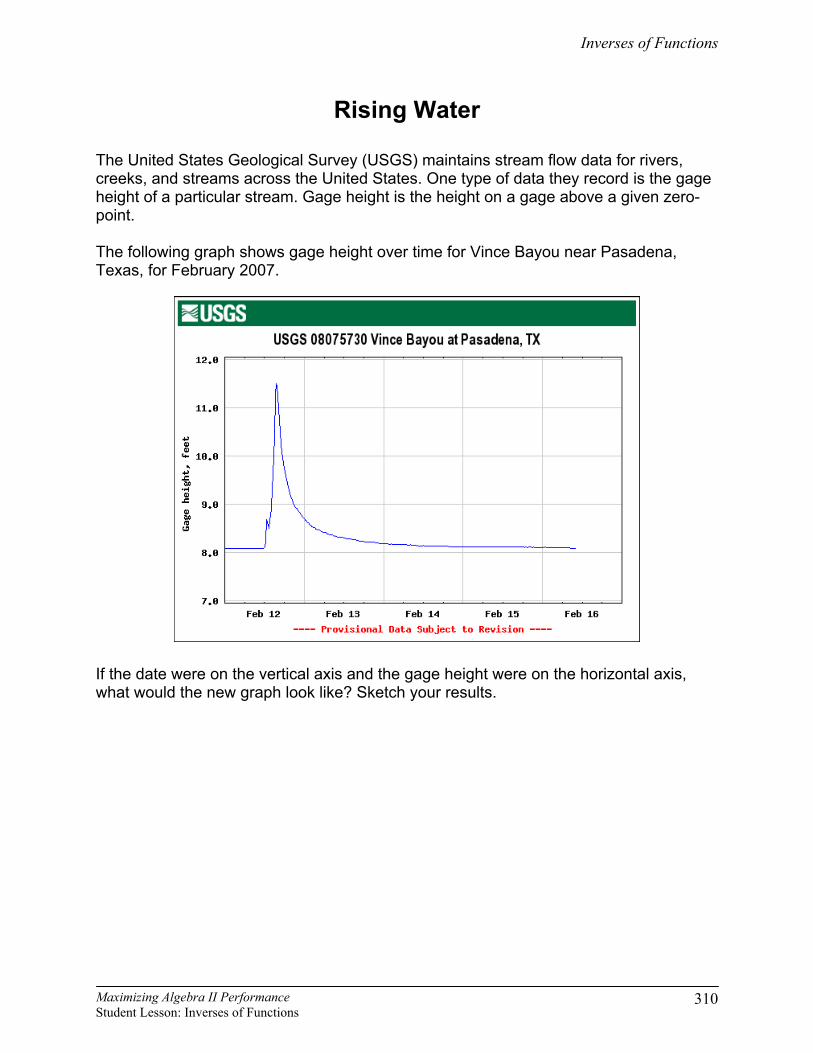
Rising Water
The United States Geological Survey (USGS) maintains stream flow data for rivers, creeks, and streams across the United States. One type of data they record is the gage height of a particular stream. Gage height is the height on a gage above a given zero-point. The following graph shows gage height over time for Vince Bayou near Pasadena, Texas, for February 2007.
If the date were on the vertical axis and the gage height were on the horizontal axis, what would the new graph look like? Sketch your results.

Inverses of Functions
Maximizing Algebra II Performance Student Lesson: Inverses of Functions
311
Know When to Hold ‘Em For each graph, trace the graph onto a sheet of patty paper. Be sure to trace the plot and the axes then label your axes on your patty paper. Take the top-right corner of your patty paper in your right hand and the bottom-left corner in your left hand and flip the patty paper over so that the top-left corner and the bottom-right corner of the patty paper change places. Align the origin on the patty paper with the origin of your original graph and align the axes on the patty paper with the axes on the graph. While observing the original position and the new position of the plot, answer the related questions.
Graph 1
Graph 2
1. How is the new graph similar to the original graph? How are they different?
2. Is the new graph a function? How do you
know?
3. How is the new graph similar to the original graph? How are they different?
4. Is the new graph a function? How do you
know?
Inverses of Functions
Maximizing Algebra II Performance Student Lesson: Inverses of Functions
312
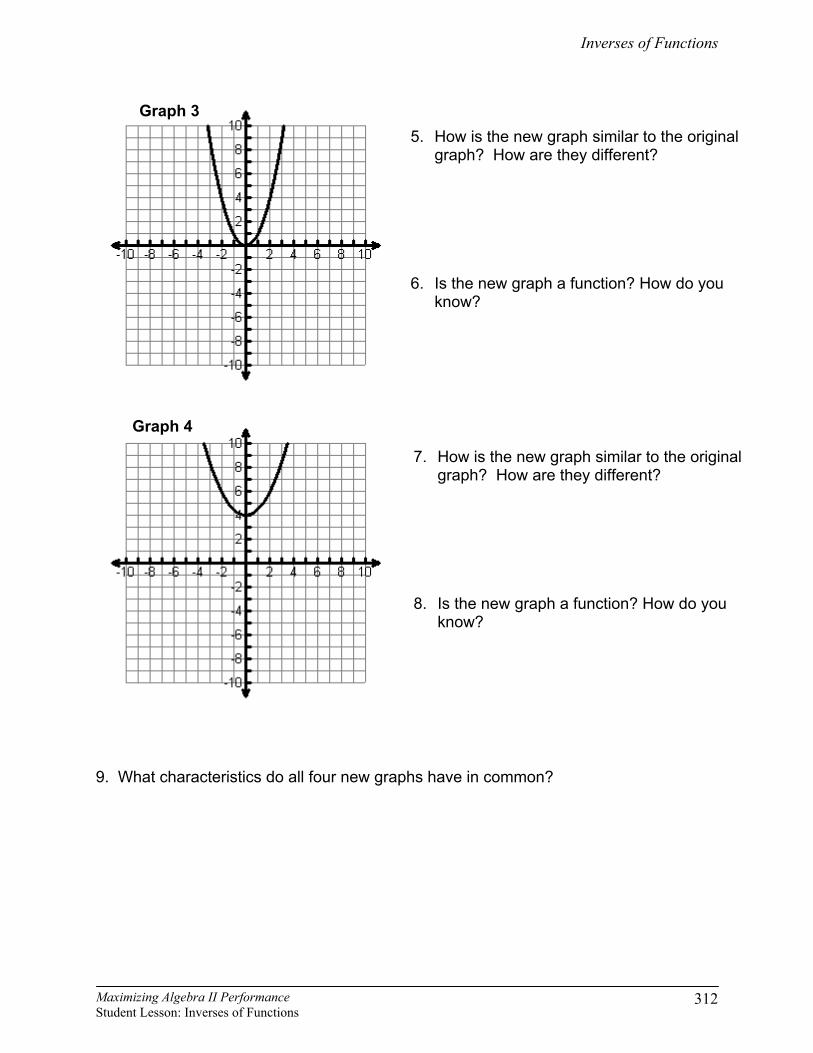
9. What characteristics do all four new graphs have in common?
Graph 4
Graph 3 5. How is the new graph similar to the original
graph? How are they different? 6. Is the new graph a function? How do you
know?
7. How is the new graph similar to the original graph? How are they different?
8. Is the new graph a function? How do you
know?

Inverses of Functions
Maximizing Algebra II Performance Student Lesson: Inverses of Functions
313
10. Revisit the graph from Rising Water. Trace the graph and both axes (don’t forget to label your axes) onto a sheet of patty paper then flip the traced graph just like you did with Graphs 1 – 4. Sketch your results.
11. How does your flipped graph compare to your prediction from Rising Water?
Explain any similarities or differences.
Inverses of Functions
Maximizing Algebra II Performance Student Lesson: Inverses of Functions
314
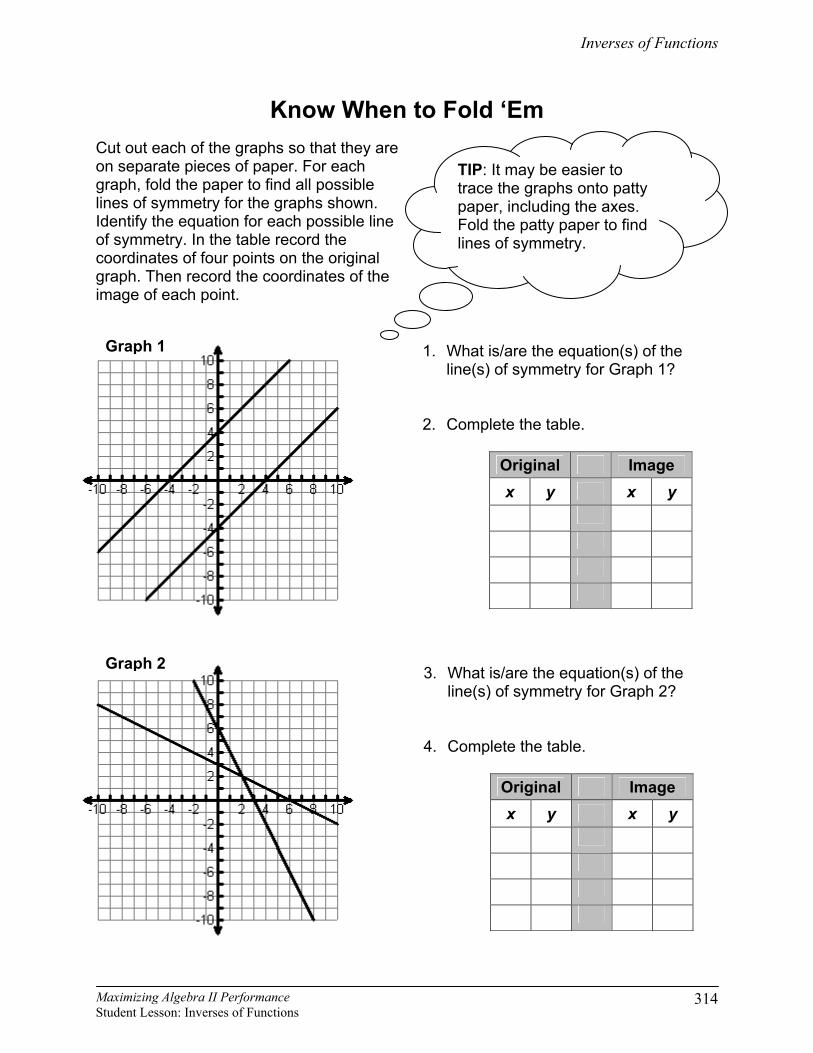
Know When to Fold ‘Em
Cut out each of the graphs so that they are on separate pieces of paper. For each graph, fold the paper to find all possible lines of symmetry for the graphs shown. Identify the equation for each possible line of symmetry. In the table record the coordinates of four points on the original graph. Then record the coordinates of the image of each point.
TIP: It may be easier to trace the graphs onto patty paper, including the axes. Fold the patty paper to find lines of symmetry.
1. What is/are the equation(s) of the line(s) of symmetry for Graph 1?
2. Complete the table.
Original Image x y x y
3. What is/are the equation(s) of the line(s) of symmetry for Graph 2?
4. Complete the table.
Original Image x y x y
Graph 1
Graph 2

Inverses of Functions
Maximizing Algebra II Performance Student Lesson: Inverses of Functions
315
9. What patterns do you notice among the lines of symmetry for each of the graphs? 10. Which transformation describes the folds across a line of symmetry for your graphs?
5. What is/are the equation(s) of the line(s) of symmetry for Graph 3?
6. Complete the table.
Original Image x y x y
7. What is/are the equation(s) of the line(s) of symmetry for Graph 4?
8. Complete the table.
Original Image x y x y
Graph 3
Graph 4

Inverses of Functions
Maximizing Algebra II Performance Student Lesson: Inverses of Functions
316
11. How are the x- and y-coordinates from the original related to the x- and y-coordinates of its image? How could you represent this relationship symbolically?
12. Are the relations, y = 2x – 8 and 1 42
= +y x related to each other in the same way
the plots in graphs 1, 2, 3 and 4 are related to each other? How do you know?
13. Are the relations, y = 2x – 8 and 1 42
= +y x both functions? How do you know?
14. Are the relations, = +2 2y x and = ± − 2y x related to each other in the same way
the plots in graphs 1, 2, 3 and 4 are related to each other? How do you know?
15. Are the relations, = +2 2y x and = ± − 2y x both functions? How do you know?
Inverses of Functions
Maximizing Algebra II Performance Student Lesson: Inverses of Functions
317
Multiple Representations of Inverses The graphs of two parent functions are shown. Trace each parent function onto a separate piece of patty paper. Be sure to trace and label the axes as well. Linear Functions: 1. Reflect the linear parent function across the line y = x. Sketch your resulting graph.
2. What is the domain and range of the inverse of the linear parent function? How do
they compare with the original function?
2y x=y x=
Inverses of Functions
Maximizing Algebra II Performance Student Lesson: Inverses of Functions
318
3. Is the inverse of the linear parent function also a function? How do you know? 4. What kind of function is the inverse of a linear function?
5. What is the inverse of the function 2 75
y x= − ?
6. How did you determine the inverse?
Quadratic Functions 7. Reflect the quadratic parent function across the line y = x. Sketch your resulting
graph.
Inverses of Functions
Maximizing Algebra II Performance Student Lesson: Inverses of Functions
319
8. What is the domain and range of the inverse of the quadratic parent function? How do they compare with the original function?
9. Is the inverse of the quadratic parent function also a function? How do you know?
10. If the inverse is not a function, how can we restrict the domain and/or range so that the inverse is a function?
11. What kind of function is the inverse of a quadratic function? 12. What is the inverse of the function ( )23 1 2y x= − − + ?
13. How did you determine the inverse?
Inverses of Functions
Maximizing Algebra II Performance Student Lesson: Inverses of Functions
320
14. For each function and its inverse, one of the given representations is incorrect. Cross out the incorrect representation then create it correctly in the last column.
Symbolic Graph Mappings Corrected Representation
3 6= +y x
and
1 63
= −y x
2 63
= −y x
and
3 92
= +y x
2 3= +y x
and
3= ± −y x
2 2 4= − − +y x xand
1 3= − ± − +y x
x y
–20
–76–44
–4 2468
x y
18
3024
12 2468
x y
3
96
0 –8–6–4–2
x y
–6
–2–4
–8 0369
x y
4
86
2 7193967
x y
19
6739
7 2468
x y
4
86
2 –4–20–44–76
x y
4
86
2 12182430
Inverses of Functions
Maximizing Algebra II Performance Student Lesson: Inverses of Functions
321
How Cheesy At the Cheesy Cheese Cake Store the charge to deliver a cheese cake to a party is determined by the number of miles the party is from the Cheesy Cheese Cake Store. There is fixed administrative charge of $10 plus $0.45 for each mile driven one way. The amount charged can be modeled by the function y = 0.45x + 10 where x is the number of miles driven one way and y is the total charge. On a recent delivery Craig charged a customer $19.90, but when he went to fill out his delivery log, he could not remember the number of miles he drove. How many miles did Craig drive? Justify your answer using the inverse of the function y = 0.45x + 10.
![The Structure of Inverses in Schema Mappings · For s-t tgd mappings, Fagin [Fag07] focused only on inversesspecified by tgds, and left open the problem of char-acterizing the language](https://img.pdfslide.us/doc/110x75/5e4181a5c1682537dc3e84f6/the-structure-of-inverses-in-schema-mappings-for-s-t-tgd-mappings-fagin-fag07.jpg)