Embed Size (px)
Citation preview
Absolute Value Functions
Maximizing Algebra II Performance Student Lesson: Absolute Value Functions
357
Student Lesson: Absolute Value Functions TEKS:
a(5) Tools for algebraic thinking. Techniques for working with functions and equations are essential in understanding underlying relationships. Students use a variety of representations (concrete, pictorial, numerical, symbolic, graphical, and verbal), tools, and technology (including, but not limited to, calculators with graphing capabilities, data collection devices, and computers) to model mathematical situations to solve meaningful problems.
a(6) Underlying mathematical processes. Many processes underlie all content areas in mathematics. As they do mathematics, students continually use problem-solving, language and communication, and reasoning (justification and proof) to make connections within and outside mathematics. Students also use multiple representations, technology, applications and modeling, and numerical fluency in problem-solving contexts.
2A.1 Foundations for functions. The student uses properties and attributes of functions and applies functions to problem situations.
2A.1A The student is expected to identify the mathematical domains and ranges of functions and determine reasonable domain and range values for continuous and discrete situations.
2A.1B The student is expected to collect and organize data, make and interpret scatterplots, fit the graph of a function to the data, interpret the results, and proceed to model, predict, and make decisions and critical judgments.
2A.2 Foundations for functions. The student understands the importance of the skills required to manipulate symbols in order to solve problems and uses the necessary algebraic skills required to simplify algebraic expressions and solve equations and inequalities in problem situations.
2A.2A The student is expected to use tools including factoring and properties of exponents to simplify expressions and to transform and solve equations.
2A.4 Algebra and geometry. The student connects algebraic and geometric representations of functions.
2A.4A The student is expected to identify and sketch graphs of parent functions, including linear (f(x) =x), quadratic (f(x) =x²), exponential (f(x) = xa ), and logarithmic (f(x) = loga x ) functions, absolute value of x (f(x) = x ), square
root of x ((f(x) = x ), and reciprocal of x ( ) 1f xx
⎛ ⎞=⎜ ⎟⎝ ⎠
.
2A.4B The student is expected to extend parent functions with parameters such as a in f(x) = a/x and describes the effects of the parameter changes on the graph of parent functions.
Absolute Value Functions
Maximizing Algebra II Performance Student Lesson: Absolute Value Functions
358
Objectives: At the end of this student lesson, students will be able to: • describe the absolute value parent function as a pair of linear functions with restricted
domain and • identify, sketch, and describe the effects of parameter changes on the graph of the absolute
value parent function. TAKS™ Objectives Supported: While the Algebra II TEKS are not tested on TAKS, the concepts addressed in this lesson reinforce the understanding of the following objectives.
• Objective 1: Functional Relationships • Objective 2: Properties and Attributes of Functions • Objective 10: Mathematical Processes and Mathematical Tools
Materials: Prepare in Advance: Copies of participant pages, copies of The Fire Station Problem
Graphic Sheets taped together
Presenter Materials: Overhead graphing calculator
Per group: The Fire Station Problem Graphic Sheets taped together to represent a street, chart paper
Per participant: Copy of participant pages, graphing calculator
Absolute Value Functions
Maximizing Algebra II Performance Student Lesson: Absolute Value Functions
359
Engage The Engage portion of the lesson is designed to provide students with a concrete connection to the Explore phase of the lesson.
Facilitation Questions: • There are many factors that affect the price of home insurance. “What do you think some of
the factors might be?” Possible responses may include: the age of the home, the crime rate in the neighborhood,
the type of construction of the home, weather in the area, such as hurricanes, tornadoes, flooding, a flood plain location, smoke alarm and security system, quality of the fire department, quality of the police department, size of the home, value of the home, working fire hydrants, location of the fire department, or distance to the nearest fire hydrant.
• If students do not mention the distance to a fire hydrant or fire station, ask, “Do you think that the distance from your home to a fire station or fire hydrant would
matter?” Hopefully, students will say that the distance does matter. • “Why do you think it matters?” Possible responses: The distance your home is from a fire station or fire hydrant may affect
the fire department’s response time. If the fire trucks can get water on the home faster, there may be less damage for the insurance company to pay.
• How far do you think your home is from the fire station? Responses may vary.
Absolute Value Functions
Maximizing Algebra II Performance Student Lesson: Absolute Value Functions
360
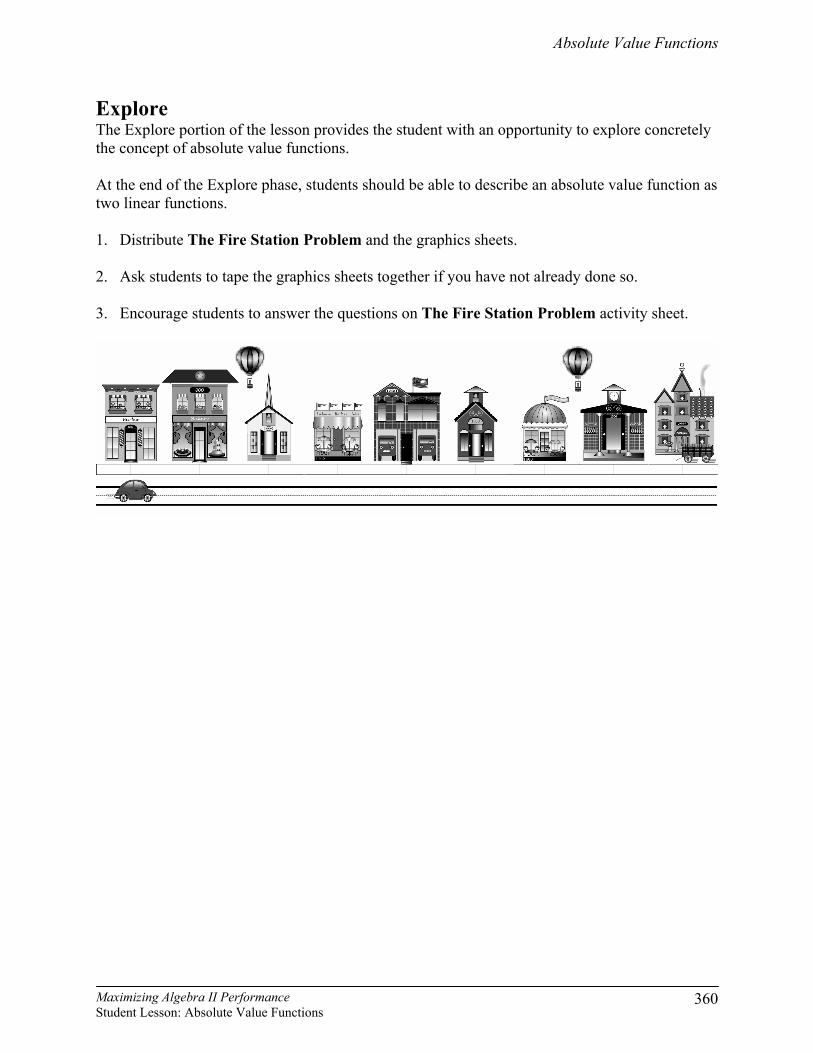
Explore The Explore portion of the lesson provides the student with an opportunity to explore concretely the concept of absolute value functions. At the end of the Explore phase, students should be able to describe an absolute value function as two linear functions. 1. Distribute The Fire Station Problem and the graphics sheets. 2. Ask students to tape the graphics sheets together if you have not already done so. 3. Encourage students to answer the questions on The Fire Station Problem activity sheet.
Absolute Value Functions
Maximizing Algebra II Performance Student Lesson: Absolute Value Functions
361
The Fire Station Problem Answer Key
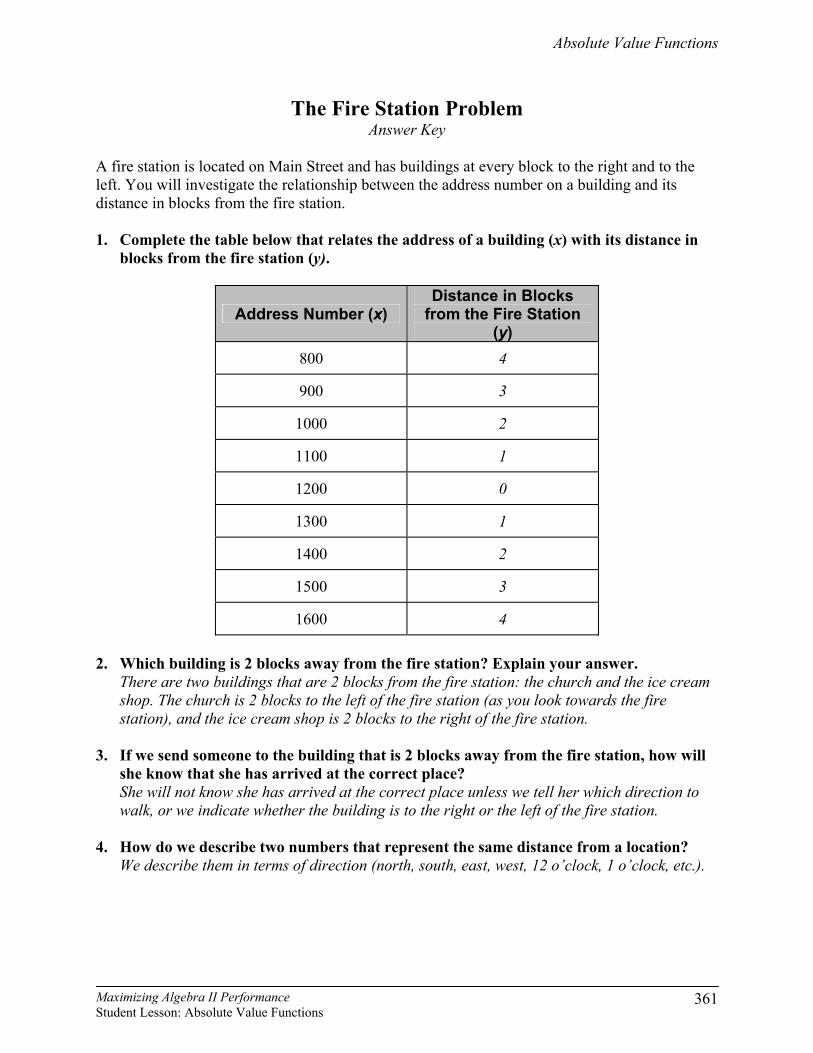
A fire station is located on Main Street and has buildings at every block to the right and to the left. You will investigate the relationship between the address number on a building and its distance in blocks from the fire station. 1. Complete the table below that relates the address of a building (x) with its distance in
blocks from the fire station (y).
Address Number (x) Distance in Blocks
from the Fire Station (y)
800 4
900 3
1000 2
1100 1
1200 0
1300 1
1400 2
1500 3
1600 4 2. Which building is 2 blocks away from the fire station? Explain your answer. There are two buildings that are 2 blocks from the fire station: the church and the ice cream
shop. The church is 2 blocks to the left of the fire station (as you look towards the fire station), and the ice cream shop is 2 blocks to the right of the fire station.
3. If we send someone to the building that is 2 blocks away from the fire station, how will
she know that she has arrived at the correct place? She will not know she has arrived at the correct place unless we tell her which direction to
walk, or we indicate whether the building is to the right or the left of the fire station. 4. How do we describe two numbers that represent the same distance from a location? We describe them in terms of direction (north, south, east, west, 12 o’clock, 1 o’clock, etc.).
Absolute Value Functions
Maximizing Algebra II Performance Student Lesson: Absolute Value Functions
362
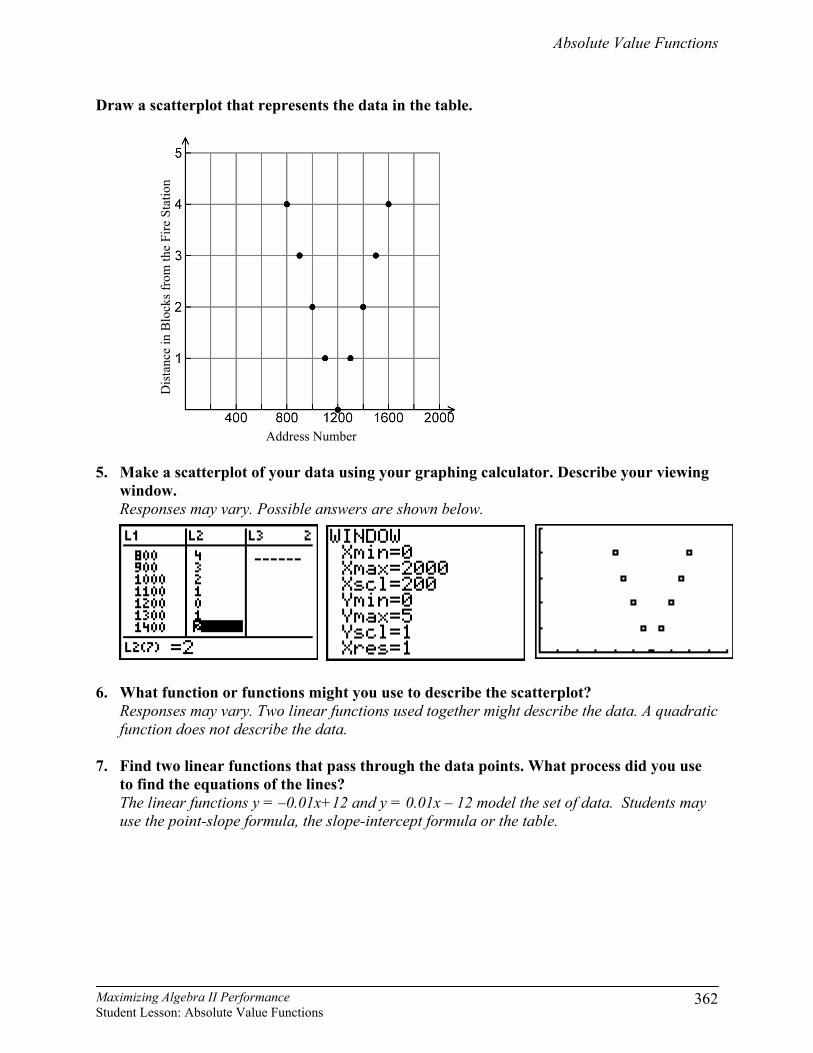
Draw a scatterplot that represents the data in the table.
5. Make a scatterplot of your data using your graphing calculator. Describe your viewing
window. Responses may vary. Possible answers are shown below. 6. What function or functions might you use to describe the scatterplot? Responses may vary. Two linear functions used together might describe the data. A quadratic
function does not describe the data. 7. Find two linear functions that pass through the data points. What process did you use
to find the equations of the lines? The linear functions y = –0.01x+12 and y = 0.01x – 12 model the set of data. Students may
use the point-slope formula, the slope-intercept formula or the table.
Address Number
Dis
tanc
e in
Blo
cks f
rom
the
Fire
Sta
tion
Absolute Value Functions
Maximizing Algebra II Performance Student Lesson: Absolute Value Functions
363
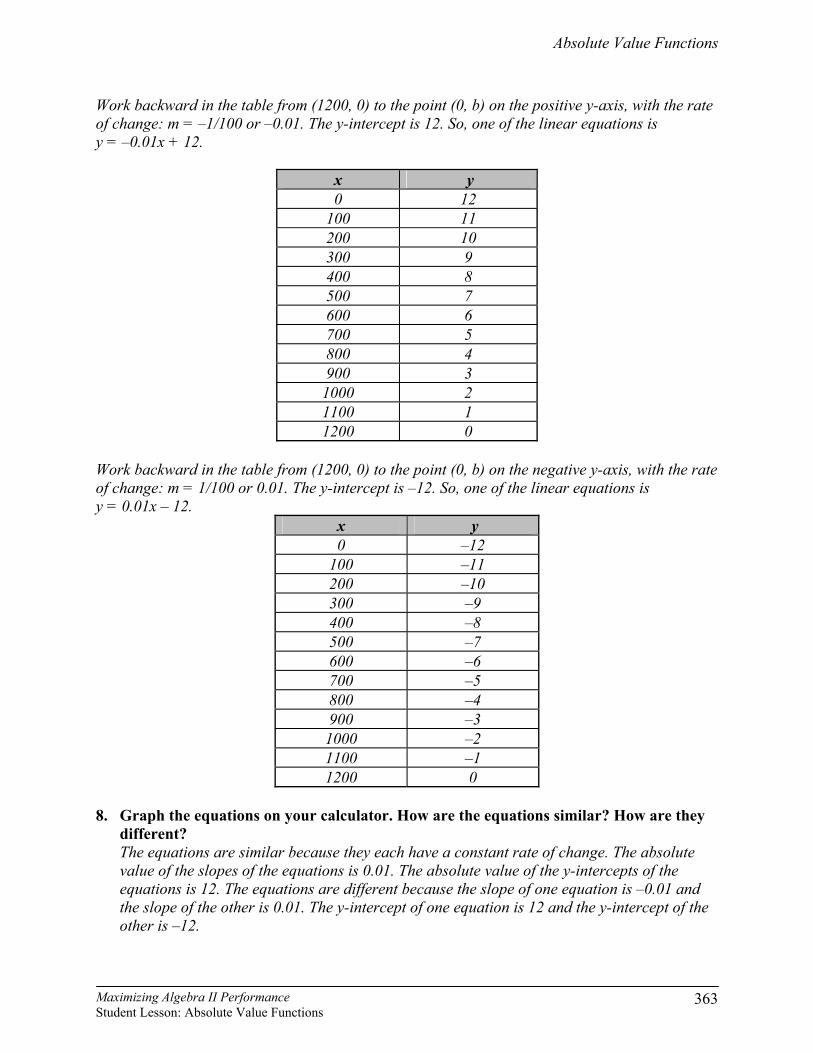
Work backward in the table from (1200, 0) to the point (0, b) on the positive y-axis, with the rate of change: m = –1/100 or –0.01. The y-intercept is 12. So, one of the linear equations is y = –0.01x + 12.
x y 0 12
100 11 200 10 300 9 400 8 500 7 600 6 700 5 800 4 900 3 1000 2 1100 1 1200 0
Work backward in the table from (1200, 0) to the point (0, b) on the negative y-axis, with the rate of change: m = 1/100 or 0.01. The y-intercept is –12. So, one of the linear equations is y = 0.01x – 12.
x y 0 –12
100 –11 200 –10 300 –9 400 –8 500 –7 600 –6 700 –5 800 –4 900 –3 1000 –2 1100 –1 1200 0
8. Graph the equations on your calculator. How are the equations similar? How are they
different? The equations are similar because they each have a constant rate of change. The absolute
value of the slopes of the equations is 0.01. The absolute value of the y-intercepts of the equations is 12. The equations are different because the slope of one equation is –0.01 and the slope of the other is 0.01. The y-intercept of one equation is 12 and the y-intercept of the other is –12.
Absolute Value Functions
Maximizing Algebra II Performance Student Lesson: Absolute Value Functions
364
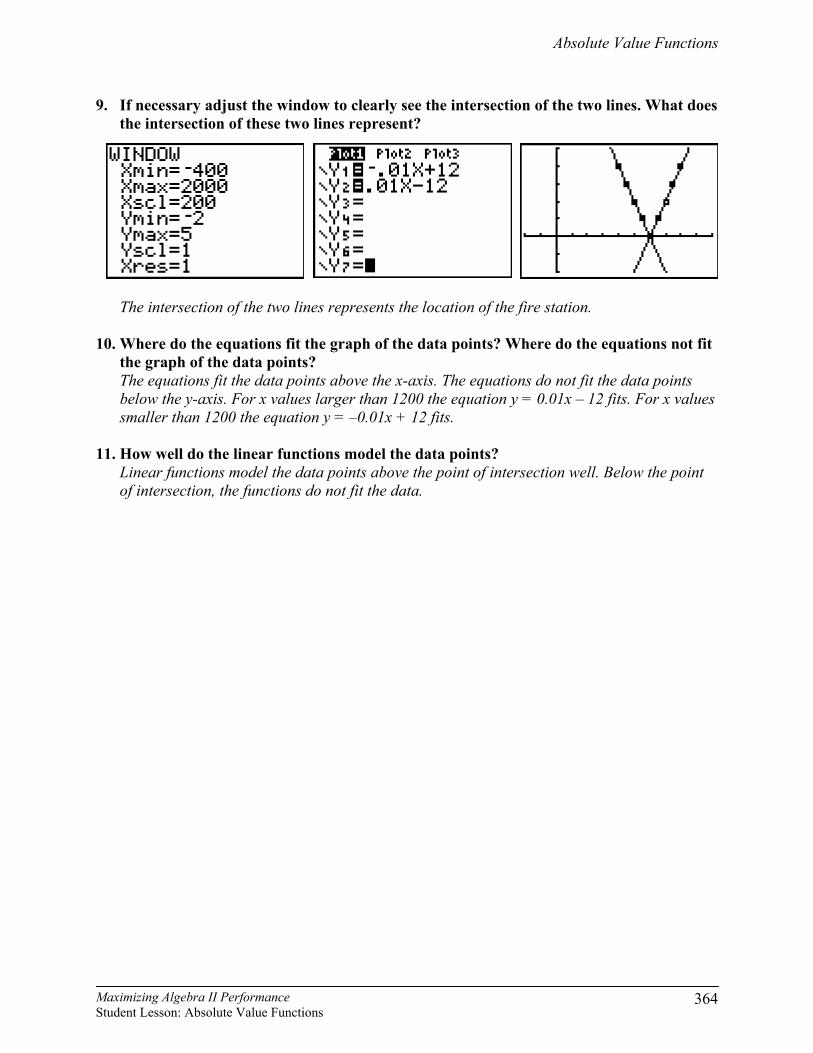
9. If necessary adjust the window to clearly see the intersection of the two lines. What does the intersection of these two lines represent?
The intersection of the two lines represents the location of the fire station. 10. Where do the equations fit the graph of the data points? Where do the equations not fit
the graph of the data points? The equations fit the data points above the x-axis. The equations do not fit the data points
below the y-axis. For x values larger than 1200 the equation y = 0.01x – 12 fits. For x values smaller than 1200 the equation y = –0.01x + 12 fits.
11. How well do the linear functions model the data points? Linear functions model the data points above the point of intersection well. Below the point
of intersection, the functions do not fit the data.
Absolute Value Functions
Maximizing Algebra II Performance Student Lesson: Absolute Value Functions
365
Explain The Explain portion of the lesson is directed by the teacher to allow the students to formalize their understanding of the TEKS addressed in the lesson. Use the questions to elicit student groups to share their responses. At the end of the Explain phase, students should be able to communicate the characteristics of the absolute value parent function. 1. Distribute Part 2: The Fire Station Problem to students. Ask them to work through the
activity. Actively monitor student groups, providing assistance as necessary. 2. Debrief Part 2: The Fire Station Problem. 3. Use a vocabulary organizer to describe and define the absolute value of a number and
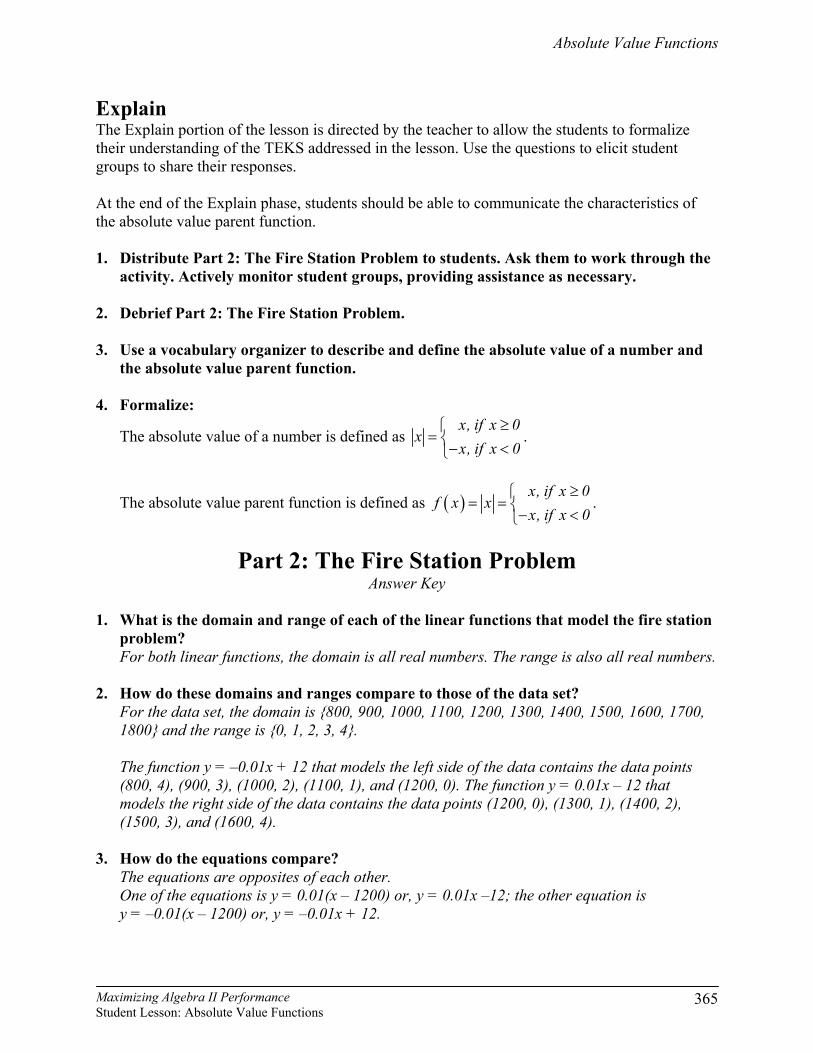
the absolute value parent function. 4. Formalize:
The absolute value of a number is defined as x, if x 0
xx, if x 0
≥⎧= ⎨− <⎩
.
The absolute value parent function is defined as ( )x, if x 0
f x xx, if x 0
≥⎧= = ⎨− <⎩
.
Part 2: The Fire Station Problem
Answer Key
1. What is the domain and range of each of the linear functions that model the fire station problem? For both linear functions, the domain is all real numbers. The range is also all real numbers.
2. How do these domains and ranges compare to those of the data set?
For the data set, the domain is {800, 900, 1000, 1100, 1200, 1300, 1400, 1500, 1600, 1700, 1800} and the range is {0, 1, 2, 3, 4}. The function y = –0.01x + 12 that models the left side of the data contains the data points (800, 4), (900, 3), (1000, 2), (1100, 1), and (1200, 0). The function y = 0.01x – 12 that models the right side of the data contains the data points (1200, 0), (1300, 1), (1400, 2), (1500, 3), and (1600, 4).
3. How do the equations compare? The equations are opposites of each other. One of the equations is y = 0.01(x – 1200) or, y = 0.01x –12; the other equation is y = –0.01(x – 1200) or, y = –0.01x + 12.
Absolute Value Functions
Maximizing Algebra II Performance Student Lesson: Absolute Value Functions
366
4. At what point do the graphs of the equations intersect? The lines intersect at (1200, 0).
5. Which parts of the graphs of the lines model our data set? Which parts do not? Why? The graphs of the lines above the x-axis model our data points. The parts of the graphs below the x-axis do not model our data points. The lines that model our data have restricted domains.
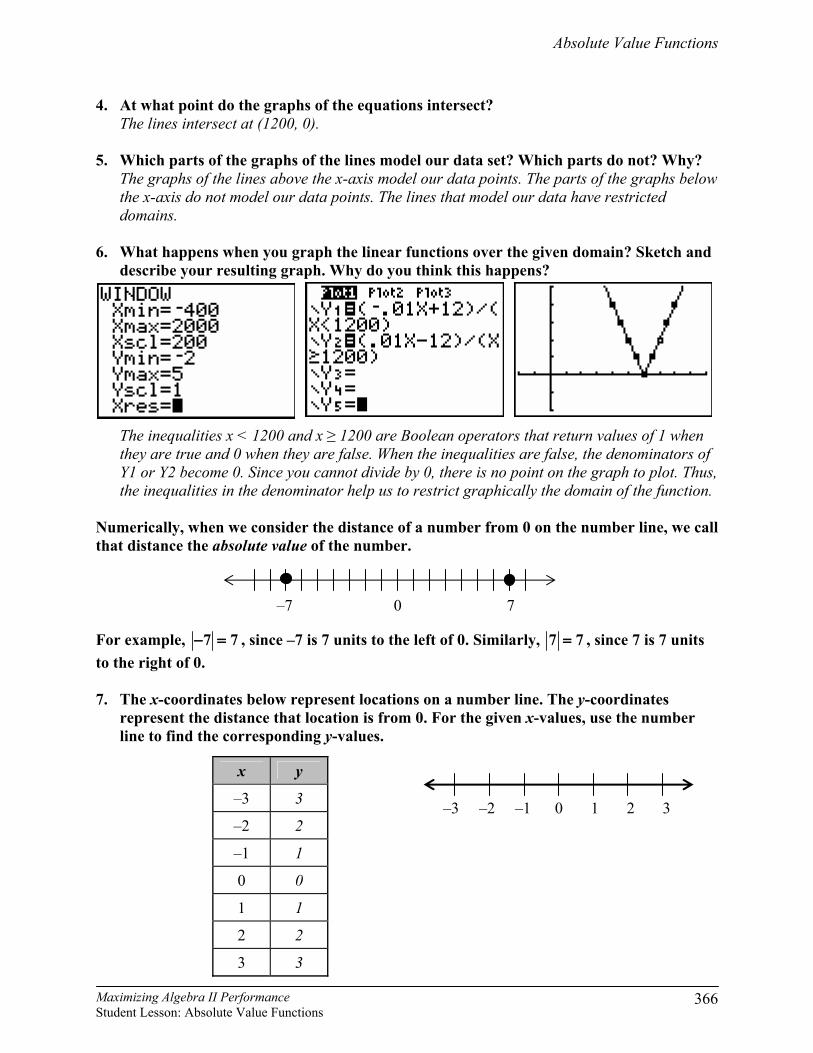
6. What happens when you graph the linear functions over the given domain? Sketch and describe your resulting graph. Why do you think this happens?
The inequalities x < 1200 and x ≥ 1200 are Boolean operators that return values of 1 when they are true and 0 when they are false. When the inequalities are false, the denominators of Y1 or Y2 become 0. Since you cannot divide by 0, there is no point on the graph to plot. Thus, the inequalities in the denominator help us to restrict graphically the domain of the function.
Numerically, when we consider the distance of a number from 0 on the number line, we call that distance the absolute value of the number.
For example, 7 7− = , since –7 is 7 units to the left of 0. Similarly, 7 7= , since 7 is 7 units to the right of 0. 7. The x-coordinates below represent locations on a number line. The y-coordinates
represent the distance that location is from 0. For the given x-values, use the number line to find the corresponding y-values.
–7 0 7
–3 –2 –1 0 1 2 3
x y
–3 3
–2 2
–1 1
0 0
1 1
2 2
3 3
Absolute Value Functions
Maximizing Algebra II Performance Student Lesson: Absolute Value Functions
367
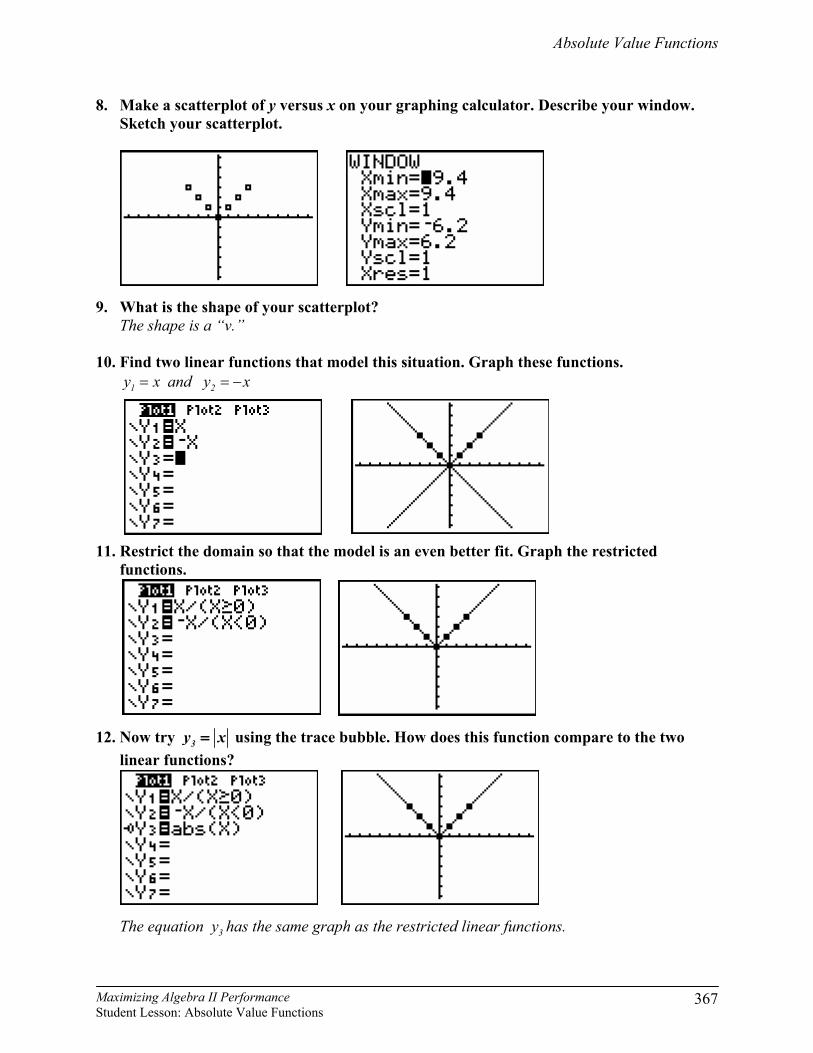
8. Make a scatterplot of y versus x on your graphing calculator. Describe your window. Sketch your scatterplot.
9. What is the shape of your scatterplot?
The shape is a “v.”
10. Find two linear functions that model this situation. Graph these functions. 1y x= and 2y x= −
11. Restrict the domain so that the model is an even better fit. Graph the restricted functions.
12. Now try 3y x= using the trace bubble. How does this function compare to the two linear functions? The equation 3y has the same graph as the restricted linear functions.
Absolute Value Functions
Maximizing Algebra II Performance Student Lesson: Absolute Value Functions
368
13. This is a new parent function to add to your list of parent functions. With which other parent functions are you familiar? Responses may vary. The linear parent function, y = x, and the quadratic parent function, y = x2, are two possible parent functions with which students may be familiar.
14. What is the parent function for absolute value? The parent function is f(x) = |x|. 15. What are the characteristics of absolute value functions? Absolute value functions graph in the shape of a “v.” The slope of the left side of the graph is
the opposite of the slope of the right side of the graph. The graph has line symmetry. The absolute value parent function is produced by reflecting the part of the graph of y = x to the left of x = 0 above the x-axis.
Absolute Value Functions
Maximizing Algebra II Performance Student Lesson: Absolute Value Functions
369
Elaborate The Elaborate portion of the lesson provides the student with an opportunity to investigate concretely and apply the concept of transformations on the absolute value parent function. At the end of the Elaborate phase students should be able to describe the graphs of transformations to the absolute value function.
Investigating Absolute Value Functions
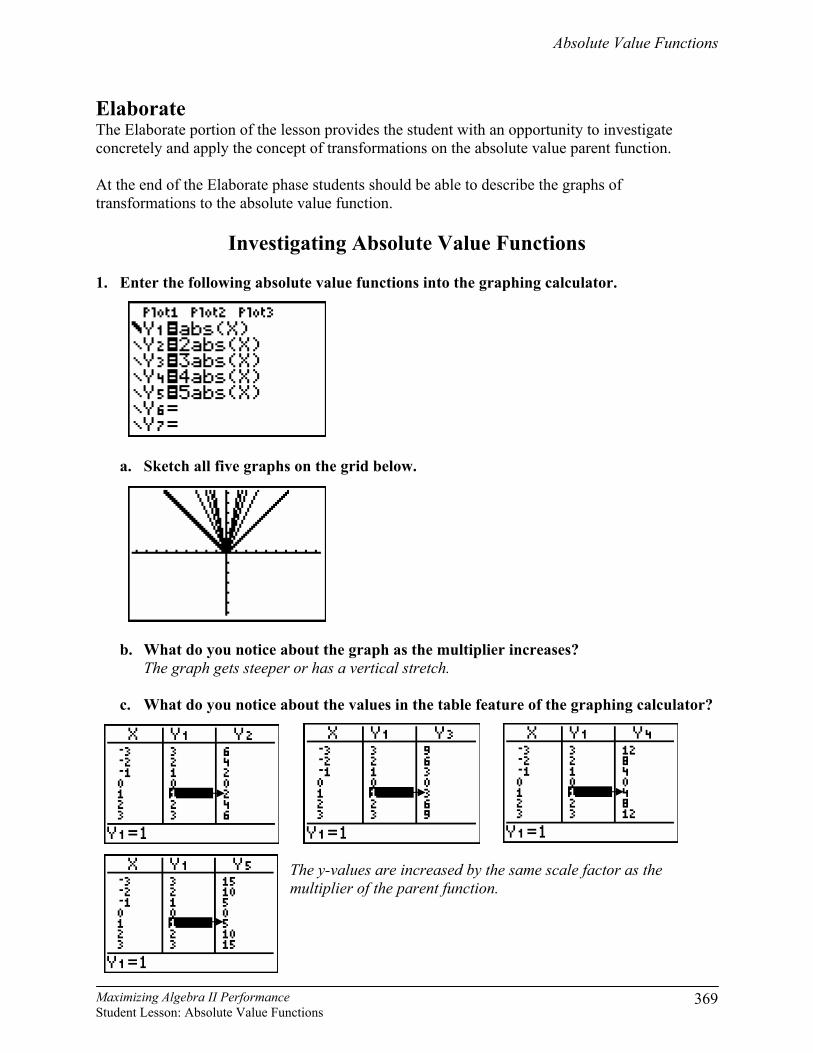
1. Enter the following absolute value functions into the graphing calculator.
a. Sketch all five graphs on the grid below.
b. What do you notice about the graph as the multiplier increases? The graph gets steeper or has a vertical stretch.
c. What do you notice about the values in the table feature of the graphing calculator?
The y-values are increased by the same scale factor as the multiplier of the parent function.
Absolute Value Functions
Maximizing Algebra II Performance Student Lesson: Absolute Value Functions
370
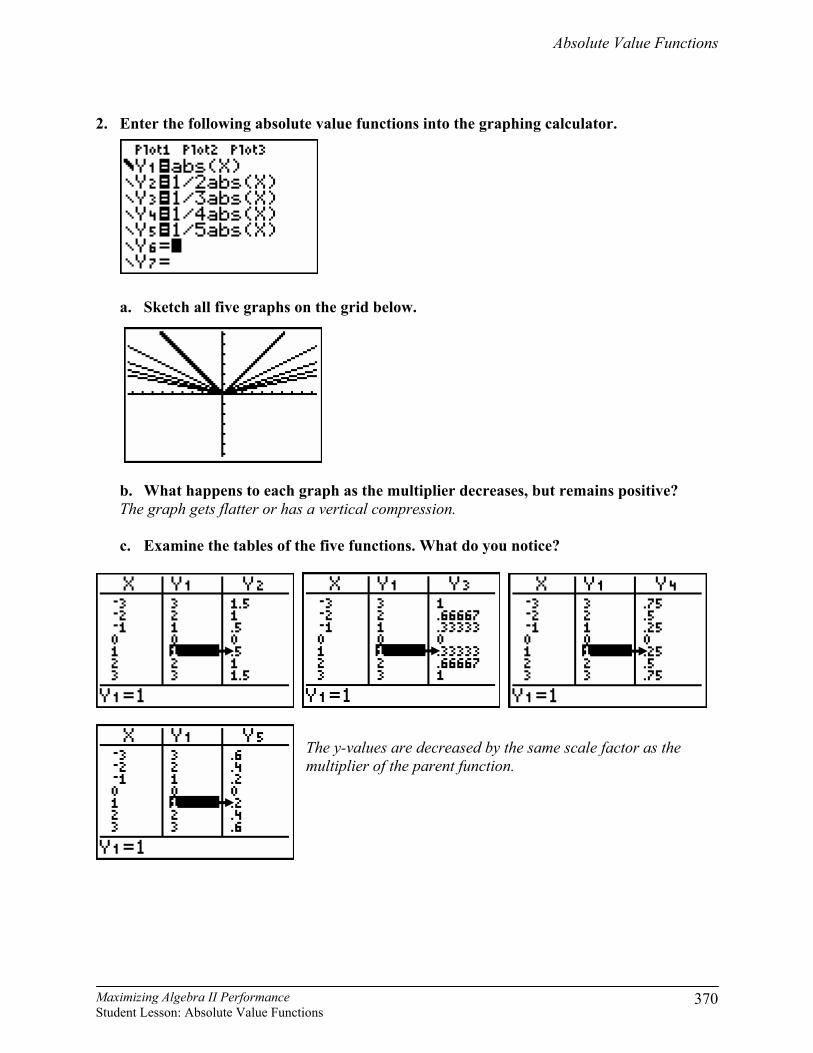
2. Enter the following absolute value functions into the graphing calculator.
a. Sketch all five graphs on the grid below.
b. What happens to each graph as the multiplier decreases, but remains positive? The graph gets flatter or has a vertical compression.
c. Examine the tables of the five functions. What do you notice?
The y-values are decreased by the same scale factor as the multiplier of the parent function.
Absolute Value Functions
Maximizing Algebra II Performance Student Lesson: Absolute Value Functions
371
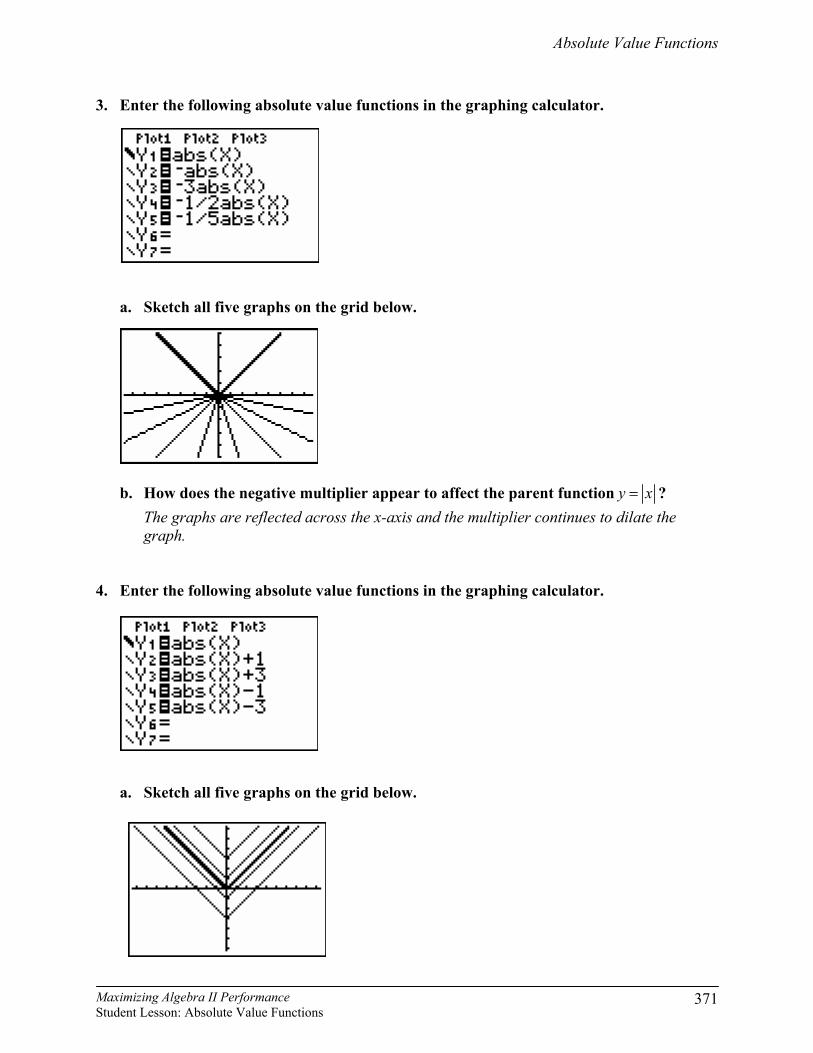
3. Enter the following absolute value functions in the graphing calculator.
a. Sketch all five graphs on the grid below.
b. How does the negative multiplier appear to affect the parent function =y x ? The graphs are reflected across the x-axis and the multiplier continues to dilate the
graph. 4. Enter the following absolute value functions in the graphing calculator.
a. Sketch all five graphs on the grid below.
Absolute Value Functions
Maximizing Algebra II Performance Student Lesson: Absolute Value Functions
372
b. What do you notice about these functions? They have been shifted vertically up or down. The amount of the shift depends on the
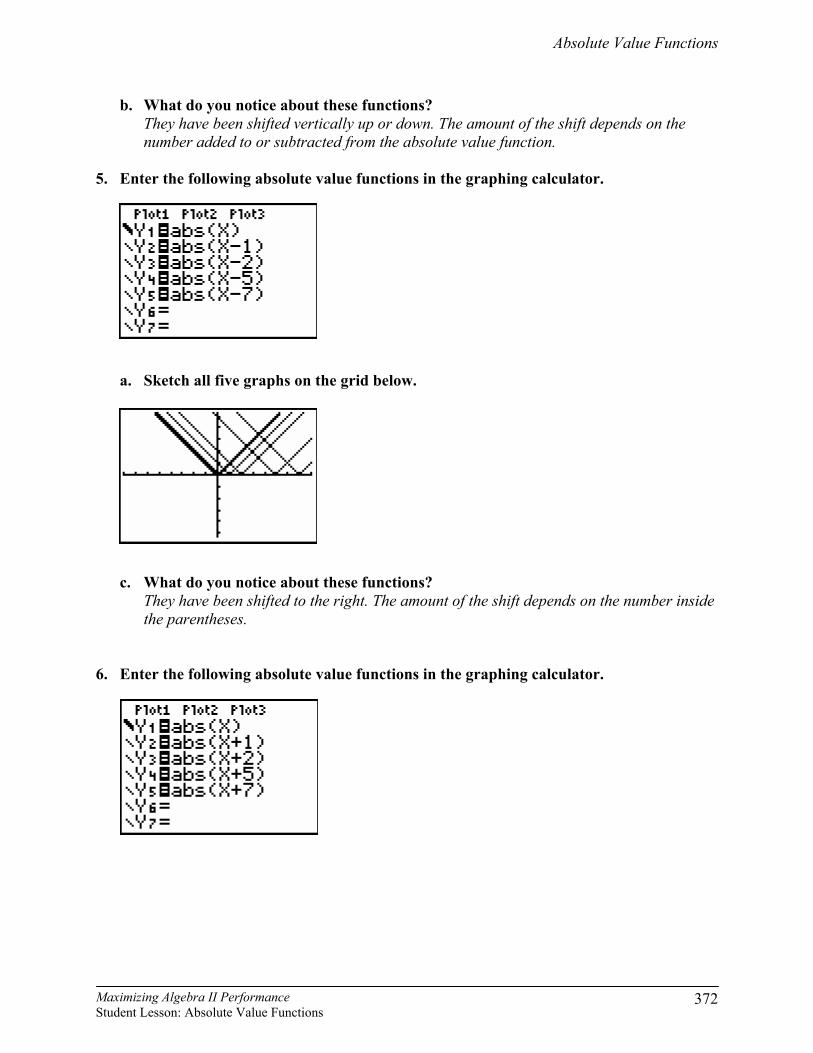
number added to or subtracted from the absolute value function. 5. Enter the following absolute value functions in the graphing calculator.
a. Sketch all five graphs on the grid below.
c. What do you notice about these functions?
They have been shifted to the right. The amount of the shift depends on the number inside the parentheses.
6. Enter the following absolute value functions in the graphing calculator.
Absolute Value Functions
Maximizing Algebra II Performance Student Lesson: Absolute Value Functions
373
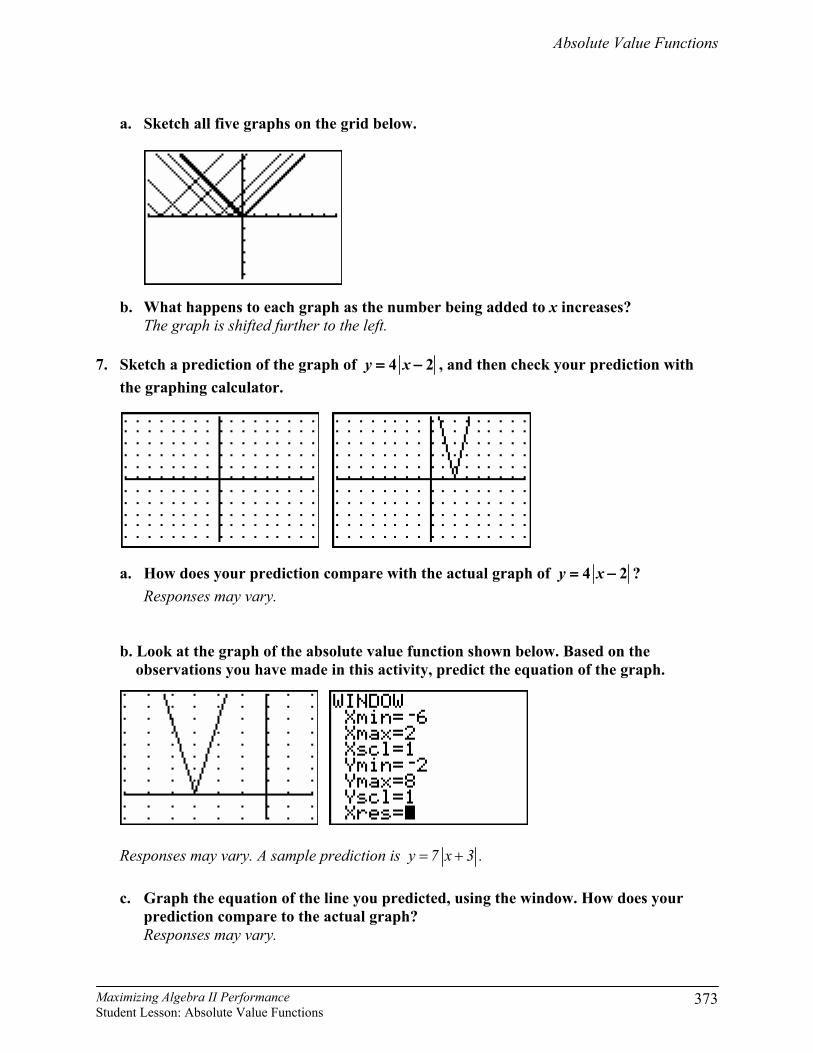
a. Sketch all five graphs on the grid below.
b. What happens to each graph as the number being added to x increases? The graph is shifted further to the left. 7. Sketch a prediction of the graph of 4 2y x= − , and then check your prediction with
the graphing calculator.
a. How does your prediction compare with the actual graph of 4 2y x= − ? Responses may vary.
b. Look at the graph of the absolute value function shown below. Based on the observations you have made in this activity, predict the equation of the graph.
Responses may vary. A sample prediction is y 7 x 3= + .
c. Graph the equation of the line you predicted, using the window. How does your prediction compare to the actual graph?
Responses may vary.
Absolute Value Functions
Maximizing Algebra II Performance Student Lesson: Absolute Value Functions
374
8. Verbally describe the graphs of the functions below as compared to the graph of the parent function y = |x|.
a) 4=y x b) 13
=y x
vertical stretch of 4 vertical compression of 13
c) 7 8= −y x d) 9y x= + vertical stretch of 7 and vertical shift of 9 units up a horizontal shift 8 units to the right e) 9y x= + f) 2 3y x= − − horizontal shift 9 units to the left vertical stretch of -2 units (reflects
down) and a vertical shift down of 3 units
9. Using what you know about the transformations you just made and the transformations
made to a quadratic function, write a general form for transformations to the absolute value parent function. y a x h k= − +
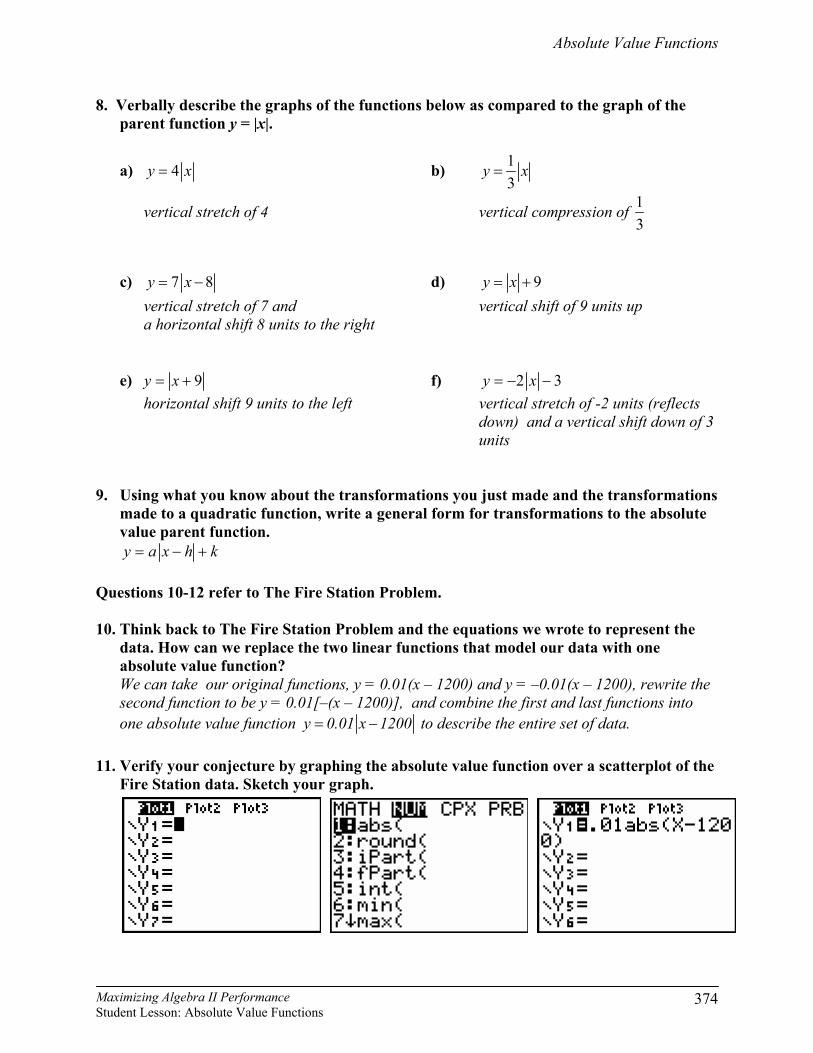
Questions 10-12 refer to The Fire Station Problem. 10. Think back to The Fire Station Problem and the equations we wrote to represent the
data. How can we replace the two linear functions that model our data with one absolute value function?
We can take our original functions, y = 0.01(x – 1200) and y = –0.01(x – 1200), rewrite the second function to be y = 0.01[–(x – 1200)], and combine the first and last functions into one absolute value function y 0.01 x 1200= − to describe the entire set of data.
11. Verify your conjecture by graphing the absolute value function over a scatterplot of the
Fire Station data. Sketch your graph.
Absolute Value Functions
Maximizing Algebra II Performance Student Lesson: Absolute Value Functions
375
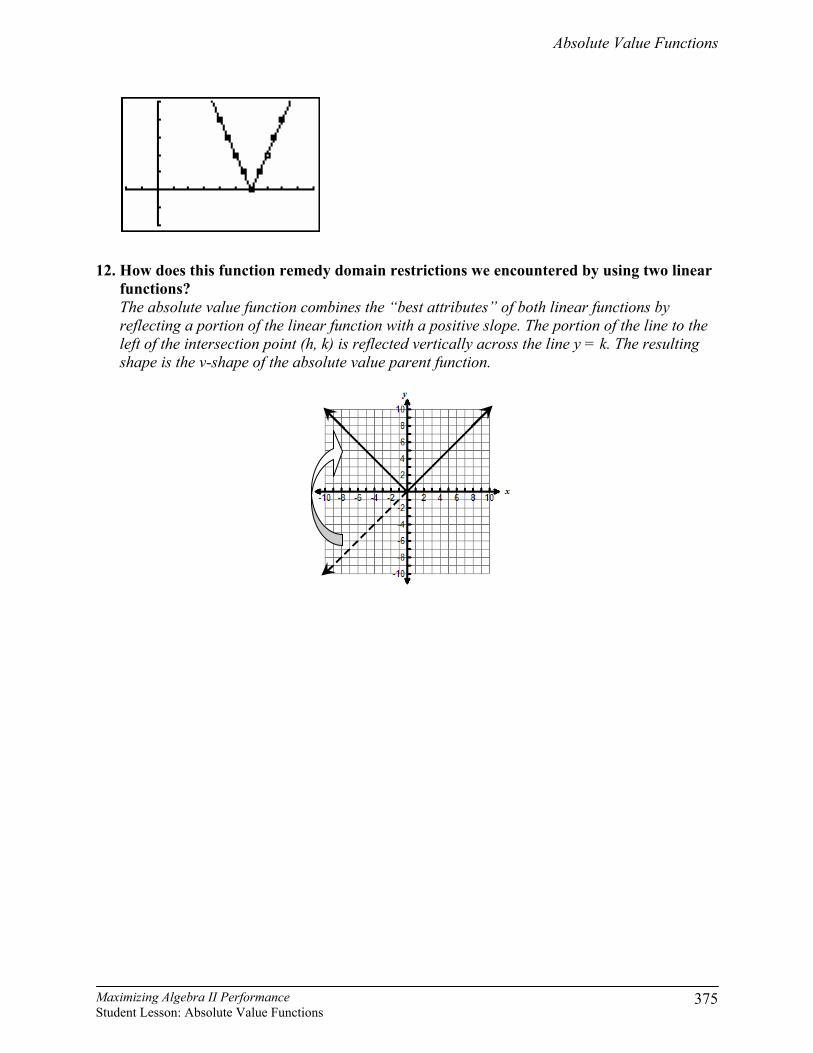
12. How does this function remedy domain restrictions we encountered by using two linear
functions? The absolute value function combines the “best attributes” of both linear functions by reflecting a portion of the linear function with a positive slope. The portion of the line to the left of the intersection point (h, k) is reflected vertically across the line y = k. The resulting shape is the v-shape of the absolute value parent function.
Absolute Value Functions
Maximizing Algebra II Performance Student Lesson: Absolute Value Functions
376
Evaluate The Evaluate portion of the lesson provides the student with an opportunity to demonstrate his or her understanding of the TEKS addressed in this lesson. Materials Needed
• Student copies of Soda Can Performance Assessment • Graphing calculators • Chart paper • markers
Duration: 30 – 45 minutes Provide each student with a copy of the Soda Can Performance Assessment and a graphing calculator. Give students 15 – 20 minutes to work on the performance assessment independently. After the time limit is up, students work in groups of 4 and come to a consensus about the solutions. Each group must present a common solution on chart paper or individual students may turn in solutions.
Absolute Value Functions
Maximizing Algebra II Performance Student Lesson: Absolute Value Functions
377
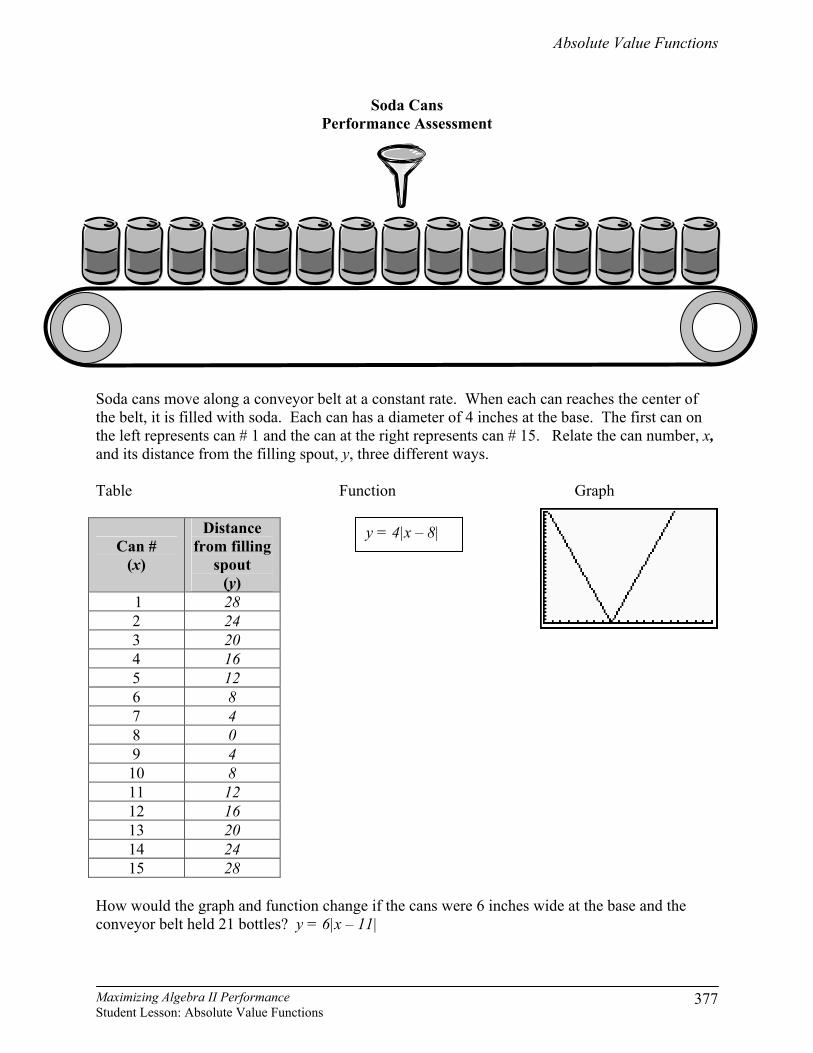
Soda Cans Performance Assessment
Soda cans move along a conveyor belt at a constant rate. When each can reaches the center of the belt, it is filled with soda. Each can has a diameter of 4 inches at the base. The first can on the left represents can # 1 and the can at the right represents can # 15. Relate the can number, x, and its distance from the filling spout, y, three different ways. Table Function Graph
Can # (x)
Distance from filling
spout (y)
1 28 2 24 3 20 4 16 5 12 6 8 7 4 8 0 9 4 10 8 11 12 12 16 13 20 14 24 15 28
How would the graph and function change if the cans were 6 inches wide at the base and the conveyor belt held 21 bottles? y = 6|x – 11|
y = 4|x – 8|
Absolute Value Functions
Maximizing Algebra II Performance Student Lesson: Absolute Value Functions
378
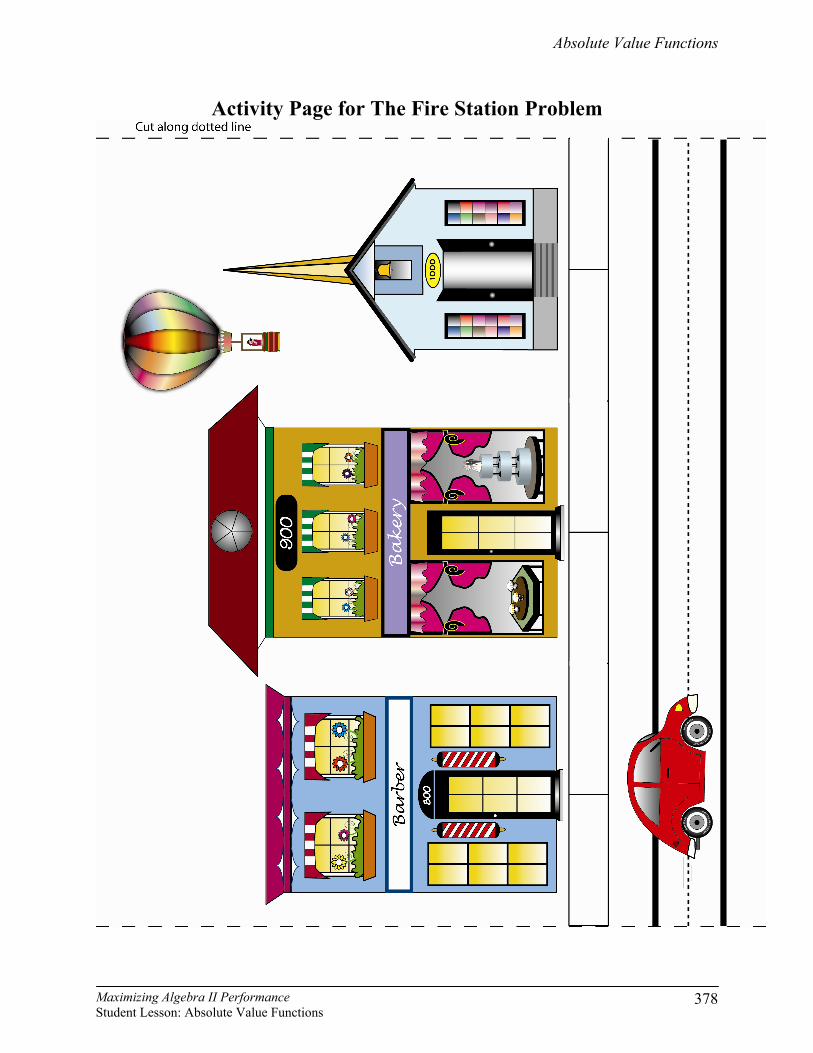
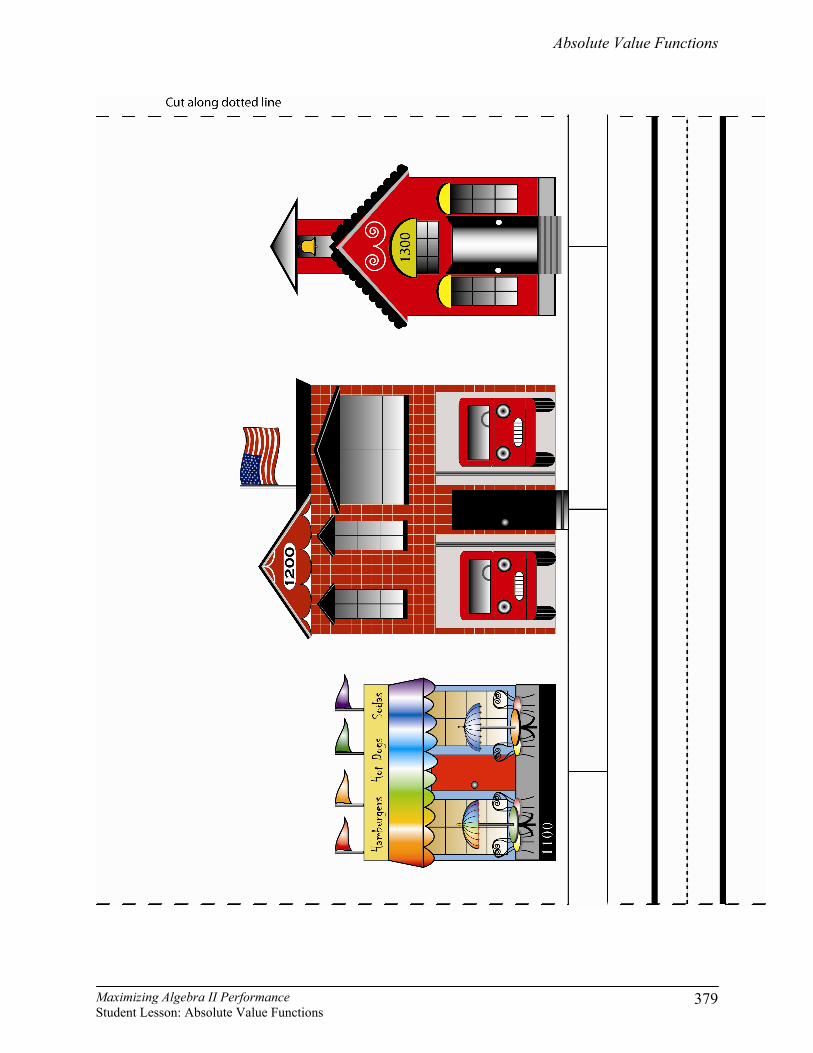
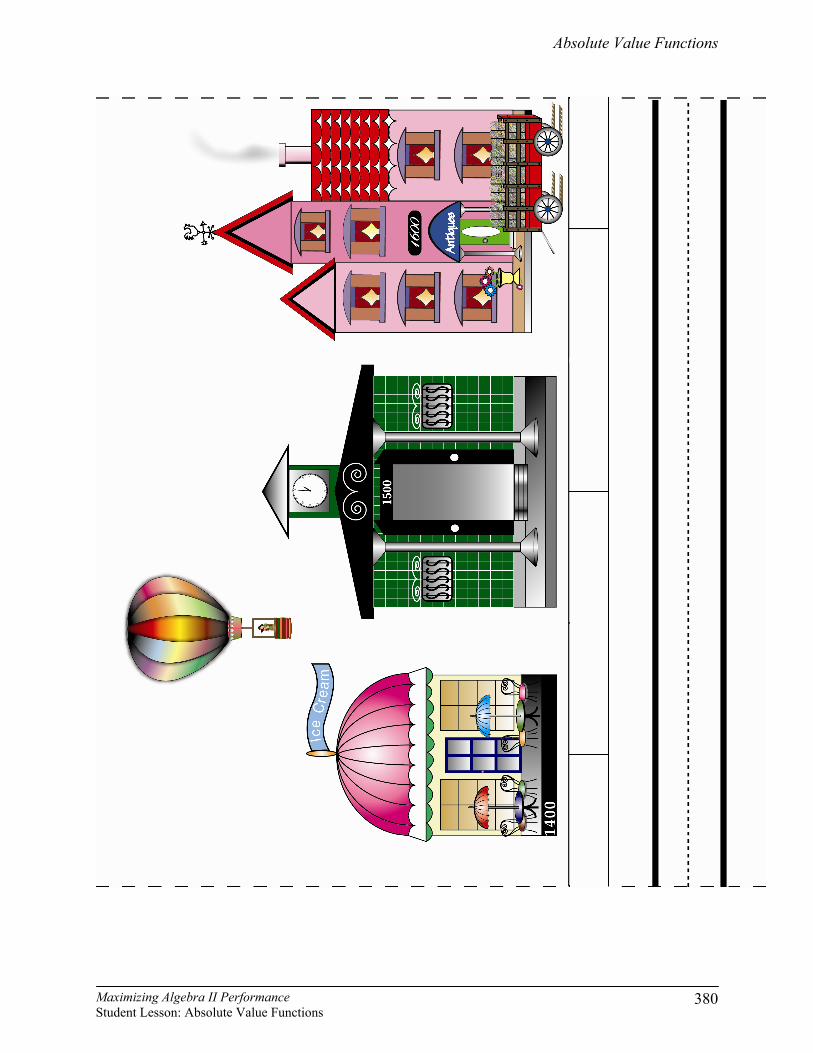
Activity Page for The Fire Station Problem
Absolute Value Functions
Maximizing Algebra II Performance Student Lesson: Absolute Value Functions
379
Absolute Value Functions
Maximizing Algebra II Performance Student Lesson: Absolute Value Functions
380
Absolute Value Functions
Maximizing Algebra II Performance Student Lesson: Absolute Value Functions
381
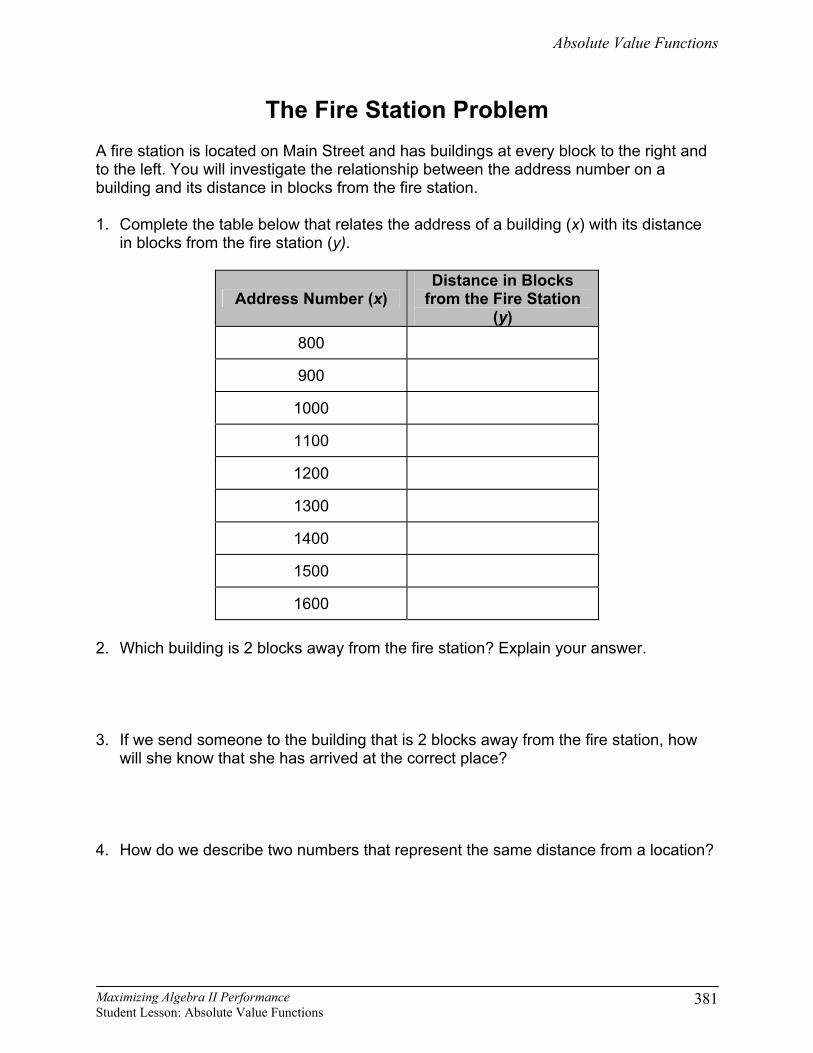
The Fire Station Problem A fire station is located on Main Street and has buildings at every block to the right and to the left. You will investigate the relationship between the address number on a building and its distance in blocks from the fire station. 1. Complete the table below that relates the address of a building (x) with its distance
in blocks from the fire station (y).
Address Number (x) Distance in Blocks
from the Fire Station (y)
800
900
1000
1100
1200
1300
1400
1500
1600 2. Which building is 2 blocks away from the fire station? Explain your answer. 3. If we send someone to the building that is 2 blocks away from the fire station, how
will she know that she has arrived at the correct place? 4. How do we describe two numbers that represent the same distance from a location?
Absolute Value Functions
Maximizing Algebra II Performance Student Lesson: Absolute Value Functions
382
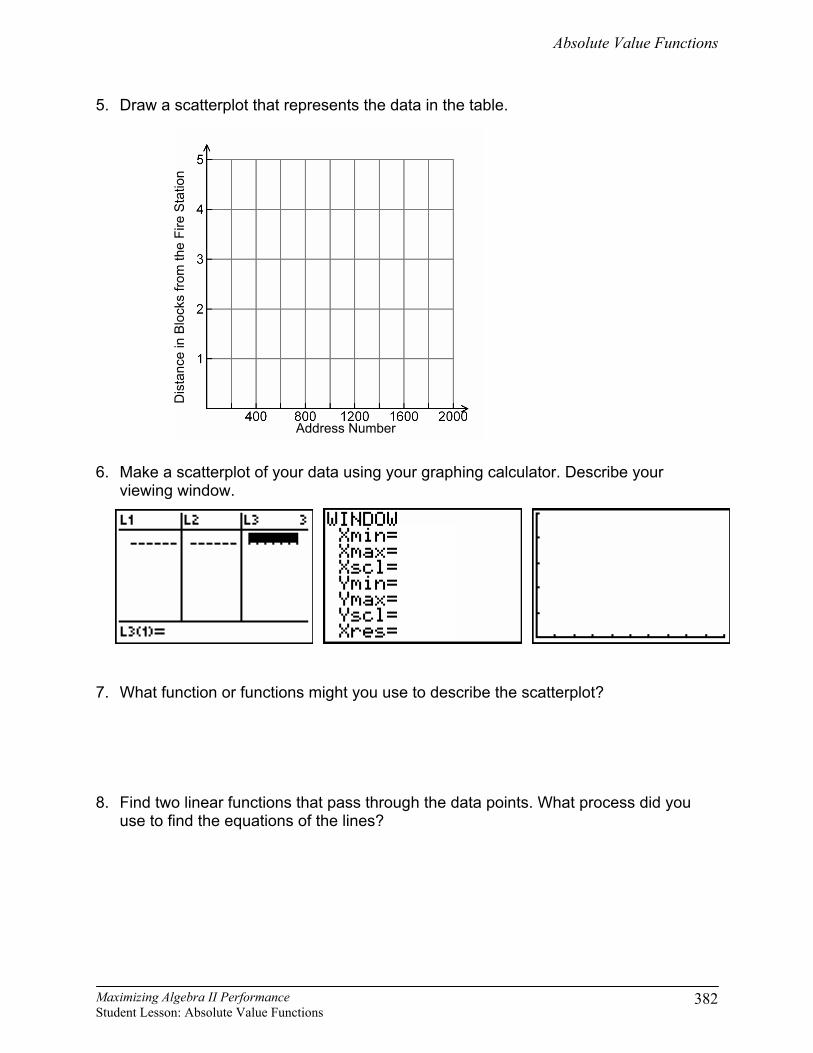
5. Draw a scatterplot that represents the data in the table.
6. Make a scatterplot of your data using your graphing calculator. Describe your
viewing window. 7. What function or functions might you use to describe the scatterplot? 8. Find two linear functions that pass through the data points. What process did you
use to find the equations of the lines?
Address Number
Dis
tanc
e in
Blo
cks
from
the
Fire
Sta
tion
Absolute Value Functions
Maximizing Algebra II Performance Student Lesson: Absolute Value Functions
383
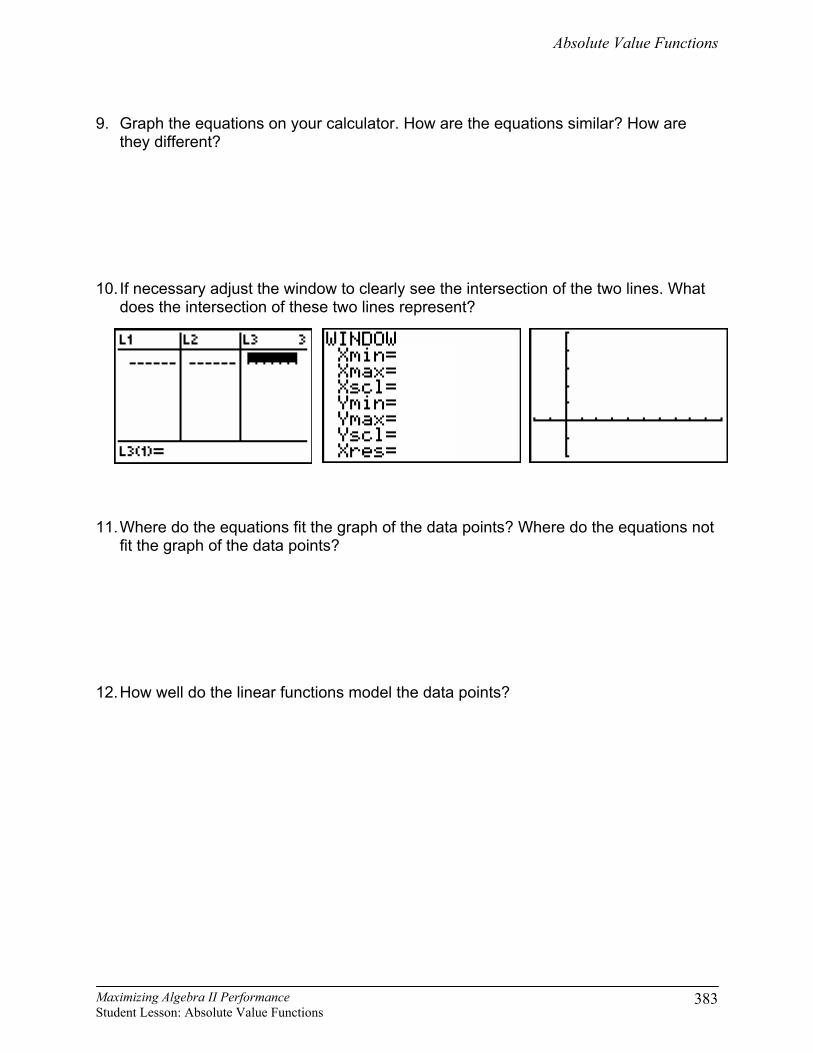
9. Graph the equations on your calculator. How are the equations similar? How are
they different? 10. If necessary adjust the window to clearly see the intersection of the two lines. What
does the intersection of these two lines represent? 11. Where do the equations fit the graph of the data points? Where do the equations not
fit the graph of the data points? 12. How well do the linear functions model the data points?
Absolute Value Functions
Maximizing Algebra II Performance Student Lesson: Absolute Value Functions
384
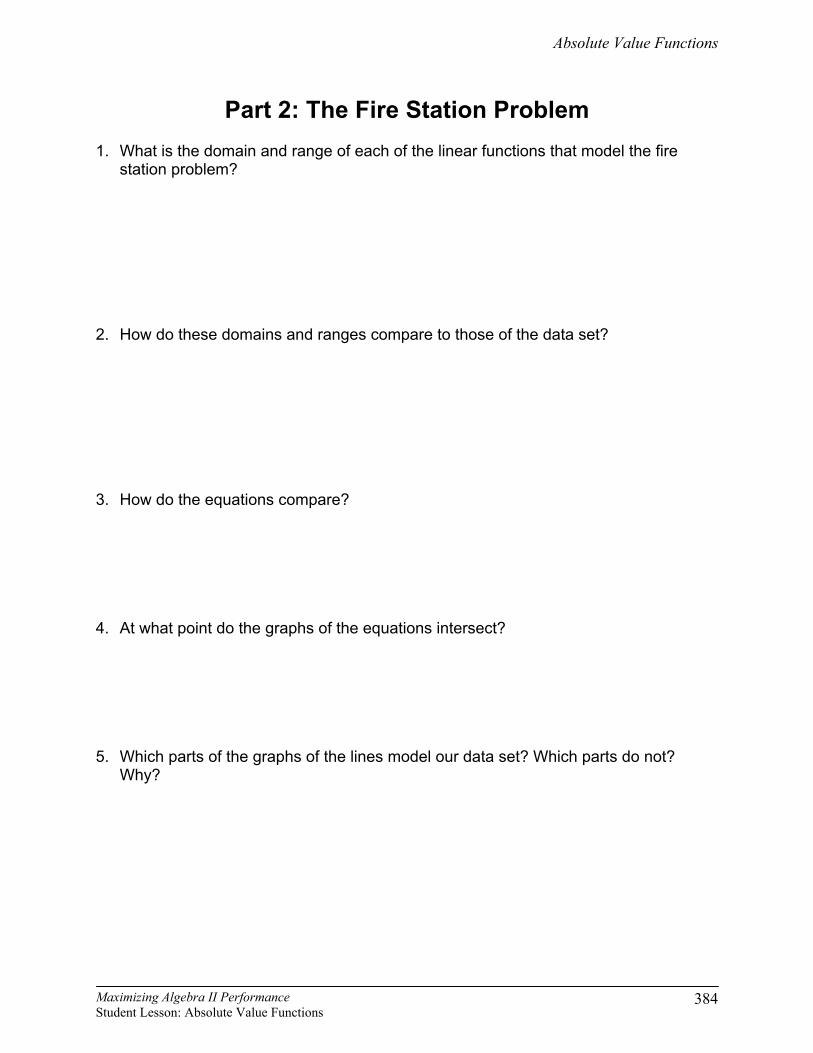
Part 2: The Fire Station Problem
1. What is the domain and range of each of the linear functions that model the fire station problem?
2. How do these domains and ranges compare to those of the data set? 3. How do the equations compare? 4. At what point do the graphs of the equations intersect?
5. Which parts of the graphs of the lines model our data set? Which parts do not? Why?
Absolute Value Functions
Maximizing Algebra II Performance Student Lesson: Absolute Value Functions
385
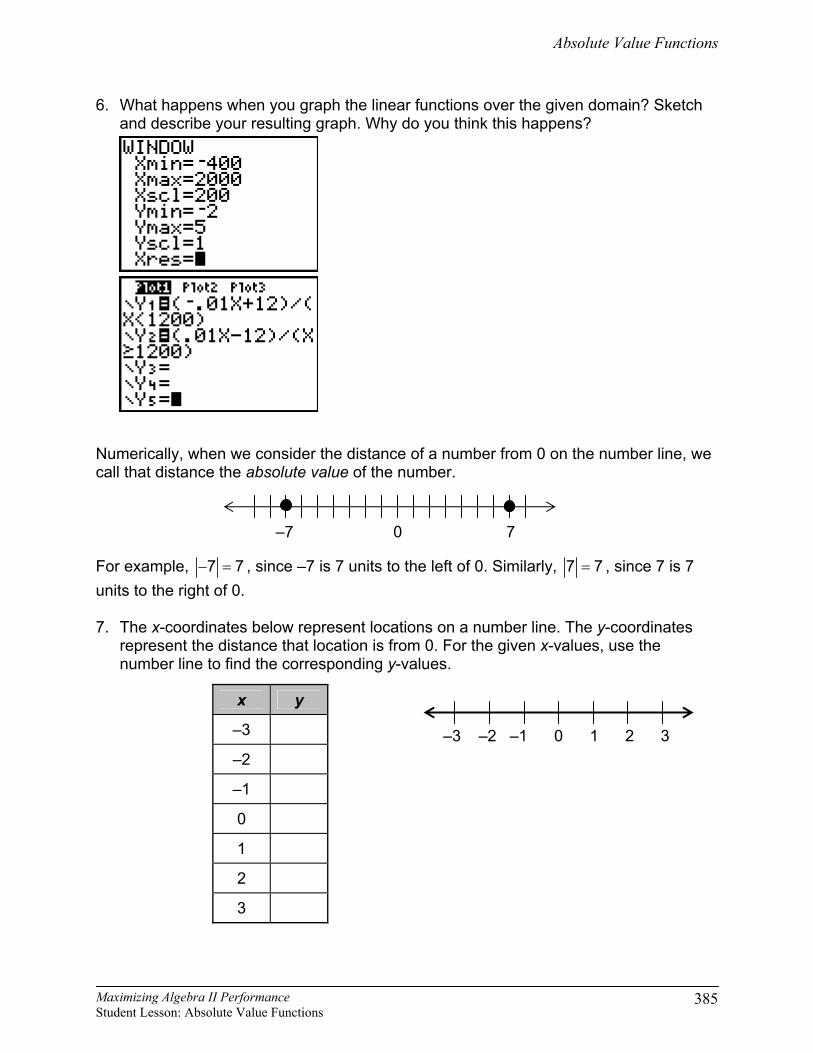
6. What happens when you graph the linear functions over the given domain? Sketch and describe your resulting graph. Why do you think this happens?
Numerically, when we consider the distance of a number from 0 on the number line, we call that distance the absolute value of the number.
For example, − =7 7 , since –7 is 7 units to the left of 0. Similarly, =7 7 , since 7 is 7 units to the right of 0. 7. The x-coordinates below represent locations on a number line. The y-coordinates
represent the distance that location is from 0. For the given x-values, use the number line to find the corresponding y-values.
–7 0 7
–3 –2 –1 0 1 2 3
x y
–3
–2
–1
0
1
2
3
Absolute Value Functions
Maximizing Algebra II Performance Student Lesson: Absolute Value Functions
386
8. Make a scatterplot of y versus x on your graphing calculator. Describe your window. Sketch your scatterplot.
9. What is the shape of your scatterplot?
10. Find two linear functions that model this situation. Graph these functions.
11. Restrict the domain so that the model is an even better fit. Graph the restricted functions.
12. Now try =3y x using the trace bubble. How does this function compare to the two linear functions?
Absolute Value Functions
Maximizing Algebra II Performance Student Lesson: Absolute Value Functions
387
13. This is a new parent function to add to your list of parent functions. With which other parent functions are you familiar?
14. What is the parent function for absolute value? 15. What are some characteristics of absolute value functions?
Absolute Value Functions
Maximizing Algebra II Performance Student Lesson: Absolute Value Functions
388
Investigating Absolute Value Functions
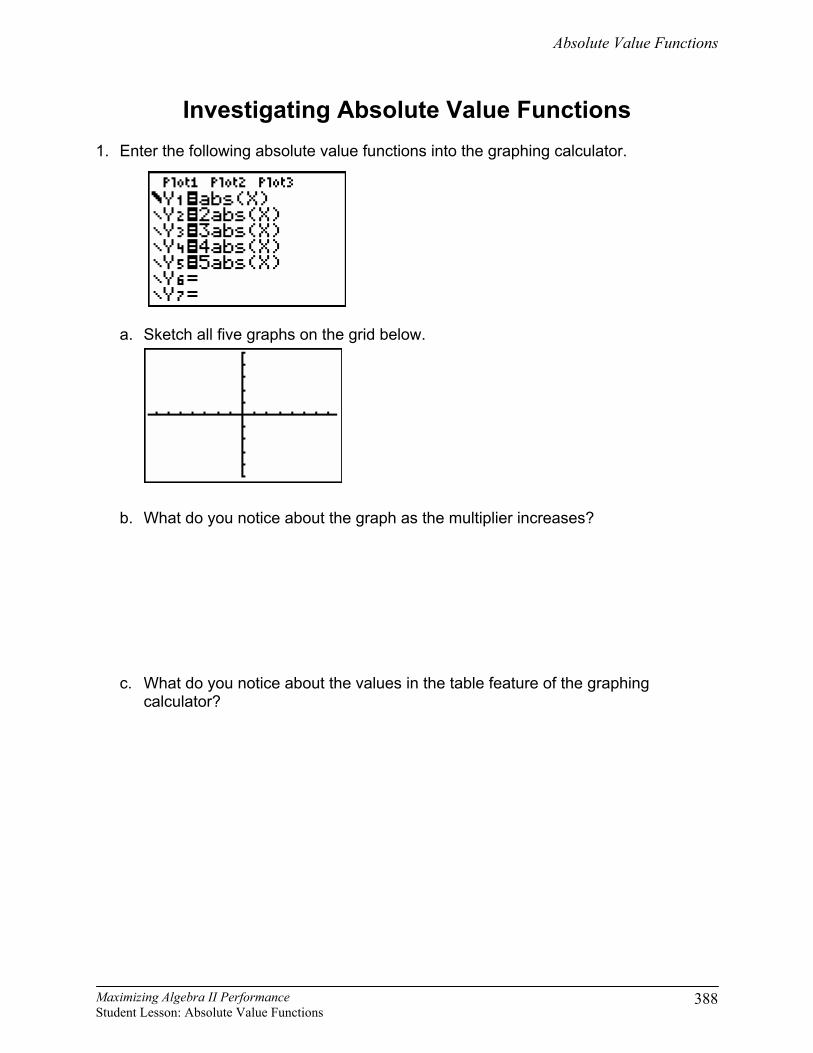
1. Enter the following absolute value functions into the graphing calculator.
a. Sketch all five graphs on the grid below.
b. What do you notice about the graph as the multiplier increases?
c. What do you notice about the values in the table feature of the graphing calculator?
Absolute Value Functions
Maximizing Algebra II Performance Student Lesson: Absolute Value Functions
389
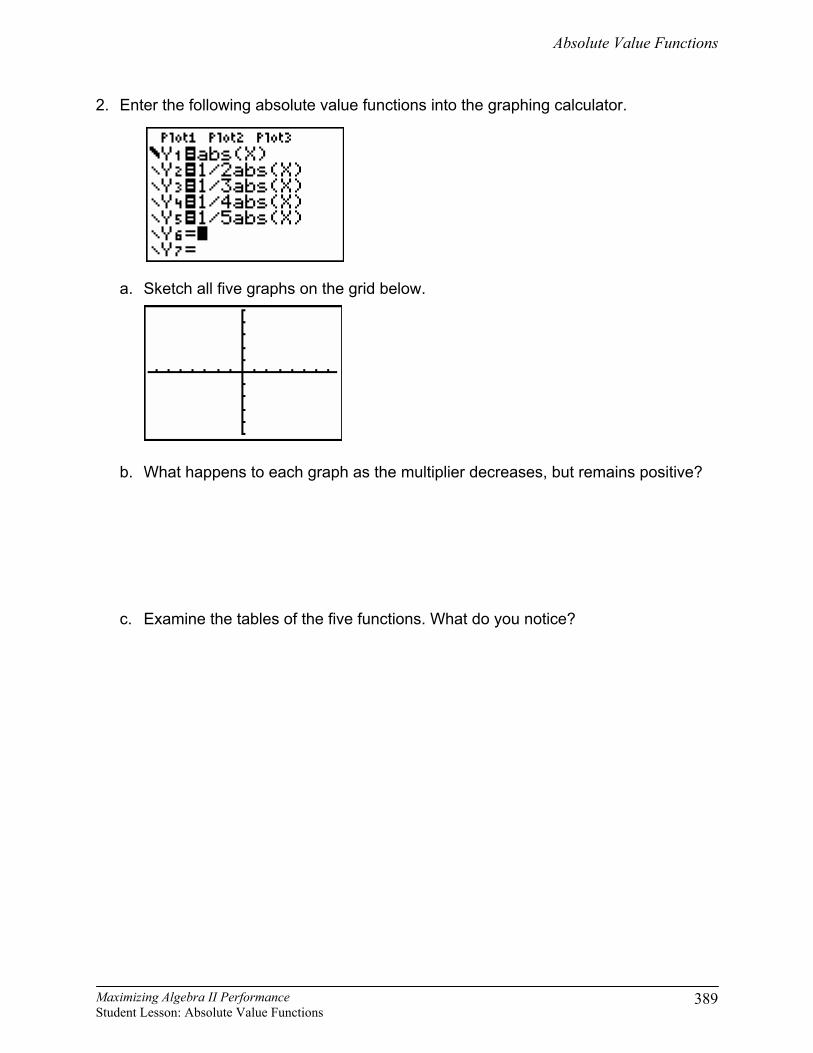
2. Enter the following absolute value functions into the graphing calculator.
a. Sketch all five graphs on the grid below.
b. What happens to each graph as the multiplier decreases, but remains positive?
c. Examine the tables of the five functions. What do you notice?
Absolute Value Functions
Maximizing Algebra II Performance Student Lesson: Absolute Value Functions
390
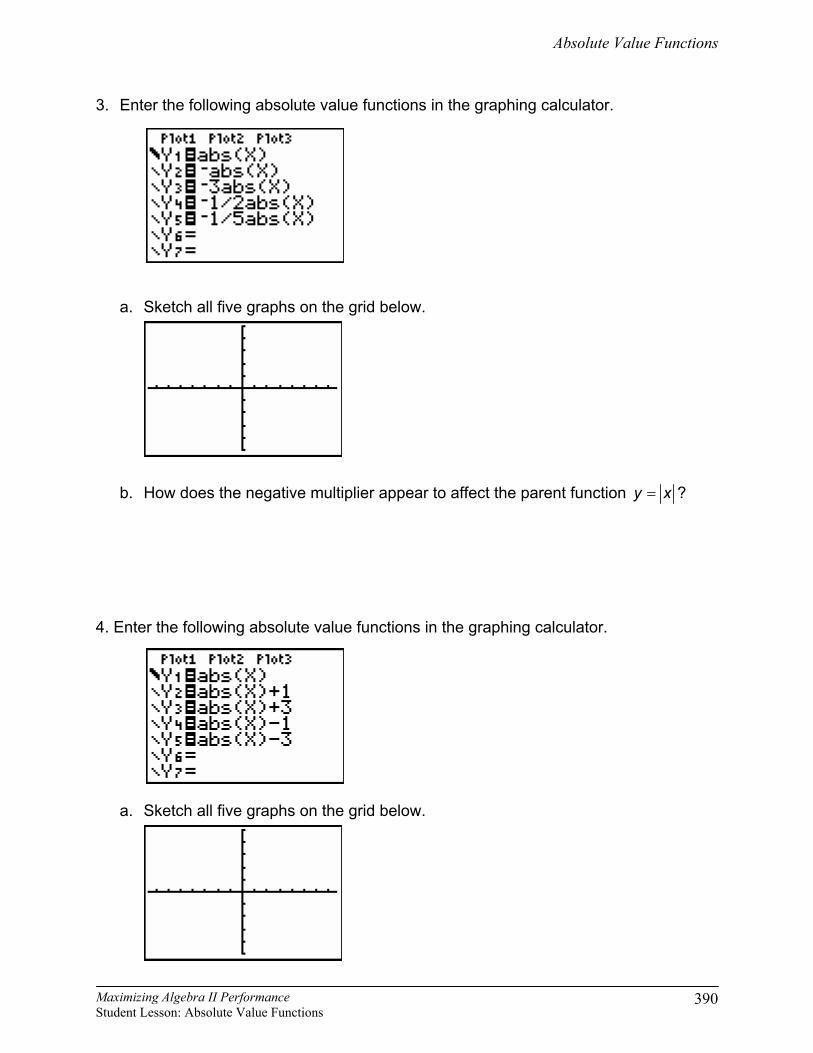
3. Enter the following absolute value functions in the graphing calculator.
a. Sketch all five graphs on the grid below.
b. How does the negative multiplier appear to affect the parent function =y x ? 4. Enter the following absolute value functions in the graphing calculator.
a. Sketch all five graphs on the grid below.
Absolute Value Functions
Maximizing Algebra II Performance Student Lesson: Absolute Value Functions
391
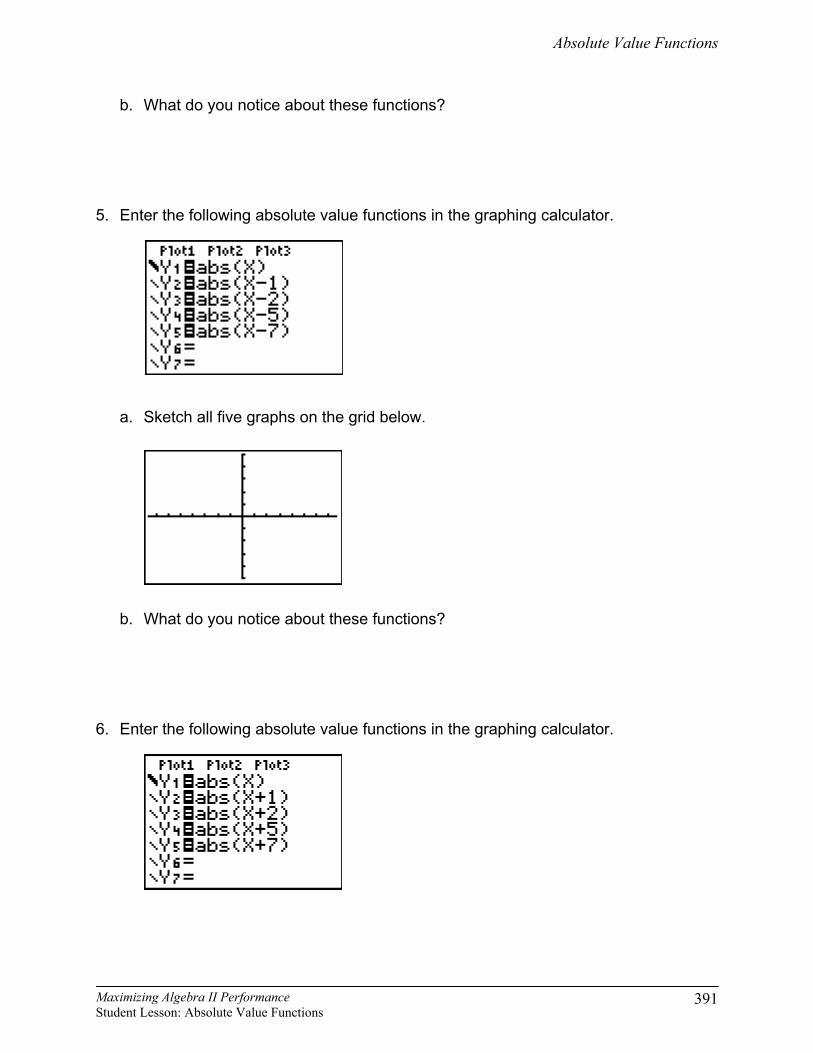
b. What do you notice about these functions? 5. Enter the following absolute value functions in the graphing calculator.
a. Sketch all five graphs on the grid below.
b. What do you notice about these functions? 6. Enter the following absolute value functions in the graphing calculator.
Absolute Value Functions
Maximizing Algebra II Performance Student Lesson: Absolute Value Functions
392
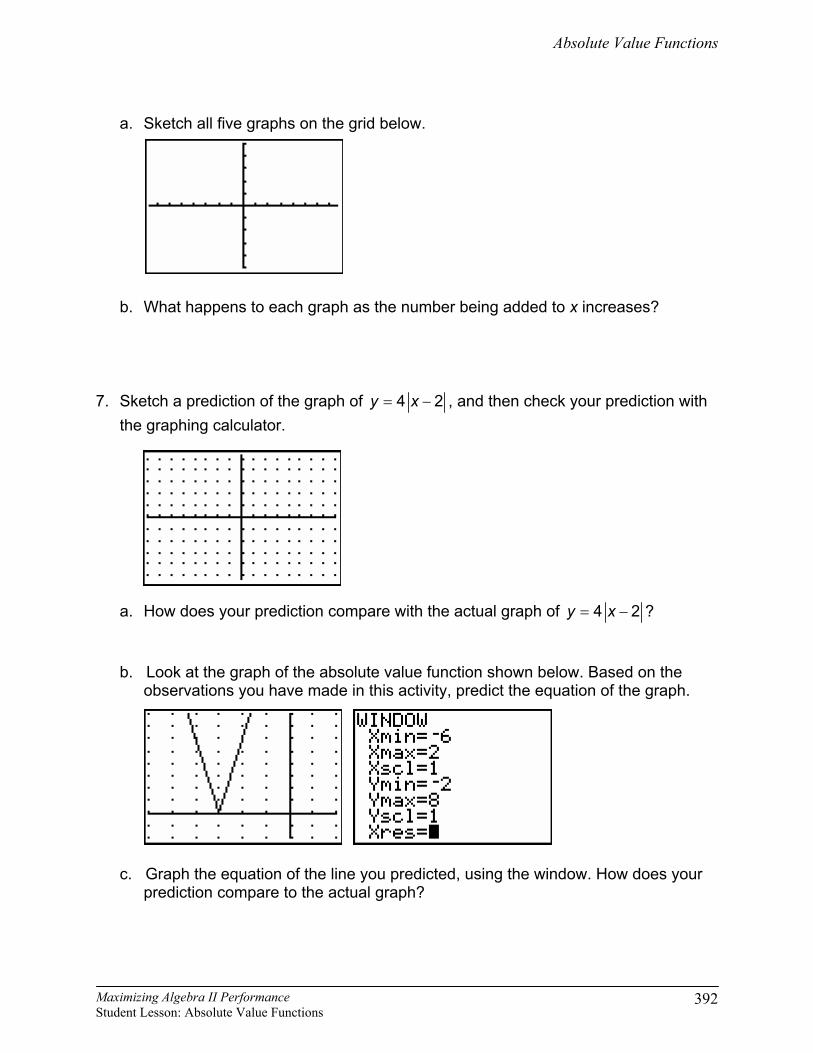
a. Sketch all five graphs on the grid below.
b. What happens to each graph as the number being added to x increases? 7. Sketch a prediction of the graph of = −4 2y x , and then check your prediction with
the graphing calculator.
a. How does your prediction compare with the actual graph of = −4 2y x ?
b. Look at the graph of the absolute value function shown below. Based on the observations you have made in this activity, predict the equation of the graph.
c. Graph the equation of the line you predicted, using the window. How does your prediction compare to the actual graph?
Absolute Value Functions
Maximizing Algebra II Performance Student Lesson: Absolute Value Functions
393
8. Verbally describe the graphs of the functions below as compared to the graph of the parent function =y x .
a) = 4y x b) 13
y x=
c) 7 8y x= − d) 9y x= +
e) = + 9y x f) = − −2 3y x
9. Using what you know about the transformations you just made and the
transformations made to a quadratic function, write a general form for transformations to the absolute value parent function.
Questions 10-12 refer to The Fire Station Problem. 10. Think back to The Fire Station Problem and the equations we wrote to represent the
data. How can we replace the two linear functions that model our data with one absolute value function?
11. Verify your conjecture by graphing the absolute value function over a scatterplot of
the Fire Station data. Sketch your graph. 12. How does this function remedy domain restrictions we encountered by using two
linear functions?
Absolute Value Functions
Maximizing Algebra II Performance Student Lesson: Absolute Value Functions
394
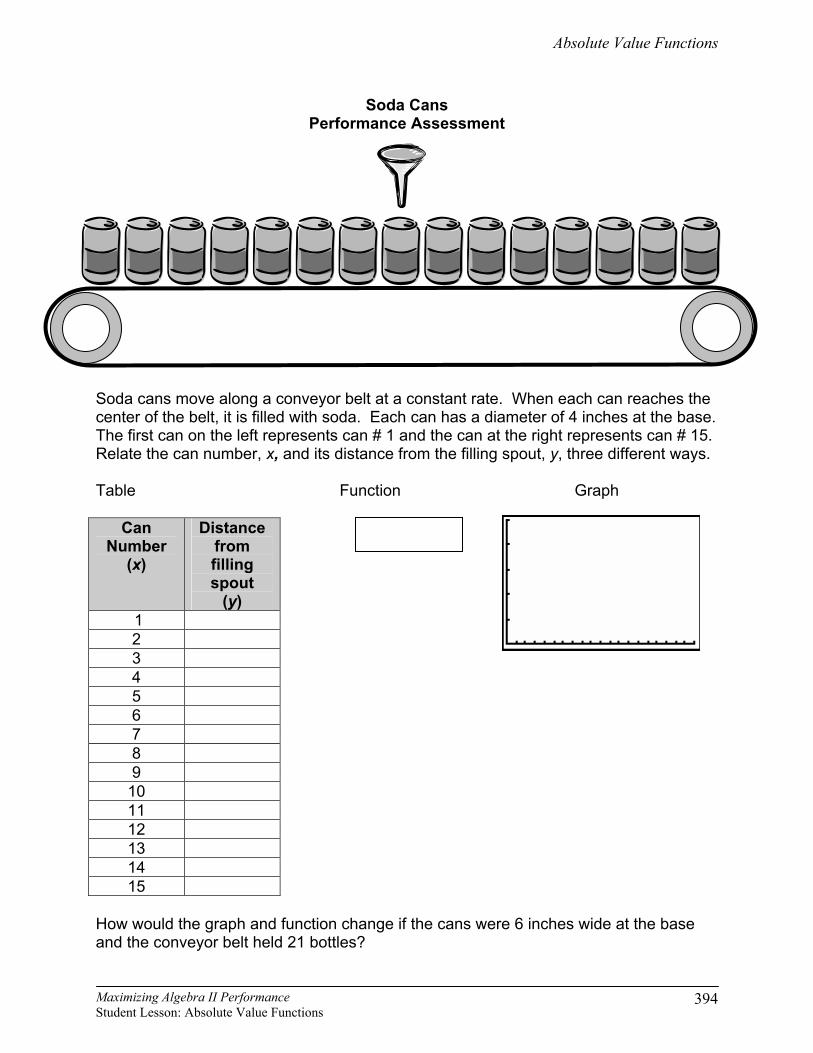
Soda Cans Performance Assessment
Soda cans move along a conveyor belt at a constant rate. When each can reaches the center of the belt, it is filled with soda. Each can has a diameter of 4 inches at the base. The first can on the left represents can # 1 and the can at the right represents can # 15. Relate the can number, x, and its distance from the filling spout, y, three different ways. Table Function Graph
Can Number
(x)
Distance from filling spout
(y) 1 2 3 4 5 6 7 8 9 10 11 12 13 14 15
How would the graph and function change if the cans were 6 inches wide at the base and the conveyor belt held 21 bottles?