Embed Size (px)
Citation preview
Diffusion & Osmosis Lab 1COPYMASTER: Permission granted to make unlimited copies. Copy use confined to educational purposes within a single school building. Copyright 2002–Neo/SCI Corporation.
11
Neo/SCI™
Student’s
GuideName . . . . . . . . . . . . . . . . . . . . . . . . . . . . . . . . . .
Teacher/Section . . . . . . . . . . . . . . . . . . . . . . . .
Date . . . . . . . . . . . . . . . . . . . . . . . . . . . . . . . . . . .
Diffusion & Osmosis
This lab exercise illustrates the role of the cell membranein regulating the passive movement of substancesbetween the environment and the cytoplasm.
• Construct models of cells using dialysis tubing tosimulate the selectively permeable nature of the plasmamembrane.
• Study the effects of diffusion through a selectivelypermeable membrane.
• Predict the characteristics of substances that allow themto pass through a selectively permeable membrane.
Diffusion occurs whenever concentrations of substancesare not even throughout an area. This unequal distribu-tion of particles is called a concentration gradient.Molecules tend to move from areas where they are highlyconcentrated to areas where there are less moleculespresent. This process does not require any energy input tomove the molecules from one area to another, and so issaid to be passive.
Cells are surrounded by the plasma membrane, which ismade up of a variety of different organic molecules, withthe most common component being phospholipids.
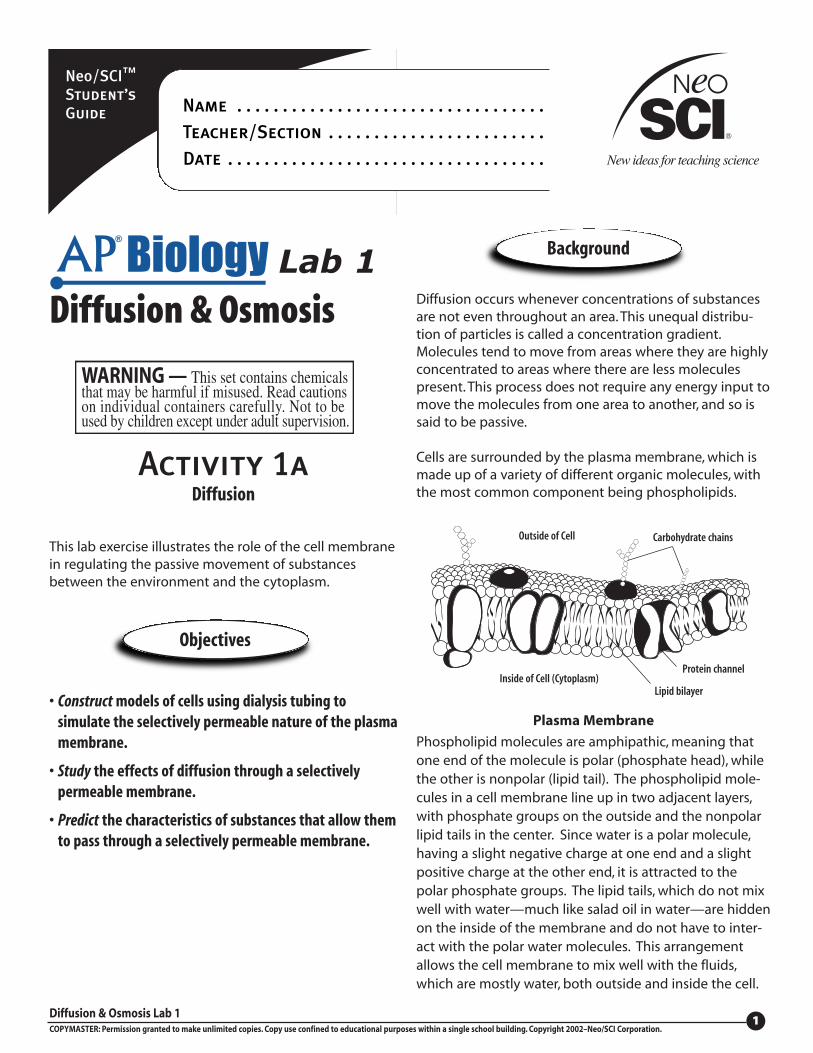
Plasma Membrane
Phospholipid molecules are amphipathic, meaning thatone end of the molecule is polar (phosphate head), whilethe other is nonpolar (lipid tail). The phospholipid mole-cules in a cell membrane line up in two adjacent layers,with phosphate groups on the outside and the nonpolarlipid tails in the center. Since water is a polar molecule,having a slight negative charge at one end and a slightpositive charge at the other end, it is attracted to thepolar phosphate groups. The lipid tails, which do not mixwell with water—much like salad oil in water—are hiddenon the inside of the membrane and do not have to inter-act with the polar water molecules. This arrangementallows the cell membrane to mix well with the fluids,which are mostly water, both outside and inside the cell.
Background
Objectives
Activity 1aDiffusion
Lab 1
Outside of Cell
Inside of Cell (Cytoplasm)Lipid bilayer
Protein channel
Carbohydrate chains
Diffusion & Osmosis Lab 1COPYMASTER: Permission granted to make unlimited copies. Copy use confined to educational purposes within a single school building. Copyright 2002–Neo/SCI Corporation.
22
Neo/SCI™
Student’s
GuideName . . . . . . . . . . . . . . . . . . . . . . . . . . . . . . . . . .
Teacher/Section . . . . . . . . . . . . . . . . . . . . . . . .
Date . . . . . . . . . . . . . . . . . . . . . . . . . . . . . . . . . . .
The cell membrane has several components besidesphospholipids, including proteins that act as channelsthrough the membrane, cholesterol molecules, enzymes,and carbohydrates. The cell membrane is said to beselectively permeable, that is, it lets some substancesinto and out of the cell, while not allowing other sub-stances to pass at all. Molecules that are large, such asproteins and starch, and charged particles, such as ions,usually are not able to get through the cell membraneunless the appropriate protein “gate” is present.Molecules that cannot pass from one side of the mem-brane to the other can become concentrated on oneside of the membrane. Solutes of different sizes and/orcharges can be separated from one another in this way.This process is called dialysis.
Per studentApronGlovesGoggles
Per group1 Cup, clear1 Funnel, plastic
15 cm Soaked dialysis tubing15 mL 15% Glucose/1% starch solution in medicine
cup1 Pipet, plastic2 Glucose test strips
1 mL Starch indicator solution (IKI)2 10-cm pieces of string
Water, distilled
Be sure to always wear safety goggles, gloves and a labapron to protect your eyes and clothing when workingwith any chemicals.
Iodine potassium iodide (IKI) is a corrosive substance andcan be a caustic irritant if allowed to come in contactwith the skin. Keep the iodine potassium iodide bottletightly capped and only open it when you are ready touse it. In case of spills or skin contact, inform yourteacher immediately and flush areas with running waterfor 15 minutes.
Dispose of any waste materials and clean up your workarea as directed by your teacher.
Be sure to always wash your hands before leaving thelaboratory.
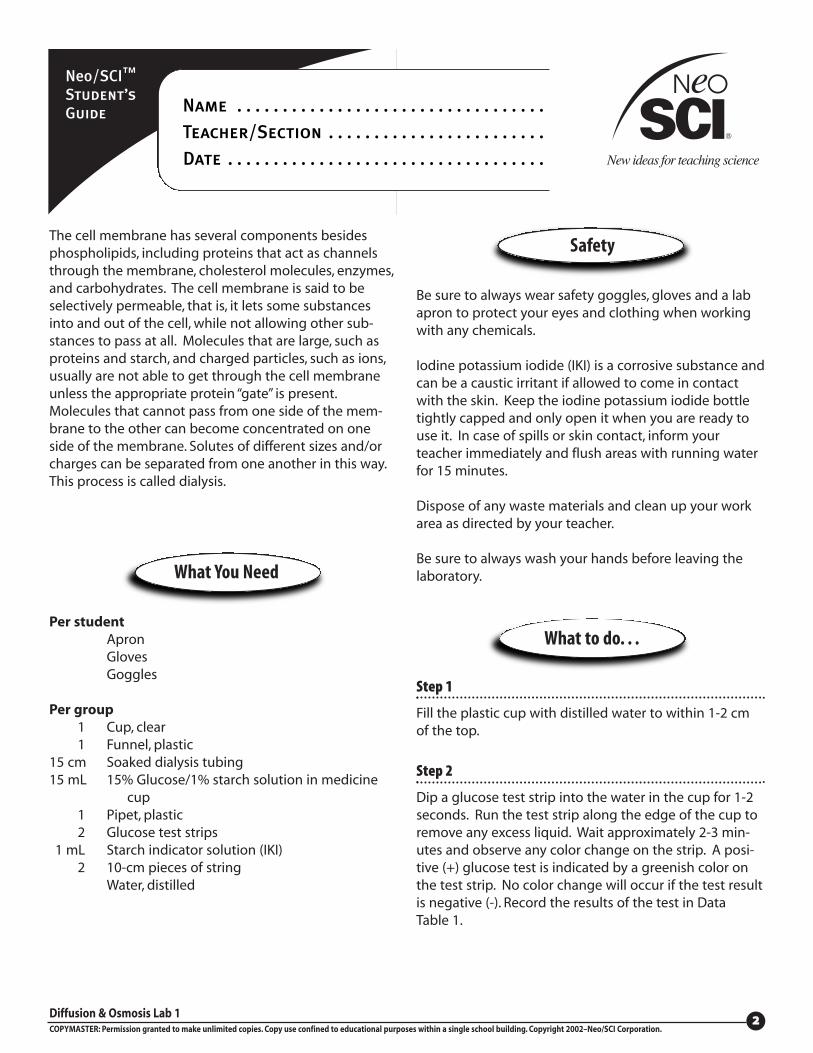
Step 1
Fill the plastic cup with distilled water to within 1-2 cmof the top.
Step 2
Dip a glucose test strip into the water in the cup for 1-2seconds. Run the test strip along the edge of the cup toremove any excess liquid. Wait approximately 2-3 min-utes and observe any color change on the strip. A posi-tive (+) glucose test is indicated by a greenish color onthe test strip. No color change will occur if the test resultis negative (-). Record the results of the test in DataTable 1.
What You Need
What to do. . .
Safety
Diffusion & Osmosis Lab 1COPYMASTER: Permission granted to make unlimited copies. Copy use confined to educational purposes within a single school building. Copyright 2002–Neo/SCI Corporation.
33
Neo/SCI™
Student’s
GuideName . . . . . . . . . . . . . . . . . . . . . . . . . . . . . . . . . .
Teacher/Section . . . . . . . . . . . . . . . . . . . . . . . .
Date . . . . . . . . . . . . . . . . . . . . . . . . . . . . . . . . . . .
Step 3
Caution: IKI solution is a poison. Avoid any skin contact.Be sure to wear proper safety equipment.Using the plastic pipet, carefully add 20-25 drops of thestarch indicator solution (IKI) to the water in the cup.Observe what happens to the indicator solution as itmixes with the water. Record the color of the water inData Table 1.
Step 4
Your teacher will provide you with a soaking dialysistube segment. Gently rub the tubing between yourfingers to open it.
Step 5
Tie one end of the tubing tightly with one piece ofstring. Make sure this end is tied tightly enough to pre-vent any leaks from the end of the bag. Fill the tubingwith water and test it for leaks at a sink. Empty thetubing.
Step 6
Insert the tip of the plastic funnel into the open end ofthe dialysis bag, and pour the 15 mL of 15% glucose/1%starch solution from the medicine cup into the tubing.
Step 7
Squeeze all the air bubbles out of the tubing and tie theopen end shut with another piece of string. Note thecolor of the starch-glucose solution in the dialysis tubingand record your observations in Data Table 1.
Step 8
Briefly rinse the outside of the bag under running water.Squeeze the bag gently to be sure that there are noleaks. If you find a bag leaking at an end, retie it securely.
Step 9
Completely submerge the model cell into the cup ofwater and starch indicator solution. Allow osmosis anddiffusion to occur for 30 minutes.
Step 10
After 30 minutes, test the water in the cup for sugarcontent, as in Step 2. Note any color changes in thedialysis tubing and in the cup. Record these observa-tions in Data Table 1.Note: A positive (+) result for the presence of starch isindicated by a blue black color of the final solution. If thestarch test result is negative (-), the final solution will be anorange brown color.
Step 11
Be sure to wash your hands and clean up and dispose ofany waste materials as directed by your teacher.
Diffusion & Osmosis Lab 1COPYMASTER: Permission granted to make unlimited copies. Copy use confined to educational purposes within a single school building. Copyright 2002–Neo/SCI Corporation.
44
Neo/SCI™
Student’s
GuideName . . . . . . . . . . . . . . . . . . . . . . . . . . . . . . . . . .
Teacher/Section . . . . . . . . . . . . . . . . . . . . . . . .
Date . . . . . . . . . . . . . . . . . . . . . . . . . . . . . . . . . . .
1. What is simple diffusion?
............................................................................................................
............................................................................................................
............................................................................................................
2. What are two characteristics of substances that do not allow them to pass through the selectively per-meable membrane of living cells?
............................................................................................................
............................................................................................................
3. What types of substances pass easily through living cell membranes?
............................................................................................................
............................................................................................................
............................................................................................................
4. Did the glucose molecules pass through the dialysis tubing? How do you know?
............................................................................................................
............................................................................................................
............................................................................................................
5. Did the starch molecules pass through the dialysis tubing? What evidence do you have to support this conclusion?
............................................................................................................
............................................................................................................
............................................................................................................
6. Why did we use dialysis tubing as a model for a cell membrane?
............................................................................................................
............................................................................................................
............................................................................................................
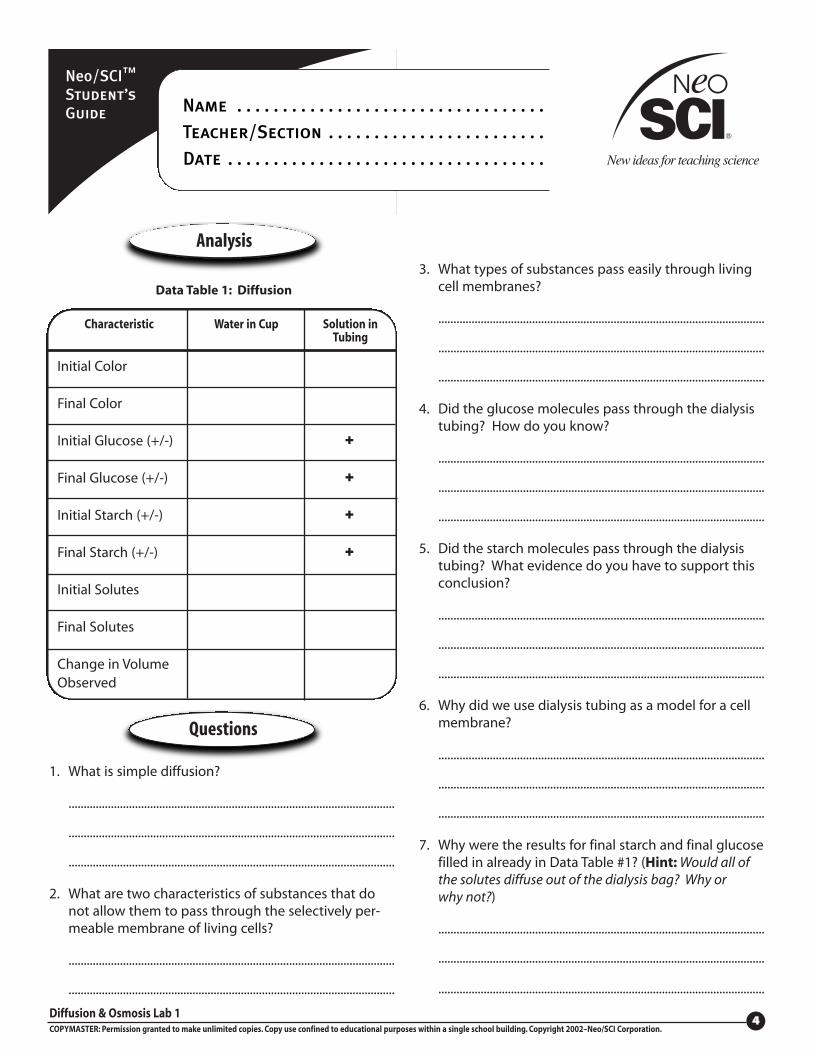
7. Why were the results for final starch and final glucosefilled in already in Data Table #1? (Hint: Would all of the solutes diffuse out of the dialysis bag? Why or why not?)
............................................................................................................
............................................................................................................
............................................................................................................
Analysis
Questions
Characteristic Solution inTubing
Initial Color
Final Color
Initial Glucose (+/-) +
Final Glucose (+/-) +
Initial Starch (+/-) +
Final Starch (+/-) +
Initial Solutes
Final Solutes
Change in Volume Observed
Water in Cup
Data Table 1: Diffusion
Diffusion & Osmosis Lab 1COPYMASTER: Permission granted to make unlimited copies. Copy use confined to educational purposes within a single school building. Copyright 2002–Neo/SCI Corporation.
55
Neo/SCI™
Student’s
GuideName . . . . . . . . . . . . . . . . . . . . . . . . . . . . . . . . . .
Teacher/Section . . . . . . . . . . . . . . . . . . . . . . . .
Date . . . . . . . . . . . . . . . . . . . . . . . . . . . . . . . . . . .
This lab exercise models the effect of hypertonic andhypotonic solutions on the cell due to the selectivelypermeable nature of the cell membrane.
• Construct models of cells using dialysis tubing tosimulate the selectively permeable nature of the plasmamembrane.
• Observe the effects of osmosis on a model cell.
• Predict the effect of solute concentration on osmosis.
Osmosis is a term used to describe diffusion under a par-ticular set of circumstances. Consider what occurs whena concentration gradient exists across a plasma mem-brane, but the solutes are unable to cross from one sideto the other due to size or electrochemical interactions.In this situation, diffusion of solutes cannot occur.
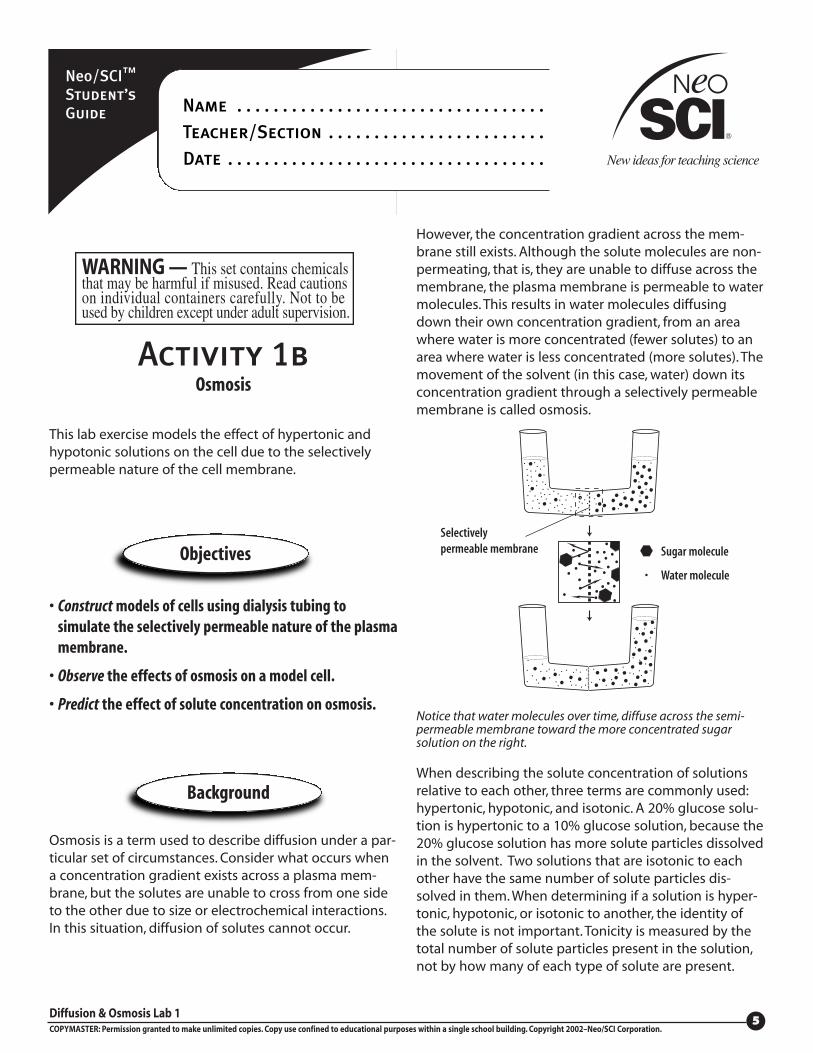
However, the concentration gradient across the mem-brane still exists. Although the solute molecules are non-permeating, that is, they are unable to diffuse across themembrane, the plasma membrane is permeable to watermolecules. This results in water molecules diffusingdown their own concentration gradient, from an areawhere water is more concentrated (fewer solutes) to anarea where water is less concentrated (more solutes). Themovement of the solvent (in this case, water) down itsconcentration gradient through a selectively permeablemembrane is called osmosis.
Notice that water molecules over time, diffuse across the semi-permeable membrane toward the more concentrated sugarsolution on the right.
When describing the solute concentration of solutionsrelative to each other, three terms are commonly used:hypertonic, hypotonic, and isotonic. A 20% glucose solu-tion is hypertonic to a 10% glucose solution, because the20% glucose solution has more solute particles dissolvedin the solvent. Two solutions that are isotonic to eachother have the same number of solute particles dis-solved in them. When determining if a solution is hyper-tonic, hypotonic, or isotonic to another, the identity ofthe solute is not important. Tonicity is measured by thetotal number of solute particles present in the solution,not by how many of each type of solute are present.
Activity 1bOsmosis
Background
Objectives Sugar molecule
Water molecule
Selectivelypermeable membrane

Diffusion & Osmosis Lab 1COPYMASTER: Permission granted to make unlimited copies. Copy use confined to educational purposes within a single school building. Copyright 2002–Neo/SCI Corporation.
66
Neo/SCI™
Student’s
GuideName . . . . . . . . . . . . . . . . . . . . . . . . . . . . . . . . . .
Teacher/Section . . . . . . . . . . . . . . . . . . . . . . . .
Date . . . . . . . . . . . . . . . . . . . . . . . . . . . . . . . . . . .
Per studentApronGlovesGoggles
Per group6 Cups, clear6 15-cm dialysis tubing segments
12 10-cm string segments1 Medicine cup, plastic
10 mL Distilled water10 mL 0.2 M Sucrose solution10 mL 0.4 M Sucrose solution10 mL 0.6 M Sucrose solution10 mL 0.8 M Sucrose solution10 mL 1.0 M Sucrose solution
1 Marking pencilLabeling tapeCalculatorPaper toweling
Shared MaterialsBalance(s)Distilled water to cover the tubing bags in cups
Be sure to always wear safety goggles, gloves and a labapron to protect your eyes and clothing when workingwith any chemicals.
Dispose of any waste materials and clean up your workarea as directed by your teacher.
Be sure to always wash your hands before leaving thelaboratory.
Step 1
Number the plastic cups 1-6 with the marking pencil andlabeling tape.
Step 2
Your teacher will provide you with 6 soaking dialysistube segments. Gently rub each piece of tubingbetween your fingers to open it.
Step 3
Tie one end of each piece of tubing tightly with a pieceof string. Make sure the knot tight enough to preventany leaks from the end of the bag. Fill the tubing withwater and test it for leaks at a sink. Empty the tubing.Repeat this step for each of the 6 dialysis tubingsegments.
Step 4
Using the medicine cup provided, measure out 10 mL ofthe appropriate solution into the dialysis bags as follows:
Rinse the medicine cup between solutions. Be sure togently squeeze excess air from each bag. Tie off theother end of each dialysis bag with string.
What You Need
Safety
What to do. . .
Bag to be placed in cup #
1 Distilled water
2 0.2 M Sucrose
3 0.4 M Sucrose
4 0.6 M Sucrose
5 0.8 M Sucrose
6 1.0 M Sucrose
Solution
Diffusion & Osmosis Lab 1COPYMASTER: Permission granted to make unlimited copies. Copy use confined to educational purposes within a single school building. Copyright 2002–Neo/SCI Corporation.
77
Neo/SCI™
Student’s
GuideName . . . . . . . . . . . . . . . . . . . . . . . . . . . . . . . . . .
Teacher/Section . . . . . . . . . . . . . . . . . . . . . . . .
Date . . . . . . . . . . . . . . . . . . . . . . . . . . . . . . . . . . .
Step 5
Briefly rinse the outside of each bag under runningwater. Squeeze each bag gently to be sure that there areno leaks. If you find a bag leaking at an end, retie itsecurely.
Step 6
Dry the outside of the bag with a paper towel, andobtain the mass of each bag. Record the initial mass ofeach bag in Data Table 2.
Step 7
Place the correct model cell into each numbered cupand fill each cup with enough distilled water to com-pletely cover each model cell. Allow osmosis to occur for30 minutes.
Step 8
After waiting 30 minutes, remove each bag from its cup.Gently blot excess moisture from the surface of each bagwith a paper towel and obtain the mass of each bag.Record the final mass of each bag in Data Table 2.
Step 9
Be sure to wash your hands and clean up and dispose ofany waste materials as directed by your teacher.
Step 10
For each of the solutions, subtract the initial mass of thedialysis bag from the final mass of the dialysis bag toobtain the change in mass and record this information inData Table 2. Be sure to record a positive result if thebags gained mass, and a negative result if the bags lostmass.
Step 11
For each solution, divide the result you got in Step 9 bythe initial mass of the bags and multiply by 100. This isthe percent change in mass for each bag. Record yourresults in Data Table 2.
Step 12
Calculate the class average percent change in mass ofthe bags in each solution, and record your results in DataTable 3.
Step 13
Construct a graph using Figure 1, illustrating the percentchange in mass for both your group’s data and the com-bined class averages.
Diffusion & Osmosis Lab 1COPYMASTER: Permission granted to make unlimited copies. Copy use confined to educational purposes within a single school building. Copyright 2002–Neo/SCI Corporation.
88
Neo/SCI™
Student’s
GuideName . . . . . . . . . . . . . . . . . . . . . . . . . . . . . . . . . .
Teacher/Section . . . . . . . . . . . . . . . . . . . . . . . .
Date . . . . . . . . . . . . . . . . . . . . . . . . . . . . . . . . . . .
Analysis
Beaker with: Final Mass
of Bag (g)
Distilled Water
0.2 M Sucrose
0.4 M Sucrose
0.6 M Sucrose
0.8 M Sucrose
1.0 M Sucrose
Initial Mass
of Bag (g)
Change Mass
of Bag (g)
% Change Mass
of Bag (g)
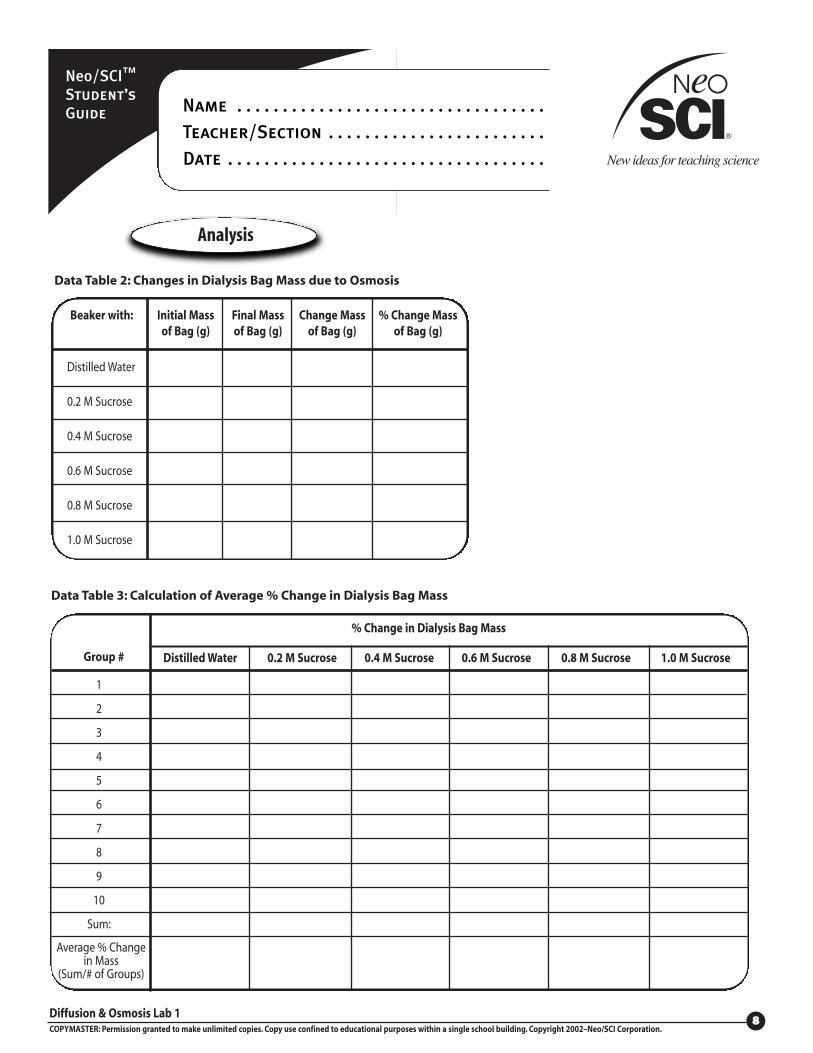
Data Table 2: Changes in Dialysis Bag Mass due to Osmosis
1
2
3
4
5
6
7
8
9
10
Sum:
Distilled Water 0.2 M Sucrose 0.4 M Sucrose 0.6 M Sucrose 0.8 M Sucrose 1.0 M Sucrose
% Change in Dialysis Bag Mass
Data Table 3: Calculation of Average % Change in Dialysis Bag Mass
Average % Changein Mass
(Sum/# of Groups)
Group #
Diffusion & Osmosis Lab 1COPYMASTER: Permission granted to make unlimited copies. Copy use confined to educational purposes within a single school building. Copyright 2002–Neo/SCI Corporation.
99
Neo/SCI™
Student’s
GuideName . . . . . . . . . . . . . . . . . . . . . . . . . . . . . . . . . .
Teacher/Section . . . . . . . . . . . . . . . . . . . . . . . .
Date . . . . . . . . . . . . . . . . . . . . . . . . . . . . . . . . . . .
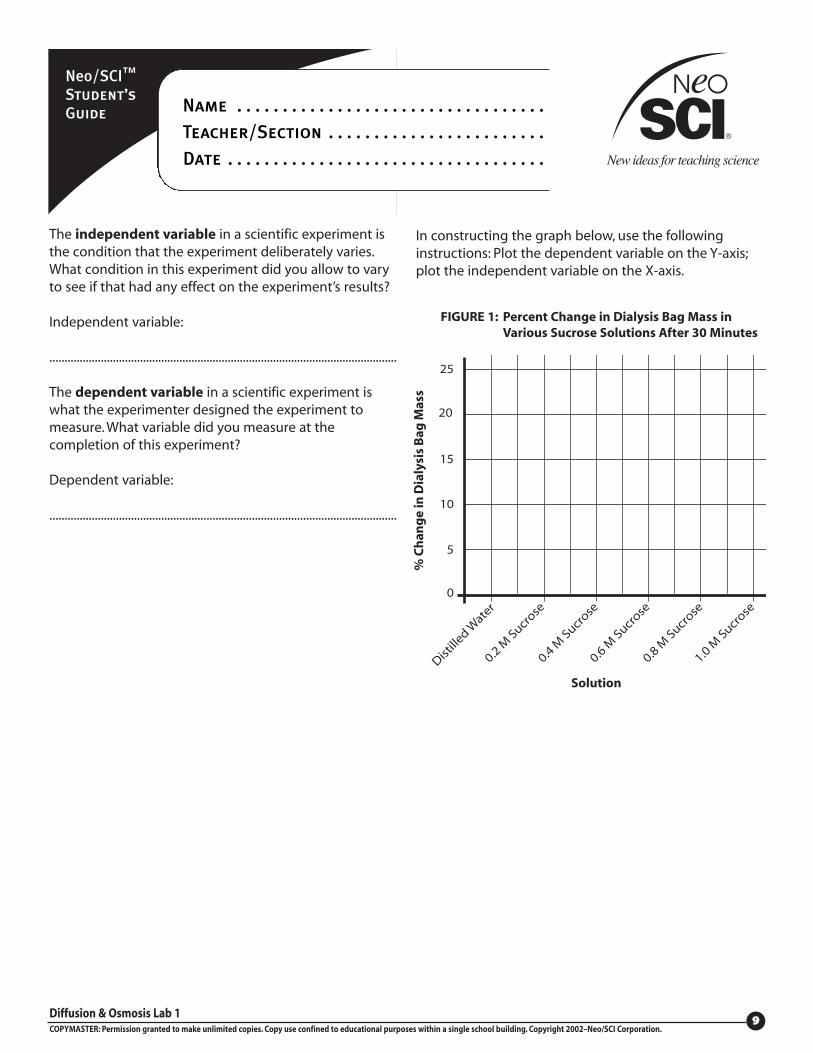
The independent variable in a scientific experiment isthe condition that the experiment deliberately varies.What condition in this experiment did you allow to varyto see if that had any effect on the experiment’s results?
Independent variable:
...................................................................................................................
The dependent variable in a scientific experiment iswhat the experimenter designed the experiment tomeasure. What variable did you measure at thecompletion of this experiment?
Dependent variable:
...................................................................................................................
FIGURE 1: Percent Change in Dialysis Bag Mass in
Various Sucrose Solutions After 30 Minutes
In constructing the graph below, use the followinginstructions: Plot the dependent variable on the Y-axis;plot the independent variable on the X-axis.
0
10
5
15
20
25
Distille
d Wate
r
0.2 M Sucro
se
0.4 M Sucro
se
0.6 M Sucro
se
0.8 M Sucro
se
1.0 M Sucro
se
% C
han
ge
in D
ialy
sis
Bag
Mas
s
Solution
Diffusion & Osmosis Lab 1COPYMASTER: Permission granted to make unlimited copies. Copy use confined to educational purposes within a single school building. Copyright 2002–Neo/SCI Corporation.
1100
Neo/SCI™
Student’s
GuideName . . . . . . . . . . . . . . . . . . . . . . . . . . . . . . . . . .
Teacher/Section . . . . . . . . . . . . . . . . . . . . . . . .
Date . . . . . . . . . . . . . . . . . . . . . . . . . . . . . . . . . . .
4. Did you see any clear relationship between the molarity of the solutions in the bags and the percent change in the mass of the bag? If so, how would you describe that relationship?
............................................................................................................
............................................................................................................
............................................................................................................
5. If you had placed all 6 bags into a beaker containing 1.2 M sucrose, would your results have differed from what you observed? Why? Describe possible results for each of the bags placed in this solution.
............................................................................................................
............................................................................................................
............................................................................................................
1. What is osmosis, and how does it differ from simple diffusion?
............................................................................................................
............................................................................................................
............................................................................................................
2. Did osmosis occur in each treatment? What observa-tion led you to this conclusion?
............................................................................................................
............................................................................................................
............................................................................................................
3. You observed a change in mass of the bags over the course of the experiment. Why was it important to convert the absolute change in mass of the bags to percent change in mass of the bags?
............................................................................................................
............................................................................................................
............................................................................................................
Questions
Diffusion & Osmosis Lab 1COPYMASTER: Permission granted to make unlimited copies. Copy use confined to educational purposes within a single school building. Copyright 2002–Neo/SCI Corporation.
1111
Neo/SCI™
Student’s
GuideName . . . . . . . . . . . . . . . . . . . . . . . . . . . . . . . . . .
Teacher/Section . . . . . . . . . . . . . . . . . . . . . . . .
Date . . . . . . . . . . . . . . . . . . . . . . . . . . . . . . . . . . .
This lab exercise will allow the calculation of waterpotential in potato tuber tissue placed in solutions ofvarious molarities.
• Observe the effects of water potential on cells placed inhypotonic and hypertonic solutions.
• Calculate the percent change in mass of potato coresover the course of the experiment.
• Predict the approximate solute concentration insidepotato tuber cells.
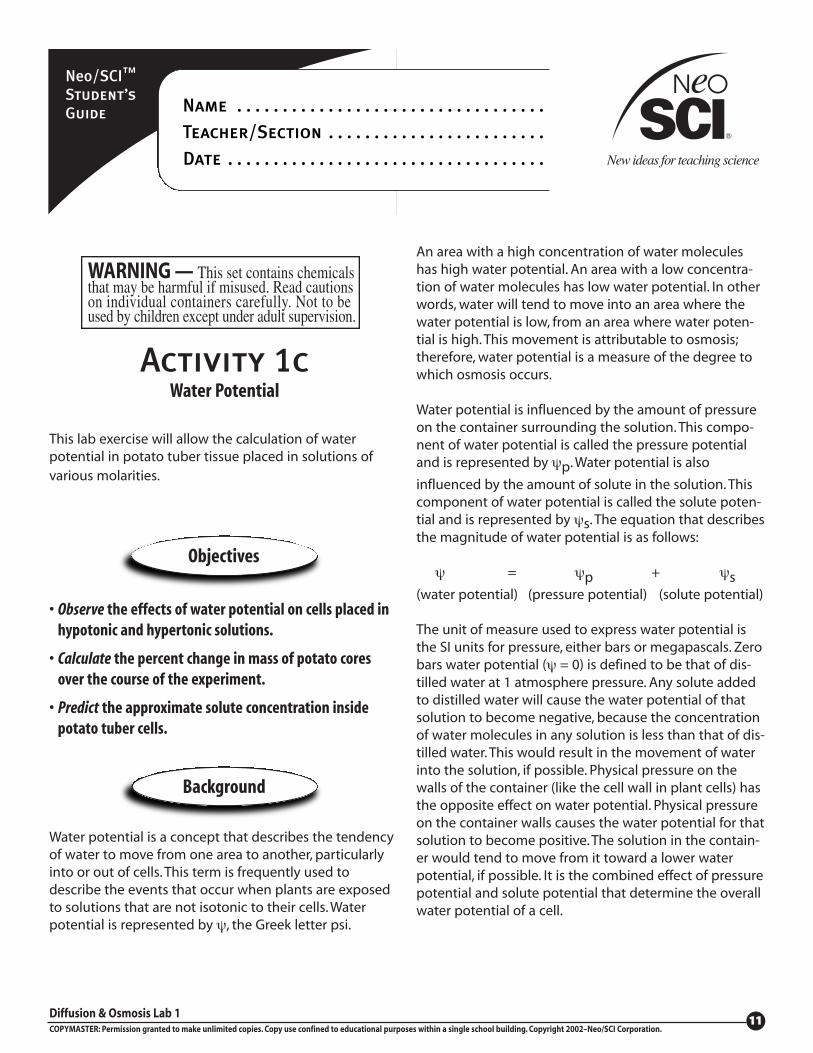
Water potential is a concept that describes the tendencyof water to move from one area to another, particularlyinto or out of cells. This term is frequently used todescribe the events that occur when plants are exposedto solutions that are not isotonic to their cells. Waterpotential is represented by ψ, the Greek letter psi.
An area with a high concentration of water moleculeshas high water potential. An area with a low concentra-tion of water molecules has low water potential. In otherwords, water will tend to move into an area where thewater potential is low, from an area where water poten-tial is high. This movement is attributable to osmosis;therefore, water potential is a measure of the degree towhich osmosis occurs.
Water potential is influenced by the amount of pressureon the container surrounding the solution. This compo-nent of water potential is called the pressure potentialand is represented by ψp. Water potential is also
influenced by the amount of solute in the solution. Thiscomponent of water potential is called the solute poten-tial and is represented by ψs. The equation that describesthe magnitude of water potential is as follows:
ψ = ψp + ψs(water potential) (pressure potential) (solute potential)
The unit of measure used to express water potential isthe SI units for pressure, either bars or megapascals. Zerobars water potential (ψ = 0) is defined to be that of dis-tilled water at 1 atmosphere pressure. Any solute addedto distilled water will cause the water potential of thatsolution to become negative, because the concentrationof water molecules in any solution is less than that of dis-tilled water. This would result in the movement of waterinto the solution, if possible. Physical pressure on thewalls of the container (like the cell wall in plant cells) hasthe opposite effect on water potential. Physical pressureon the container walls causes the water potential for thatsolution to become positive. The solution in the contain-er would tend to move from it toward a lower waterpotential, if possible. It is the combined effect of pressurepotential and solute potential that determine the overallwater potential of a cell.
Background
Objectives
Activity 1cWater Potential
Diffusion & Osmosis Lab 1COPYMASTER: Permission granted to make unlimited copies. Copy use confined to educational purposes within a single school building. Copyright 2002–Neo/SCI Corporation.
1122
Neo/SCI™
Student’s
GuideName . . . . . . . . . . . . . . . . . . . . . . . . . . . . . . . . . .
Teacher/Section . . . . . . . . . . . . . . . . . . . . . . . .
Date . . . . . . . . . . . . . . . . . . . . . . . . . . . . . . . . . . .
Potato tuber cells can be used to demonstrate the effectof solute concentration on water potential. Rememberthat each plant cell is surrounded by a cell membraneand a nonliving cellulose cell wall. If we place potatotuber cells into a container of distilled water osmosis willoccur. Water molecules will move down the solutepotential through the selectively permeable membraneinto the potato cells. This will continue until the resist-ance provided by the cell wall stops any further netmovement of water molecules. At this point, the pressurepotential (due to the rigid cell wall) and the solutepotential are equal. What is your prediction about thewater potential changes in potato tuber cells placed in ahypertonic solution?
Per studentApronGlovesGoggles
Per group1 #2 Cork borer (inner diameter of
approximately 5mm)1 Potato1 Knife or scalpel1 Centimeter ruler6 Clear plastic cups6 Pieces of plastic wrap or aluminum foil1 Marking pencil
Labeling tape100 mL Distilled water100 mL 0.2 M Sucrose solution100 mL 0.4 M Sucrose solution100 mL 0.6 M Sucrose solution100 mL 0.8 M Sucrose solution100 mL 1.0 M Sucrose solution
Paper toweling
Shared materialsBalance
Be sure to always wear safety goggles, gloves and a labapron to protect your eyes and clothing when workingwith any chemicals.
Use caution when handling sharp lab instruments.
Dispose of any waste materials and clean up your workarea as directed by your teacher.
Be sure to always wash your hands before leaving thelaboratory.
Step 1
Label 6 clear plastic cups with the different solutionsused in this lab. Pour 100 mL of the appropriate solutioninto the cups.
Step 2
Push the cork borer completely through the potato.Remove the potato core from the borer. Carefully cut offeach end of the core where the potato “skin” is.
Step 3
Lay the core next to a metric ruler. Measure and cut a 3cm long potato core section.
Step 4
Punch a total of 4 potato cores, each 3 cm in length.Obtain the mass of the 4 cores together to the nearest0.1 g. If you have to wait to use the balance, be sure towrap the cores in a piece of plastic wrap or aluminumfoil until the balance is available.
What You Need What to do. . .
Safety
Diffusion & Osmosis Lab 1COPYMASTER: Permission granted to make unlimited copies. Copy use confined to educational purposes within a single school building. Copyright 2002–Neo/SCI Corporation.
1133
Neo/SCI™
Student’s
GuideName . . . . . . . . . . . . . . . . . . . . . . . . . . . . . . . . . .
Teacher/Section . . . . . . . . . . . . . . . . . . . . . . . .
Date . . . . . . . . . . . . . . . . . . . . . . . . . . . . . . . . . . .
Step 5
Place these 4 cores into one of the labeled plastic cupscontaining a solution. Record the initial mass of the 4cores for this solution in Data Table 4.
Step 6
Repeat Steps 2-5 with each of the remaining cups. Coverall of the cups with plastic wrap or aluminum foil to keepevaporation to a minimum.
Step 7
Place the cups in a location where they won’t be dis-turbed overnight.
Step 8
Remove the cores from one of the cups and carefullyplace them on a paper towel. Dab the cores with thepaper towel to dry them. Obtain the mass of the 4 corestogether. Record the final mass of the cores in Data Table 4.
Step 9
Repeat Step 8 for each of the cups.
Step 10
For each of the solutions, subtract the initial mass of thecores from the final mass of the cores to obtain thechange in mass. Be sure to record a positive result if thecores gained mass, and a negative result if the cores lostmass. Record these calculations in Data Table 4.
Step 11
For each solution, calculate the percent change in massfor the cores as you did for the dialysis bags in theprevious exercise. Record your results.
Step 12
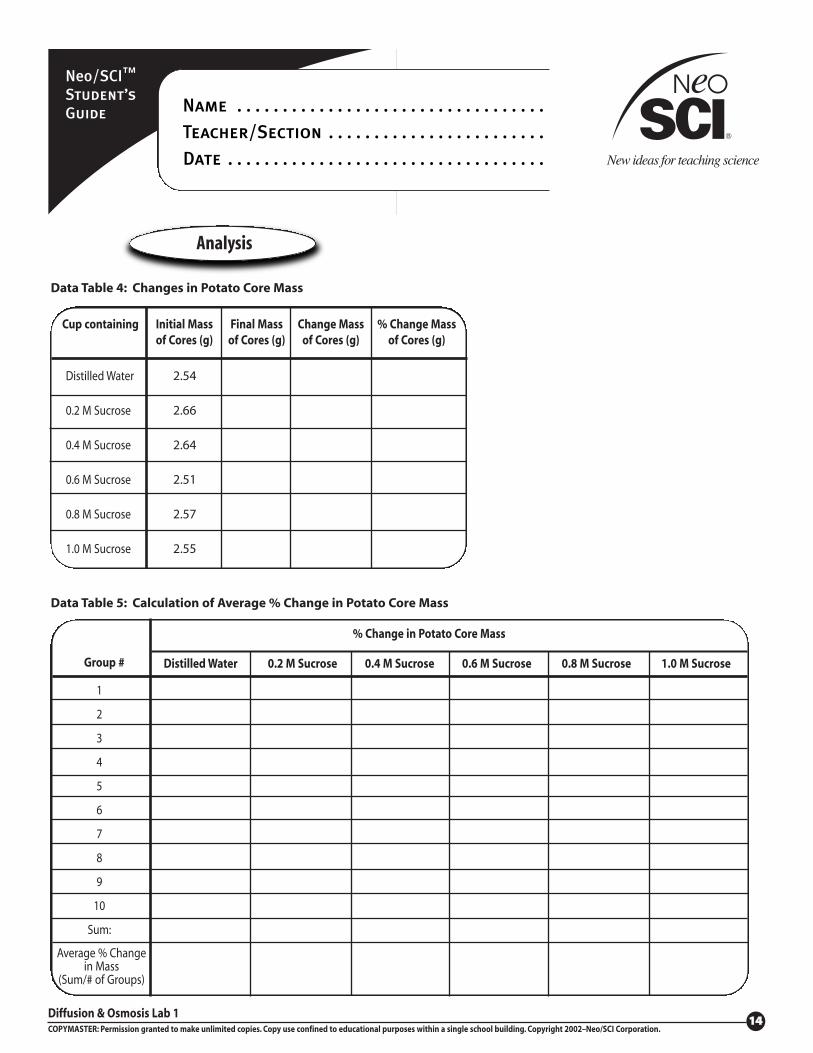
Calculate the class average percent change in mass ofthe cores in each solution in Data Table 5.
Step 13
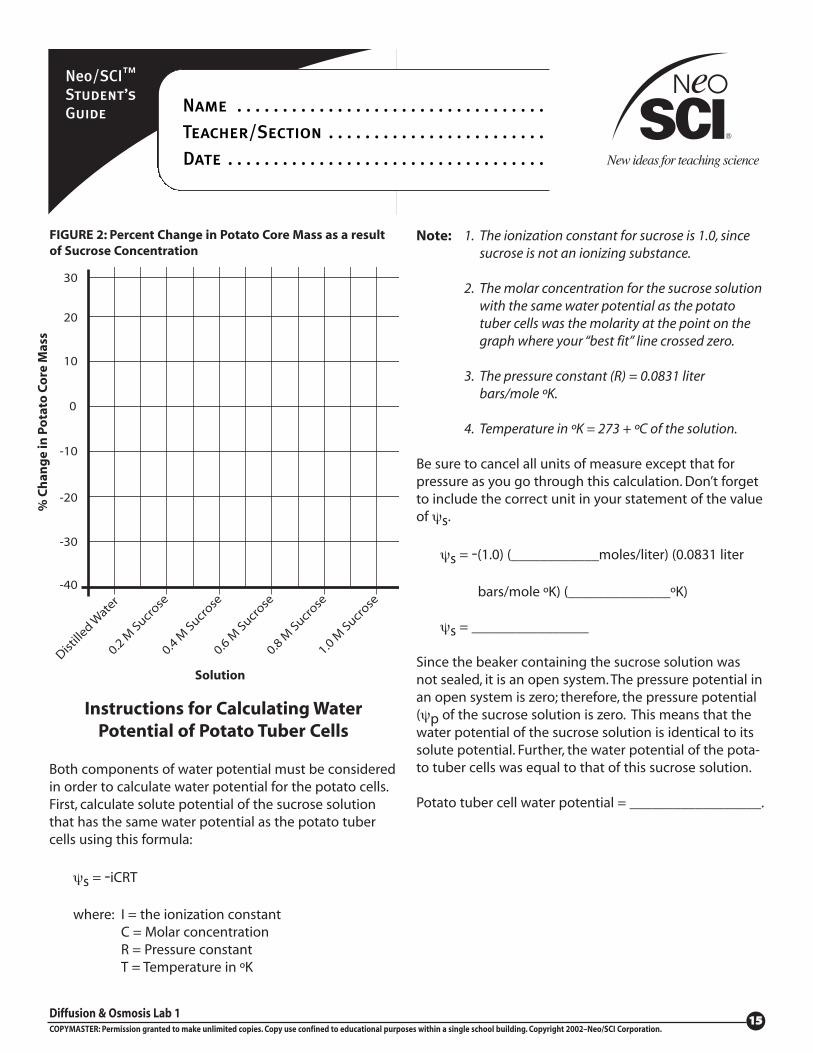
You will construct a graph of the percent change in massfor both your group’s data and the combined classaverages in Figure 2. Plot the molarity of the solutions inthe beakers on the X-axis, and the % change in mass ofthe potato cores on the Y-axis.
Step 14
Using a ruler, draw a “best fit” line corresponding to thepoints on your graph. The point at which your linecrosses zero on the Y-axis is an approximation of themolar concentration of solutes inside the potato tubercells. This point identifies the molarity of a sucrose solu-tion that has the same water potential as that of thepotato tuber cells.
Step 15
Be sure to wash your hands and clean up and dispose ofany waste materials as directed by your teacher.
Diffusion & Osmosis Lab 1COPYMASTER: Permission granted to make unlimited copies. Copy use confined to educational purposes within a single school building. Copyright 2002–Neo/SCI Corporation.
1144
Neo/SCI™
Student’s
GuideName . . . . . . . . . . . . . . . . . . . . . . . . . . . . . . . . . .
Teacher/Section . . . . . . . . . . . . . . . . . . . . . . . .
Date . . . . . . . . . . . . . . . . . . . . . . . . . . . . . . . . . . .
Analysis
Data Table 4: Changes in Potato Core Mass
Data Table 5: Calculation of Average % Change in Potato Core Mass
1
2
3
4
5
6
7
8
9
10
Sum:
Distilled Water 0.2 M Sucrose 0.4 M Sucrose 0.6 M Sucrose 0.8 M Sucrose 1.0 M Sucrose
% Change in Potato Core Mass
Average % Changein Mass
(Sum/# of Groups)
Group #
Cup containing Final Mass
of Cores (g)
Distilled Water
0.2 M Sucrose
0.4 M Sucrose
0.6 M Sucrose
0.8 M Sucrose
1.0 M Sucrose
Initial Mass
of Cores (g)
Change Mass
of Cores (g)
% Change Mass
of Cores (g)
2.54
2.66
2.64
2.51
2.57
2.55
Diffusion & Osmosis Lab 1COPYMASTER: Permission granted to make unlimited copies. Copy use confined to educational purposes within a single school building. Copyright 2002–Neo/SCI Corporation.
1155
Neo/SCI™
Student’s
GuideName . . . . . . . . . . . . . . . . . . . . . . . . . . . . . . . . . .
Teacher/Section . . . . . . . . . . . . . . . . . . . . . . . .
Date . . . . . . . . . . . . . . . . . . . . . . . . . . . . . . . . . . .
Instructions for Calculating WaterPotential of Potato Tuber Cells
Both components of water potential must be consideredin order to calculate water potential for the potato cells.First, calculate solute potential of the sucrose solutionthat has the same water potential as the potato tubercells using this formula:
ψs = -iCRT
where: I = the ionization constantC = Molar concentrationR = Pressure constantT = Temperature in ºK
Note: 1. The ionization constant for sucrose is 1.0, since sucrose is not an ionizing substance.
2. The molar concentration for the sucrose solutionwith the same water potential as the potato tuber cells was the molarity at the point on the graph where your “best fit” line crossed zero.
3. The pressure constant (R) = 0.0831 liter bars/mole ºK.
4. Temperature in ºK = 273 + ºC of the solution.
Be sure to cancel all units of measure except that forpressure as you go through this calculation. Don’t forgetto include the correct unit in your statement of the valueof ψs.
ψs = -(1.0) (____________moles/liter) (0.0831 liter
bars/mole ºK) (______________ºK)
ψs = ________________
Since the beaker containing the sucrose solution wasnot sealed, it is an open system. The pressure potential inan open system is zero; therefore, the pressure potential(ψp of the sucrose solution is zero. This means that thewater potential of the sucrose solution is identical to itssolute potential. Further, the water potential of the pota-to tuber cells was equal to that of this sucrose solution.
Potato tuber cell water potential = __________________.
FIGURE 2: Percent Change in Potato Core Mass as a result
of Sucrose Concentration
-40
-20
-30
-10
0
10
20
30
Distille
d Wate
r
0.2 M Sucro
se
0.4 M Sucro
se
0.6 M Sucro
se
0.8 M Sucro
se
1.0 M Sucro
se
% C
han
ge
in P
ota
to C
ore
Mas
s
Solution
Diffusion & Osmosis Lab 1COPYMASTER: Permission granted to make unlimited copies. Copy use confined to educational purposes within a single school building. Copyright 2002–Neo/SCI Corporation.
1166
Neo/SCI™
Student’s
GuideName . . . . . . . . . . . . . . . . . . . . . . . . . . . . . . . . . .
Teacher/Section . . . . . . . . . . . . . . . . . . . . . . . .
Date . . . . . . . . . . . . . . . . . . . . . . . . . . . . . . . . . . .
1. Why was it necessary to keep the potato tuber cores in a covered container until the balance was avail-able? If you had left them out in the open, how might that have affected your results?
............................................................................................................
............................................................................................................
............................................................................................................
2. Some plants grow in salt marshes, where the concentration of solutes in the soil water is high. What is one adaptation you might expect to find in these salt-tol-erant plants with respect to the solute concentration within their cells?
............................................................................................................
............................................................................................................
............................................................................................................
3. Water is usually “pulled” through a plant, from roots toleaves. What happens at the leaves to cause this “pull”? (Hint: Think about the effect of a hot, windy day on a puddle of water.) How would you describe the water potential at the leaf versus the water potential at the root? Why?
............................................................................................................
............................................................................................................
............................................................................................................
Questions Notes
Diffusion & Osmosis Lab 1COPYMASTER: Permission granted to make unlimited copies. Copy use confined to educational purposes within a single school building. Copyright 2002–Neo/SCI Corporation.
1177
Neo/SCI™
Student’s
GuideName . . . . . . . . . . . . . . . . . . . . . . . . . . . . . . . . . .
Teacher/Section . . . . . . . . . . . . . . . . . . . . . . . .
Date . . . . . . . . . . . . . . . . . . . . . . . . . . . . . . . . . . .
This lab exercise demonstrates the effect of hypertonicand hypotonic solutions on plant cells. Both turgid andplasmolyzed cells will be easily observed.
• Prepare a wet mount slide of onion epidermal cells.
• Observe the effects of hypertonic and hypotonicsolutions on a plant cell.
• Predict the conditions under which plasmolysis andturgidity would occur in living plants.
When a solution becomes more concentrated on oneside of a selectively permeable membrane than on theother, osmosis will occur. In living cells, when the extra-cellular fluid solutes become more concentrated thanthe solutes in the cytosol, water will leave the cell byosmosis. In this case, the solution surrounding the cell ishypertonic to the cytosol, meaning that it has a greaterconcentration of solutes than does the cytosol.
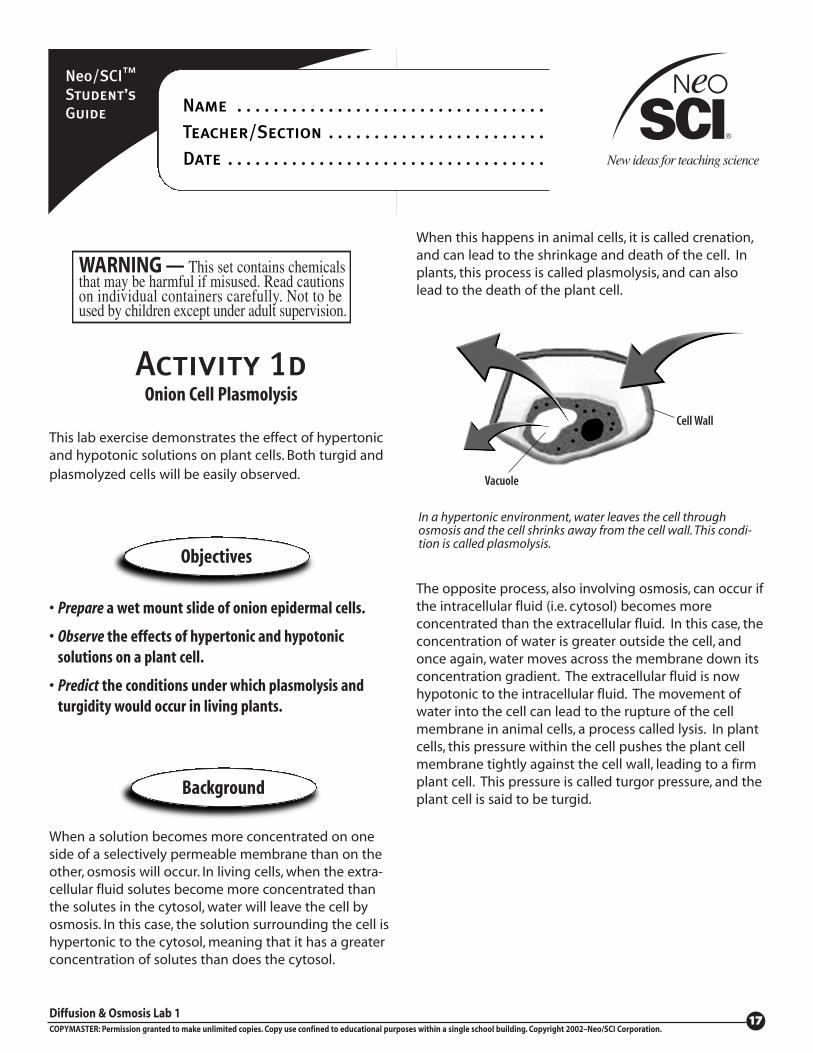
When this happens in animal cells, it is called crenation,and can lead to the shrinkage and death of the cell. Inplants, this process is called plasmolysis, and can alsolead to the death of the plant cell.
The opposite process, also involving osmosis, can occur ifthe intracellular fluid (i.e. cytosol) becomes moreconcentrated than the extracellular fluid. In this case, theconcentration of water is greater outside the cell, andonce again, water moves across the membrane down itsconcentration gradient. The extracellular fluid is nowhypotonic to the intracellular fluid. The movement ofwater into the cell can lead to the rupture of the cellmembrane in animal cells, a process called lysis. In plantcells, this pressure within the cell pushes the plant cellmembrane tightly against the cell wall, leading to a firmplant cell. This pressure is called turgor pressure, and theplant cell is said to be turgid.
Background
Objectives
Activity 1dOnion Cell Plasmolysis
Cell Wall
In a hypertonic environment, water leaves the cell throughosmosis and the cell shrinks away from the cell wall. This condi-tion is called plasmolysis.
Vacuole
Diffusion & Osmosis Lab 1COPYMASTER: Permission granted to make unlimited copies. Copy use confined to educational purposes within a single school building. Copyright 2002–Neo/SCI Corporation.
1188
Neo/SCI™
Student’s
GuideName . . . . . . . . . . . . . . . . . . . . . . . . . . . . . . . . . .
Teacher/Section . . . . . . . . . . . . . . . . . . . . . . . .
Date . . . . . . . . . . . . . . . . . . . . . . . . . . . . . . . . . . .
Per studentApronGlovesGoggles
Per group1 Microscope slide1 Coverslip1 Forceps1 Pipet
Onion leaves15% NaCl solution in beakerDistilled water in beakerPaper toweling
Shared materialsCompound light microscope
Be sure to always wear safety goggles, gloves and a labapron to protect your eyes and clothing when workingwith any chemicals.
Dispose of any waste materials and clean up your workarea as directed by your teacher.
Be sure to always wash your hands before leaving thelaboratory.
Step 1
Using the forceps, remove a small piece of onionepidermis (“onion skin”) from an onion leaf. Make a wetmount slide of the epidermis and view at 100X magnifi-cation. Sketch a few of the onion epidermis cells in theanalysis section.
Step 2
Without removing the slide from the microscope stage,place 2-4 drops of the NaCl solution at the left edge ofthe coverslip.
Step 3
While viewing the onion epidermis through the micro-scope, hold a piece of paper toweling at the right edgeof the coverslip, touching the fluid on the slide. This will“wick” the fluid from the left side of the slide to the right.Note any changes that occur in the cells during thisprocess.
Step 4
Now repeat Steps 2-3 using distilled water instead ofNaCl solution. Note any changes that occur in the cellsduring this process.
What You Need
Safety
What to do. . .
Diffusion & Osmosis Lab 1COPYMASTER: Permission granted to make unlimited copies. Copy use confined to educational purposes within a single school building. Copyright 2002–Neo/SCI Corporation.
1199
Neo/SCI™
Student’s
GuideName . . . . . . . . . . . . . . . . . . . . . . . . . . . . . . . . . .
Teacher/Section . . . . . . . . . . . . . . . . . . . . . . . .
Date . . . . . . . . . . . . . . . . . . . . . . . . . . . . . . . . . . .
1. Sketch of onion epidermal cells, prior to addition of NaCl solution (100X):
2. Sketch of onion epidermal cells after adding NaCl solution (100X):
Analysis3. Sketch of onion epidermal cells after flooding with
distilled water (100X):
4. Describe the changes that took place in the onion epidermal cells after the NaCl solution surrounded them.
............................................................................................................
............................................................................................................
............................................................................................................
5. Describe the changes that took place in the onion epidermal cells after they were flooded with distilled water.............................................................................................................
............................................................................................................
............................................................................................................
Diffusion & Osmosis Lab 1COPYMASTER: Permission granted to make unlimited copies. Copy use confined to educational purposes within a single school building. Copyright 2002–Neo/SCI Corporation.
2200
Neo/SCI™
Student’s
GuideName . . . . . . . . . . . . . . . . . . . . . . . . . . . . . . . . . .
Teacher/Section . . . . . . . . . . . . . . . . . . . . . . . .
Date . . . . . . . . . . . . . . . . . . . . . . . . . . . . . . . . . . .
1. Circle the hypertonic solution in each of the pairs of solutions below:
Onion epidermal cells 15% NaCl solution
Onion epidermal cells Distilled water
2. Why does a plant lose a “wilted” appearance after it has been watered well?
............................................................................................................
............................................................................................................
............................................................................................................
3. Why would spraying a brine solution or applying roadsalt to a slick road kill early spring plants growing near the roadside?
............................................................................................................
............................................................................................................
............................................................................................................
4. Animal cells can lyse if placed in a hypotonic solution.Why don’t plant cells lyse when placed in a hypotonicsolution?
............................................................................................................
............................................................................................................
............................................................................................................
Benjamin, Clinton; Garman, Gregory; and Funston, James.Human Biology. McGraw-Hill. 1997.
Allan J. Tobin and Richard E. Morel. Asking About Cells.HBJ School Div. 1997
Andres Llamas Ruiz and Luis Rizo. The Life of a Cell (Cyclesof Life). Sterling Publications. 1997
Information of biology related topics in easy tounderstand format for studentshttp://www.chem4kids.com/biology4kids/cell/lys.
htmlhttp://www.chem4kids.com/biology4kids/chem/prot.
htmlhttp://esgwww.mit.edu:8001/esgbio/cb/mem
branes/transport.html
Provides a thorough overview of cell structure and functionhttp://www.kapili.com/biology4kids/cell/index.html
Provides background information and suggestedactivities to learn more about cells http://raven.umnh.utah.edu/secondlevel/teen/teen.
html
Provides a wide selection on various types of cells andrelated informationhttp://www.cellsalive.com/
Questions Learn and Read More About It
Neat Websites