Embed Size (px)
Citation preview

Student Financial Aid 2011-12
Institution: University of North Carolina at Chapel Hill
OverviewIPEDS Student Financial Aid Component Overview
Public Academic Reporters Welcome to the Student Financial Aid (SFA) component of the U.S. Department of Education’s IntegratedPostsecondary Education Data System (IPEDS). The purpose of the SFA component is to collect information aboutfinancial aid provided to various groups of undergraduate students at your institution.
Changes to This Year’s SFA Component• SFA is now part of the Winter collection. The Winter collection will close for keyholders on
February 8, 2012.• In Part E, an additional column will collect the number of students in Group 4 who were
awarded any Title IV grant aid, by income categories.• For reporting grant or scholarship aid, institutions should report “aid awarded” rather than “aid
received” or “aid awarded and accepted.” The amount awarded may be different from theamount that was actually disbursed to students. There is no change to how loans to studentsshould be reported. Institutions should continue to report on loans that were awarded to andaccepted by the student.
• Veterans education benefits should no longer be reported in SFA, as they are no longerconsidered Estimated Financial Assistance for Federal Student Aid purposes.
Data Reporting Reminders
GroupsThroughout this component, you will be asked to report information for different groups of students.
• Group 1: All undergraduate students• Group 2: Of Group 1, full-time, first-time degree/certificate-seeking students• Group 3: Of Group 2, students who paid the in-state/in-district tuition rate and were awarded
any grant/scholarship aid from the federal government, state/local government, or theinstitution
• Group 4: Of Group 2, students who paid the in-state/in-district tuition rate and were awardedany Title IV federal student aid
Consult the instructions and screens to make sure you are reporting the correct aid amounts for the correct groups ofstudents.
College Affordability and Transparency ListsNet price amounts calculated in SFA will be used to populate the Department’s College Affordability and Transparencylists.
Interactive Edits and Error MessagesSFA contains interactive edits that will check for blank fields, invalid values, or values that fall outside expectedranges. Some error messages will require you to confirm or explain the values that you entered. Some error messagesare fatal and will require you to contact the IPEDS Help Desk at 1-877-225-2568 for resolution.
Context Boxes

You will find optional text boxes throughout SFA. Context boxes allow you to provide more information about the datayou enter. Some of these context boxes may be made available to the public on College Navigator, so make sure thatthe information you enter can be understood easily by students, parents, and the general public.
Resources
To download the survey materials for this component: Survey Materials
To access your prior year data submission for this component: Reported Data
If you have questions about completing this component, please contact the IPEDS Help Desk at 1-877-225-2568.

Institution: University of North Carolina at Chapel Hill
Part APart A - Establish Your GroupsPart A establishes the number of students in various groups. Note that the numbers on this screen will be carriedforward to other parts of the Student Financial Aid component.
In the fields below, report the number of students in each of the following groups. Fall 2010 YOUR
PRIORYEARDATA
Fall 2009
01. Group 1All undergraduate students
17,981
02. Group 2Of those in Group 1, those who are full-time, first-time degree/certificate-seeking
3,958
02a. Of those in Group 2, those who were awarded any Federal WorkStudy, loans to students, or grant or scholarship aid from the federalgovernment, state/local government, the institution, or other sourcesknown to the institution
2,758
02b. Of those in Group 2, those who were awarded any loans to studentsor grant or scholarship aid from the federal government, state/localgovernment, or the institution
2,266
03. Group 3Of those in Group 2, those who paid the in-state or in-district tuition rate andwere awarded grant or scholarship aid from the federal government,state/local government, or the institution
1,563
04. Group 4Of those in Group 2, those who paid the in-state or in-district tuition rate andwere awarded any Title IV federal student aid
1,194
18,579
3,946
2,767
2,362
1,597
1,358

Imagedescription.Thesecontext notesmay beposted onthe CollegeNavigatorwebsite. Endof imagedescription.
Institution: University of North Carolina at Chapel Hill
Part BPart B - Enter Information About Group 1Part B includes information about Group 1. Group 1 students are all undergraduate students enrolled in Fall 2010.For this part, report:
For These Students The Following Type(s) of Aid Awarded in This Period• All undergraduate
students enrolledin Fall 2010
• Grant or scholarship aid fromthe federal government
• Grant or scholarship aid fromstate/local government
• Grant or scholarship from theinstitution
• Grant or scholarship aid fromother sources known to theinstitution
• Loans to students from thefederal government
• Anytime during academic year2010-11
In the fields below, report the number of Group 1 students and the total amount of aid awarded to thesestudents for each type of aid. Information from Part A: Fall 2010Group 1All undergraduate students(This number is carried forward from Part A, Line 01.)
18,579
Aid Type 2010-11
Number of Group 1students who were
awarded aid
Percentage ofGroup 1
students whowere awarded
aid
Total amount of aidawarded to Group 1
students
Averageamount of
aid awardedto Group 1students
01. Grant or scholarship aidfrom the federalgovernment, state/localgovernment, theinstitution, and othersources known to theinstitution
56
11,073
02. Pell grants
20
4,479
03. Federal student loans
29
6,079
You may use the space below to provide context for data you've reported above. These context notes maybe posted on the College Navigator website and should be written to be understood by students and parents.
10,483 116,083,017
3,776 16,912,450
5,325 32,372,490

Institution: University of North Carolina at Chapel Hill
Part C, Page 1Part C, Page 1 - Enter Information about Group 2Part C includes information about Group 2. Group 2 students are all full-time, first-time degree/certificate-seekingundergraduate students enrolled in Fall 2010. In the fields below, report the number of Group 2 students paying in-district, in-state, and out-of-state tuitionrates. Information from Part A: Fall 2010Group 2Full-time, first-time degree/certificate-seekingundergraduates(This number is carried forward from Part A, Line02)
3,946
Group 2 students: YOUR PRIORYEAR DATA
Fall 2010 Fall 2009Number of Group 2
studentsPercentage of
Group 2 studentsPercentage of
Group 2 students01. 01a. paying in-district tuition rates
0 0
01b. paying in-state tuition rates
82 82
01c. paying out-of-state tuition rates
18 18
01d. Unknown (calculated value)This value is calculated using the followingformula: [A02-(C01a+C01b+C01c)]
0 0 0
0
3,222
724

Institution: University of North Carolina at Chapel Hill
Part C, Page 2Part C, Page 2 - Enter Information about Group 2Part C includes financial aid information about Group 2. Group 2 students are all full-time, first-time degree/certificate-seeking undergraduate students enrolled in Fall 2010.For this part, report:
For These Students The Following Type(s) of Aid Awarded in ThisPeriod
• Full-time, first-time, degree/certificate-seeking undergraduate students enrolled inFall 2010
• Grant or scholarship aidfrom the federalgovernment
• Grant or scholarship aidfrom state/localgovernment
• Grant or scholarship fromthe institution
• Loans to student fromthe federal governmentand from other sources,including private or otherloans
• Do not include grant orscholarship aid fromprivate or other sources
• Do not include PLUSloans or loans made toanyone other than thestudent
• Any timeduringacademicyear 2010-11
In the fields below, report the number of Group 2 students and the total amount of aid awarded to thesestudents for each type of aid. Enter unduplicated student counts within a category (e.g., Pell grants). However, astudent can appear in more than one aid category. Information from Part A: Fall 2010Group 2Full-time, first-time degree/certificate-seeking undergraduates(This number is carried forward from Part A, Line 02)
3,946
Group 2aOf those in Group 2, those who were awarded any Federal Work Study, loans tostudents, or grant or scholarship aid from the federal government, state/localgovernment, the institution, or other sources known to the institution(This number is carried forward from Part A, Line 02a)
2,767
Group 2bOf those in Group 2, those who were awarded any loans to students or grant orscholarship aid from the federal government, state/local government, or theinstitution(This number is carried forward from Part A, Line 02b)
2,362
Group 3Of those in Group 2, those who were awarded grant or scholarship aid from thefederal government, state/local government, or the institution
1,597
Aid Type
Imagedescription.Thesecontext notesmay beposted onthe CollegeNavigator.End of imagedescription.
YOURPRIORYEARDATA
Fall 2010 Fall2009
Number of Group 2students who were
awarded aid
Percentageof Group 2studentswho wereawarded
aid
Total amount of aidawarded to Group 2
students
Averageamountof aid
awardedto Group
2students
Averageamountof aid
awardedto Group
2students
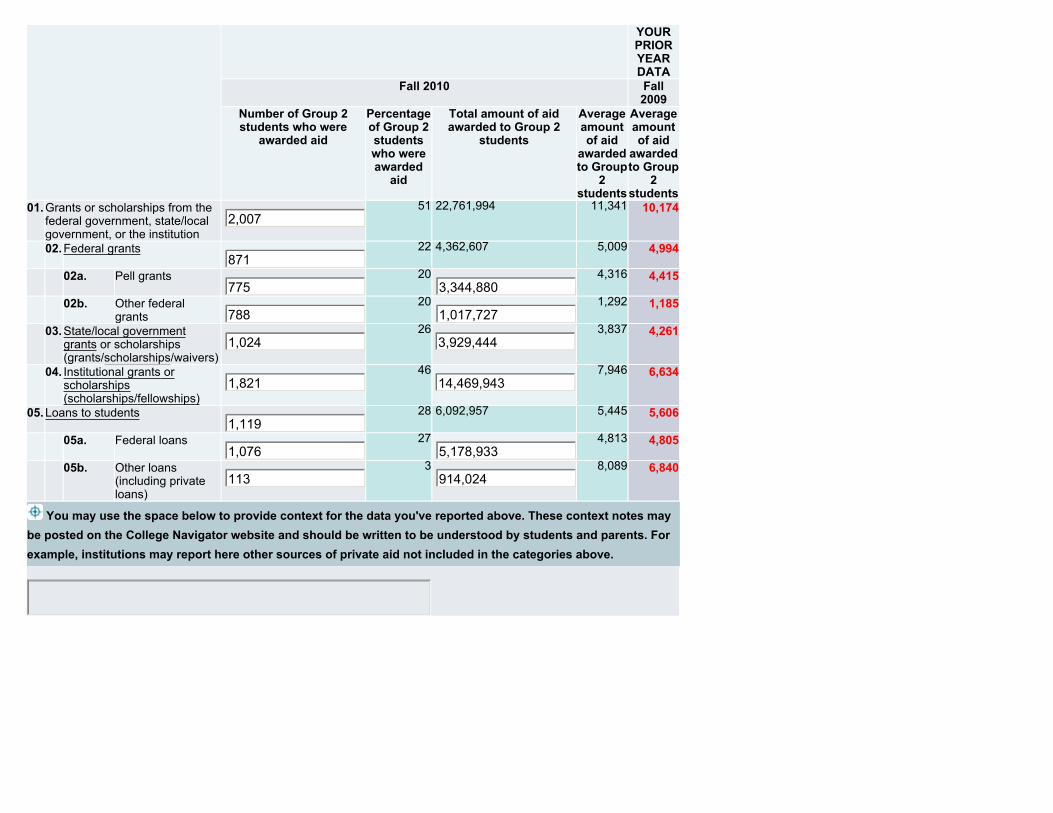
01. Grants or scholarships from thefederal government, state/localgovernment, or the institution
51 22,761,994 11,341 10,174
02. Federal grants
22 4,362,607 5,009 4,994
02a. Pell grants
20
4,316 4,415
02b. Other federalgrants
20
1,292 1,185
03. State/local governmentgrants or scholarships(grants/scholarships/waivers)
26
3,837 4,261
04. Institutional grants orscholarships(scholarships/fellowships)
46
7,946 6,634
05. Loans to students
28 6,092,957 5,445 5,606
05a. Federal loans
27
4,813 4,805
05b. Other loans(including privateloans)
3
8,089 6,840
You may use the space below to provide context for the data you've reported above. These context notes maybe posted on the College Navigator website and should be written to be understood by students and parents. Forexample, institutions may report here other sources of private aid not included in the categories above.
2,007
871
775 3,344,880
788 1,017,727
1,024 3,929,444
1,821 14,469,943
1,119
1,076 5,178,933
113 914,024

Institution: University of North Carolina at Chapel Hill
Part DPart D - Enter Information about Group 3Part D includes financial aid information about Group 3. Group 3 students are all full-time, first-time degree/certificate-seekingundergraduate students enrolled in Fall 2010 who paid the in-state or in-district tuition rate and were awarded grant or scholarship aid fromthe following sources: the federal government, state/local government, or the institution. The information you report in this part will be usedin Part F to calculate average institutional net price.For this part report:
For These Students The Following Type(s) of Aid Awarded in This Period•Full-time, first-time,degree/certificate-seekingundergraduate studentsenrolled in Fall 2010 whopaid the in-state or in-district tuition rate andwere awarded grant orscholarship aid from thefollowing sources: thefederal government,state/local government,or the institution•Do not include studentswho were awarded onlygrant or scholarship aidfrom private or othersources, or students whowere awarded only non-grant aid
• Grant or scholarship aid from thefederal government
• Grant or scholarship aid fromstate/local government
• Grant or scholarship from theinstitution
• Do not include grant or scholarship aidfrom private or other sources
• Any time during academic year 2010-11
In the fields below, report the number of Group 3 students with each type of living arrangement and the total amount of grant orscholarship aid from the federal government, state/local government, or the institution awarded to these students. Information from Part A: 2010-2011 YOUR PRIOR
YEAR DATAYOUR PRIORYEAR DATA
2009-2010 2008-2009Group 3Full-time, first-time degree/certificate-seekingundergraduate students who paid the in-state or in-districttuition rate and were awarded grant or scholarship aidfrom the following sources: the federal government,state/local government, or the institution(This number is carried forward from Part A, Line 03)
1,597
01. Report the number of Group 3 studentswith the following living arrangements:
2010-11 YOUR PRIORYEAR DATA
YOUR PRIORYEAR DATA
2009-10 2008-09 01a. On-campus
01b. Off-campus (with family)
01c. Off-campus (not with
family) 01d. Unknown (calculated) 148 145 151
1,563 1,321
1,423 1,383 1,136
12 11 0
14 24 34

This value is calculatedusing the followingformula: [A03-(D01a+D01b+D01c)]
02. Report the total amount of grant orscholarship aid from the federalgovernment, state/local government, orthe institution awarded to Group 3students
03. Average grant or scholarship aid from thefederal government, state/local government,or the institution awarded to Group 3students (calculated value).This value is calculated using the followingformula: [D02/A03]
9,200 8,760 7,781
You may use the space below to provide context for the data you've reported above.
14,692,630 13,691,772 10,278,761

Institution: University of North Carolina at Chapel Hill
Part EPart E – Enter Information about Group 4Part E includes financial aid information about Group 4. Group 4 students are all full-time, first-time degree/certificate-seeking undergraduate studentsenrolled in Fall 2010 who paid the in-state or in-district tuition rate and were awarded any Title IV federal student aid, including federal grants or federalstudent loans. The information you report in this part will be used in Part G to calculate average institutional net price by income level.For this part, report:
For These Students The Following Type(s) of Aid Awarded in This Period•Full-time, first-time,degree/certificate-seekingundergraduate studentsenrolled in Fall 2010 whopaid the in-state or in-district tuition rate andwere awarded any TitleIV federal student aid
• Grant or scholarship aid from the federal government• Grant or scholarship aid from state/local government• Grant or scholarship from the institution• Do not include grant or scholarship aid from private or
other sources• Do not include loans amounts• Do not include Federal Work Study amounts
• Any time during academic year 2010-11
In the fields below, report the number of Group 4 students with each type of living arrangement and the total amount of grant or scholarship aidfrom the federal government, state/local government, or the institution awarded to these students by income level. Information from Part A: 2010-11 2009-10 2008-09Group 4Full-time, first-time degree/certificate-seeking undergraduate students whopaid the in-state or in-district tuition rate and were awarded any Title IVfederal student aid(This number is carried forward from Part A, Line 04)
1,358
01. Report the number of Group 4 students with the followingliving arrangements:
2010-11 YOUR PRIORYEAR DATA
YOUR PRIORYEAR DATA
2009-10 2008-09 01a. On-campus
01b. Off-campus (with family)
01c. Off-campus (not with family)
01d. Unknown (calculated)
This value is calculated using the formula:[A04-(E01a+E01b+E01c)]
17 0 0
2010-11 Number of Group 4
students who wereawarded any Title IV aid
Number of Group 4students who were
awarded any Title IVgrant aid
Total amount of grant orscholarship aid awardedto Group 4 students from
the following sources:the federal government,state/local government,
or the institution
Average amount of grantor scholarship aid
awarded to Group 4students from the
following sources: thefederal government,
state/local government,or the institution
Col. 1 Col. 2 Col. 3 Col. 402. Income level 02a. $0-30,000
16,107
02b. $30,001-48,000
13,662
1,194 974
1,314 1,170 949
14 9 1
13 15 24
290 286 4,670,989
229 219 3,128,651

02c. $48,001-75,000
9,753
02d. $75,001-110,000
4,086
02e. $110,001 andmore
1,126
02f. Total all incomelevels
1,358 665 11,747,369 8,650
2009-10 Col. 1 Col. 2 Col. 3 Col. 4
03. Income level 03a. $0-30,000
14,514
03b. $30,001-48,000
11,765
03c. $48,001-75,000
8,338
03d. $75,001-110,000
2,610
03e. $110,001 andmore
400
03f. Total all incomelevels
1,194 618 9,824,467 8,228
2008-09 Col. 1 Col. 2 Col. 3 Col. 4
04. Income level 04a. $0-30,000
13,828
04b. $30,001-48,000
11,118
04c. $48,001-75,000
7,259
04d. $75,001-110,000
2,479
04e. $110,001 andmore
264
04f. Total all incomelevels
974 423 6,779,253 6,960
You may use the space below to provide context for the data you've reported above.
262 140 2,555,255
251 16 1,025,512
326 4 366,962
318 315 4,615,485
223 202 2,623,573
236 97 1,967,881
204 4 532,346
213 0 85,182
206 203 2,848,552
186 163 2,067,961
187 57 1,357,426
181 0 448,734
214 0 56,580

Imagedescription.Thesecontext notesmay beposted onthe CollegeNavigator.End of imagedescription.
Institution: University of North Carolina at Chapel Hill
Part FPart F – Net Price Calculation for Group 3The following net price calculation is based on information that your institution reported in the Institutional Characteristicscomponent and the Student Financial Aid component. For more information about the data your institution reported inthe Institutional Characteristics component, please contact your institution’s IPEDS Keyholder.
2010-11 YOUR PRIORYEAR DATA
YOUR PRIORYEAR DATA
2009-10 2008-09Components of cost of attendance
01. Published tuition and required fees (lower of in-district orin-state)
6,665 5,625 5,397
02. Books and supplies 1,028 1,000 1,00003. Room and board and other expenses by living
arrangement
03a. On campus 12,612 11,226 9,796 03b. Off-campus (with family) 3,306 2,128 1,856 03c. Off-campus (not with
family) 12,612 10,798 10,182
04. Number of Group 3 students by living arrangement 04a. On campus 1,423 1,383 1,136 04b. Off-campus (with family) 12 11 0 04c. Off-campus (not with
family) 14 24 34
04d. Unknown 148 145 15105. Weighted average for room and board and other
expenses by living arrangement (excluding unknownvalues)See instructions for the formula for this calculation
12,535 11,148 9,807
06. Total cost of attendanceThis value is calculated using the following formula:[F01+F02+F05]
20,228 17,773 16,204
07. Average amount of grant or scholarship aid awardedto Group 3 students from the following sources: thefederal government, state/local government, and theinstitution
9,200 8,760 7,781
08. Average institutional net price for Group 3 studentsThis value is calculated using the following formula: [F06-F07]
11,028 9,013 8,423
As required by the Higher Education Opportunity Act of 2008, these amounts will be posted on the U.S. Department ofEducation’s College Navigator website and used in the U.S. Department of Education’s College Affordability andTransparency Lists.
Do you wish to provide additional context notes?Yes
No
You may use the space below to provide context for these data. These context notes may be posted on theCollege Navigator website and should be written to be understood by students and parents.
Institution: University of North Carolina at Chapel Hill
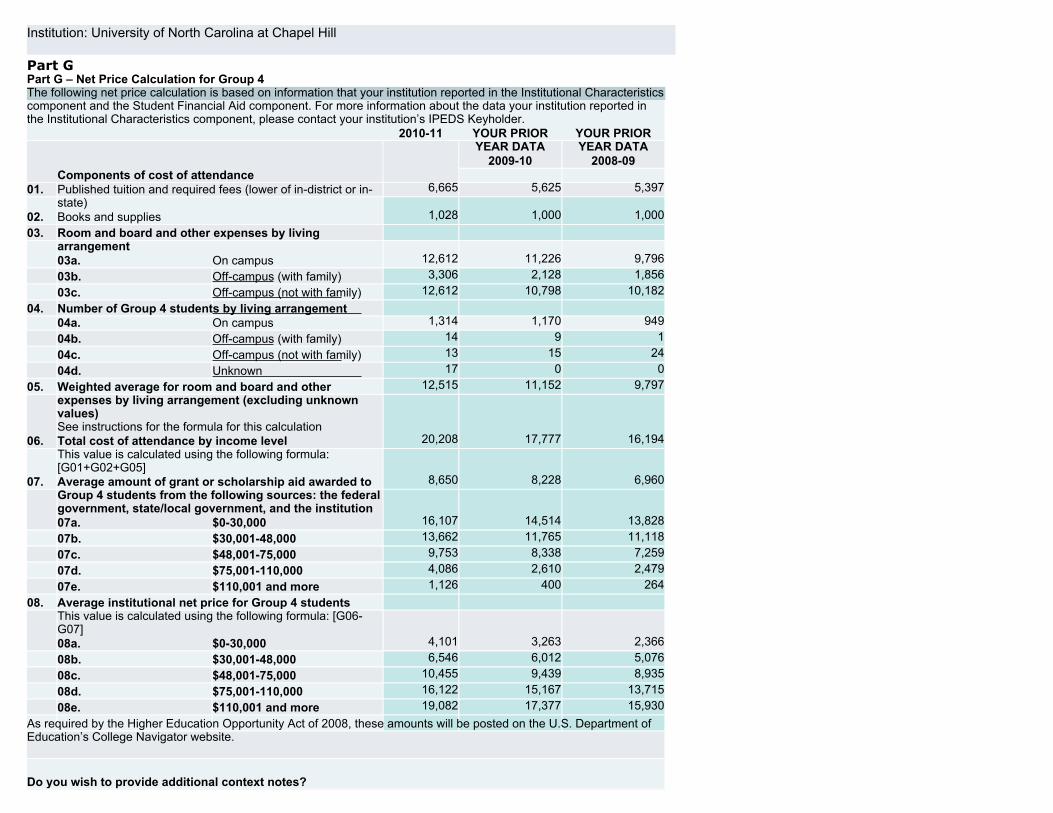
Part GPart G – Net Price Calculation for Group 4The following net price calculation is based on information that your institution reported in the Institutional Characteristicscomponent and the Student Financial Aid component. For more information about the data your institution reported inthe Institutional Characteristics component, please contact your institution’s IPEDS Keyholder.
2010-11 YOUR PRIORYEAR DATA
YOUR PRIORYEAR DATA
2009-10 2008-09Components of cost of attendance
01. Published tuition and required fees (lower of in-district or in-state)
6,665 5,625 5,397
02. Books and supplies 1,028 1,000 1,00003. Room and board and other expenses by living
arrangement
03a. On campus 12,612 11,226 9,796 03b. Off-campus (with family) 3,306 2,128 1,856 03c. Off-campus (not with family) 12,612 10,798 10,18204. Number of Group 4 students by living arrangement 04a. On campus 1,314 1,170 949 04b. Off-campus (with family) 14 9 1 04c. Off-campus (not with family) 13 15 24 04d. Unknown 17 0 005. Weighted average for room and board and other
expenses by living arrangement (excluding unknownvalues)See instructions for the formula for this calculation
12,515 11,152 9,797
06. Total cost of attendance by income levelThis value is calculated using the following formula:[G01+G02+G05]
20,208 17,777 16,194
07. Average amount of grant or scholarship aid awarded toGroup 4 students from the following sources: the federalgovernment, state/local government, and the institution
8,650 8,228 6,960
07a. $0-30,000 16,107 14,514 13,828 07b. $30,001-48,000 13,662 11,765 11,118 07c. $48,001-75,000 9,753 8,338 7,259 07d. $75,001-110,000 4,086 2,610 2,479 07e. $110,001 and more 1,126 400 26408. Average institutional net price for Group 4 students
This value is calculated using the following formula: [G06-G07]
08a. $0-30,000 4,101 3,263 2,366 08b. $30,001-48,000 6,546 6,012 5,076 08c. $48,001-75,000 10,455 9,439 8,935 08d. $75,001-110,000 16,122 15,167 13,715 08e. $110,001 and more 19,082 17,377 15,930As required by the Higher Education Opportunity Act of 2008, these amounts will be posted on the U.S. Department ofEducation’s College Navigator website.
Do you wish to provide additional context notes?
Imagedescription.Thesecontext notesmay beposted onthe CollegeNavigator.End of imagedescription.
Yes
No
You may use the space below to provide context for these data. These context notes may be posted on theCollege Navigator website and should be written to be understood by students and parents.

Institution: University of North Carolina at Chapel HillSummary
IPEDS Student Financial Aid (SFA) Survey Summary
IPEDS collects important information regarding your institution. All data reported in IPEDSsurvey components become available in the IPEDS Data Center and appear as aggregated datain various Department of Education reports. Additionally, some of the reported data appearsspecifically for your institution through the College Navigator website and is included in yourinstitution’s Data Feedback Report (DFR). The purpose of this summary is to provide you anopportunity to view some of the data that, when accepted through the IPEDS quality controlprocess, will appear on the College Navigator website and/or your DFR. College Navigator isupdated approximately three months after the data collection period closes and Data FeedbackReports will be available through the ExPT and sent to your institution’s CEO in November 2012.
Please review your data for accuracy. If you have questions about the data displayed belowafter reviewing the data reported on the survey screens, please contact the IPEDS Help Desk at:1-877-225-2568 or [email protected].
Total grant aid received by all undergraduate students $116,083,017
Number of undergraduate students who received a Pell Grant 3,776
Percentage of FTFT students receiving any financial aid 70%
Percentage of FTFTstudents receiving grantaid by type
Average amount ofgrant aid received bytype
Total 51% $11,341
Federal Government 22% $5,009
Pell 20% $4,316
Other Federal 20% $1,292
State/Local Government 26% $3,837
Institutional 46% $7,946
Percentage of FTFTstudents receiving loansby type
Average amount ofloans received by type
Total 28% $5,445
Federal 27% $4,813
Non-federal 3% $8,089
Average net price for FTFT students who receive grant aid $11,028
Average net price for FTFT students who receive Title IV federal studentaid
$0 – 30,000 $4,101
$30,001 – 48,000 $6,546
$48,001 – 75,000 $10,455
$75,001 – 110,000 $16,122
$110,001 and more $19,082


Institution: University of North Carolina at Chapel HillEdit Report
Student Financial AidInstitution: University of North Carolina at Chapel Hill
Source Description Severity Resolved OptionsScreen: Part D - Enter Information about Group 3
UploadFile
You reported zero for this valuelast year. Please confirm thisvalue is correct for this year.(Error #7177)
Confirmation Yes Back tosurveydata