Embed Size (px)
Citation preview
May 18, 2016
WelcomeGaetano Paone, MD, MHSA
Henry Ford HospitalCardiac Surgery
Chair, STS Task Force on Quality Initiatives
STS Quality Webinar Series: Readmission after CABG
Presented by the STS Task Force on Quality Initiatives
Guy Paone, ChairIman AzizThomas BeaverBill Burfeind Jr.Bill CaineJoe ClevelandKathy CorneliusMichael CuligChris FeindelTony FurnaryKris George
Fred GroverBaron HammanChasity Harness Jeff JacobsCathy KnoffDonny LikoskyKevin LobdellJohn MayerJames McClurken Rich PragerSyma Prince
Jeffrey RichJuan SanchezDave ShahianFrank ShannonAlan SpeirJudy TingleyPaul UhligRobert WelshMichael WeyantJaelene WilliamsDave Wormuth
Presenters
David M. Shahian, MD
Frank L. Shannon, MD
Kevin W. Lobdell, MD
William T. Caine, MD

Readmissions
David M. Shahian, MD
Vice President, Center for Quality and Safety, Massachusetts General HospitalProfessor of Surgery, Harvard Medical School
Chair, STS Council on Quality, Research, and Patient Safety Operating BoardChair, STS Quality Measurement Task Force

• None
Disclosures

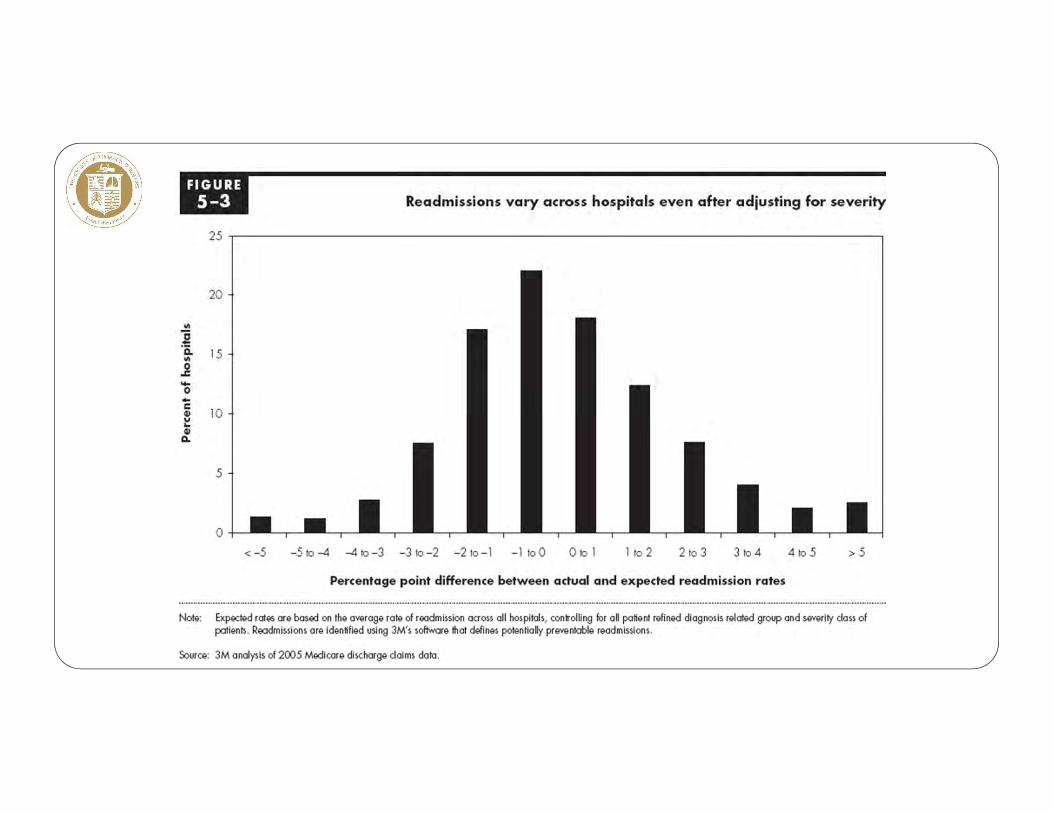
• “Hospital readmissions are sometimes indicators of poor care or missed opportunities to better coordinate care.”
• “..failure to adequately attend to the care transition at discharge from the hospital results in additional Medicare spending; 17.6 percent of admissions result in readmissions within 30 days of discharge, accounting for $15 billion in spending. Not all of these readmissions are avoidable, but some are.”
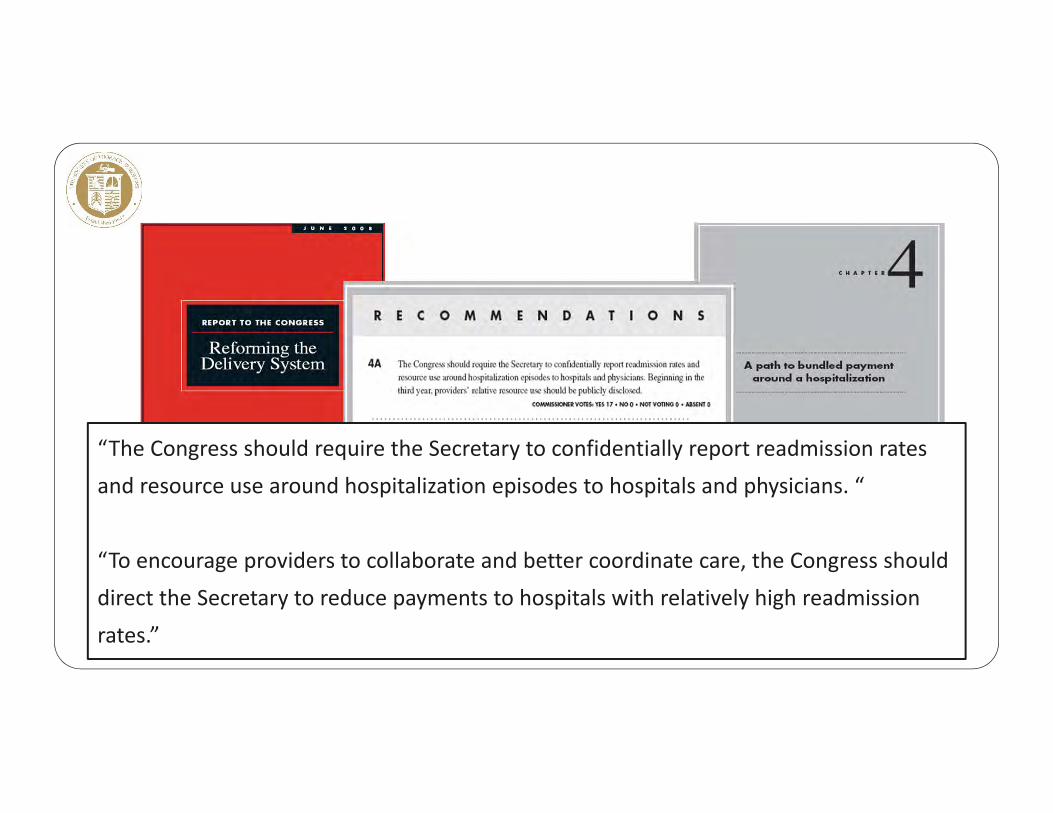
“The Congress should require the Secretary to confidentially report readmission rates and resource use around hospitalization episodes to hospitals and physicians. “
“To encourage providers to collaborate and better coordinate care, the Congress should direct the Secretary to reduce payments to hospitals with relatively high readmission rates.”

“Almost one fifth (19.6%) of the 11,855,702 Medicare beneficiaries who had been discharged from a hospital were rehospitalized within 30 days, and 34.0% were rehospitalized within 90 days…..In the case of 50.2% of the patients who were rehospitalized within 30 days after a medical discharge to the community, there was no bill for a visit to a physician’s office between the time of discharge and rehospitalization.” NEJM, 2009

Similar variation in CV readmissions
Krumholz et al, 2009
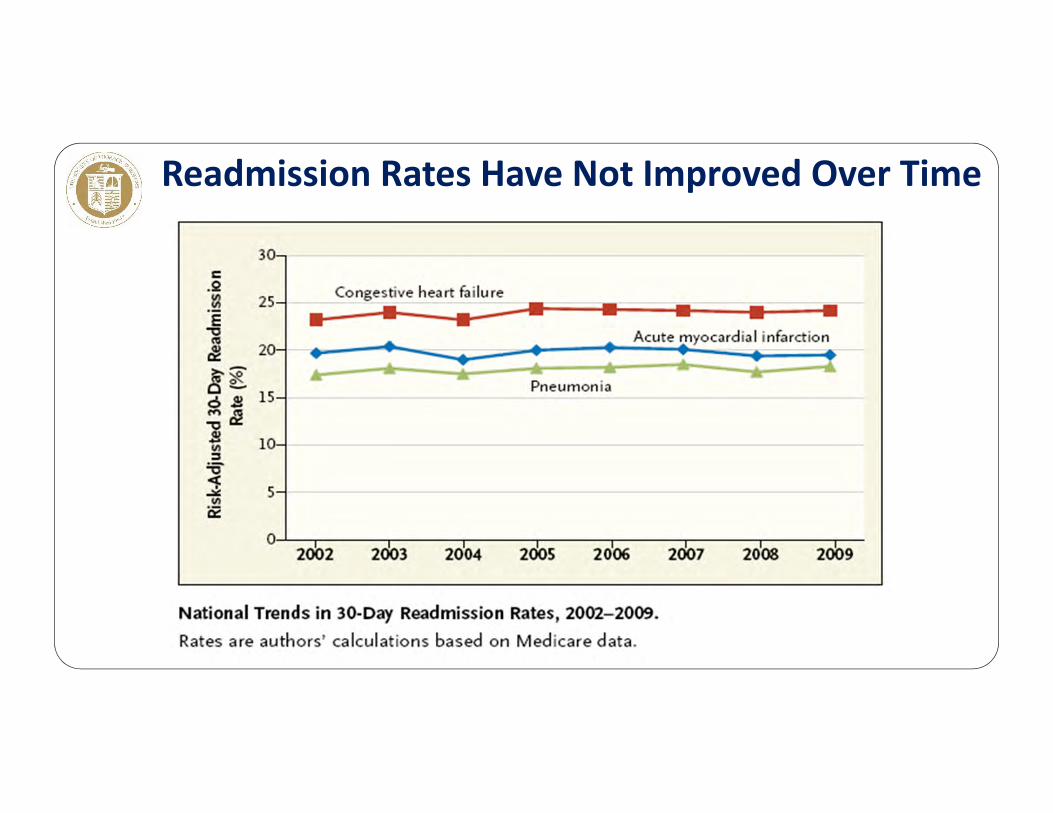
Readmission Rates Have Not Improved Over Time
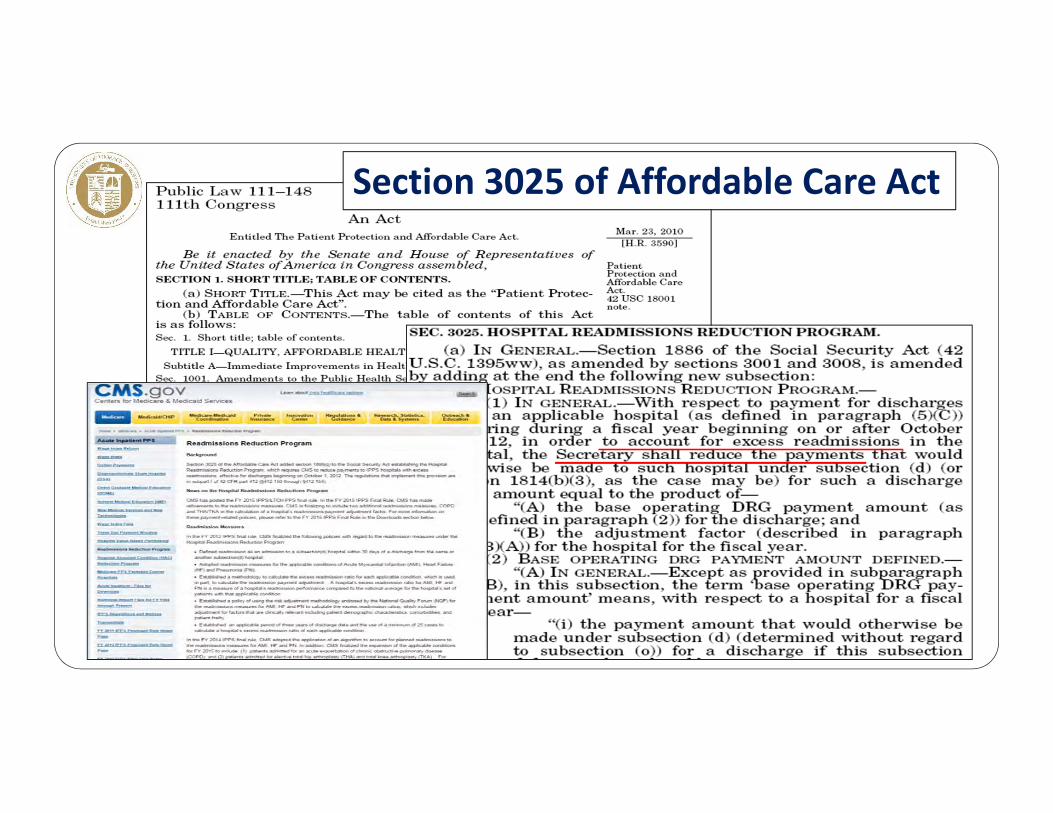
Section 3025 of Affordable Care Act
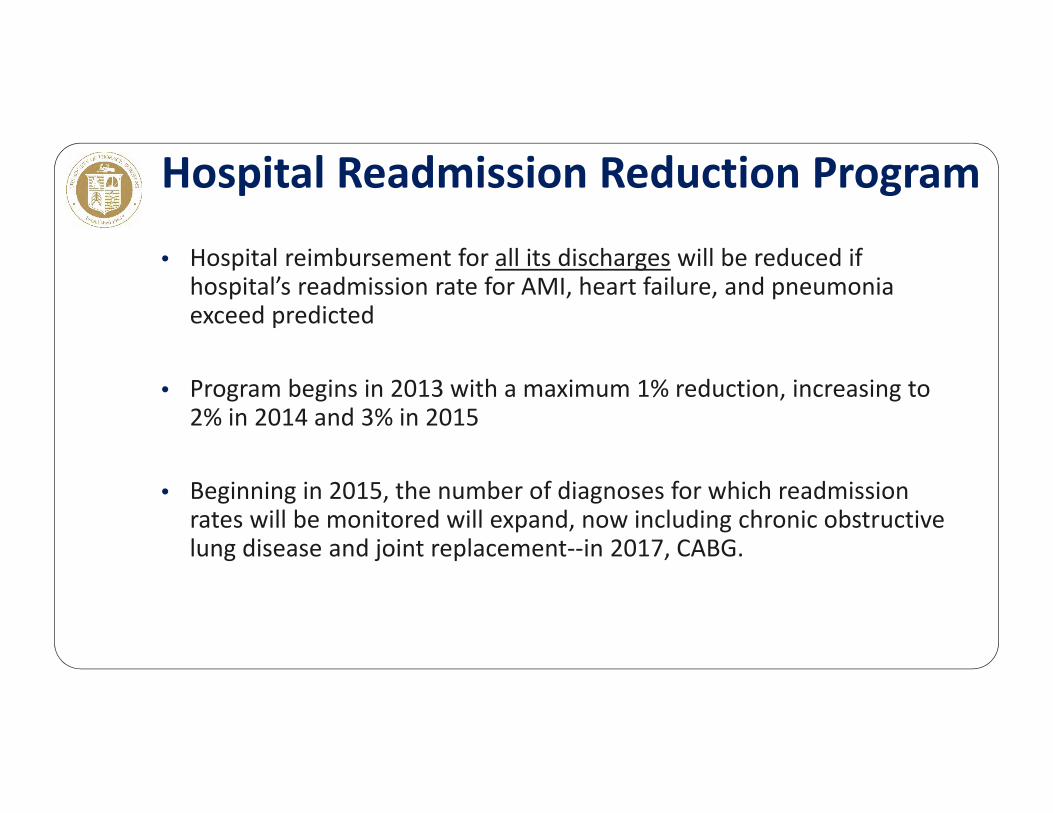
• Hospital reimbursement for all its discharges will be reduced if hospital’s readmission rate for AMI, heart failure, and pneumonia exceed predicted
• Program begins in 2013 with a maximum 1% reduction, increasing to 2% in 2014 and 3% in 2015
• Beginning in 2015, the number of diagnoses for which readmission rates will be monitored will expand, now including chronic obstructive lung disease and joint replacement‐‐in 2017, CABG.
Hospital Readmission Reduction Program
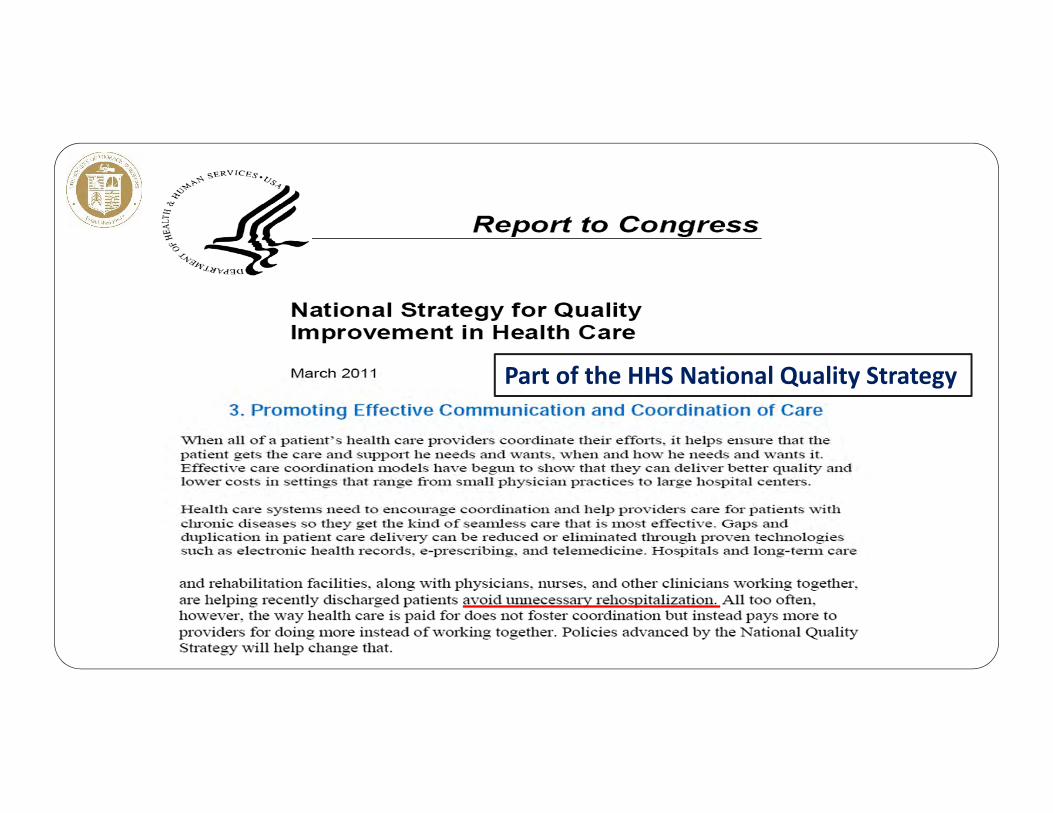
Part of the HHS National Quality Strategy
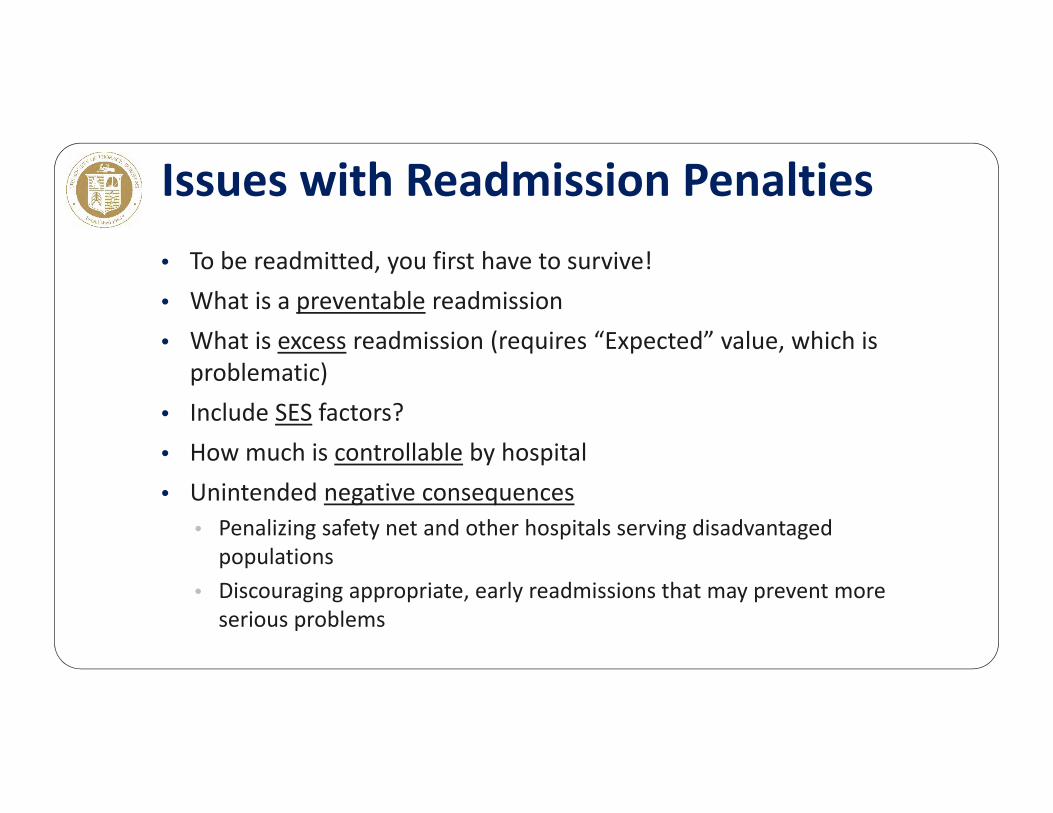
• To be readmitted, you first have to survive!• What is a preventable readmission• What is excess readmission (requires “Expected” value, which is
problematic) • Include SES factors?• How much is controllable by hospital• Unintended negative consequences
• Penalizing safety net and other hospitals serving disadvantaged populations
• Discouraging appropriate, early readmissions that may prevent more serious problems
Issues with Readmission Penalties

• Most credible determinations of readmission preventability come from chart reviews by expert clinicians
• Chart review typically reveals lower rates of preventability than those determined from automated algorithms (e.g., 3M)
• Clinician review not feasible to scale
• For profiling purposes, risk‐adjusted, automated, rate‐based approaches will be required
Preventable Readmissions

• Compared with mortality risk estimation, broader and more complex range of risk factors for readmission, some not under control of index hospital• Patient characteristics and illness severity on admission• Quality of care during the index admission (failure to adequately treat
and resolve the original condition, complications of care)• Discharge and transition planning (inadequate prep of patient/family,
poor communication with PCP’s)• Local environmental factors (inadequate community healthcare
resources to support patients post‐discharge)• SES factors (risk adjust or stratify)• Recurrence of the original chronic condition• Development of an unrelated new condition• Discretionary, local threshold to admit
Estimating Expected Readmission Rates
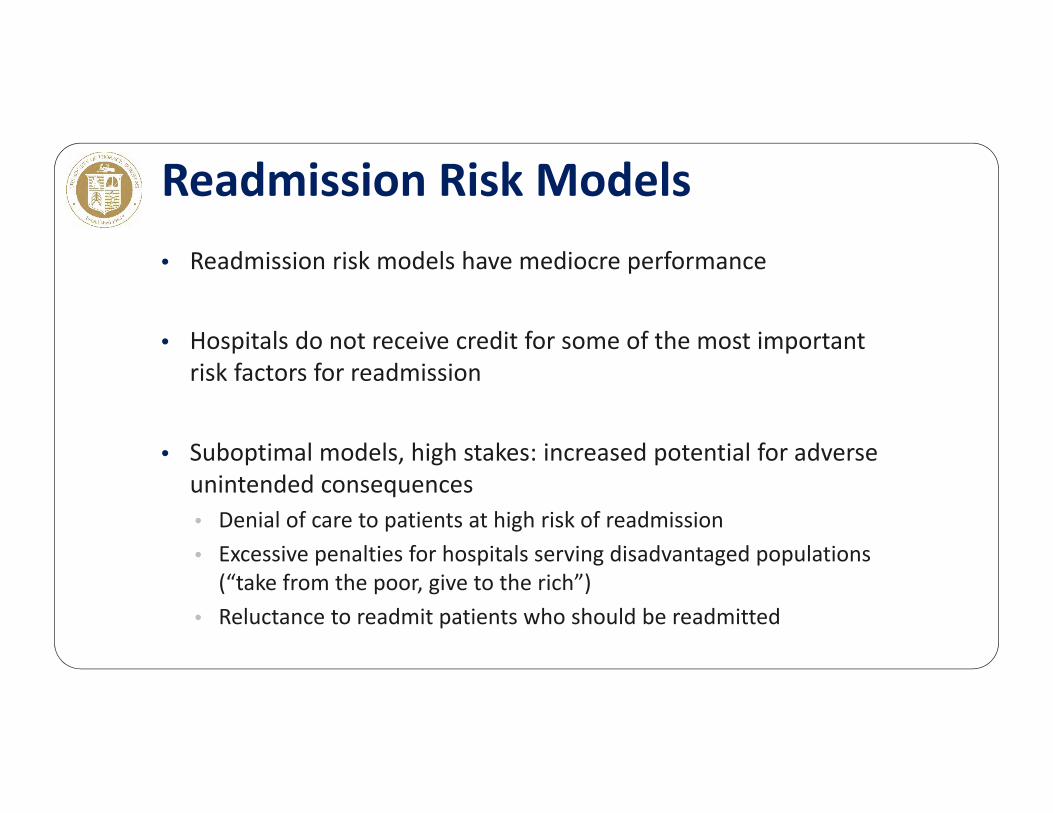
• Readmission risk models have mediocre performance
• Hospitals do not receive credit for some of the most important risk factors for readmission
• Suboptimal models, high stakes: increased potential for adverse unintended consequences• Denial of care to patients at high risk of readmission• Excessive penalties for hospitals serving disadvantaged populations (“take from the poor, give to the rich”)
• Reluctance to readmit patients who should be readmitted
Readmission Risk Models
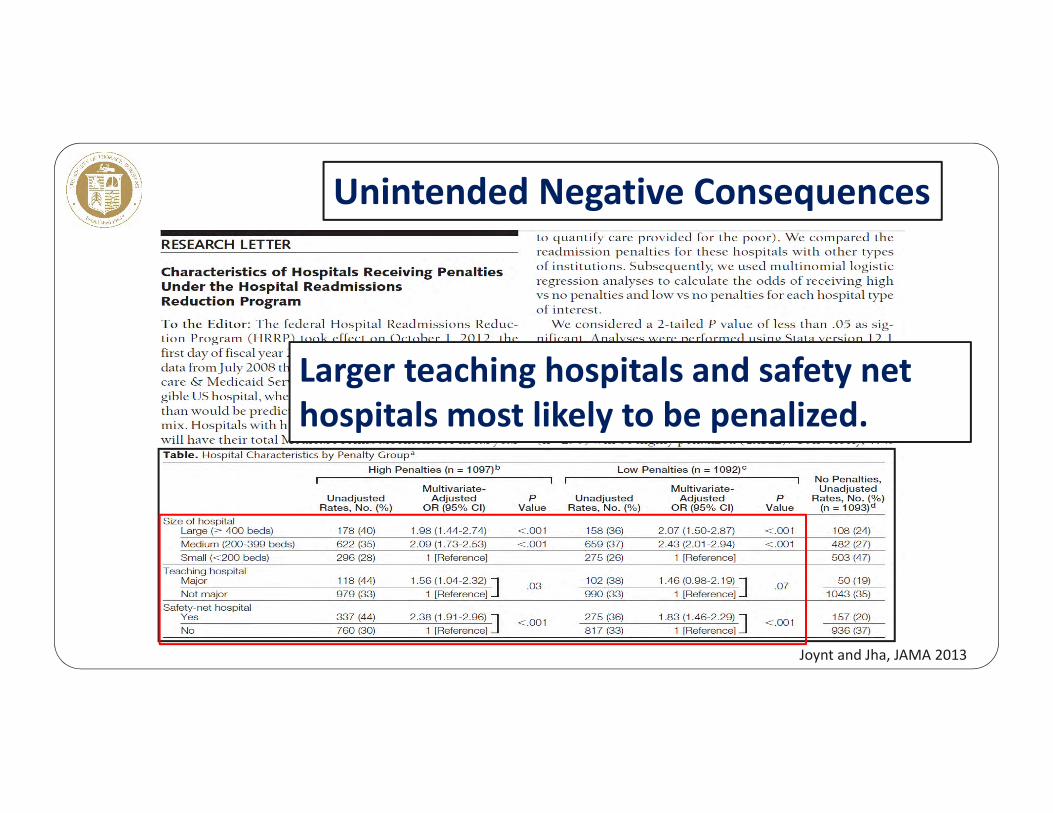
Larger teaching hospitals and safety net hospitals most likely to be penalized.
Unintended Negative Consequences
Joynt and Jha, JAMA 2013
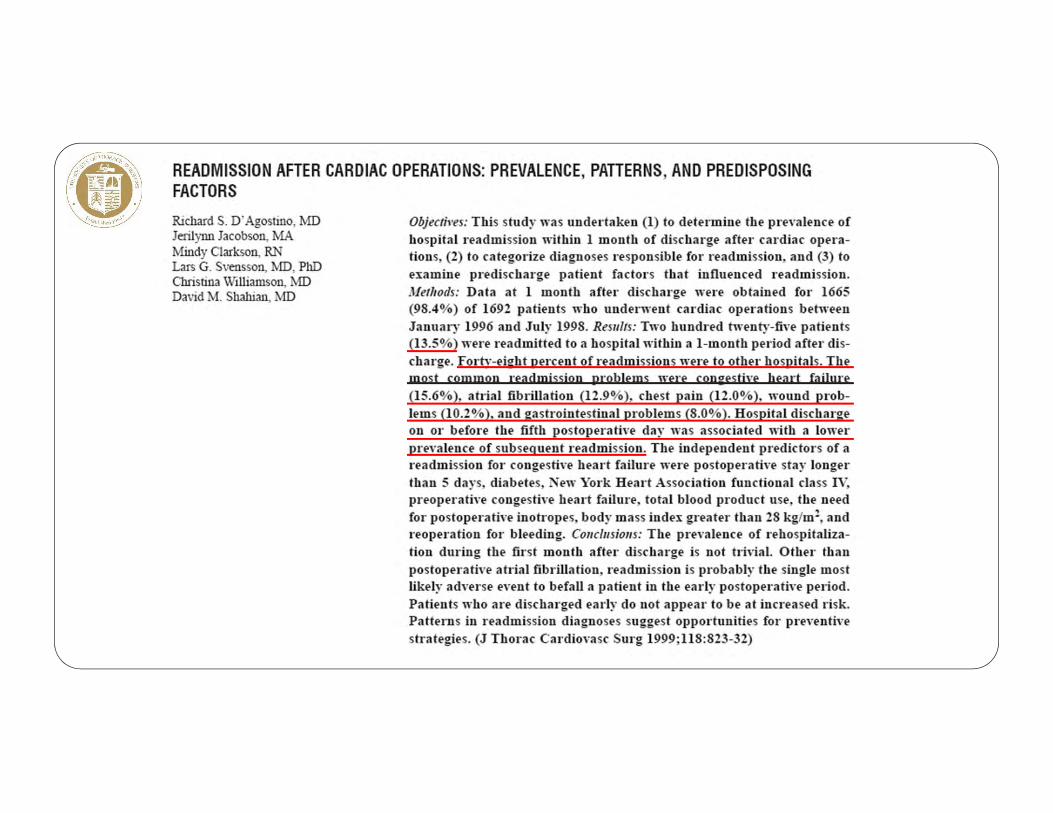
• CABG readmissions: a marker of care quality and an opportunity to improve care
• Most CABG readmissions unplanned‐‐result from delayed occurrence or recognition of complications
• Not a result of shorter LOS initiatives• High mortality in readmitted patients• Readmission and mortality rates are complementary performance measures
CABG Readmission
• Frequency and financial impact of CABG readmissions
• If count ED visits, doubles # of “returns” to hospital
• Ascertainment issues: 50% CABG readmissions to other than index hospital
• Lack of improvement in CABG readmission rates
• Significant inter‐hospital variation in rates
• CMS adding CABG as readmission target
CABG Readmission
• Feasible opportunities for improvement
• Proactively address common readmission causes before discharge• Educate patients, families, cardiologists, and PCPs• Always contact original surgeon before readmission• Outpatient visits by NPs, PAs; Smartphone pix, videos; earlier return visits
CABG Readmission
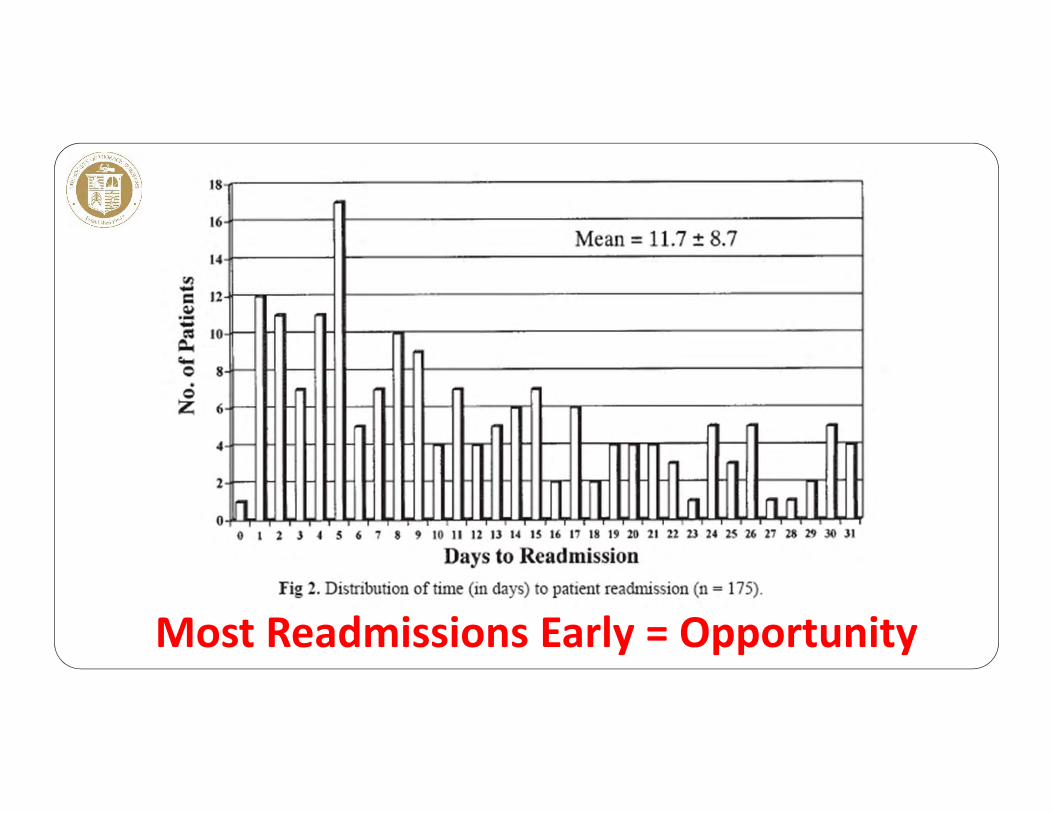
Most Readmissions Early = Opportunity

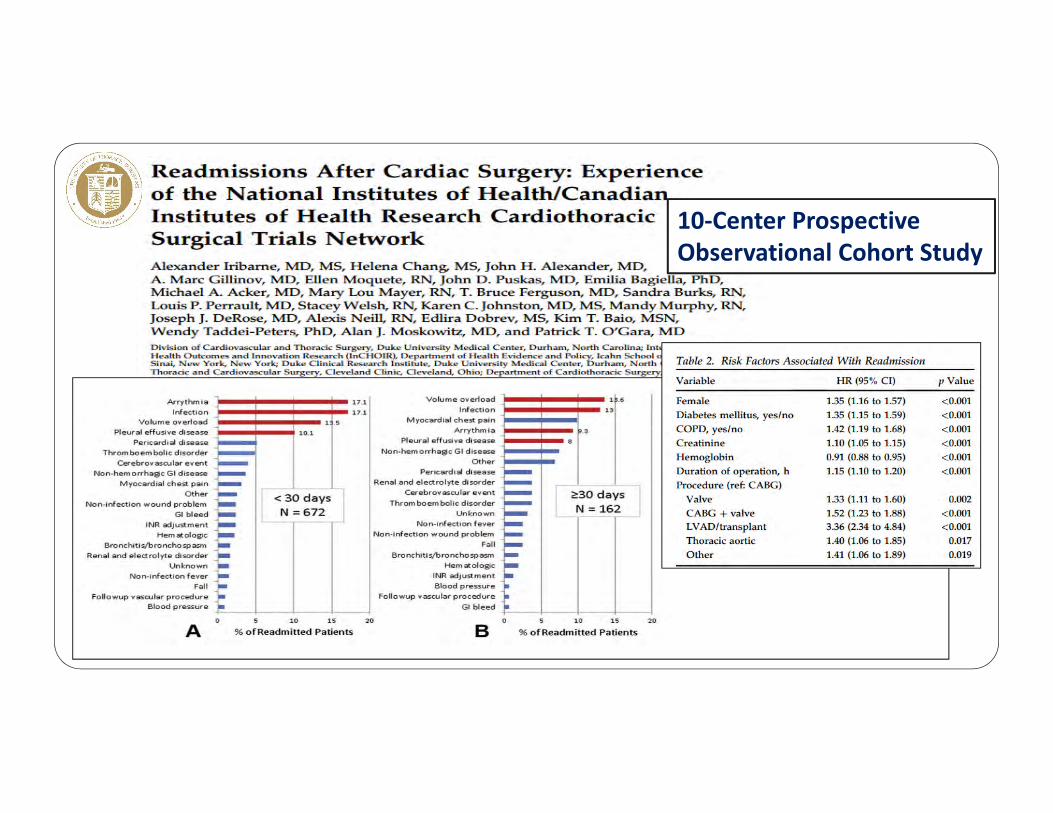
10‐Center ProspectiveObservational Cohort Study
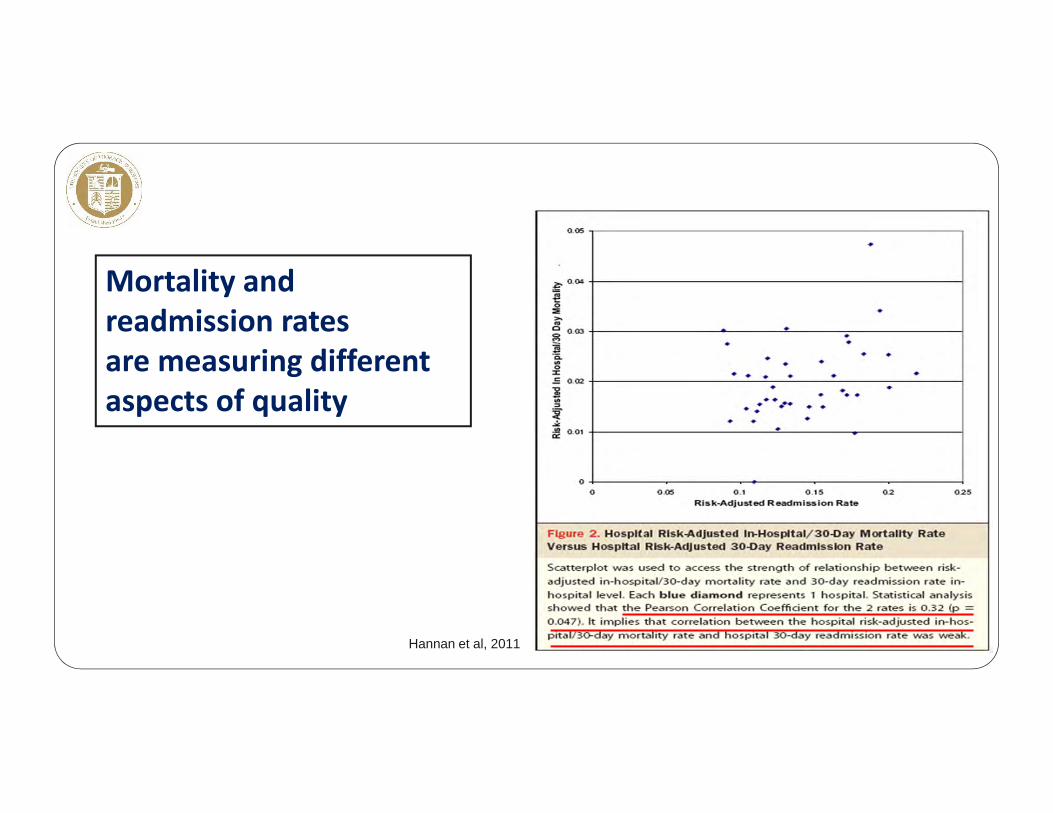
Mortality and readmission ratesare measuring different aspects of quality
Hannan et al, 2011
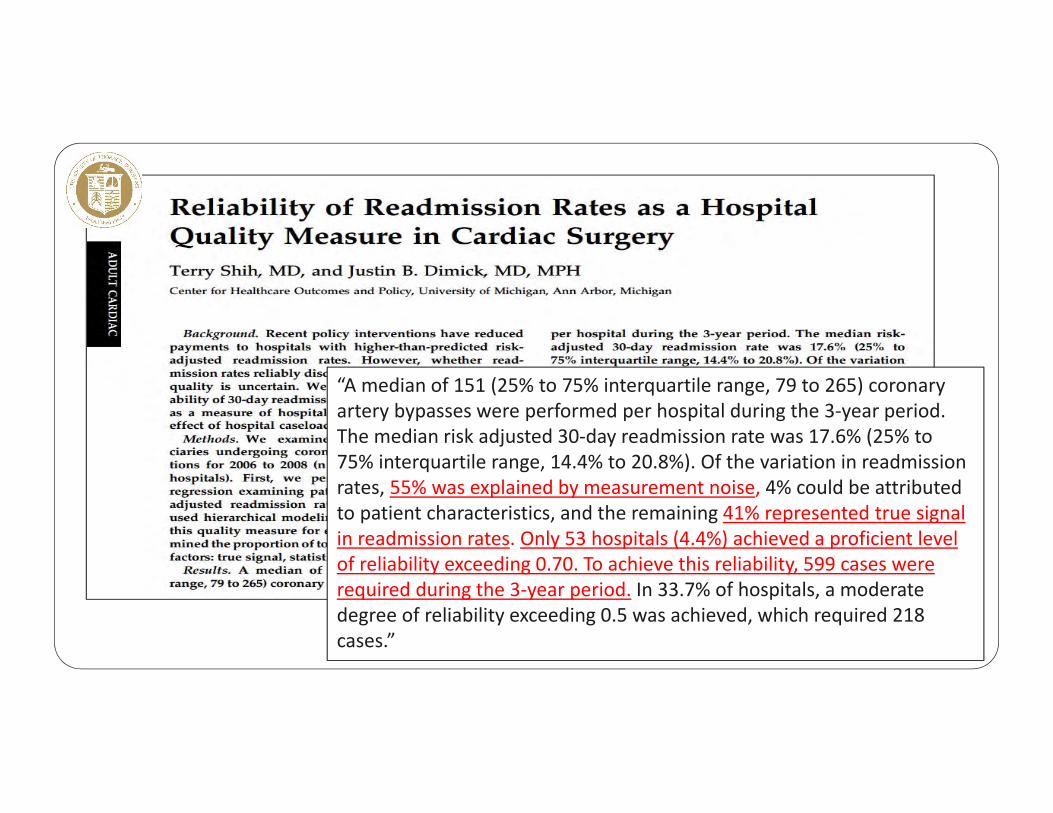
“A median of 151 (25% to 75% interquartile range, 79 to 265) coronary artery bypasses were performed per hospital during the 3‐year period. The median risk adjusted 30‐day readmission rate was 17.6% (25% to 75% interquartile range, 14.4% to 20.8%). Of the variation in readmission rates, 55% was explained by measurement noise, 4% could be attributed to patient characteristics, and the remaining 41% represented true signal in readmission rates. Only 53 hospitals (4.4%) achieved a proficient level of reliability exceeding 0.70. To achieve this reliability, 599 cases were required during the 3‐year period. In 33.7% of hospitals, a moderate degree of reliability exceeding 0.5 was achieved, which required 218 cases.”

Based on preop factors only, and no SES


STS/NQF Sociodemographic Factors Study
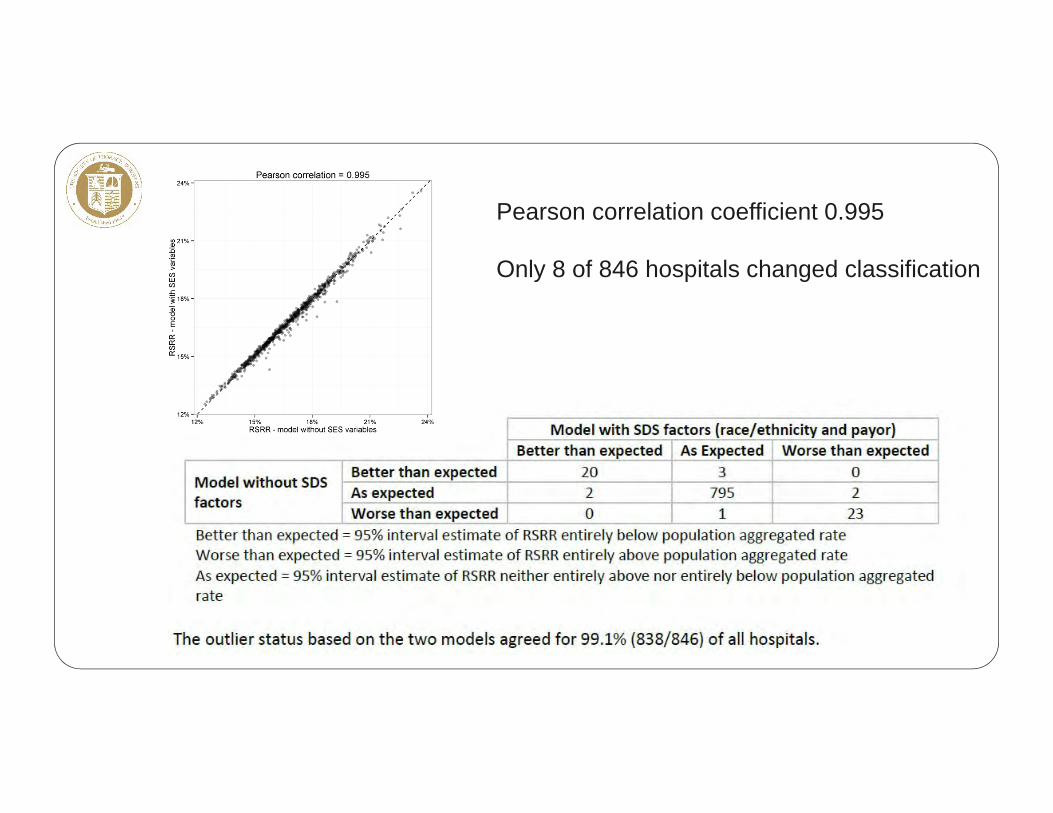
Pearson correlation coefficient 0.995
Only 8 of 846 hospitals changed classification

• Major national concern• Inter‐hospital variation exists• Readmission prediction models, including CABG, perform poorly
compared with mortality or morbidity models• SES factors do not change CABG performance classification for vast
majority of hospitals• For CABG, potential exists to mitigate likelihood of readmission
Readmission
Reducing Readmissions after Isolated CABG: Guidelines for Perioperative Care
Frank L. Shannon, MD
William Beaumont Hospital Cardiovascular Surgery
Associate ProfessorOakland University
William Beaumont School of Medicine
• None
Disclosures
• Risk factors for surgical morbidity and mortality are not the same as those for hospital readmission.
• Reducing readmission rates for CABG patients requires a “bundled” approach • Multiple unrelated causes of readmissions with a low incidence• Some causes are unavoidable complications of surgery• Socioeconomic and insurance coverage factors are unchangeable
General Considerations
• Provide better peri‐operative care• Strict glycemic control• Prevent Retained Blood Syndrome
• Completely resolve post‐operative issues• Atrial fibrillation – rate control and anti‐coagulation• Congestive heart failure – appropriate medication regimen• Pleural effusions – early thoracentesis
• Proactively identify patients “At Risk” for readmission• Better management of co‐morbidities• Plan enhanced post‐discharge follow‐up
Strategies to Reduce Readmission Rates after CABG
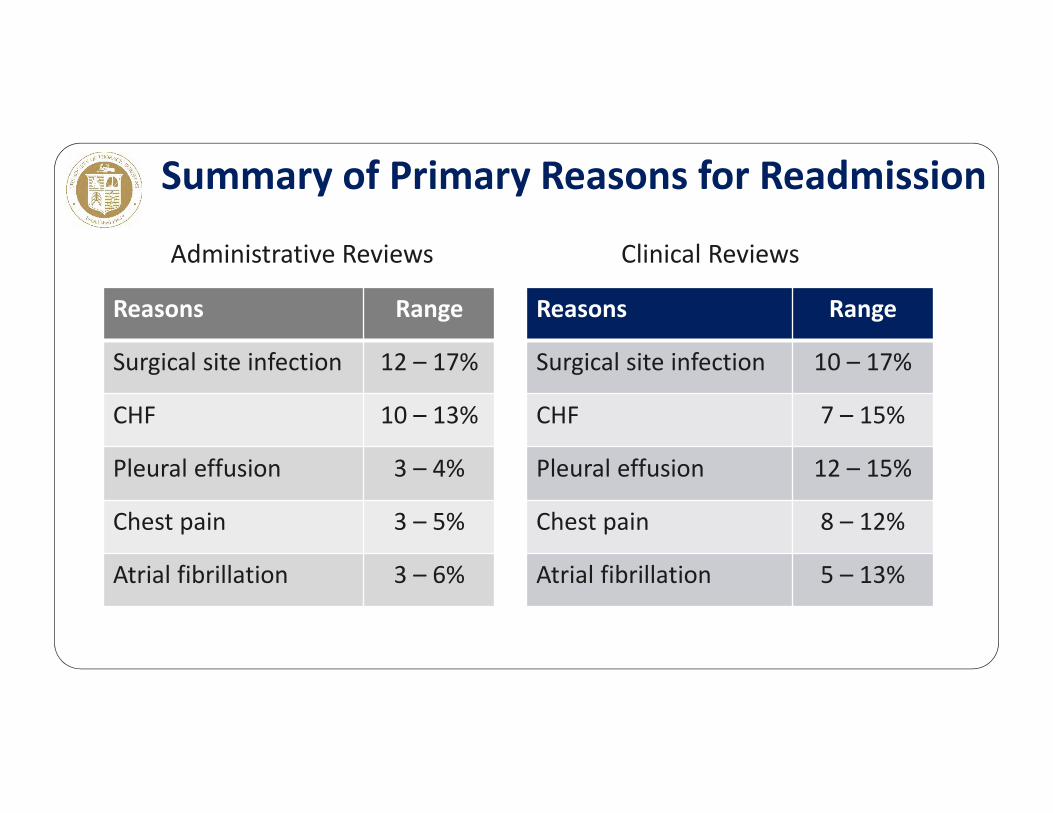
Summary of Primary Reasons for Readmission
Reasons Range
Surgical site infection 12 – 17%
CHF 10 – 13%
Pleural effusion 3 – 4%
Chest pain 3 – 5%
Atrial fibrillation 3 – 6%
Reasons Range
Surgical site infection 10 – 17%
CHF 7 – 15%
Pleural effusion 12 – 15%
Chest pain 8 – 12%
Atrial fibrillation 5 – 13%
Administrative Reviews Clinical Reviews
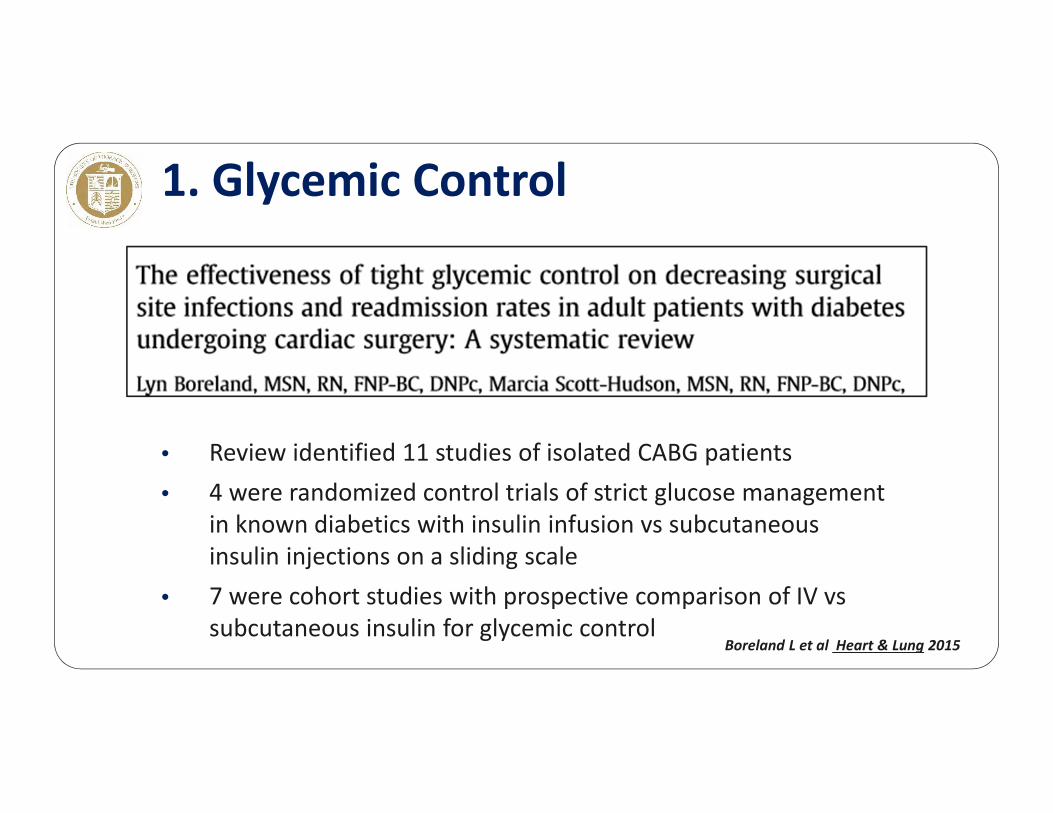
• Review identified 11 studies of isolated CABG patients• 4 were randomized control trials of strict glucose management
in known diabetics with insulin infusion vs subcutaneous insulin injections on a sliding scale
• 7 were cohort studies with prospective comparison of IV vs subcutaneous insulin for glycemic control
1. Glycemic Control
Boreland L et al Heart & Lung 2015
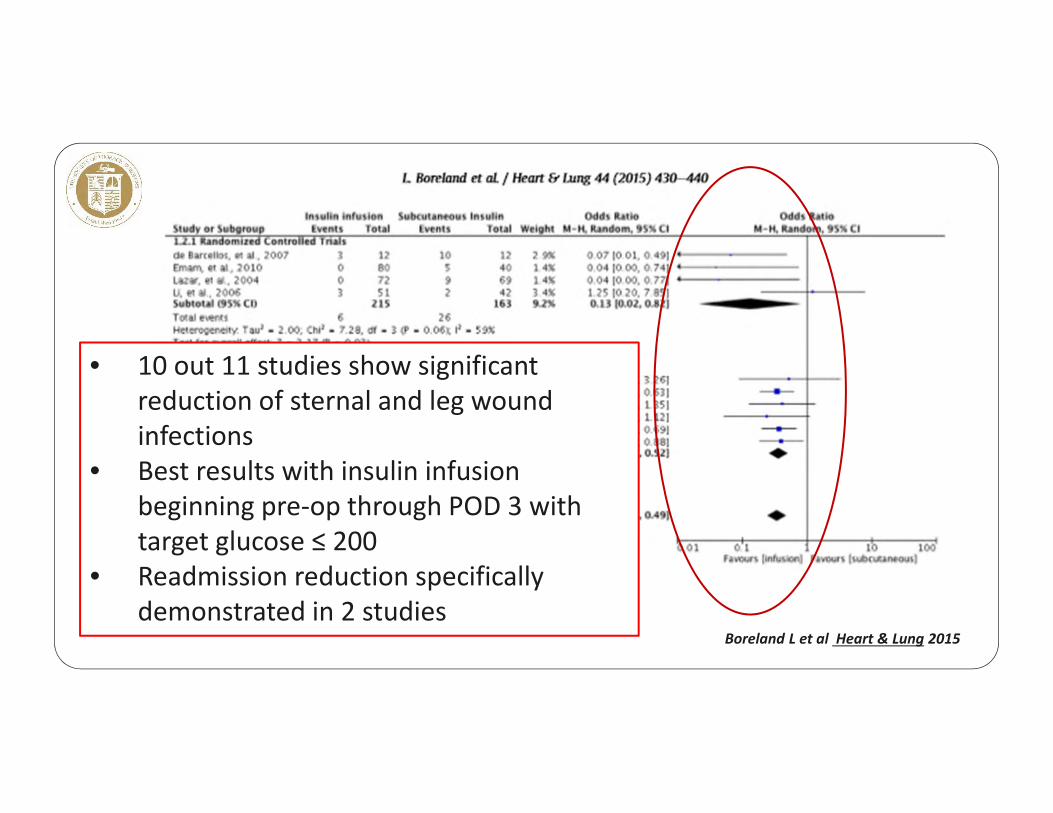
• 10 out 11 studies show significant reduction of sternal and leg wound infections
• Best results with insulin infusion beginning pre‐op through POD 3 with target glucose ≤ 200
• Readmission reduction specifically demonstrated in 2 studies
Boreland L et al Heart & Lung 2015
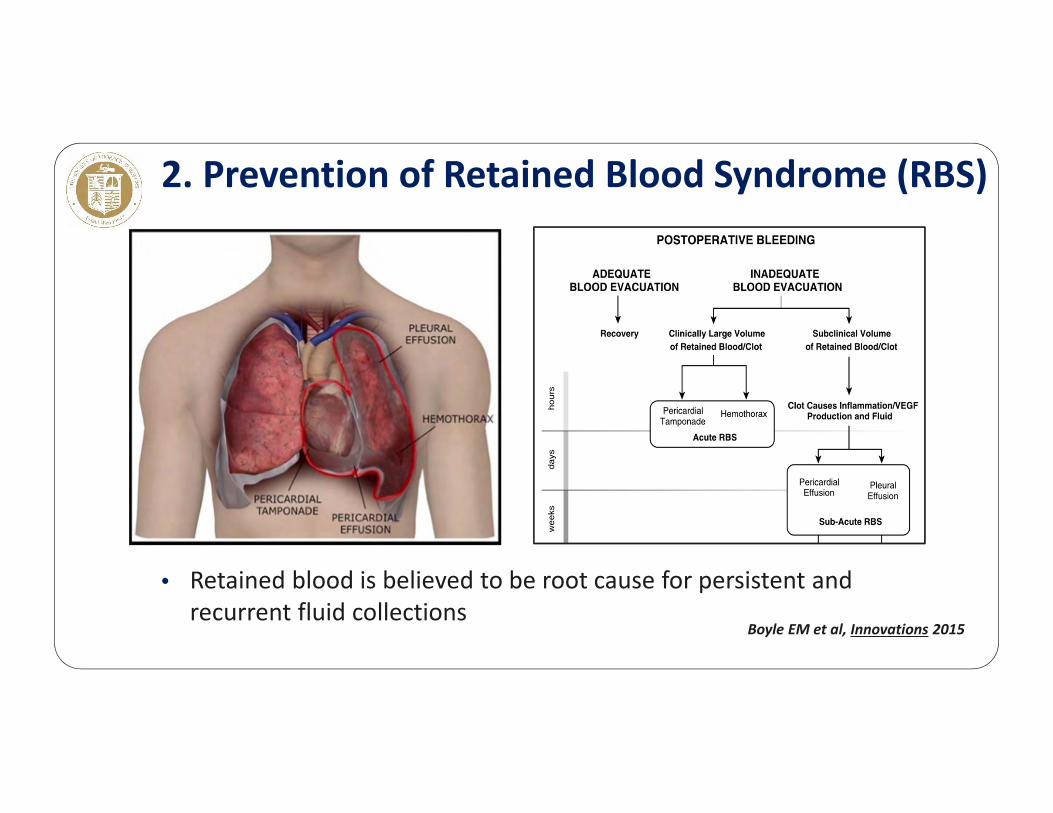
• Retained blood is believed to be root cause for persistent and recurrent fluid collections
2. Prevention of Retained Blood Syndrome (RBS)
Boyle EM et al, Innovations 2015
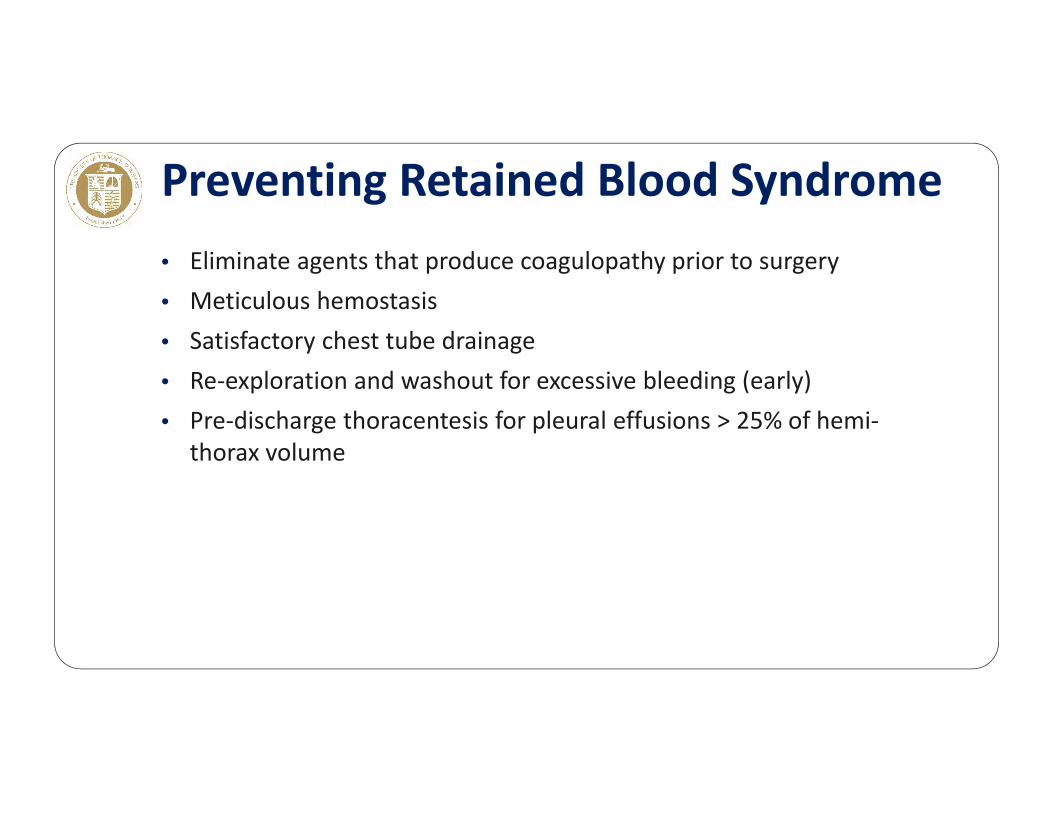
• Eliminate agents that produce coagulopathy prior to surgery• Meticulous hemostasis• Satisfactory chest tube drainage• Re‐exploration and washout for excessive bleeding (early)• Pre‐discharge thoracentesis for pleural effusions > 25% of hemi‐
thorax volume
Preventing Retained Blood Syndrome

1. HFrEF (LVEF < 40%)• Diuretics • ACE inhibitors titrated to effect• Aldosterone antagonists• Avoid calcium channel blockers
2. HFpEF (LVEF ≥ 40%)• Diuretics for fluid overload• Anti‐hypertensives to modulate BP and prevent SBP “spikes”• Beta blockers to prevent tachycardia• Aldosterone antagonists
Complete Resolution of Post‐operative IssuesCHF – Optimal Medication Management
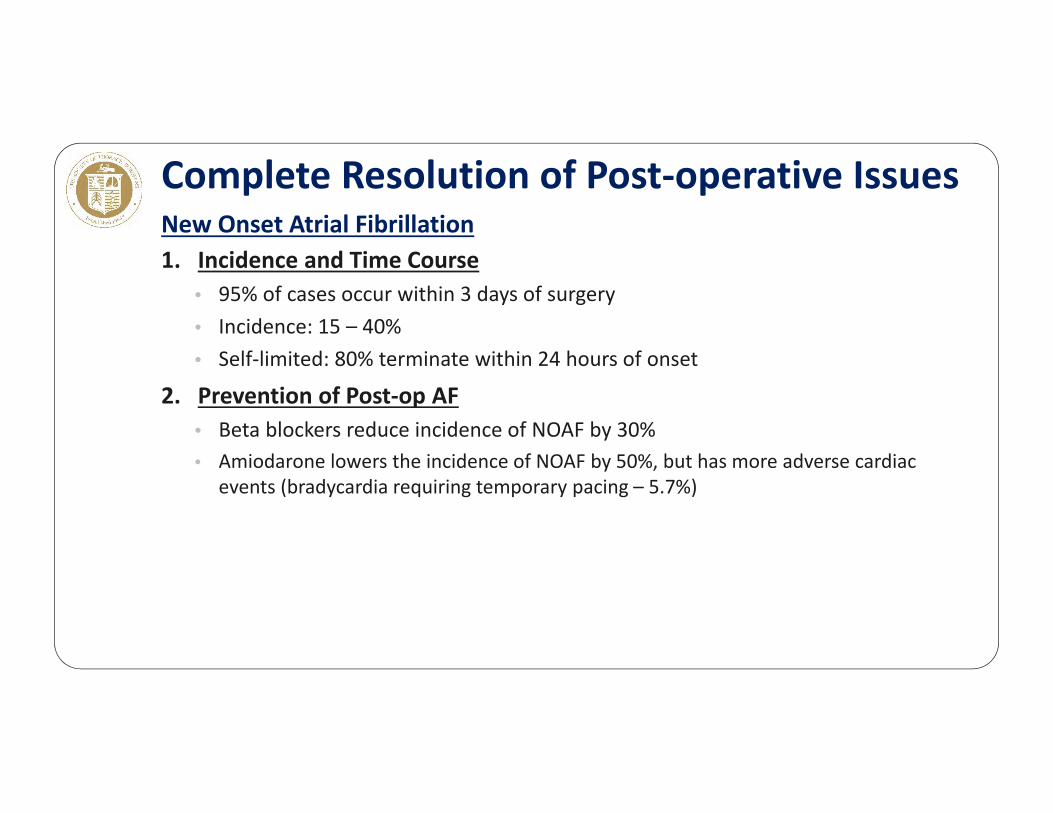
1. Incidence and Time Course• 95% of cases occur within 3 days of surgery• Incidence: 15 – 40% • Self‐limited: 80% terminate within 24 hours of onset
2. Prevention of Post‐op AF• Beta blockers reduce incidence of NOAF by 30% • Amiodarone lowers the incidence of NOAF by 50%, but has more adverse cardiac
events (bradycardia requiring temporary pacing – 5.7%)
Complete Resolution of Post‐operative IssuesNew Onset Atrial Fibrillation
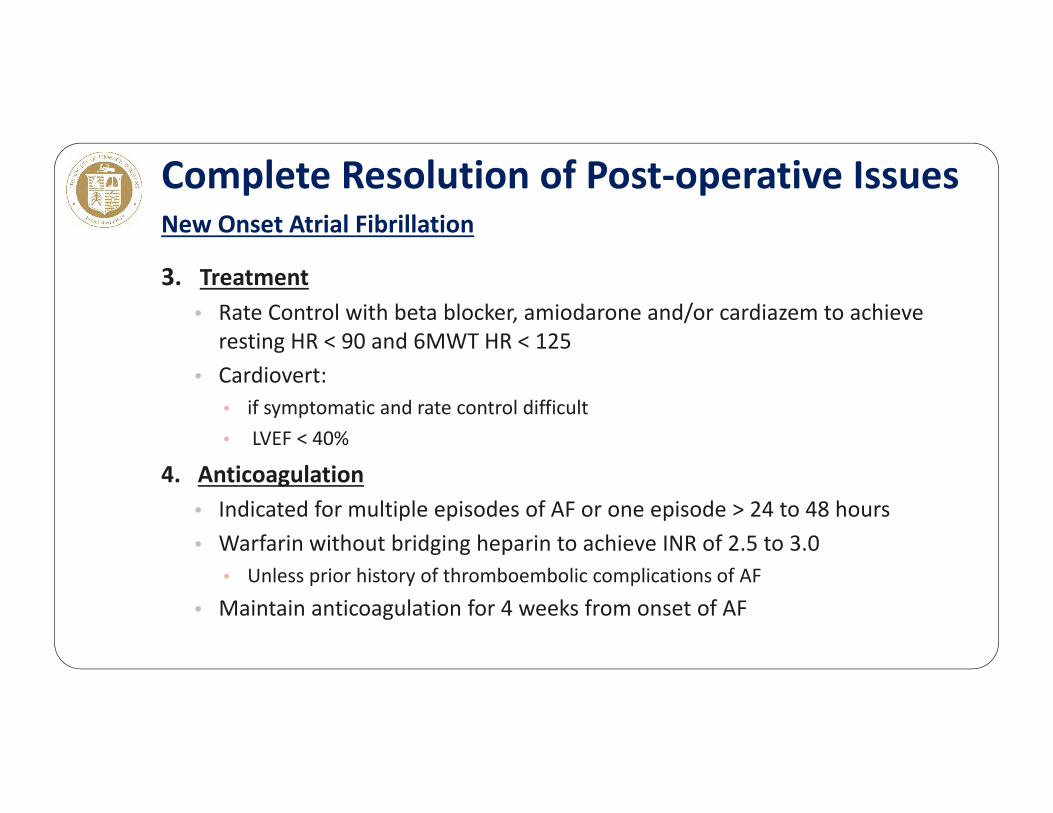
3. Treatment• Rate Control with beta blocker, amiodarone and/or cardiazem to achieve resting HR < 90 and 6MWT HR < 125
• Cardiovert:• if symptomatic and rate control difficult• LVEF < 40%
4. Anticoagulation• Indicated for multiple episodes of AF or one episode > 24 to 48 hours• Warfarin without bridging heparin to achieve INR of 2.5 to 3.0
• Unless prior history of thromboembolic complications of AF
• Maintain anticoagulation for 4 weeks from onset of AF
Complete Resolution of Post‐operative IssuesNew Onset Atrial Fibrillation

1. Natural History• 10% develop effusion that occupies > 25% of hemi‐thorax within 30 days• Only half of these patients require thoracentesis
2. Evaluation• Pleural ultrasound to differentiate fluid from atelectasis• Post‐cardiotomy syndrome work‐up if progressive enlargement > 2 weeks
3. Treatment• Medical management (diuresis ± NSAIDs)• Pre‐discharge ultrasound‐guided thoracentesis if > 25% hemithorax
Complete Resolution of Post‐operative IssuesPleural Effusions
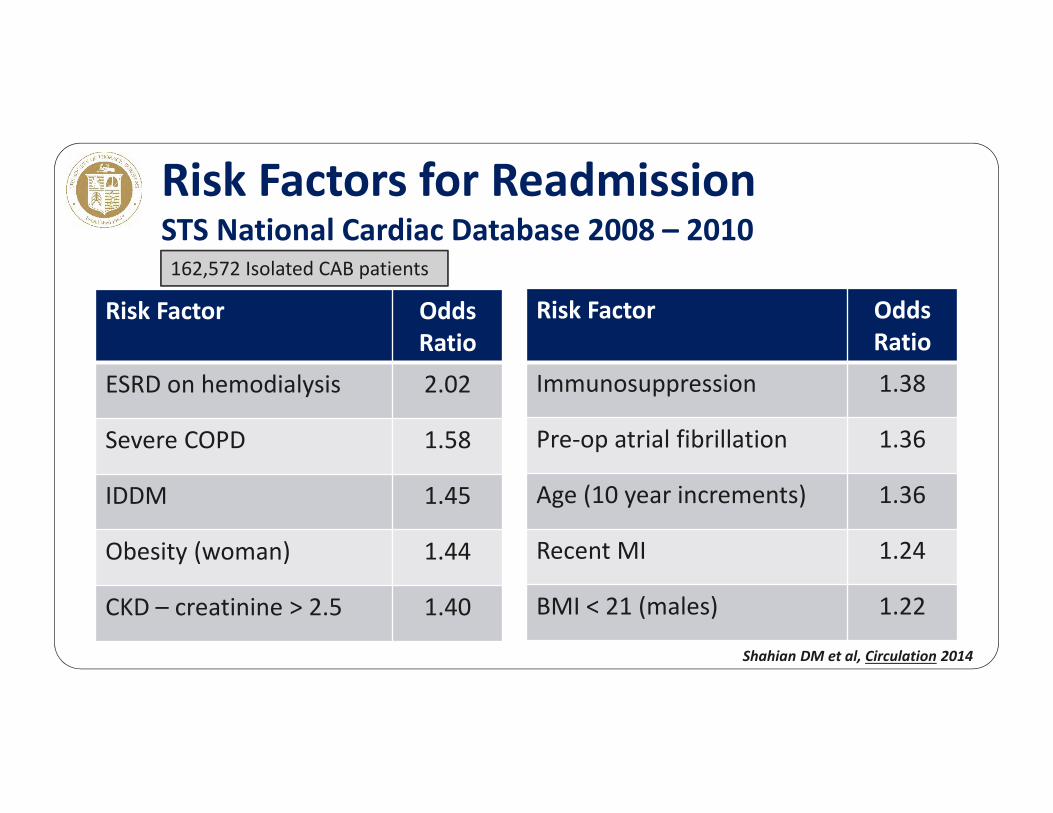
Risk Factors for ReadmissionSTS National Cardiac Database 2008 – 2010
Risk Factor OddsRatio
ESRD on hemodialysis 2.02
Severe COPD 1.58
IDDM 1.45
Obesity (woman) 1.44
CKD – creatinine > 2.5 1.40
Risk Factor Odds Ratio
Immunosuppression 1.38
Pre‐op atrial fibrillation 1.36
Age (10 year increments) 1.36
Recent MI 1.24
BMI < 21 (males) 1.22
Shahian DM et al, Circulation 2014
162,572 Isolated CAB patients

• Conscientious guideline implementation• Adjust for co‐morbidities
• Higher index of suspicion for complications• Infections and borderline cardiopulmonary function
• Plan post‐discharge resources for frailty support • PT and nursing care to facilitate full recovery
• Avoid post‐surgical variant of “post‐hospital syndrome”• Urgent surgery challenges pre‐hospital compensation
Benefits of Recognizing “At Risk” Patients for Readmission
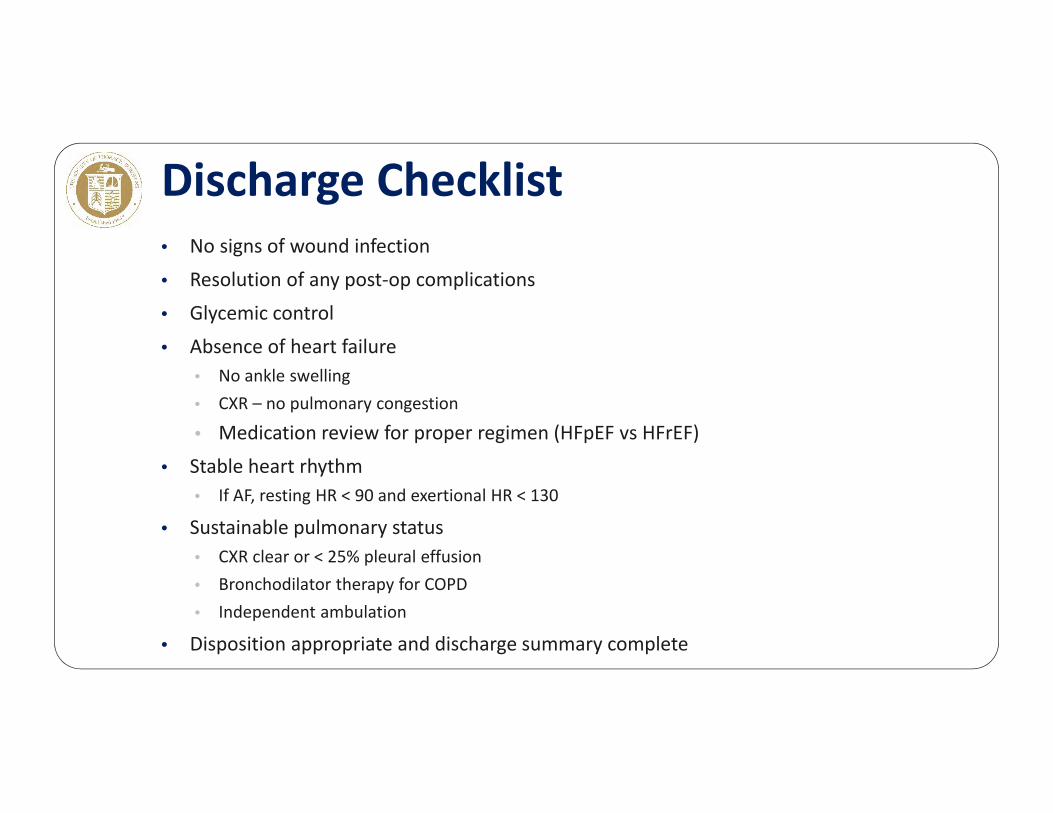
• No signs of wound infection
• Resolution of any post‐op complications
• Glycemic control
• Absence of heart failure• No ankle swelling• CXR – no pulmonary congestion
• Medication review for proper regimen (HFpEF vs HFrEF)
• Stable heart rhythm• If AF, resting HR < 90 and exertional HR < 130
• Sustainable pulmonary status• CXR clear or < 25% pleural effusion• Bronchodilator therapy for COPD• Independent ambulation
• Disposition appropriate and discharge summary complete
Discharge Checklist
Readmission Strategies & Outcomes
Kevin W. Lobdell, MD
Director of QualitySanger Heart & Vascular InstituteCarolinas HealthCare System
Clinical Professor of SurgeryUniversity of North Carolina

• None
Disclosures
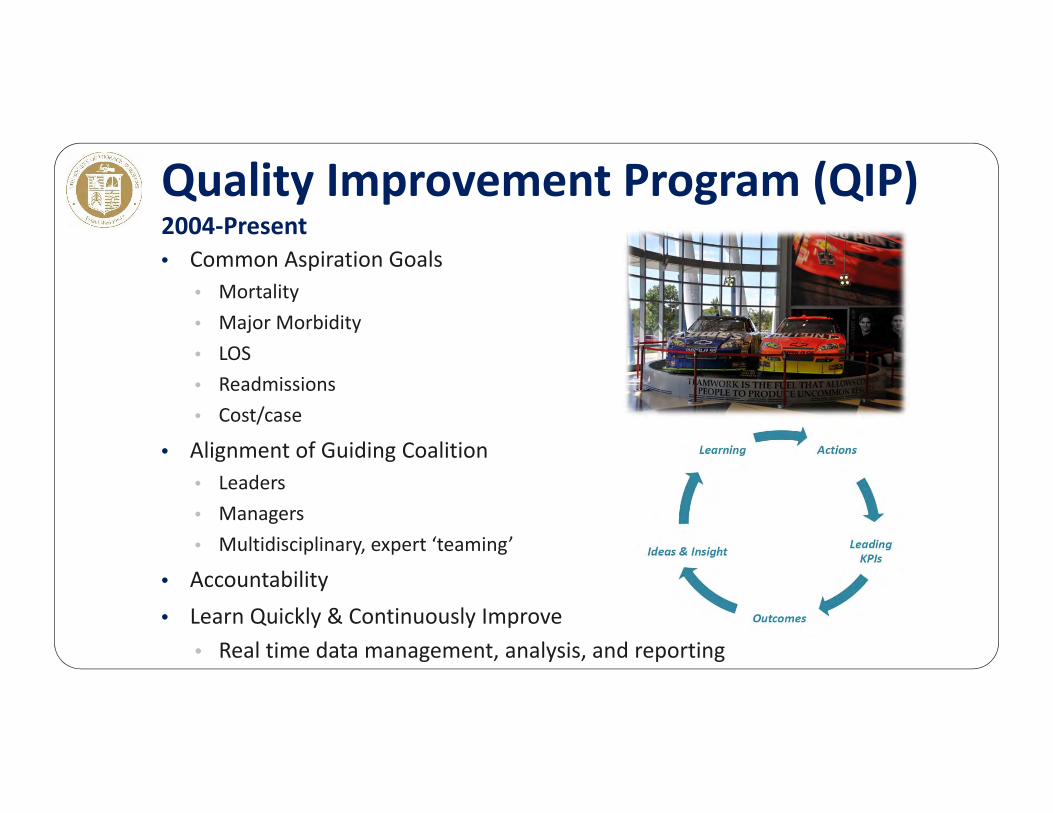
• Common Aspiration Goals• Mortality• Major Morbidity• LOS• Readmissions• Cost/case
• Alignment of Guiding Coalition• Leaders• Managers• Multidisciplinary, expert ‘teaming’
• Accountability• Learn Quickly & Continuously Improve
• Real time data management, analysis, and reporting
Quality Improvement Program (QIP)2004‐Present
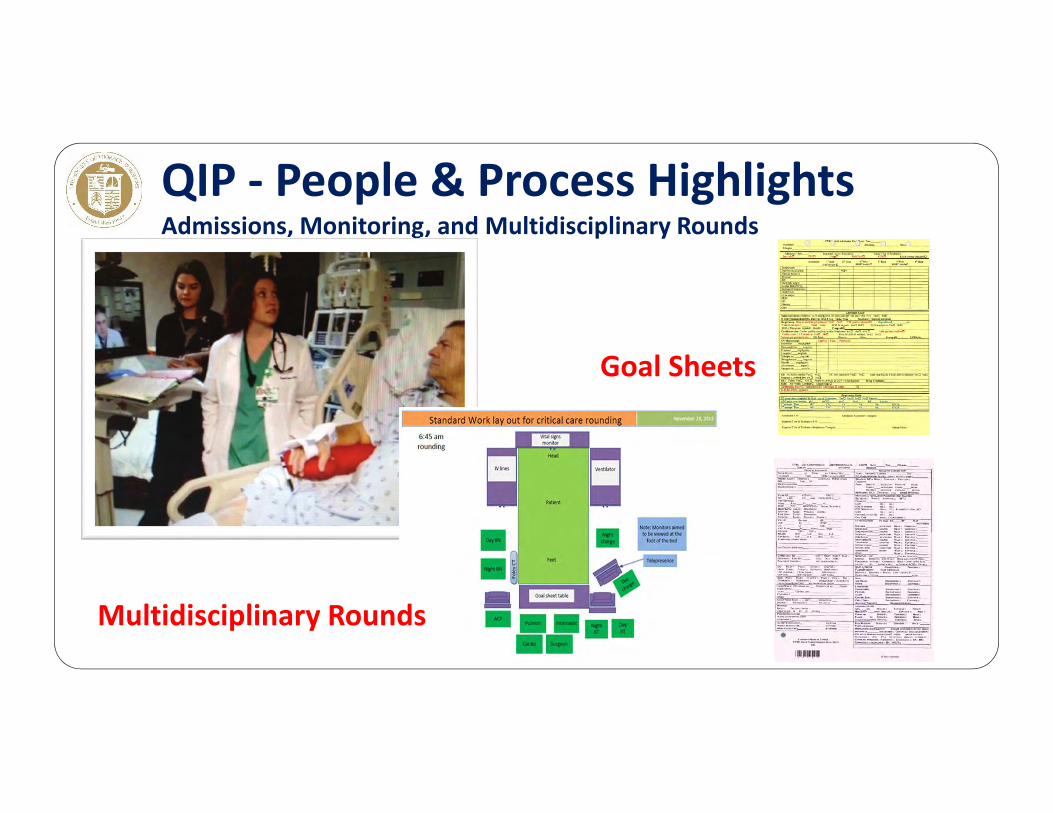
QIP ‐ People & Process HighlightsAdmissions, Monitoring, and Multidisciplinary Rounds
Multidisciplinary Rounds
Goal Sheets
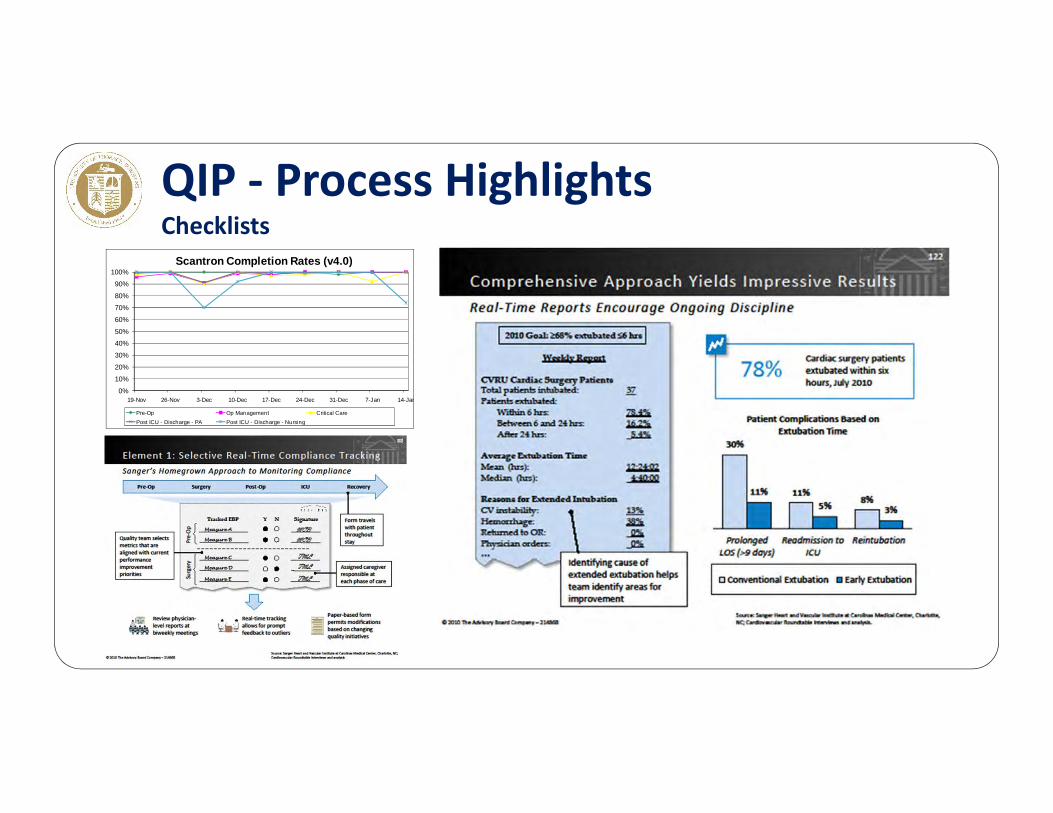
QIP ‐ Process HighlightsChecklists
0%
10%
20%
30%
40%
50%
60%
70%
80%
90%
100%
19-Nov 26-Nov 3-Dec 10-Dec 17-Dec 24-Dec 31-Dec 7-Jan 14-Jan
Scantron Completion Rates (v4.0)
Pre-Op Op Management Critical CarePost ICU - Discharge - PA Post ICU - Discharge - Nursing

QIP‐Technology Point of Care Database
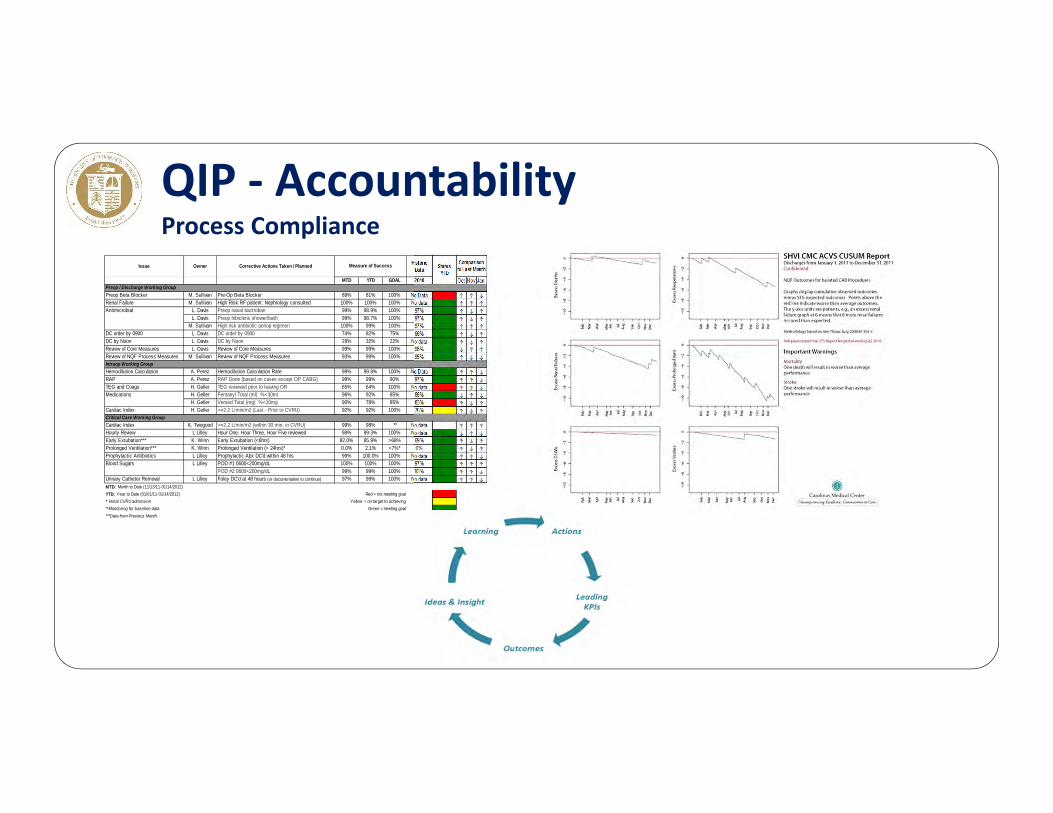
QIP ‐ AccountabilityProcess Compliance
Issue Owner Corrective Actions Taken / Planned Historic Data
MTD YTD GOAL 2010 Oct Nov Jan
Preop Beta Blocker M. Sullivan Pre-Op Beta Blocker 89% 81% 100% No Data ↑ ↑ ↓Renal Failure M. Sullivan High Risk RF patient: Nephrology consulted 100% 100% 100% No data ↑ ↑ ↑
L. Davis Preop nasal bactroban 99% 98.9% 100% 97% ↑ ↓ ↑L. Davis Preop hibiclens shower/bath 99% 98.7% 100% 97% ↑ ↓ ↑
M. Sullivan High risk antibiotic periop regimen 100% 99% 100% 97% ↑ ↑ ↑DC order by 0900 L. Davis DC order by 0900 74% 82% 75% 66% ↑ ↓ ↑DC by Noon L. Davis DC by Noon 29% 32% 22% No data ↑ ↓ ↑Review of Core Measures L. Davis Review of Core Measures 99% 99% 100% 96% ↓ ↑ ↑Review of NQF Process Measures M. Sullivan Review of NQF Process Measures 93% 99% 100% 95% ↑ ↓ ↓
Hemodilution Calculation A. Perez Hemodilution Calculation Rate 99% 99.9% 100% No Data ↑ ↑ ↓RAP A. Perez RAP Done (based on cases except OP CABG) 99% 99% 90% 97% ↑ ↑ ↓TEG and Coags H. Geller TEG reviewed prior to leaving OR 65% 64% 100% No data ↑ ↑ ↓
H. Geller Fentanyl Total (ml) %<30ml 96% 92% 85% 86% ↓ ↑ ↓H. Geller Versed Total (mg) %<10mg 90% 78% 85% 83% ↑ ↓ ↑
Cardiac Index H. Geller >=2.2 L/min/m2 (Last - Prior to CVRU) 92% 92% 100% 75% ↑ ↓ ↑
Cardiac Index K. Twogood >=2.2 L/min/m2 (within 30 min. in CVRU) 99% 98% ** No data ↑ ↑ ↑Hourly Review L Lilley Hour One, Hour Three, Hour Five reviewed 98% 99.3% 100% No data ↓ ↑ ↓Early Extubation*** K. Winn Early Extubation (<6hrs) 82.0% 85.9% >68% 69% ↑ ↓ ↑Prolonged Ventilation*** K. Winn Prolonged Ventilation (> 24hrs)* 0.0% 2.1% <7%* 6% ↑ ↓ ↑Prophylactic Antibiotics L Lilley Prophylactic Abx DC'd within 48 hrs 99% 100.0% 100% No data ↑ ↑ ↓
L Lilley POD #1 0600<200mg/dL 100% 100% 100% 97% ↑ ↑ ↑ POD #2 0600<200mg/dL 99% 99% 100% 93% ↑ ↑ ↓
Urinary Catheter Removal L Lilley Foley DC'd at 48 hours (or documentation to continue) 97% 99% 100% No data ↑ ↑ ↓MTD: Month to Date (11/13/11-01/14/2012)YTD: Year to Date (01/01/11-01/14/2012) Red = not meeting goal* Initial CVRU admission Yellow = on target to achieving**Monitoring for baseline data Green = meeting goal***Data from Previous Month
Comparison to Last MonthMeasure of Success
Antimicrobial
Blood Sugars
Preop / Discharge Working Group
Intraop Working Group
Critical Care Working Group
Medications
StatusYTD
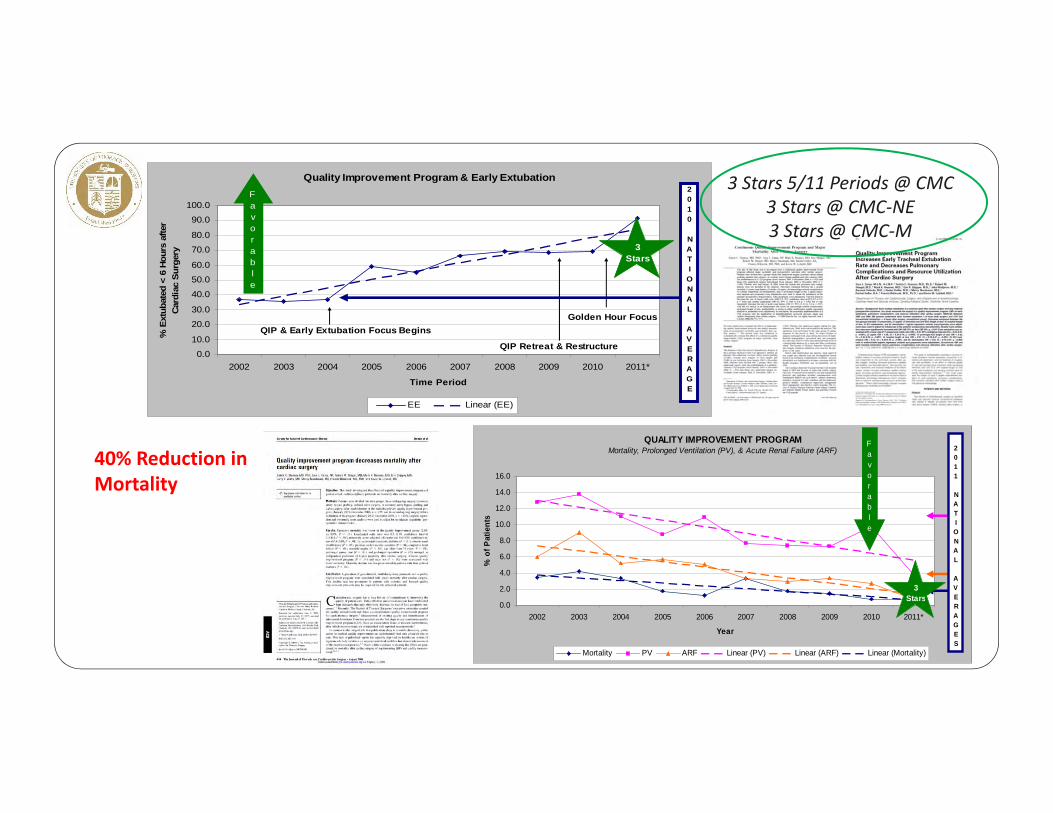
Quality Improvement Program & Early Extubation
0.0
10.0
20.0
30.0
40.0
50.0
60.0
70.0
80.0
90.0
100.0
2002 2003 2004 2005 2006 2007 2008 2009 2010 2011*
Time Period
% E
xtub
ated
< 6
Hou
rs a
fter
Card
iac
Surg
ery
EE Linear (EE)
Favorable
Golden Hour FocusQIP & Early Extubation Focus Begins
QIP Retreat & Restructure
2010 NATIONAL AVERAGE
3 Stars
QUALITY IMPROVEMENT PROGRAMMortality, Prolonged Ventilation (PV), & Acute Renal Failure (ARF)
0.0
2.0
4.0
6.0
8.0
10.0
12.0
14.0
16.0
2002 2003 2004 2005 2006 2007 2008 2009 2010 2011*
Year
% o
f Pat
ient
s
Mortality PV ARF Linear (PV) Linear (ARF) Linear (Mortality)
Favorable
2011 NATIONAL AVERAGES
3Stars
3 Stars 5/11 Periods @ CMC3 Stars @ CMC‐NE3 Stars @ CMC‐M
40% Reduction in Mortality
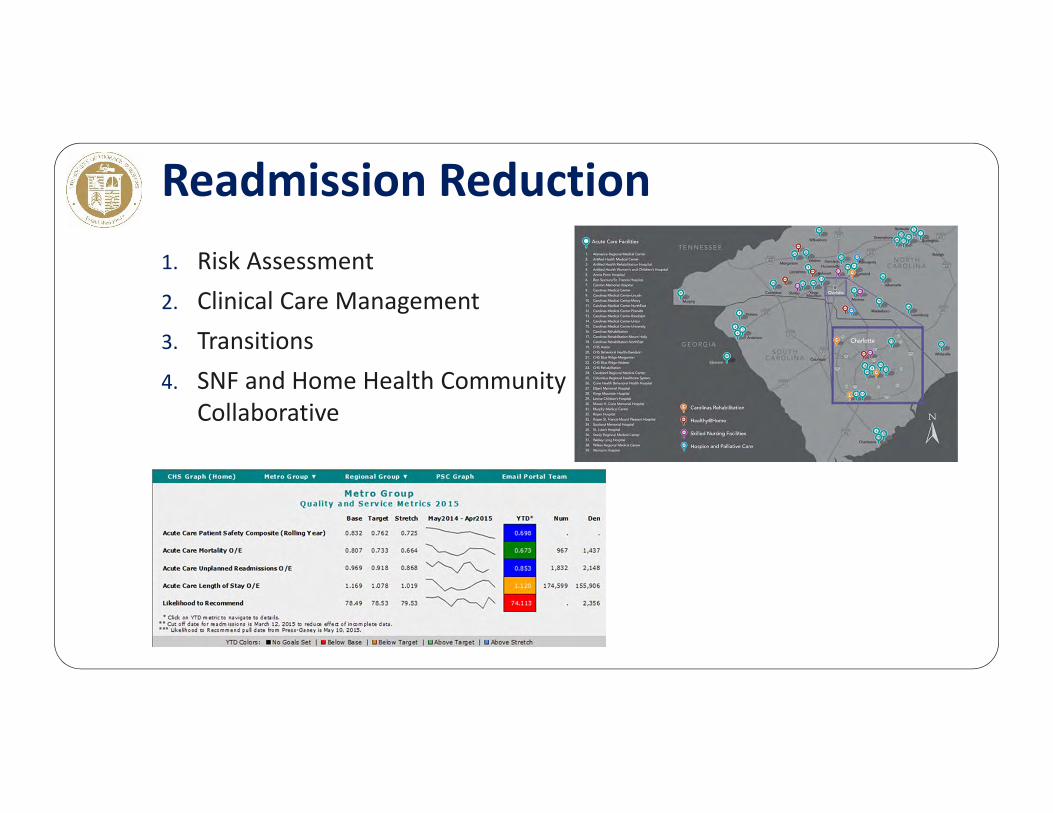
1. Risk Assessment2. Clinical Care Management3. Transitions4. SNF and Home Health Community
Collaborative
Readmission Reduction

2014 Charlotte Metro Readmissions

Readmission ReductionCharter & Structure
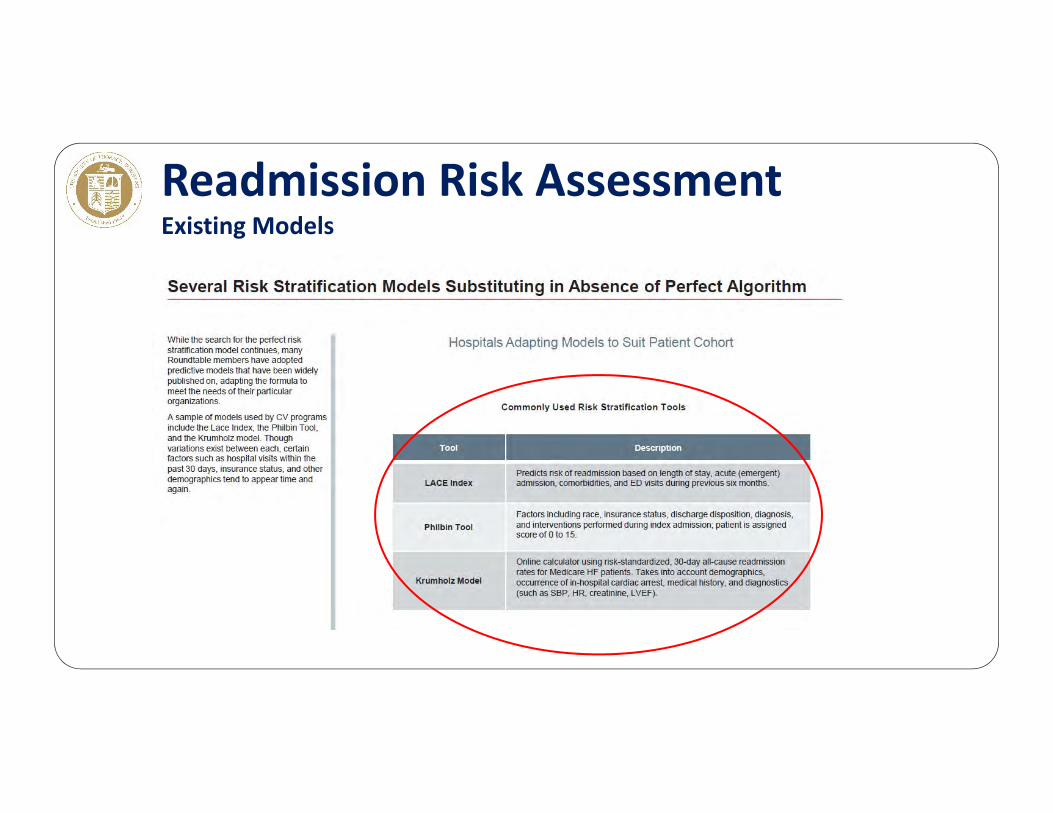
Readmission Risk AssessmentExisting Models
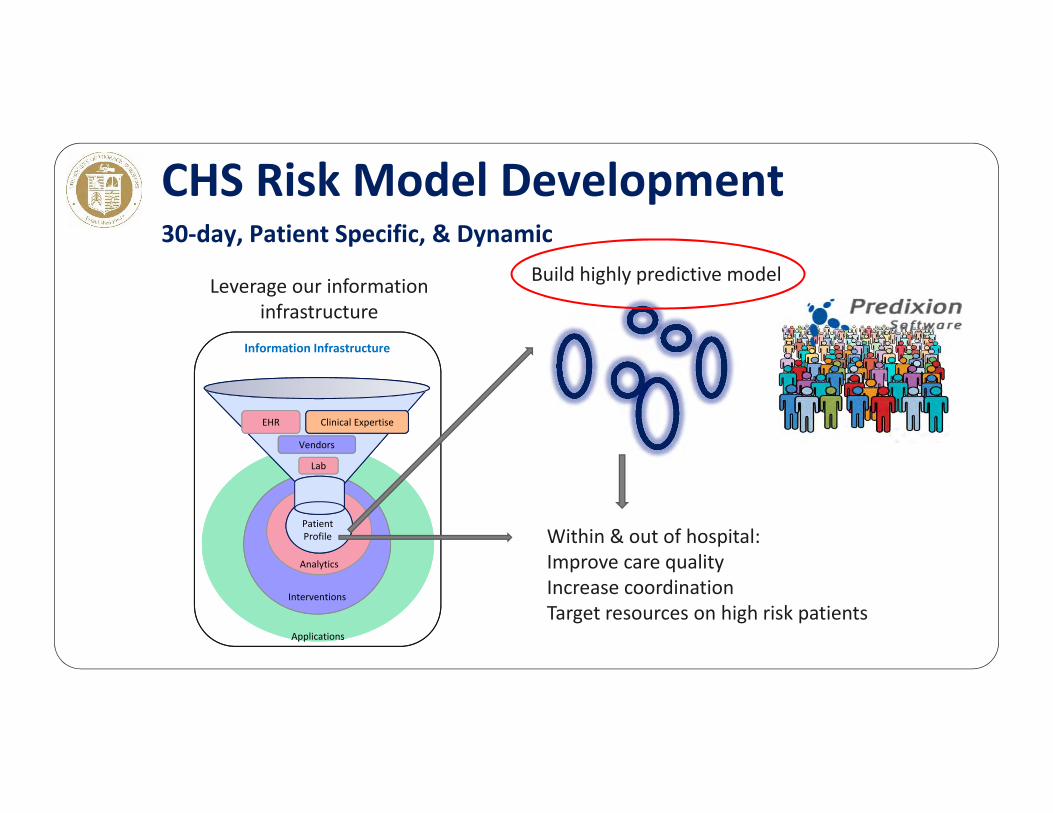
CHS Risk Model Development30‐day, Patient Specific, & Dynamic
Build highly predictive model
ApplicationsApplications
Interventions
Analytics
PatientProfile
EHR
Vendors
Lab
Information Infrastructure
Clinical Expertise
Leverage our information infrastructure
Within & out of hospital: Improve care qualityIncrease coordinationTarget resources on high risk patients
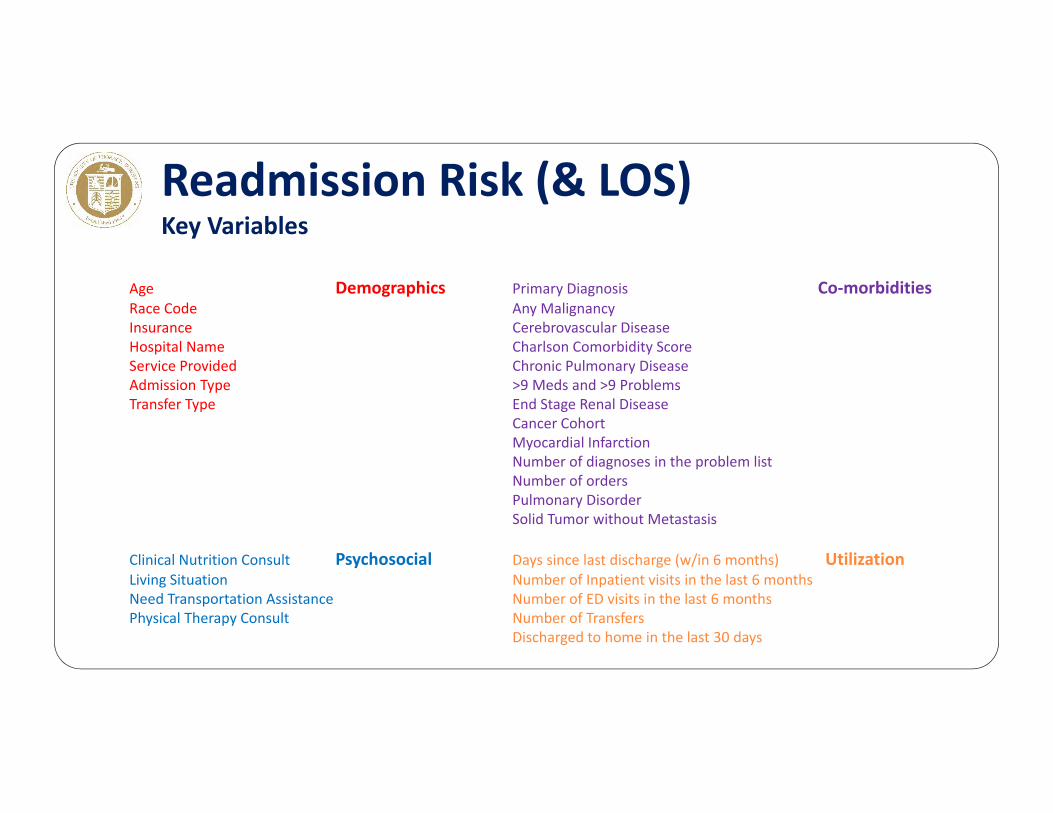
Readmission Risk (& LOS)Key Variables
Age DemographicsRace CodeInsuranceHospital NameService ProvidedAdmission Type Transfer Type
Clinical Nutrition Consult PsychosocialLiving SituationNeed Transportation AssistancePhysical Therapy Consult
Primary Diagnosis Co‐morbiditiesAny MalignancyCerebrovascular DiseaseCharlson Comorbidity Score Chronic Pulmonary Disease>9 Meds and >9 ProblemsEnd Stage Renal DiseaseCancer Cohort Myocardial InfarctionNumber of diagnoses in the problem listNumber of orders Pulmonary DisorderSolid Tumor without Metastasis
Days since last discharge (w/in 6 months) UtilizationNumber of Inpatient visits in the last 6 monthsNumber of ED visits in the last 6 monthsNumber of TransfersDischarged to home in the last 30 days
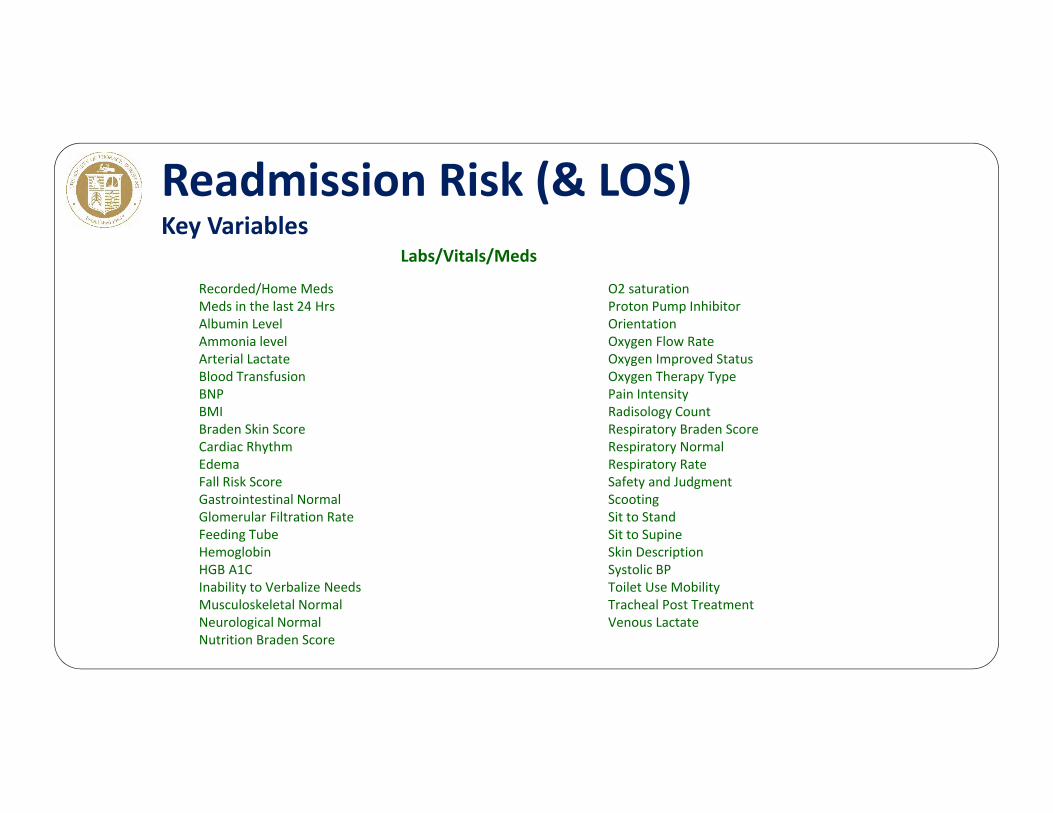
Recorded/Home MedsMeds in the last 24 HrsAlbumin Level Ammonia levelArterial LactateBlood TransfusionBNPBMIBraden Skin ScoreCardiac RhythmEdemaFall Risk ScoreGastrointestinal Normal Glomerular Filtration RateFeeding TubeHemoglobinHGB A1CInability to Verbalize NeedsMusculoskeletal NormalNeurological NormalNutrition Braden Score
Labs/Vitals/Meds
O2 saturationProton Pump InhibitorOrientationOxygen Flow RateOxygen Improved StatusOxygen Therapy TypePain IntensityRadisology CountRespiratory Braden ScoreRespiratory NormalRespiratory RateSafety and JudgmentScootingSit to StandSit to SupineSkin DescriptionSystolic BPToilet Use MobilityTracheal Post TreatmentVenous Lactate
Readmission Risk (& LOS)Key Variables
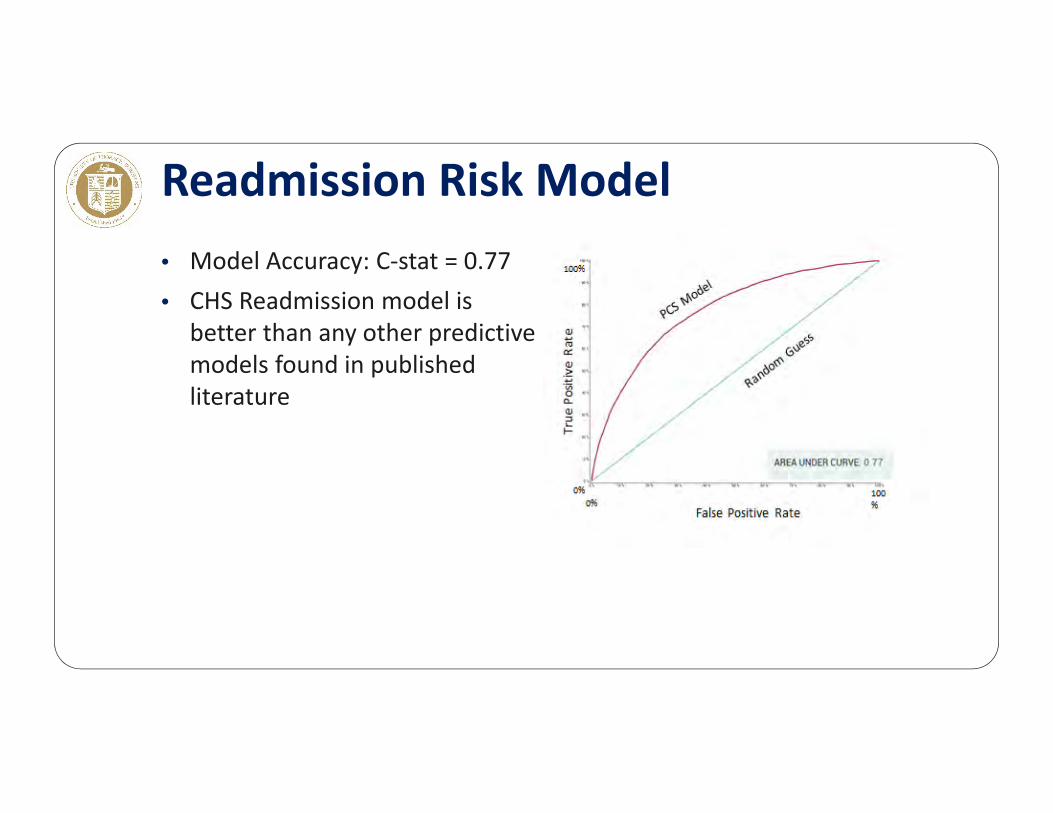
• Model Accuracy: C‐stat = 0.77• CHS Readmission model is
better than any other predictive models found in published literature
Readmission Risk Model

Validation of Readmission CHS Risk Model
0% 10% 20%
Low
Medium
High
Very High
Pred
icted Risk
Actual Readmission Rate
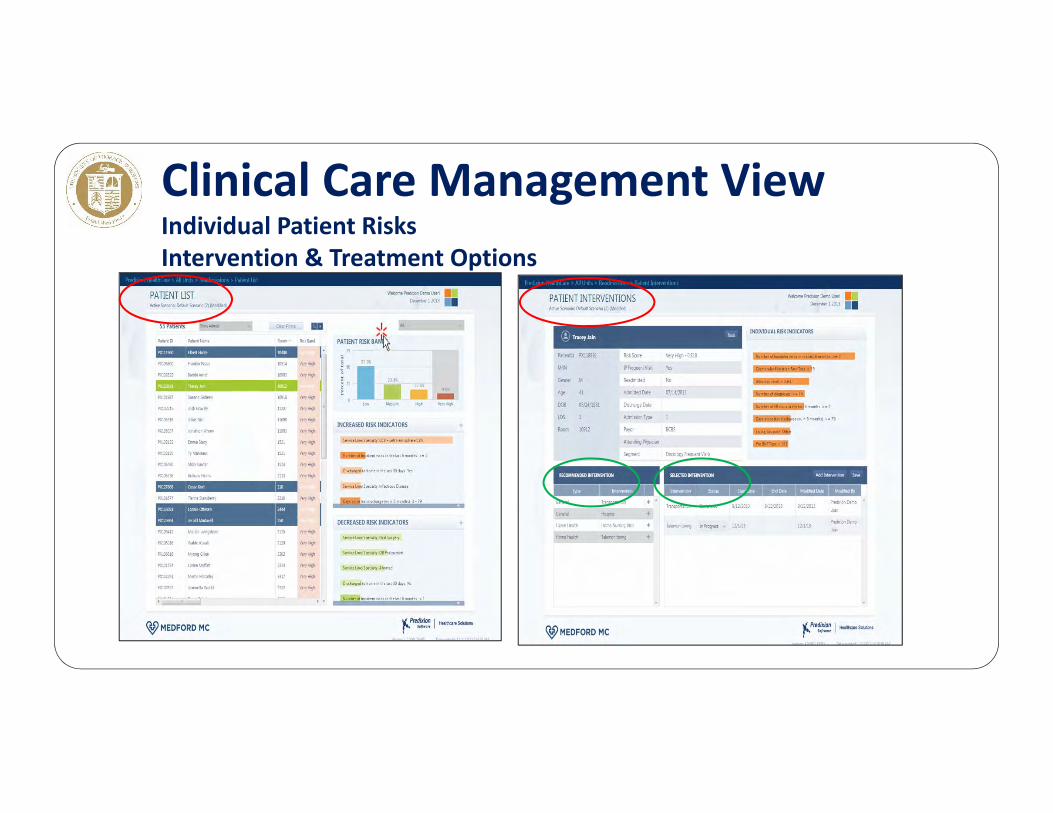
Clinical Care Management ViewIndividual Patient RisksIntervention & Treatment Options
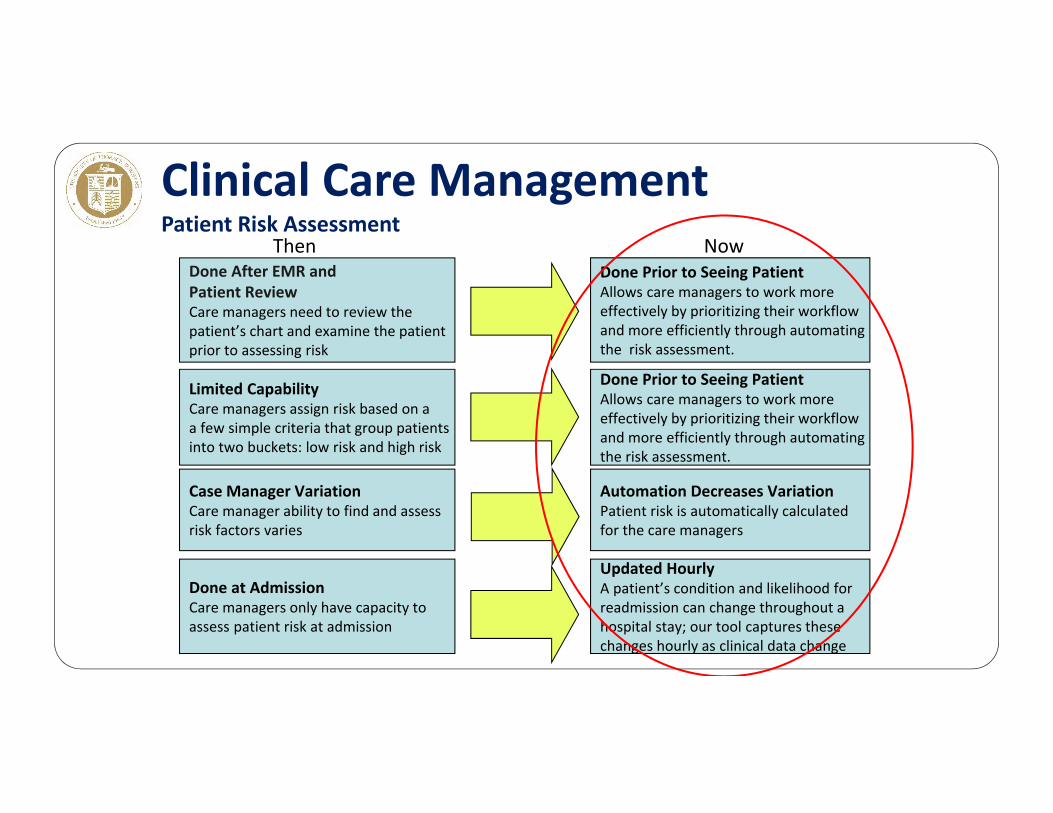
Clinical Care ManagementPatient Risk Assessment
Done After EMR and Patient ReviewCare managers need to review the patient’s chart and examine the patient prior to assessing risk
Limited CapabilityCare managers assign risk based on aa few simple criteria that group patientsinto two buckets: low risk and high risk
Case Manager VariationCare manager ability to find and assessrisk factors varies
Done at AdmissionCare managers only have capacity to assess patient risk at admission
ThenDone Prior to Seeing PatientAllows care managers to work more effectively by prioritizing their workflow and more efficiently through automating the risk assessment.
Done Prior to Seeing PatientAllows care managers to work more effectively by prioritizing their workflow and more efficiently through automating the risk assessment.
Automation Decreases VariationPatient risk is automatically calculated for the care managers
Updated HourlyA patient’s condition and likelihood for readmission can change throughout a hospital stay; our tool captures thesechanges hourly as clinical data change
Now
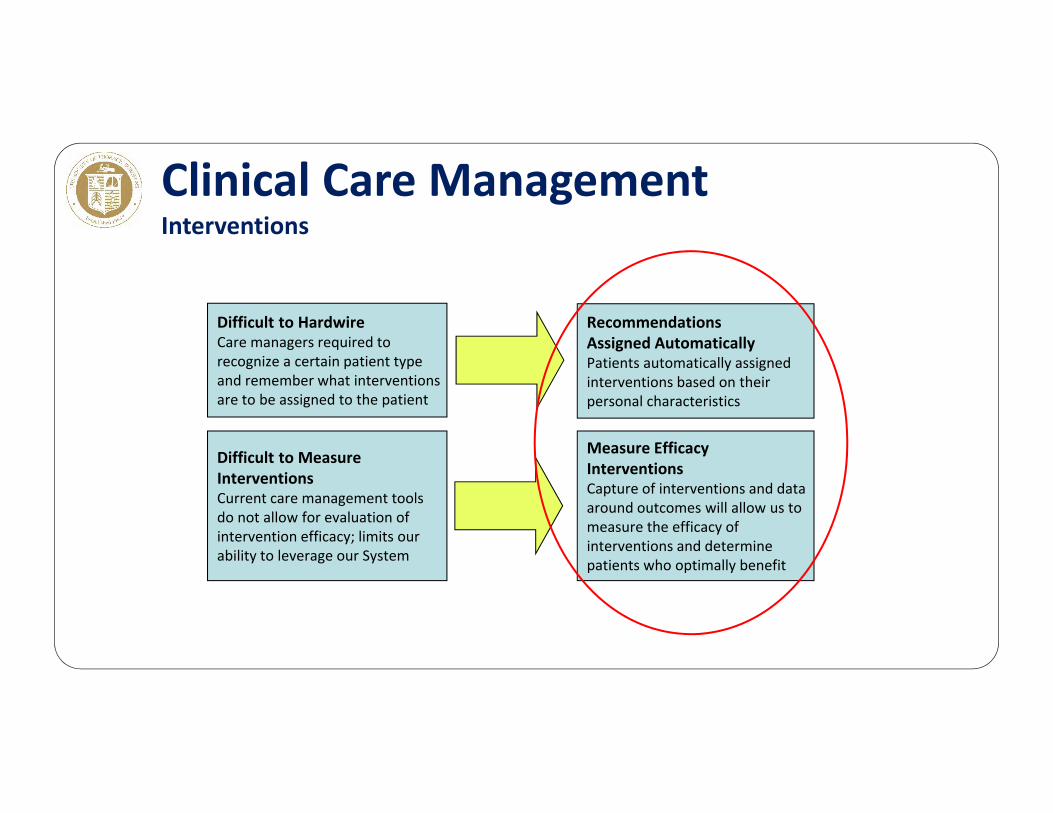
Clinical Care ManagementInterventions
Difficult to HardwireCare managers required to recognize a certain patient type and remember what interventions are to be assigned to the patient
Difficult to Measure InterventionsCurrent care management toolsdo not allow for evaluation of intervention efficacy; limits our ability to leverage our System
RecommendationsAssigned AutomaticallyPatients automatically assignedinterventions based on their personal characteristics
Measure Efficacy InterventionsCapture of interventions and dataaround outcomes will allow us to measure the efficacy of interventions and determine patients who optimally benefit
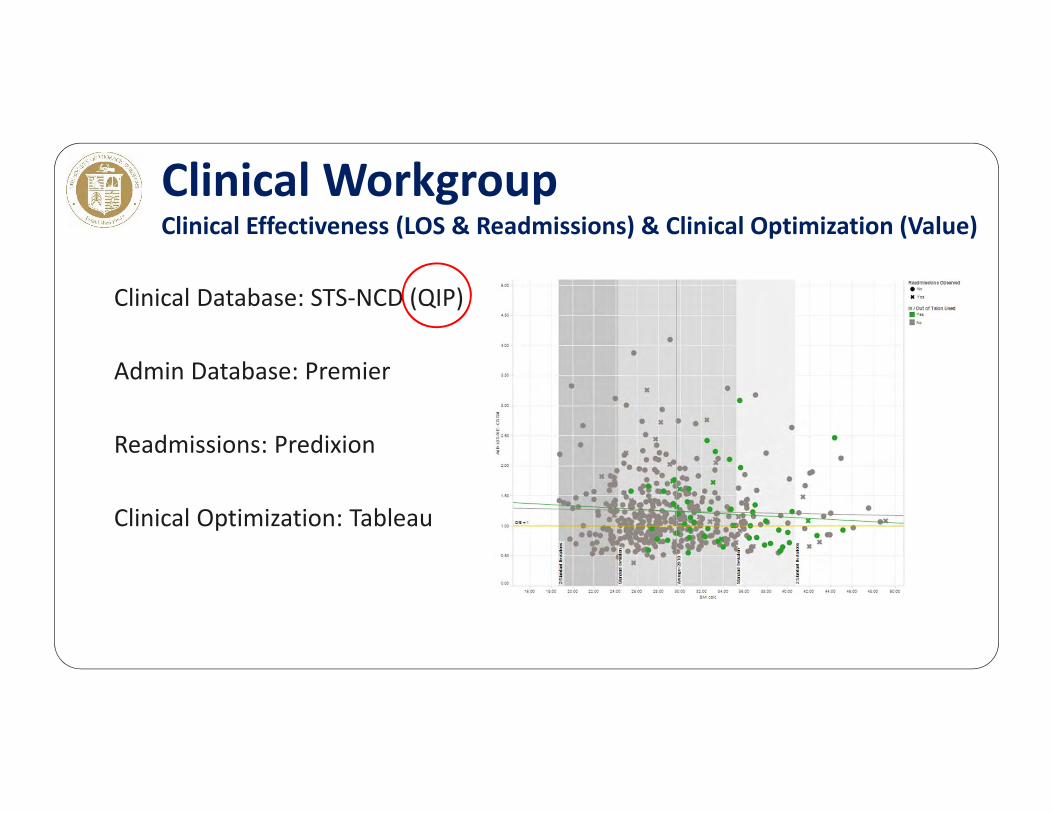
Clinical Database: STS‐NCD (QIP)
Admin Database: Premier
Readmissions: Predixion
Clinical Optimization: Tableau
Clinical WorkgroupClinical Effectiveness (LOS & Readmissions) & Clinical Optimization (Value)
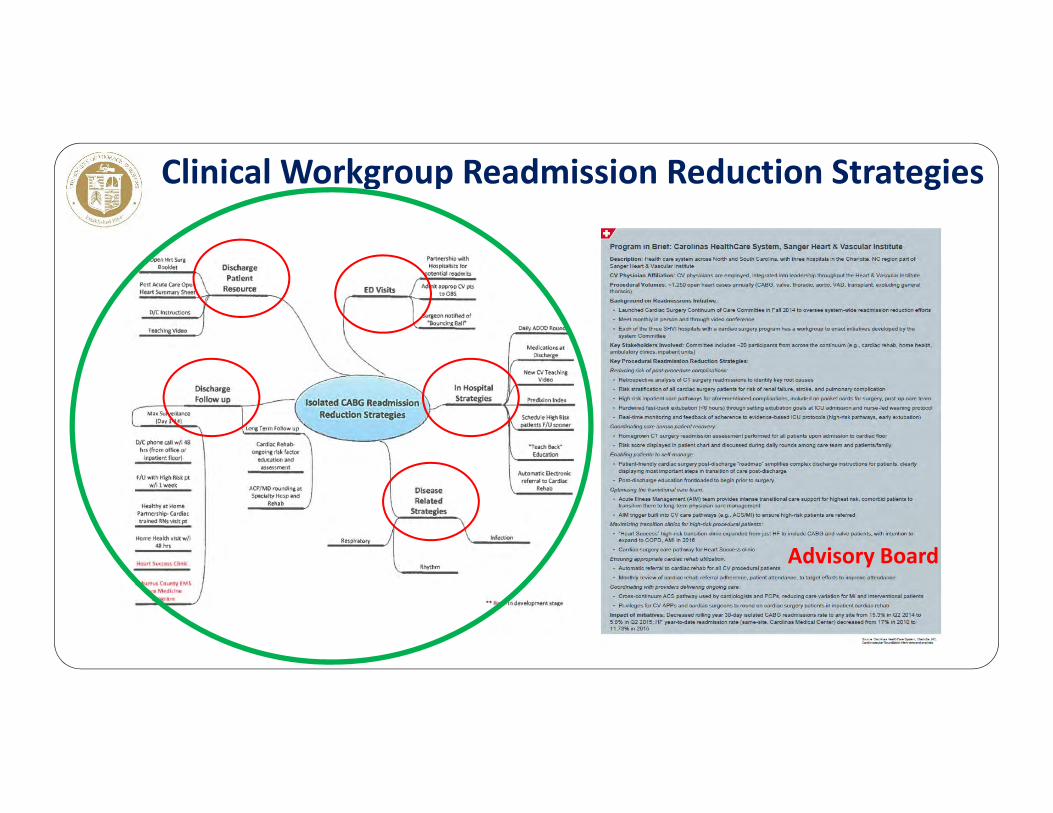
Clinical Workgroup Readmission Reduction Strategies
Advisory Board
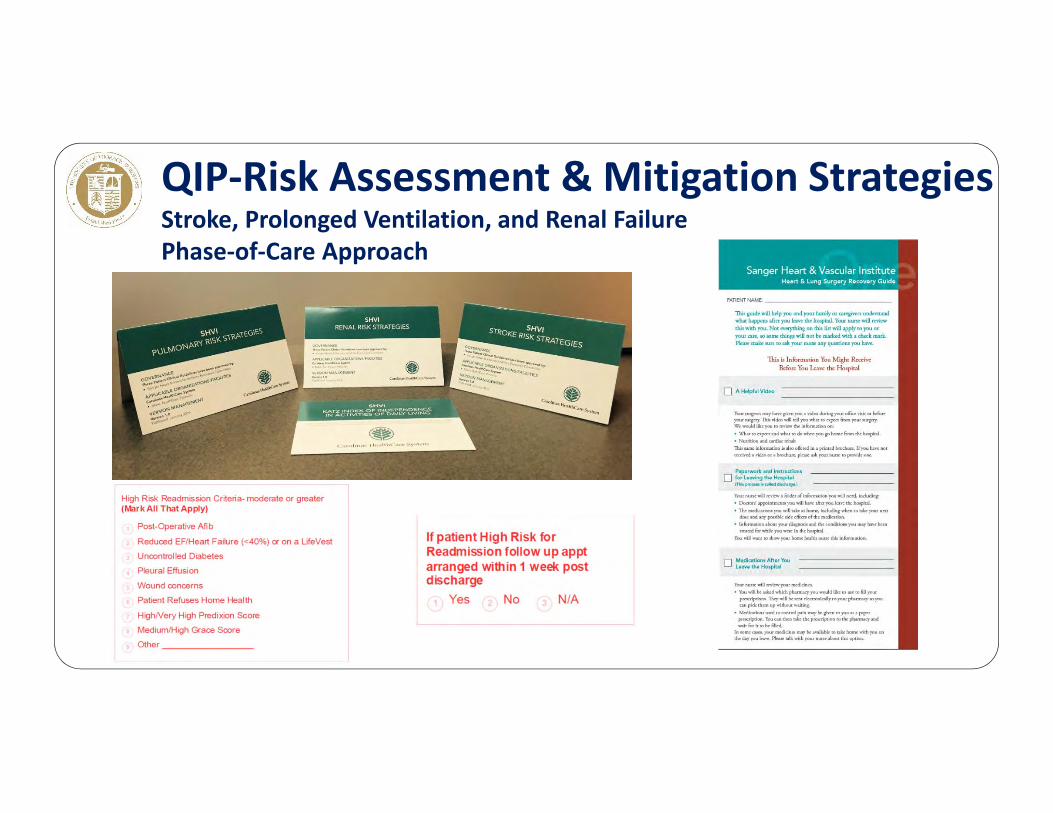
QIP‐Risk Assessment & Mitigation StrategiesStroke, Prolonged Ventilation, and Renal FailurePhase‐of‐Care Approach
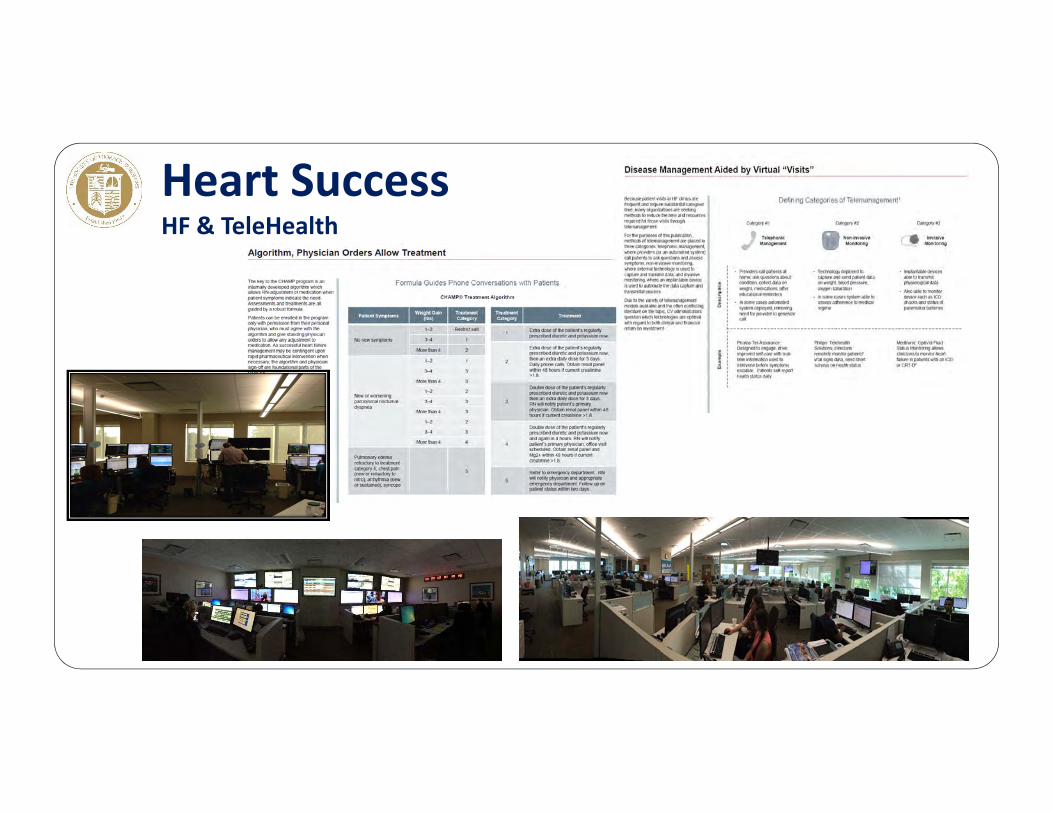
Heart SuccessHF & TeleHealth
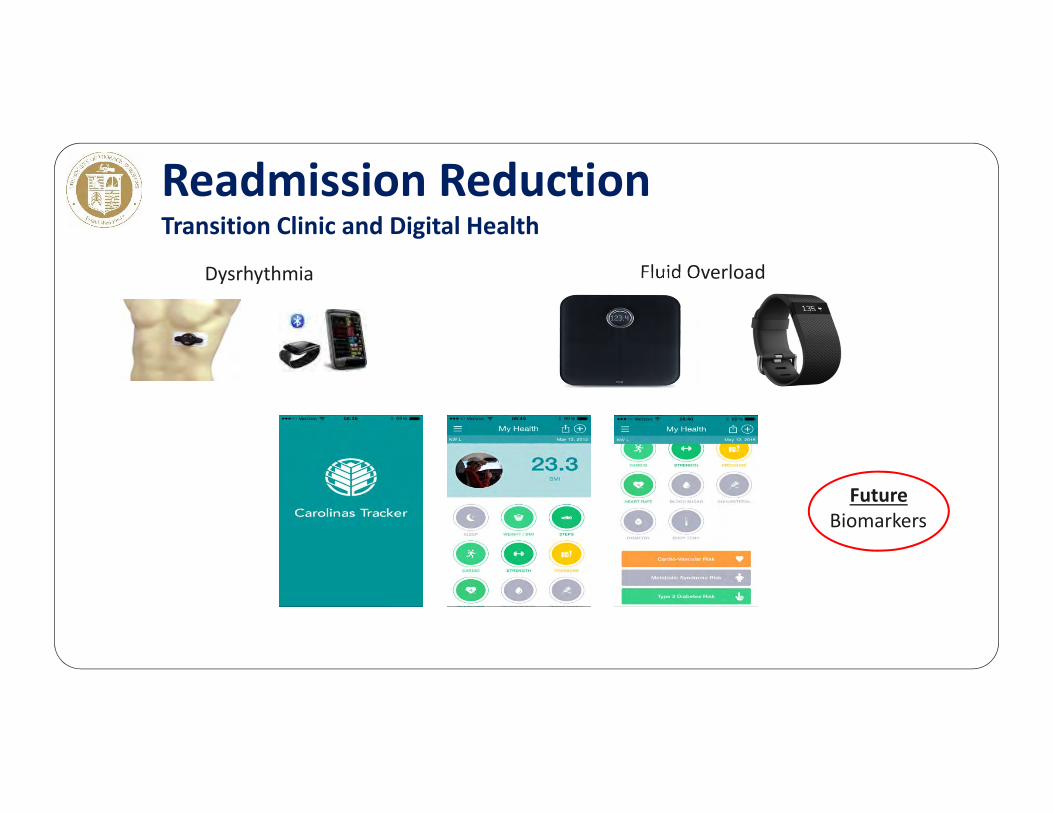
Readmission ReductionTransition Clinic and Digital Health
Dysrhythmia Fluid Overload
FutureBiomarkers

Clinical EffectivenessCAB‐only LOS
2015 CMC STS AveOp Mort % 1.8 2.2Major Morb % 10.2 12.2PV % 8.6 7.9
LOSMean d 6.6 6.9Median d 6.0 6.0Short <6d 41.6 46.8Readmission % 6.3 10
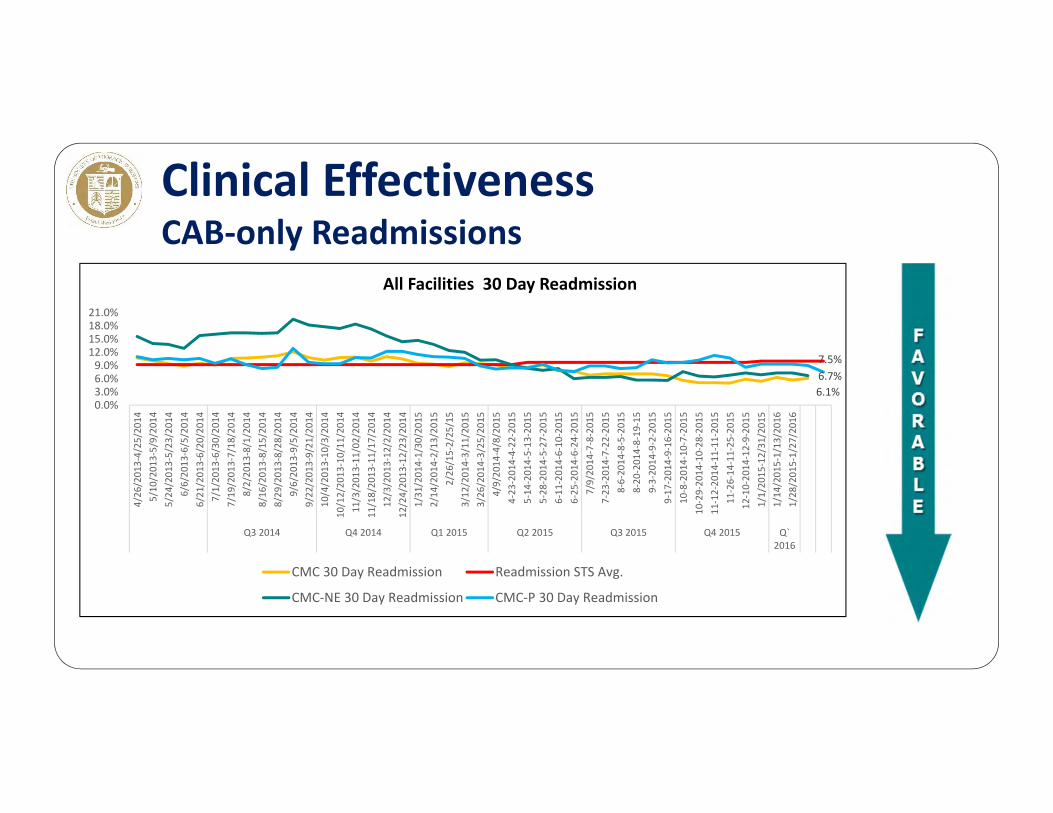
Clinical EffectivenessCAB‐only Readmissions
6.1%6.7%7.5%
0.0%3.0%6.0%9.0%
12.0%15.0%18.0%21.0%
4/26
/201
3‐4/25
/201
45/10
/201
3‐5/9/20
145/24
/201
3‐5/23
/201
46/6/20
13‐6/5/201
46/21
/201
3‐6/20
/201
47/1/20
13‐6/30/20
147/19
/201
3‐7/18
/201
48/2/20
13‐8/1/201
48/16
/201
3‐8/15
/201
48/29
/201
3‐8/28
/201
49/6/20
13‐9/5/201
49/22
/201
3‐9/21
/201
410
/4/201
3‐10
/3/201
410
/12/20
13‐10/11
/201
411
/3/201
3‐11
/02/20
1411
/18/20
13‐11/17
/201
412
/3/201
3‐12
/2/201
412
/24/20
13‐12/23
/201
41/31
/201
4‐1/30
/201
52/14
/201
4‐2/13
/201
52/26
/15‐2/25
/15
3/12
/201
4‐3/11
/201
53/26
/201
4‐3/25
/201
54/9/20
14‐4/8/201
54‐23
‐201
4‐4‐22
‐201
55‐14
‐201
4‐5‐13
‐201
55‐28
‐201
4‐5‐27
‐201
56‐11
‐201
4‐6‐10
‐201
56‐25
‐201
4‐6‐24
‐201
57/9/20
14‐7‐8‐201
57‐23
‐201
4‐7‐22
‐201
58‐6‐20
14‐8‐5‐201
58‐20
‐201
4‐8‐19
‐15
9‐3‐20
14‐9‐2‐201
59‐17
‐201
4‐9‐16
‐201
510
‐8‐201
4‐10
‐7‐201
510
‐29‐20
14‐10‐28
‐201
511
‐12‐20
14‐11‐11
‐201
511
‐26‐14
‐11‐25
‐201
512
‐10‐20
14‐12‐9‐20
151/1/20
15‐12/31
/201
51/14
/201
5‐1/13
/201
61/28
/201
5‐1/27
/201
6
Q3 2014 Q4 2014 Q1 2015 Q2 2015 Q3 2015 Q4 2015 Q`2016
All Facilities 30 Day Readmission
CMC 30 Day Readmission Readmission STS Avg.
CMC‐NE 30 Day Readmission CMC‐P 30 Day Readmission
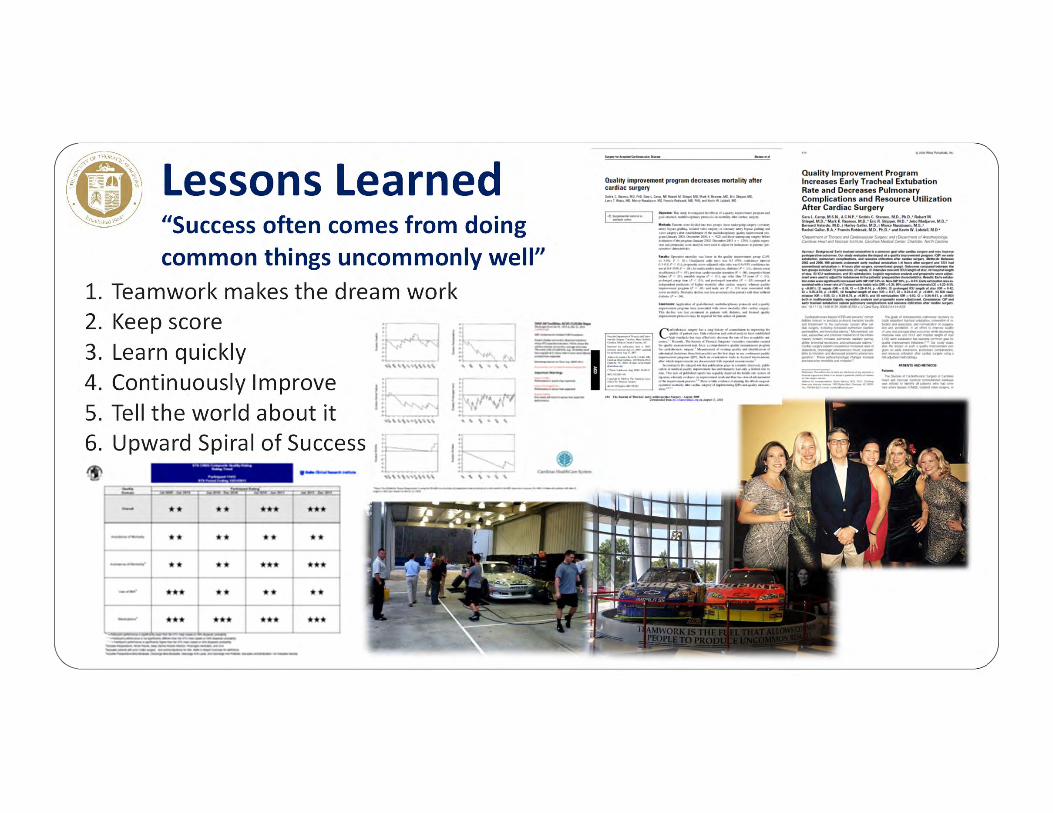
Lessons Learned“Success often comes from doing common things uncommonly well”
1. Teamwork makes the dream work2. Keep score3. Learn quickly4. Continuously Improve5. Tell the world about it6. Upward Spiral of Success
Reducing Readmission
William T. Caine, MD
Intermountain Heart InstituteCardiothoracic Surgery
Intermountain Medical Center

• None
Disclosures
• Current 30‐day readmission rate in the STS Adult Cardiac Surgery Database is ~10%
• Avoidable readmission is associated with• Opportunities to improve transition of care strategies• Significantly increased healthcare costs
• Readmission rates are increasingly scrutinized and reported, and will increasingly impact reimbursement
The Readmission Problem

Once again, reviewing our STS data helped us recognize an area where we
could improve our quality of care

CAB (2013‐H3)
• Multiple risk factors for Readmission have been outlined in the medical literature
• CMS has published a Readmission prediction model based on claims data, much of which isn't available until after patient discharge
• What can Intermountain’s STS patient data tell us about how to predict which patients are at highest risk for readmission?
How Can We Intervene to Prevent Readmission?
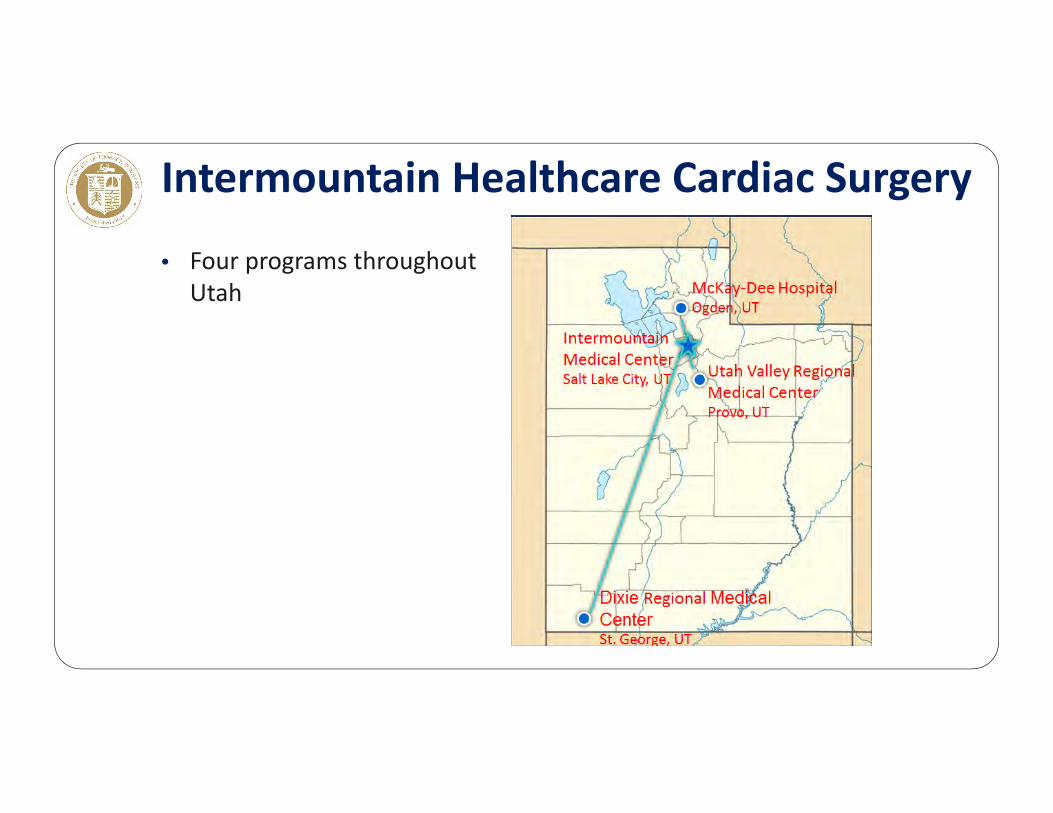
• Four programs throughout Utah
Intermountain Healthcare Cardiac Surgery
• Study patient population:• 1,607 patients who underwent isolated coronary artery bypass surgery
• Includes patients operated at all four of Intermountain's cardiac surgical hospitals
• Data set• All STS database v. 2.73 registered patients• 59 easily obtainable pre‐operative data elements were analyzed.
Intermountain Readmission Data
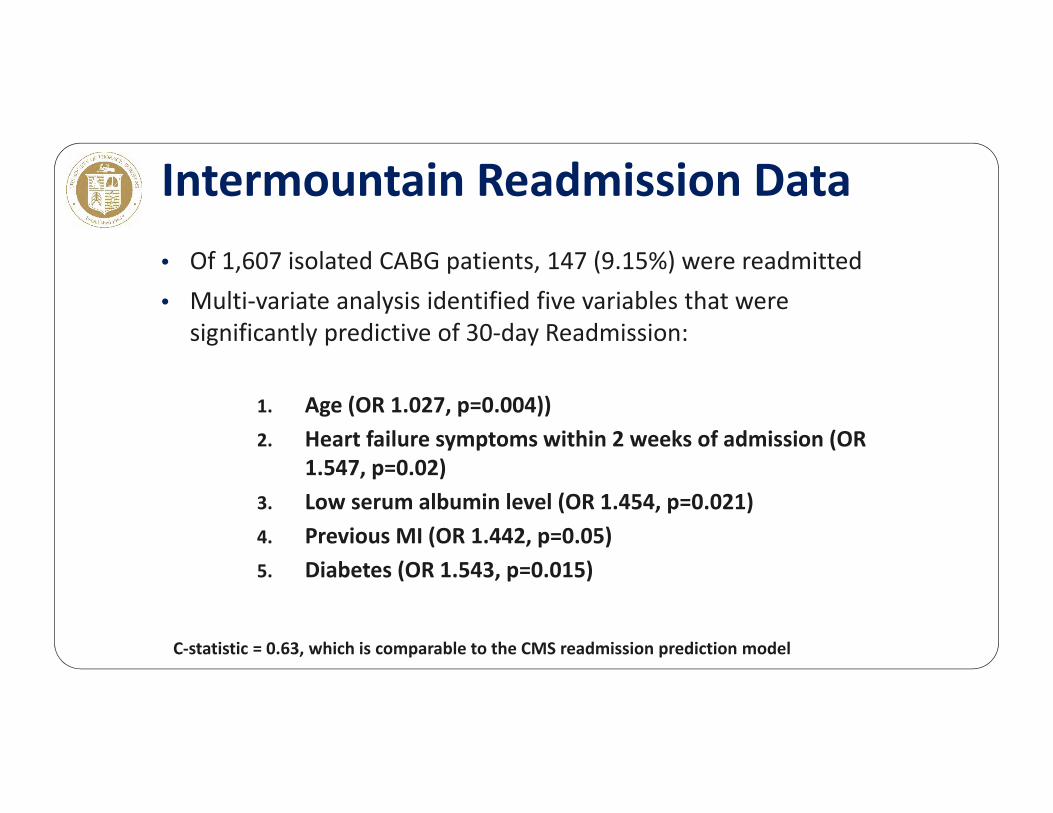
• Of 1,607 isolated CABG patients, 147 (9.15%) were readmitted• Multi‐variate analysis identified five variables that were
significantly predictive of 30‐day Readmission:
1. Age (OR 1.027, p=0.004))2. Heart failure symptoms within 2 weeks of admission (OR
1.547, p=0.02)3. Low serum albumin level (OR 1.454, p=0.021)4. Previous MI (OR 1.442, p=0.05)5. Diabetes (OR 1.543, p=0.015)
C‐statistic = 0.63, which is comparable to the CMS readmission prediction model
Intermountain Readmission Data
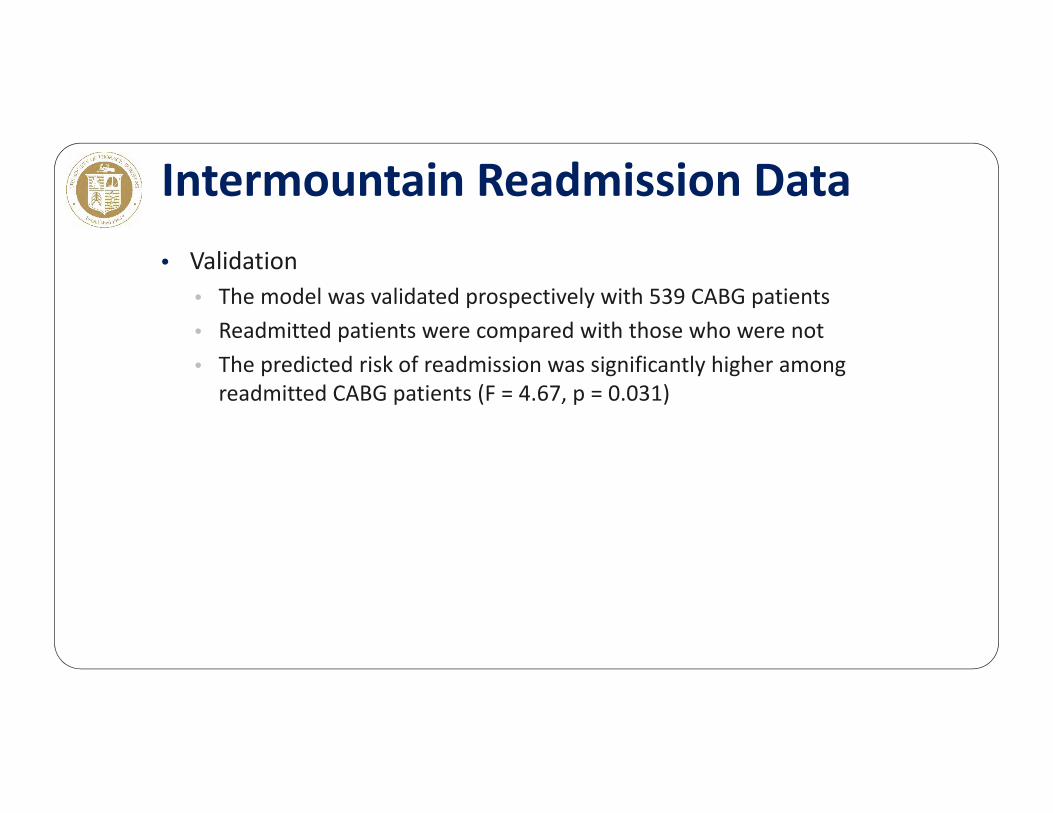
• Validation• The model was validated prospectively with 539 CABG patients• Readmitted patients were compared with those who were not• The predicted risk of readmission was significantly higher among readmitted CABG patients (F = 4.67, p = 0.031)
Intermountain Readmission Data

What do we now do with these data?

The Key to Success of all Quality Improvement Initiatives:
A Multi‐disciplinary MonthlyProcess Improvement Meeting
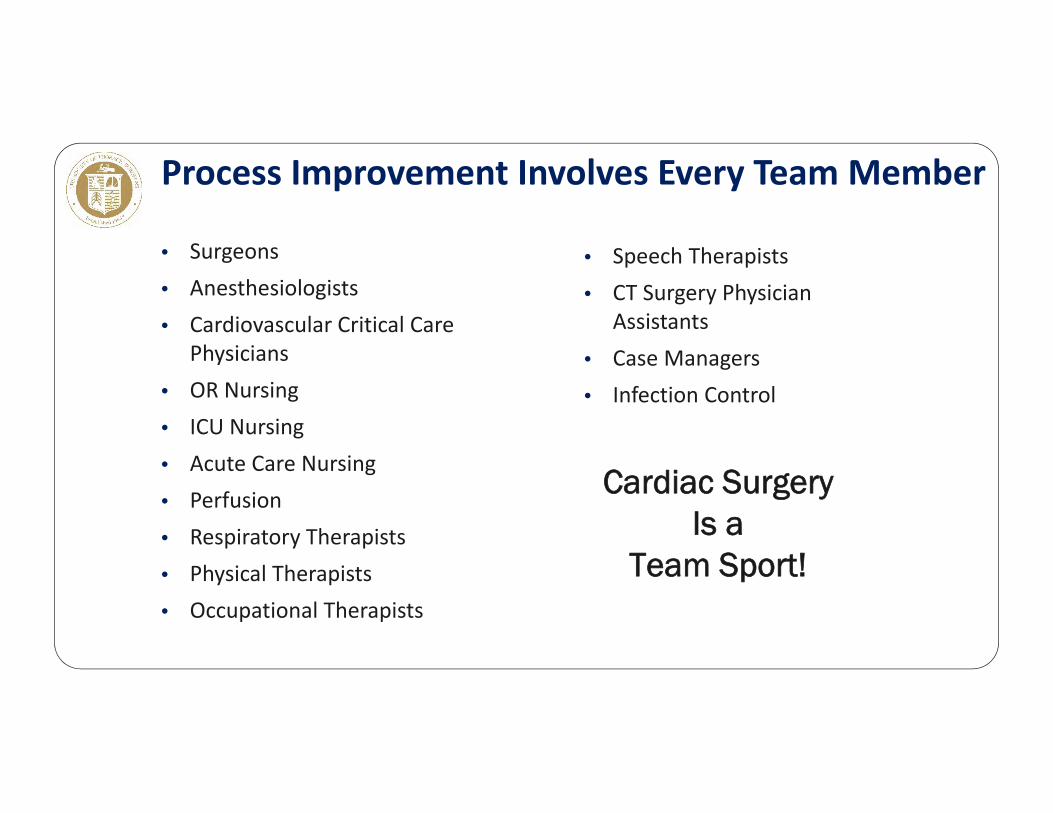
• Surgeons• Anesthesiologists• Cardiovascular Critical Care
Physicians• OR Nursing• ICU Nursing• Acute Care Nursing• Perfusion• Respiratory Therapists• Physical Therapists• Occupational Therapists
Process Improvement Involves Every Team Member
Cardiac Surgery Is a
Team Sport!
• Speech Therapists• CT Surgery Physician
Assistants• Case Managers• Infection Control
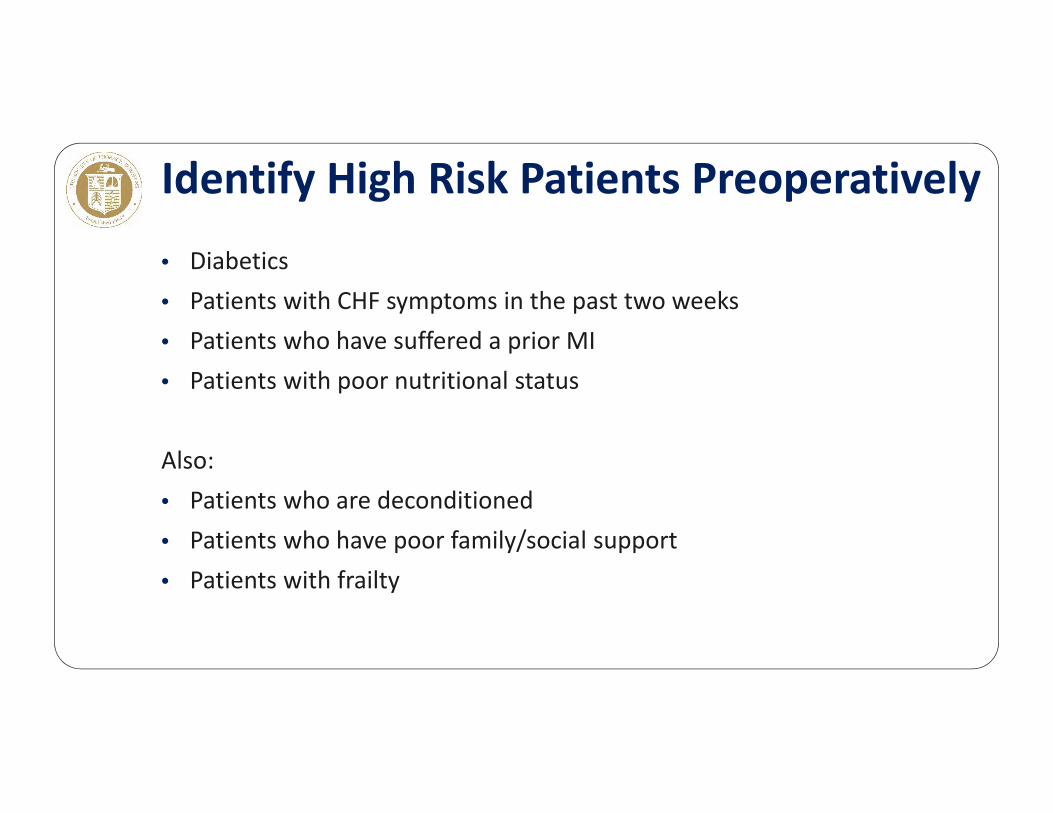
• Diabetics• Patients with CHF symptoms in the past two weeks• Patients who have suffered a prior MI• Patients with poor nutritional status
Also:• Patients who are deconditioned• Patients who have poor family/social support• Patients with frailty
Identify High Risk Patients Preoperatively
• The rest of the hospitalization should be spent preventing readmission.• Discharge needs are reassessed throughout the hospital stay• All caregivers focus on ensuring safe transitions of care• APCs are empowered to arrange early follow‐up in high risk patients which may include:• Early telephone calls to patients following discharge• Home health nursing visits• Early clinic follow‐up visits
• CV surgeon is contacted for all post‐discharge ED visits
Preoperative Identification Is Only The First Step
• Clear list of diagnoses• List of medications• Follow‐up phone numbers• Follow‐up office visits with
• Primary Care Provider• Cardiologist• Cardiac Surgeon
Detailed, Clear Instructions at Discharge

• Visit patients after discharge within 3 – 4 days
• Review medications• Watch for common problems
• Volume overload• Arrhythmias• Infections
• Have a clear point of contact when problems are identified
Home Health Visits

• Must be used with care• Recent studies suggest patients discharged to a Skilled Nursing
Facility are >50% more likely to require readmission• Intermountain has a new pilot program to work with SNFs to
recognize problems early and reduce readmissions
Skilled Nursing Facilities
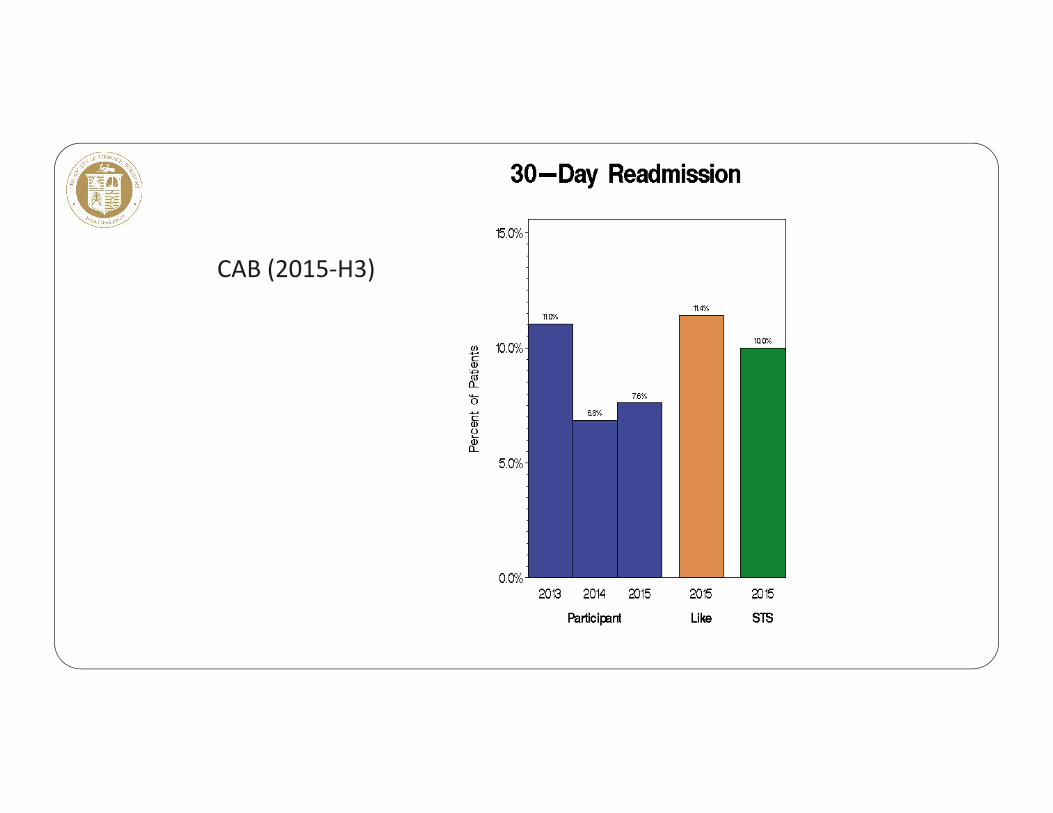
CAB (2015‐H3)
Please direct questions, comments and feedback to Sydney Clinton, STS Quality Metrics & Initiatives
Coordinator, at [email protected].
Questions

Thank you for viewing the STS Readmission after CABG Webinar.
Please note that webinar slides and other materials are posted on the STS website.


![[PPT]PowerPoint Presentation - ACDIS here to... · Web viewAMI HF Pneumonia COPD Stroke CABG HRRP Timeline: Claims-based Quality Measures THA/TKA 30- DAY MORTALITY 30-DAY READMISSION](https://img.pdfslide.us/doc/110x75/5b2c812f7f8b9abe2a8c0f5c/pptpowerpoint-presentation-acdis-here-to-web-viewami-hf-pneumonia-copd.jpg)