Embed Size (px)
Citation preview
#ULIFall13
Structuring the Deal
to be Profitable
Fundamental Skills for
Real Estate Development
Professionals II
#ULIFall13
Goals
• Overview of Development Financing
• Review Basic Financing Mechanisms
– Senior Debt
– Institutional Equity
– Mezzanine Debt
• No Answers (or at least very few), but
Groundwork for Financing a Successful Project
#ULIFall13
Agenda
• Define Success
• Recap Basics of Finance
• Sample Development
– Rental w/Equity Partner
– Condo w/Equity Partner
– Condo w/Mezzanine Debt
• Wrap-Up
#ULIFall13
Defining Success
• Different Goals for Different Projects
– Unentitled land
– New construction
– Re-development of existing property
– Build-to-suit
– Stabilized property
• Different Risks for Different Projects
– Market risk
– Construction risk
– Entitlement Risk
#ULIFall13
Defining Success
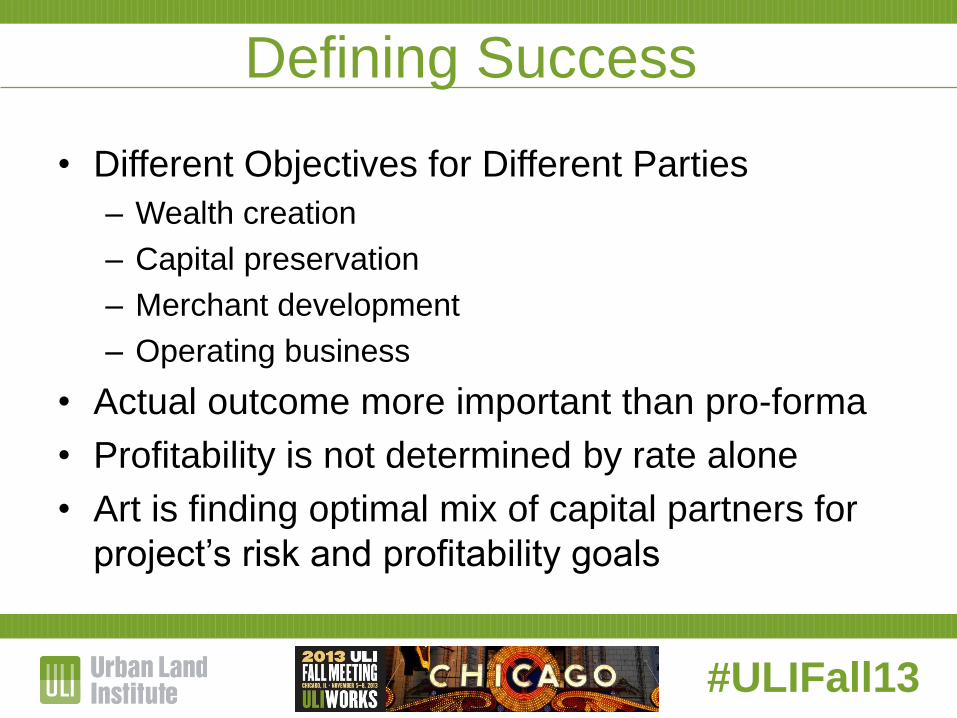
• Different Objectives for Different Parties
– Wealth creation
– Capital preservation
– Merchant development
– Operating business
• Actual outcome more important than pro-forma
• Profitability is not determined by rate alone
• Art is finding optimal mix of capital partners for
project’s risk and profitability goals
#ULIFall13
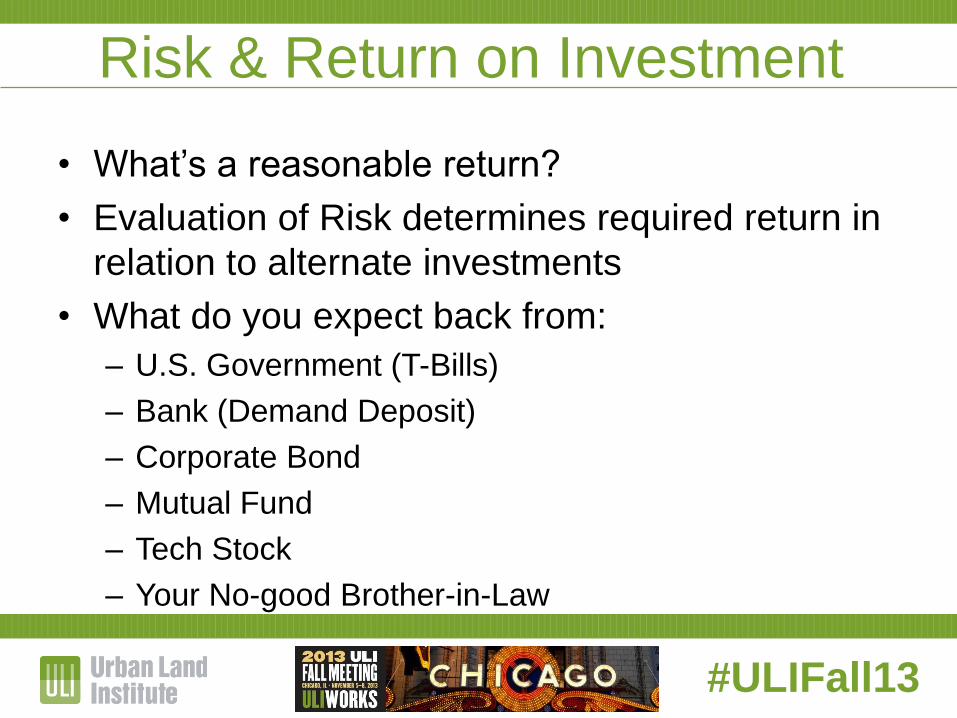
Risk & Return on Investment
• What’s a reasonable return?
• Evaluation of Risk determines required return in
relation to alternate investments
• What do you expect back from:
– U.S. Government (T-Bills)
– Bank (Demand Deposit)
– Corporate Bond
– Mutual Fund
– Tech Stock
– Your No-good Brother-in-Law
#ULIFall13
FINANCE BASICS RECAP
#ULIFall13
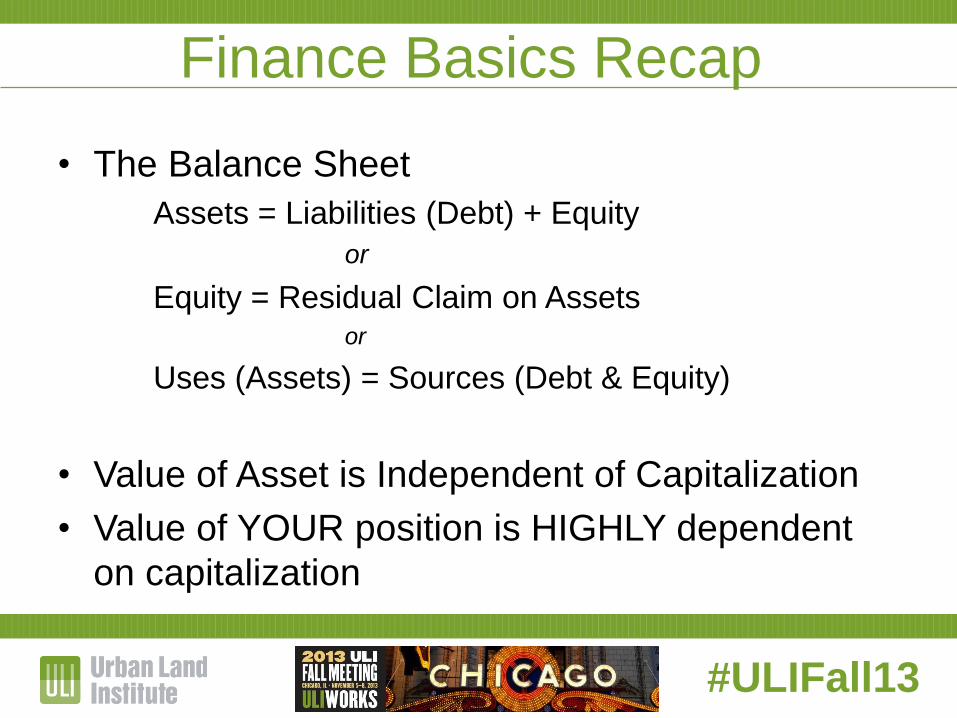
Finance Basics Recap
• The Balance Sheet
Assets = Liabilities (Debt) + Equity
or
Equity = Residual Claim on Assets or
Uses (Assets) = Sources (Debt & Equity)
• Value of Asset is Independent of Capitalization
• Value of YOUR position is HIGHLY dependent
on capitalization
#ULIFall13
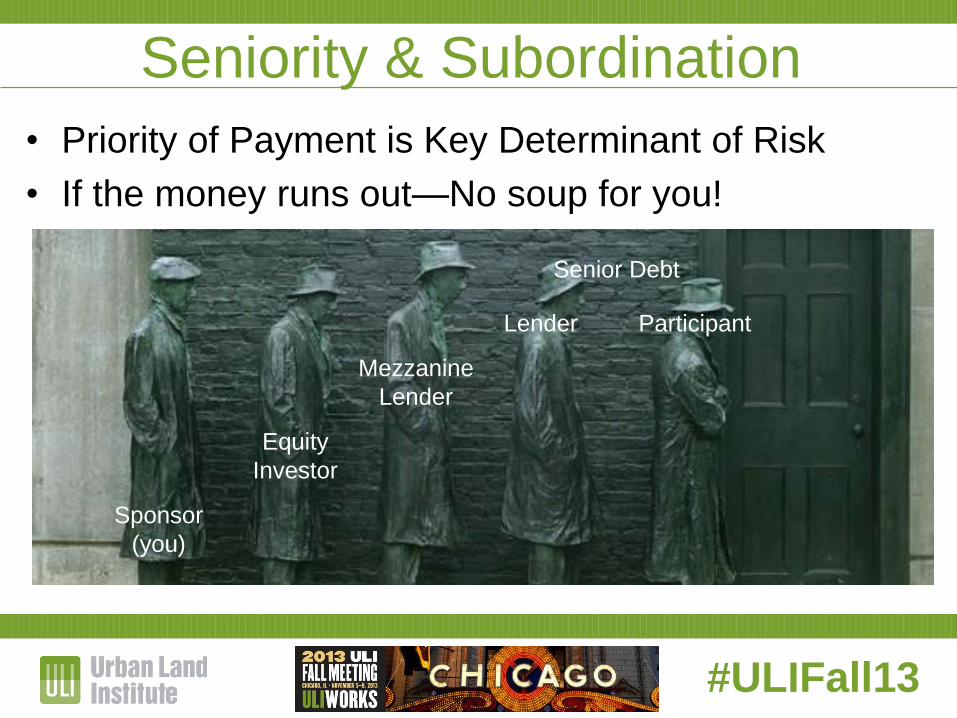
Seniority & Subordination
• Priority of Payment is Key Determinant of Risk
• If the money runs out—No soup for you!
Senior Debt
Lender Participant
Mezzanine
Lender
Equity
Investor
Sponsor
(you)
#ULIFall13
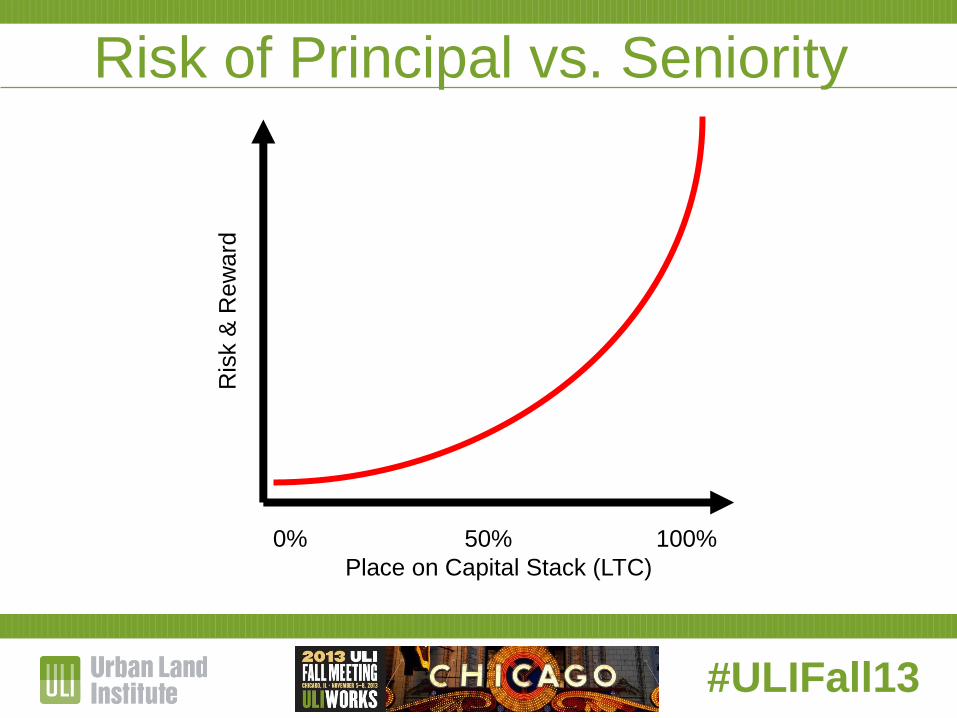
Risk of Principal vs. Seniority
0% 50% 100%
Place on Capital Stack (LTC)
Ris
k &
Rew
ard
#ULIFall13
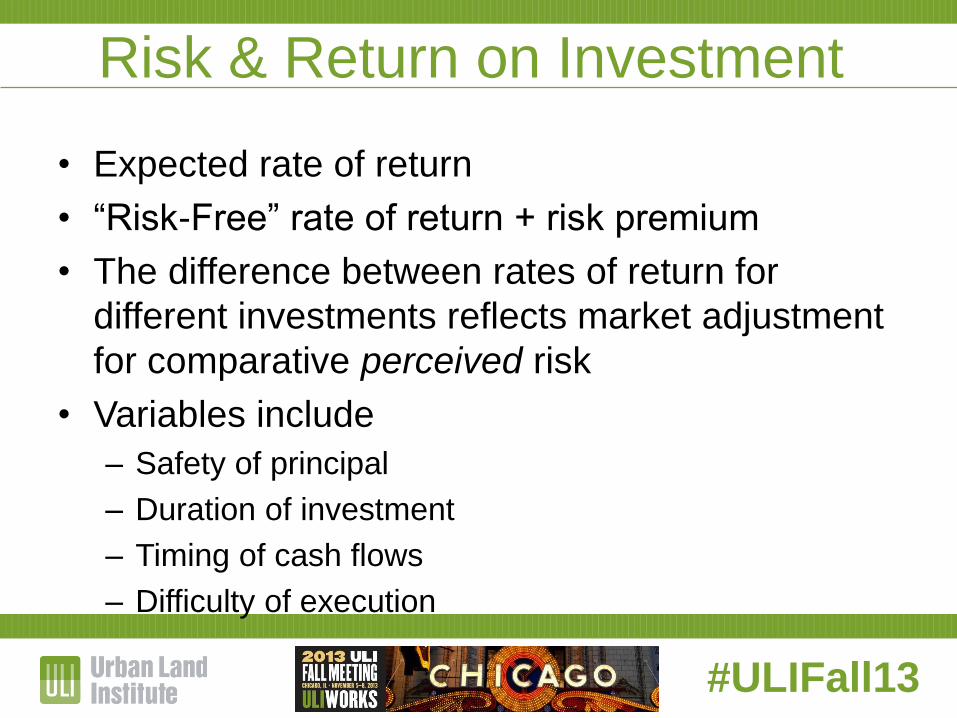
Risk & Return on Investment
• Expected rate of return
• “Risk-Free” rate of return + risk premium
• The difference between rates of return for
different investments reflects market adjustment
for comparative perceived risk
• Variables include
– Safety of principal
– Duration of investment
– Timing of cash flows
– Difficulty of execution
#ULIFall13
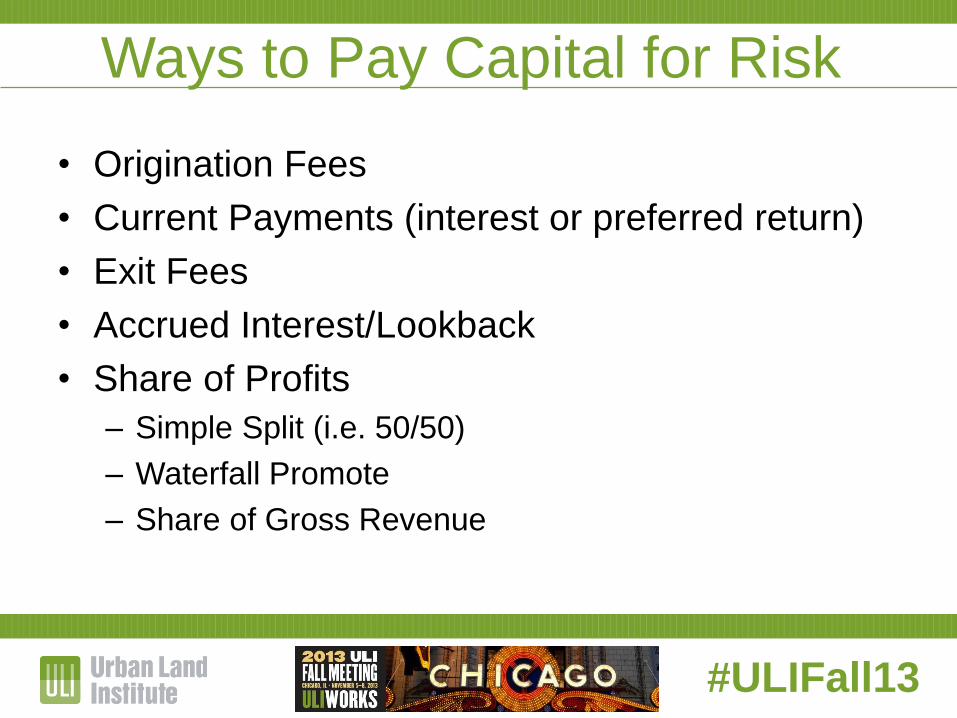
Ways to Pay Capital for Risk
• Origination Fees
• Current Payments (interest or preferred return)
• Exit Fees
• Accrued Interest/Lookback
• Share of Profits
– Simple Split (i.e. 50/50)
– Waterfall Promote
– Share of Gross Revenue
#ULIFall13
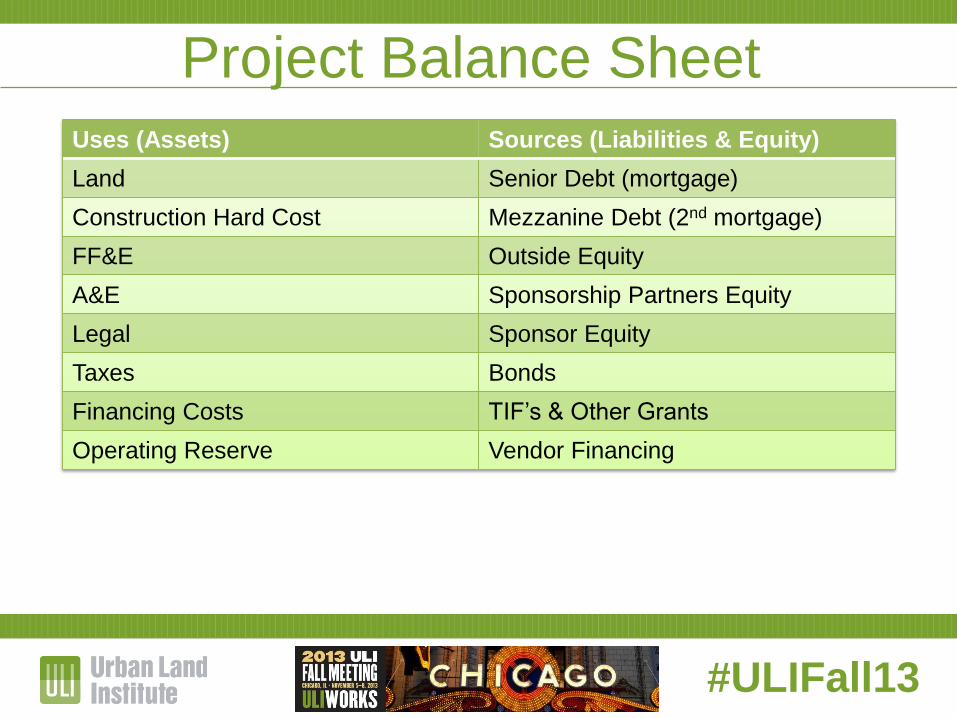
Project Balance Sheet
Uses (Assets) Sources (Liabilities & Equity)
Land Senior Debt (mortgage)
Construction Hard Cost Mezzanine Debt (2nd mortgage)
FF&E Outside Equity
A&E Sponsorship Partners Equity
Legal Sponsor Equity
Taxes Bonds
Financing Costs TIF’s & Other Grants
Operating Reserve Vendor Financing

#ULIFall13
SAMPLE PROJECT
Residential Rental
Debt & Equity
#ULIFall13
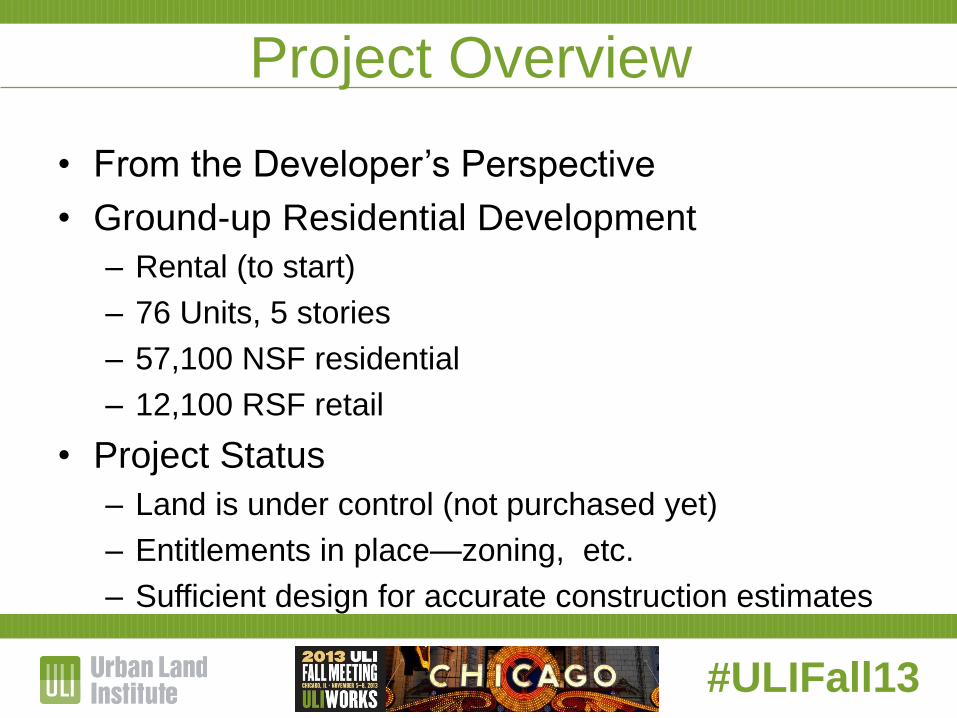
Project Overview
• From the Developer’s Perspective
• Ground-up Residential Development
– Rental (to start)
– 76 Units, 5 stories
– 57,100 NSF residential
– 12,100 RSF retail
• Project Status
– Land is under control (not purchased yet)
– Entitlements in place—zoning, etc.
– Sufficient design for accurate construction estimates
#ULIFall13
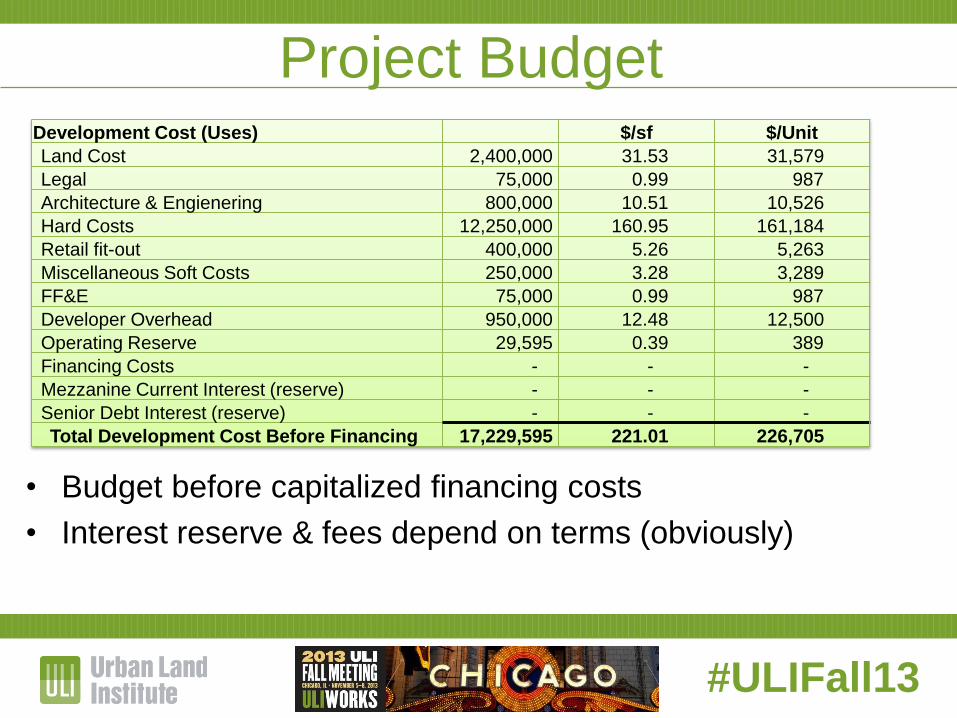
Project Budget
• Budget before capitalized financing costs
• Interest reserve & fees depend on terms (obviously)
Development Cost (Uses) $/sf $/Unit
Land Cost 2,400,000 31.53 31,579
Legal 75,000 0.99 987
Architecture & Engienering 800,000 10.51 10,526
Hard Costs 12,250,000 160.95 161,184
Retail fit-out 400,000 5.26 5,263
Miscellaneous Soft Costs 250,000 3.28 3,289
FF&E 75,000 0.99 987
Developer Overhead 950,000 12.48 12,500
Operating Reserve 29,595 0.39 389
Financing Costs - - -
Mezzanine Current Interest (reserve) - - -
Senior Debt Interest (reserve) - - -
Total Development Cost Before Financing 17,229,595 221.01 226,705
#ULIFall13
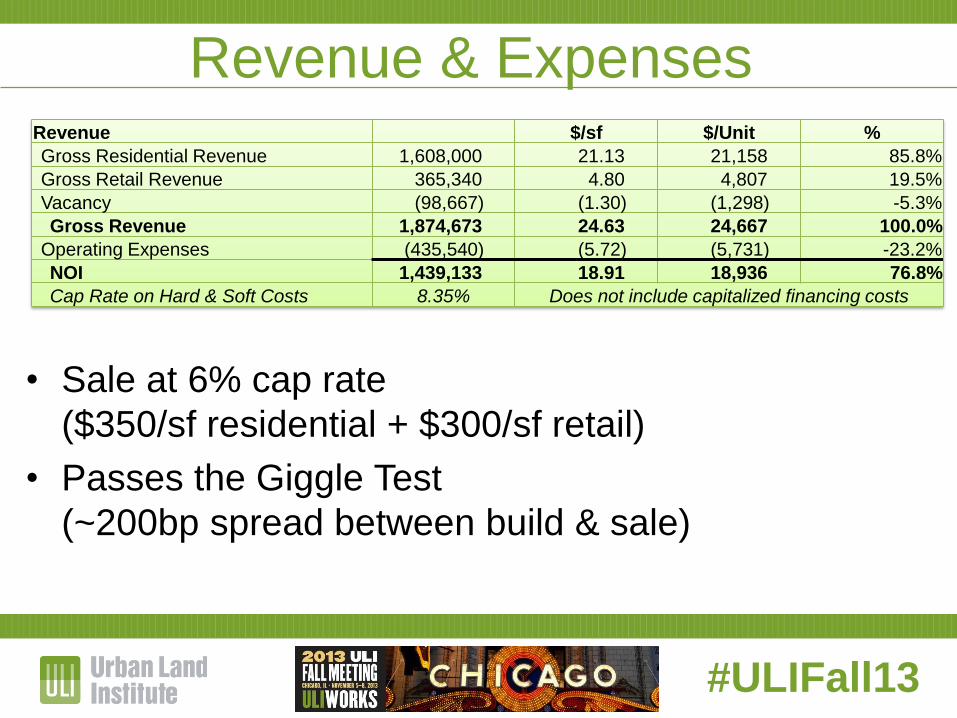
Revenue & Expenses
• Sale at 6% cap rate
($350/sf residential + $300/sf retail)
• Passes the Giggle Test
(~200bp spread between build & sale)
Revenue $/sf $/Unit %
Gross Residential Revenue 1,608,000 21.13 21,158 85.8%
Gross Retail Revenue 365,340 4.80 4,807 19.5%
Vacancy (98,667) (1.30) (1,298) -5.3%
Gross Revenue 1,874,673 24.63 24,667 100.0%
Operating Expenses (435,540) (5.72) (5,731) -23.2%
NOI 1,439,133 18.91 18,936 76.8%
Cap Rate on Hard & Soft Costs 8.35% Does not include capitalized financing costs
#ULIFall13
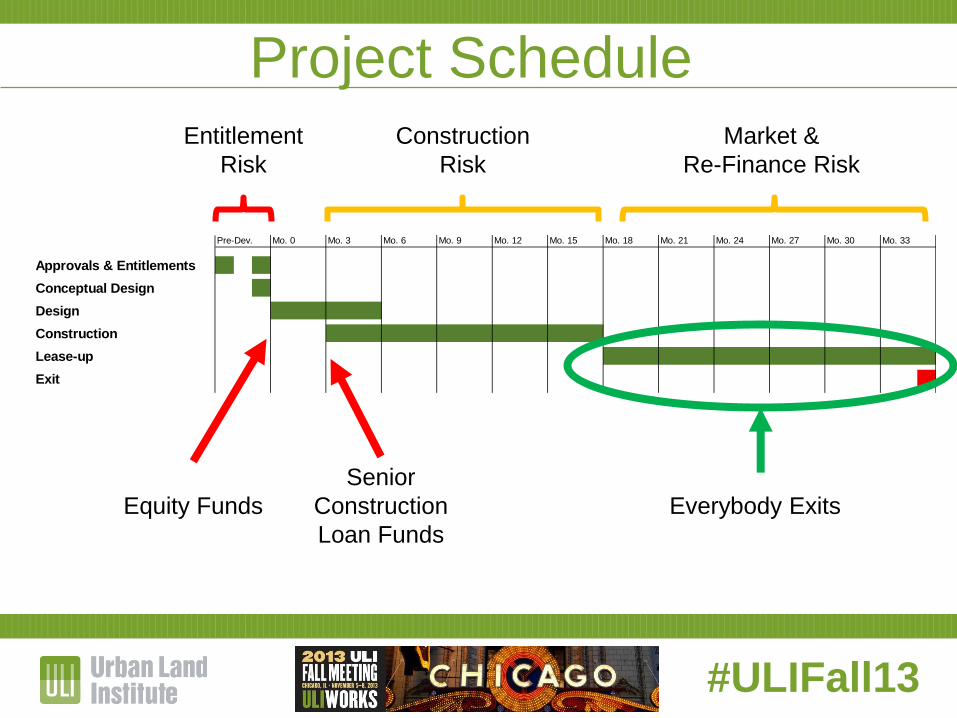
Project Schedule
• Schedule
– 3 months pre-construction
– 15 months construction
– 18 month lease-up
– Sale at lease-up
#ULIFall13
Project Schedule
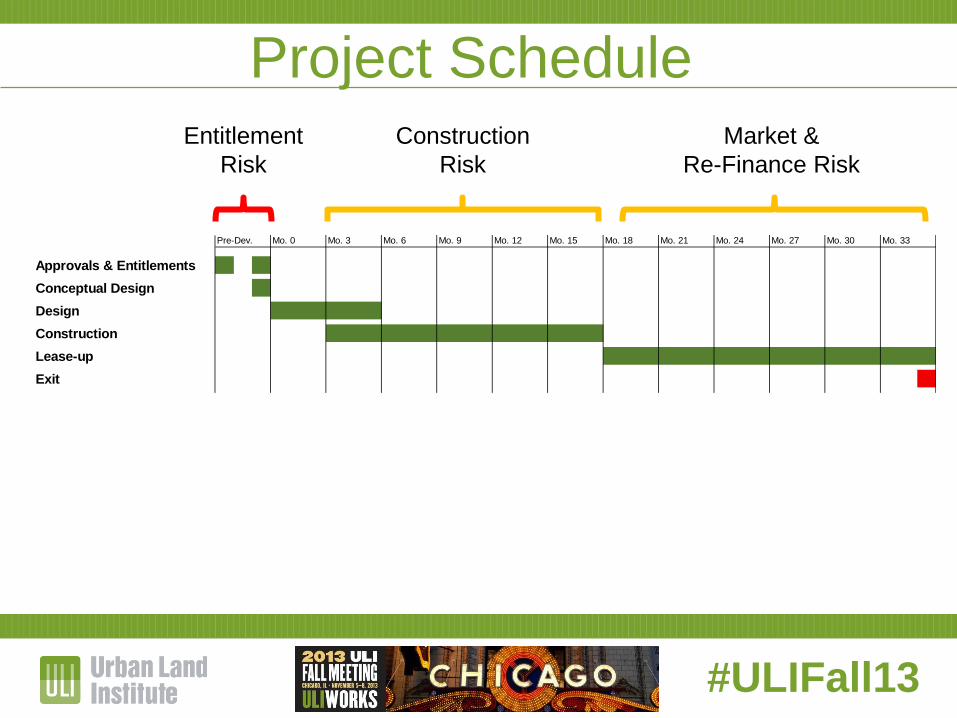
Pre-Dev. Mo. 3 Mo. 9 Mo. 15 Mo. 21 Mo. 27 Mo. 33
Approvals & Entitlements 1 1
Conceptual Design 1
Design 1 1 1 1 1 1
Construction 1 1 1 1 1 1 1 1 1 1 1 1 1 1 1
Lease-up 1 1 1 1 1 1 1 1 1 1 1 1 1 1 1 1 1 1
Exit 3
Mo. 12 Mo. 24 Mo. 30Mo. 18Mo. 0 Mo. 6
Entitlement
Risk
Construction
Risk
Market &
Re-Finance Risk
#ULIFall13
Senior Construction Debt
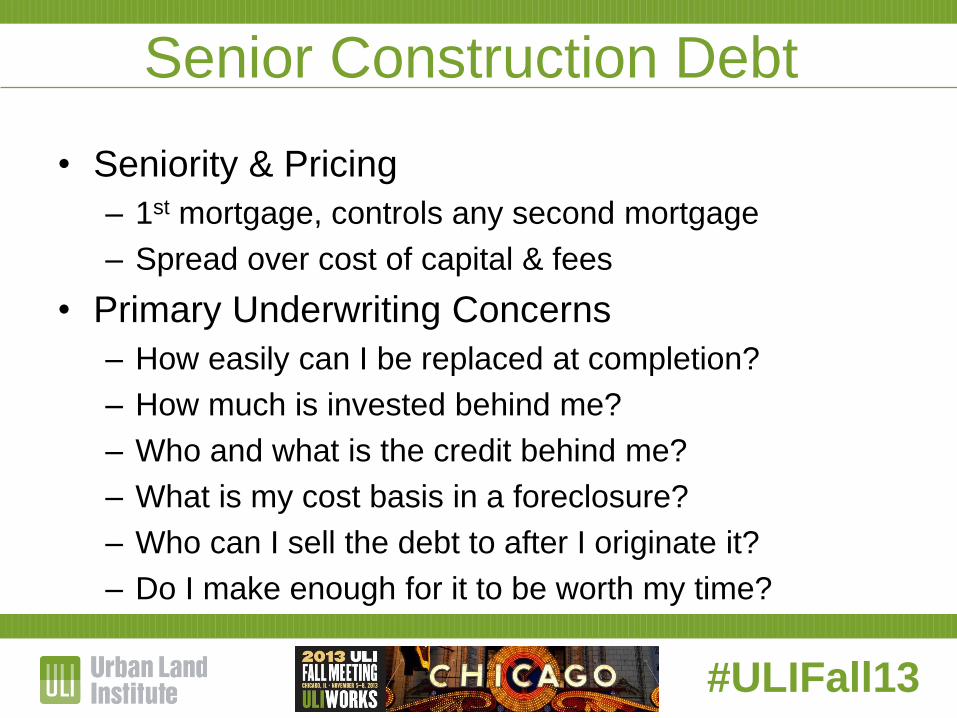
• Seniority & Pricing
– 1st mortgage, controls any second mortgage
– Spread over cost of capital & fees
• Primary Underwriting Concerns
– How easily can I be replaced at completion?
– How much is invested behind me?
– Who and what is the credit behind me?
– What is my cost basis in a foreclosure?
– Who can I sell the debt to after I originate it?
– Do I make enough for it to be worth my time?
#ULIFall13
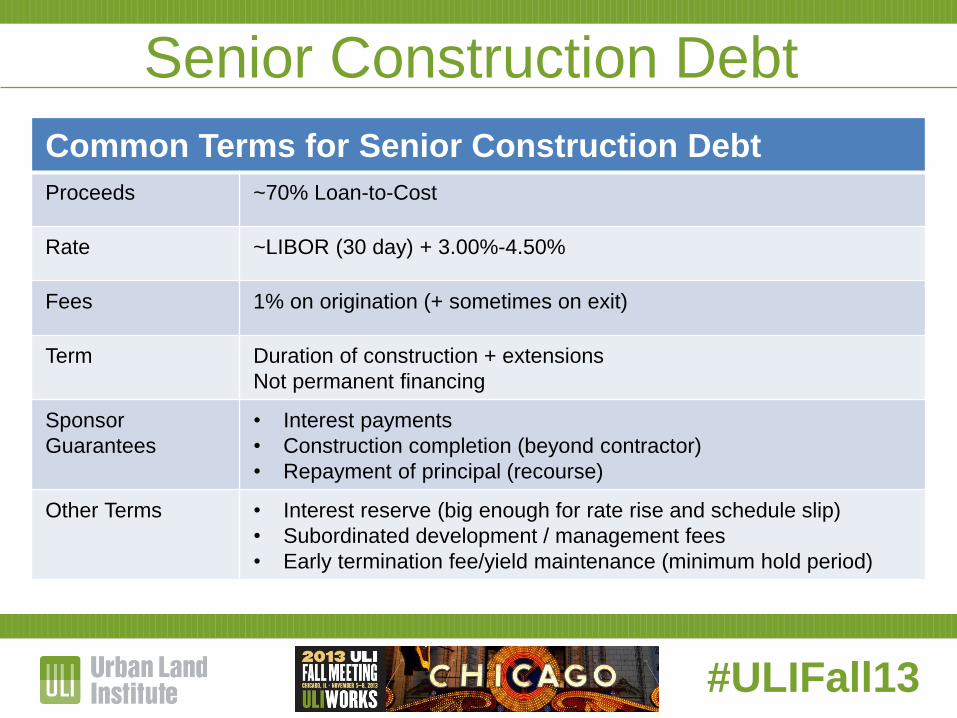
Common Terms for Senior Construction Debt
Proceeds ~70% Loan-to-Cost
Rate ~LIBOR (30 day) + 3.00%-4.50%
Fees 1% on origination (+ sometimes on exit)
Term Duration of construction + extensions
Not permanent financing
Sponsor
Guarantees
• Interest payments
• Construction completion (beyond contractor)
• Repayment of principal (recourse)
Other Terms • Interest reserve (big enough for rate rise and schedule slip)
• Subordinated development / management fees
• Early termination fee/yield maintenance (minimum hold period)
Senior Construction Debt
#ULIFall13
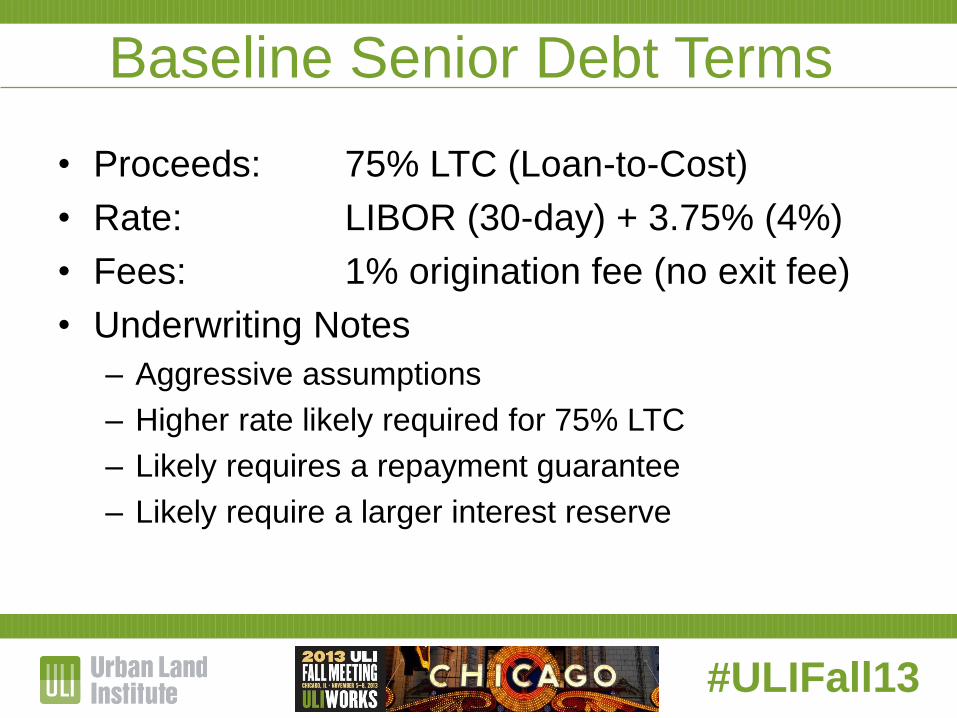
Baseline Senior Debt Terms
• Proceeds: 75% LTC (Loan-to-Cost)
• Rate: LIBOR (30-day) + 3.75% (4%)
• Fees: 1% origination fee (no exit fee)
• Underwriting Notes
– Aggressive assumptions
– Higher rate likely required for 75% LTC
– Likely requires a repayment guarantee
– Likely require a larger interest reserve
#ULIFall13
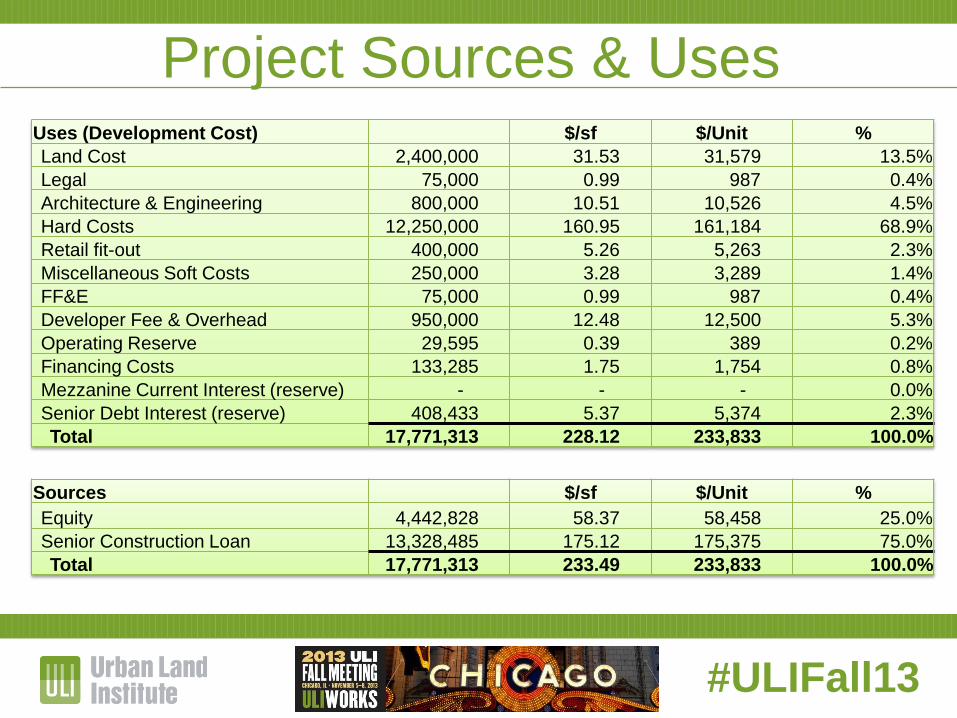
Project Sources & Uses
Sources $/sf $/Unit %
Equity 4,442,828 58.37 58,458 25.0%
Senior Construction Loan 13,328,485 175.12 175,375 75.0%
Total 17,771,313 233.49 233,833 100.0%
Uses (Development Cost) $/sf $/Unit %
Land Cost 2,400,000 31.53 31,579 13.5%
Legal 75,000 0.99 987 0.4%
Architecture & Engineering 800,000 10.51 10,526 4.5%
Hard Costs 12,250,000 160.95 161,184 68.9%
Retail fit-out 400,000 5.26 5,263 2.3%
Miscellaneous Soft Costs 250,000 3.28 3,289 1.4%
FF&E 75,000 0.99 987 0.4%
Developer Fee & Overhead 950,000 12.48 12,500 5.3%
Operating Reserve 29,595 0.39 389 0.2%
Financing Costs 133,285 1.75 1,754 0.8%
Mezzanine Current Interest (reserve) - - - 0.0%
Senior Debt Interest (reserve) 408,433 5.37 5,374 2.3%
Total 17,771,313 228.12 233,833 100.0%
#ULIFall13
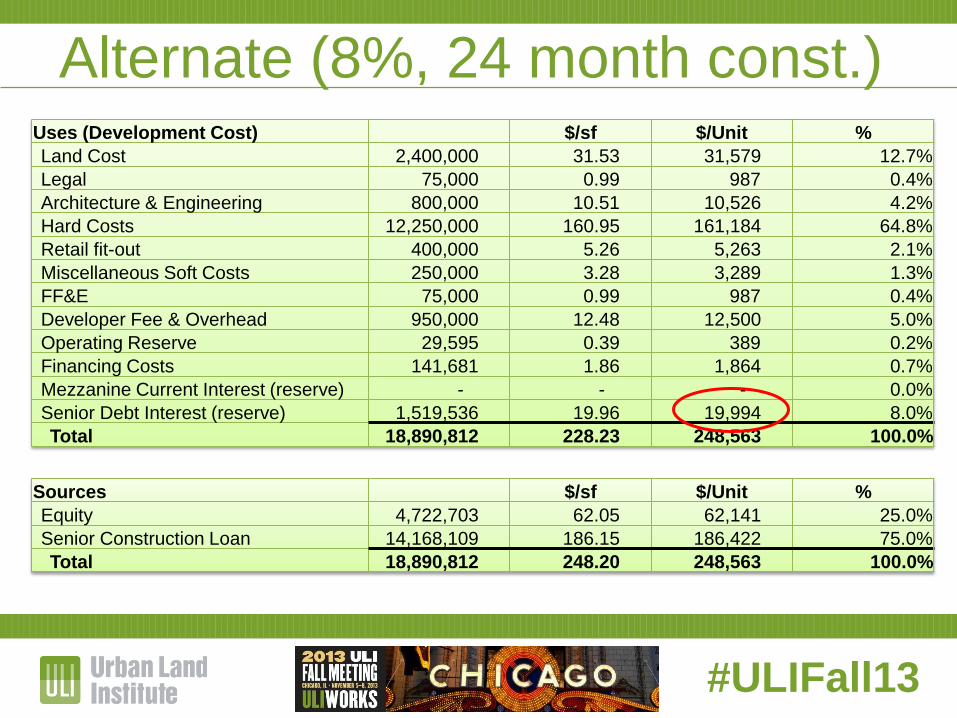
Alternate (8%, 24 month const.) Uses (Development Cost) $/sf $/Unit %
Land Cost 2,400,000 31.53 31,579 12.7%
Legal 75,000 0.99 987 0.4%
Architecture & Engineering 800,000 10.51 10,526 4.2%
Hard Costs 12,250,000 160.95 161,184 64.8%
Retail fit-out 400,000 5.26 5,263 2.1%
Miscellaneous Soft Costs 250,000 3.28 3,289 1.3%
FF&E 75,000 0.99 987 0.4%
Developer Fee & Overhead 950,000 12.48 12,500 5.0%
Operating Reserve 29,595 0.39 389 0.2%
Financing Costs 141,681 1.86 1,864 0.7%
Mezzanine Current Interest (reserve) - - - 0.0%
Senior Debt Interest (reserve) 1,519,536 19.96 19,994 8.0%
Total 18,890,812 228.23 248,563 100.0%
Sources $/sf $/Unit %
Equity 4,722,703 62.05 62,141 25.0%
Senior Construction Loan 14,168,109 186.15 186,422 75.0%
Total 18,890,812 248.20 248,563 100.0%
#ULIFall13
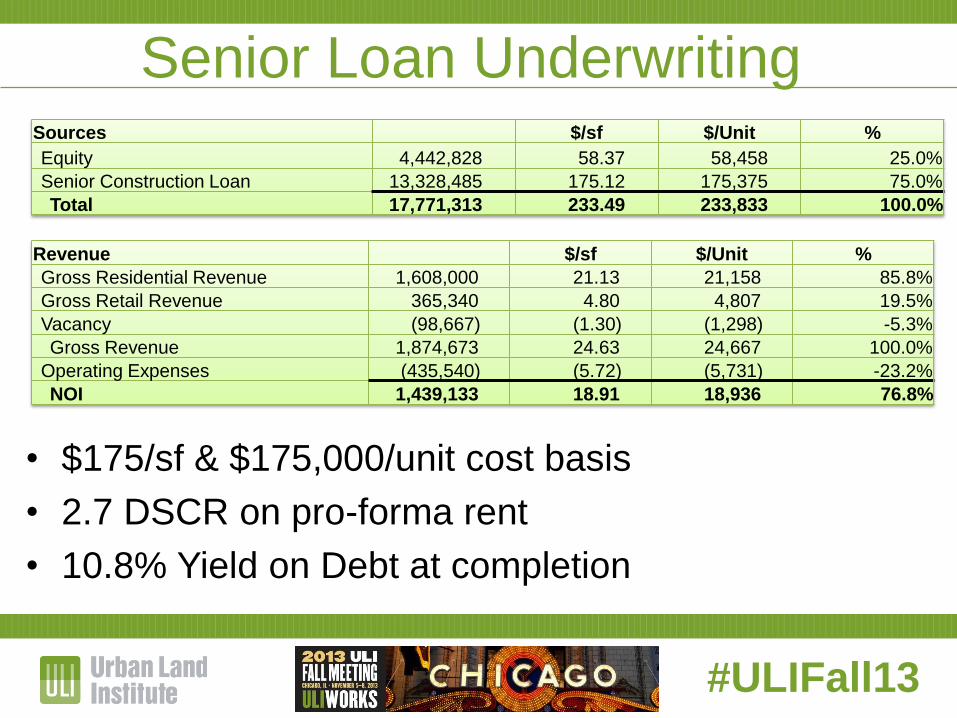
Senior Loan Underwriting Sources $/sf $/Unit %
Equity 4,442,828 58.37 58,458 25.0%
Senior Construction Loan 13,328,485 175.12 175,375 75.0%
Total 17,771,313 233.49 233,833 100.0%
• $175/sf & $175,000/unit cost basis
• 2.7 DSCR on pro-forma rent
• 10.8% Yield on Debt at completion
Revenue $/sf $/Unit %
Gross Residential Revenue 1,608,000 21.13 21,158 85.8%
Gross Retail Revenue 365,340 4.80 4,807 19.5%
Vacancy (98,667) (1.30) (1,298) -5.3%
Gross Revenue 1,874,673 24.63 24,667 100.0%
Operating Expenses (435,540) (5.72) (5,731) -23.2%
NOI 1,439,133 18.91 18,936 76.8%
#ULIFall13
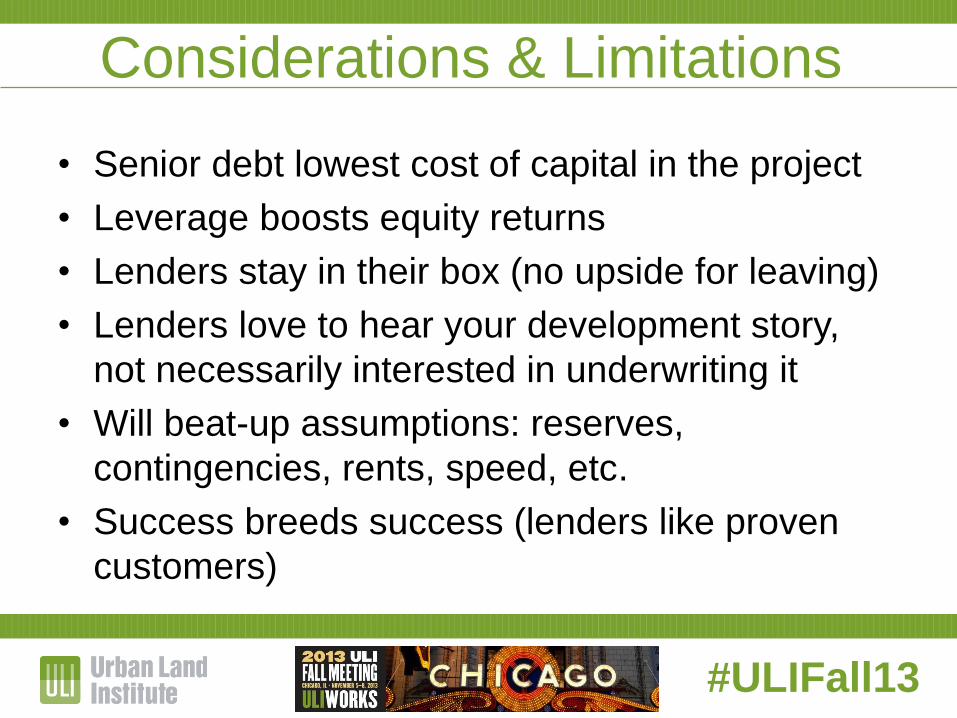
Considerations & Limitations
• Senior debt lowest cost of capital in the project
• Leverage boosts equity returns
• Lenders stay in their box (no upside for leaving)
• Lenders love to hear your development story,
not necessarily interested in underwriting it
• Will beat-up assumptions: reserves,
contingencies, rents, speed, etc.
• Success breeds success (lenders like proven
customers)
#ULIFall13
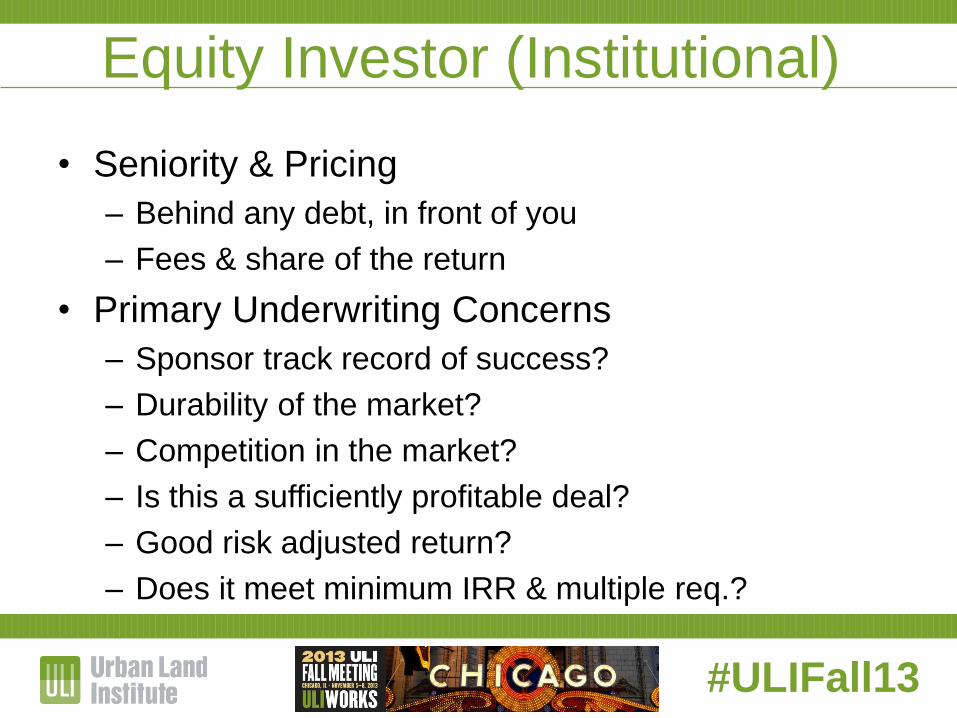
Equity Investor (Institutional)
• Seniority & Pricing
– Behind any debt, in front of you
– Fees & share of the return
• Primary Underwriting Concerns
– Sponsor track record of success?
– Durability of the market?
– Competition in the market?
– Is this a sufficiently profitable deal?
– Good risk adjusted return?
– Does it meet minimum IRR & multiple req.?
#ULIFall13
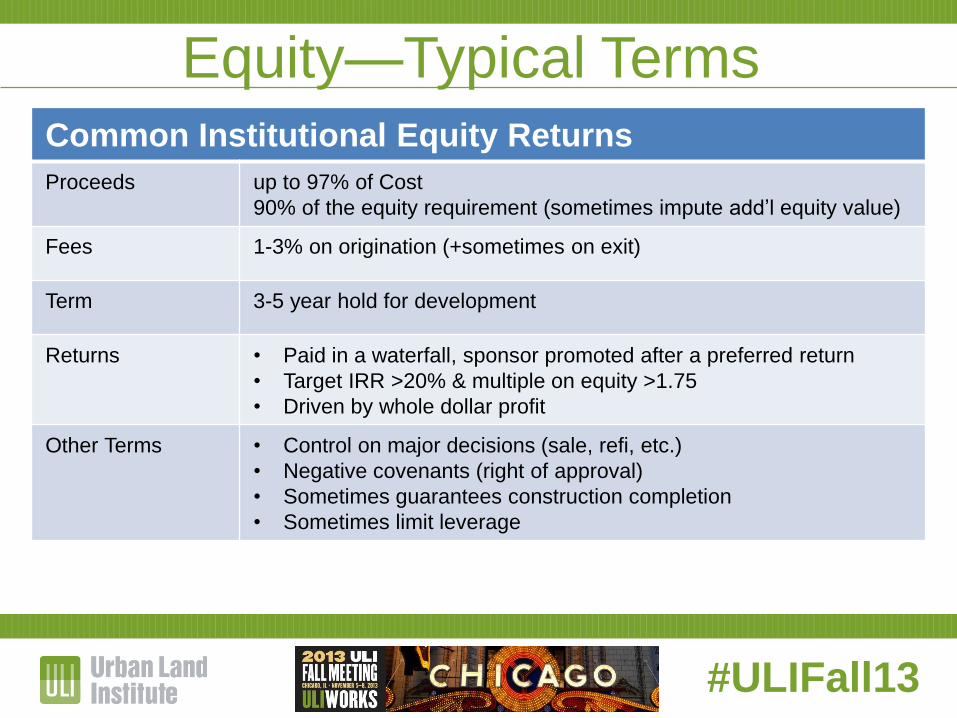
Common Institutional Equity Returns
Proceeds up to 97% of Cost
90% of the equity requirement (sometimes impute add’l equity value)
Fees 1-3% on origination (+sometimes on exit)
Term 3-5 year hold for development
Returns • Paid in a waterfall, sponsor promoted after a preferred return
• Target IRR >20% & multiple on equity >1.75
• Driven by whole dollar profit
Other Terms • Control on major decisions (sale, refi, etc.)
• Negative covenants (right of approval)
• Sometimes guarantees construction completion
• Sometimes limit leverage
Equity—Typical Terms
#ULIFall13
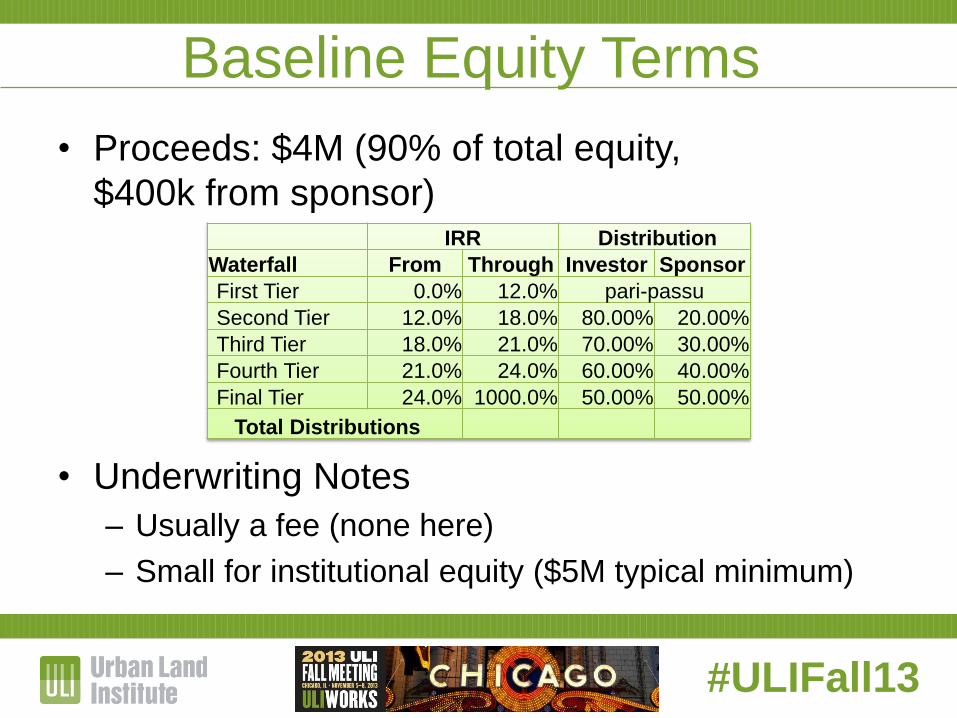
Baseline Equity Terms
• Proceeds: $4M (90% of total equity,
$400k from sponsor)
• Underwriting Notes
– Usually a fee (none here)
– Small for institutional equity ($5M typical minimum)
IRR Distribution
Waterfall From Through Investor Sponsor
First Tier 0.0% 12.0% pari-passu
Second Tier 12.0% 18.0% 80.00% 20.00%
Third Tier 18.0% 21.0% 70.00% 30.00%
Fourth Tier 21.0% 24.0% 60.00% 40.00%
Final Tier 24.0% 1000.0% 50.00% 50.00%
Total Distributions
#ULIFall13
Project Schedule
Pre-Dev. Mo. 3 Mo. 9 Mo. 15 Mo. 21 Mo. 27 Mo. 33
Approvals & Entitlements 1 1
Conceptual Design 1
Design 1 1 1 1 1 1
Construction 1 1 1 1 1 1 1 1 1 1 1 1 1 1 1
Lease-up 1 1 1 1 1 1 1 1 1 1 1 1 1 1 1 1 1 1
Exit 3
Mo. 12 Mo. 24 Mo. 30Mo. 18Mo. 0 Mo. 6
Equity Funds
Senior
Construction
Loan Funds
Everybody Exits
Entitlement
Risk
Construction
Risk
Market &
Re-Finance Risk
#ULIFall13
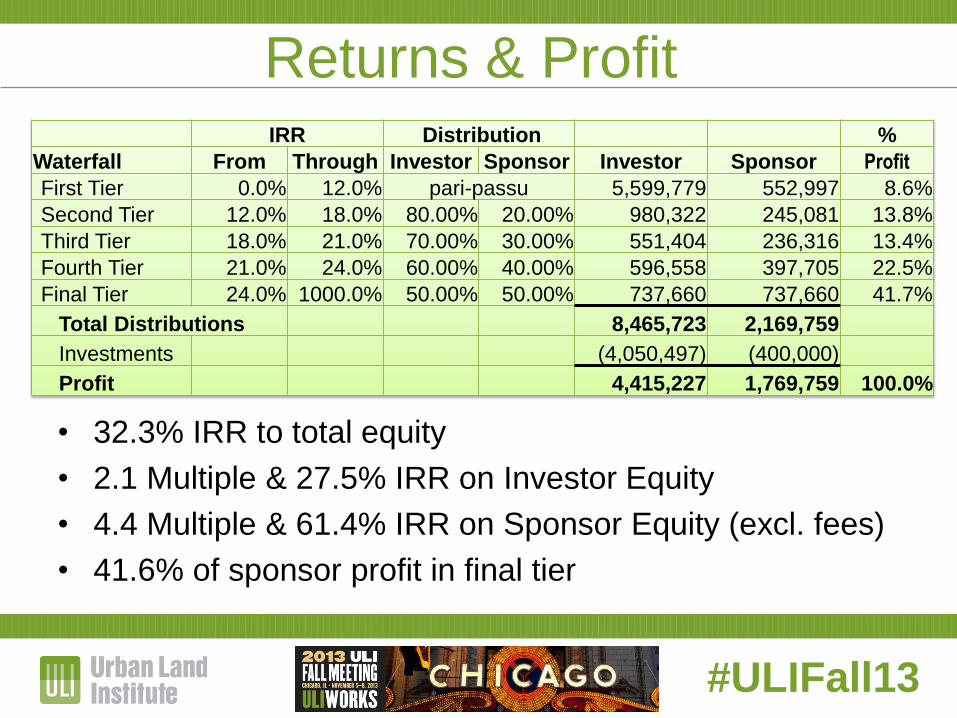
Returns & Profit
• 32.3% IRR to total equity
• 2.1 Multiple & 27.5% IRR on Investor Equity
• 4.4 Multiple & 61.4% IRR on Sponsor Equity (excl. fees)
• 41.6% of sponsor profit in final tier
IRR Distribution %
Waterfall From Through Investor Sponsor Investor Sponsor Profit
First Tier 0.0% 12.0% pari-passu 5,599,779 552,997 8.6%
Second Tier 12.0% 18.0% 80.00% 20.00% 980,322 245,081 13.8%
Third Tier 18.0% 21.0% 70.00% 30.00% 551,404 236,316 13.4%
Fourth Tier 21.0% 24.0% 60.00% 40.00% 596,558 397,705 22.5%
Final Tier 24.0% 1000.0% 50.00% 50.00% 737,660 737,660 41.7%
Total Distributions 8,465,723 2,169,759
Investments (4,050,497) (400,000)
Profit 4,415,227 1,769,759 100.0%
#ULIFall13
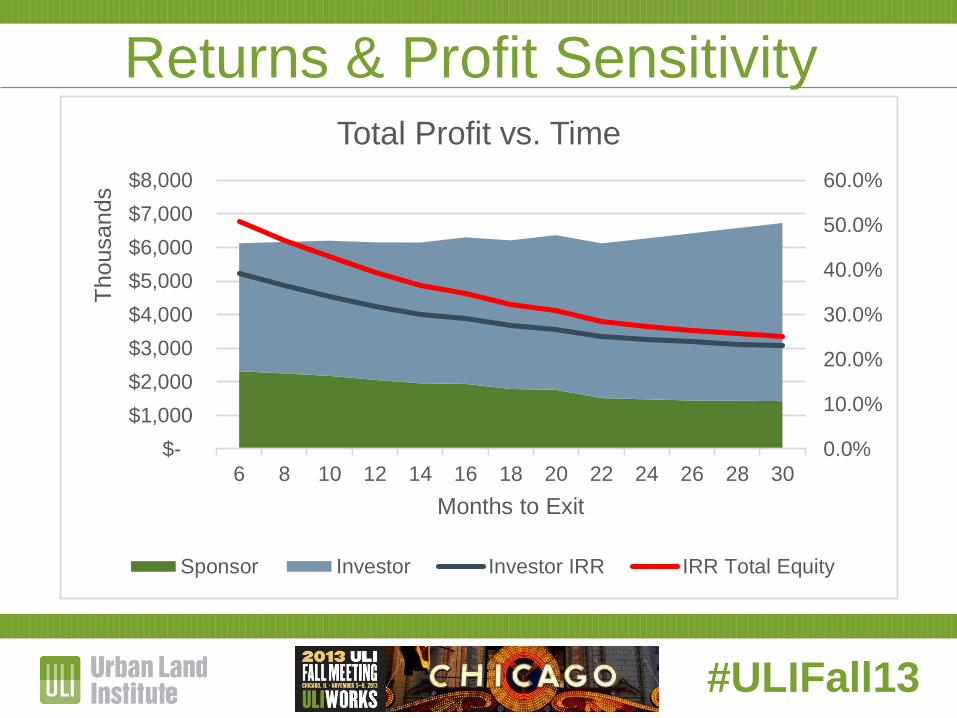
Returns & Profit Sensitivity
0.0%
10.0%
20.0%
30.0%
40.0%
50.0%
60.0%
$-
$1,000
$2,000
$3,000
$4,000
$5,000
$6,000
$7,000
$8,000
6 8 10 12 14 16 18 20 22 24 26 28 30
Thousands
Months to Exit
Total Profit vs. Time
Sponsor Investor Investor IRR IRR Total Equity
#ULIFall13
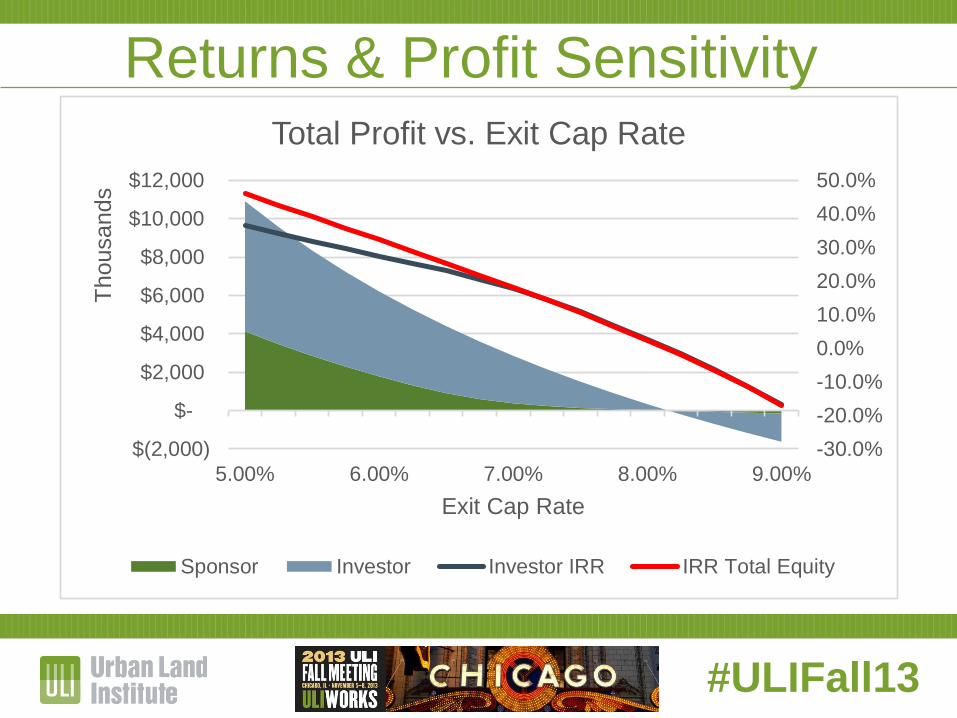
Returns & Profit Sensitivity
-30.0%
-20.0%
-10.0%
0.0%
10.0%
20.0%
30.0%
40.0%
50.0%
$(2,000)
$-
$2,000
$4,000
$6,000
$8,000
$10,000
$12,000
5.00% 6.00% 7.00% 8.00% 9.00%
Thousands
Exit Cap Rate
Total Profit vs. Exit Cap Rate
Sponsor Investor Investor IRR IRR Total Equity
#ULIFall13
SAMPLE PROJECT
Residential Condominium
Debt & Equity
#ULIFall13
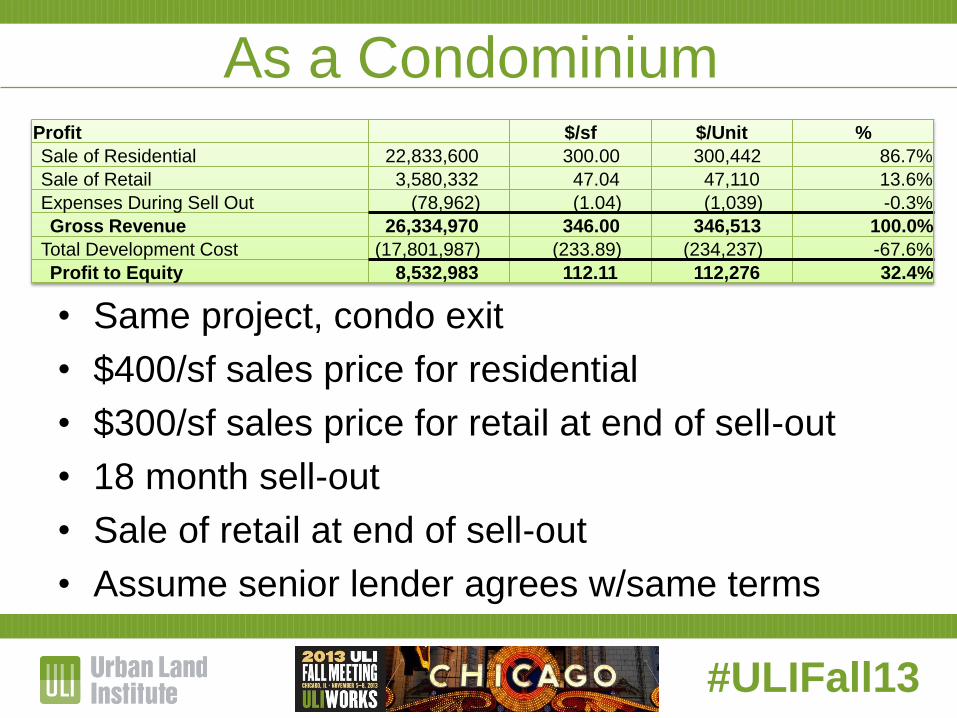
As a Condominium
• Same project, condo exit
• $400/sf sales price for residential
• $300/sf sales price for retail at end of sell-out
• 18 month sell-out
• Sale of retail at end of sell-out
• Assume senior lender agrees w/same terms
Profit $/sf $/Unit %
Sale of Residential 22,833,600 300.00 300,442 86.7%
Sale of Retail 3,580,332 47.04 47,110 13.6%
Expenses During Sell Out (78,962) (1.04) (1,039) -0.3%
Gross Revenue 26,334,970 346.00 346,513 100.0%
Total Development Cost (17,801,987) (233.89) (234,237) -67.6%
Profit to Equity 8,532,983 112.11 112,276 32.4%
#ULIFall13
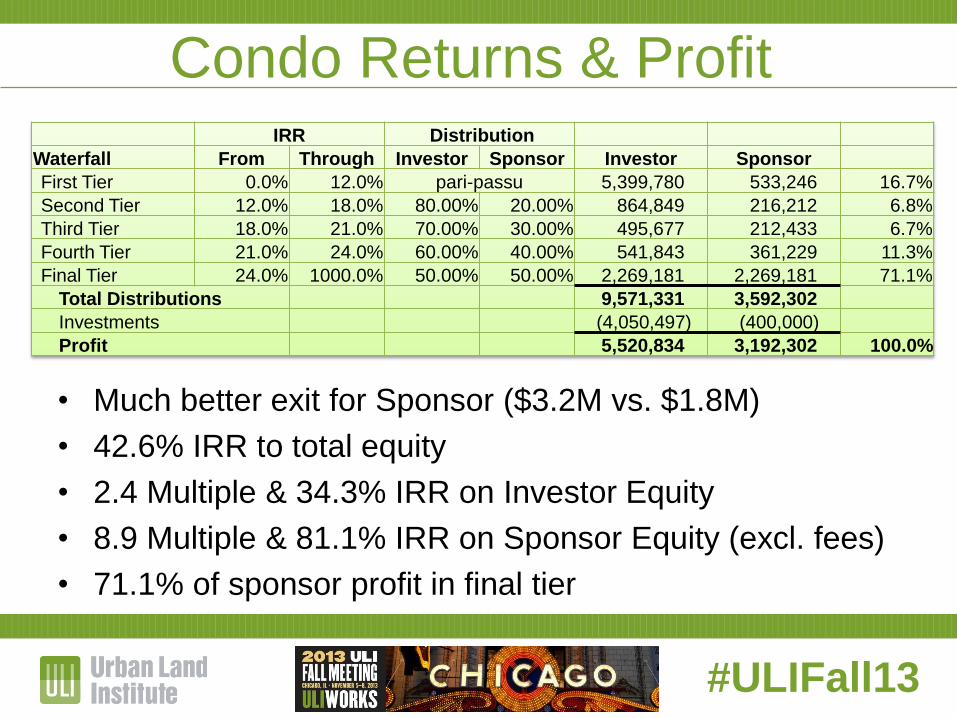
Condo Returns & Profit
• Much better exit for Sponsor ($3.2M vs. $1.8M)
• 42.6% IRR to total equity
• 2.4 Multiple & 34.3% IRR on Investor Equity
• 8.9 Multiple & 81.1% IRR on Sponsor Equity (excl. fees)
• 71.1% of sponsor profit in final tier
IRR Distribution
Waterfall From Through Investor Sponsor Investor Sponsor
First Tier 0.0% 12.0% pari-passu 5,399,780 533,246 16.7%
Second Tier 12.0% 18.0% 80.00% 20.00% 864,849 216,212 6.8%
Third Tier 18.0% 21.0% 70.00% 30.00% 495,677 212,433 6.7%
Fourth Tier 21.0% 24.0% 60.00% 40.00% 541,843 361,229 11.3%
Final Tier 24.0% 1000.0% 50.00% 50.00% 2,269,181 2,269,181 71.1%
Total Distributions 9,571,331 3,592,302
Investments (4,050,497) (400,000)
Profit 5,520,834 3,192,302 100.0%
#ULIFall13
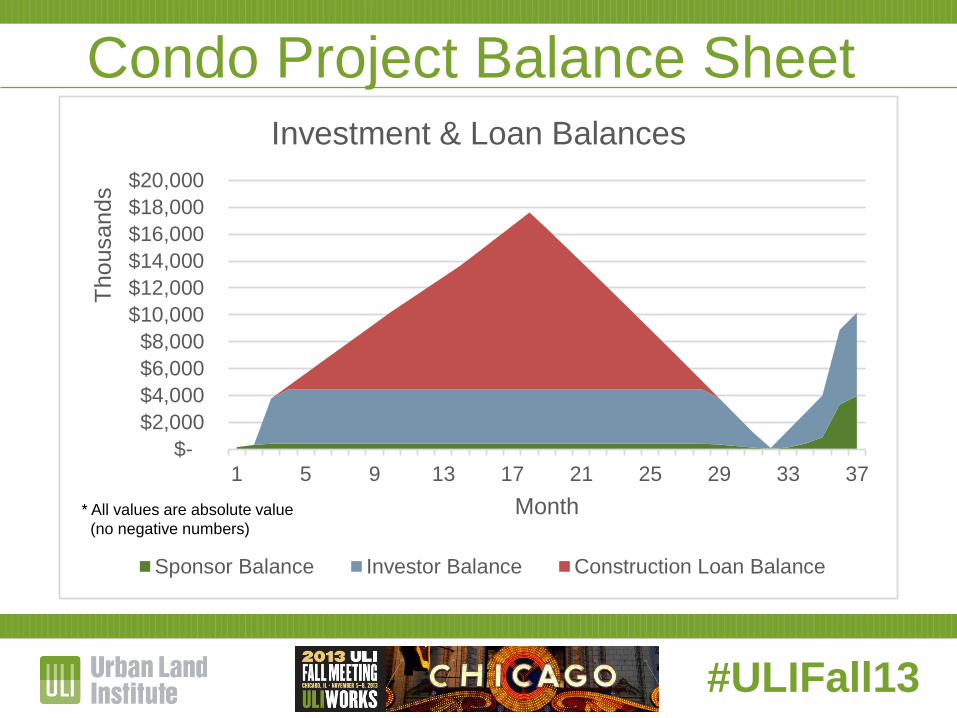
Condo Project Balance Sheet
$-
$2,000
$4,000
$6,000
$8,000
$10,000
$12,000
$14,000
$16,000
$18,000
$20,000
1 5 9 13 17 21 25 29 33 37
Thousands
Month
Investment & Loan Balances
Sponsor Balance Investor Balance Construction Loan Balance
* All values are absolute value
(no negative numbers)
#ULIFall13
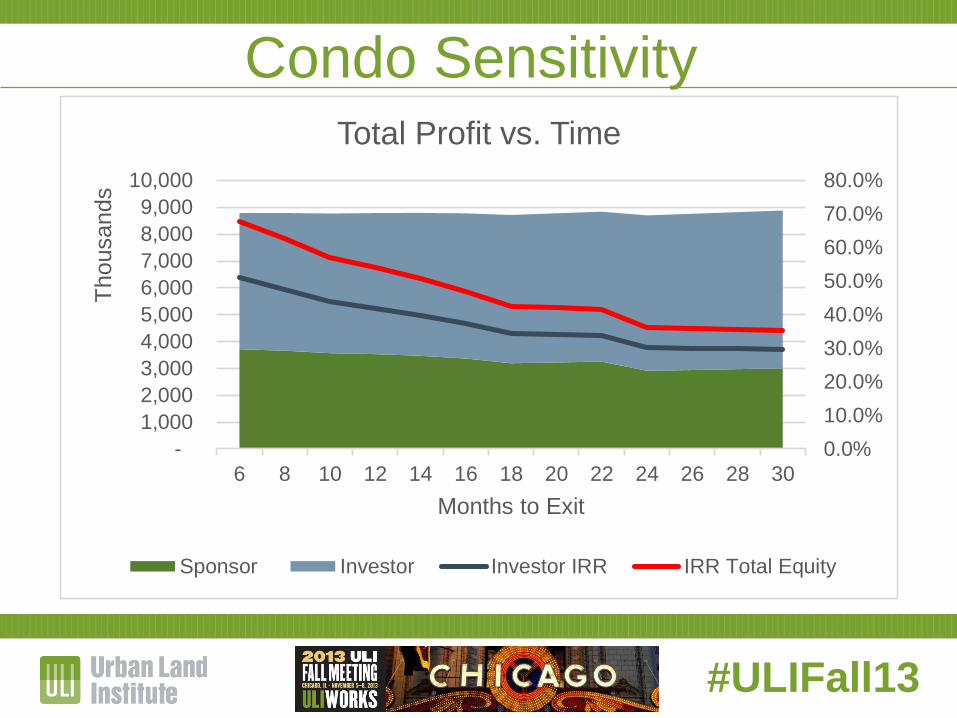
Condo Sensitivity
0.0%
10.0%
20.0%
30.0%
40.0%
50.0%
60.0%
70.0%
80.0%
-
1,000
2,000
3,000
4,000
5,000
6,000
7,000
8,000
9,000
10,000
6 8 10 12 14 16 18 20 22 24 26 28 30
Thousands
Months to Exit
Total Profit vs. Time
Sponsor Investor Investor IRR IRR Total Equity
#ULIFall13
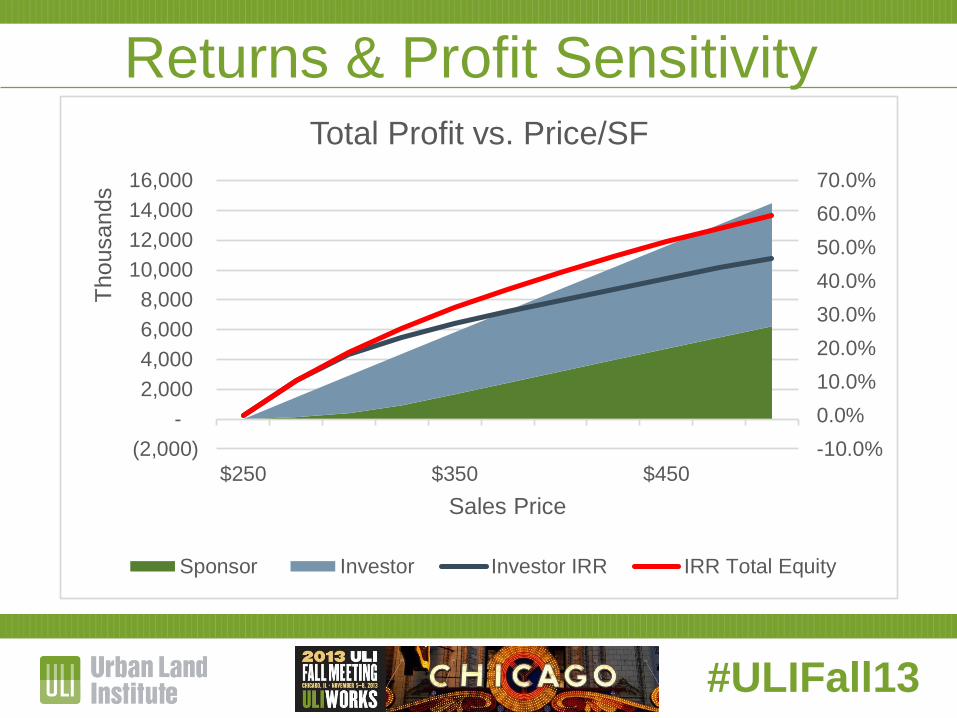
Returns & Profit Sensitivity
-10.0%
0.0%
10.0%
20.0%
30.0%
40.0%
50.0%
60.0%
70.0%
(2,000)
-
2,000
4,000
6,000
8,000
10,000
12,000
14,000
16,000
$250 $350 $450
Thousands
Sales Price
Total Profit vs. Price/SF
Sponsor Investor Investor IRR IRR Total Equity
#ULIFall13
Equity Considerations
• Often creative partners in their underwriting
• Can stretch the edge of their boxes
• Good partner makes debt financing easier
• Good partner valuable when things go wrong
• Often likes leverage, except when they don’t
• Beware smallness problem…not a big enough
investment to be worth the expense and hassle
• Expensive in success (share every dollar)
#ULIFall13
SAMPLE PROJECT
Residential Condominium
Debt, Mezzanine & Equity
#ULIFall13
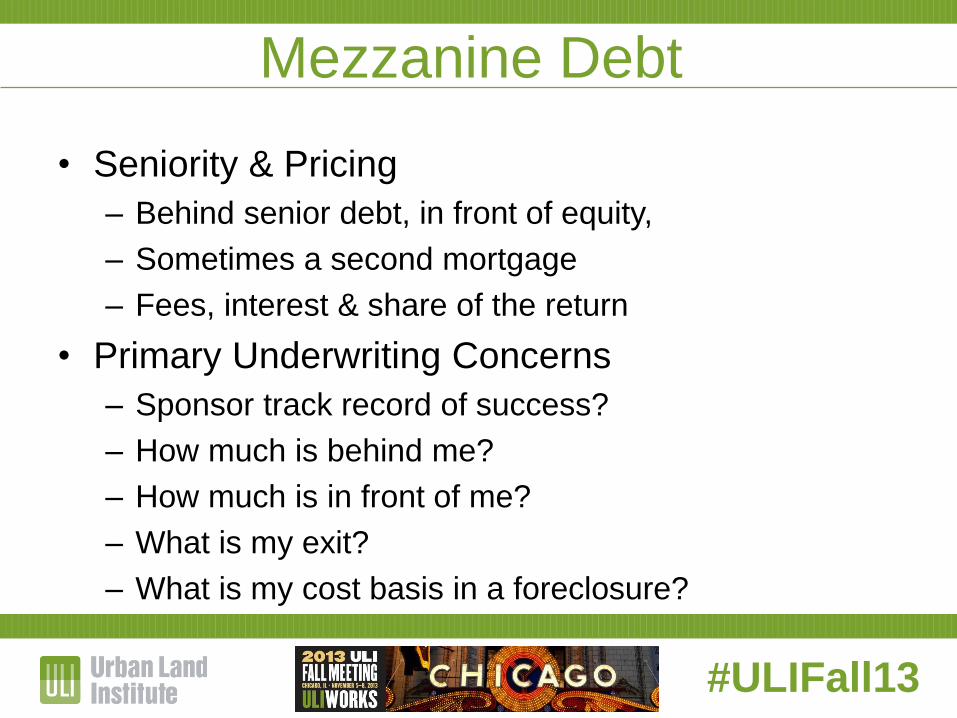
Mezzanine Debt
• Seniority & Pricing
– Behind senior debt, in front of equity,
– Sometimes a second mortgage
– Fees, interest & share of the return
• Primary Underwriting Concerns
– Sponsor track record of success?
– How much is behind me?
– How much is in front of me?
– What is my exit?
– What is my cost basis in a foreclosure?
#ULIFall13
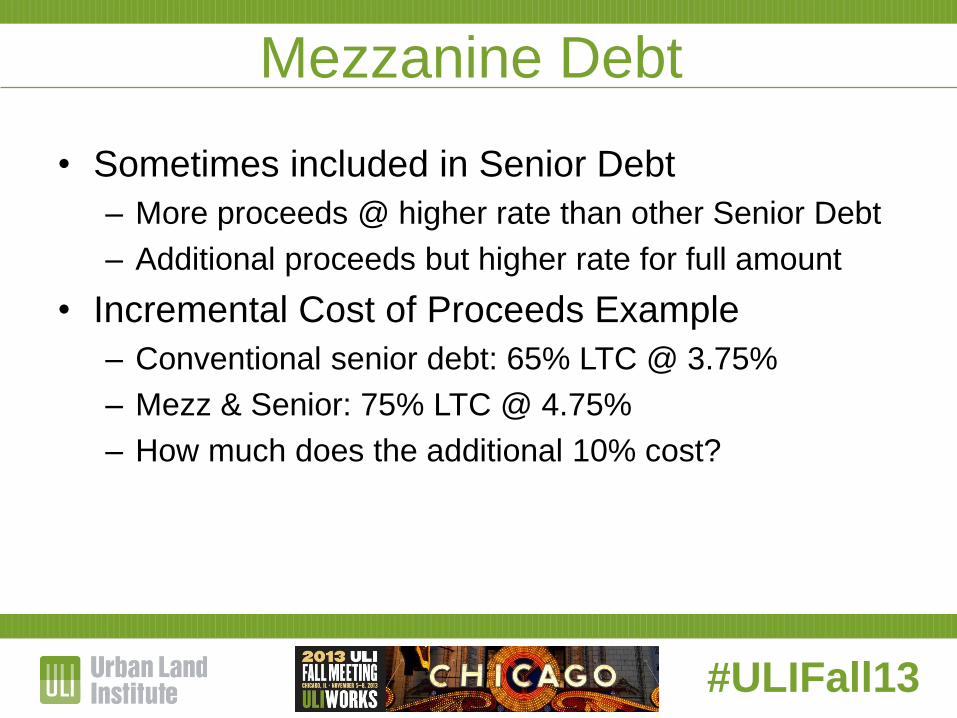
Mezzanine Debt
• Sometimes included in Senior Debt
– More proceeds @ higher rate than other Senior Debt
– Additional proceeds but higher rate for full amount
• Incremental Cost of Proceeds Example
– Conventional senior debt: 65% LTC @ 3.75%
– Mezz & Senior: 75% LTC @ 4.75%
– How much does the additional 10% cost?
#ULIFall13
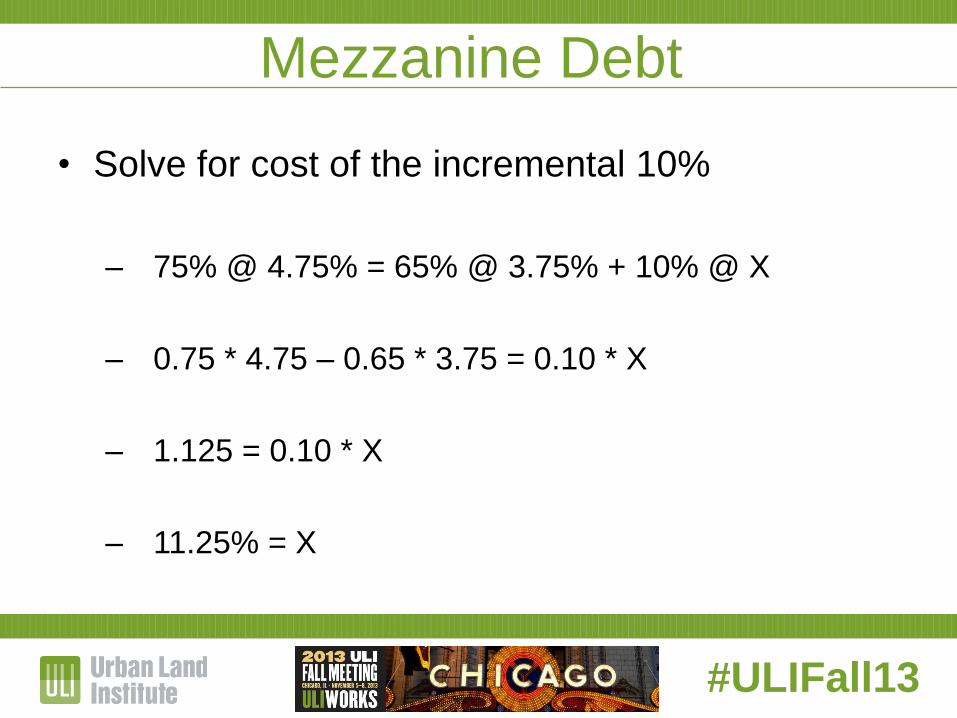
Mezzanine Debt
• Solve for cost of the incremental 10%
– 75% @ 4.75% = 65% @ 3.75% + 10% @ X
– 0.75 * 4.75 – 0.65 * 3.75 = 0.10 * X
– 1.125 = 0.10 * X
– 11.25% = X
#ULIFall13
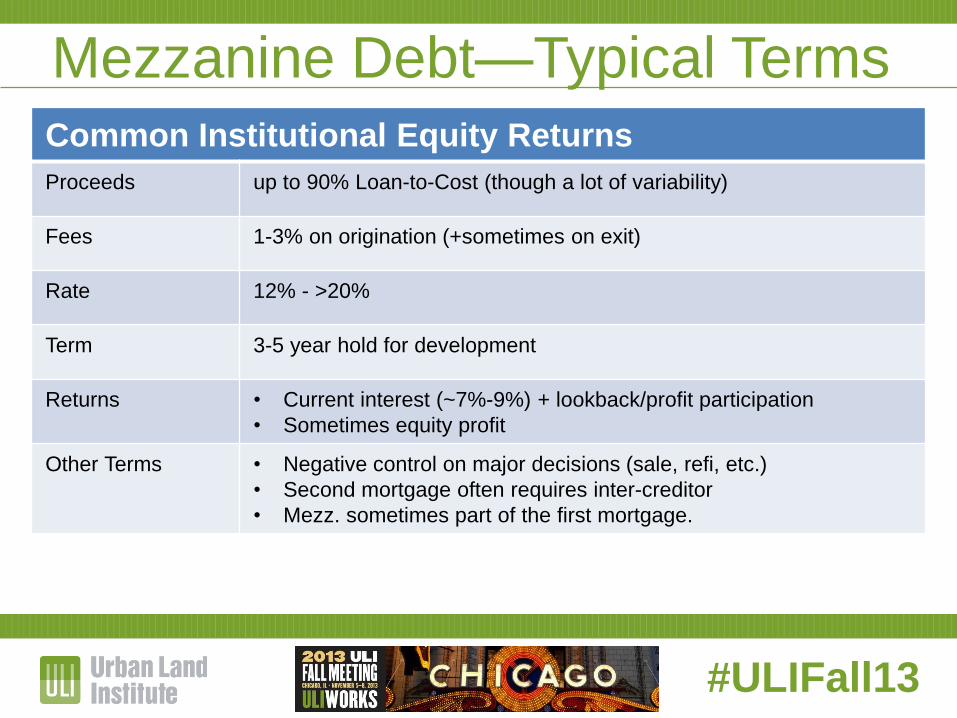
Common Institutional Equity Returns
Proceeds up to 90% Loan-to-Cost (though a lot of variability)
Fees 1-3% on origination (+sometimes on exit)
Rate 12% - >20%
Term 3-5 year hold for development
Returns • Current interest (~7%-9%) + lookback/profit participation
• Sometimes equity profit
Other Terms • Negative control on major decisions (sale, refi, etc.)
• Second mortgage often requires inter-creditor
• Mezz. sometimes part of the first mortgage.
Mezzanine Debt—Typical Terms
#ULIFall13
Mezzanine Debt Terms
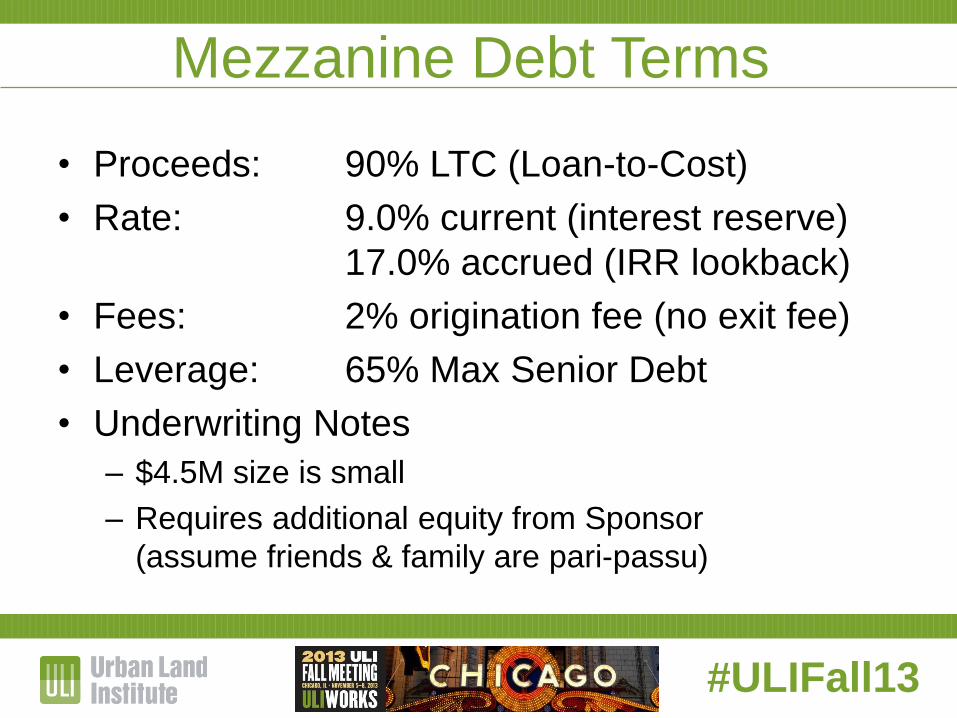
• Proceeds: 90% LTC (Loan-to-Cost)
• Rate: 9.0% current (interest reserve)
17.0% accrued (IRR lookback)
• Fees: 2% origination fee (no exit fee)
• Leverage: 65% Max Senior Debt
• Underwriting Notes
– $4.5M size is small
– Requires additional equity from Sponsor
(assume friends & family are pari-passu)
#ULIFall13
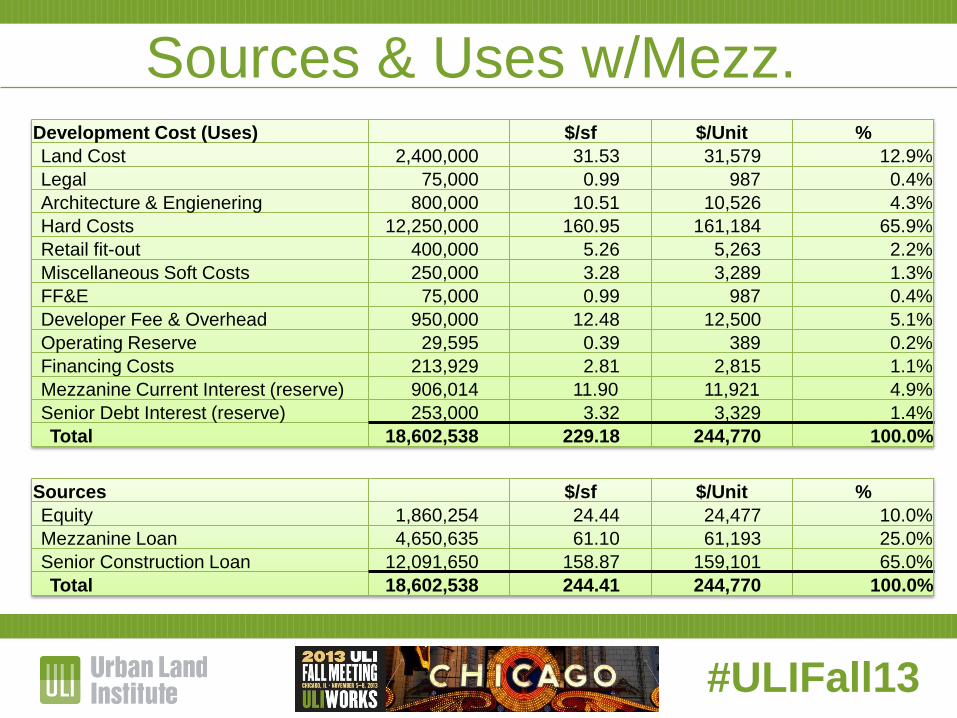
Sources & Uses w/Mezz. Development Cost (Uses) $/sf $/Unit %
Land Cost 2,400,000 31.53 31,579 12.9%
Legal 75,000 0.99 987 0.4%
Architecture & Engienering 800,000 10.51 10,526 4.3%
Hard Costs 12,250,000 160.95 161,184 65.9%
Retail fit-out 400,000 5.26 5,263 2.2%
Miscellaneous Soft Costs 250,000 3.28 3,289 1.3%
FF&E 75,000 0.99 987 0.4%
Developer Fee & Overhead 950,000 12.48 12,500 5.1%
Operating Reserve 29,595 0.39 389 0.2%
Financing Costs 213,929 2.81 2,815 1.1%
Mezzanine Current Interest (reserve) 906,014 11.90 11,921 4.9%
Senior Debt Interest (reserve) 253,000 3.32 3,329 1.4%
Total 18,602,538 229.18 244,770 100.0%
Sources $/sf $/Unit %
Equity 1,860,254 24.44 24,477 10.0%
Mezzanine Loan 4,650,635 61.10 61,193 25.0%
Senior Construction Loan 12,091,650 158.87 159,101 65.0%
Total 18,602,538 244.41 244,770 100.0%
#ULIFall13
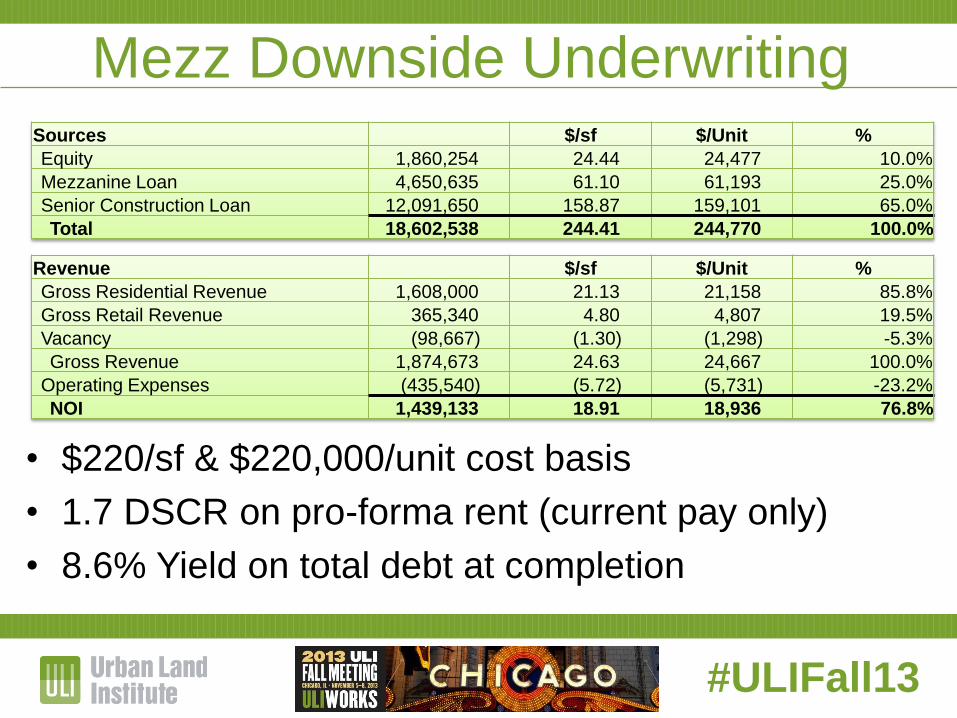
Mezz Downside Underwriting
• $220/sf & $220,000/unit cost basis
• 1.7 DSCR on pro-forma rent (current pay only)
• 8.6% Yield on total debt at completion
Revenue $/sf $/Unit %
Gross Residential Revenue 1,608,000 21.13 21,158 85.8%
Gross Retail Revenue 365,340 4.80 4,807 19.5%
Vacancy (98,667) (1.30) (1,298) -5.3%
Gross Revenue 1,874,673 24.63 24,667 100.0%
Operating Expenses (435,540) (5.72) (5,731) -23.2%
NOI 1,439,133 18.91 18,936 76.8%
Sources $/sf $/Unit %
Equity 1,860,254 24.44 24,477 10.0%
Mezzanine Loan 4,650,635 61.10 61,193 25.0%
Senior Construction Loan 12,091,650 158.87 159,101 65.0%
Total 18,602,538 244.41 244,770 100.0%
#ULIFall13
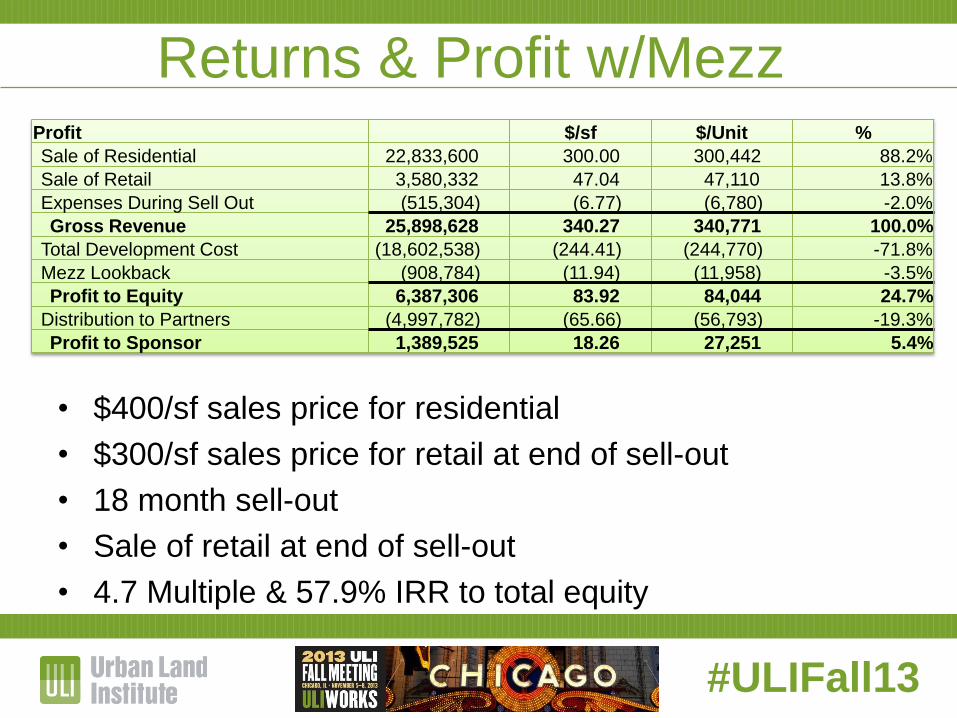
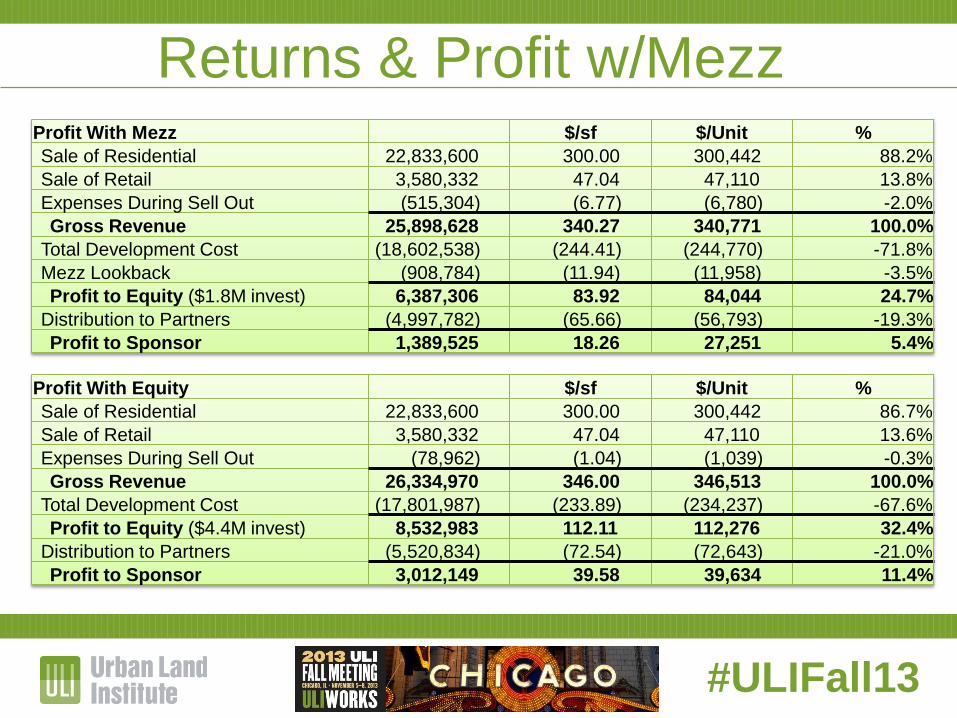
Returns & Profit w/Mezz
• $400/sf sales price for residential
• $300/sf sales price for retail at end of sell-out
• 18 month sell-out
• Sale of retail at end of sell-out
• 4.7 Multiple & 57.9% IRR to total equity
Profit $/sf $/Unit %
Sale of Residential 22,833,600 300.00 300,442 88.2%
Sale of Retail 3,580,332 47.04 47,110 13.8%
Expenses During Sell Out (515,304) (6.77) (6,780) -2.0%
Gross Revenue 25,898,628 340.27 340,771 100.0%
Total Development Cost (18,602,538) (244.41) (244,770) -71.8%
Mezz Lookback (908,784) (11.94) (11,958) -3.5%
Profit to Equity 6,387,306 83.92 84,044 24.7%
Distribution to Partners (4,997,782) (65.66) (56,793) -19.3%
Profit to Sponsor 1,389,525 18.26 27,251 5.4%
#ULIFall13
Returns & Profit w/Mezz
• 4.7 Multiple & 57.9% IRR to total equity
• 41.6% of sponsor profit in final tier
Profit With Mezz $/sf $/Unit %
Sale of Residential 22,833,600 300.00 300,442 88.2%
Sale of Retail 3,580,332 47.04 47,110 13.8%
Expenses During Sell Out (515,304) (6.77) (6,780) -2.0%
Gross Revenue 25,898,628 340.27 340,771 100.0%
Total Development Cost (18,602,538) (244.41) (244,770) -71.8%
Mezz Lookback (908,784) (11.94) (11,958) -3.5%
Profit to Equity ($1.8M invest) 6,387,306 83.92 84,044 24.7%
Distribution to Partners (4,997,782) (65.66) (56,793) -19.3%
Profit to Sponsor 1,389,525 18.26 27,251 5.4%
Profit With Equity $/sf $/Unit %
Sale of Residential 22,833,600 300.00 300,442 86.7%
Sale of Retail 3,580,332 47.04 47,110 13.6%
Expenses During Sell Out (78,962) (1.04) (1,039) -0.3%
Gross Revenue 26,334,970 346.00 346,513 100.0%
Total Development Cost (17,801,987) (233.89) (234,237) -67.6%
Profit to Equity ($4.4M invest) 8,532,983 112.11 112,276 32.4%
Distribution to Partners (5,520,834) (72.54) (72,643) -21.0%
Profit to Sponsor 3,012,149 39.58 39,634 11.4%
#ULIFall13
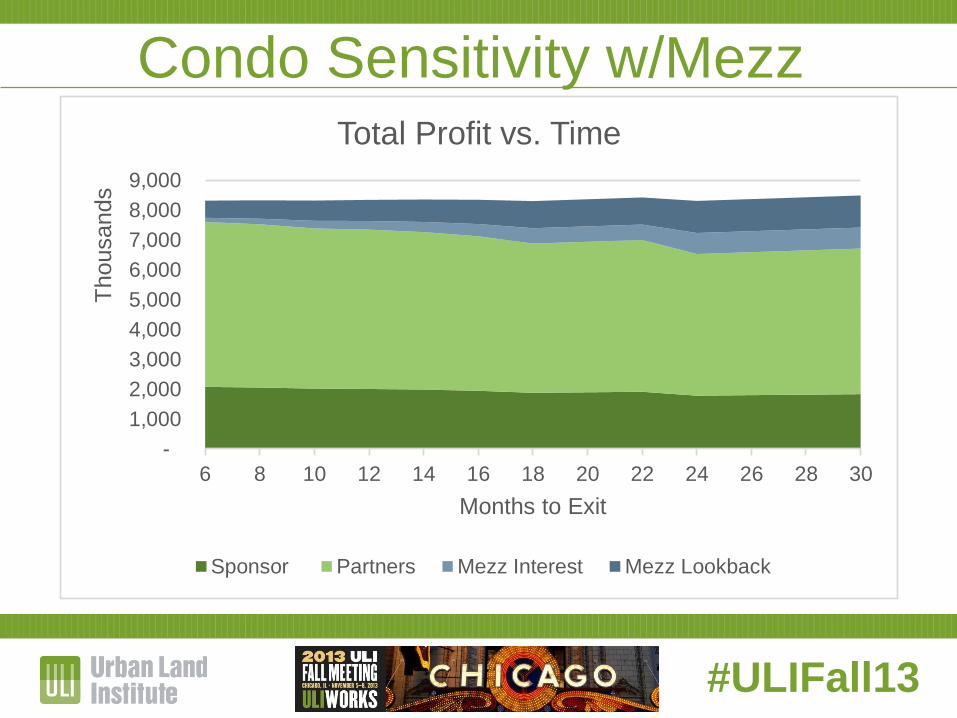
Condo Sensitivity w/Mezz
-
1,000
2,000
3,000
4,000
5,000
6,000
7,000
8,000
9,000
6 8 10 12 14 16 18 20 22 24 26 28 30
Thousands
Months to Exit
Total Profit vs. Time
Sponsor Partners Mezz Interest Mezz Lookback
#ULIFall13
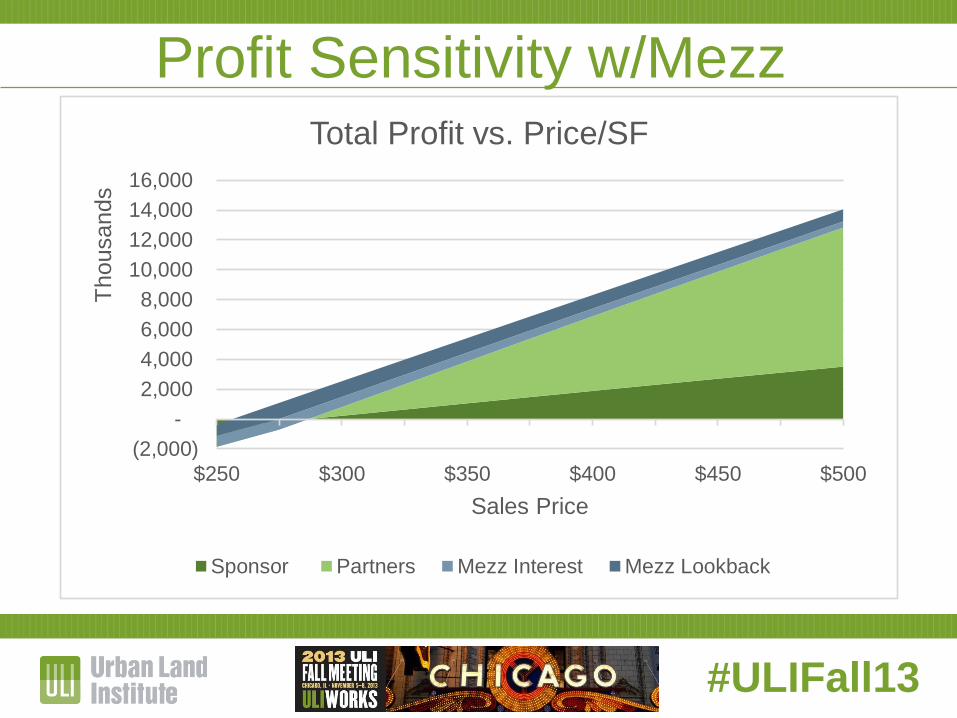
Profit Sensitivity w/Mezz
(2,000)
-
2,000
4,000
6,000
8,000
10,000
12,000
14,000
16,000
$250 $300 $350 $400 $450 $500
Thousands
Sales Price
Total Profit vs. Price/SF
Sponsor Partners Mezz Interest Mezz Lookback
#ULIFall13
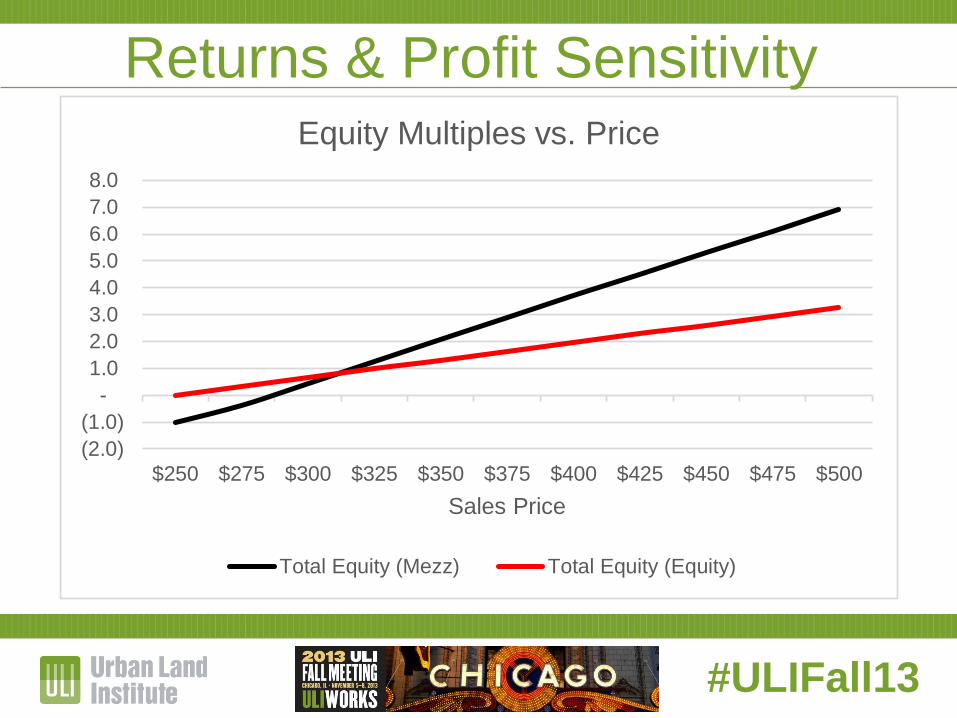
Returns & Profit Sensitivity
(2.0)
(1.0)
-
1.0
2.0
3.0
4.0
5.0
6.0
7.0
8.0
$250 $275 $300 $325 $350 $375 $400 $425 $450 $475 $500
Sales Price
Equity Multiples vs. Price
Total Equity (Mezz) Total Equity (Equity)
#ULIFall13
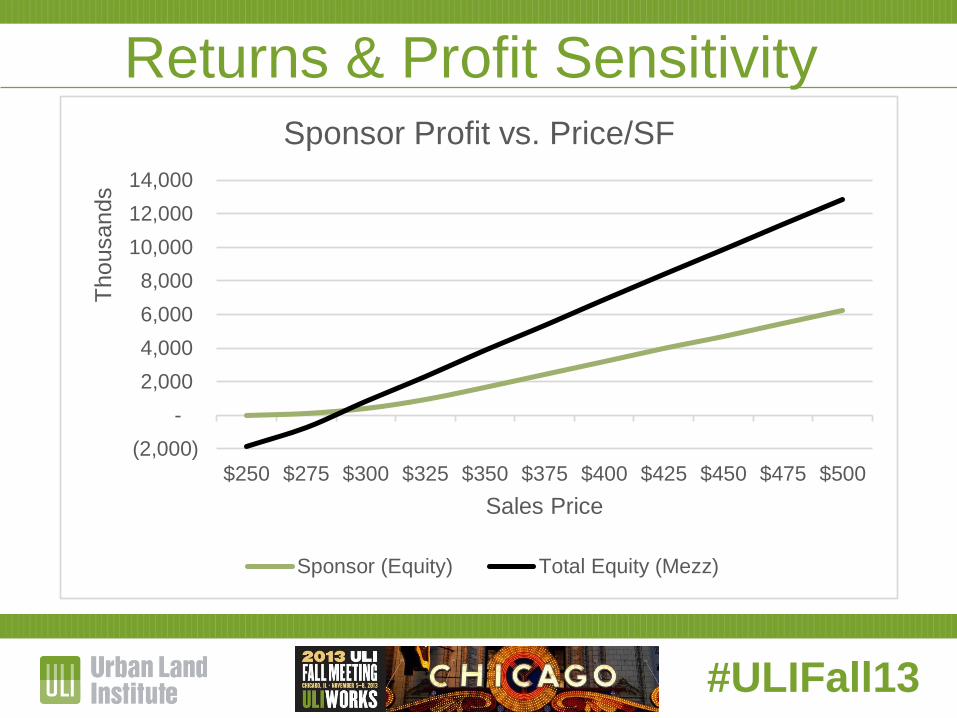
Returns & Profit Sensitivity
(2,000)
-
2,000
4,000
6,000
8,000
10,000
12,000
14,000
$250 $275 $300 $325 $350 $375 $400 $425 $450 $475 $500
Thousands
Sales Price
Sponsor Profit vs. Price/SF
Sponsor (Equity) Total Equity (Mezz)

#ULIFall13
Mezzanine Considerations
• Can be creative, sometimes like equity
• Always feels expensive, even when it’s cheap
• Preserves more upside for the developer
• Shortens the fuse on success
• Proceeds not usually as high equity (often fund
limited)
#ULIFall13
Mezzanine Considerations
• Can be creative, sometimes like equity
• Always feels expensive, even when it’s cheap
• Preserves more upside for the developer
• Shortens the fuse on success
• Proceeds not usually as high equity (often fund
limited)
#ULIFall13
Summary of Considerations
• Understand the goals of the project
• Finance to manage the project’s key risks
• Investors & lenders have defined limitations
• Size of the investment drives options
• The project may have to adapt to make it
financeable
• Mezz. is cheaper…unless it goes badly
• Profitability is not determined by rate alone
#ULIFall13
Christopher Strom
Director of Project Development
AthenianRazak
Tel: 215.531.8163
Email: [email protected]