Embed Size (px)
Citation preview
Structured Designand Modeling
CS 123/CS 231

Design Models Revisited
UML: Modeling Language for OO SystemsFor the Procedural (Structured) Paradigm
Data and processes are separately consideredData Model: Entity-Relationship DiagramProcess Model: Data-Flow Diagram
Some modeling techniques apply to both paradigms

ERDs
Entity-Relationship DiagramsUsed to produce a data model for an
enterpriseModels data entities, their attributes,
and relationship among data entitiesDatabase Design

Entities and Attributes
Entitything, person, placeexamples: Book, Sales Invoice, Student,
Customer, Employee, Department, AirportAttribute
feature of an entityexamples: Name, Address, Age, QCA,
Title, Author, Amount, City

Relationships
Relationshipan association between (at least) two entitiesexamples: student borrows a book
CardinalityOne-to-one, one-to-many, many-to-many
Intersection Dataattribute resulting from relationshipexample: date-borrowed
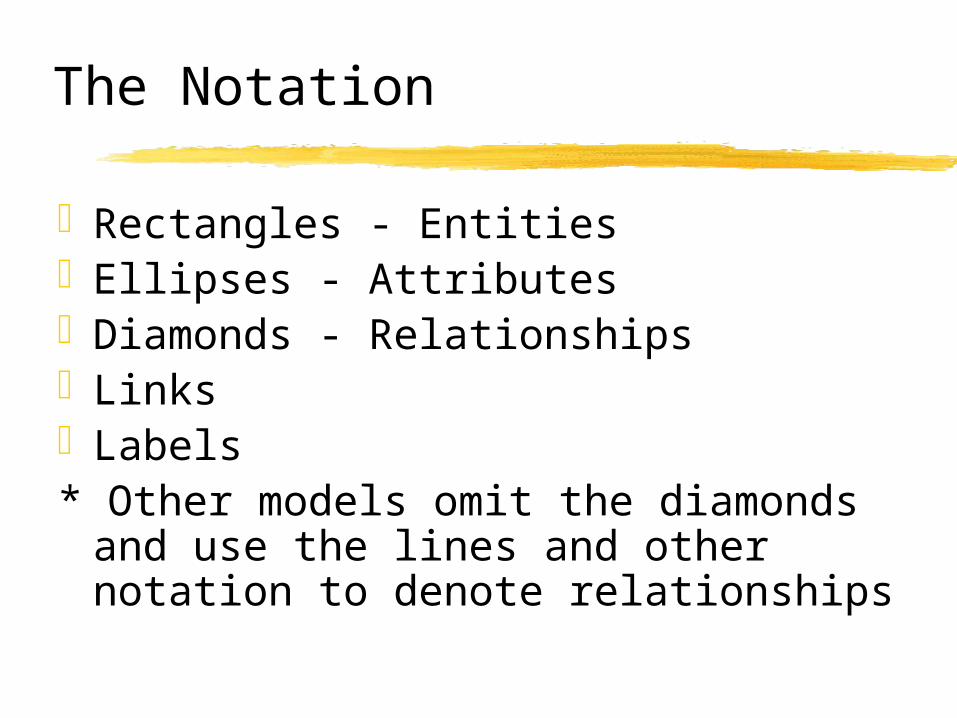
The Notation
Rectangles - EntitiesEllipses - AttributesDiamonds - RelationshipsLinksLabels* Other models omit the diamonds and
use the lines and other notation to denote relationships

Sample Notation

Example

Example: The University Setting
DescriptionStudents enroll in classes. Each class is
a section of a particular course.Entities
Student, Section, Course

Student
id number
name addressyear
qca

Student enrolls Section
Course has
M M
M
1
grade
index roomsched
cat numtitle
desc
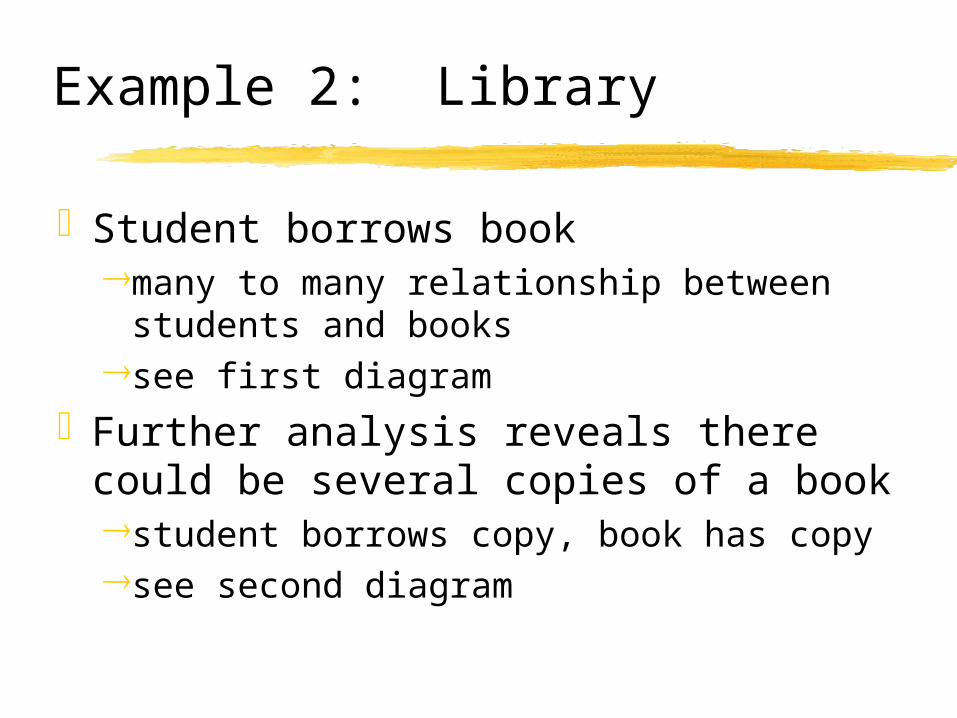
Example 2: Library
Student borrows bookmany to many relationship between
students and bookssee first diagram
Further analysis reveals there could be several copies of a bookstudent borrows copy, book has copysee second diagram

Student borrows BookM M

Student borrows Copy
Book has
M M
M
1
Exercise: Complete Diagram by filling in attributes

ERDs and the Software Life Cycle
Used at the design phase of the software life cycle for database systems, although it is often used as early as the analysis phase
In design, it precedes table definition
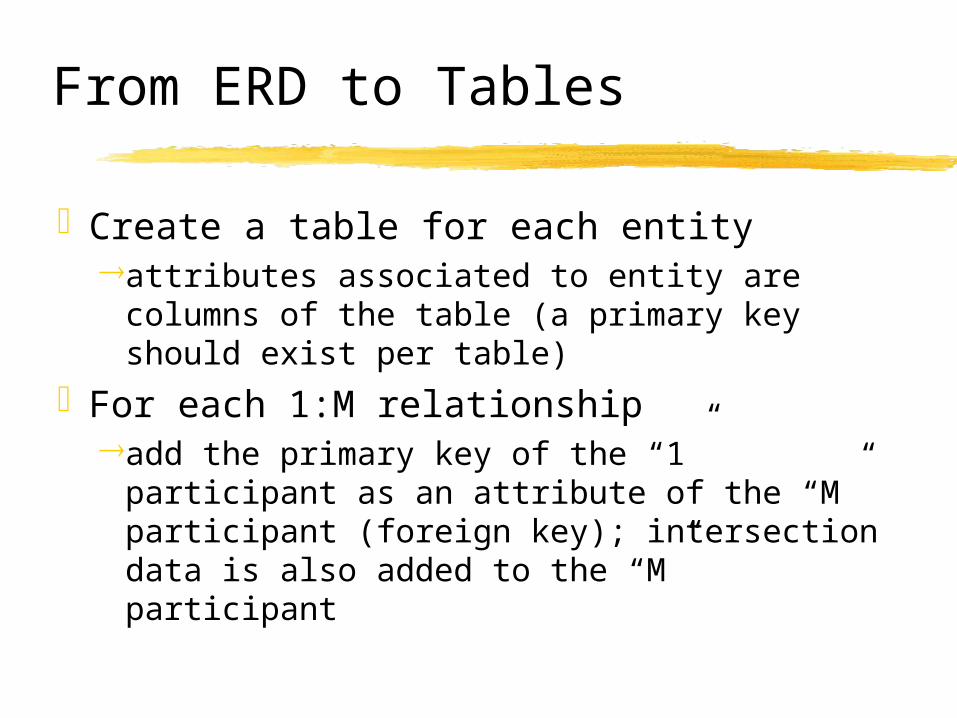
From ERD to Tables
Create a table for each entityattributes associated to entity are
columns of the table (a primary key should exist per table)
For each 1:M relationshipadd the primary key of the “1”
participant as an attribute of the “M” participant (foreign key); intersection data is also added to the “M” participant

ERD to Tables, continued
For each 1:1 relationshipadd primary key of one table plus
intersection data to the other tableFor each M:M relationship
create a new tableattributes are the primary keys of the
participants plus intersection data
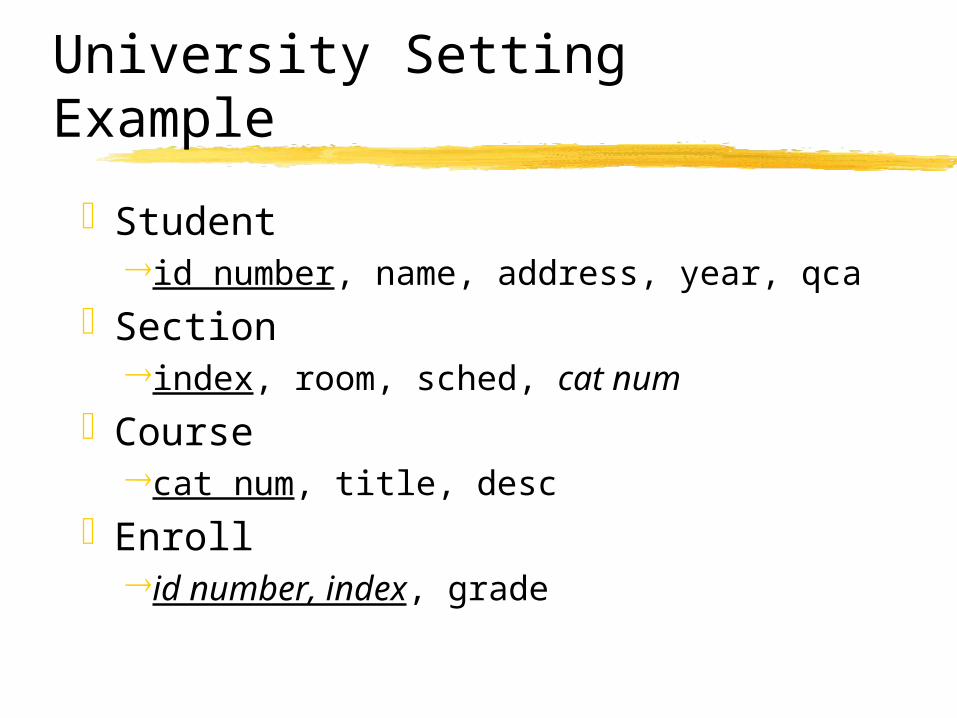
University Setting Example
Studentid number, name, address, year, qca
Sectionindex, room, sched, cat num
Coursecat num, title, desc
Enrollid number, index, grade

DFDs
Data Flow DiagramsModels Operations (Processes)Also used in analysis and design

Traditional approach
System is a collection of processesProcesses interact with data entitiesProcesses accept inputs and produce
outputs

DFD Definition
A graphical representation of data processes in the organization
Depicts the broad overview of system inputs, processes and outputs
Dataflow approach emphasizes the logic underlying the system
A tool for system analysis - aid to conceptualization

Processes
An operation or function in a systemexample: Borrow Book
Involvesdata flow (input and results)Data stores, sources and sinksExample: student and book-copy info are
data that flow into the process; results stored in borrow table

Notation
Circle (Bubble) or Square with rounded corners - Process
Arrows - Data FlowsRectangles – Stores and Entities
(Sources and Sinks)Labels

1BorrowBook
Student Copy Borrow
id num, copy num borrow confirmation

Conventions - Symbols
External entity that can send data or receive dataSource/Origin or Sink/Destination- Noun
Movement of data from one point to another- Noun
Transforming process representing work beingperformed within the system- Verb-Adjective-Noun
Repository of data or data store which could be manual or computerized- Noun

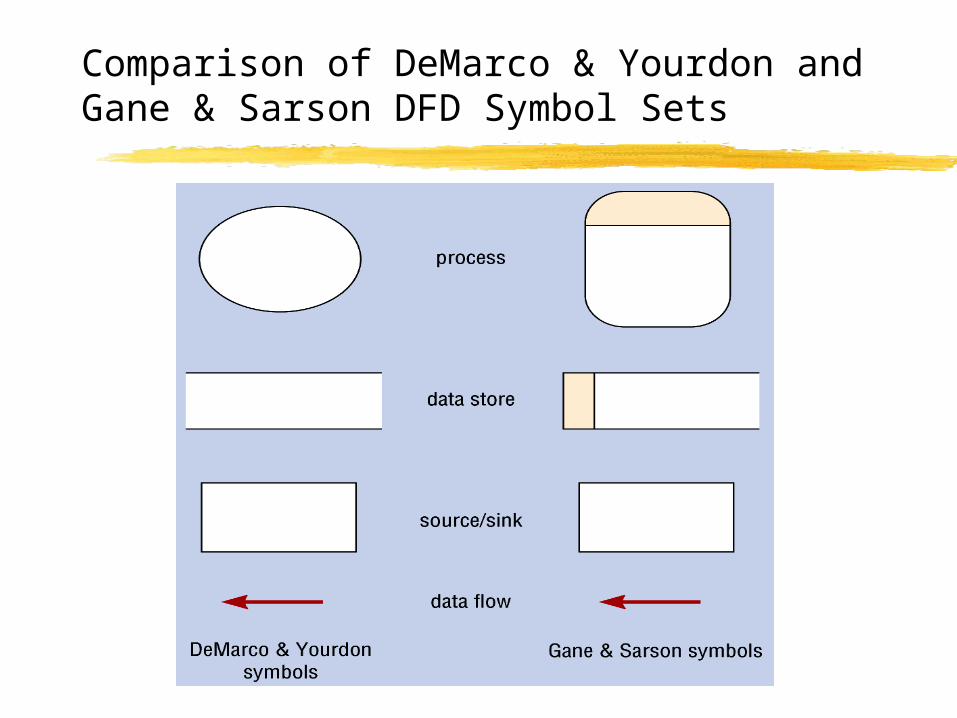
Comparison of DeMarco & Yourdon and Gane & Sarson DFD Symbol Sets

B1 B2 B1 B1
B1 B1
B1 B1
DS1 DS2 DS1
a process is needed to
exchange data flows between
boundaries
a process is needed to update (or use) a data
store
a process is needed to
present data from a data
store
a process is needed to move data
from one data store to another
DS2
DS1
DS1 DS1
DS1
Illegal data flows
Corrected data flows
Illegal Data Flows

DFD Levels
A process may involve sub-processesprovides detail about the process
DFD levels emergeProcess hierarchy also depicted
using a structure chart

1.1Check
StudentStatus
id num borrower status
copy num copy status1.2
CheckBook Copy
Status
Student
Copy

1.3RecordBorrow
id num, copy num
Borrow
borrower status, copy status
borrow confirmation
Copy

Developing DFDs - Top Down Approach
1. List business activities and determineexternal entitiesdata flowsprocessesdata stores
2. Create context diagramshow external entities and data flows in and
out of the systemno detailed processes or data stores

Developing DFDs
3. Draw Diagram 0show processes, keep them generalshow data stores at this level
4. Create the Child Diagram/s for all processes of Diagram 0, as necessary
5. Check for errors and make sure labels are meaningful
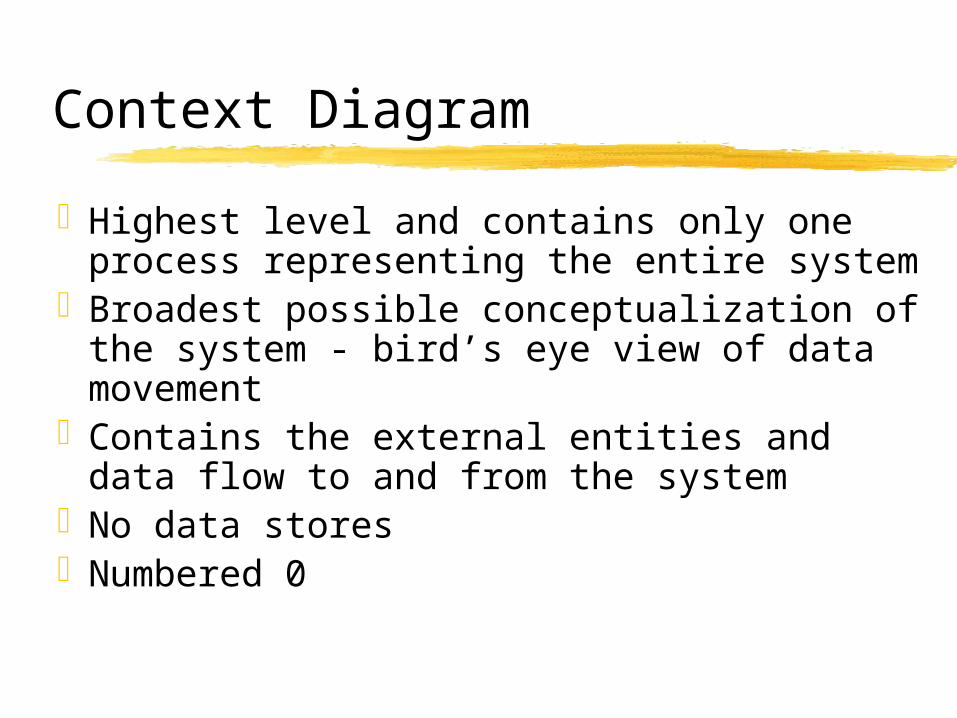
Context Diagram
Highest level and contains only one process representing the entire system
Broadest possible conceptualization of the system - bird’s eye view of data movement
Contains the external entities and data flow to and from the system
No data storesNumbered 0

Context Diagram
Top-level view of an information system that shows the system’s boundaries and scope.
Start by placing the process symbol at the center; place external entities at the perimeter

Context Diagram of Hoosier Burger’s Food Ordering System

Diagram 0 - Next Level
Context diagram explosion into sub-processes; entities and data flows intact
Contains new lower level data flows and data stores; shows details inside black box
Handling of exceptions is ignored Up to 9 processes in single sheetNumbered by integers, left to rightData stores numbered sequentially - “D#”
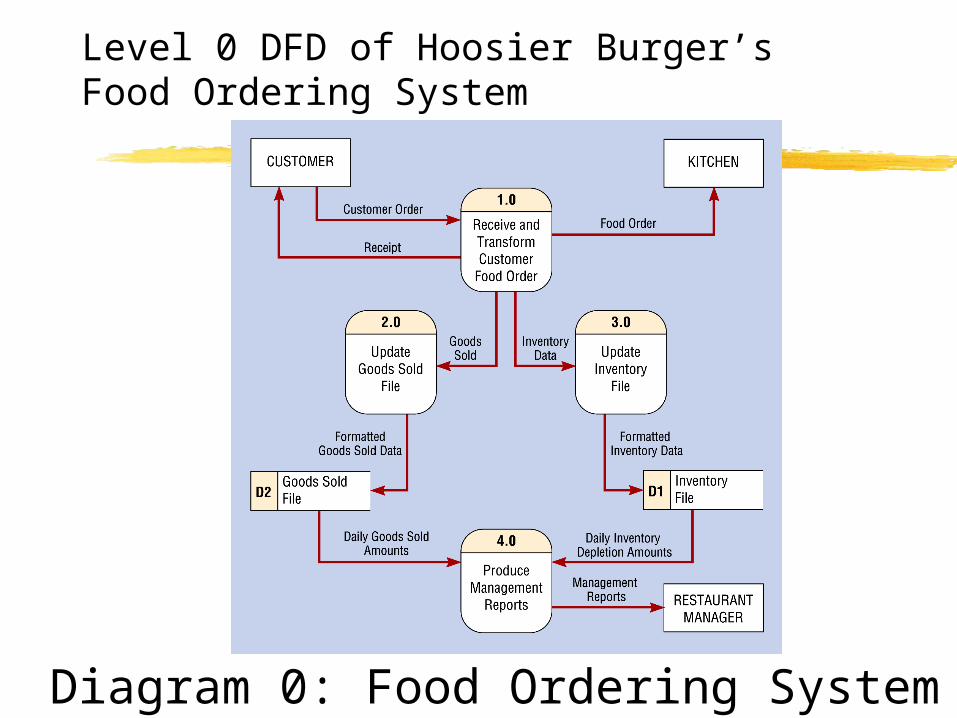
Level 0 DFD of Hoosier Burger’s Food Ordering System
Diagram 0: Food Ordering System

Child Diagram - Low Level
Parent Process in Diagram 0 is exploded to one or more Child Diagrams
Vertical balancing - Diagram 0 data flows intact; called “interface data flow”
New data flows; error line includedNo external entitiesNew data stores; Diagram 0 data stores
are optional

Child Diagram - Low Level
Numbering follows Parent Process - “3.1”
Primitive ProcessIf Parent Process is not exploded and is
functionally primitiveIf Child Diagram Process cannot be
further broken downLogic is written as Process Specifications

Level 1 Diagram Showing Decomposition of Process 1.0 from the Level 0 Diagram
Diagram 1: Receive and Transform Customer Order

Level 1 Diagram Showing the Decomposition of Process 4.0 from the Level 0 Diagram
Diagram 4: Produce Management Reports

Level 2 Diagram Showing the Decomposition of Process 4.3 from the Level 1 Diagram for Process 4.0
Diagram 4.3: Prepare Management Reports

About DFDs
Data flows should “balance” between levels
Number label format X.X.X provides level information
Context DiagramLevel 0 (or system-level) DFD
Notational Variations
Checking for Errors
Forgetting to include a data flow or pointing the arrow in the wrong directionshows all inputs and no outputs or vice versaConnecting data stores and entities directly -
should only connect to a processIncorrect label for process and data flowNot too many processes in a diagram
cluttered diagram and hinders communication

Checking for Errors
Omitting data flow; linear flows with single input and single output are rare and may indicate missing data
Creating unbalanced decomposition in child diagrams; interface data flows should be same as parent
Exception - error lines only in child diagram

DFD Summary
DFDs are structured analysis tools for better understanding of the logical movement of data and its transformation presented in visual form
DFDs are used to document systems independent of its analyst

Summary
Modeling techniques and notation needed in analysis and designmodels data and processes of a system
Other techniques and notationstate diagrams, structure charts,
flowcharts, document flow diagrams, more...
Structured vs OO Paradigmsome techniques specific to the paradigm


![Structured Light IIengineering.nyu.edu/~gerig/CS-GY-6643-S2016/Materials/CS...Structured Lighting: Binary Codes Binary Image Sequence [Posdamer and Altschuler 1982] Each image is a](https://img.pdfslide.us/doc/110x75/5fda9cd9498c370b5d0dc9e5/structured-light-gerigcs-gy-6643-s2016materialscs-structured-lighting-binary.jpg)