Embed Size (px)
Citation preview

Structure, star formation and magnetic fields in the OMC 1 region
UMEKAWA Michihisa (ASAFAS)
Plasma seminar Feb. 2
Coppin et al., A&A, 356, 1031 (2000)

• Observation of OMC1 using 450 and 850 micro m• clump mass function• polarimetry (direction of magnetic fields)

Orion star forming region
•~ 450pc•5h20m-6h00m•+5°- -10°

OMC1

James Clerk Maxwell Telescope (JCMT)SCUBA (Submillimetre Common-User Bolometer Array)Dec. 1997Jan. 1999 for polarimetry data, with a rotating half-wave plate and a fixed etched grid in front of the SCUBA
15m, the largest submillimetre tele-scope in the world.

SCUBA 450 micro m: hexagonal array of 91 bolometers850 micro m: 37 bolometersfield of view: 2’.3Calibration sources: Uranus, Mars, OH231.8, CRL618......Nine over lapping fields of view over two nightsBright bar region could be observed only second night


north-east bar KL

Clump identification
1. part of a clump being truncated by the map edge2. having a negative flux3. having a higher mean signal in larger areas4. having a peak flux above the local background lower than the noise cut-offreject criteria
The fluxes of the peaks above the local backgroud for clumps

•39 clumps at 850 micro m, 28 clumps at 450 micro m 55 source are finally listed•3 clumps are on common regions 850 and 450 micro m covered, but not seen on 450 micro m map. All have some emission on 450 micro m map although not a distinct centroid.•Clumps are generally circle, however at 850 micro m 7 clumps and at 450 micro m 4 clumps are elongated.•~ 20% of the flux within their beam size region•<7% of the total flux of the whole jiggle-map region.•S_ν ν^(2+β) (black body). The mean βis 0.5.∝This is small than 1.75 to 2.5 of the previous work at 350 and 1100 micro m. For clouds This is 1.8 to 2.3.Expecting the growth of grains?


Clump mass function
•The number of clumps dN in mass bin M to M+dM is dN/dM M^(-α)∝
•S_clumps directly traces mass of the clumps. β and temperature of dust are approximately constant. log(dN/dS_clump) vs log S_clump is plotted.

α= 1.51 at 850 micro m and 1.54 at 450 micro m.

Polarimetry data

Conclusions
•4 clouds larger than 0.1 pc contain most of the mass and flux in the region, while the 55 clumps identified on ~0.02pc scales have <7% of the total flux.•magnetic field may have influenced the formation of the brightest cores, Orion-KL and Orion-S, but overall the HII region expansion and fragmentation on the Jeans length appear to be more important dynamically.•a single power-law function of slope -1.5 provides a good fit to the clump masses over a very wide range from 0.1 to 100 Msun.• One more NEXT

Cloud mass function in Motte et al. (1998)
Motte et al., A&A 336, 150 (1998)ρOphiuchi dark cloud : 160pc from the sun.IRAM 30-m telescope located near Granada Spain1.3mm dust continuum emission from the ρOphiuchi main cloudMPIfR 19-channel bolometerrun: 1995 Mar. 17 to 21, 1996 Mar. 13 to 17, 1996 Apr. 3 to 4, and 1997 Feb. 17 to 23

Results

• dN/dM M^-α∝
• α~2.5 for 1 – 10 Msun• α~1.5 for less than 1Msun
• The mass distribution for clumps mimics the behavior of the stellar initial mass function.

• Motte et al. found two slopes of cloud mass function in ρOphiuchi. In contrust their result has only -1.5.
• The changes in mas function slope are potentially a difference between regions of high-mass and low-mass star formation.
Statistical problem: only afew high mass objects identified in each cloud.
Comments in Coppin et al.
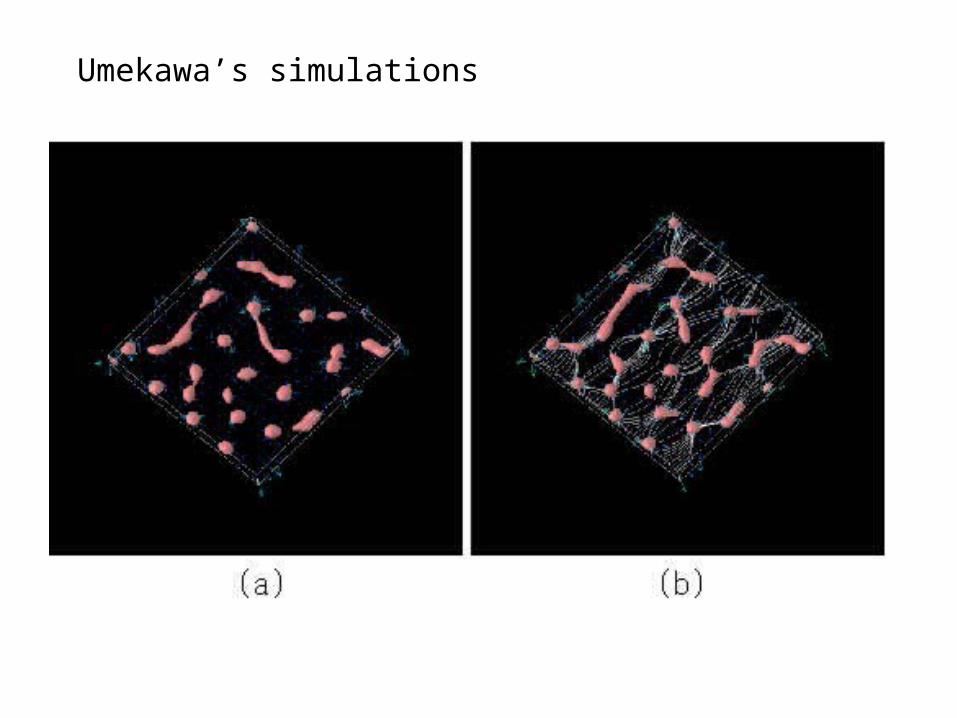
Umekawa’s simulations

(a)
(b)

• (a) Mc~3.5x10 Msun
• (b) Mc~1.1x10^-1Msun
• 微妙である
Umekawa’s simulations