Embed Size (px)
Citation preview
Structure of University Database System and
Data Analysis
Masaaki Ida*
*National Institution for Academic Degrees and University Evaluation, 1-29-1 Gakuen-nishimachi, Kodaira, Tokyo, Japan
Abstract— This paper describes the state of research and
development of data structure for university data, especially,
Japanese university basic survey data and its application for
business intelligence analysis. Our research and development are
aimed for university data reporting and comparative analysis on
the data with consideration on general university information
structure. Institutional data of university, college, or college of
technology are substantially important for data analysis or
knowledge discovery in the higher education management field.
However, university institutional data are not necessarily
standardized and compiled, so it is difficult to integrate their
information for various reporting and data analysis. In the past
decade, a number of investigations of the integrated university
database have been done to deal with various kinds of university
institutional information including university survey or school
basic survey data by considering the structured university data.
This paper describes the state of our research and development
of structure of university database and data analysis system,
which are effectively utilized for data reporting and university
comparative analysis. We explain (i) development of various data
reporting and analysis system of university database system, and
(ii) proposal of generalized layered university database structure
based on Link-based data set.
Keywords— Business intelligence , Data structure, Link base,
School basic survey, XBRL.
I. INTRODUCTION
A. University Institutional Data
Development of education-related databases is substantially
important for data analysis and knowledge discovery in
education field [1]. Institutional data of universities, such as
the number of various kinds of academic staffs, are difficult to
analyze since they are not necessarily fully standardized and
integrated in each university itself or in national level
education-related agencies. However, some advanced
university database systems are progressively developing.
In the United States, Integrated Postsecondary Education
Data System (IPEDS) [2] of National Center for Education
Statistics (NCES) has been developed to collect and analyze
basic institutional information about universities and colleges
in U.S. The system standardizes and accumulates these
information nationwide. This system comprehensively holds
basic institutional data, such as institutional characteristic,
degree completion, enrollment, human resource, finance,
student financial aid, graduation rate, and so on. Moreover,
this system is equipped with facilitated data analysis tools to
conduct university comparative analysis.
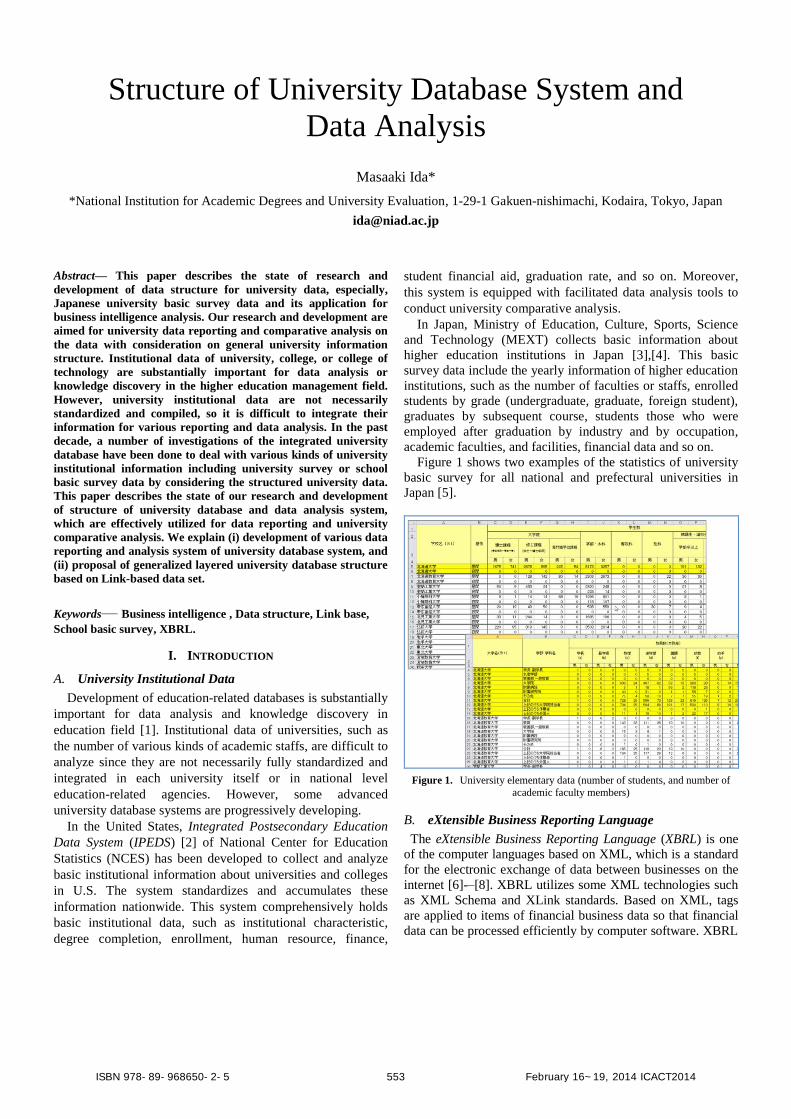
In Japan, Ministry of Education, Culture, Sports, Science
and Technology (MEXT) collects basic information about
higher education institutions in Japan [3],[4]. This basic
survey data include the yearly information of higher education
institutions, such as the number of faculties or staffs, enrolled
students by grade (undergraduate, graduate, foreign student),
graduates by subsequent course, students those who were
employed after graduation by industry and by occupation,
academic faculties, and facilities, financial data and so on.
Figure 1 shows two examples of the statistics of university
basic survey for all national and prefectural universities in
Japan [5].
Figure 1. University elementary data (number of students, and number of
academic faculty members)
B. eXtensible Business Reporting Language
The eXtensible Business Reporting Language (XBRL) is one
of the computer languages based on XML, which is a standard
for the electronic exchange of data between businesses on the
internet [6]-–[8]. XBRL utilizes some XML technologies such
as XML Schema and XLink standards. Based on XML, tags
are applied to items of financial business data so that financial
data can be processed efficiently by computer software. XBRL
ISBN 978-89-968650-2-5 553 February 16~19, 2014 ICACT2014
is implemented in a wide range of scenes such as tax payment
system and financial data transfer system in stock exchange.
XBRL consists of XBRL Report Instance, containing
primarily the business facts being reported, and a set of
Taxonomies, defining metadata about these facts, such as what
the facts mean and how they relate to one another (Figure 2):
・ Instance holds the following information: business facts,
contexts (date and time information, scenario), units,
footnote, and references.
・ Taxonomies are the reporting-area specific hierarchical
dictionaries. The XBRL specification defines five different
kinds of linkbases (Label linkbase, Reference linkbase,
Definition linkbase, Calculation linkbase, and Presentation
linkbase). Taxonomies consist of hierarchical structure ((1)
standard taxonomy, (2) industry taxonomy, (3) company
taxonomy).
Instance and company taxonomy of financial reports must be
submitted from individual company to government agency.
Different taxonomies are required for different purposes in
various application fields.
Figure 2. Submission of financial reports from individual company to
government agency: XBRL Instance and layered Taxonomies ((1) standard
taxonomy, (2) industry taxonomy, (3) company taxonomy)
In this paper, we utilize the technology of XBRL (Link-
based data set) for expressing the various kinds of university
information. We extend or modify taxonomies of standard
XBRL to university information.
II. DATA WARE HOUSE AND ANALYSIS SYSTEM
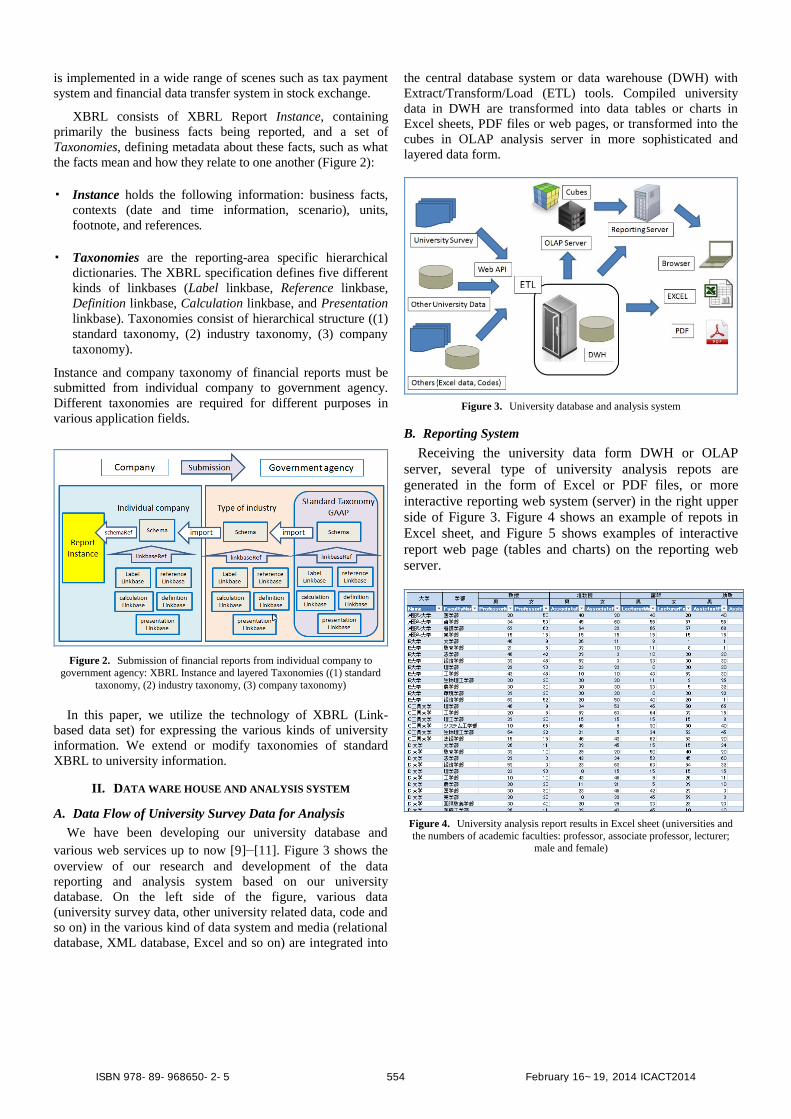
A. Data Flow of University Survey Data for Analysis
We have been developing our university database and
various web services up to now [9]–[11]. Figure 3 shows the
overview of our research and development of the data
reporting and analysis system based on our university
database. On the left side of the figure, various data
(university survey data, other university related data, code and
so on) in the various kind of data system and media (relational
database, XML database, Excel and so on) are integrated into
the central database system or data warehouse (DWH) with
Extract/Transform/Load (ETL) tools. Compiled university
data in DWH are transformed into data tables or charts in
Excel sheets, PDF files or web pages, or transformed into the
cubes in OLAP analysis server in more sophisticated and
layered data form.
Figure 3. University database and analysis system
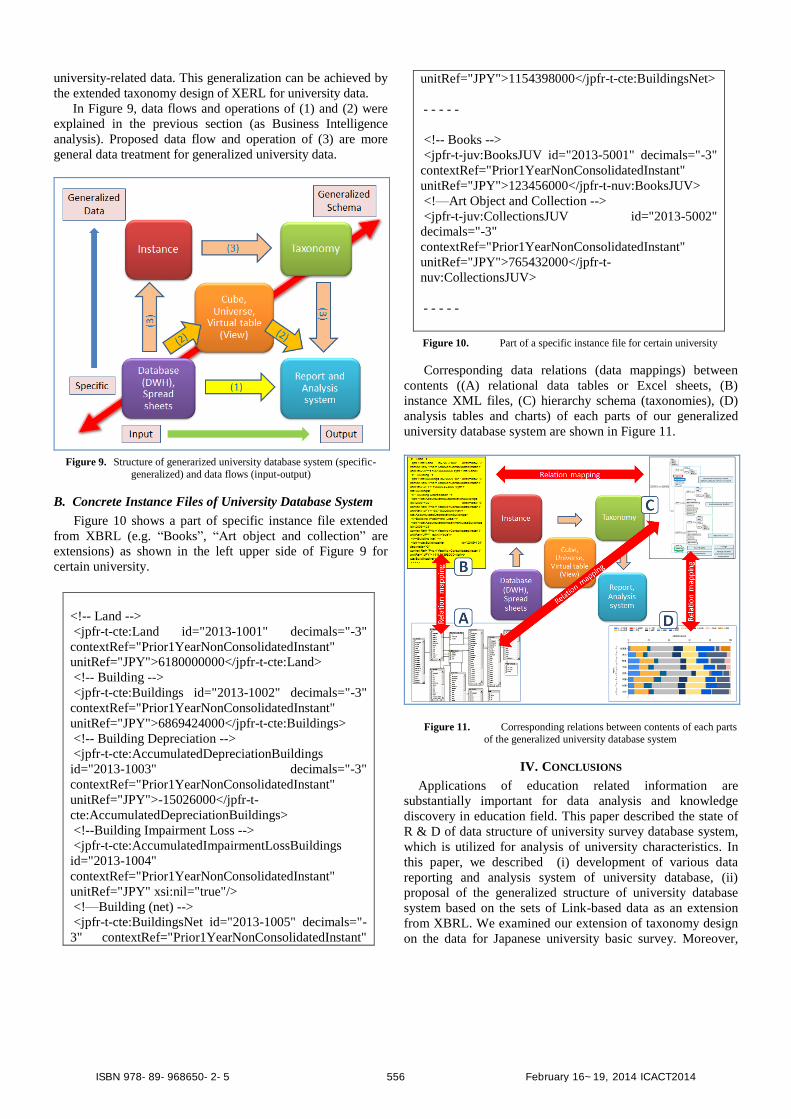
B. Reporting System
Receiving the university data form DWH or OLAP
server, several type of university analysis repots are
generated in the form of Excel or PDF files, or more
interactive reporting web system (server) in the right upper
side of Figure 3. Figure 4 shows an example of repots in
Excel sheet, and Figure 5 shows examples of interactive
report web page (tables and charts) on the reporting web
server.
Figure 4. University analysis report results in Excel sheet (universities and
the numbers of academic faculties: professor, associate professor, lecturer; male and female)
ISBN 978-89-968650-2-5 554 February 16~19, 2014 ICACT2014
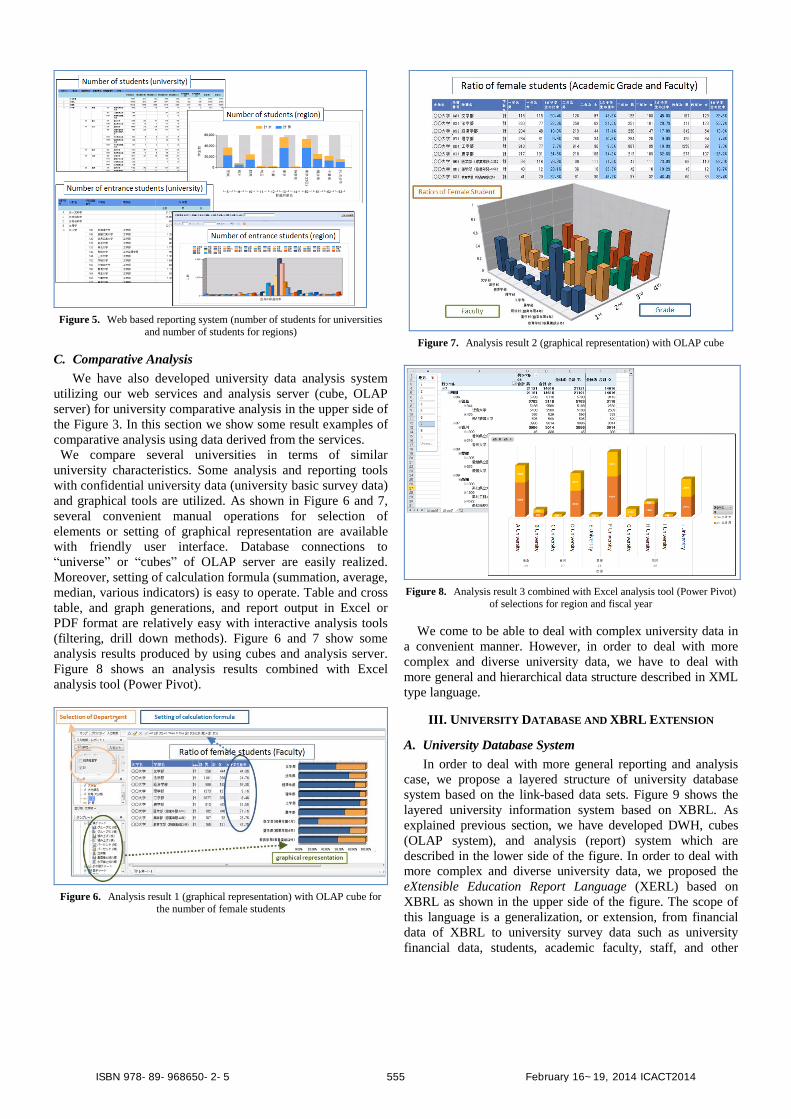
Figure 5. Web based reporting system (number of students for universities
and number of students for regions)
C. Comparative Analysis
We have also developed university data analysis system
utilizing our web services and analysis server (cube, OLAP
server) for university comparative analysis in the upper side of
the Figure 3. In this section we show some result examples of
comparative analysis using data derived from the services.
We compare several universities in terms of similar
university characteristics. Some analysis and reporting tools
with confidential university data (university basic survey data)
and graphical tools are utilized. As shown in Figure 6 and 7,
several convenient manual operations for selection of
elements or setting of graphical representation are available
with friendly user interface. Database connections to
“universe” or “cubes” of OLAP server are easily realized.
Moreover, setting of calculation formula (summation, average,
median, various indicators) is easy to operate. Table and cross
table, and graph generations, and report output in Excel or
PDF format are relatively easy with interactive analysis tools
(filtering, drill down methods). Figure 6 and 7 show some
analysis results produced by using cubes and analysis server.
Figure 8 shows an analysis results combined with Excel
analysis tool (Power Pivot).
Figure 6. Analysis result 1 (graphical representation) with OLAP cube for
the number of female students
Figure 7. Analysis result 2 (graphical representation) with OLAP cube
Figure 8. Analysis result 3 combined with Excel analysis tool (Power Pivot)
of selections for region and fiscal year
We come to be able to deal with complex university data in
a convenient manner. However, in order to deal with more
complex and diverse university data, we have to deal with
more general and hierarchical data structure described in XML
type language.
III. UNIVERSITY DATABASE AND XBRL EXTENSION
A. University Database System
In order to deal with more general reporting and analysis
case, we propose a layered structure of university database
system based on the link-based data sets. Figure 9 shows the
layered university information system based on XBRL. As
explained previous section, we have developed DWH, cubes
(OLAP system), and analysis (report) system which are
described in the lower side of the figure. In order to deal with
more complex and diverse university data, we proposed the
eXtensible Education Report Language (XERL) based on
XBRL as shown in the upper side of the figure. The scope of
this language is a generalization, or extension, from financial
data of XBRL to university survey data such as university
financial data, students, academic faculty, staff, and other
ISBN 978-89-968650-2-5 555 February 16~19, 2014 ICACT2014
university-related data. This generalization can be achieved by
the extended taxonomy design of XERL for university data.
In Figure 9, data flows and operations of (1) and (2) were
explained in the previous section (as Business Intelligence
analysis). Proposed data flow and operation of (3) are more
general data treatment for generalized university data.
Figure 9. Structure of generarized university database system (specific-
generalized) and data flows (input-output)
B. Concrete Instance Files of University Database System
Figure 10 shows a part of specific instance file extended
from XBRL (e.g. “Books”, “Art object and collection” are
extensions) as shown in the left upper side of Figure 9 for
certain university.
<!-- Land -->
<jpfr-t-cte:Land id="2013-1001" decimals="-3"
contextRef="Prior1YearNonConsolidatedInstant"
unitRef="JPY">6180000000</jpfr-t-cte:Land>
<!-- Building -->
<jpfr-t-cte:Buildings id="2013-1002" decimals="-3"
contextRef="Prior1YearNonConsolidatedInstant"
unitRef="JPY">6869424000</jpfr-t-cte:Buildings>
<!-- Building Depreciation -->
<jpfr-t-cte:AccumulatedDepreciationBuildings
id="2013-1003" decimals="-3"
contextRef="Prior1YearNonConsolidatedInstant"
unitRef="JPY">-15026000</jpfr-t-
cte:AccumulatedDepreciationBuildings>
<!--Building Impairment Loss -->
<jpfr-t-cte:AccumulatedImpairmentLossBuildings
id="2013-1004"
contextRef="Prior1YearNonConsolidatedInstant"
unitRef="JPY" xsi:nil="true"/>
<!—Building (net) -->
<jpfr-t-cte:BuildingsNet id="2013-1005" decimals="-
3" contextRef="Prior1YearNonConsolidatedInstant"
unitRef="JPY">1154398000</jpfr-t-cte:BuildingsNet>
- - - - -
<!-- Books -->
<jpfr-t-juv:BooksJUV id="2013-5001" decimals="-3"
contextRef="Prior1YearNonConsolidatedInstant"
unitRef="JPY">123456000</jpfr-t-nuv:BooksJUV>
<!—Art Object and Collection -->
<jpfr-t-juv:CollectionsJUV id="2013-5002"
decimals="-3"
contextRef="Prior1YearNonConsolidatedInstant"
unitRef="JPY">765432000</jpfr-t-
nuv:CollectionsJUV>
- - - - -
Figure 10. Part of a specific instance file for certain university
Corresponding data relations (data mappings) between
contents ((A) relational data tables or Excel sheets, (B)
instance XML files, (C) hierarchy schema (taxonomies), (D)
analysis tables and charts) of each parts of our generalized
university database system are shown in Figure 11.
Figure 11. Corresponding relations between contents of each parts
of the generalized university database system
IV. CONCLUSIONS
Applications of education related information are
substantially important for data analysis and knowledge
discovery in education field. This paper described the state of
R & D of data structure of university survey database system,
which is utilized for analysis of university characteristics. In
this paper, we described (i) development of various data
reporting and analysis system of university database, (ii)
proposal of the generalized structure of university database
system based on the sets of Link-based data as an extension
from XBRL. We examined our extension of taxonomy design
on the data for Japanese university basic survey. Moreover,
ISBN 978-89-968650-2-5 556 February 16~19, 2014 ICACT2014
we extended XBRL taxonomies that can produce more
general institutional indicators for higher education
institutions. In order to handle more general university data
such as the data between some countries, we have to
coordinate differences between those data for effective
comparisons by utilizing our link-based data structure. We
hope that our proposal will play an important role as an
infrastructure for data analysis and knowledge discovery in
higher education field.
REFERENCES
[1] C. Romero, S. Ventura, M. Pechenizkiy and R. Baker (eds.), Handbook
of Educational Data Mining, CRC Press, 2010.
[2] NCES, Integrated Postsecondary Education Data System, IPEDS, http://nces.ed.gov/ipeds/
[3] Ministry of Education, Culture, Sports, Science and Technology, basic
information of higher education institutions in Japan, http://www.mext.go.jp/b_menu/toukei/
[4] Example of survey sheet (sheet of “faculty and student”),
http://www.mext.go.jp/component/b_menu/other/_icsFiles/afieldfile/2012/03/30/1318957_3.pdf
[5] Japanese University Basic Information, [Online]. Available:
http://portal.niad.ac.jp/ptrt/table.html
[6] eXtensible Business Reporting Language, http://www.xbrl.org/
[7] R. Debreceny, C. Felden, B. Ochocki, M. Piechocki, et al., XBRL for Interactive Data: Engineering the Information Value Chain, Springer,
2009.
[8] C. Hoffmann, and L.A. Watson, XBRL, Wiley, 2010. [9] M. Ida, “Web Service and Visualization for Higher Education
Information Providing Service,” Proc. of ICSESS2010, pp.415-418,
2010. [10] M. Ida, “XBRL Extension for Knowledge Discovery in Higher
Education,” Proc. of the 8th International Conference on Fuzzy
Systems and Knowledge Discovery, pp.2177-2180, 2011. [11] M. Ida, “XBRL Financial Database for Higher Education Institutions,”
Proc. of the 14th International Conference on Advanced
Communication Technology, pp. 398-401, 2012.
Masaaki Ida was received the B.E., M.E, and Ph.D. degrees in engineering from Kyoto University, Kyoto,
Japan. He is currently a professor of National Institution
for Academic Degrees and University Evaluation. His current research interests are in computer and systems
science, especially in advanced database system and
communication technology in higher education.
ISBN 978-89-968650-2-5 557 February 16~19, 2014 ICACT2014


![GeneSetDB: A comprehensive meta-database, statistical and ...TFactS [37] GO Gene Ontology [8] Fig. 1. Database structure and analysis scheme. The gene sets are downloaded from source](https://img.pdfslide.us/doc/110x75/603cb46218d052577f29895d/genesetdb-a-comprehensive-meta-database-statistical-and-tfacts-37-go-gene.jpg)