Embed Size (px)
Citation preview
Structure
Myosin-II
and Polymerization
Filaments
of Acanthamoeba
THOMAS D. POLLARD Department of Cell Biology and Anatomy, Johns Hopkins Medical School, Baltimore, Maryland 21205
ABSTRACT Acanthamoeba myosin-II forms filaments of two different sizes. Thin bipolar fila- ments 7 nm wide and 200 nm long consist of 16 myosin-II molecules. Thick bipolar filaments of variable width (14-19 nm) consist of 40 or more myosin-II molecules. Both have a central bare zone 90 nm long and myosin heads projecting laterally at the ends. The heads are arranged in rows spaced 15 nm apart. In the case of the thin myosin-II filaments there are two molecules per row. The thick filaments are formed rapidly and reversibly in the presence of 6-10 mM MgCI2 (or any of five other different divalent cations tested) by the lateral aggregation of thin myosin-II filaments. Acid pFI also favors thick filament formation. Neither the myosin-II concentration (50-1,000/~g/ml) nor ATP has an effect on the morphology of the filaments. The polymerization mechanism was studied quantitatively by measuring the amount of polymer formed (Cp) under various conditions as a function of total myosin-II concentration (G). Above a critical concentration of 15-40/~g/ml, Cp was proportional to G with a slope of 0.5-0.95 depending on conditions. In the range of 0.8-4.9 heavy chain phosphates per molecule, phosphorylation has no effect on the morphology of either the thin or thick myosin-II filaments and only a small effect on the extent of polymerization.
The polymerization of myosin into bipolar filaments has long been studied as a classic example of macromolecular self- assembly (17, 18, 19) and has recently attracted new interest for two reasons. First, recent evidence that light chain (23, 32, 34) and heavy chain (21) phosphorylation can modify polym- erization has led to speculation that filament assembly and disassembly might contribute to the control of motile force generation, especially in nonmuscle cells. Second, electron microscopy of nonmuscle cells has failed to demonstrate myosin filaments even with the aid of ferritin-labeled anti- bodies 05, 36). Although the apparent absence of myosin filaments could be the result of fixation problems, this obser- vation suggests that the myosin of nonmuscle cells is not permanently in the form of filaments.
One approach to learning how a cell regulates myosin po- lymerization, is to characterize the mechanism by which puri- fied myosin forms filaments under well-defined conditions. Elegant quantitative studies of the polymerization of striated muscle myosin (9, 10, 18, 19, 30) have established that under the conditions in which quantitative measurements can be made by sedimentation velocity ultracentrifugation (alkaline pH and relatively high ionic strength), skeletal muscle myosin forms filaments by a condensation-polymerization mechanism like actin and flagellin. Above a critical concentration a con-
stunt monomer concentration is in equilibrium with any con- centration of polymer. The critical concentration depends on the salt concentration, pH, and hydrostatic pressure. Smooth muscle myosin polymerization is sensitive to the same solution conditions, but it does not exhibit a critical concentration and the concentration of monomer varies with total protein concen- tration (25). The theoretical basis of this behavior is not yet understood. Previous studies of cytoplasmic myosin polymeri- zation have emphasized filament structure and simple quanti- tative analysis of the ionic conditions which support polymer- ization (3, 4, 16, 23, 26, 27, 32). It is not known, for example, whether cytoplasmic myosins use a condensation polymeriza- tion or some other mechanism of assembly.
Of the various cytoplasmic myosins one might use in assem- bly studies, Acanthamoeba myosin-II has some advantages. More is known about its physical properties (29) immunochem- istry and enzymatic activity (6-8, 12, 13, 20, 24) than most other cytoplasmic myosins. It consists of two 175,000 molecular weight heavy chains and three or four light chains. It has two heads and a tail ~90 nm long. Compared with other myosins, the tail is shorter by one-third and the heavy chains are correspondingly smaller. Myosin-II can be isolated with 1-3 heavy chain phosphates per molecule and the actin-activated ATPase activity is inversely proportional to the extent of
THE JOURNAL OF CeLL BIOLOGY. VOLUMe 95 DECEMBER 1982 816-825 816 © ]-he Rockefeller University Press • 0021-9525/82/12/0816/10 $1.00
on November 21, 2018jcb.rupress.org Downloaded from http://doi.org/10.1083/jcb.95.3.816Published Online: 1 December, 1982 | Supp Info:
phosphorylation (6-8). A partially purified kinase will add heavy chain phosphates at three different sites up to a total of six phosphates per molecule (8). All of these phosphates are thought to be located within 5 nm of the end of the myosin-II tail (5).
Myosin-II forms very small bipolar filaments consisting of 12-16 molecules (29). These filaments are unique because the
bare zone is only 100 nm long like the myosin-II tail. All other myosin filaments have bare zones 150 nm long. In the first study of myosin-II filaments it was noted that the filaments were much thicker under some conditions, such as 10 mM CaC12 (29). Furthermore, Collins and Korn (7) showed that MgCI2 in the range of 6-7 mM increased the sedimentation rate of very low (<20 gg/ml) concentrations of both phospho- rylated and partially dephosphorylated myosin-II,
The very small size of the myosin-II filaments suggests that the assembly mechanism might be more amenable to quanti- tative analysis than that of larger myosin filaments. For ex- ample, muscle myosin polymerization can only be studied quantitatively under rather restricted, nonphysiological condi- tions in which the filaments are relatively small.
The goals of this study were to define the structure of myosin-II filaments by electron microscopy and to study their mechanism of assembly looking for possible effects of heavy chain phosphorylation. Myosin-II forms thin bipolar filaments composed of 16 molecules with the heads arranged in rows 15 nm apart and anchored to the backbone by a very short segment of the tail. These thin filaments can rapidly and reversibly aggregate laterally to form thicker filaments. The critical concentration for myosin-II polymerization is much lower than for skeletal muscle myosin due, perhaps, to the small size of the myosin-II filaments. Heavy chain phospho- rylation in the range of 0.8-4.9 phosphates per molecule has a relatively minor effect on the polymerization process.
MATERIALS AND METHODS
Acanthamoeba myosin-II was purified as described by Pollard et al. (29) or by a similar procedure omitting the low ionic strength extraction of the actomyosin precipitate. Samples from four different preparations were dephosphorytated with potato alkaline phosphatase (Sigma Chemical Co., St. Louis, MO) as described by Collins and Korn (7). The reaction was carried out for 3½ to 5 h at 30°C. The phosphate content myosin-lI was measured by a malachite green assay on samples washed with trichloroacetic acid and ashed in Mg(NOa)2 (33).
Myosin-lI filaments were formed by dialysis of soluble myosin in 0.5 M KCI, 10 mM imidazole, pH 7 against various buffers. Sample volumes were 50-300 #1. The bags had a flat width of 0.5 cm and the samples were small enough that the internal solution was < 1 mm thick. Under these conditions the half time for dialysis of KC1 is ~4 rain. In both electron microscopic and quantitative studies it is important to analyze the samples soon after removing salt to polymerize the filaments, because of time-dependent, at least partially irreversible, formation of large head to head aggregates of the filaments. In these experiments the samples were usually dialyzed for 30 min and analyzed immediately.
Myosin-II filament formation was assayed quantitatively by sedimentation in a Beckman Airfuge (Beckman Instruments, Inc., Fullerton, CA). Samples of 150- 170/tl were centrifuged at 23 psi (g average = 105,000) for 15 min. Aliquots of 90/.d were removed from the meniscus, diluted with 500 gl of 0.5 M KCI and the myosin concentration measured by absorbance at 230 nm. The extinction coef- ficient at 230 nm is 3 . 3 0 D . m l / m g . Consequently, after dilution a sample containing 100 ~g myosin-II/ml has an absorbance of 0.043. Although this absorbance is low, it was possible with careful pipetting to measure reproducibly supernatant myosin-II concentrations in the 10-50 gg /ml range.
Specimens were prepared for electron microscopy by negative staining. Sam- pies of 5 gl containing 100 gg /ml myosin-II were placed on glow-discharged carbon coated grids for 30 s, drained by touching the edge of the grid to filter paper, reverted onto a drop of buffer for 5 s, drained, inverted on a drop of 1% aqueous uranyl acetate for 15 s, drained and air dried using suction through a Pasteur pipette with a constricted tip to remove any excess stain. Alternatively, pellets of filaments were fixed for 30 min at room temperature with 100 mM gtutaraldehyde, 2 mg/ml tannic acid in 10 mM MgCI~, 20 mM KC1, 10 mM
POLLARD
imidazote pH 6.8, washed, treated with 4 mM OsO4 in 50 mM KC1, 5 mM MgC12 100 mM phosphate buffer, pH 6.0 at room temperature for 20 rain, dehydrated, and embedded. Micrographs were taken on a JE01 100 CX electron microscope at 33,000 or 50,000 magnification. The microscope was calibrated with negatively stained tropomyosin paracrystals. Filament widths were measured to the nearest 0.1 mm on prints enlarged 2.5x using a lupe with a reticle. Bare zone and total lengths were measured to the nearest mm with a ruler or digitizer.
RESULTS
Like other myosins, the size of myosin-lI filaments depends on the solution conditions. Generally the filaments fall into one of two extreme classes: thin bipolar filaments composed of ~ 16 molecules and thick filaments that are formed rapidly and reversibly by the lateral aggregation of the thin filaments. I will first describe the structure of the two major filament types and then, quantitative studies of the polymerization reaction and a detailed survey of how solution conditions affect filament structure. The experiments were done with myosin-II with 0.8- 4.9 heavy chain phosphates per molecule to evaluate the effect of phosphorylation on filament formation. This is the range of phosphorylation that affects the actin-activated myosin-II ATPase (6).
Structure of Myosin-II Filaments
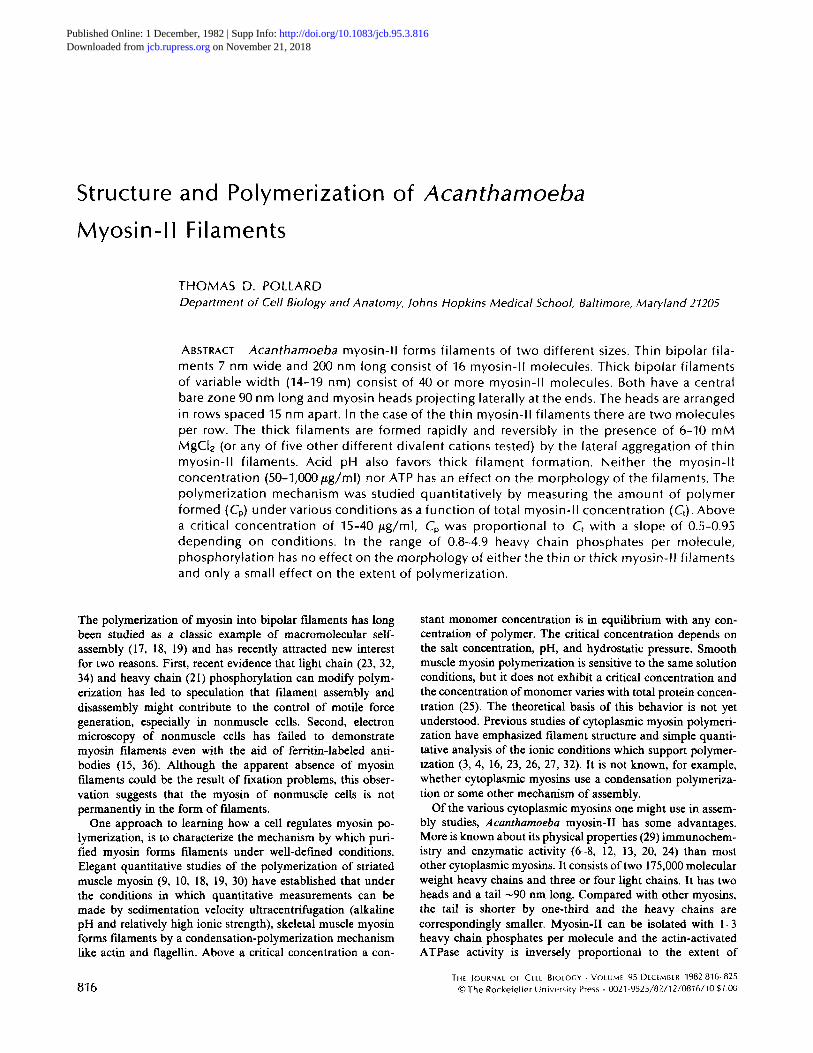
The size of the myosin-II molecule (Fig. 1 b) has been re- examined using the replicas from the previous study (29), but with special care to obtain the absolute length of the tail. This was done by recording micrographs of the molecules and a tropomyosin paracrystal standard without changing lens cur- rent. The tail lengths had a Gaussian distribution (Fig. l g) with a mean of 86 nm (SD 12 nm).
In 20 mM KC1 at pH 6.8 myosin-II filaments are bipolar with a central bare zone like other myosin filaments, but they are remarkable because they are exceedingly small and, like other cytoplasmic myosin filaments, very uniform in size (Fig. 1; Table I). The overall length is -200 nm. The bare zone measures - 6 nm wide in its center (Fig. 2; Table I). Although the variation in the measured width is small (SD 15%), this is probably an underestimate of the true width due to stain piling up around these thin myosin-II filaments. The mean length of the bare zone (the distance between the first globular projec- tions cn either side) is - 9 0 nm and the variation in this dimension is considerably larger than the other two dimensions (SD 20%). Globular material, presumably myosin heads, is present at both ends of the filaments. In many cases the heads are clumped together, but in well stained specimens the heads are occasionally spread well enough to be resolved. Up to 12 heads have been counted at one end. Because each molecule has two heads, the thin myosin-II filaments must be composed of at least 12 myosin-II molecules. In the best cases (Fig. I c) the two heads of individual myosin molecules can be seen attached to the filament backbone by stubby projections ~ 10 nm long. There are one or two myosin-II molecules visible at any longitudinal position along the backbone. The spacing of these rows of heads is not regular, but is on the order of 15-20 r im .
In 10 mM MgC12, 20 mM KC1 at pH 6.8 myosin-II filaments are much thicker than in KCI alone (Figs. 2 and 3). Like the thin myosin-II filaments, most of these thick filaments are bipolar with a central bare zone and globular projections at both ends. Compared with the thin myosin-II filaments, the thick myosin-II filaments are much more variable in size and shape (Figs. 2 and 3; Table I). Their mean length is -250-300 nm. The bare zone is - 9 0 nm long and -15 nm wide with a
5tructure & Polymerization of Acanthamoeba Myosin-ll Filaments 817
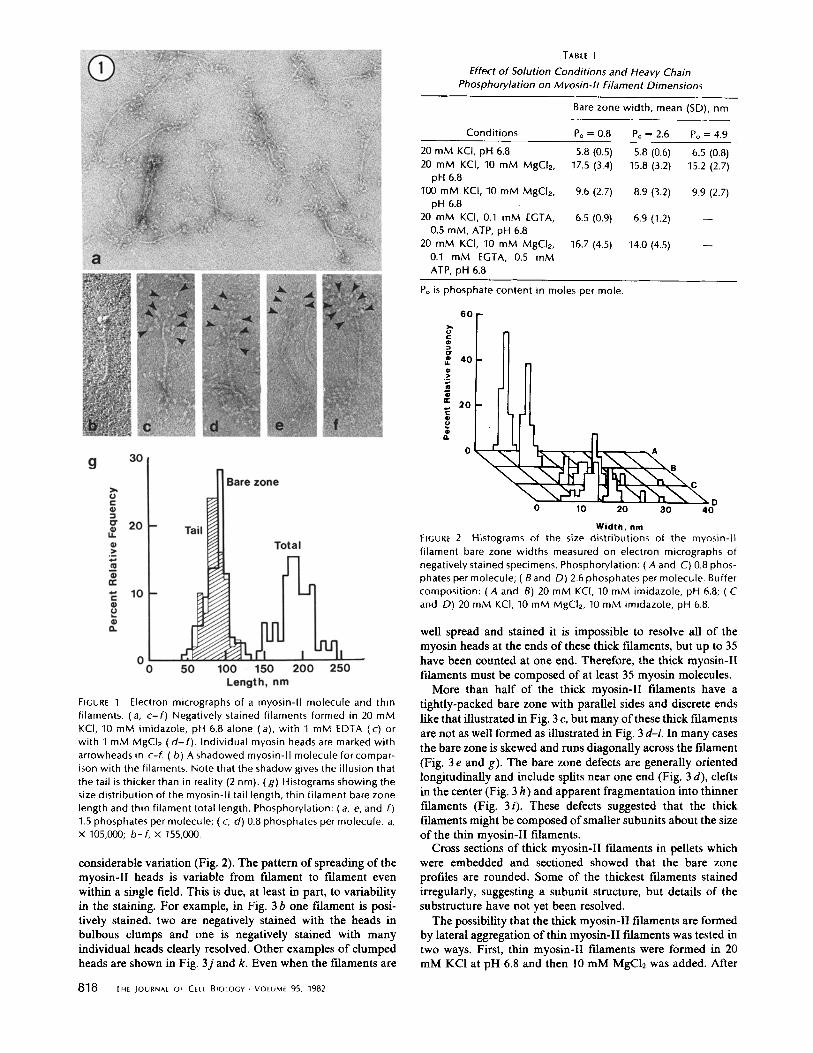
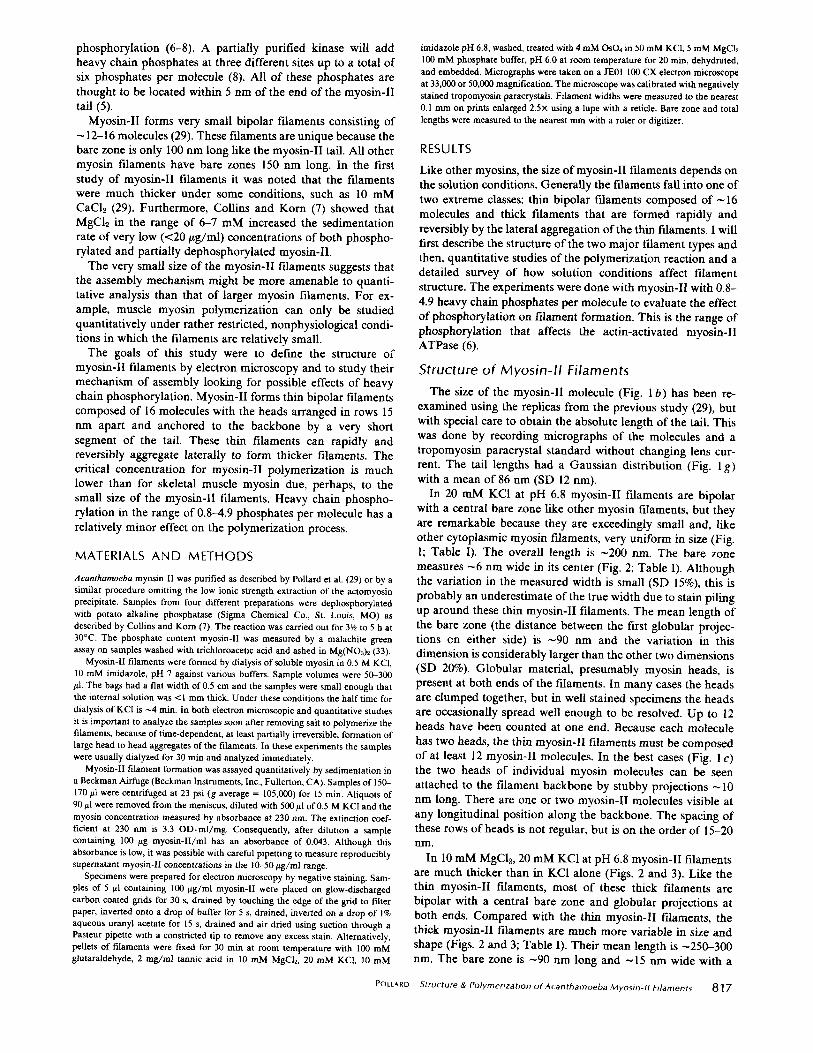
TABLE I
Effect of Solution Conditions and Heavy Chain Phosphorylation on Myosin-I/Filament Dimensions
Bare zone width, mean (SD), nm
Conditions Po = 0.8 PQ = 2.6 Po = 4.9
20 mM KCI, pH 6.8 5.8 (0.5) 5.8 (0.6) 6.5 (0.8) 20 mM KCl, 10 mM MgCI~, 17.5 (3.4) 15.8 (3.2) 15.2 (2.7)
pH 6.8 100 mM KCl, 10 mM MgCl2, 9.6 (2.7) 8.9 (3.2) 9.9 (2.7)
pH 6.8 20 mM KCI, 0.1 mM EGTA, 6.5 (0.9) 6.9 (1.2) - -
0.5 raM, ATP, pH 6.8 20 mM KCl, 10 mM MgCl2, 16.7 (4.5) 14.0 (4.5) - -
0.1 mM EGTA, 0.5 mM ATP, pH 6.8
Po is phosphate content in moles per mole.
6 0
4 0
~" 2o
o A
D 0 10 20 30 40
Width, nm EIGURE 2 Histograms of the size distributions of the myosin-II f i lament bare zone widths measured on electron micrographs of negatively stained specimens. Phosphorylation: ( A and C) 0.8 phos- phates per molecule; ( B and D) 2.6 phosphates per molecule. Buffer composition: ( A and B) 20 mM KCl, 10 mM imidazole, pH 6.8; ( C and D) 20 mM KCI, 10 mM MgCI2, 10 mM imidazole, pH 6.8.
FIGURE 1 Electron micrographs of a myosin-II molecule and thin filaments. (a, c- f ) Negatively stained filaments formed in 20 mM KCl, 10 mM imidazole, pH 6.8 alone (a), wi th 1 mM EDTA (c) or with 1 mM MgCI2 ( d - f ) . Individual myosin heads are marked with arrowheads in c-f. (b) A shadowed myosin-II molecule for compar- ison with the filaments. Note that the shadow gives the illusion that the tail is thicker than in reality (2 nm). (g) Histograms showing the size distribution of the myosin-II tail length, thin f i lament bare zone length and thin f i lament total length. Phosphorylation: ( a, e, and f) 1.5 phosphates per molecule; ( c, d) 0.8 phosphates per molecule, a, x 105,000; b-f , x 155,000.
considerable variation (Fig. 2). The pattern of spreading of the myosin-II heads is variable from fdament to fdament even within a single field. This is due, at least in part, to variability in the staining. For example, in Fig. 3 b one filament is posi- tively stained, two are negatively stained with the heads in bulbous clumps and one is negatively stained with many individual heads clearly resolved. Other examples of clumped heads are shown in Fig. 3j and k. Even when the filaments are
well spread and stained it is impossible to resolve all of the myosin heads at the ends of these thick filaments, but up to 35 have been counted at one end. Therefore, the thick myosin-II filaments must be composed of at least 35 myosin molecules.
More than half of the thick myosin-II fdaments have a tightly-packed bare zone with parallel sides and discrete ends like that illustrated in Fig. 3 c, but many of these thick fdaments are not as well formed as illustrated in Fig. 3 d-i. In many cases the bare zone is skewed and runs diagonally across the filament (Fig. 3 e and g). The bare zone defects are generally oriented longitudinally and include splits near one end (Fig. 3 d), clefts in the center (Fig. 3 h) and apparent fragmentation into thinner filaments (Fig. 3i). These defects suggested that the thick filaments might be composed of smaller subunits about the size of the thin myosin-II filaments.
Cross sections of thick myosin-II filaments in pellets which were embedded and sectioned showed that the bare zone profiles are rounded. Some of the thickest filaments stained irregularly, suggesting a subunit structure, but details of the substructure have not yet been resolved.
The possibility that the thick myosin-II fdaments are formed by lateral aggregation of thin myosin-II fdaments was tested in two ways. First, thin myosin-II filaments were formed in 20 mM KC1 at pH 6.8 and then 10 mM MgCI2 was added. After
818 THE JOURNAL OF CELL BIOLOGY. VOLUME 95, 1982
FIGUR[ 3 Electron micrographs of negatively stained myosin-II thick filaments formed in 20 mM KCI, 10 mM MgCIz, 10 mM imidazole, pH 6.8. Phosphorylation: (a-i) 0.8 phosphates per molecule: ( j and k) 2.6 phosphates per molecule. The 15-nm periodicity of the side arms is indicated in ( j ) and (k). a and b, x 105,000; c-h, x 155,000.
60 s in 10 mM MgCh the thin myosin-II filaments were converted quantitatively into thick filaments with the same size, shape, and range of longitudinal defects found in fdaments formed by dialysis of myosin-II in 0.5 M KCI (_10 mM MgC12) against 20 mM KCI, 10 mM MgCI~ at pH 6.8 for 5-60 min (Fig. 4a). Second, thick myosin-II filaments formed in 20 mM KC1, 10 mM MgC12 at pH 6.8 were adsorbed to electron microscope grids and then washed on the grid with 20 mM KCI, 0.2 mM EDTA. Within 5 s the thick fdaments start to break up longitudinally into thin bipolar thin filaments (Fig. 4 b). This fragmentation is complete within 15 s, although the heads remain aggregated, holding the thin myosin-II fdaments in loose bundles. Together, these experiments indicate that the thick filaments are formed rapidly and reversibly by lateral aggregation of thin fdaments.
Quantitative Analysis of the Polymerization Process
The extent of polymerization was measured by sedimenta- tion in an Airfuge. At 23 psi (105,000 g average) myosin-II monomers in 0.5 M KC1 sediment out of the upper 60% of the
sample at a rate of 0.4% per mmute. This corresponds to a sedimentation coefficient of about 6S as expected for myosin- II (29). Both myosin-II thin filaments (in 20 mM KCI) and thick fdaments (in 20 mM KC1, 10 mM MgCI2, are cleared from the top 60% of the airfuge tube in < 15 min, leaving a slowly sedimenting species, presumably monomer or dimer, in the supematant. Thus, during the 15-min centrifugation used to assay polymerization, all of the polymer and ~6% of the slowly sedimenting species are removed from the supernatant (monomer) fraction. No correction was made for this small monomer loss. All of the assays reported here were done using absorbance at 230 nm to measure the concentration of myosin- II in the monomer fraction, but identical results were obtained in control experiments using the Bradford (1) protein assay. Other control experiments established that there was no loss of myosin-II from the monomer fraction due to adsorption to the centrifuge tubes.
The extent of myosin-II filament formation depends on myosin-II concentration and the solution conditions (Fig. 5; Table II; following sections). No myosin-II pellets at very low total myosin concentrations (< 15 #g/ml) under any of the conditions tested. At a critical concentration (which varies
POLLARD Structure & Polymerization of Acanthamoeba Myosin-II Filaments 819
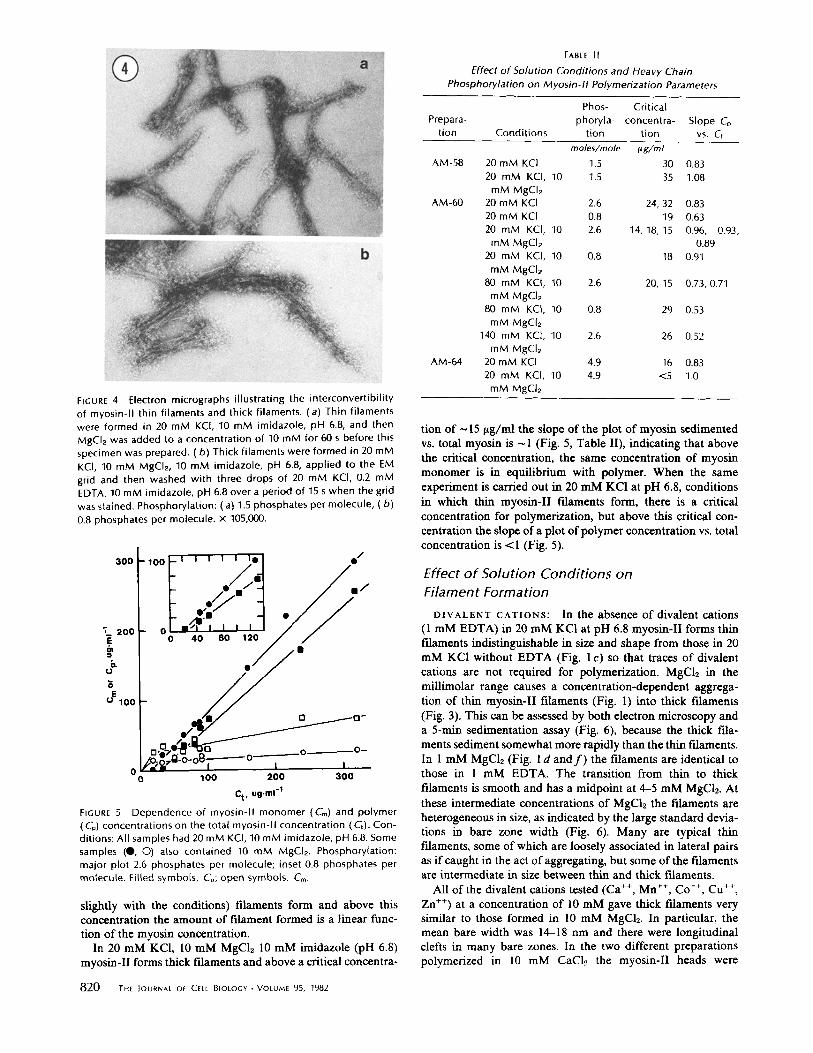
FIGURE 4 Electron micrographs illustrating the interconvert ibi l i ty of myosin-II thin filaments and thick filaments. (a) Thin filaments were formed in 20 mM KCI, 10 mM imidazole, pH 6.8, and then MgCI2 was added to a concentration of 10 mM for 60 s before this specimen was prepared. (b) Thick filaments were formed in 20 mM KCI, 10 mM MgCI2, 10 mM imidazole, pH 6.8, applied to the EM grid and then washed with three drops of 20 mM KCI, 0.2 mM EDTA, 10 mM imidazole, pH 6.8 over a period of 15 s when the grid was stained. Phosphorylation: (a) 1.5 phosphates per molecule, (b ) 0.8 phosphates per molecule, x 105,000.
300 1 0 0 b - ! I ) ! ) I o l O /
I 0
OE 100
| I o 0 100 2 0 0 3 0 0
Ct, ug.ml -I
FIGURE 5 Dependence of myosin-II monomer (Cm) and polymer (Cp) concentrations on the total myosin-II concentration (G). Con- ditions: All samples had 20 mM KCI, 10 mM imidazole, pH 6.8. Some samples (O, O) also contained 10 mM MgCI2. Phosphory[ation: major plot 2.6 phosphates per molecule; inset 0.8 phosphates per motecule. Filled symbols, Co; open symbols, Cm.
slightly with the conditions) filaments form and above this concentration the amount of filament formed is a linear func- tion of the myosin concentration.
In 20 mM KC1, 10 mM MgCI2 10 mM imidazole (pH 6.8) myosin-II forms thick filaments and above a critical concentra-
820 THE JOURNAL Of CELL BIOLOGY-VOLUME 95, 1982
TABLE II
Effect of Solution Conditions and Heavy Chain Phosphorylation on Myosin-II Polymerization Parameters
Phos- Critical Prepara- phoryla- concentra- Slope Co
tion Conditions tion tion vs. G moles/mole #g/ml
AM-58 20 mM KCI 1.5 30 0.83 20 mM KCI, 10 1.5 35 1.08
mM MgCI2 AM-60 20 mM KCI 2.6 24, 32 0.83
20 mM KCI 0.8 19 0.63 20 mM KCl, 10 2.6 14, 18, 15 0.96, 0.93,
mM MgCI2 0.89 20 mM KCI, 10 0.8 18 0.91
mM MgCI2 80 mM KC[, 30 2.6 20, 15 0.73, 0.71
mM MgCl2 80 mM KCI, 10 0.8 29 0.53
mM MgCI2 140 mM KCl, 10 2.6 26 0.52
mM MgCI2 AM-64 20 mM KCI 4.9 16 0.83
20 mM KCI, 10 4.9 <5 1.0 mM MgCl2
tion of ~ 15 vg/ml the slope of the plot of myosin sedimented vs. total myosin is ~ 1 (Fig. 5, Table II), indicating that above the critical concentration, the same concentration of myosin monomer is in equilibrium with polymer. When the same experiment is carried out in 20 mM KCI at pH 6.8, conditions in which thin myosin-II filaments form, there is a critical concentration for polymerization, but above this critical con- centration the slope of a plot of polymer concentration vs. total concentration is <1 (Fig. 5).
Effect of Solution Conditions on Filament Formation
DIVALENT CATIONS" In the absence of divalent cations (1 mM EDTA) in 20 mM KC1 at pH 6.8 myosin-II forms thin filaments indistinguishable in size and shape from those in 20 mM KCI without EDTA (Fig. 1 c) so that traces of divalent cations are not required for polymerization. MgCh in the millimolar range causes a concentration-dependent aggrega- tion of thin myosin-II filaments (Fig. 1) into thick filaments (Fig. 3). This can be assessed by both electron microscopy and a 5-rain sedimentation assay (Fig. 6), because the thick fila- ments sediment somewhat more rapidly than the thin filaments. In 1 mM MgCI2 (Fig. I d and f ) the filaments are identical to those in 1 mM EDTA. The transition from thin to thick filaments is smooth and has a midpoint at 4-5 mM MgCI2. At these intermediate concentrations of MgCh the filaments are heterogeneous in size, as indicated by the large standard devia- tions in bare zone width (Fig. 6). Many are typical thin filaments, some of which are loosely associated in lateral pairs as if caught in the act of aggregating, but some of the filaments are intermediate in size between thin and thick filaments.
All of the divalent cations tested (Ca ++, Mn ++, Co ++, Cu ++, Zn ++) at a concentration of 10 mM gave thick filaments very similar to those formed in 10 mM MgC12. In particular, the mean bare width was 14-18 nm and there were longitudinal clefts in many bare zones. In the two different preparations polymerized in 10 mM CaCI~ the myosin-II heads were
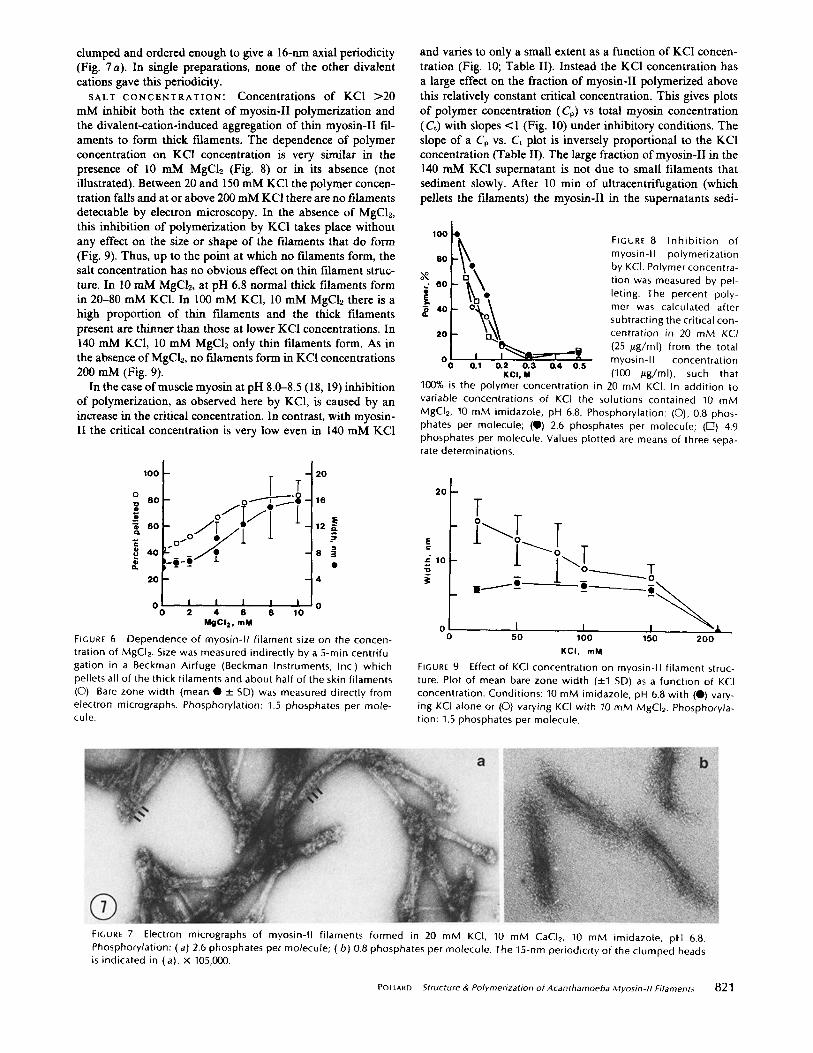
clumped and ordered enough to give a 16-nm axial periodicity (Fig. 7a). In single preparations, none of the other divalent cations gave this periodicity.
SALT CONCENTRATION" Concentrations of KC1 >20 mM inhibit both the extent of myosin-II polymerization and the divalent-cation-induced aggregation of thin myosin-II fil- aments to form thick t'daments. The dependence of polymer concentration on KC1 concentration is very similar in the presence of 10 mM MgC12 (Fig. 8) or in its absence (not illustrated). Between 20 and 150 mM KC1 the polymer concen- tration falls and at or above 200 mM KCI there are no filaments detectable by electron microscopy. In the absence of MgCI2, this inhibition of polymerization by KC1 takes place without any effect on the size or shape of the filaments that do form (Fig. 9). Thus, up to the point at which no t'daments form, the salt concentration has no obvious effect on thin filament struc- ture. In 10 mM MgClz, at pH 6.8 normal thick filaments form in 20-80 mM KCI. In 100 mM KC1, 10 mM MgCI2 there is a high proportion of thin filaments and the thick filaments present are thinner than those at lower KCI concentrations. In 140 mM KCI, 10 mM MgC12 only thin filaments form. As in the absence of MgCI2, no fdaments form in KCI concentrations 200 mM (Fig. 9).
In the case of muscle myosin at pH 8.0-8.5 (18, 19) inhibition of polymerization, as observed here by KC1, is caused by an increase in the critical concentration. In contrast, with myosin- II the critical concentration is very low even in 140 mM KCI
1OO
o 8 0
8 0
~ 4o g.
20
,S•__ T 0 I f ~
i ._~_~
2 0
16
12 R" F
8 5
4
0 I I I I I 0 0 2 4 6 8 10
MgCI2, mM
FIGURE 6 Dependence of myosin-I/ f i lament size on the concen- trat ion of MgCI2. Size was measured indirectly by a 5-rain centrifu- gation in a Beckman Airfuge (Beckman Instruments, Inc.) which pellets all of the thick filaments and about half of the skin filaments (O). Bare zone width (mean • _ SD) was measured directly from electron micrographs. Phosphorylation: 1.5 phosphates per mole- cule.
and varies to only a small extent as a function of KC1 concen- tration (Fig. 10; Table II). Instead the KC1 concentration has a large effect on the fraction of myosin-II polymerized above this relatively constant critical concentration. This gives plots of polymer concentration (Cp) vs total myosin concentration (Ct) with slopes <1 (Fig. 10) under inhibitory conditions. The slope of a Co vs. Ct plot is inversely proportional to the KCI concentration (Table II). The large fraction of myosin-II in the 140 mM KCI supernatant is not due to small filaments that sediment slowly. After 10 min of ultracentrifugation (which pellets the filaments) the myosin-II in the supernatants sedi-
0 0.1 0.2 0.3 0.4 0.5 KCI, M
FIGURE 8 Inh ib i t i on of myosin-II polymerizat ion by KCI. Polymer concentra- t ion was measured by pel- leting. The percent poly- mer was calculated after subtracting the critical con- centration in 20 mM KCI (25 p.g/ml) from the total myosin-II concentration (100 .ug/ml), such that
100% is the polymer concentration in 20 mM KCI. In addit ion to variable concentrations of KCI the solutions contained 10 mM MgCl2, 10 mM imidazole, pH 6.8. Phosphorylation: (O), 0.8 phos- phates per molecule; (0) 2.6 phosphates per molecule; (1-1) 4.9 phosphates per molecule. Values plotted are means of three sepa- rate determinations.
20 m
T =. I i
I I I "~. 50 100 150 200
KCI, mM
FIGURE 9 Effect of KCI concentrat ion on myosin-II f i lament struc- ture. Plot of mean bare zone width (+1 SD) as a function of KCl concentration. Conditions: 10 mM imidazole, pH 6.8 with (0) vary- ing KCI alone or (O) varying KCI with 10 mM MgCI2. Phosphoryla- tion: 1.5 phosphates per molecule.
FIGURE 7 Electron micrographs of myosin-II f i laments formed in 20 mM KCI, 10 mM CaCI2, 10 mM imidazole, p t l 6.8. Phosphorylation: (a) 2.6 phosphates per molecule; ( b ) 0.8 phosphates per molecule. The 15-nm periodici ty of the c lumped heads is indicated in (a). x 105,000.
POLLARD Structure & Polymerization of Acanthamoeba Myosin-II Filaments 821
o /
120 O ~ L~/
o
4 o
o 40 80 120 160
Ct, ug.ml "1
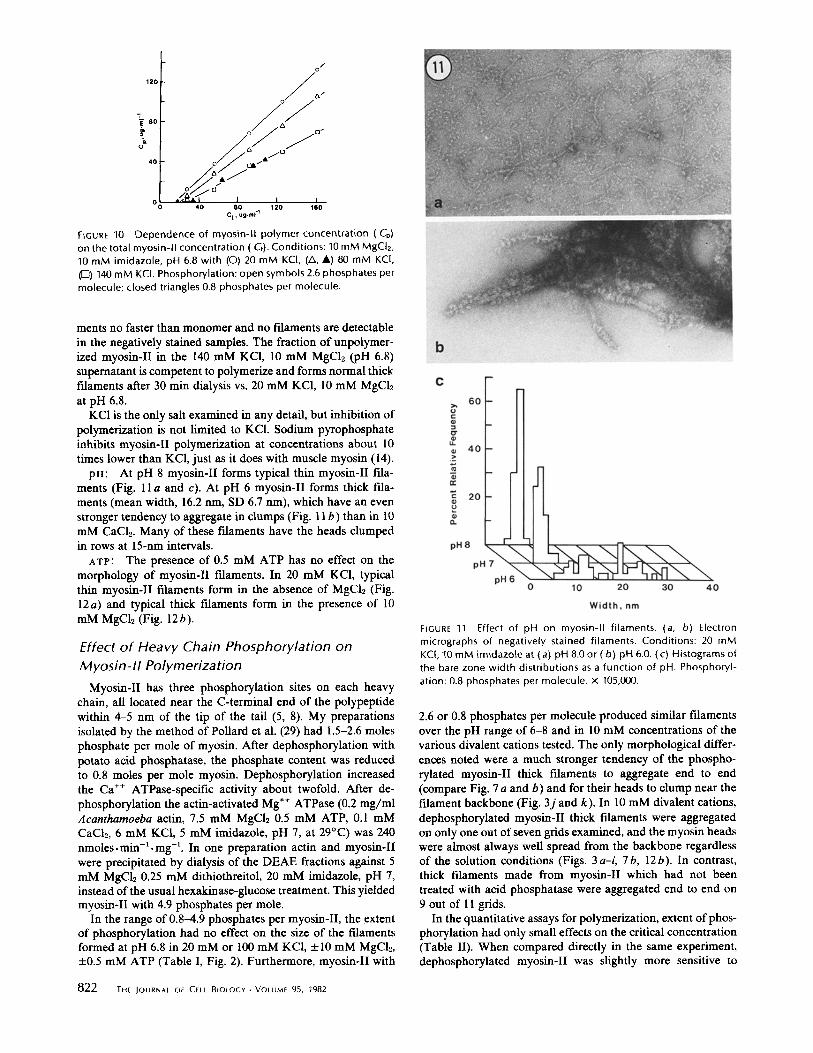
F~GURe 10 Dependence of myosin-ll polymer concentration (Cp) on the total myosin-II concentration (G). Conditions: 10 mM MgCI2, 10 mM imidazole, pH 6.8 with (O) 20 mM KC[, (A, A) 80 mM KC[, (I~) 140 mM KCI. Phosphorylation: open symbols 2.6 phosphates per molecule; closed triangles 0.8 phosphates per molecule.
merits no faster than monomer and no filaments are detectable in the negatively stained samples. The fraction of unpolymer- ized myosin-II in the 140 mM KCI, 10 mM MgCb (pH 6.8) supernatant is competent to polymerize and forms normal thick filaments after 30 min dialysis vs. 20 mM KC1, 10 mM MgC12 at pH 6.8.
KC1 is the only salt examined in any detail, but inhibition of polymerization is not limited to KC1. Sodium pyrophosphate inhibits myosin-II polymerization at concentrations about 10 times lower than KC1, just as it does with muscle myosin (14).
pH: At pH 8 myosin-II forms typical thin myosin-II fila- ments (Fig. 11 a and c). At pH 6 myosin-II forms thick illa- ments (mean width, 16.2 rim, SD 6.7 nm), which have an even stronger tendency to aggregate in clumps (Fig. 11 b) than in 10 mM CaCb. Many of these filaments have the heads clumped in rows at 15-nm intervals.
ATP: The presence of 0.5 mM ATP has no effect on the morphology of myosin-II filaments. In 20 mM KCI, typical thin myosin-II filaments form in the absence of MgCI2 (Fig. 12a) and typical thick filaments form in the presence of 10 mM MgCh (Fig. 12b).
Effect of Heavy Chain Phosphorylation on Myosin-II Polymerization
Myosin-II has three phosphorylation sites on each heavy chain, all located near the C-terminal end of the polypeptide within 4-5 nm of the tip of the tail (5, 8). My preparations isolated by the method of Pollard et al. (29) had 1.5-2.6 moles phosphate per mole of myosin. After dephosphorylation with potato acid phosphatase, the phosphate content was reduced to 0.8 moles per mole myosin. Dephosphorylation increased the Ca ++ ATPase-specific activity about twofold. After de- phosphorylation the actin-activated Mg ÷+ ATPase (0.2 mg/ml Acanthamoeba actin, 7.5 mM MgCb 0.5 mM ATP, 0.1 mM CaCh, 6 mM KC1, 5 mM imidazole, pH 7, at 29°C) was 240 nmoles.min-l .mg -1. In one preparation actin and myosin-II were precipitated by dialysis of the DEAE fractions against 5 mM MgC12 0.25 mM dithiothreitol, 20 mM imidazole, pH 7, instead of the usual hexakinase-glucose treatment. This yielded myosin-II with 4.9 phosphates per mole.
In the range of 0.8-4.9 phosphates per myosin-II, the extent of phosphorylation had no effect on the size of the filaments formed at pH 6.8 in 20 mM or 100 mM KC1, _+10 mM MgCI2, +_0.5 mM ATP (Table I, Fig. 2). Furthermore, myosin-II with
822 r.e JOURNAL OE CELL BIOLOGY. VOLUME 95, 1982
FIGURE 11 Effect of pH on myosin-ll filaments. (a, b) Electron micrographs of negatively stained filaments. Conditions: 20 mM KCI, 10 mM imidazole at {a) pH 8.0 or (b) pH 6.0. (c) Histograms of the bare zone width distributions as a function of pH. Phosphoryl- ation: 0.8 phosphates per molecule, x 105,000.
2.6 or 0.8 phosphates per molecule produced similar filaments over the pH range of 6-8 and in 10 mM concentrations of the various divalent cations tested. The only morphological differ- ences noted were a much stronger tendency of the phospho- rylated myosin-II thick filaments to aggregate end to end (compare Fig. 7 a and b) and for their heads to clump near the filament backbone (Fig. 3j and k). In 10 mM divalent cations, dephosphorylated myosin-II thick filaments were aggregated on only one out of seven grids examined, and the myosin heads were almost always well spread from the backbone regardless of the solution conditions (Figs. 3 a-i, 7b, 12b). In contrast, thick filaments made from myosin-II which had not been treated with acid phosphatase were aggregated end to end on 9 out of 11 grids.
In the quantitative assays for polymerization, extent ofphos- phorylation had only small effects on the critical concentration (Table II). When compared directly in the same experiment, dephosphorylated myosin-II was slightly more sensitive to
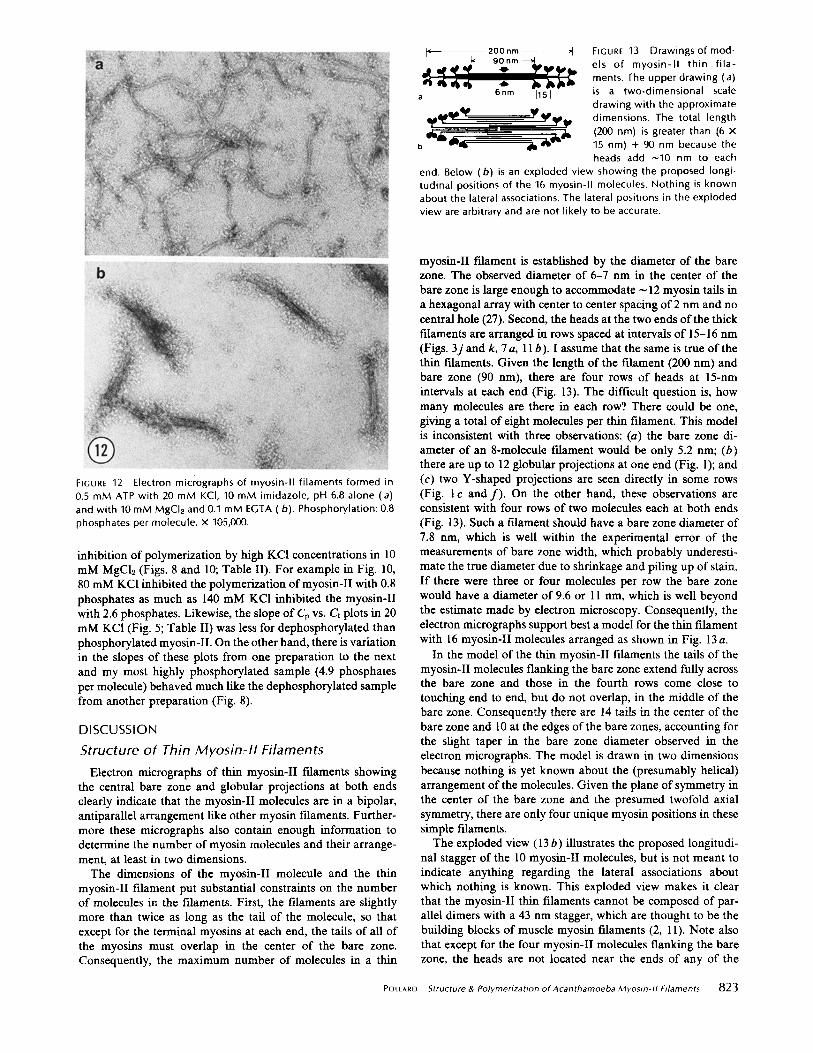
~. 20Ohm "l FIGURE 13 Drawings of mod- k~ 9 0 n m ~ els of myosin-II thin fila-
~,~ ~ i~ll ~: = ~II' ~ I / °~ ments. The upper drawing (a) 6nm 1151 is a two-dimensional scale a
drawing with the approximate ~ ' ~ ' ~ ' ~ 1 ~ dimensions. The total length "ql~l'~dlDdll ~I~ ~ I b (200 nm) is greater than (6 x
15 nm) + 90 nm because the b heads add -10 nm to each
end. Below (b) is an exploded view showing the proposed longi- tudinal positions of the 16 myosin-II molecules. Nothing is known about the lateral associations. The lateral positions in the exploded view are arbitrary and are not likely to be accurate.
FIGURE 12 Electron micrographs of myosin-II filaments formed in 0.5 mM ATP with 20 mM KCI, 10 mM imidazole, pH 6.8 alone (a) and with 10 mM MgCI2 and 0.1 mM EGTA (b). Phosphorylation: 0.8 phosphates per molecule, x 105,000.
inhibition of polymerization by high KCI concentrations in l0 mM MgC12 (Figs. 8 and 10; Table II). For example in Fig. 10, 80 mM KCI inhibited the polymerization of myosin-II with 0.8 phosphates as much as 140 mM KCI inhibited the myosin-II with 2.6 phosphates. Likewise, the slope of Cp vs. Ct plots in 20 mM KC1 (Fig. 5; Table II) was less for dephosphorylated than phosphorylated myosin-II. On the other hand, there is variation in the slopes of these plots from one preparation to the next and my most highly phosphorylated sample (4.9 phosphates per molecule) behaved much like the dephosphorylated sample from another preparation (Fig. 8).
DISCUSSION
St ruc tu re o f Thin M y o s i n - I I F i laments
Electron micrographs of thin myosin-II filaments showing the central bare zone and globular projections at both ends clearly indicate that the myosin-II molecules are in a bipolar, antiparallel arrangement like other myosin filaments. Further- more these micrographs also contain enough information to determine the number of myosin molecules and their arrange- ment, at least in two dimensions.
The dimensions of the myosin-II molecule and the thin myosin-II filament put substantial constraints on the number of molecules in the filaments. First, the filaments are slightly more than twice as long as the tail of the molecule, so that except for the terminal myosins at each end, the tails of all of the myosins must overlap in the center of the bare zone. Consequently, the maximum number of molecules in a thin
myosin-II filament is established by the diameter of the bare zone. The observed diameter of 6-7 nm in the center of the bare zone is large enough to accommodate ~ 12 myosin tails in a hexagonal array with center to center spacing of 2 nm and no central hole (27). Second, the heads at the two ends of the thick filaments are arranged in rows spaced at intervals of 15-16 nm (Figs. 3j and k, 7a, l I b). I assume that the same is true of the thin filaments. Given the length of the filament (200 nm) and bare zone (90 nm), there are four rows of heads at 15-nm intervals at each end (Fig. 13). The difficult question is, how many molecules are there in each row?. There could be one, giving a total of eight molecules per thin filament. This model is inconsistent with three observations: (a) the bare zone di- ameter of an 8-molecule filament would be only 5.2 nm; (b) there are up to 12 globular projections at one end (Fig. 1); and (c) two Y-shaped projections are seen directly in some rows (Fig. I c and f ) . On the other hand, these observations are consistent with four rows of two molecules each at both ends (Fig. 13). Such a filament should have a bare zone diameter of 7.8 am, which is well within the experimental error of the measurements of bare zone width, which probably underesti- mate the true diameter due to shrinkage and piling up of stain. If there were three or four molecules per row the bare zone would have a diameter of 9.6 or 11 nm, which is well beyond the estimate made by electron microscopy. Consequently, the electron micrographs support best a model for the thin filament with 16 myosin-II molecules arranged as shown in Fig. 13 a.
In the model of the thin myosin-II filaments the tails of the myosin-II molecules flanking the bare zone extend fully across the bare zone and those in the fourth rows come close to touching end to end, but do not overlap, in the middle of the bare zone. Consequently there are 14 tails in the center of the bare zone and l0 at the edges of the bare zones, accounting for the slight taper in the bare zone diameter observed in the electron micrographs. The model is drawn in two dimensions because nothing is yet known about the (presumably helical) arrangement of the molecules. Given the plane of symmetry in the center of the bare zone and the presumed twofold axial symmetry, there are only four unique myosin positions in these simple filaments.
The exploded view (13 b) illustrates the proposed longitudi- nal stagger of the l0 myosin-II molecules, but is not meant to indicate anything regarding the lateral associations about which nothing is known. This exploded view makes it clear that the myosin-II thin filaments cannot be composed of par- allel dimers with a 43 nm stagger, which are thought to be the building blocks of muscle myosin filaments (2, l l). Note also that except for the four myosin-II molecules flanking the bare zone, the heads are not located near the ends of any of the
POLLARD Structure & Polymerization of Acanthamoeba Myosin-II Filaments 823
tails. Consequently, the heavy chain phosphorylation sites at the end of the tail (5) would not appear to be in a position to interact directly with heads and to influence the ATPase activ- ity when the myosin-II is polymerized.
It is interesting that the skeletal muscle myosin "mini- filaments" which form in 10 mM citrate/Tris buffer at pH 8.0 are also composed of 16 myosin molecules (30). The arrange- ment of the 16 amoeba or muscle myosin molecules in these small filaments is probably an especially stable configuration with limited potential for further elongation.
The micrographs of the filaments also give some indication about the segmental flexibility of the myosin-II molecule. Many well preserved myosin-II filaments have clearly resolved side arms, some of which are Y-shaped. Presumably the arms of the Y are the heads, whereas the base of the Y is comparable to muscle myosin subfragment-2, which links the heads to the light meromyosin backbone of muscle thick fdaments (22). Many of these side arms are perpendicular to the backbone, so at least after drying there can be a 90 ° bend in the myosin-II tail at the point where the side arm bends away from the backbone.
Compared with the subfragment-2 region of skeletal muscle myosin, which is ~50 nm long (22) and allows the heads to spread up to 60 am from the filament backbone (28, 35) the corresponding region of the myosin-II tail is quite short. The myosin-II side arms project only 20 nm from the backbone. Given that the heads are ~ 10 nm long the linker region is no more than 10 nm long. This conclusion is consistent with direct observation of the linker region of individually resolved side arms which is also <10 nm long (Fig. 1). This suggests that a major part of the difference in the length of the tails of myosin- II and muscle myosin could be due to the almost complete absence in myosin-II of a region comparable to skeletal muscle myosin subfragment-2. If the subfragment-2 region of the myosin-II tail is <10 nm long, the remaining part of the myosin-II tail is exactly the same length as muscle myosin light meromyosin (80 nm; reference 22). The idea that the myosin- II tail is all or mostly equivalent to muscle light meromyosin is supported circumstantially by two independent observations. First, the rows of myosin-II molecules in the backbone of the filament are staggered by l 5 am. In muscle thick filaments the 15-nm spacing is determined by the properties of light mero- myosin. Second, there are no sensitive proteolytic cleavage sites within the tail of the myosin-II molecule (5). In the muscle myosin tail there are, of course, two such sensitive sites, located at the two ends of the subfragment-2 region (22).
Structure of Thick Myosin-II Filaments The thick myosin-II filaments are much more complex than
the thin filaments. So far it has been impossible to ascertain their structure by electron microscopy. Their diameter is vari- able and many are imperfectly formed. The longitudinal clefts in the defective thick filaments arid the demonstration that thick and thin filaments are interconvertible in a few seconds by simple changes in the ionic conditions, both argue that the thick filaments are formed by the lateral aggregation of thin filaments. The diameter of the thick fdaments is large enough to accommodate 3-6 thin filaments, but unfortunately subunits have not yet been resolved in cross sections of the thick filaments, so that the number and packing of the constituent thin filaments is unknown.
Accepting the interpretation that the thick filaments are composed of thin filaments, there are two observations that
suggest that the thin filaments comprising the thick filaments are not in perfect longitudinal register, but rather are staggered longitudinally by multiples of 15 rim. First, many of the thick fdaments have skewed bare zones or bare zones with indistinct margins (Fig. 3). Second, the overall length of the thick illa- ments (300 am) is 50% greater than the thin filaments. In spite of this longitudinal displacement of the thin filaments, the rows of myosin heads must be in register, because many thick filaments (especially in 10 mM CaCI2 and at pH 6) have the heads clumped in rows with a 15-am spacing (Fig. 7a).
Mechanism of Polymerization Myosin polymerization probably involves a number of dis-
crete reversible steps including myosin dimerization, filament nucleation and elongation (10). In the case of myosin-II there is also lateral aggregation of thin filaments to form thick filaments. A quantitative description of the polymerization mechanism will require identification of the reaction pathway and measurement of the kinetic constants for each step. In no case has this been completed, but for muscle myosin Davis (10) has used pressure-jump experiments to show that elongation is very fast, probably diffusion-limited, and that dissociation rates vary by a factor of 500 depending on filament length. Thus polymer length is controlled kinetically by the dissociation reaction.
At equilibrium myosin polymerization systems consist of subunits, which are actually a monomer-dimer equilibrium, and polymer which, in the case of skeletal muscle myosin minifilaments (31) and the myosin-II filaments described, here have a very discrete size distribution. The absence of species intermediate in size between subunits and the polymer dem- onstrates the high cooperativity of the muscle and Acantha- moeba myosin polymerization process.
In the original quantitative analysis of muscle myosin polym- erization, Josephs and Harrington (18) introduced as a simpli- fying assumption, that at equilibrium a skeletal muscle myosin polymerization system consists of only monomer and polymer.
n.monomers ~ polymer
K = C p / f m n
K is the equilibrium constant, Cp is the polymer concentration, Cm is the monomer concentration and n is the number of subunits in the polymer. The dependence of C o on total myosin concentration, Ct, is determined by the n and K. For many values of n and K there is a critical concentration below which there is essentially no polymer and above which Cm is approx- imately constant. Model calculations show that when n is small the critical concentration is low and relatively independent of K. When K is large the monomer-polymer transition around the critical concentration is sharp and the slope of Cp vs. Ct is 1. When K is small the transition from monomer to polymer is smooth and at low Cp the plot of Cp vs. Ct is curved and has a slope < 1.
This model must be oversimplified judging from the new work of Davis (10), but under a variety of conditions the behavior of muscle myosin agrees well with the model (18, 31). Over the limited range of concentrations tested Acanthamoeba myosin-II polymerization is also consistent with this model. The critical concentration for myosin-II polymerization is one or two orders of magnitude lower than for muscle myosin. This difference may be attributable, at least in part, to the small size of the myosin-II filaments rather than the myosin-II having a
824 THe Journa l o f CEtu BIOLOGY - votume 95, 1982
large polymerization equilibrium constant. On the contrary, the fact that plots of Co vs. Ct are < 1, under many conditions (Table II), suggests that the myosin-II equilibrium constant is relatively small, although the data are not yet extensive enough to calculate meaningful values for the equilibrium constant, Smooth muscle myosin polymerization differs from both skel- etal muscle and Acanthamoeba myosin-II in having neither a critical concentration nor a linear dependence of Cp on Ct (25), In every case more detailed analysis recognizing the various intermediates in the myosin polymerization reaction will be required to understand the polymerization mechanism. The myosin-II polymerization reactions may be particularly ame- nable to more detailed analysis, because there are only four unique positions in the filaments and therefore a limited num- ber of reactions and intermediates.
Form of Myosin-II in the Cell
Because the concentration of myosin-ll in the cell is ~ 1 mg/ ml (29) and the salt concentration is thought to be low, the properties of myosin-II suggest that it should be almost com- pletely polymerized in the cell. The exact cytoplasmic ionic conditions are not known, but need to be established before further conclusions can be drawn. In addition it will be neces- sary to test for inhibitors of myosin-II polymerization in the cell. Regardless of cytoplasmic conditions and the extent of myosin-II polymerization, it will be very difficult to identify cytoplasmic myosin-II filaments by electron microscopy of thin sections, because the filaments are so small. I hope that ultra- structural localization with highly specific new monoclonal antibodies (20) will help answer the questions about the form of myosin-II in the cell.
I would like to thank Drs. Ueli Aebi and Daniel Kiehart for their suggestions on a draft of this paper and Drs. William Harrington and Julien Davis for discussions of polymerization mechanisms.
This work was supported by National Institutes of Health Research Grant GM-26338.
Received for publication 17 June 1982, and in revised form 7 September 1982.
R E F E R E N C E S
I. Bradford, M. 1976. A rapid and sensitive method for the quantitation of microgram quantities of protein utilizing the principle of protein-dye binding. A haL Biochem. 72:248- 254.
2. Burke, M., and W. F. Harrington. 1972. Geometry of the myosin dimer in high salt media. II. Hydrodynamic studies on macromodels of myosin and its rod segments. Biochemistry. 11:1456-1462.
3. Barridge, K., and D. Bray. 1975. Purification and structural analysis of myosins from brain and other non-muscle tissues. J. MoL Biol. 99:1-14.
4. Clarke, M., and J. A. Spudich. 1974. Biochemical and structural studies of actomyosin- like proteins from non-muscle cells. Isolation and characterization of myosin from amoebae of Dictyostelium discoideum. J. Mol. Biol. 86:209-222.
5. Collins, J. H., G. P. Cote, and E. D. Korn. 1982. Localization of the three phosphorylation sites on each heavy chain ofAcanthamoeba myosin-II to a segment at the end of the tail. J. Biol. Chem. 257:4529-4534.
6. Collins, J. H., and E. D. Koru. 1980. Actin activation of Ca++-sensitive Mg++-ATPasc activity ofAcanthamoeba myosin-II is enhanced by dephosphorylation of its heavy chain. J. Biol. Chem. 255:8011-8014.
7. Collins, J. H., and E. D. Korn. 198l. Purification and characterization of actin-activatablc, Ca+÷-sensitive myosin-ll from Acanthamoeba. J. Biol. Chem. 256:2586-2595.
8. Cote, G. P., J. H. Collins, and E. D. Korn. 198 [. Identification of three phosphorylation sites on each heavy chain of Acanthamoeba myosin-If. J. Biol. Chem. 256:12811-12816.
9. Davis, J. S. 1981. The influence of pressure on the self-assembly of the thick filament from the myosin of vertebrate skeletal muscle. Biochem. J. 197:301-308.
10. Davis, J. S. 1981. Pressure-jump studies on the length-regulation kinetics of the self- assembly of myosin from vertebrate skeletal muscle into thick filaments. Biochem. £ 197:309-314.
II. Davis, J. S., J. Buck, and E. P. Green. 1982. The myosin dimer: an intermediate m the self-assembly of the thick filament of vertebrate skeletal muscle. FEBS (Fed. Eur. Biochem. Soc.) Lett. 140:293-297. Gadasi, H., and E. D. Korn. 1979. lmmunochemical analysis of Acanthamoeba myosins IA, IB and II..L BioL Chem. 254:8095 8098. Gadasi, H.. and E. D. Korn. 1980. Evidence for differential intracellular localization of the Aeanthamoeba myosin isozymes. Nature (Lond). 286:452-456. Harrington, W. F., and S. Himmelfarb. 1972. Effect of adenosine di- and triphosphates on the stability of synthetic myosin filaments. Biochemistry. 11:2945-2952. Herman, 1. M., and T. D. Pollard. 1981. Electron microscopic localization of cytoplasmic myosin with ferritin-labeled antibodies. Z Cell BioL 88:346-351. Hinssen, H., J. D'Haese, J. V. Small, and A. Sobieszek. 1978. Mode of filament assembly of myosins from muscle and non-muscle cells. J. Ultrastruct. Res. 64:282-302. Huxley, H E. 1963. Electron microscopic studies ofthe structure of natural and synthetic protein filaments from striated muscles. J. MoL BioL 7:281-308. Josephs, R, and W. F. Harrington. 1966. Studies on the formation and physical chemical properties of synthetic myosin filaments. Biochemistry. 5:3474-3487. Josephs, R., and W. F. Harrington. 1968. On the stability of myosin filaments. Biochemistry. 7:2834-2847. Kiehart, D. P., D. A. Kaiser, and T. D. Pollard. 1982. Monoclonal antibodies inhibit the aetin activated Mg*÷-ATPase ofAcamhamoeba myosin-lI Biophys. J. 37:40a (abstr.). Kuczmarski, E. R., and J. A. Spudich. 1980. Regulation of myosin self-assembly: phos- phorylation of Dictyostelium heavy chain inhibits formation of thick filaments. Proc. NatL Acad ScL U. S. A. 77:7292-7296. Lowey, S., H. S. Slayter, A. Weeds, and H. Baker. 1969. Substructure of the myosin molecule. I. Sabfragments of myosin produced by enzymatic digestion. J. MoL BioL 42:1- 29. Martin, F., J. Gabrion, and J'. C. Cavadore. 198l. Thyroid myosin filament assembly- disassembly is controlled by myosin light chain phosphorylation-dephosphorylation. FEBS (Fed Eur Biochem. Soc.) Lett. 131:235-238. Maruta, H, and E. D. Korn. 1979. Acamhamoeba myosin-ll. J. Biol. Chem. 252:6501 6509. Mergerman, J., and S. Lowey. 1981. Polymerization of myosin from smooth muscle of the calf aorta. Biochemistry. 20:2099-2110. Nachraias, V. T. 1972. Filament formation by purified Physarum myosin. Proc. Natl. Acad Sci. U. S..4.69:2011-2014. Niederman, R, and T. D. Pollard. 1975. Human platelet myosin 11. In vitro assembly and structure of myosin filaments. Z Cell BioL 67:72-92. Pollard, T. D. 1975. Electron microscopy of synthetic myosin filaments. Evidence for cross-bridge flexibility and copolymer formation. J. Cell BioL 67:93-104. Pollard, T. D., W. F. Stafford, and M. E. Porter. 1978. Characterization of a second myosin from/lcanthamoeba castellanii. J. BioL Chem. 253:4798-4808. Reisler, E., P. Cheu~g, C. Oriol-Audit, and J. A. Luke. 1982. Growth of synthetic myosin filaments from myosin minifilaments. Biochemistry. 21:701-707. Reisler, E., C. Smith, and G. Seegan. 1980. Myosin minifilaments. Z MoL BioL 143:129- 145. Scholey, J. M., K. A. Taylor, and J. Kendrick-Jones. 1980. Regulation of non-muscle myosin assembly by calmodulin-dependent light chain kinase. Nature (Lom£). 287:233- 235. StuU, J. T., and J. E. Buss. 1977. Phosphorylation of cardiac troponin by cAMP-dependent protein kinase. J. BioL Chem. 252:851-857. Suzuki, H., H. Onishi, K. Takaliashi, and S. Watanabe. 1978. Structure and function of chicken gizzard myosin..L Bwchem. (Tokyo). 84:1529-1542. Trinick, J., and A. Elliott. 1979. Electron microscope studies of thick filaments from vertebrate skeletal muscle. J. MoL BioL 131:133-136. Willingham, M. C., S. S. Yamada, P. J. Bechtel, A. V. Rutherford, and 1. H. Pastan. 1981. Ultrastructural immunocytochemical localization of myosin in cultured fibroblastic cells. £ Histochem. Cytochem. 29:1289-1301.
12,
13.
14.
15.
16.
17.
18.
19.
20.
21.
22.
23.
24.
25,
26.
27.
28.
29.
30.
31.
32.
33.
34.
35.
36.
POLLARD Structure & Polymerization of Acanthamoeba Myosin-II Filaments 8 2 5


![Analysis of Myosin II Minifilament Orientation at Epithelial Zonula … · 2017. 10. 28. · ; g.gomez@uq.edu.au [Abstract] Non-muscle myosin II (NMII) form bipolar filaments, which](https://img.pdfslide.us/doc/110x75/609f4ff238086e0945401275/analysis-of-myosin-ii-minifilament-orientation-at-epithelial-zonula-2017-10-28.jpg)


![Muscular System - Fisiokinesiterapia · •Organization of the sarcomere •Thick filaments = myosin filaments ... Slide 6.12b •At rest, there is a bare [“H”] zone that lacks](https://img.pdfslide.us/doc/110x75/5fb2bbcbb7621d07fc1a0ba7/muscular-system-f-aorganization-of-the-sarcomere-athick-filaments-myosin.jpg)