Embed Size (px)
Citation preview
Structure in the Enron Email Dataset
P.S. Keila and D.B. SkillicornSchool of ComputingQueen’s University
{keila,skill}@cs.queensu.ca
Abstract
We investigate the structures present in the Enronemail dataset using singular value decomposition andsemidiscrete decomposition. Using word frequencyprofiles we show that messages fall into two distinctgroups, whose extrema are characterized by shortmessages and rare words versus long messages andcommon words. It is surprising that length of messageand word use pattern should be related in this way.We also investigate relationships among individualsbased on their patterns of word use in email. Weshow that word use is correlated to function withinthe organization, as expected. We also show thatword use among those involved in alleged criminalactivity may be slightly distinctive.
1 Introduction
Many countries intercept communication and an-alyze messages as an intelligence technique. Thelargest such system is Echelon [?], run jointlyby the U.S., Canada, U.K, Australia, and NewZealand. The standard publicly-acknowledgedanalysis of intercepted data is to search messagesfor keywords, discard those messages that do notcontain keywords, and pass those that do to ana-lysts for further processing. An interesting ques-tion is what else can be learned from such mes-sages; for example, can connections between other-wise innocuous messages reveal links between theirsenders and/or receivers [12].
The Enron email dataset provides real-worlddata that is arguably of the same kind as data fromEchelon intercepts – a set of messages about a widerange of topics, from a large group of people whodo not form a closed set. Further, individuals atEnron were involved in several apparently criminal
activities. Hence, like Echelon data, there are prob-ably patterns of unusual communication within thedataset.
Understanding the characteristics and struc-ture of both normal and abnormal (collusive)emails therefore provides information about howsuch data might be better analyzed in an intelli-gence setting.
Linguistically, email has been considered to oc-cupy a middle ground between written material,which is typically well-organized, and uses moreformal grammatical style and word choices; andspeech, which is produced in real-time and char-acterized by sentence fragments and informal wordchoices. Although the potential for editing emailexists, anecdotal evidence suggests that this rarelyhappens; on the other hand, email does not usuallycontain the spoken artifacts of pausing (Ums etc.).
We examine the structure of the Enron emaildataset, looking for what it can tell us about howemail is constructed and used, and also for whatit can tell us about how individuals use email tocommunicate.
2 Related Work
Previous attention has been paid to email with twomain goals: spam detection, and email topic clas-sification. Spam detection tends to rely on localproperties of email: the use of particular words,and more generally the occurrence of unlikely com-binations of words. This has been increasinglyunsuccessful, as spam email has increasingly usedsymbol substitution (readable to humans) whichmakes most of its content seem not to be words atall.
Email topic classification attempts to assist
users by automatically classifying their email intodifferent folders by topic. Some examples are [2,6, 9, 11]. This work has been moderately successfulwhen the topics are known in advance, but performmuch less adequately in an unsupervised setting.An attempt to find connections between peoplebased on patterns in their email can be found in[7].
3 Matrix Decompositions
We will use two matrix decompositions, SingularValue Decomposition (SVD) [3], and SemiDiscreteDecomposition (SDD) [4, 5]. Both decompose amatrix, A, with n rows and m columns into theform
A = C W F
where C is n×k, W is a k×k diagonal matrix whoseentries indicate the importance of each dimension,and F is k ×m.
There are several useful ways to interpret sucha decomposition. The factor interpretation regardsthe k rows of F as representing underlying or latentfactors (and hence better explanations of the data)while the rows of C describe how to mix thesefactors together to get the observed values in A.The geometric interpretation regards the k rowsof F as representing axes in some transformedspace, and the rows of C as coordinates in this(k-dimensional) space. The layer interpretationrelies on the fact that A is the sum of k outerproduct matrices, Ai, where each Ai is the productof the ith column of C and the ith row of F(and the ith diagonal element of W ). All of theseinterpretations can be helpful in interpreting adataset.
Singular value decomposition is usually inter-preted using the factor model (in the social sci-ences) and the geometric model (in the sciences).An SVD for the matrix A is
A = U S V ′
where U and V are orthonormal, the diagonal ofS is non-increasing, and k ≤ m. The usefulnessof SVD comes primarily from the fact that thecolumns of V are orthogonal and hence representindependent factors, or orthogonal axes. The
first k columns of U can be interpreted as thecoordinates of a point corresponding to each rowof A in a k-dimensional space, and that this is themost faithful representation of the relationships inthe original data in this number of dimensions.
The correlation between two objects is propor-tional to the dot product between their positionsregarded as vectors from the origin. Two objectsthat are highly correlated have a dot product (thecosine of the angle between the two vectors) thatis large and positive. Two objects that are highlynegatively correlated have a dot product that islarge and negative. Two objects that are uncorre-lated have dot product close to zero.
This property is useful because there are twoways for a dot product to be close to zero. The ob-vious way is for the vectors concerned to be orthog-onal. However, when m is less than n (as it typi-cally is) there are many fewer directions in whichvectors can point orthogonally than there are vec-tors. Hence if most vectors are uncorrelated, theymust still have small dot products but cannot all beorthogonal. The only alternative is that their val-ues must be small. Hence vectors that are largelyuncorrelated must have small magnitudes, and thecorresponding objects are placed close to the originin the transformed space. Hence, in a transformedspace from an SVD, the points corresponding toobjects that are ‘uninteresting’ (they are correlatedeither with nothing or with everything) are foundclose to the origin, while points corresponding tointeresting objects are located far from the origin(potentially in different direction indicating differ-ent clusters of such objects).
The SemiDiscrete Decomposition (SDD) of amatrix A is
A = X D Y
where the entries of X and Y come from the set{−1, 0, +1}, D is a diagonal matrix, and k canhave any value, not necessarily less than m. Thenatural interpretation of SDD is a layer one [8].Each Ai corresponds to a column of X and a rowof Y , weighted by an entry from D. The product ofxi and yi is a stencil representing a ‘bump’ (wherethe product has a +1) and corresponding ‘ditch’(where the product has a −1). The correspondingvalue of D gives the height of the bump and ditch
at each level. Hence an SDD expresses a matrix asthe sum of bumps, with the most significant bumpsappearing first. Because the choice of the sequenceof bumps depends on both their area (how manylocations in the matrix they cover) and their height,altering the scale of A will change the resultingSDD. In particular, taking the signed square ofeach value in the matrix will give greater emphasisto the heights of bumps and hence select outlyingregions of the dataset earlier. Conversely, takingthe signed square root of each value in the matrixwill tend to find large homogeneous regions earlier.
SDD generates a ternary, unsupervised hierar-chical classification of the samples, based on thevalues in each successive column of the X matrix.Consider the first column of X. Those samplesfor which this column has the value +1 can begrouped; those samples for which this column hasthe value −1 are, in a sense, similar but opposite;and those samples for which this column has thevalue 0 are unclassified at this level. This can berepeated for columns 2, 3, and so on, to produce aclassification tree.
Neither SVD nor SDD exploit the order of rowsand columns in the data matrix, so they do notstart with any advantage over more conventionaldata-mining techniques.
4 Structure from Word Usage
Most emails contain few words from the possiblevocabulary, so a word-document (word-email) ma-trix is extremely sparse. Although SVD could beperformed on such matrices using sparse matrixtechniques such as Lanczos methods, we chose in-stead to analyze matrices whose rows correspond toemails and whose columns correspond to frequencyin the email. The entries in the matrix are the(global) ranks of words in frequency order in themessage. For example, if the most frequent wordsin an email is “stock” and this word ranks 12,000thoverall in the Enron noun frequency list, then theentry in the row corresponding to that email andthe first column of the matrix is 12,000.
Two emails are similar in this representation ifthey have similar word usage profiles in descendingorder of frequency ; in other words, the similaritymetric is more discriminating than one based only
on a bag-of-words similarity metric.
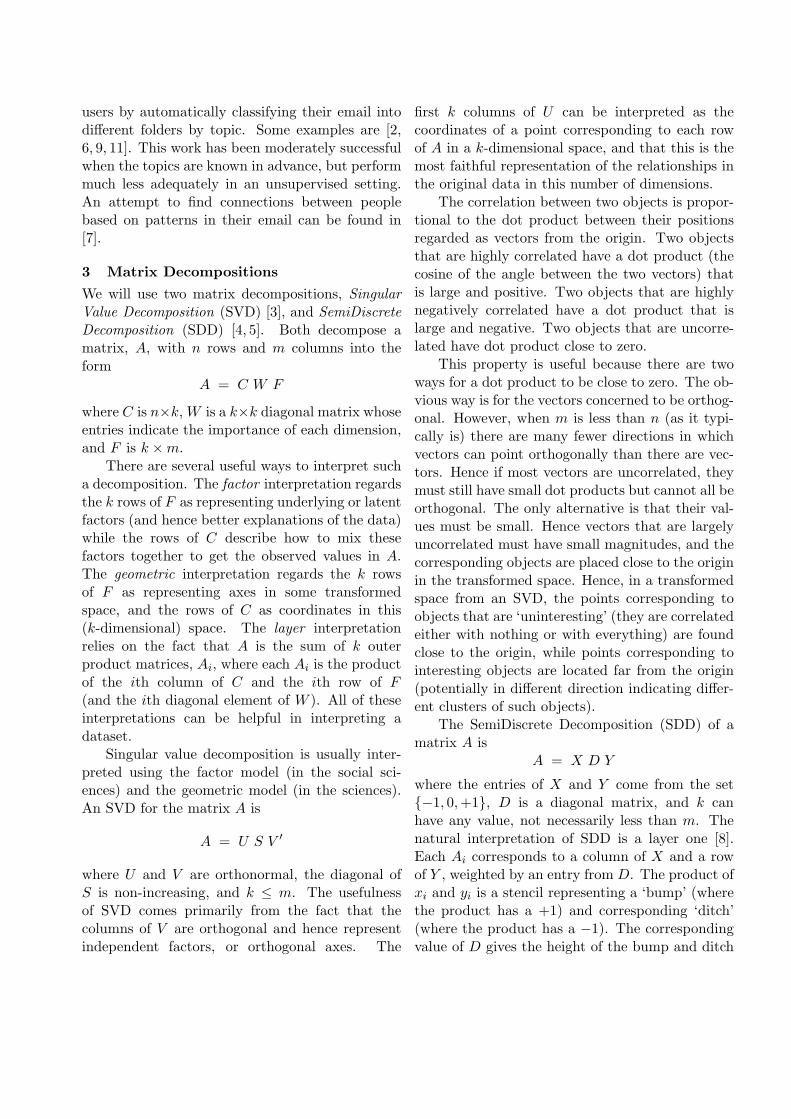
Basic Structure An SVD analysis of the entireemail dataset is shown in Figure 1, based on494,833 messages using 160 203 distinct words (nostemming has been applied).
Figure 1: SVD plot of entire email set of 494,833messages. Note the strong bifurcation.
The most obvious and striking feature of thisplot is that it results in a ‘butterfly’ shape, that isthe emails separate into two clusters that grow in-creasingly different with distance from the origin.This separation is quite surprising; as far as we areaware previous analysis of email datasets has re-vealed separation by topic, but not such as strongstructural separation. This structure remains moreor less fixed as the set of nouns is reduced, indicat-ing that it is not an artifact of particular choice ofnouns under consideration.
To explore the structure of the dataset moredeeply, we reduced the number of words underconsideration by removing those we believed madethe least contribution to interesting structure. Weused the BNC corpus [1], which is a frequency-ranked list of words in both spoken and writtenEnglish to assist. We first removed words thatappear in the Enron dataset but not in the BNCcorpus. This removes almost all of the strings thatare not real words (artifacts of email processingand also of postprocessing of the dataset); and
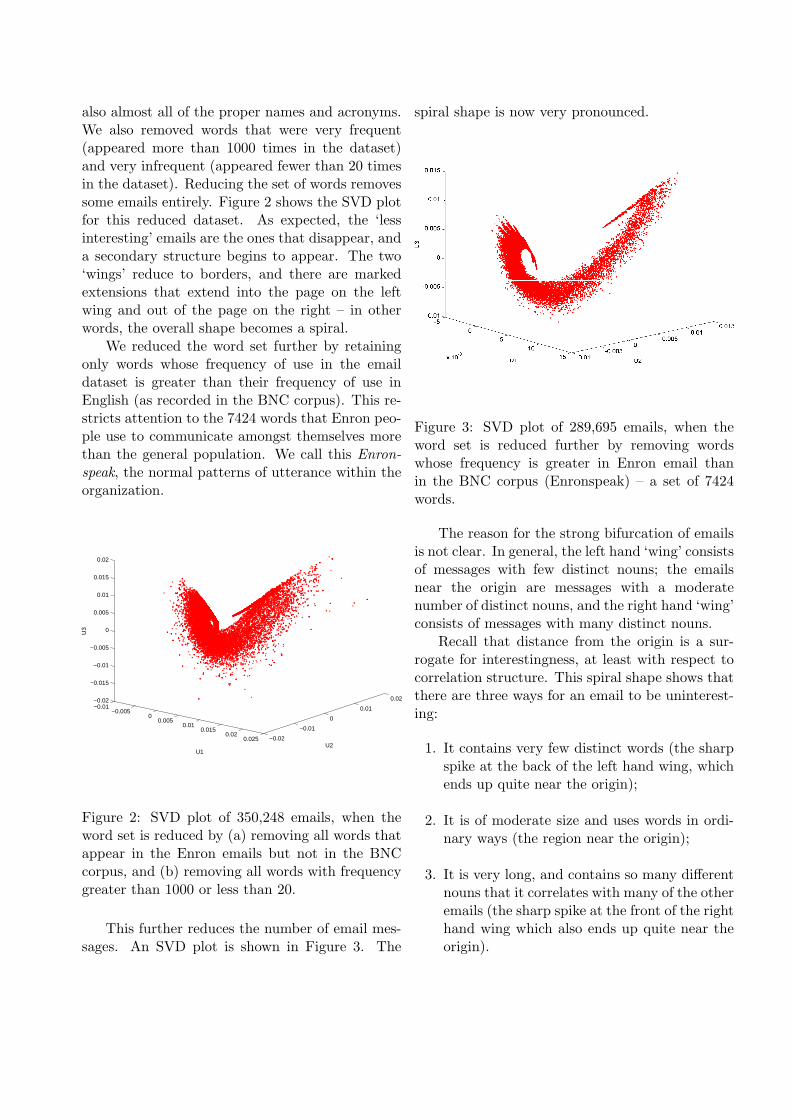
also almost all of the proper names and acronyms.We also removed words that were very frequent(appeared more than 1000 times in the dataset)and very infrequent (appeared fewer than 20 timesin the dataset). Reducing the set of words removessome emails entirely. Figure 2 shows the SVD plotfor this reduced dataset. As expected, the ‘lessinteresting’ emails are the ones that disappear, anda secondary structure begins to appear. The two‘wings’ reduce to borders, and there are markedextensions that extend into the page on the leftwing and out of the page on the right – in otherwords, the overall shape becomes a spiral.
We reduced the word set further by retainingonly words whose frequency of use in the emaildataset is greater than their frequency of use inEnglish (as recorded in the BNC corpus). This re-stricts attention to the 7424 words that Enron peo-ple use to communicate amongst themselves morethan the general population. We call this Enron-speak, the normal patterns of utterance within theorganization.
−0.01−0.005
00.005
0.010.015
0.020.025 −0.02
−0.01
0
0.01
0.02−0.02
−0.015
−0.01
−0.005
0
0.005
0.01
0.015
0.02
U2U1
U3
Figure 2: SVD plot of 350,248 emails, when theword set is reduced by (a) removing all words thatappear in the Enron emails but not in the BNCcorpus, and (b) removing all words with frequencygreater than 1000 or less than 20.
This further reduces the number of email mes-sages. An SVD plot is shown in Figure 3. The
spiral shape is now very pronounced.
Figure 3: SVD plot of 289,695 emails, when theword set is reduced further by removing wordswhose frequency is greater in Enron email thanin the BNC corpus (Enronspeak) – a set of 7424words.
The reason for the strong bifurcation of emailsis not clear. In general, the left hand ‘wing’ consistsof messages with few distinct nouns; the emailsnear the origin are messages with a moderatenumber of distinct nouns, and the right hand ‘wing’consists of messages with many distinct nouns.
Recall that distance from the origin is a sur-rogate for interestingness, at least with respect tocorrelation structure. This spiral shape shows thatthere are three ways for an email to be uninterest-ing:
1. It contains very few distinct words (the sharpspike at the back of the left hand wing, whichends up quite near the origin);
2. It is of moderate size and uses words in ordi-nary ways (the region near the origin);
3. It is very long, and contains so many differentnouns that it correlates with many of the otheremails (the sharp spike at the front of the righthand wing which also ends up quite near theorigin).
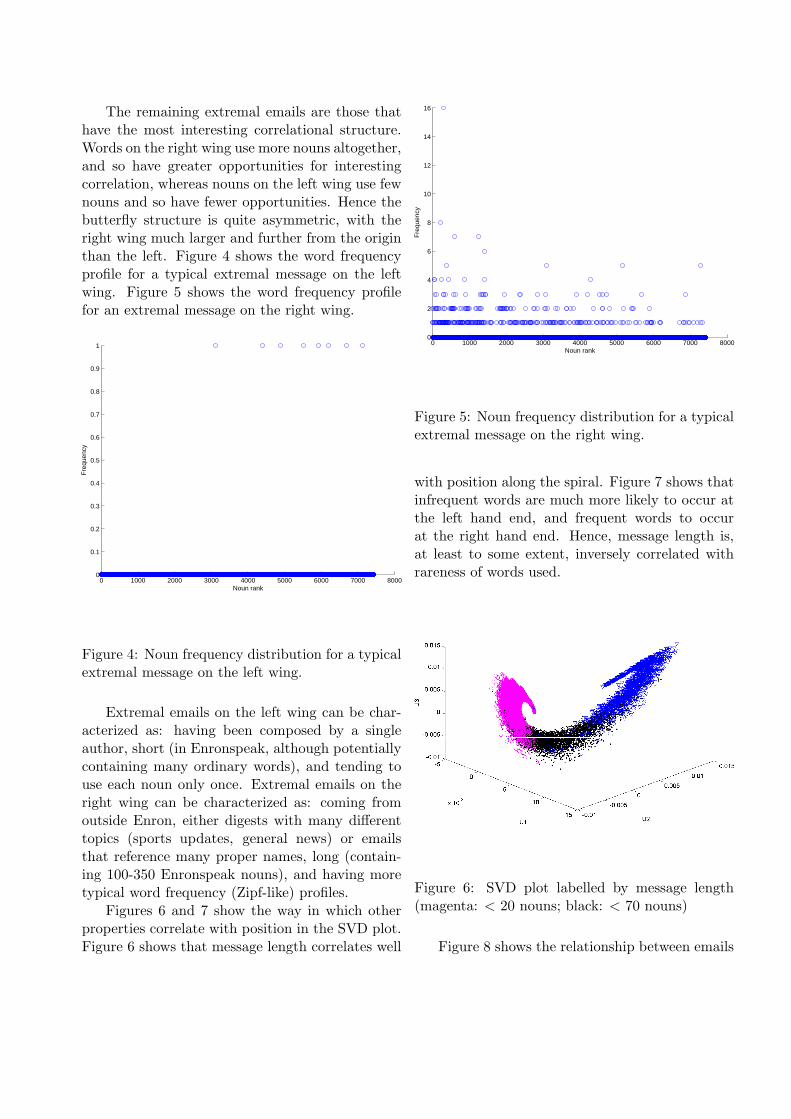
The remaining extremal emails are those thathave the most interesting correlational structure.Words on the right wing use more nouns altogether,and so have greater opportunities for interestingcorrelation, whereas nouns on the left wing use fewnouns and so have fewer opportunities. Hence thebutterfly structure is quite asymmetric, with theright wing much larger and further from the originthan the left. Figure 4 shows the word frequencyprofile for a typical extremal message on the leftwing. Figure 5 shows the word frequency profilefor an extremal message on the right wing.
0 1000 2000 3000 4000 5000 6000 7000 80000
0.1
0.2
0.3
0.4
0.5
0.6
0.7
0.8
0.9
1
Noun rank
Fre
quen
cy
Figure 4: Noun frequency distribution for a typicalextremal message on the left wing.
Extremal emails on the left wing can be char-acterized as: having been composed by a singleauthor, short (in Enronspeak, although potentiallycontaining many ordinary words), and tending touse each noun only once. Extremal emails on theright wing can be characterized as: coming fromoutside Enron, either digests with many differenttopics (sports updates, general news) or emailsthat reference many proper names, long (contain-ing 100-350 Enronspeak nouns), and having moretypical word frequency (Zipf-like) profiles.
Figures 6 and 7 show the way in which otherproperties correlate with position in the SVD plot.Figure 6 shows that message length correlates well
0 1000 2000 3000 4000 5000 6000 7000 80000
2
4
6
8
10
12
14
16
Noun rank
Fre
quen
cyFigure 5: Noun frequency distribution for a typicalextremal message on the right wing.
with position along the spiral. Figure 7 shows thatinfrequent words are much more likely to occur atthe left hand end, and frequent words to occurat the right hand end. Hence, message length is,at least to some extent, inversely correlated withrareness of words used.
Figure 6: SVD plot labelled by message length(magenta: < 20 nouns; black: < 70 nouns)
Figure 8 shows the relationship between emails
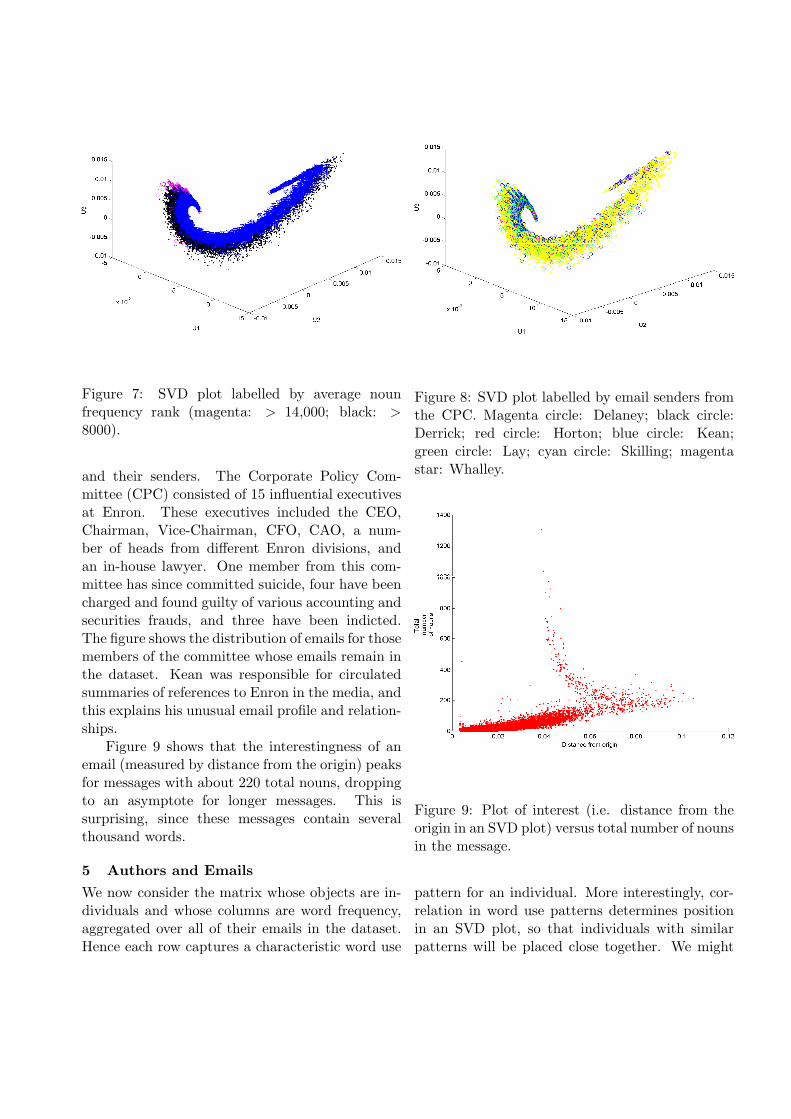
Figure 7: SVD plot labelled by average nounfrequency rank (magenta: > 14,000; black: >8000).
and their senders. The Corporate Policy Com-mittee (CPC) consisted of 15 influential executivesat Enron. These executives included the CEO,Chairman, Vice-Chairman, CFO, CAO, a num-ber of heads from different Enron divisions, andan in-house lawyer. One member from this com-mittee has since committed suicide, four have beencharged and found guilty of various accounting andsecurities frauds, and three have been indicted.The figure shows the distribution of emails for thosemembers of the committee whose emails remain inthe dataset. Kean was responsible for circulatedsummaries of references to Enron in the media, andthis explains his unusual email profile and relation-ships.
Figure 9 shows that the interestingness of anemail (measured by distance from the origin) peaksfor messages with about 220 total nouns, droppingto an asymptote for longer messages. This issurprising, since these messages contain severalthousand words.
5 Authors and Emails
We now consider the matrix whose objects are in-dividuals and whose columns are word frequency,aggregated over all of their emails in the dataset.Hence each row captures a characteristic word use
Figure 8: SVD plot labelled by email senders fromthe CPC. Magenta circle: Delaney; black circle:Derrick; red circle: Horton; blue circle: Kean;green circle: Lay; cyan circle: Skilling; magentastar: Whalley.
Figure 9: Plot of interest (i.e. distance from theorigin in an SVD plot) versus total number of nounsin the message.
pattern for an individual. More interestingly, cor-relation in word use patterns determines positionin an SVD plot, so that individuals with similarpatterns will be placed close together. We might
expect that individuals with similar job responsi-bilities and similar rank might use words in similarways, both because of writing style, and becauseof similarity in typical subject matter. Further de-tails of participants and their situation within En-ron can be found in [10].
−0.4−0.3
−0.2−0.1
00.1
0.20.3
0.4 −0.4
−0.3
−0.2
−0.1
0
0.1
0.2
0.3
0.4
−0.4
−0.2
0
0.2
0.4
0.6
U1
U2
U3
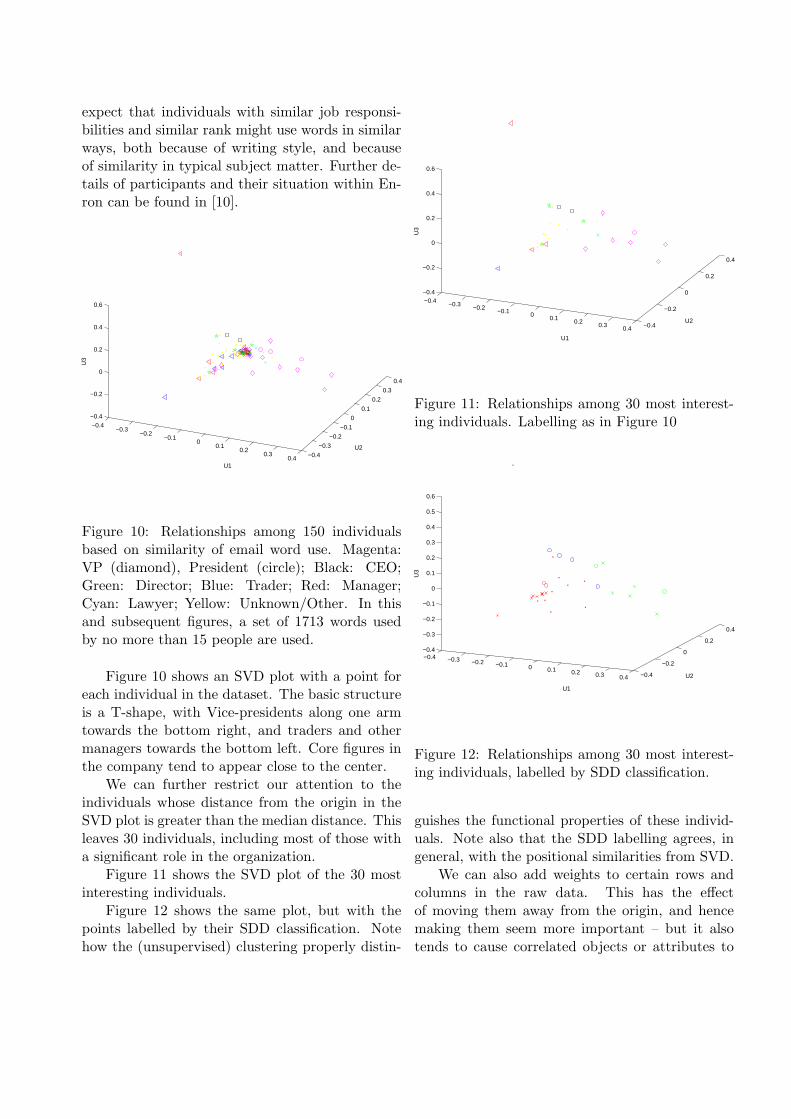
Figure 10: Relationships among 150 individualsbased on similarity of email word use. Magenta:VP (diamond), President (circle); Black: CEO;Green: Director; Blue: Trader; Red: Manager;Cyan: Lawyer; Yellow: Unknown/Other. In thisand subsequent figures, a set of 1713 words usedby no more than 15 people are used.
Figure 10 shows an SVD plot with a point foreach individual in the dataset. The basic structureis a T-shape, with Vice-presidents along one armtowards the bottom right, and traders and othermanagers towards the bottom left. Core figures inthe company tend to appear close to the center.
We can further restrict our attention to theindividuals whose distance from the origin in theSVD plot is greater than the median distance. Thisleaves 30 individuals, including most of those witha significant role in the organization.
Figure 11 shows the SVD plot of the 30 mostinteresting individuals.
Figure 12 shows the same plot, but with thepoints labelled by their SDD classification. Notehow the (unsupervised) clustering properly distin-
−0.4 −0.3 −0.2 −0.1 0 0.1 0.2 0.3 0.4 −0.4
−0.2
0
0.2
0.4
−0.4
−0.2
0
0.2
0.4
0.6
U2
U1
U3
Figure 11: Relationships among 30 most interest-ing individuals. Labelling as in Figure 10
−0.4 −0.3 −0.2 −0.1 0 0.1 0.2 0.3 0.4 −0.4
−0.2
0
0.2
0.4
−0.4
−0.3
−0.2
−0.1
0
0.1
0.2
0.3
0.4
0.5
0.6
U2
U1
U3
Figure 12: Relationships among 30 most interest-ing individuals, labelled by SDD classification.
guishes the functional properties of these individ-uals. Note also that the SDD labelling agrees, ingeneral, with the positional similarities from SVD.
We can also add weights to certain rows andcolumns in the raw data. This has the effectof moving them away from the origin, and hencemaking them seem more important – but it alsotends to cause correlated objects or attributes to
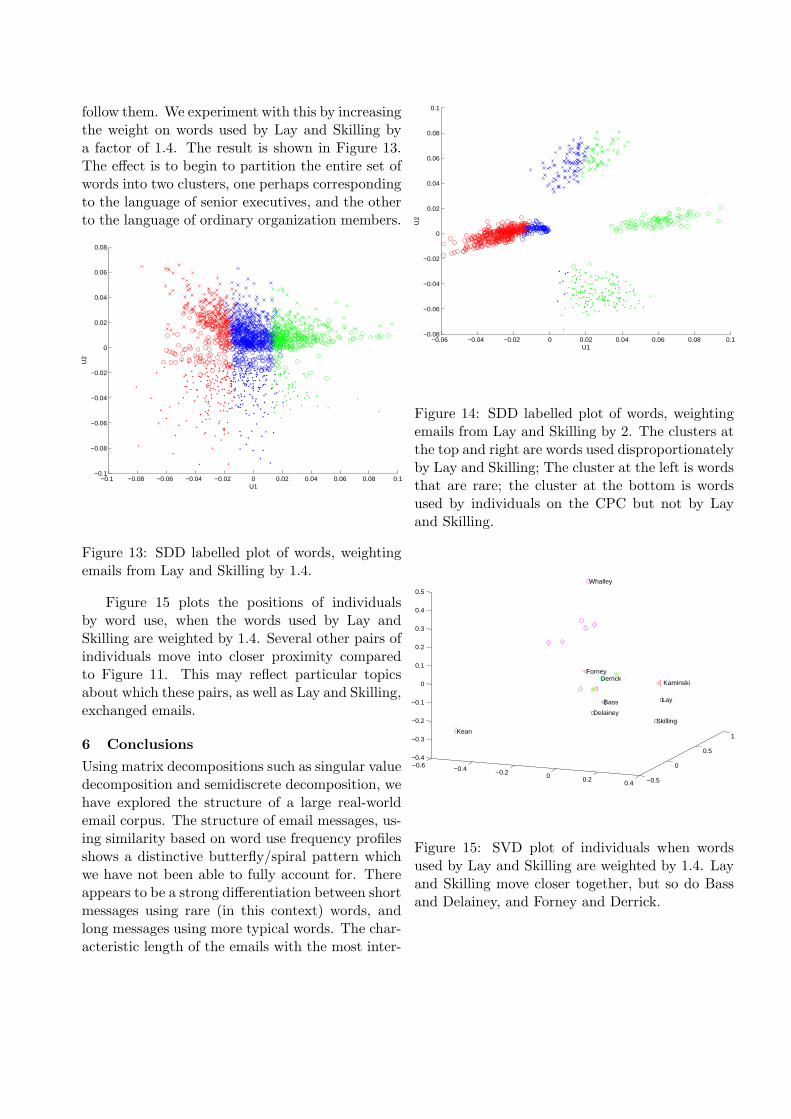
follow them. We experiment with this by increasingthe weight on words used by Lay and Skilling bya factor of 1.4. The result is shown in Figure 13.The effect is to begin to partition the entire set ofwords into two clusters, one perhaps correspondingto the language of senior executives, and the otherto the language of ordinary organization members.
−0.1 −0.08 −0.06 −0.04 −0.02 0 0.02 0.04 0.06 0.08 0.1−0.1
−0.08
−0.06
−0.04
−0.02
0
0.02
0.04
0.06
0.08
U1
U2
Figure 13: SDD labelled plot of words, weightingemails from Lay and Skilling by 1.4.
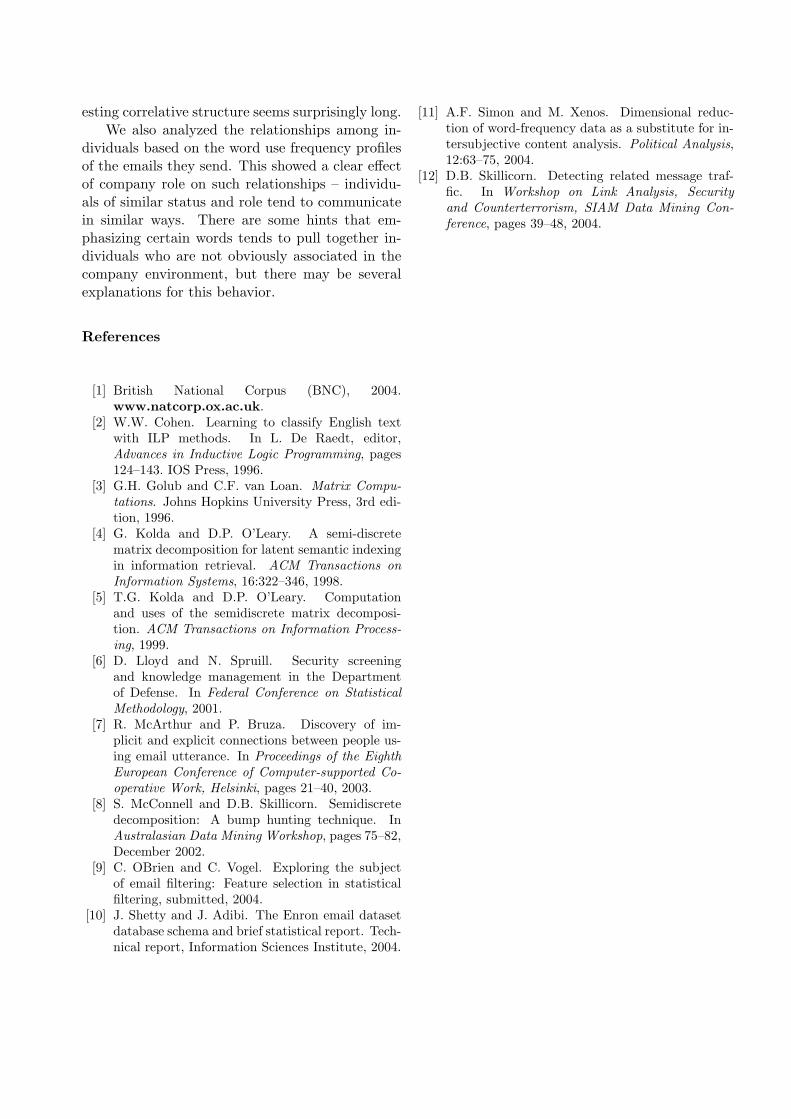
Figure 15 plots the positions of individualsby word use, when the words used by Lay andSkilling are weighted by 1.4. Several other pairs ofindividuals move into closer proximity comparedto Figure 11. This may reflect particular topicsabout which these pairs, as well as Lay and Skilling,exchanged emails.
6 Conclusions
Using matrix decompositions such as singular valuedecomposition and semidiscrete decomposition, wehave explored the structure of a large real-worldemail corpus. The structure of email messages, us-ing similarity based on word use frequency profilesshows a distinctive butterfly/spiral pattern whichwe have not been able to fully account for. Thereappears to be a strong differentiation between shortmessages using rare (in this context) words, andlong messages using more typical words. The char-acteristic length of the emails with the most inter-
−0.06 −0.04 −0.02 0 0.02 0.04 0.06 0.08 0.1−0.08
−0.06
−0.04
−0.02
0
0.02
0.04
0.06
0.08
0.1
U1
U2
Figure 14: SDD labelled plot of words, weightingemails from Lay and Skilling by 2. The clusters atthe top and right are words used disproportionatelyby Lay and Skilling; The cluster at the left is wordsthat are rare; the cluster at the bottom is wordsused by individuals on the CPC but not by Layand Skilling.
−0.6 −0.4 −0.2 0 0.2 0.4 −0.5
0
0.5
1
−0.4
−0.3
−0.2
−0.1
0
0.1
0.2
0.3
0.4
0.5
Kean
Skilling
Lay
Delainey
Bass
DerrickForney
Whalley
Kaminski
Figure 15: SVD plot of individuals when wordsused by Lay and Skilling are weighted by 1.4. Layand Skilling move closer together, but so do Bassand Delainey, and Forney and Derrick.
esting correlative structure seems surprisingly long.We also analyzed the relationships among in-
dividuals based on the word use frequency profilesof the emails they send. This showed a clear effectof company role on such relationships – individu-als of similar status and role tend to communicatein similar ways. There are some hints that em-phasizing certain words tends to pull together in-dividuals who are not obviously associated in thecompany environment, but there may be severalexplanations for this behavior.
References
[1] British National Corpus (BNC), 2004.www.natcorp.ox.ac.uk.
[2] W.W. Cohen. Learning to classify English textwith ILP methods. In L. De Raedt, editor,Advances in Inductive Logic Programming, pages124–143. IOS Press, 1996.
[3] G.H. Golub and C.F. van Loan. Matrix Compu-tations. Johns Hopkins University Press, 3rd edi-tion, 1996.
[4] G. Kolda and D.P. O’Leary. A semi-discretematrix decomposition for latent semantic indexingin information retrieval. ACM Transactions onInformation Systems, 16:322–346, 1998.
[5] T.G. Kolda and D.P. O’Leary. Computationand uses of the semidiscrete matrix decomposi-tion. ACM Transactions on Information Process-ing, 1999.
[6] D. Lloyd and N. Spruill. Security screeningand knowledge management in the Departmentof Defense. In Federal Conference on StatisticalMethodology, 2001.
[7] R. McArthur and P. Bruza. Discovery of im-plicit and explicit connections between people us-ing email utterance. In Proceedings of the EighthEuropean Conference of Computer-supported Co-operative Work, Helsinki, pages 21–40, 2003.
[8] S. McConnell and D.B. Skillicorn. Semidiscretedecomposition: A bump hunting technique. InAustralasian Data Mining Workshop, pages 75–82,December 2002.
[9] C. OBrien and C. Vogel. Exploring the subjectof email filtering: Feature selection in statisticalfiltering, submitted, 2004.
[10] J. Shetty and J. Adibi. The Enron email datasetdatabase schema and brief statistical report. Tech-nical report, Information Sciences Institute, 2004.
[11] A.F. Simon and M. Xenos. Dimensional reduc-tion of word-frequency data as a substitute for in-tersubjective content analysis. Political Analysis,12:63–75, 2004.
[12] D.B. Skillicorn. Detecting related message traf-fic. In Workshop on Link Analysis, Securityand Counterterrorism, SIAM Data Mining Con-ference, pages 39–48, 2004.


![[Enron] New hire welcome binder (policies, org chart, tips, etc.)mattmg83.github.io/cynicalcapitalist/documents/[Enron... · 2019-09-27 · Enron Operator (71)853·6161 Enron Voice](https://img.pdfslide.us/doc/110x75/5f1e01293cf2d927c4643421/enron-new-hire-welcome-binder-policies-org-chart-tips-etc-enron-2019-09-27.jpg)