Embed Size (px)
Citation preview

Vol. 10(7), pp. 147-158, September 2018
DOI: 10.5897/JENE2018.0683
Article Number: D391AE958659
ISSN: 2006-9847
Copyright ©2018
Author(s) retain the copyright of this article
http://www.academicjournals.org/JENE
Journal of Ecology and the
Natural Environment
Full Length Research Paper
Structure and natural regeneration of woody species at central highlands of Ethiopia
Mammo Siraj1,2 and Kebin Zhang1*
1Beijing Forestry University, School of Soil and Water Conservation Beijing 100083, China.
2Department of Biology, Ambo University, Ambo, Ethiopia.
Received 14 February, 2018; Accepted 12 July, 2018
The management of regeneration plays a vital role in sustainable forest practice by ensuring the future growing carbon stock and serving as an indicator of the forest condition of an area. In premises of the above-mentioned facts, the current study was conducted to investigate the population structure and regeneration status of woody species as an indicator for forest condition and to provide information on sustainable management of the woody plants in Chilimo-Gaji Forest. The data collection was done using a preferential sampling technique as a sampling design and a total of 36 plots with a size of 20 m × 20 m (400 m
2) was laid out for the woody species. In each sample plot, all woody species seedling,
sapling and mature tree/shrubs were counted and recorded. And their diameter at breast height (DBH) was measured at 1.5 from the ground with DBH ≥ 2.5 cm. A total of 42 species of vascular plants belonging to 34 genera and 28 families were recorded and identified from the 36 study plots. The total density of woody plant species in all the 36 sampled plots of the study area was 3328.47 individuals ha-1. The total density of seedlings, saplings and trees/shrubs were 1743.75, 827.08 and 757.64 ha-
1, respectively. The regeneration status of individual tree species showed differences as 26% had good
regeneration, 43% had fair regeneration, 7% had poor regeneration, 7% lacked regeneration, and 17% have appeared as newly regenerating. The cumulative species DBH class distribution of the study area was inverted J-shape distribution indicating stable population status or good regeneration status. Key words: Chilimo-Gaji, Dry Afromontane, regeneration, vegetation structure.
INTRODUCTION Natural resources are an integral part of society and natural ecosystems as an integral part of the renewable natural resources serving as a major sustainable development index for each country. Natural tropical forests are extremely important for the conservation of
the world‟s biological diversity. Forests play an important role in supporting the livelihood of people worldwide, predominantly in meeting the daily subsistence needs of the world‟s poor (UNFF, 2007; Siraj et al., 2016), served as refuges for human beings during wars and for other
* Corresponding author E-mail: [email protected].
Author(s) agree that this article remain permanently open access under the terms of the Creative Commons Attribution
License 4.0 International License
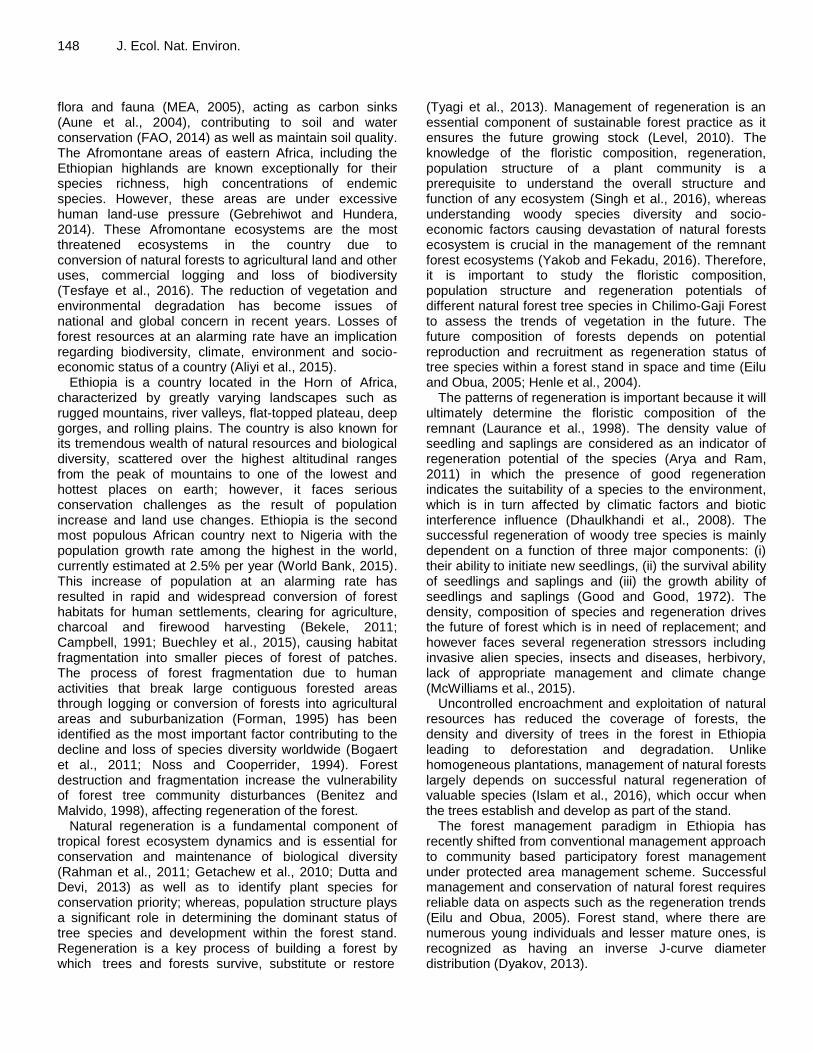
148 J. Ecol. Nat. Environ. flora and fauna (MEA, 2005), acting as carbon sinks (Aune et al., 2004), contributing to soil and water conservation (FAO, 2014) as well as maintain soil quality. The Afromontane areas of eastern Africa, including the Ethiopian highlands are known exceptionally for their species richness, high concentrations of endemic species. However, these areas are under excessive human land-use pressure (Gebrehiwot and Hundera, 2014). These Afromontane ecosystems are the most threatened ecosystems in the country due to conversion of natural forests to agricultural land and other uses, commercial logging and loss of biodiversity (Tesfaye et al., 2016). The reduction of vegetation and environmental degradation has become issues of national and global concern in recent years. Losses of forest resources at an alarming rate have an implication regarding biodiversity, climate, environment and socio-economic status of a country (Aliyi et al., 2015).
Ethiopia is a country located in the Horn of Africa, characterized by greatly varying landscapes such as rugged mountains, river valleys, flat-topped plateau, deep gorges, and rolling plains. The country is also known for its tremendous wealth of natural resources and biological diversity, scattered over the highest altitudinal ranges from the peak of mountains to one of the lowest and hottest places on earth; however, it faces serious conservation challenges as the result of population increase and land use changes. Ethiopia is the second most populous African country next to Nigeria with the population growth rate among the highest in the world, currently estimated at 2.5% per year (World Bank, 2015). This increase of population at an alarming rate has resulted in rapid and widespread conversion of forest habitats for human settlements, clearing for agriculture, charcoal and firewood harvesting (Bekele, 2011; Campbell, 1991; Buechley et al., 2015), causing habitat fragmentation into smaller pieces of forest of patches. The process of forest fragmentation due to human activities that break large contiguous forested areas through logging or conversion of forests into agricultural areas and suburbanization (Forman, 1995) has been identified as the most important factor contributing to the decline and loss of species diversity worldwide (Bogaert et al., 2011; Noss and Cooperrider, 1994). Forest destruction and fragmentation increase the vulnerability of forest tree community disturbances (Benitez and Malvido, 1998), affecting regeneration of the forest.
Natural regeneration is a fundamental component of tropical forest ecosystem dynamics and is essential for conservation and maintenance of biological diversity (Rahman et al., 2011; Getachew et al., 2010; Dutta and Devi, 2013) as well as to identify plant species for conservation priority; whereas, population structure plays a significant role in determining the dominant status of tree species and development within the forest stand. Regeneration is a key process of building a forest by which trees and forests survive, substitute or restore
(Tyagi et al., 2013). Management of regeneration is an essential component of sustainable forest practice as it ensures the future growing stock (Level, 2010). The knowledge of the floristic composition, regeneration, population structure of a plant community is a prerequisite to understand the overall structure and function of any ecosystem (Singh et al., 2016), whereas understanding woody species diversity and socio-economic factors causing devastation of natural forests ecosystem is crucial in the management of the remnant forest ecosystems (Yakob and Fekadu, 2016). Therefore, it is important to study the floristic composition, population structure and regeneration potentials of different natural forest tree species in Chilimo-Gaji Forest to assess the trends of vegetation in the future. The future composition of forests depends on potential reproduction and recruitment as regeneration status of tree species within a forest stand in space and time (Eilu and Obua, 2005; Henle et al., 2004).
The patterns of regeneration is important because it will ultimately determine the floristic composition of the remnant (Laurance et al., 1998). The density value of seedling and saplings are considered as an indicator of regeneration potential of the species (Arya and Ram, 2011) in which the presence of good regeneration indicates the suitability of a species to the environment, which is in turn affected by climatic factors and biotic interference influence (Dhaulkhandi et al., 2008). The successful regeneration of woody tree species is mainly dependent on a function of three major components: (i) their ability to initiate new seedlings, (ii) the survival ability of seedlings and saplings and (iii) the growth ability of seedlings and saplings (Good and Good, 1972). The density, composition of species and regeneration drives the future of forest which is in need of replacement; and however faces several regeneration stressors including invasive alien species, insects and diseases, herbivory, lack of appropriate management and climate change (McWilliams et al., 2015).
Uncontrolled encroachment and exploitation of natural resources has reduced the coverage of forests, the density and diversity of trees in the forest in Ethiopia leading to deforestation and degradation. Unlike homogeneous plantations, management of natural forests largely depends on successful natural regeneration of valuable species (Islam et al., 2016), which occur when the trees establish and develop as part of the stand.
The forest management paradigm in Ethiopia has recently shifted from conventional management approach to community based participatory forest management under protected area management scheme. Successful management and conservation of natural forest requires reliable data on aspects such as the regeneration trends (Eilu and Obua, 2005). Forest stand, where there are numerous young individuals and lesser mature ones, is recognized as having an inverse J-curve diameter distribution (Dyakov, 2013).

Siraj and Zhang 149
Figure 1. Map of the study area.
MATERIALS AND METHODS Description of the study area The present study was conducted in Chilimo-Gaji Forest which is among the few remnant patches of native dry Afromontane Forest in the country (Figure 1). The forest is located in the Dendi district, which is one of the districts endowed with different landscapes in Oromia Regional State, near to the small town of Ginchi. The study area geographical location is 38° 10' E, and 9°05 'N and with altitudinal ranges between 2170 to 3054 m a.s.l. The forest is a small enclave in the western section of the ridge that stretches from the capital westward to Gedo highlands (Soromessa and Kelbessa, 2013). Chilimo-Gaji Forest consists of over 180 bird species, 21 mammal species commonly Menelik's bushbuck, vervet monkey, Colobus monkey, Anubis baboon and Leopard (Woldemariam, 1998) and other forest creatures are abundant.
Chilimo-Gaji Forest was designated as a national forest priority area in 1982 and is among Ethiopia's 58 national priority forest protected areas in order to minimize deforestation. Due to continuous deforestation, the Chilimo-Gaji Forest cover has declined from 22,000 ha in 1982 to 6000 ha in 1991 (Dugo, 2009). Currently, the forest cover area is estimated at about 5,000 ha, owned by the Federal Government. Though the forest is owned by the state, it is currently divided into blocks and managed by the local forest user groups forming cooperatives under the participatory forest management arrangement schemes. This type of forest management in many regions is assumed to be acting to improve forest conditions and the livelihood of the forest user groups. Chilimo-Gaji Forest is the pioneer of participatory forest management site in Ethiopia, where the forest user groups managing the forest have formed a strong cooperative union. The
forest is important to these local people for grazing, firewood, as source of water, and construction materials. Participatory forest management focuses on improving the livelihood and conserving natural forest systems through local participation and cooperation. Participatory forest management can deliver multiple outcomes such as carbon storage, livelihood benefits and biodiversity conservation (Agrawal and Angelsen, 2009) and can lead to sustainable use of forest resources. Geology and soils In the central plateau including Chilimo-Gaji Forest, basalt constitutes the main rock types that are chemically and mineralogically uniform in composition (Soromessa and Kelbessa, 2013). The soils in Chilimo-Gaji Forest area are reddish brown, gravelly and shallow at higher altitudes, while at lower sites they tend to become dark-grey and deep; whereas soils in the surrounding low plains are vertisols, black soils with characteristic high clay content (Tesfaye et al., 2016). The major soil types around Chilimo-Gaji Forest areas are various types of Vertisols, Luvisols and Cambisols dominated (Soromessa and Kelbessa, 2013). Vegetation The Chilimo-Gaji Forest could be categorized in Afromontane undifferentiated forest type (Friis, 1992). Chilimo-Gaji Forest is dominated and composed of mixed broad leaved coniferous forest and characterized by the dominant tree species of Juniperus procera, Podocarpus falcatus, Apodytes dimdiata, Prunus africana,

150 J. Ecol. Nat. Environ. Olea europaea L. subsp. cuspidata, Olinia rochetiana and Myrsine africana. The report from Soromessa and Kelbessa (2013) indicated that Chilimo-Gaji Forest is known with its diversity and endemism with a total of 213 different plant species. Those 213 plant species were grouped into 83 families, with the highest angiosperm (91%) 193 species, followed by pteridophytes (7%) 16 species, gymnosperms (2%) 4 species (represented by 2 exotic and 2 indigenous species); including 17 plant species that are unique to the Chilimo-Gaji Forest. Vegetation sampling procedures Reconnaissance survey A field reconnaissance survey of the vegetation area was executed in the Chilimo-Gaji Forest at the beginning of December 2014 to get an overview and identify various tree stands. Sampling design Following a reconnaissance survey, actual sampling of vegetation was done focusing on homogeneity via preferential means. In order to develop population structure, the diameter of small and big trees DBH ≥ 2.5 cm at breast and height ≥ 1.5 m were measured using diameter tape. To understand regeneration status of tree species in the study area, all tree species were recorded. Altitude, longitude and latitudes of each plot were measured using GPS. A total of 36 sampling were established. A plot of size 20 m × 20 m (400 m2) was used for trees and shrubs, and a 5 m × 5 m (25 m2) for seedlings. The trees and shrubs were recorded and identified following the published volumes of Flora of Ethiopia and Eritrea and authenticated specimens. The nomenclature of the plant species names were made following the published volumes of Flora of Ethiopia and Eritrea. For the purpose our study, “seedlings”, “saplings” and “mature trees/shrubs” were defined as plants with heights less than 1 m, 1 to 3 m and greater than 3 m, respectively. Data analysis Structural analysis The vegetation data entry form was developed using Microsoft Excel application and subsequent analyses of the data were performed using the same application. Graphs were drawn using Excel spread sheets. All individuals of species recorded in all the 36 plots were used in the analysis of vegetation structure. Species structure (frequency, density, abundance, basal area, and importance value index (IVI) of tree species in the forest were analyzed. Importance value index (IVI) was calculated by summing up relative frequency (RF), relative density (RD) and relative dominance (RD). The DBH, basal area, tree density, frequency and important value index were used for description of vegetation structure.
Regeneration status of a given forest stand can be shown by computing the age (or size) structure of individual tree species. To describe population structure, individuals of recorded species were grouped into diameter classes at a given interval increments of DBH. Basal area (BA)
The basal area of a tree stem is calculated from a tree diameter measurement (DBH) by assuming that the tree stem is perfectly circular with the base of the tree having same diameter as the stem
at 1.5 m above ground (the height for DBH measurement). It is measured from DBH and its basal area was calculated as one of the chief characteristics to determine dominance. Therefore, relative dominance was determined as the relative value of basal area (BA) was calculated for all woody species as
Where BA = basal area in m2; π =3.14; DBH =diameter at breast height.
Dominance Dominance (DO) was calculated as the sum of the basal areas (BA) of the individual woody species in m2 per ha.
Relative Dominance: Basal area of a given species divided by the sum of the basal areas of all of the species × 100
Importance Value Index (IVI)
Where RD= Relative density; RDO= Relative dominance; RF= Relative frequency.
Relative density (RD) is the number of individuals of a species divided by the total number of individuals of all species;
Relative frequency is the frequency of a given species expressed as a percentage of the sum of frequency values for all species present.
Regeneration status
The regeneration status of woody species was summarized based on the total count of seedlings and saplings of each species across all plots. The regeneration status of the forest was assessed using the following categories used by (Dhaulkhadi et al., 2008; Chauhan et al., 2008).
1. „Good regeneration, if seedling is greater than sapling and mature tree/adult (seedling density > sapling density > mature tree/adults; 2. „Fair‟ regeneration, if seedling > or ≤ sapling ≤ mature tree; 3. „Poor‟ regeneration, if a species survives only in the sapling stage, but has no seedlings (even though saplings may be <, >, or = mature); 4. „If a species is present only in an adult form, it is considered as not regenerating 5. „New‟, if a species has no mature, but only sapling and/ or seedling stages.
For the purpose of this study seedling, saplings and mature trees/ shrubs were defined as plants with heights less than 1 m, 1-3 m and greater than 3 m respectively.

RESULTS AND DISCUSSION Floristic composition of woody species A total of 42 species of vascular plants belonging to 34 genera and 28 families were recorded and identified from the 36 study plots in Chilimo-Gaji Forest. The dominant 8 families of plants were Rosaceae, representing (9.76%) 4 species in four genera, Oleaceae (9.76%) 4 species in two genera, two families Flacourtiaceae and Rutaceae each of them are represented by 2 species (4.88%) in two genera, whereas the 5 families Anacardiaceae, Asteraceae, Celasteraceae, Myrisinaceae, Rhamnaceae each of them were represented by (4.88 %) 2 species in one genera respectively. The other remaining 19 families of plants were each of them represented by one genera and one species. Frequency This is the number of plots in which a species recorded/total number of plots. Frequency (F) was the number of sample in which the species was encountered, whereas relative frequency (RF) was computed as the ratio of the number in which a species occurred and the total occurrences of all species in all. The frequency gives an approximate indication of the homogeneity and heterogeneity of a forest stand. O. rochetiana and J. procera are the two most frequent species each recorded in 86.11% of the total plots sampled followed by O. europaea L. subsp. cuspidata (83.33%), Bersama abyssinica (72.22%), M. africana (69.44%), P. falcatus (69.44%), Maytenus gracilipes (66.67%), Dovyalis abyssinica (55.56%) and Osyris quadripartita (55.56%). Regeneration status of Chilimo-Gaji Forest Density of tree/shrub, sapling and seedlings Density is a count of the numbers of individuals of a species within the plots (Kent and Coker, 1992). It refers to the total number of stem of a species ha
-1 which was
calculated by summing up all the stems across all sample plots (abundance) and translated to hectare base for all the species encountered in the study plots whereas, relative density is a proportion of density of a species with respect to total density of all species.
Composition and density of seedlings and saplings would indicate the regeneration status of forests. The regeneration status of 42 woody species occurring in the study plots of Chilimo-Gaji Forest was analyzed, computed and used. The total density of woody plant species in all the 36 sample plots of the study area was 3328.47 individuals ha
-1. The total density of seedlings,
saplings and trees/shurbs were 1743.7, 827.1 and 757.6
Siraj and Zhang 151 ha
-1, respectively as shown in (Figure 3). The top 10
densest woody species at Chilimo-Gaji Forest were (in descending order of density) M. gracilipes (Welw. ex Oliv.) Exell, P. falcatus (Thunb.) R.B. ex Mirb, M. africana L., J. procera Hochst. ex Endl., Olea welwitschii (Knob/.) Gilg & Schellenb., B. abyssinica Fresen and O. rochetiana A.Juss (Table). These species constituted 69.38% of all stems in all sampling plots of the study area, while the least five densest woody species at Chilimo-Gaji Forest were (in descending order of density) Teclea nobilis Del., Rhamnus staddo A.Rich., Salix mucronata Thunb, Rhamnus prinoides L‟herit and Olea capensis L. supsp. macrocarpa (C. H. Wright) Verdc.
The seedling stage was represented by 35 species belonging to 28 genera and 24 families accounting only for 83.33% of the woody plant species in the forest. The densities of seedling in descending order were M. gracilipes (326.39 ha
-1), M. africana (234.72 ha
-1), B.
abyssinica (221.53 ha-1
), O. welwitschii (175 ha-1
), P. falcatus (154.86 ha
-1), D. abyssinica (95.83 ha
-1) and J.
procera (92.36 ha-1
) which accounted for about 74.59% of the total density of seedling (Table 1). While the sapling stage was composed of 34 species representing 29 genera and 25 families covering 80.95% of the woody plant species in the forest, the density of saplings and seedlings were dominated by few species. The sapling densities in descending order for five species were M. africana (117.36 ha
-1), P. falcatus (112.5 ha
-1), Carissa
spinarum (79.86 ha-1
), O. quadripartita (73.61 ha-1
) and J. procera (68.06 ha
-1), accounting for about 54.58% of the
total sapling density (Table 1). Vegetation structure According to Peters (1996), population structure is the numerical distribution of individuals of differing size or age within a population of a given species at a given moment of time. It can also be defined as the distribution of individuals of each species within a population in arbitrarily defined diameter height classes (Adefires, 2007). Population structure data have long been used by foresters and ecologists to investigate the regeneration profile of a species of a given population in the study plots (Woldemariam, 2003). Plant population structure may be affected due to changes in recruitment of individuals at low DBH classes or exploitation of individual at DBH or throughout the class size structure (Rocky and Mligo, 2012).
DBH distribution of Chilimo-Gaji Forest dry Afromontane Forest was classified into nine classes at an interval of 15 cm. The cumulative DBH class distribution of the woody species is given in Figure 2. In this study, the cumulative DBH class distribution showed an inverted J-shape general pattern of normal population structure which could be considered as an indication of stable population status or good regeneration status where the

152 J. Ecol. Nat. Environ. Table 1. Density of tree/shrub, sapling and seedling of some select plant species in Chilimo Gaji Forest.
Botanical name Family Seedling Sapling Tree/Shrub
Allophylus abyssinicus (Hochst.) Radlk. Sapindaceae 33.33 7.64 18.75
Apodytes dimdiata E. Mey. Ex Arn Icacinaceae 6.25 3.47 5.56
Bersama abyssinica Fresen. Melianthaceae 221.53 28.47 3.47
Calpurnia aurea (Ait.) Benth. Fabaceae 5.56 6.25 3.47
Carissa spinarum L. Apocynaceae 12.5 79.86 -
Clausena anisata (Willd.) Benth. Rutaceae 2.08 - -
Dovyalis abyssinica (A.Rich.) Warp. Flacourtiaceae 95.83 14.58 2.08
Ekebergia capensis Sparrm. Meliaceae 15.28 16.67 4.86
Erica arborea L. Ericaceae 4.17 8.33 4.17
Gnidia glauca (Fresen.) Gilg Thymelaeaceae - - 0.69
Hagenia abyssinica (Bruce) J.F. Gmel. Rosaceae - 0.69 9.72
Ilex mitis (L.) Radlk. Aquifolaceae 5.56 7.64 16.67
Jasminum abyssinicum Hochst. ex A.Rich. Oleaceae 3.47 0 0.69
Juniperus procera Hochst. ex Endl. Cupressaceae 92.36 68.06 168.75
Maytenus addat (Loes.) Sebsebe Celasteraceae 41.67 12.5 6.25
Maytenus gracilipes (Welw. ex Oliv.) Exell Celasteraceae 326.39 41.67 6.94
Maytenus obscura (A. Rich.) Cuf. Celasteraceae 20.14 2.78 3.47
Myrica salicifolia A. Rich. Myricaceae 3.47 1.39 5.56
Myrsine africana L. Myrsinaceae 234.72 117.36 1.39
Myrsine melanophloeos (L.) R.Br. Myrisinaceae 70.83 9.72 9.72
Nuxia congesta R.Br. ex Fresen. Loganiaceae 7.64 18.06 27.08
Olea europaea L. subsp. cuspidata (Wall. ex G.Don) c.f. Oleaceae 32.64 36.81 99.31
Olea capensis L. supsp. macrocarpa (C. H. Wright) Verdc. Oleaceae 0.69 - 1.39
Olea welwitschii (Knob/.) Gilg & Schellenb. Oleaceae 175 45.83 40.97
Olinia rochetiana A.Juss. Oliniaceae 31.94 47.22 113.19
Osyris quadripartita Decn. Santalaceae 52.08 73.61 32.64
Pittosporum viridflorum Sims Pittosporaceae - 1.39 2.08
Podocarpus falcatus (Thunb.) R.B. ex Mirb Podocarpaceae 154.86 112.5 91.67
Prunus africana (Hook.f.)Kalkm. Rosaceae 6.25 0.69 22.92
Rhamnus prinoides L’herit. Rhamnaceae 0.69 - -
Rhamnus staddo A.Rich. Rhamnaceae - 0.69 -
Rhus glutinosa subsp. glutinosa A. Rich. Anacardiaceae 9.03 11.81 13.89
Rhus glutinosa A.Rich.subsp. neoglutinosa (M.Gilbert) M.Gilbert Anacardiaceae 6.25 24.31 22.22
Rosa abyssinica Lindley Rosaceae 2.08 2.78 -
Rubus apetalus Poir. Rosaceae - 3.47 -
Salix mucronata Thunb. Salicaceae - - 0.69
Schefflera abysinica (Hochst. ex A. Rich.) Harms Araliaceae - - 3.47
Scolopia theifolia Gilg Flacourtiaceae 3.47 2.08 1.39
Sideroxylon oxyacanthum Baill. Sapotaceae 50 15.28 12.5
Teclea nobilis Del. Rutaceae 0.69 0.69 -
Vernonia amygdalina Del. Asteraceae 7.64 - -
Vernonia auriculifera Hiern. Asteraceae 7.64 2.78 -
majority of the species had the highest number of individuals at lower DBH classes with gradual decrease towards the higher DBH classes. This implies good reproduction and recruitment potential of the vegetation (Derero et al., 2003). As the DBH class size increases, the number of individuals gradually decrease beginning
from 749 stems ha-1
in the first class down to 38 stems ha
-1 in the last DBH class. However, the diameter class
frequency distribution of some individual species is different from the cumulative DBH class distribution. Diameter class distribution of selected tree species demonstrated various patterns of population structure,

Siraj and Zhang 153
Figure 2. Cumulative frequency distribution by diameter class of woody species. DBH classes (cm): 1=<15, 2=15.1-30, 3=30.1-45, 4=45.1-60, 5=60.1-75, 6=75.1-90, 7=90.1-105, 8=105-20, 9 > 120.1.
implying different population dynamics among species (Didita et al., 2010). The slight reduction in diameter classes of some species was due to a selective removal of small diameter class individuals either by local dwellers for some purpose (e.g. for fencing and fuel wood), or by livestock (trampling or browsing), or may be other biotic factors (Wale et al., 2012), indicating selective harvesting of individuals in the particular size classes. Basal area (BA) and important value index (IVI) Tree species with highest dominance indices could be considered the most important species in the study vegetation. Total basal area for Chilimo-Gaji Forest dry Afromontane Forest was found to be 454.52m
2 ha
-1. In
our study, basal area analysis across individual species revealed that very few species had high dominance. J. procera Hochst. ex Endl was the dominant species in the forest comprising 29.3% of the total basal area followed by P. falcatus (Thunb.) R.B. ex Mirb (26.23%) and O. europaea L. subsp. cuspidata (Wall. ex G.Don) c.f. (12.132%). These three woody species accounted for about 74.59% of the total basal area of the study area. This implies that these six species are the most ecologically important woody species in the study area.
Importance value index (IVI) was the summation of RDE + RFR + RDO and presented in percentage (Kent and Coker, 1992; Akwee et al., 2010). Where RD is relative density, RDO is relative dominance and RF is relative frequency. The importance value index compares the ecological significance of species and indicates the importance of individual tree/shrub species in the systems. It is a composite index based on the relative measures of species frequency, density and dominance (Kent and Coker, 1992). This index is used to determine the overall importance of each species in the community structure. IVI enables comparison of the ecological significance of species in a given forest type. Species with the highest importance value are dominant in the
forest. The importance value index (IVI) of the most common and frequent trees of Chilimo-Gaji Forest was listed in Table 2. The importance value index (IVI) of the most common and frequent trees of Chilimo-Gaji Forest was calculated and J. procera (46.58) was found to have the highest IVI (Table 2). The 10 most important woody species with the highest IVIs were in decreasing order, J. procera Hochst. ex Endl., P. falcatus (Thunb.) R.B. ex Mirb, O. europaea L. subsp. cuspidata (Wall. ex G.Don) c.f., O. rochetiana A.Juss., M. gracilipes (Welw. ex Oliv.) Exell, M. africana L., B. abyssinica Fresen, O. welwitschii (Knob/.) Gilg & Schellenb, O. quadripartita Decn and Allophylus abyssinicus (Hochst.) Radlk., were the top ten species in their descending order of ecological importance. These contributed over 91.11% of the total IVI (Table 2) and implies that these ten species are the most ecologically important woody species at Chilimo-Gaji Forest. Regeneration status of woody species in Chilimo-Gaji Forest The density values of seedling and saplings are considered as regeneration potential of the species (Robi, 2016). The successful regeneration of a given forest requires the occurrence of a sufficient number of young trees, saplings and seedlings in population (Hanief et al., 2016).
The total density of mature tree/shrub, sapling and seedling of the study plots was 757.64 (23%), 827.08 (25%) and 1743.75 (52%) individuals ha
-1 respectively
(Figure 3). Density ha−1
of the species showed that seedling > sapling > matured tree in Chilimo-Gaji Forest natural forest. Based on the criteria of Tiwari et al. (2010), indicating the species is categorized under the species with good regeneration. The calculation of the ratio among the seedling, sapling and mature tree can provide information regarding the distribution of mature tree, sapling, seedling and the regeneration status of the
0
100
200
300
400
500
600
700
800
1 2 3 4 5 6 7 8 9
Num
ber
of
indiv
iduals
in th
e
DB
H c
lass
DBH classes (cm)

154 J. Ecol. Nat. Environ. Table 2. Importance value indices for woody species in Chilimo-Gaji Forest.
Botanical Name Relative Density Relative Frequency Relative dominance IVI Rank
Allophylus abyssinicus (Hochst.) Radlk. 1.77 4.34 2.48 8.58 10
Apodytes dimdiata E. Mey ex Arn. 0.45 1.45 0.81 2.71 23
Bersama abyssinica Fresen. 7.49 6.27 0.37 14.13 7
Calpurnia aurea (Ait.) Benth. 0.45 3.13 0.14 3.73 20
Carissa spinarum L. 2.73 2.17 0.23 5.13 16
Clausena anisata (Willd.)Benth. 0.06 0.48 0.00 0.55 34
Dovyalis abyssinica (A.Rich.) Warp. 3.33 4.82 0.26 8.40 11
Ekebergia capensis Sparrm. 1.09 2.65 0.85 4.59 17
Erica arborea L. 0.49 1.45 0.16 2.10 26
Gnidia glauca (Fresen.) Gilg 0.02 0.24 0.03 0.29 40
Hagenia abyssinica (Bruce) J.F. Gmel. 0.31 1.20 0.86 2.37 24
Ilex mitis (L.) Radlk. 0.88 1.20 1.42 3.50 21
Jasminum abyssinicum Hochst. ex A.Rich. 0.12 0.48 0.00 0.61 31
Juniperus procera Hochst. ex Endl. 9.73 7.47 29.30 46.50 1
Maytenus addat (Loes.) Sebsebe 3.45 1.45 0.09 4.98 19
Maytenus gracilipes (Welw. ex Oliv.) Exell 10.88 5.78 1.51 18.18 5
Maytenus obscura (A. Rich.) Cuf. 0.78 1.93 0.17 2.88 22
Myrica salicifolia A. Rich. 0.31 0.24 0.20 0.74 30
Myrsine africana L. 10.45 6.02 1.02 17.49 6
Myrsine melanophloeos (L.) R.Br. 2.69 1.45 0.47 4.60 17
Nuxia congesta R.Br. ex Fresen. 1.56 3.61 1.96 7.14 12
Olea europaea L. subsp. cuspidata (Wall. ex G.Don) c.f. 4.99 7.23 12.13 24.35 3
Olea capensis L. supsp. macrocarpa (C. H. Wright) Verdc. 0.06 0.48 0.03 0.57 33
Olea welwitschii (Knob/.) Gilg & Schellenb. 7.74 3.13 2.82 13.69 8
Olinia rochetiana A.Juss. 5.69 7.47 7.74 20.90 4
Osyris quadripartita Decn. 4.68 4.82 1.68 11.18 9
Pittosporum viridflorum Sims 0.10 0.48 0.00 0.59 32
Podocarpus falcatus (Thunb.) R.B. ex Mirb 10.62 6.02 26.23 42.87 2
Prunus africana (Hook.f.)Kalkm. 0.84 2.17 3.67 6.68 13
Rhamnus prinoides L’herit. 0.02 0.24 0.00 0.26 42
Rhamnus staddo A.Rich. 0.02 0.24 0.00 0.26 41
Rhus glutinosa subsp. glutinosa A. Rich. 1.05 0.96 0.22 2.23 25
Rhus glutinosa A.Rich.subsp. neoglutinosa (M.Gilbert) M.Gilbert 1.56 2.89 1.40 5.85 15
Rosa abyssinica Lindley 0.14 0.24 0.00 0.39 37
Rubus apetalus Poir. 0.10 0.24 0.00 0.34 38
Salix mucronata Thunb. 0.02 0.24 0.07 0.33 39
Schefflera abysinica (Hochst. ex A. Rich.) Harms 0.10 0.72 0.30 1.12 27
Scolopia theifolia Gilg 0.21 0.48 0.15 0.84 28
Sideroxylon oxyacanthum Baill. 2.30 3.13 1.18 6.61 14
Teclea nobilis Del. 0.04 0.48 0.03 0.55 34
Vernonia amygdalina Del. 0.35 0.24 0.01 0.60 36
Vernonia auriculifera Hiern. 0.31 0.48 0.02 0.81 29
Total 100 100 100 300
species (Chauhan et al., 2008; Robi, 2016). In line with this, the ration of seedling to sapling, seedling to mature tree and sapling to mature tree of the species was conducted and the result was 2.11:0.47, 2.30:0.43 and 1.09:0.92, respectively. These reveal that the distribution
of seedling density is greater than both sapling and mature tree/shrub. The successful regeneration of a given forest requires the occurrence of a sufficient number of young trees, saplings and seedlings in population (Hanief et al., 2016). Hence, in this study

Siraj and Zhang 155
Figure 3. Density of seedling, sapling and mature tree/shrubs.
Figure 4. Regenration status of individuals based on Dhaulkhadi et al. (2008) and Chauhan et al. (2008) categories.
there is sufficient amount of seedling and sapling is availabile as a potential for regeneration and recruitment (Figure 3).
As far as the regeneration status of each species is concerned and based on the categories used by Dhaulkhadi et al. (2008) and Chauhan et al. (2008); out of the 42 wood species, eleven (26.19%) tree species achieved good regeneration, eighten (42.86%) species had fair regeneration, three (7.14%) had poor regeneration, three (7.4%) lacked regeneration, and seven (16.66%) were appearing as new species regenerating (Figure 4).
Most of the species in the current study had shown differences in forest structure. In this study, the diameter class frequency distribution of selected species with high IVI had four different patterns. The first pattern of structure is reverse J-shape which is characteristic for many tropical forests (Richards, 1996) exemplified by P. africana and P. falcatus (Figure 5), with a successful regeneration (Poorter et al., 1996). This pattern indicates the presence of highest density in the lower DBH classes with gradual decrease in density towards the bigger classes, which suggests good reproduction and
recruitment (Derero et al., 2003; Lulekal et al., 2008) (Figure 5). The second pattern is interrupted inverted J curve population. This pattern shows high frequency in the lower DBH classes followed by a gradual decrease and absence of representative individuals after the middle class. It suggests good reproduction but bad recruitment exemplified by M. Africana and B. abyssinica (Figure 5). The third pattern is the irregularly interrupted DBH distributions that indicate poor regeneration and recruitment exemplified by Ekebergia capensis (Figure 5), while the Fourth is depicted as Bell-shaped pattern which reflects discontinuous or irregular recruitment in which regeneration has been inhibited by vigorous growth of young cohort populations of the dominant canopy tree (Måren and Vetaas, 2007). Conclusion In this study, floristic composition vegetation structure and regeneration patterns were determined for the woodland vegetation in Chilimo-Gaji Forest. Rosaceae was found to be the most dominant family followed by
757.64
827.08
1743.75
Density of wood species
mature tree/shrub
sapling
seedling
26%
43%
7%
7%
17%
Regeneration status VS No. of Species
Good regeneration
Fair regeneration
poor regeneration
lacked regeneration
new appearsing

156 J. Ecol. Nat. Environ.
Figure 5. The four population structure of selected tree species classified according to different DBH (cm) classes, such as, 1 =<10, 2 = 10.1–25.0, 3 = 25.1–40.0, 4 = 40.1–55.0, 5 = 55.1–70.0, 6 = 70.1–85.0, 7 = 85.1–100.0, 8 = 100.1–115.0, 9 = 115.1–130.0, 10 > 130.1. Oleaceae, Flacourtiaceae and Rutaceae. The results of this study is important in understanding the patterns of the vegetation structure and regeneration status of wood species in Chilimo-Gaji Forest, which is generously significant for the sustainable utilization, management and decision making for the future conservation of the forest. Abundance of seedlings and saplings are indicators of the establishment of young individuals. In this study, generally, the regeneration of wood species has shown that contribution of seedlings density was highest followed by saplings and adult trees, representing relatively a healthy regeneration of the species. This
implies that the overall regeneration status of wood species in the study area has good reproduction and recruitment potential of the vegetation though dominated by few species.
The presence of good reproduction and recruitment for regeneration of species is an important effective strategy for restoration of the tropical secondary forest, which further helps to sustain the future natural forest ecosystem. However, woody species represented by “poor” or “no” regeneration of growth, survival, and reproduction potential at risk in future, needs systematic management plan for their conservation and sustainable
0
50
100
150
1 2 3 4 5 6 7 8 9 10
Podocarpus falcatus (Thunb.) R.B. ex Mirb
0
5
10
1 2 3 4 5 6 7 8 9 10
Prunus africana (Hook.f.) Kalkm.
0
50
100
150
1 2 3 4 5 6 7 8 9 10
Myrsine africana L.
0
50
100
150
1 2 3 4 5 6 7 8 9 10
Bersama abyssinica Fresen.
0
5
10
15
1 2 3 4 5 6 7 8 9 10
Ekebergia capensis Sparrm.
0
2
4
6
1 2 3 4 5 6 7 8 9 10
Apodytes dimdiata E. Mey ex Arn.
Num
ber
of
indiv
iduals
in t
he D
BH
cla
ss
DBH classes (cm) DBH classes (cm)
DBH classes (cm) DBH classes (cm)
DBH classes (cm) DBH classes (cm)
Num
ber
of
indiv
iduals
in t
he D
BH
cla
ss
Num
ber
of
indiv
iduals
in t
he D
BH
cla
ss
Nu
mb
er
of
ind
ivid
ua
ls
in t
he
DB
H c
lass
Nu
mb
er
of
ind
ivid
ua
ls
in t
he
DB
H c
lass
Nu
mb
er
of
ind
ivid
ua
ls
in t
he
DB
H c
lass

utilization (Singh et al., 2016) and should be given priority in conservation, for example, Pittosporum viridflorum, Jasminum abyssinicum, Rhamnus staddo, Gnidia glauca, Rubus apetalus, Salix mucronata, and Schefflera abysinica. The forest management paradigm in Ethiopia has recently shifted from conventional management approach to community based forest management under protected area management scheme. As the result of the implementation of participatory forest management since 1996, in the current study area, has contributed for the successful regeneration of some wood species specifically the indigenous trees such as P. falcatus, M. africana, B. abyssinica and J. procera, indicating scaling up of the participatory forest management to other forests under restricted management to promote sustainable utilization and management of the forest resources. CONFLICT OF INTERESTS The authors have not declared any conflict of interests. REFERENCES
Adefires W (2007). Population status and socio-economic importance of
gum and resin bearing species in Borana Lowlands, southern Ethiopia (Doctoral dissertation, AAU).
Agrawal A, Angelsen A (2009). Using community forest management to achieve REDD+ goals. In A. Angelsen, ed., Realising REDD+: national strategy and policy options. Bogor, Center for International Forestry Research.
Akwee PE, Palapala VA, Gweyi-Onyango JP (2010). A comparative study of plant species composition of grasslands in Saiwa Swamp National Park and Kakamega Forest, Kenya. Journal of Biodiversity 1(2):77-83.
Aliyi K, Hundera K, Dalle G (2015). Floristic Composition, Vegetation Structure and Regeneration Status of Kimphe Lafa Natural Forest, Oromia Regional State, West Arsi, Ethiopia. Research and Reviews: A Journal of Life Sciences 5(1):19-32.
Arya N, Ram J (2011). Forest disturbance and its impact on species richness and regeneration of Uttarakhand Himalaya. NY Science Journal 4(6):21-27.
Aune JB, Alemu AT, Gautam KP (2004). Carbon sequestration in rural communities: is it worth the effort?. Journal of Sustainable Forestry 21(1):69-79.
Bekele M (2011). Forest plantations and woodlots in Ethiopia: a platform for stakeholders in African forestry. African For. Forum P 1.
Benitez‐Malvido J (1998). Impact of forest fragmentation on seedling abundance in a tropical rain forest. Conservation Biology 12(2):380-389.
Bogaert J, Barima YS, Iyongo WML, Bamba I, Mama A, Toyi M, Lafortezza R (2011). Forest fragmentation: causes, ecological impacts and implications for landscape management. Landscape ecology in forest management and conservation. Challenges and solutions for global change pp. 273-296.
Buechley ER, Şekercioğlu ÇH, tickem , Gebremichael G, Ndungu JK, Mahamued BA, Lens L (2015). Importance of Ethiopian shade coffee farms for forest bird conservation. Biological Conservation 188:50-60.
Campbell J (1991). Land or peasants?: the dilemma confronting Ethiopia resource conservation. African Affairs 90:5-21.
Chauhan D, Dhanal C, Singh B, Chauhan S, Todaria N, Khalid M (2008) Regeneration and Tree Diversity in Natural and Planted Forests in a Terai -Bhabhar Forest in Katarniaghat Wildlife Sanctuary, India. Tropical Ecology 49(1):53-67.
Siraj and Zhang 157 Derero A, Bekele T, Naslund B (2003). Population structure and
regeneration of woody species in a broad-leaved afromontane rain forest, south west Ethiopia. Ethiopian Journal of Natural Resources 5:255-280.
Dhaulkhandi M, Dobhal A, Bhatt S, Kumar M (2008). Community structure and regeneration potential of natural forest site in Gangotri, India. Journal of Basic and Applied sciences 4(1):49-52.
Didita M, Nemomissa S, Gole TW (2010). Floristic and structural analysis of the woodland vegetation around Dello Menna, Southeast Ethiopia. Journal of Forestry Research 21(4):395-408.
Dugo GS (2009). The structure and regeneration status of tree and shrub species of Chilimo forest-ecological sustainability Indicators for participatory forest management in Oromia, Ethiopia.
Dutta G, Devi A (2013) Plant diversity, population structure, and regeneration status in disturbed tropical forests in Assam, northeast India. Journal of Forestry Research 24:715-72.
Dyakov NR (2013). Successional Pattern, Stand Structure and Regeneration of Forest Vegetation According to Local Environmental Gradients. Ecologia Balkanica 5(1).
Eilu G, Obua J (2005). Tree condition and natural regeneration in disturbed sites of Bwindi Impenetrable Forest National Park, southwestern Uganda. Tropical Ecology 46(1):99-112.
Food and Agriculture Organization (FAO) (2014). State of the world„s forests enhancing the socioeconomic benefits from forests. Rome
Forman TT (1995). Land Mosaics: The Ecology of Landscapes and Regions. New York: Cambridge University Press.
Gebrehiwot K, Hundera K (2014). Species Composition, Plant Community Structure and Natural Regeneration Status of Belete Moist Evergreen Montane Forest, Oromia Regional State, Southwestern Ethiopia. Momona Ethiopian Journal of Science 6:97-101.
Getachew T, Demel T, Masresha F, Erwin B (2010). Regeneration of seven indigenous tree species in a dry Afromontane forest, Southern Ethiopia. Flora 205:135-143.
Good NF, Good RE (1972). Population dynamics of tree seedlings and saplings in mature Eastern hardwood forest. Bull Torrey Bot. Club. P99
Hanief M, Bidalia A, Meena A, Rao KS (2016) Natural regeneration dynamics of dominant tree species along an altitudinal gradient in three different forest covers of Darhal watershed in north western Himalaya (Kashmir), India. Tropical Plant Research Journal 3(2):253-262.
Henle K, Davies KF, Kleyer M, Margules C, Settele J (2004). Predictors of species sensitivity to fragmentation. Biodiversity Conservation 13(1):207-251.
Islam I, Hasan SS, kawsar MH, Rahman M (2016). The effect of soil moisture content and forest canopy openness on the regeneration of Dipterocarpus turbinatus C.F. Gaertn. (Dipterocarpaceae) in a protected forest area of Bangladesh. Tropical Ecology 57(3):455-464.
Kent M and Coker P (1992). Vegetation Description and Analysis: A practical approach. London: Belhaven press P 363.
Laurance WF, Ferreira LV, Merona JM, Laurance SG, Hutchings RW, Lovejoy, TE (1998). Effects of forest fragmentation on recruitment patterns in Amazonian tree communities. Conservation biology 12(2):460-464
Level FWPA (2010). Tree growth relationships and silvicultural tools to assist stand management in private native spotted gum dominant forests in Queensland and northern New South Wales.
Lulekal E, Kelbessa E, Bekele T, Yineger H (2008). Plant species composition and structure of the Mana Angetu moist montane forest, south-eastern Ethiopia. Journal of East African Natural History 97(2):165-185
Måren IE, Vetaas OR (2007). Does regulated land use allow regeneration of keystone forest species in the Annapurna Conservation Area, Central Himalaya. Mountain Research Development 27(4):345-351.
McWilliams WH, Westfall JA, Brose PH, Dey DC, Hatfield M, Johnson K, Ristau TE (2015). A regeneration indicator for Forest Inventory and Analysis: history, sampling, estimation, analytics, and potential use in the midwest and northeast United States.
Millennium Ecosystem Assessment (MEA) (2005) Forest and woodland systems. Ecosystems and human well-being: current state and

158 J. Ecol. Nat. Environ.
trends. World Resources Institute, Washington, DC Noss RF, Cooperrider A (1994). Saving Nature's Legacy: Protecting
and Restoring Biodiversity. Defenders of Wildlife and Island Press, Washington, DC, P 416.
Peters CM (1996). The ecology and management of Non-timber forest resources. World Bank Technical paper P322, Washington.
Poorter L, Bongers F, van Rompaey RS, de Klerk M (1996). Regeneration of canopy tree species at five sites in West African moist forest. Forest Ecology and Management 84(1):61-69.
Rahman MH, Khan MASA, Roy, B, Fardusi MJ (2011). Assessment of natural regeneration status and diversity of tree species in the biodiversity conservation areas of Northeastern Bangladesh. Journal of Forestry Research 22(4):551-559.
Richards PW (1996). The Tropical Rain Forest. Second edition. Cambridge University Press, Cambridge.
Robi (2016).The status of an Ethiopian endemic plant Vepris dainellii (Pichi-Serm.) Kokwaro, in Arba Minch Natural Forest, Southern Ethiopia. International Journal of Multidisciplinary 311:20-24.
Rocky J, Mligo C (2012). Regeneration Pattern and Size-Class Distribution of Native Tree Species in Exotic Plantation in Pugu Forest Reserve, Tanzania.
Singh S, Malik ZA, Sharma CM (2016). Tree Species Richness, Diversity and Regeneration Status in Different Oak (Quercus spp.) Dominated forests of Garhwal Himalaya, India. Journal of Asia-Pacific Biodiversity.
Siraj M, Zhang K, Xiao W, Bilal A, Gemechu S, Geda K, Xiaodan L (2016). Does participatory forest management save the remnant forest in Ethiopia?. Proceedings of the National Academy of Sciences, India Section B: Biological Sciences 88(1):1-14.
Soromessa T, Kelbessa E (2013). Diversity and endemicity of Chilimo
forest, central Ethiopia. Bioscience Discovery 4(1):1-4. Tesfaye MA, Bravo-Oviedo A, Bravo F, Ruiz-Peinado R (2016).
Aboveground biomass equations for sustainable production of fuelwood in a native dry tropical afromontane forest of Ethiopia. Annals of Forest Science pp. 1-13.
Tyagi JV, Qazi N, Rai SP, Singh MP (2013). Analysis of soil moisture variation by forest cover structure in lower western Himalayas, India. Journal of forestry Research 24(2):317-324.
United Nations Forum on Forests Secretariat (UNFF) (2007) Enabling sustainable forest management: strategies for equitable development, for forests, for people. New York.
Wale HA, Bekele T, Dalle G (2012). Floristic diversity, regeneration status, and vegetation structure of woodlands in Metema Area, Amhara National Regional State, Northwestern Ethiopia. Journal of Forestry Research 23(3):391-398.
Woldemariam T (2003). Vegetation of the Yayu forest in Southwest Ethiopia: Impacts of human use and Implications for In situ conservation of Wild Coffea arabica L. populations. Ecology and Development Ecology Development Series P 10.
World Bank (2015).http://www.data.worldbank.org/indicator/ accessed November 2015
Yakob G, Fekadu A (2016). Diversity and Regeneration Status of Woody Species: The Case of Keja Araba and Tula Forests, South West Ethiopia. Open Access Library Journal 3(04):1.