Embed Size (px)
Citation preview
STRUCTURE AND MECHANISM OF A EUKARYOTIC
FMN ADENYLYLTRANSFERASE
Approved by supervisory committee
____________________________________
Hong Zhang, Ph.D. (Mentor)
____________________________________
Diana Tomchick, Ph.D. (Committee Chair)
____________________________________
Kevin Gardner, Ph.D.
____________________________________
Betsy Goldsmith, Ph.D.

This thesis is dedicated to my family.
STRUCTURE AND MECHANISM OF A EUKARYOTIC
FMN ADENYLYLTRANSFERASE
by
CARLOS HUERTA JR.
DISSERTATION
Presented to the Faculty of the Graduate School of Biomedical Sciences
The University of Texas Southwestern Medical Center at Dallas
In Partial Fulfillment of the Requirements
For the Degree of
DOCTOR OF PHILOSOPHY
The University of Texas Southwestern Medical Center at Dallas
Dallas, Texas
December, 2009

Copyright
by
CARLOS HUERTA JR., 2009
All Rights Reserved

v
ACKNOWLEDGEMENTS
There are many individuals that contributed to my graduate education and
I would like to thank a few of them. First, I would like to honor my mentor, Dr.
Hong Zhang. Dr. Zhang’s support and encouragement was essential to the
completion of my graduate education. Dr. Zhang’s compassion to X-ray
crystallography and biological science was fundamental in transforming me into a
structural biologist.
I would also like to thank all past and current members of the Zhang
laboratory. In particular, I would like to thank Dr. Nian Huang and Dr. Darek
Martynowski for discussions in structure refinement and modeling, and Marcelo
Raines for teaching me protein purification and crystallization. A special
acknowledgement goes to Dr. Dominika Borek for teaching me how to solve my
first protein structure and her support through-out my graduate education.
My graduate thesis would not be possible without the guidance and
understanding of my dissertation committee members Dr. Diana Tomchick, Dr.
Kevin Gardner and Dr. Elizabeth Goldsmith. I owe them and Dr. Zhang my
deepest gratitude.
Finally, I would like to thank my family for all their support and
encouragement. Without my mom, Mary Huerta, and my aunt, Jaimi Salas, my
path to a graduate education would not exist. I would also like to thank my
brother and my sister for encouragement and interest in my research.

vi
STRUCTURE AND MECHANISM OF A EUKARYOTIC
FMN ADENYLYLTRANSFERASE
Carlos Huerta Jr., Ph.D.
The University of Texas Southwestern Medical Center at Dallas, 2009
Supervising Professor: Hong Zhang, Ph.D.
ABSTRACT
Flavin mononucleotide adenylyltransferase (FMNAT) catalyzes the
formation of the essential flavocoenzyme FAD and plays an important role in
flavocoenzyme homeostasis regulation. By sequence comparison, bacterial and
eukaryotic FMNAT enzymes belong to two different protein superfamilies and
apparently utilize different set of active site residues to accomplish the same
chemistry. Extensive biochemical studies from endogenous bacterial and
mammalian FMNATs using FMN analogs and various cations have suggested
that the architectures of the substrate binding and catalytic sites are different.
Sequence comparison reveals that eukaryotic FMNAT is related to the PAPS
reductase-like family, which belongs to the adenine nucleotide hydrolase-like
superfamily. Despite the classification of eukaryotic FMNAT, the residues
vii
involved in substrate binding and catalysis are not completely known, as
eukaryotic FMNAT has no sequence similarity to other known flavin binding
proteins. To determine the unique flavin binding site, and to investigate the
residues involved in substrate binding and the mechanism of catalysis, we utilized
X-ray crystallography and biochemical methods.
Here we report the first structural characterization of a eukaryotic FMNAT
from a pathogenic yeast Candida glabrata (CgFMNAT). Four crystal structures
of CgFMNAT in different complexed forms were determined at resolutions
between 1.20-1.95 Å, capturing the enzyme active site states prior to and after
catalysis. These structures reveal a novel flavin-binding mode and a unique
enzyme-bound FAD conformation. Comparison of the bacterial and eukaryotic
FMNAT provides a structural basis for understanding the convergent evolution of
the same FMNAT activity from different protein ancestors. The different
complexed forms of CgFMNAT allowed a structure-based investigation into the
kinetic properties of eukaryotic FMNAT, whereby two “supermutants” were
identified from mutagenic analysis. The steady-state kinetics and product
inhibition properties of the two “supermutants” provided a basis for understanding
the regulatory mechanisms of FAD homeostasis by FMNAT in eukaryotic
organisms.
viii
TABLE OF CONTENTS
ACKNOWLEDGEMENT v
ABSTRACT vi
PRIOR PUBLICATIONS xii
LIST OF FIGURES xiii
LIST OF TABLES xvii
LIST OF ABREVIATIONS xviii
CHAPTER 1: General Introduction
A. Biological Function of Flavin Cofactors 1
B. Biosynthetic Pathway of Flavocofactors 11
1. Biosynthesis of riboflavin 11
2. Biosynthesis of flavocofactors 15
3. Genes of riboflavin biosynthesis 15
4. Genes of flavocofactor biosynthesis 20
5. Riboflavin transporter 23
C. FMNAT Protein Family 24
D. Enzymatic Properties of Bacteria and Eukaryotic FMNATs 26
E. Regulation of FAD Biosynthesis 28
F. Objective of Research 30
CHAPTER 2: Structure Determination of apo-CgFMNAT
A. Introduction 32

ix
B. Materials 38
C. Methods
1. Cloning, expression and purification of S. cerevisiae 39
and apo-CgFMNAT
2. Crystallization of apo-CgFMNAT 46
3. Data collection, X-ray structure determination and refinement 50
D. Results
1. Quality of apo-CgFMNAT model 55
2. Description of apo-CgFMNAT structure 61
3. Structural comparison to adenine nucleotide 73
hydrolase-like superfamily
E. Discussion 77
CHAPTER 3: Structures of CgFMNAT Complexes
A. Introduction 81
B. Materials 83
C. Methods
1. Expression and purification 83
2. Crystallization 84
3. Data collection, X-ray structure determination and refinement 89
D. Results
1. Quality of CgFMNAT complex structures 95

x
2. Comparison of CgFMNAT complex structures 105
3. Substrate binary and ternary complexes − ATP binding site 115
4. Substrate ternary complex – Flavin binding site 123
5. Product ternary complex 127
6. Local conformational changes in different CgFMNAT states 131
7. Comparison of the active site with other 135
adenine nucleotide hydrolase-like proteins
8. Small molecule interaction sites on CgFMNAT surface 144
E. Discussion
1. Novel flavin-binding site in CgFMNAT 150
2. Bacterial and eukaryotic FMNATs – 155
a case of convergent evolution
CHAPETER 4: Steady-state kinetics and mutagenic analysis
A. Introduction 159
B. Materials 160
C. Methods
1. Mutagenesis, protein expression and purification 161
2. Steady-state kinetics analysis 163
3. Product inhibition analysis 166
D. Results
1. Steady-state kinetic analysis of CgFMNAT 170
xi
2. Investigating roles of active residues by mutagenesis 172
3. Product feedback inhibition analysis 176
4. Proposed catalytic mechanism for CgFMNAT 181
E. Discussion
1. Roles of the catalytic residues 185
2. Interaction between ATP and FMN binding site 187
3. Product inhibition of CgFMNAT 189
CHAPTER 5: Conclusion and Future Direction 192
REFERENCES 198

xii
PRIOR PUBLICATIONS
1. Yang K, Strauss E, Huerta C, and Zhang H. (2008) “Structural Basis for
Substrate Binding and the Catalytic Mechanism of Type III Pantothenate
Kinase.” Biochemistry. 47, 1369-1380.
2. Huerta C, Borek D, Machius M, Grishin NV, and Zhang H. (2009)
“Structure and Mechanism of a Eukaryotic FMN Adenylyltransferase.”
Journal of Molecular Biology. 389, 388-400.

xiii
LIST OF FIGURES
Figure 1.1 ............................................................................................................... 3
Figure 1.2 ............................................................................................................... 4
Figure 1.3 ............................................................................................................... 5
Figure 1.4 ............................................................................................................... 6
Figure 1.5 ............................................................................................................... 8
Figure 1.6 ............................................................................................................. 13
Figure 1.7 ............................................................................................................. 16
Figure 1.8 ............................................................................................................. 18
Figure 1.9 ............................................................................................................. 22
Figure 2.1 ............................................................................................................. 34
Figure 2.2 ............................................................................................................. 37
Figure 2.3 ............................................................................................................. 43
Figure 2.4 ............................................................................................................. 44
Figure 2.5 ............................................................................................................. 48
Figure 2.6 ............................................................................................................. 49
Figure 2.7 ............................................................................................................. 57
Figure 2.8 ............................................................................................................. 58
Figure 2.9 ............................................................................................................. 59
Figure 2.10 ........................................................................................................... 60
xiv
Figure 2.11 ........................................................................................................... 63
Figure 2.12 ........................................................................................................... 64
Figure 2.13 ........................................................................................................... 66
Figure 2.14 ........................................................................................................... 67
Figure 2.15 ........................................................................................................... 69
Figure 2.16 ........................................................................................................... 70
Figure 2.17 ........................................................................................................... 71
Figure 2.18 ........................................................................................................... 75
Figure 2.19 ........................................................................................................... 76
Figure 2.20 ........................................................................................................... 78
Figure 3.1 ............................................................................................................. 87
Figure 3.2 ............................................................................................................. 88
Figure 3.3 ............................................................................................................. 90
Figure 3.4 ............................................................................................................. 92
Figure 3.5 ............................................................................................................. 96
Figure 3.6 ............................................................................................................. 97
Figure 3.7 ............................................................................................................. 98
Figure 3.8 ........................................................................................................... 100
Figure 3.9 ........................................................................................................... 103
Figure 3.10 ......................................................................................................... 106
Figure 3.11 ......................................................................................................... 107

xv
Figure 3.12 ......................................................................................................... 110
Figure 3.13 ......................................................................................................... 111
Figure 3.14 ......................................................................................................... 112
Figure 3.15 ......................................................................................................... 113
Figure 3.16 ......................................................................................................... 114
Figure 3.17 ......................................................................................................... 117
Figure 3.18 ......................................................................................................... 118
Figure 3.19 ......................................................................................................... 119
Figure 3.20 ......................................................................................................... 121
Figure 3.21 ......................................................................................................... 122
Figure 3.22 ......................................................................................................... 125
Figure 3.23 ......................................................................................................... 128
Figure 3.24 ......................................................................................................... 130
Figure 3.25 ......................................................................................................... 132
Figure 3.26 ......................................................................................................... 133
Figure 3.27 ......................................................................................................... 136
Figure 3.28 ......................................................................................................... 137
Figure 3.29 ......................................................................................................... 140
Figure 3.30 ......................................................................................................... 145
Figure 3.31 ......................................................................................................... 146
Figure 3.32 ......................................................................................................... 148

xvi
Figure 3.33 ......................................................................................................... 149
Figure 3.34 ......................................................................................................... 152
Figure 3.35 ......................................................................................................... 153
Figure 3.36 ......................................................................................................... 157
Figure 4.1 ........................................................................................................... 164
Figure 4.2 ........................................................................................................... 171
Figure 4.3 ........................................................................................................... 174
Figure 4.4 ........................................................................................................... 177
Figure 4.5 ........................................................................................................... 179
Figure 4.6 ........................................................................................................... 180
Figure 4.7 ........................................................................................................... 182
Figure 4.8 ........................................................................................................... 184
xvii
LIST OF TABLES
Table 2.1 ...............................................................................................................52
Table 2.2 .............................................................................................................. 72
Table 3.1 .............................................................................................................. 94
Table 3.2 ............................................................................................................ 104
Table 4.1 ............................................................................................................ 162
Table 4.2 ............................................................................................................ 175

xviii
LIST OF ABBREVIATIONS
Å Angstrom
AIF Apoptosis-inducing factor
AMPCPP ,-methyleneadenosine 5’-triphosphate
APBS Adaptive Poisson-Boltzmann Solver
APS Adenosine phosphosulfate
ATP Adenosine 5’-triphosphate
ATPase ATP hydrolyzing enzyme
C-terminus Carboxyl-terminus
CoREST REST corepressor
CCP4 Collaborative computational project 4
DAAO D-amino acid oxidase
DNA Deoxyribonucleic acid
dNTP Deoxyribonucleotide triphosphate
DTT Dithiolthreitol
EC Enzyme commission
Ero1 Endoplasmic reticulum oxidoreductin 1
FAD Flavin adenine dinucleotide
FADS Flavin adenine dinucleotide synthetase
Fc Calculated structure factor amplitude
FFT Fast Fourier transform
FMN Flavin mononucleotide
FMNAT Flavin mononucleotide adenylyltransferase
Fo Observed structure factor amplitude
g Gravity acceleration
GMP Guanosine monophosphate

xix
GTP Guanosine triphosphate
HEPES 4-(2-hydroxyethyl)-1-piperazineethanesulfonic acid
His6 Six histidines
IPTG Isopropyl-1-thio--D-galactopyranoside
LB Luria-Bertani
LSD1 Lysine-specific demethylase 1
kcat Enzyme turnover rate
Ki Inhibitor equilibrium constant
Km Michaelis-Menten constant
MAD Multiple-wavelength anomalous diffraction
MAO Monoamine oxidase
MESG 2-amino-6-mercapto-7-methylpurine riboside
Mg2+
magnesium ion
MgCl2 Magnesium chloride
MICAL Molecule interacting with CasL
MoCo Molybdenum cofactor
MoeA Product of moeA gene
MogA Product of mogA gene
MTHFR 5,10-methylenetetrahydrofolate reductase
N-terminus Amine-terminus
N-type Ammonium-type
Na1+
Sodium ion
NaCl Sodium chloride
NAD Nicotinamide adenine dinucleotide
NH3+
Ammonium
NaMN Nicotinic acid mononucleotide

xx
NMN Nicotinamide mononucleotide
NMNAT Nicotinamide mononucleotide adenylyltransferase
PAPS 3’-phosphoadenosine 5’-phosphosulfate
PCR Polymerase chain reaction
Pfam Protein families
PEG Polyethylene glycol
PEG MME Polyethylene glycol monomethyl ether
PNP Purine nucleoside phosphorylase
PPase Inorganic pyrophosphatase
PPi Inorganic pyrophosphate
RFK Riboflavin kinase
RT Room temperature
SAD Single anomalous diffraction
SCOP Structural classification of proteins
SDS-PAGE Sodium dodecyl-sulfate polyacrylamide gel electrophoresis
SeMet Selenomethionyl
TEV Tobacco etch virus
Tm Melting temperature
Tris Tris(hydroxymethyl) aminomethane
tRNA Transfer ribonucleic acid
Vmax Maximum velocity
w/v Weight per volume
XMP Xanthosine 5’-monophosphate

1
CHAPTER 1
General Introduction
Biological Function of Flavin Cofactors
The riboflavin derivatives flavin mononucleotide (FMN) and flavin
adenine dinucleotide (FAD) are essential cofactors involved in many
oxidation/reduction (redox) reactions in the cell1. The functional and chemical
versatility of these cofactors, in association with various flavoproteins (proteins
that bind flavins), allows them to be involved in a large variety of reaction types
and to participate in many cellular processes ranging from energy production,
metabolism, light emission, DNA repair, chromatin remodeling, and protein
folding to detoxification, neural development, and apoptosis2-4
. Due to the
involvement of flavocofactors in wide-ranging cellular processes, riboflavin
deficiency in human leads to a multitude of physiological aberrations, such as
abnormal fetal development, inadequate ion absorption, cardiovascular disease
and corneal defects5.
The flavocofactors, FMN and FAD, have many biological functions.
Primarily, they act as redox agents that can undergo one- and two-electron
transfer processes. The flavocofactors can also act as nucleophiles and

2
electrophiles that form a flavin-adduct intermediate1,6-9
. The electron transfer
occurs at the N1 and N5 atom positions of the isoalloxazine ring (Fig. 1.1),
whereas flavin-adduct intermediates occur on the C4a and N5 atom positions.
Flavoproteins, which are flavin-dependent for catalysis, have the flavin non-
covalently or covalently bound (either permanently or reversibly) as a
cofactor8,10,11
. The covalent bond can occur as a single linkage between the
isoalloxazine ring of the flavin and a Cys, His or Tyr residue of the
flavoprotein8,10
, or as a dual linkage involving Cys and His11
(Fig. 1.2).
The type of flavoprotein the flavins associate with dictates the chemical
reaction type that the flavin will perform1. Oxidases and monooxygenases are two
flavin-dependent flavoproteins that require molecular oxygen for the catalytic
process, in which hydrogen peroxide is an end product for oxidases and water for
monooxygenases12
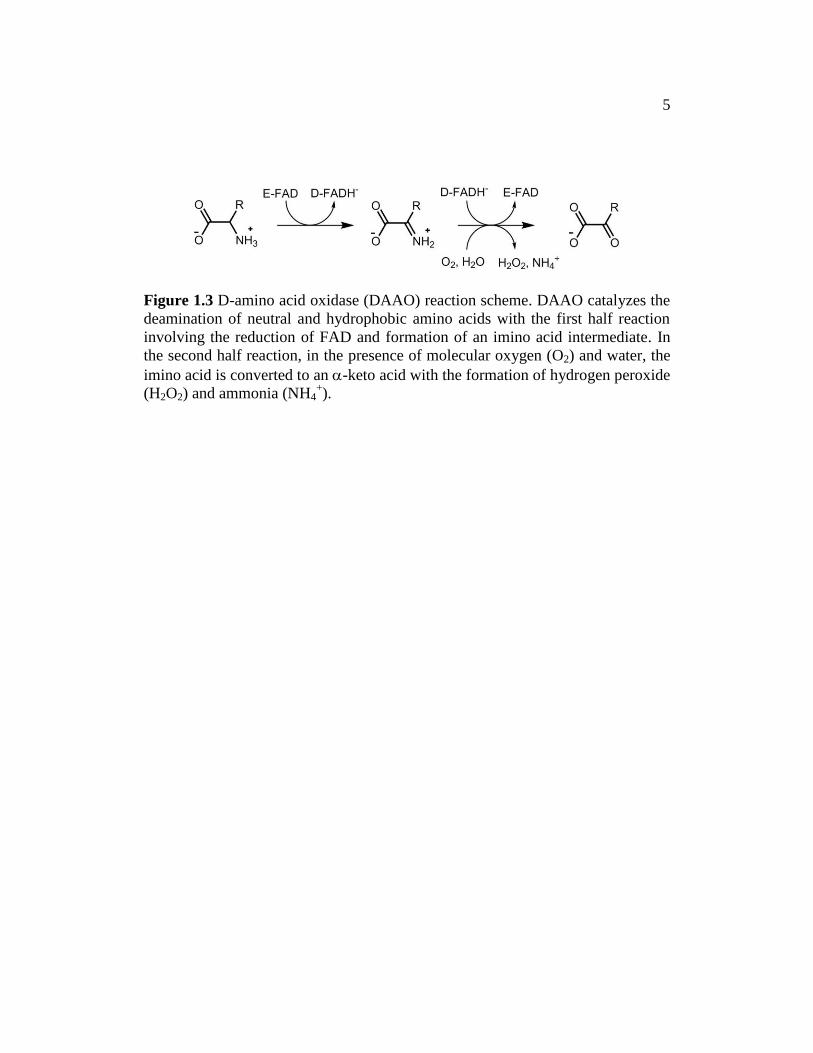
. An example of an oxidase is the FAD-dependent D-amino
acid oxidase (DAAO) that deaminates neutral and hydrophobic amino acids with
the production of hydrogen peroxide, ammonia and an -keto acid13
(Fig. 1.3). In
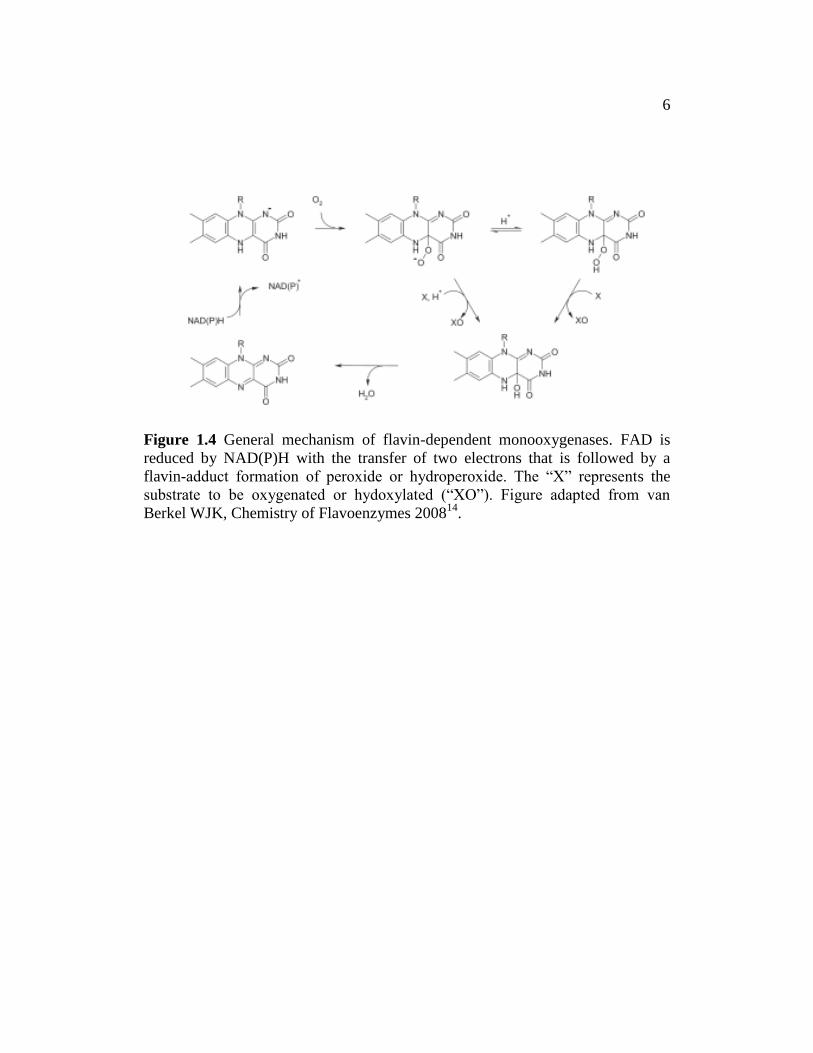
the case of monooxygenases, NADH or NAD(P)H is the electron donor rather
than the substrate as in DAAO1,13
. During the catalytic process a flavin-adduct
intermediate (peroxide or hydroperoxide) on the C4a atom of the isoalloxazine
ring occurs (Fig. 1.4), with the subsequent transfer of an oxygen or hydroxyl to
the substrate.

3
Figure 1.1 Structures of flavocofactors. The oxidation-reduction states of the
flavocofactors are shown with 1 being the oxidized state, 2 the one-electron
reduced (neutral semiquinone) state and 3 the two-electron reduced
(hydroquinone) state. The substitution of R stands for “H”, “PO32-
” or “ADP” for
riboflavin, FMN and FAD, respectively.

4
Figure 1.2 Structures of six covalent linkages between the flavin cofactor and
flavoenzyme.
5
Figure 1.3 D-amino acid oxidase (DAAO) reaction scheme. DAAO catalyzes the
deamination of neutral and hydrophobic amino acids with the first half reaction
involving the reduction of FAD and formation of an imino acid intermediate. In
the second half reaction, in the presence of molecular oxygen (O2) and water, the
imino acid is converted to an -keto acid with the formation of hydrogen peroxide
(H2O2) and ammonia (NH4+).
6
Figure 1.4 General mechanism of flavin-dependent monooxygenases. FAD is
reduced by NAD(P)H with the transfer of two electrons that is followed by a
flavin-adduct formation of peroxide or hydroperoxide. The “X” represents the
substrate to be oxygenated or hydoxylated (“XO”). Figure adapted from van
Berkel WJK, Chemistry of Flavoenzymes 200814
.

7
Recently, flavoproteins are emerging to be involved in biological
processes other than metabolism2,4
. In addition to its fundamental role in basic
metabolism such as respiration, amino acids and fatty acid metabolism,
flavoproteins are also involved in other cellular processes, such as transcription
regulation, tumorigenesis and apoptosis. For example, lysine-specific demethylase
(LSD1) is a flavin-dependent amine oxidase that demethylates mono- and di-
methylated histone H3 at lysine 4 (K4) of the nucleosomes15
. The mechanism of
demethylation is similar to that of the DAAO catalytic process, where the FAD is
reduced by the fourth Lys residue (substrate) of the histone, with the subsequent
release of hydrogen peroxide and formaldehyde16
(Fig. 1.5). The methylation of
H3K4 serves as a gene activation marker, with transcription repressed by
demethylation by LSD1 and the associated co-repressor CoREST and histone
deacetylase15,17
. The activity of LSD1 on H3K4 has been shown to regulate
hematopoietic differentiation, which is involved in generating neutrophils and
maintaining the lymphoid development18
. In addition, LSD1 can be a gene
activator by demethylating H3K9 through the association with the androgen
receptor19
. The association is linked to the androgen-receptor-dependent gene
activation, with overexpression correlated to prostate cancer and tumor recurrence
during therapy19,20
. Other demethylases have been implicated in cancer, as well as
neurological disorders, with the latter being associated with a dysfunctional

8
Figure 1.5 Lysine specific demethylase (LSD1) catalyzed reaction. A methyl-
group from Lys4 of histone 3 is oxidized to form an iminium ion following a two
electron transfer to FAD. The iminium ion is hydrolyzed to produce formaldehyde
and demethylated lysine. The reduced flavin is then oxidized to form FAD by
molecular oxygen that produces hydrogen peroxide. Figure adapted from Culhane
JC, Curr Opin Chem Biol, 200721
.

9
demethylase22
. Another example is the apoptosis inducing factor (AIF) which is a
FAD/NAD(P)H binding protein23,24
residing in the mitochondrial intermembrane
space25
. In response to poly(ADP ribose) polymerase-1 (PARP-1) activation by
DNA damage, AIF translocates to the nucleus and binds to the DNA to induce
apoptosis through chromatin condensation and fragmentation independent of FAD
binding25-27
. The binding of AIF to DNA is required to induce apoptosis23
. Aside
from apoptosis, the primary physiological role of AIF is inside the mitochondria
where it is involved in the assembly/maintenance of the respiratory complex I,
which is part of the oxidative phosphorylation process28
. Alteration of AIF is
shown to cause mouse skeletal muscle atrophy and cardiomyopathy, which is
correlative with oxidative phosphorylation defects29
. Additionally, these
pathologies may be in response to increase oxidative stress, as it is proposed that
AIF may be a free radical scavenger29
, which was previously proposed in mouse
with a defective AIF that lead to neurodegeneration30
.
Other flavoproteins that are known to be involved in neuronal
development and signaling include MICAL (molecule interacting with CasL) and
DAAO. MICAL is a multidomain, cytosolic protein with a functionally essential
N-terminal domain that is a flavin-dependent monooxygenase that utilizes
NAD(P)H31-33
. The functional property of the N-terminal domain is shown to be
required for the signaling events that guide axonal growth in the developing

10
nervous systems31,34
. However, the catalytic mechanism to which MICAL relays
the signaling process is not known. DAAO is shown to have a significant role in
modulating D-serine (D-Ser) levels in the brain by converting D-amino acids to
-keto acids and ammonia35
. As D-Ser functions as an agonist at the glycine
binding site of N-methyl-D-aspartate (NMDA) receptors and a co-agonist for
glutamate activation of the NMDA receptors36,37
, the lack of degradation leads to
neuronal disorders such as schizophrenia, ischemia, epilepsy and
neurodegeneration35,38,39
. Following a stroke, neuronal damage occurs as a
consequence of the release of D-Ser, with the neuronal damage inhibited by
DAAO35,39
. Aside from neurons, in the presence of supplemental D-amino acids,
DAAO is shown to inhibit tumor growth and has a detoxifying role35,40,41
. Other
flavoproteins involved in regulating neuronal signaling are monoamine oxidases
(MAO) A and B. Both oxidases catalyze the degradation of amine-containing
neurotransmitters, such as serotonin that is a specific substrate for MAOA and
dopamine that is a substrate for both6. Inappropriate metabolism of the
neurotransmitters lead to aggressive behavior, stress, panic attacks and
depression, and it has been shown that elevated expression of MAOB is linked to
Parkinson’s disease 42,43
.

11
Biosynthetic Pathway of Flavocofactors
Riboflavin, also known as vitamin B2, is the universal precursor for the
biosynthesis of FMN and FAD, the primary forms of flavins in cells3,44
. In plants,
yeast and many prokaryotes, riboflavin is either synthesized de novo, or obtained
from the environment and transported into the cells44
. Higher eukaryotes, such as
humans, lack the de novo riboflavin biosynthesis machinery, and the only means
of obtaining riboflavin is through the diet3,44
. As such, the biosynthesis of
riboflavin and the flavocofactors FMN and FAD can be divided into two
categories, the biosynthesis of riboflavin and flavocofactors.
Biosynthesis of riboflavin
The de novo biosynthesis of riboflavin requires one molecule of guanosine
triphosphate (GTP) and two molecules of ribulose 5-phosphate from the purine
and pentose phosphate biosynthetic pathways45
. In the first step of pathway,
which is the committed step, GTP (1) (Fig. 1.6) is converted to 2,5-diamino-6-
ribosylamino-4(3H)-pyrimidinone 5’-phosphate (2) by GTP cyclohydrolase II (I)
with the release of PPi and formate, and the opening of the imidazole ring46-49
. In
the case of archaebacteria, this reaction may be catalyzed by two separate
enzymes, with the second substrate intermediate unique to archaebacteria50
. The
substrate intermediate (2) (or the third substrate intermediate from archaea) is
converted to 5-amino-6-ribitylamino-2,4(1H,3H)-pyrimidinedione 5’-phosphate

12
(5) by two reaction steps that involve a deamination of the heterocyclic ring and
reduction of the ribosyl side chain. In bacteria and plants, the deamination is
catalyzed first by 2,5-diamino-6-ribosylamino-4(3H)-pyrimidinone 5’-phosphate
deaminase (II) to yield 5-amino-6-ribosylamino-2,4(1H,3H)-pyrimidinedione 5’-
phosphate (3), which is then reduced by 5-amino-6-ribosylamino-2,4(1H,3H)-
pyrimidinedione 5’-phosphate reductase (III) to yield substrate intermediate (5)51-
55. In yeast and archaebacteria, the reduction precedes the deamination
56-60. It is
known that the next step is dephosphorylation (VI) to generate 5-amino-6-
ribitylamino-2,4(1H,3H)-pyrimidinedione (6), since the phosphorylated
intermediate (5) cannot serve as a substrate for the proceeding 6,7-dimethyl-8-
ribityllumazine synthase (VIII) step61,62
. However, nothing is known about the
reaction step. Following dephosphorylation, the lumazine synthase (VIII)
catalyzes the condensation of the substrate intermediate (6) with 3,4-dihydroxy-2-
butanone 4-phosphate (3,4-DHBP) (8) forming 6,7-dimethyl-8-ribityllumazine
(9)62,63
. The four carbon substrate intermediate (8) is formed from ribulose 5-
phosphate (7) by a rearrangement/elimination process catalyzed by 3,4-
dihydroxy-2-butanone 4-phosphate synthase (VII)64,65
. In the final reaction step, a
dismutation reaction is catalyzed by riboflavin synthase (IX) that involves two
molecules of 6,7-dimethyl-8-ribityllumazine (9)66-68
. During the reaction, a four
carbon unit, which was derived from ribulose 5-phosphate (7), is transferred from

13

14
Figure 1.6 Scheme for de novo biosynthesis of riboflavin. Catalytic steps are GTP cyclohydrolase II (I), 2,5-
diamino-6-ribosylamino-4(3H)-pyrimidinone 5’-phosphate deaminase (II), 5-amino-6-ribosylamino-2,4(1H,3H)-
pyrimidinedione 5’-phosphate reductase (III), 2,5-diamino-6-ribosylamino-4(3H)-pyrimidinone 5’-phosphate
reductase (IV), 2,5-diamino-6-ribosylamino-4(3H)-pyrimidinone 5’-phosphate deaminase (V), hypothetical
phosphatase (VI), 3,4-dihydroxy-2-butanone 4-phosphate synthase (VII), lumazine synthase (VIII) and
riboflavin synthase (IX). Substrates formed during the process are GTP (1), 2,5-diamino-6-ribosylamino-4(3H)-
pyrimidinone 5’-phosphate (2), 5-amino-6-ribosylamino-2,4(1H,3H)-pyrimidinedione 5’-phosphate (3), 2,5-
diamino-6-ribosylamino-4(3H)-pyrimidinone 5’-phosphate (4), 5-amino-6-ribitylamino-2,4(1H,3H)-
pyrimidinedione 5’-phosphate (5), 5-amino-6-ribitylamino-2,4(1H,3H)-pyrimidinedione (6), ribulose 5-
phosphate (7), 3,4-dihydroxy-2-butanone 4-phosphate (3,4-DHBP) (8), 6,7-dimethyl-8-ribityllumazine (9) and
riboflavin (10). Figure adapted from Fischer M, Nat Prod Rep, 200544
.

15
one molecule to the other to generate riboflavin (10) and 5-amino-6-ribitylamino-
2,4(1H,3H)-pyrmidinedione (6), which can be reused as substrate for lumazine
synthase (VIII)69
. Thus, the utilization of a second ribulose 5-phosphate for
riboflavin biosynthesis is derived from a previous catalytic reaction by lumazine
synthase (VIII).
Biosynthesis of flavocofactors
Converting riboflavin to FMN and FAD involves two universally
conserved enzymes: riboflavin kinase (RFK) and flavin mononucleotide
adenylyltransferase (FMNAT-historically also referred to as FAD synthetase). In
bacteria and eukaryotes, RFK (ATP:riboflavin 5’-phosphotransferase; EC
2.7.1.26) phosphorylates riboflavin to FMN, while FMNAT (ATP:FMN
adenylyltransferase; EC 2.7.7.2) adenylates FMN to form FAD70-73
(Fig. 1.7).
Recently, archaeal RFK was identified and it utilizes cytidine triphosphate (CTP)
instead of ATP74,75
. Whether FMNAT from archaebacteria utilizes CTP as in
archaebacteria RFK is unknown, as the protein is currently not identified.
Genes of riboflavin biosynthesis
The genes that encode the enzymes of the riboflavin biosynthetic pathway
are evolutionarily conserved and have been experimentally identified for
bacterial, yeast and plant species. Of the bacterial species investigated, the most
extensively investigated are Bacillus subtilis (B. subtilis) and Escherichia coli

16
Figure 1.7 Reaction catalyzed by riboflavin kinase (RFK) and FMN
adenylyltransferase (FMNAT).

17
(E. coli)76-81
. In E. coli, GTP cyclohydrolase II and 3,4-DHBP synthase are
encoded by ribA and ribB respectively, whereas in B. subtilis the enzymes are
encoded by one gene ribA (Fig. 1.8). The deaminase and reductase is a
bifunctional enzyme encoded by ribD and ribG in E. coli and B subtilis,
respectively. In E. coli and B. subtilis, the lumazine synthase (also referred to as
riboflavin synthase -subunit) is encoded by ribH. The riboflavin synthase (also
referred to as riboflavin synthase -subunit) is encoded by ribE in E. coli or ribB
in B. subtilis.
Organization of the rib genes varies among bacteria species. In E. coli, the
rib genes are scattered on the chromosome, whereas in B. subtilis the rib genes
are part of a single operon known as the rib operon77,78
. The arrangement of the
genes on the rib operon is ribGBAHT (or ribGBAH), with the function of ribT
unknown45
. For consistency, the E. coli genes are typically used and are presented
as ribDE(B/A)HT, where rib(B/A) represents the bi-functional ribA in B. subtilis,
or ribDEAHT. The rib genes of E. coli are not regulated in a coordinated manner,
as in B. subtilis, in which the genes of the rib operon are co-regulated77,78
.
Several studies from yeast Saccharomyces cerevisiae (S. cerevisiae) and
Candida guilliermondii have identified the genes involved in riboflavin
biosynthesis82-85
. The genes, along with the functional activity in parenthesis, are
rib1 (GTP cyclohydrolase II), rib2 (deaminase), rib3 (3,4-DHBP synthase), rib4

18
Figure 1.8 Genes involved in flavin biosynthesis. Top panel shows bacterial
genes, with B. subtilis genes in parenthesis. The gene aceK is proposed to encode
the hypothetical protein phosphatase in E. coli, as annotated in Kyoto
Encyclopedia of Genes and Genomes (KEGG)86
. Bottom panel shows human
genes involved in flavocofactor biosynthesis.

19
(lumazine synthase), rib5 (riboflavin synthase) and rib7 (reductase). Majority of
the riboflavin biosynthetic genes have been identified in plants, which include the
bifunctional enzyme GTP cyclohydrolase II/3,4-DHBP synthase, deaminase,
lumazine synthase and riboflavin synthase44,52,87,88
. For yeasts and plants, the
deaminase is not associated with the reductase as in prokaryotes52,83
.
Aside from there being no homologous GTP cyclohydrolase II in archae-
bacteria, and the different organization of GTP cyclohydrolase II and 3,4-DHBP
synthase in bacteria and eukaryotes, as well as the different organization and
reaction order of the deaminase and reductase, there are also additional variations
in the pathways. In yeasts and a bacterium Brucella abortus, lumazine synthase
has a homopentamer quaternary structure89-93
, whereas in prokaryotes and spinach
plant a 60 subunit circular capsid described as a dodecamers of pentamers is
formed93-100
. Furthermore, several archaebacteria riboflavin synthase share no
sequence similarity to riboflavin synthase in bacteria and eukaryotes, but show
significant sequence similarity to lumazine synthase101,102
. The structure is a
homopentamer102,103
, as in lumazine synthase, which is different from that of the
homotrimer in bacteria and eukaryotes84,90,104,105
. These observations suggest that
a class of archaeal riboflavin synthase is evolutionarily related to lumazine
synthase and may have evolved from a common ancestor.

20
In E. coli and many pathogenic bacteria, riboflavin is only obtained by the
endogenous biosynthetic pathway44
. The enzymes involved in riboflavin
biosynthesis are fundamental as the bacteria apparently lack a riboflavin transport
system45,106
. In fact, a riboflavin auxotroph E. coli requires an excessively higher
concentration of riboflavin in the growth media than an auxotroph bacterium
Lactococcus lactis, which has a gene that encodes for a riboflavin transporter107
.
Therefore, enzymes of the riboflavin biosynthesis have been emphasized as
suitable targets for discovering anti-microbial therapeutics against pathogenic
species44,108
.
Genes of flavocofactor biosynthesis
The genes involved in the universally conserved last two steps of
flavocofactor FMN and FAD biosynthesis have been experimentally identified in
prokaryotic and eukaryotic species. In bacteria, RFK and FMNAT are encoded in
the same gene ribF (for E. coli) or ribC (for B. subtilis), with the FMNAT domain
located at the N-terminus and with the RFK domain located at the C-terminus of
the bifunctional enzyme71,109
(Fig. 1.9). In archaebacterium Methanocaldococcus
jannaschii, the RFK gene is referred to as ribK74
. For eukaryotes, RFK and
FMNAT are encoded in separate genes. Plant species also have a bifunctional
RFK enzyme as determined from A. thaliana. However, the gene encodes for a
bifunctional RFK/FMN hydrolase enzyme, where the FMN hydrolase is located at
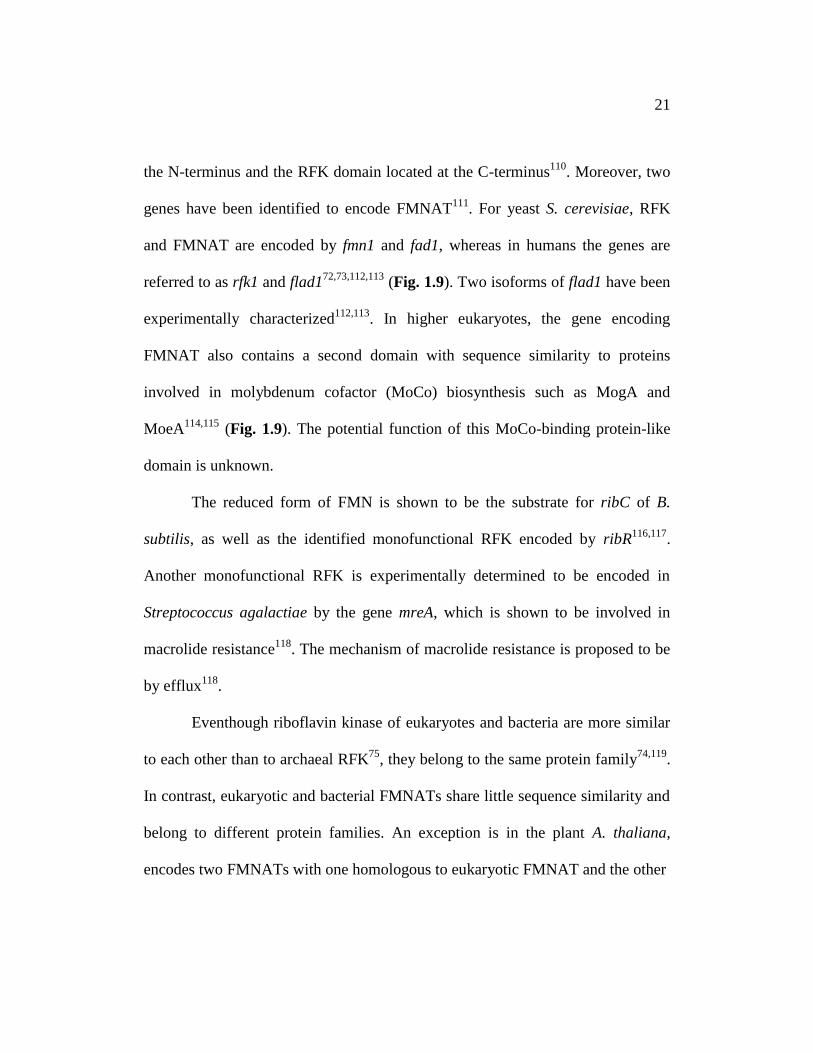
21
the N-terminus and the RFK domain located at the C-terminus110
. Moreover, two
genes have been identified to encode FMNAT111
. For yeast S. cerevisiae, RFK
and FMNAT are encoded by fmn1 and fad1, whereas in humans the genes are
referred to as rfk1 and flad172,73,112,113
(Fig. 1.9). Two isoforms of flad1 have been
experimentally characterized112,113
. In higher eukaryotes, the gene encoding
FMNAT also contains a second domain with sequence similarity to proteins
involved in molybdenum cofactor (MoCo) biosynthesis such as MogA and
MoeA114,115
(Fig. 1.9). The potential function of this MoCo-binding protein-like
domain is unknown.
The reduced form of FMN is shown to be the substrate for ribC of B.
subtilis, as well as the identified monofunctional RFK encoded by ribR116,117
.
Another monofunctional RFK is experimentally determined to be encoded in
Streptococcus agalactiae by the gene mreA, which is shown to be involved in
macrolide resistance118
. The mechanism of macrolide resistance is proposed to be
by efflux118
.
Eventhough riboflavin kinase of eukaryotes and bacteria are more similar
to each other than to archaeal RFK75
, they belong to the same protein family74,119
.
In contrast, eukaryotic and bacterial FMNATs share little sequence similarity and
belong to different protein families. An exception is in the plant A. thaliana,
encodes two FMNATs with one homologous to eukaryotic FMNAT and the other
22
Figure 1.9 Comparison of the organization of bacterial and eukaryotic RFKs and
FMNATs. For each species the gi number, in parenthesis, and the protein
identification is shown. Abbreviation for the molybdenum cofactor biosynthesis
protein-like sequence is indicated by the asterisk (*). Hp, Helicobacter pylori; Hs,
Homo sapiens; Mm, Mus musculus; Dr , Danio rerio; Ce, Caenorhabditis
elegans; Af, Aspergillus fumigates; Sc, Saccharomyces cerevisiae and Cg,
Candida glabrata.

23
to bacterial FMNAT110
. The A. thaliana FMNAT homologous to bacterial
FMNAT was experimentally determined to have FMNAT activity111
.
Riboflavin transporter
The importance of extracellular riboflavin uptake by a membrane
riboflavin transporter has been investigated for several mammalian cell types,
bacteria and yeast107,120-126
. Despite being able to synthesize riboflavin, yeast are
also able to transport riboflavin from the environment124,125
. A riboflavin
transporter has been identified in S. cerevisiae and is encoded by the gene mch5127
(Fig. 1.8). Riboflavin is transported by a facilitated diffusion mechanism,
allowing a flux of riboflavin down a concentration gradient. Bacterial riboflavin
transporters, for which several have been experimentally identified, are not related
to the yeast transporter81,107,128
. The riboflavin transporter YpaA from B. subtilis
(Fig. 1.8) and RibU from Lactobacillus lactis (L. lactis) are homologous
membrane proteins that belong to the same superfamily, therefore it is proposed
to refer YpaA as RibU107,128
. However, B. subtilis YpaA requires energy to
transport riboflavin from the extracellular side, whereas L. lactis acts as a
facilitator. The riboflavin transporter PnuX from Corynebacterium glutamicum is
also a facilitator transporter, but has sequence similarity to the riboflavin
transporter RibM from Streptomyces davawensis81,128
. The transporters
YpaA/RibU and PnuX/RibM represent two different classes of riboflavin

24
transporters in bacterial species. Even with the evidence for a riboflavin
transporter and the identification of the transporters from various species, a
mammalian riboflavin transporter gene has not been identified.
For some bacteria, the presence of riboflavin in the growth media is
essential for growth128
. The bacteria investigated are pathogens44,128
that are
devoid of the genes involved in riboflavin biosynthesis, as assessed through
comparative gene analysis106
. As an alternative, the bacteria were shown to have a
gene encoding a riboflavin transporter106
.
FMNAT Protein Family
Prokaryotic and eukaryotic RFKs are similar in sequence and structure,
and they belong to a unique protein family containing only riboflavin
kinases74,75,119,129
. In contrast, the evolutionary link between bacterial and
eukaryotic FMNATs is less clear as they show little sequence similarity and are
classified in different protein superfamilies in SCOP130
or different clans in
Pfam131
databases. The bacterial FMNAT domain of the bifunctional
RFK/FMNAT belongs to the (H/T)xGH motif containing nucleotidylyl
transferase superfamily. In contrast, eukaryotic FMNAT is currently classified as
a member of the 3’-phosphoadenosine 5’-phosphosulfate (PAPS) reductase-like

25
family, which has conserved motifs different from those of nucleotidylyl
transferases.
Well known and characterized proteins in the nucleotidylyl transferases
superfamily include class I tRNA synthetases, NMN or NaMN (nicotinamide or
nicotinic acid mononucleotide) adenylyltransferases, cytidylyltransferases and a
few other nucleotidyl transferases132-137
. In addition to the signature nucleotidylyl
transferase (H/T)xGH motif, a second sequence motif (ISSTxxR) is also observed
in the nucleotidyl transferase superfamily, which is known to interact with the -
and -phosphates of the nucleotide ATP. Within the adenine nucleotide
hydrolase-like superfamily, members of PAPS reductase-like family share
sequence and structural similarity to N-type ATP pyrophosphatases and PP-loop
ATPase families138-141
. The families share a conserved motif referred to as the PP-
loop. For N-type ATP pyrophosphatases and PP-loop ATPase families the PP-
loop consensus sequence is SGGxD(S/T)142,143
, whereas for the PAPS reductase-
like family it is a generally conserved sequence of SxG138,140,142
, with x
representing any amino acid. The PP-loop interacts with the - and -phosphates
of the nucleotide ATP or derivatives.
Crystal structures for several members of the PAPS reductase-like family
have been determined, in which a core fold is conserved138-140
. The structures
have a central twisted six-stranded -sheet with five parallel -strands and one

26
anti-parallel-strand. The central -sheet is interleaved with helices, with one or
two -helices, occurring N-terminal to the first -strand. The core of the protein
has a topology of 3|, where the crossover helix 3 connects
3 to 4 and places 4 parallel and adjacent to 1. The orientation and placement
of strand 5, which connects 4 and 6, is anti-parallel to all other strands. This
core fold is different from that of the (H/T)xGH nucleotidylyl transferase
superfamily, which has a typical Rossmann-fold topology
322|3445141,144
Therefore, the different sequence conservation,
and structural arrangement and elaboration separate the two superfamilies141
.
Enzymatic Properties of Bacteria and Eukaryotic FMNATs
Despite substantial differences in sequence and structure, the mammalian
and bacterial FMNAT enzymes have similar kinetic properties70,145
. Both
enzymes catalyze the formation of FAD through an ordered bi-bi mechanism and
have the same substrate binding and product release order where ATP binds first
to the enzyme followed by FMN, and product inorganic pyrophosphate (PPi) is
released first followed by the release of FAD. Dependence and specificity for
divalent cations differs for eukaryotic and bacterial FMNATs. Studies on the
effect of different divalent cations, indicates rat liver FMNAT requires Mg2+
,
27
whereas bacterial FMNAT can utilize different divalent cations71,146
. In regards to
rat liver FMNAT, addition of 1 mM Zn2+
in the reaction mixture inhibited the
activity by 60%, with Ca2+
and Mn2+
showing 30% and 15% of the activity,
respectively146
. Other divalent cations (Ba2+
, Co2+
, Cu2+
, Cd2+
, Fe2+
, Ni2+
, Sn2+
and Sr2+
) show no activity146
. In addition to cation selectivity, extensive studies
were performed on bacterial and eukaryotic FMNAT using FMN analogs147-150
.
Eukaryotic rat liver FMNAT is able to better tolerate substitutions in the 7- and 8-
methyl position of the FMN isoalloxazine benzenoid ring compared to the
bacterial Brevibacterium ammoniagenes FMNAT domain of FADS (BaFADS).
Eukaryotic FMNAT and BaFADS are able to utilize 8-chloro- and 7,8-dichloro-
FMN as substrates. However, as determined for the eukaryotic enzyme, these
substitutions result in an increase in Km and a decrease in Vmax, with the greatest
change occurring with 7,8-dichloro149,150
. In contrast, 7-chloro-FMN results in
similar Km and Vmax as the substrate FMN for eukaryotic FMNAT150
.
Alternatively, substitution of the 7- and 8-methyl with a less electronegative
halide of 7,8-dibromo-FMN results in an ~2-fold decrease of Km and Vmax,
whereas 8-chloro results in an ~2-fold increase of Km and decrease of Vmax in
eukaryotic FMNAT150
. BaFADS is able to use 7-bromo-FMN as a substrate149
,
however the kinetic parameters and whether 7,8-dibromo-FMN can be used as a
substrate are not known. Inhibition by FMN analogs 1-deaza-FMN (Ki = 283 M)

28
and 1,5-dideaza-FMN (Ki = 29 M) are observed for eukaryotic FMNAT, while
1-deaza-FMN and 5-dideaza-FMN appear to have no effect on the catalytic
activity in BaFADS147-149
. These results suggest that the architecture of the
substrate binding site is different between eukaryotic and bacterial FMNATs.
Regulation of FAD Biosynthesis
The regulation of FAD homeostasis is important as several studies of
cellular processes in eukaryotes, such as oxidative protein folding and
homocysteine metabolism, are sensitive to FAD levels151,152
. In yeast, the activity
of FAD-dependent Ero1 protein, which mediates oxidative protein folding in the
endoplasmic reticulum through protein disulfide isomerase, is dependent on the
FAD concentration152
. Similarly, in a riboflavin deficient study involving HepG2
hepatocarcinoma cells, oxidative protein folding was decreased122
. The reduction
of available flavins also resulted in cell growth arrest by the increased expression
of GADD153 gene, which is mediated in response to endoplasmic reticulum
stress elements122,153,154
. Additionally, clinical studies of a mutation, C677T
polymorphism, in 5,10-methylenetetrahydrofolate reductase (MTHFR) results in
an increase of plasma total homocyteine, which is a risk factor for coronary,
cerebral, and peripheral arteries disease, as well as for venous thrombosis151
. The
mutant shows a decrease in the flavin concentration in the plasma, except for

29
FAD, when compared to the control (non-mutant MTHFR)151
. A possible reason
for the unchanged plasma FAD concentration is that FAD is under strict
metabolic control, as indicated by riboflavin deficiency studies in men and rats151
.
In addition to these studies, a pronounced product feedback inhibition was
observed for rat liver FMNAT, and it was suggested that such a property would
enable FMNAT to play a role in regulating cellular FAD homeostasis as the Ki
values of FAD against FMN (0.75 M) and Mg2+
-ATP (1.3 M) are close to the
concentration of free FAD (0.4 M)145
. In this respect, how the concentration of
FAD is controlled based on cellular needs is not known.
In B. subtilis, the rib operon contains a regulatory element called the RFN
element that is present within the 5’-untranslated region (5’-UTR)155,156
.
Mutations leading to riboflavin overproduction were mapped to various regions
within the RFN element, as well as ribC (bifunctional FADS) and ribR
(monofunctional RFK)109,157,158
. The RFN element folds into a secondary structure
that binds FMN with high affinity159,160
and prevents the expression of the
downstream genes by transcription termination or a translation mechanism that
sequesters a ribosome-binding site106,159
. RNA from the RFN element acts as a
metabolic-sensor (riboswitch) that regulates riboflavin biosynthesis by binding
FMN, in the absence of proteins106,159
. RFN elements are found upstream of many
bacteria riboflavin biosynthesis operons, including riboflavin transporters106,155
.

30
Objective of Research
Both RFK and FMNAT are essential enzymes needed for generating the
indispensable flavocofactors FMN and FAD44
. The essentiality of the two
enzymes has been established experimentally in bacterial161
and yeast
species72,73,152
, and has been inferred to all other organisms. In conjunction to the
essentiality in bacteria, an in vivo study of Salmonella enterica infection in mice
indicated ribF is expressed during the virulence states, which is one of the few
genes that are not currently targeted by antimicrobial agents162,163
. The significant
differences between eukaryotic and bacterial FMNATs make them a particularly
attractive target for developing selective anti-infectious drugs161
. Structural
analyses of both eukaryotic and bacterial FMNATs will reveal the different
configurations of the substrate binding and catalytic sites, which may benefit a
structure-based inhibitor development effort. Such analyses will also address two
fundamental questions: a) how eukaryotic and bacterial FMNAT accomplish the
same chemistry with different active site architectures, and b) what mechanistic
controls are embedded in eukaryotic FMNAT to influence FAD homeostasis.
Here we report the first structural characterization of a eukaryotic FMNAT from
Candida glabrata, an opportunistic yeast pathogen causing candidemia and
invasive candidiasis164-167
. We have determined the crystal structures of C.
glabrata FMNAT (CgFMNAT) in the apo-form and in three different complexed

31
forms [with ATP, with substrate FMN and the ATP analog ,-
methyleneadenosine 5’-triphosphate (AMPCPP), and with products FAD and PPi,
respectively]. These structures reveal a novel flavin-binding mode and the
detailed catalytic site configuration that are likely shared among all eukaryotic
FMNATs. Combined with the results from steady-state kinetic analysis, a
mechanism for eukaryotic FMNAT catalyzed adenylyl transfer reaction is
proposed.

32
CHAPTER 2
Structure Determination of apo-CgFMNAT
(Parts of this chapter are adapted from Huerta et al., 2009)
INTRODUCTION
Riboflavin is the precursor to the biosynthesis of the flavocofactors3,44
,
FMN and FAD, and is shown to be essential for the function of cellular
processes122,128
. In plants, yeast and many bacteria, riboflavin is synthesized de
novo through the riboflavin biosynthetic machinery44,128
, whereas higher
eukaryotes, such as humans, obtain riboflavin from the diet3,44
. Biosynthesis of
the flavocofactors involves two universally conserved enzymes RFK and
FMNAT. The structure of bacterial FADS was solved from a bacteria thermophile
Thermotoga maritima (TmFADS)168,169
. From sequence and structure analysis, the
FMNAT domain of TmFADS belongs to the (H/T)xGH motif-containing
nucleotidyl- transferase superfamily. Based on sequence similarity, eukaryotic
FMNAT is currently classified as a member of the PAPS reductase-like family
belonging to the adenine nucleotide hydrolase-like superfamily in SCOP130
,
which has conserved motifs different from those of nucleotidylyl transferase.
Members of the PAPS reductase-like family include PAPS reductase,
adenosine 5’-phosphosulfate (APS) reductase and ATP sulfurylase. All members

33
are from bacterial species138-140
, with the exception of yeast PAPS reductase
(unpublished; PDB ID: 2oq2), which are involved in the sulfate assimilation
pathway. The pathway is important for generating sulfur metabolites170-173
, such
as cysteine and methionine, as well as sulfated metabolites174-176
. PAPS reductase-
like family also shares sequence and structural similarity with the N-type ATP
pyrophosphatases and PP-loop ATPase family138-141
, which belong to the same
superfamily130,142
.
A sequence alignment of eukaryotic FMNATs with members of the PAPS
reductase-like family shows eukaryotic FMNAT has a low percent sequence
identity to other members within the family. Selecting human and yeast Candida
glabrata FMNAT (CgFMNAT) the sequence identities to E. coli PAPS reductase
is 12% and 10%, respectively, whereas it is 13% and 7% to Pseudomonas
aeruginosa APS reductase, and 10% and 12% to Pseudomonas syringae ATP
sulfurylase. Despite the low sequence identity, eukaryotic FMNAT maintains
sequence identity for several motif regions identified in APS sulfurylase, which
are highly conserved within the family138
(Fig. 2.1), that include the PP-loop,
LDTG and Arg-loop. However, the PP-loop motif region in eukaryotic FMNAT
is different from that of the PAPS reductase-like family. Instead, it displays
similarity to the consensus sequence of SGGxD(S/T) from the N-type ATP
pyrophosphatases and PP-loop ATPase families142,143
.
34

35
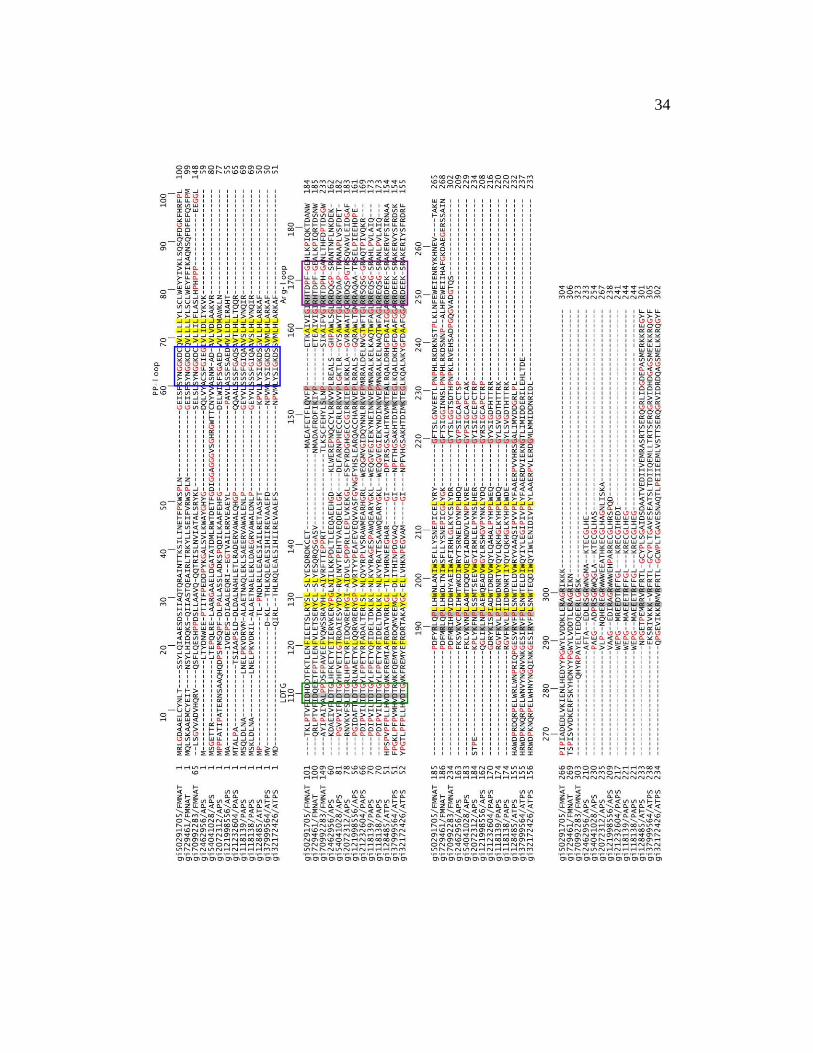
Figure 2.1 Multiple sequence alignment of PAPS reductase-like family members and eukaryotic FMNATs. The
residue numbers of Candida glabrata FMNAT are marked at the top of the alignment. Each sequence is labeled
by the gi number and protein name. The first and last residues of each sequence are numbered at the beginning
and end. Structural motifs of APS reductase are boxed and extended to cover other sequences. Glycine and
proline residues are in red; conserved glycine, proline and charged/polar residues are highlighted in gray and
conserved hydrophobic/aromatic residues in yellow. Species in the alignment are: gi50291705, Candida
glabrata; gi729461, Saccharomyces cerevisiae; gi70992283, Aspergillus fumigates; gi2462956, Bacillus subtilis;
gi54041028, Mycobacterium tuberculosis; gi2072312, Pseudomonas aeruginosa; gi121998556, Halorhodospira
halophila; gi21232604, Xanthomonas campestris; gi118139, Salmonella enterica; gi118138, Escherichia coli;
gi128485, Azospirillum brasilense; gi37999564, Pseudomonas syringae and gi32172426, Escherichia coli.
Sequence alignment was constructed by PROMALS177
and manually modified.

36
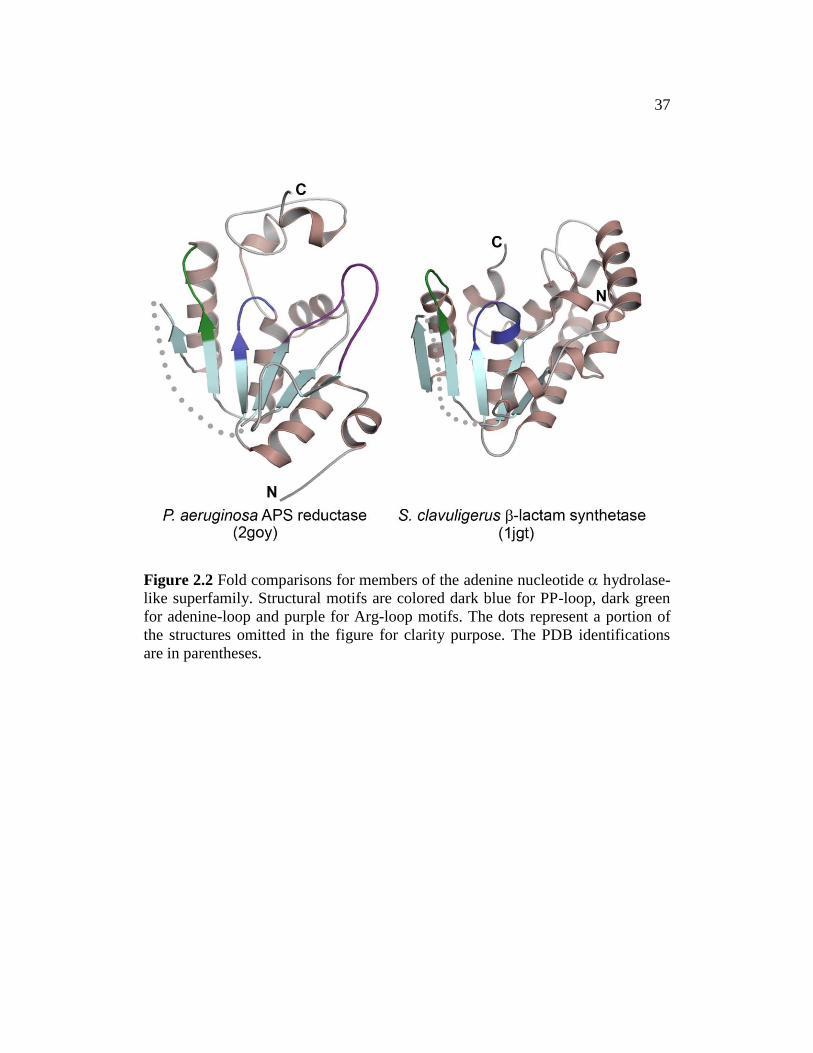
The protein crystal structures for several members of the PAPS reductase-
like family have been solved, which has a core fold considerably similar to the N-
type ATP pyrophosphatases and PP-loop ATPase (Fig. 2.2). Three structural
motifs conserved in the PAPS reductase-like family that interact with the
nucleotide are identified that include the PP-loop, LDTG and Arg-loop138
. The N-
type ATP pyrophosphatases and PP-loop ATPase families maintain similar
structural motifs PP-loop and LDTG but lack structural similarity to the Arg-loop.
Due to the relatively high sequence conservation between eukaryotic FMNAT and
the PAPS reductase-like family, the ATP binding mode is expected to be similar.
However, the flavin binding represents a new function for the superfamily with
the binding mode completely unknown. The flavin binding mode cannot be
inferred from TmFADS FMNAT domain, as eukaryotic and bacterial FMNAT
belong to different superfamilies that share little sequence similarity. Since
eukaryotic FMNAT represents a new member of the superfamily with low
sequence similarity to the PAPS reductase-like family. A structure of eukaryotic
FMNAT is necessary in order to understand its function and mechanism. In
addition, based on the sequence alignment, C. glabrata and S. cerevisiae
FMNATs possess a C-terminal insertion domain (~ 60 residues) that is not shared
among the family, including other higher eukaryotic FMNATs (Fig. 2.1).
Therefore, structural analysis is required to elucidate the structural variations.
37
Figure 2.2 Fold comparisons for members of the adenine nucleotide hydrolase-
like superfamily. Structural motifs are colored dark blue for PP-loop, dark green
for adenine-loop and purple for Arg-loop motifs. The dots represent a portion of
the structures omitted in the figure for clarity purpose. The PDB identifications
are in parentheses.
38
To begin investigating, C. glabrata and S. cerevisiae FMNATs were
cloned, expressed and purified. In light of the increased protein solubility,
CgFMNAT was selected for X-ray structure determination. We present the first
structure of eukaryotic FMNAT from C. glabrata in the apo-form. A complete
description of the overall fold is given and a region for ATP interaction is
proposed.
MATERIALS
Amino acids and other reagents were purchased from Sigma-Aldrich Inc.
(St Louis, MO), unless stated otherwise. (L)-+-selenomethionine was purchased
from Acros Organics (Geel, Belgium). For PCR, True Fidelity DNA polymerase
was purchased from Continental Lab Products (San Diego, CA), and NcoI and
SalI restriction enzymes were purchased from New England Biolabs (Ipswich,
MA). The dNTP’s (dATP, dGTP, dTTP and dCTP) were purchased from Roche
(Indianapolis, IN). High-throughput (HT) crystal screens, PEG/Ion screen,
additive screen, 96-well round bottom sitting-drop plates, 24-well crystallization
plates, silicon and paraffin oil, sodium acetate buffer and hydrochloric acid
solution for the crystallization experiments were purchased from Hampton
Research (Aliso Viejo, CA). Wizard III crystallization screen was purchased from
Emerald BioSystems (Bainbridge Island, WA). Nickel-sepharose high

39
performance resin, Resource Q media, and pre-packed phenyl sepharose HR
10/10 column and Superdex 75 HiLoad 16/60 column were purchased from GE
Healthcare (Piscataway, NJ). The nickel-nitrilotriacetic acid (Ni-NTA) resin was
purchased from Qiagen (Valencia, CA) and the micro bio-spin chromatography
columns purchased from Bio-Rad (Hercules, CA). The ÄKTA FPLC (fast protein
liquid chromatography) system was used for performing protein purification (GE
Healthcare). Primers were ordered from Integrated DNA Technologies
(Coralville, IA). Genomic DNA from C. glabrata (strain NCYC 388, ATCC
36909D) and S. cerevisiae (strain NRRL Y-53, ATCC 2601D) was purchased
from ATCC (Manassas, VA).
METHODS
Cloning, expression and purification of S. cerevisiae and apo-CgFMNAT
The predicted gene fad1 encoding ScFMNAT (gi:6320159, encoding 306
amino acids) and CgFMNAT protein (gi:50291750, encoding 304 amino acids)
were amplified from S. cerevisiae and C. glabrata genomic DNA, respectively,
by PCR and cloned into the NcoI and SalI restriction sites of the pHIS parallel
expression vector containing a T7 promoter, N-terminal His6-tag and tobacco etch
virus (TEV) protease cleavage site178
. The primers used to amplify fad1 from S.
cerevisiae genomic DNA are as follow: 5’-
40
GGGCCATGGTGATGCAGTTGAGCAAGGCTGCTG-3’, encoding a NcoI
restriction site (bold) prior to the start codon (underlined); and the reverse primer
5’-GGGGTCGACTTAATTCTTGATCCTGCCTGCTCTCTC-3’, encoding a
SalI restriction site (bold). For C. glabrata, the forward primer, 5’-
GGGCCATGGTGATGCGTTTGGGTGACGCTGC-3’, and the reverse primer,
5’-GGGGTCGACTCATTTCTTTTTAATTCTTCCTGCTCTTTC-3’, utilized
the same restriction sites, respectively. Two nucleotides were added after the NcoI
site for in-frame translation of fad1. Including the two amino acids after the TEV
cleavage site, a total of four residues (Gly-Ala-Met-Val) prior to the fad1 start
methionine residue were added in the construct. The correct sequences of the
inserts were confirmed by DNA sequencing from McDermott Center at the
University of Texas Southwestern Medical Center.
For small scale protein expression, pHIS-CgFMNAT and pHIS-
ScFMNAT plasmids were transformed into E. coli BL21(DE3) (Novagen;
Madison, WI) and cells were grown in 50 ml Luria-Bertani (LB) broth, containing
100 g/ml ampicillin, at 37 ºC until absorption at 600 nm reached 0.6–0.7. His6-
CgFMNAT and His6-ScFMNAT protein expression was induced with 0.8 mM
isopropyl-1-thio--D-galactopyranoside (IPTG) and continued incubation at 20 ºC
for approximately 16 hours. Cells were harvested by centrifugation at 4,000 rpm
for 20 minutes at 4 ºC and the resulting pellet resuspended in 3 ml lysis buffer [20

41
mM HEPES, pH 8.0, 100 mM NaCl, 10 % glycerol, 0.03% Brij-35, 1 mM
dithiolthreitol (DTT) and 2 mM phenylmethylsulfonyl fluoride (PMSF)]. Cell
suspension was frozen with liquid nitrogen, thawed and completely lysed by
sonication (550 Sonic Dismembrator, Fisher Scientific; Pittsburgh, PA) for 2
minutes with 5 seconds pulse on and off periods. Lysate was centrifuged at
16,000 g for 20 minutes at 4 ºC and resultant supernatant was decanted and stored
on ice. Purification of CgFMNAT and ScFMNAT protein from the supernatant
consisted of a single purification step. The clarified cell lysate was passed through
a 200 l nickel-nitrilotriacetic acid resin volume, packed in a Bio-Rad
chromatography column, equilibrated with Buffer A (50 mM Tris, pH 8.0, 200
mM NaCl, 0.03% Brij-35 and 2 mM -mercaptoethanol). The resin was washed
with 1 ml Salt Wash Buffer (8 ml Buffer At + 2 ml 5 M NaCl + 100 l 30% Brij-
35), followed by two elution steps of His6-CgFMNAT and His6-ScFMNAT with
200 l Elution Buffer (7.5 ml Buffer At + 2.5 ml 1 M imidazole). The flow-
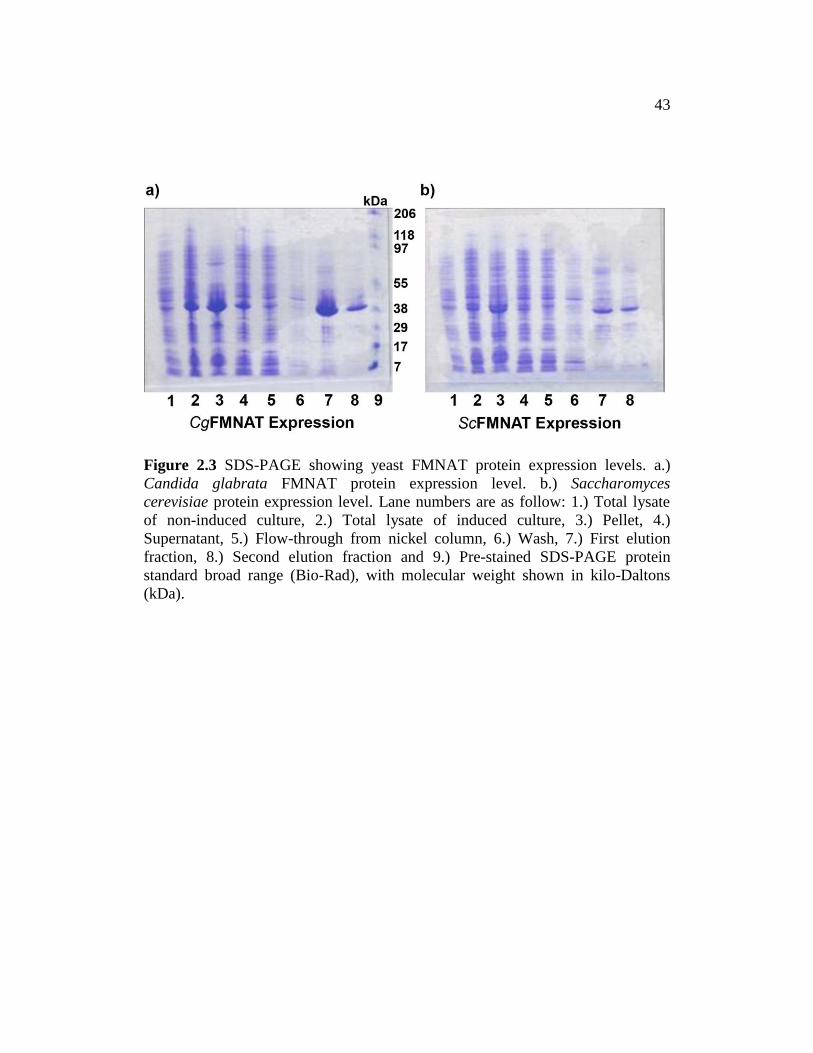
through of the supernatant, wash and elution were collected (Fig. 2.3a and b).
Because the yield of CgFMNAT was much higher than ScFMNAT, as
observed from the SDS-PAGE protein profile in figure 2.3a and b, we selected
CgFMNAT for large scale protein expression and subsequent structure analysis.
The pHIS-CgFMNAT plasmid was transformed into E. coli BL21(DE3) and cells
were grown in 4−1 L Luria-Bertani (LB) broth, containing 100 g/ml ampicillin,
42
with protein expression performed identically as for the small scale protein
purification. Cells were harvested by centrifugation at 4,000 rpm for 30 minutes at
4 ºC and the resulting pellet resuspended in 30 ml lysis buffer per 1 L culture. Cell
suspension was frozen with liquid nitrogen, thawed and completely lysed by
sonication for 5 minutes with 5 seconds pulse on and off periods. Lysate was
centrifuged at 25,000 g for 30 minutes at 4 ºC and resultant supernatant was
decanted and stored on ice.
Purification of CgFMNAT protein from supernatant consisted of four
steps resulting in homogeneous apo-CgFMNAT protein. The clarified cell lysate
was passed through a nickel-sepharose affinity column equilibrated with Buffer A
(20 mM HEPES, pH 8.0, 300 mM NaCl, 20 mM imidazole, 5% glycerol and 1
mM DTT) and His6-CgFMNAT was eluted with a 20–500 mM imidazole gradient
with Buffer B (Buffer A plus 500 mM imidazole). Incubation with TEV protease
cleaved the His6-tag during overnight dialysis in 2 L dialysis buffer (20 mM
HEPES, pH 7.5, 50 mM NaCl, 5% glycerol and 1 mM DTT) at 4 ºC and the His6-
tag was removed from CgFMNAT by passing through the nickel-sepharose
column a second time. The column was equilibrated with 20 mM HEPES, pH 7.5,
5% glycerol and 1 mM DTT. As a second purification step, protein was loaded
onto a Resource Q anion exchange column equilibrated with Buffer C (20 mM
HEPES, pH 7.5, 5% glycerol and 1 mM DTT) and eluted with a 0−350 mM NaCl
43
Figure 2.3 SDS-PAGE showing yeast FMNAT protein expression levels. a.)
Candida glabrata FMNAT protein expression level. b.) Saccharomyces
cerevisiae protein expression level. Lane numbers are as follow: 1.) Total lysate
of non-induced culture, 2.) Total lysate of induced culture, 3.) Pellet, 4.)
Supernatant, 5.) Flow-through from nickel column, 6.) Wash, 7.) First elution
fraction, 8.) Second elution fraction and 9.) Pre-stained SDS-PAGE protein
standard broad range (Bio-Rad), with molecular weight shown in kilo-Daltons
(kDa).

44
Figure 2.4 Elution profile of CgFMNAT from a Resource Q anion exchange
column. Protein was eluted with a 0−350 mM NaCl gradient (solid black line) and
monitored by absorption at 280 nm (solid blue line). Two pools were collected as
indicated by the vertical dash line. The first pool, elution volume 33 to 36 ml, had
a bright yellow color and was later shown to contain the CgFMNAT-FAD
complex. The second pool, from 37 to 56 ml, had a light yellow color, indicating
the presence of flavin with partial occupancy.
45
gradient with Buffer D (20 mM HEPES, pH 7.5, 1 M NaCl, 5% glycerol and 1
mM DTT), which yielded two pools (Fig. 2.4). The first pool had a bright yellow
color and was later shown to contain the CgFMNAT-FAD complex. The second
pool had a light yellow color, indicating the presence of flavin with partial
occupancy. To remove the flavin and obtain homogeneous apo-CgFMNAT, the
second pool was concentrated between 10–12 mg/ml and incubated with 1.5 M
ammonium sulfate on ice and loaded onto a phenyl-sepharose hydrophobic-
interaction chromatography column equilibrated with Buffer E (20 mM HEPES,
pH 7.5 and 1.5 M ammonium sulfate). The protein was eluted with a 1.5 M–0
ammonium sulfate gradient with Buffer F (20 mM HEPES, pH 7.5). Residual
ammonium sulfate in the protein sample was removed with overnight dialysis in 4
liters dialysis buffer (20 mM HEPES, pH 7.5, 50 mM NaCl and 1 mM DTT) at 4
ºC. The final purification step for apo-CgFMNAT was gel filtration using a
Superdex 75 16/60 gel filtration column equilibrated with gel filtration buffer (20
mM HEPES, pH 7.5, 150 mM NaCl and 1 mM DTT). Detection of flavin was
measured by a UV/visible wavelength scan using a Beckman Coulter DU 640
spectrophotometer (Fullerton, CA).
The selenomethionyl (SeMet) apo-CgFMNAT was expressed in E. coli
BL21(DE3) grown in minimal media supplemented with selenomethionine and
other nutrients179
and purified using the same procedure as for apo-CgFMNAT.

46
The protein purity was monitored by PhastGel SDS-PAGE (GE Healthcare) and
the protein concentration was determined using Bio-Rad (Hercules, CA) protein
assay. Amicon ultra 10,000 molecular weight cut-off centrifuge filter tubes
(Millipore; Billerica, MA) were used to concentrate the protein.
Crystallization of apo-CgFMNAT
Hampton HT screens (Salt, Index and Crystal Screen), PEG/Ion screen
and Wizard III screen were used to identify initial protein crystallization
conditions in 96-well sitting-drop plates. The plates were set-up by mixing 1 l
protein (~24 mg/ml in gel filtration buffer) with equal volume of reservoir
solution and equilibrated against the reservoir at 20 °C. Two hits were selected
from Hampton Crystal Screen HT: (1) 0.1 M sodium acetate, pH 4.6 and 8%
(w/v) polyethylene glycol (PEG) 4000 and (2) 0.1 M sodium acetate, pH 4.6, 0.2
M ammonium sulfate and 30% (w/v) polyethylene glycol monomethyl ether (PEG
MME) 2000 (Fig. 2.5a and b). The initial step for optimization of the
crystallization conditions for better crystal growth was to vary the reagents in 24-
well plates using the hanging-drop and sitting-drop vapor diffusion method, with
1.5 l protein mixed with equal volume of reservoir solution and equilibrated
against the reservoir at 20 °C. The following conditions were tested: (1) 0.1 M
sodium acetate, pH 4.4−5.4 and 6−12% (w/v) PEG 4000 and (2) 0.1 M sodium
acetate, pH 4.4−5.4, 0.2 M ammonium sulfate and 24−30% (w/v) PEG MME
47
2000. In parallel, different protein concentrations at approximately 12 mg/ml and
24 mg/ml were examined, with better crystal growth occurring with ~24 mg/ml
protein using the hanging-drop vapor diffusion method. Further optimization of
crystallization conditions included varying the salt concentration of (2), varying
the protein to reservoir mix ratio, adding different salts, an additive screen, streak-
seeding, different buffers, exchange PEG and PEG MME with a lower and higher
molecular weight PEG and PEG MME, incubation at different temperatures (4
°C, 12 °C and 16 °C) and varying the rate of vapor diffusion using silicon and
paraffin oil. Crystal quality and selection of cryoprotectant was monitored by
several diffraction images collected in-house with X-ray from a rotating anode
generator (Rigaku FRE SuperBright) and recorded on a RAXIS IV++ (Rigaku)
image plate detector. From the optimizations, the best reservoir conditions
contained 0.1 M sodium acetate, pH 4.8−5.0 and 10−12% PEG 4000, and after
incubation at 20 °C, produced prism-shaped crystals of size 0.15 x 0.05 x 0.05
mm3 (Fig. 2.5c and d). To obtain crystals with better diffraction to higher
resolution, the reagents and greased 24-well plates were chilled on ice before
setting up crystallization drops. Thorough chilling of the plate was accomplished
by surrounding the plate with ice. The apo-CgFMNAT crystals were grown by
mixing 1.5 l of protein (~24 mg/ml) with 1.5 l of reservoir solution composed
of 0.1 M sodium acetate, pH 4.4–5.4 and 6–12% PEG 4000, and equilibrated

48
Figure 2.5 Initial and optimized crystallization conditions for apo-CgFMNAT. a)
From Hampton Research Crystal Screen HT solution D1 with 0.1 M sodium
acetate, pH 4.6 and 8% (w/v) PEG 4000 and b) solution F1 with 0.1 M sodium
acetate, pH 4.6, 0.2 M ammonium sulfate and 30% (w/v) PEG MME 2000. c)
Optimization of a) condition yielded better crystal morphology in 0.1 M sodium
acetate, pH 5.0 and 12% (w/v) PEG 4000 at 20 °C incubation. d) Crystal from c)
diffracted to ~2.6 Å resolution. Images in Figure a-c were taken at 10x
magnification.
49
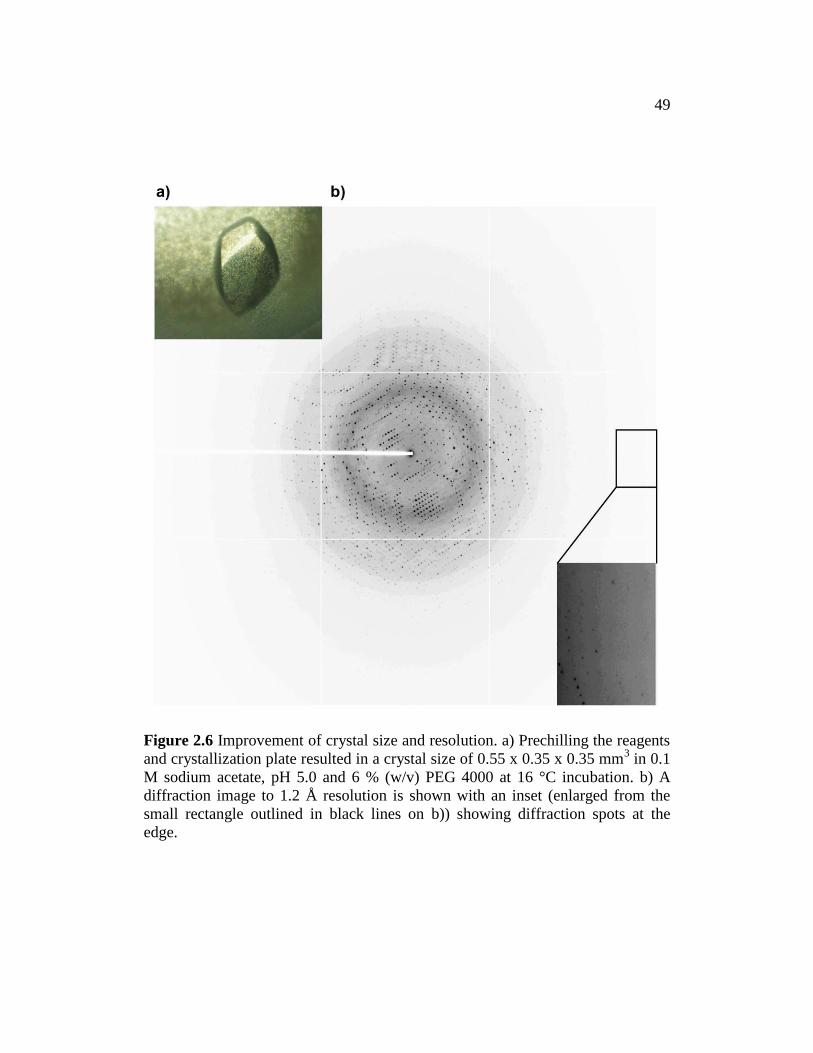
Figure 2.6 Improvement of crystal size and resolution. a) Prechilling the reagents
and crystallization plate resulted in a crystal size of 0.55 x 0.35 x 0.35 mm3 in 0.1
M sodium acetate, pH 5.0 and 6 % (w/v) PEG 4000 at 16 °C incubation. b) A
diffraction image to 1.2 Å resolution is shown with an inset (enlarged from the
small rectangle outlined in black lines on b)) showing diffraction spots at the
edge.

50
against the reservoir at 16 ºC using the hanging-drop vapor diffusion method.
Prism-shaped apo-CgFMNAT crystals grew to a maximum size of 0.55 x 0.35 x
0.35 mm3 within several days (Fig. 2.6a) in 0.1 M sodium acetate, pH 4.8–5.0 and
6% PEG 4000. The crystal diffracted to 1.48 Å at the in-house X-ray source.
SeMet apo-CgFMNAT crystals were grown under similar conditions as the native
protein. Crystals of the same morphology grew to a maximum size of 0.25 x 0.15
x 0.15 mm3 within several days in 0.1 M sodium acetate, pH 4.8–5.0 and 6–8%
PEG 4000. Crystals were cryoprotected in a solution containing all the reservoir
components and increments of glucose [10%, 20% and 30% (w/v)], flash-frozen
in liquid propane and stored in liquid nitrogen.
Data collection, X-ray structure determination and refinement
Prior to the synchrotron data collection a 1.48 Å dataset was collected in-
house from the same crystal used for the 1.2 Å data collection. Synchrotron X-ray
beam-line 19-BM and 19-ID were used to collect diffraction data recorded on a
SBC-3 CCD X-ray Detector and ADSC Quantum 315, respectively, at the
Advance Photon Source (APS), Argonne National Laboratory. A 2.18 Å single-
wavelength anomalous diffraction (SAD) dataset from a SeMet apo-CgFMNAT
crystal and a 1.5 Å dataset from a native apo-CgFMNAT crystal was collected at
beam-line 19-BM. Two data collection passes was performed on a single native
crystal for the 1.2 Å dataset at beam-line 19-ID. For the first pass, data was

51
collected to 1.5 Å with the X-ray beam attenuated to reduce radiation damage to
the protein crystal and to prevent individual spot intensity at low resolutions
exceeding the CCD detector limit. Data at 1.2 Å were collected in the second pass
with a higher X-ray flux (Fig. 2.6b). All datasets were indexed, integrated and
scaled with the HKL3000 package180
. Both passes for the 1.2 Å dataset was
scaled together and used for structure refinement. The crystals belong to either
P3121 or P3221 space group for the native and SeMet apo-CgFMNAT datasets,
with unit cell dimensions a=b=80.1 Å, c=78.1 Å, ==90° and =120° for the 1.2
Å dataset. Data collection statistics for the 2.18 Å SAD and 1.2 Å native datasets
are presented in Table 2.1. All scaled dataset intensities were converted to
structure factor amplitude in the mtz file format using the CCP4 package181
.
The initial phases for apo-CgFMNAT were obtained from the SAD data
collected on the SeMet apo-CgFMNAT crystal. To optimize the anomalous
diffraction, an X-ray fluorescence scan of the SeMet apo-CgFMNAT crystal was
conducted near the absorption edge (K-edge) of selenium (Se) at beam-line 19-
BM. The SAD dataset was collected at wavelength 0.97927 Å corresponding to
the peak point. Aside from the N-terminal methionine, CgFMNAT has only one
non-terminal methionine. In general, one methionine per 100 residues is required
for SAD and MAD (multiple-wavelength anomalous diffraction) phasing182-184
.
Therefore, it was not clear whether there would be sufficient signal for phase

52
Table 2.1. Data Collection and Refinement Statistics
Protein Selenomethionyl apo-
CgFMNAT apo-CgFMNAT
Space Group/Monomer per Asymmetric Unit
P3221/1 P3221/1
Data SAD Native
Wavelength (Å) 0.97927 0.97931 Resolution (Å) 50.0-2.18 50.0-1.20 Unit cell dimensions a, b, c (Å)
, , (º)
80.31, 80.31, 78.27 90.0, 90.0, 120.0
80.09, 80.09, 78.09 90.0, 90.0, 120.0
Total no. of reflections 200196 1036966 No. of unique reflections 15582 90728 % Completeness 99.9 (100.0)
a 99.9 (99.7)
Rsymb 0.091 (0.335) 0.070 (0.442)
I/σ 38.9 (8.5) 48.2 (2.3) Mosaicity (º) 0.6 0.4 Model Refinement Anisotropic
e
Resolution range (Å) 50.0-1.20 Rwork
c (%) 16.2
Rfreed (%) 17.8
No. of protein atoms 2502 No. of ligand atoms 13 No. of water molecules 390 Average B-factor (Å
2)
Protein atoms 17.1 Ligand atoms 21.3 Water molecules 29.3 Rmsd bond length (Å) 0.015 Rmsd bond angle (º) 1.621 Ramachandran Plot % favored region 98.6 % allowed region 1.4 % outliers 0.0
aValues in parenthesis are for highest-resolution shell.
bRsym = hkl [(j (|Ij – <I>|) / jIj ] . <I> is the average for all j measurements of reflection hkl.
cRwork = hkl |Fo – Fc| / hkl |Fo|, where Fo and Fc are the observed and calculated structure factors, respectively.
dRfree calculated from randomly selected 1.5% reflections that are excluded from refinement for cross-validation.
eSix anisotropic displacement parameters are used for selected atoms, while isotropic B-factors were used for
remaining atoms. Anisotropic displacement parameters were evaluated and assigned using ANISOANL and PARVATI.

53
determination. Heavy atom search and phasing were performed using SHELXC/D
and E, as incorporated in the HKL3000 package, at 2.5 Å. Two Se sites were
found and used for calculating phases. Refinement of heavy atom positions and
phases was also performed with MLPHARE185
followed by density modification
using DM186
. The figure-of-merit after MLPHARE was 0.15 and significantly
improved to 0.70 after DM for the 2.18 Å SAD dataset collected. During phase
determination, the space group was determined to be P3221 with one CgFMNAT
molecule per asymmetric unit.
From the initial phases a model composed of 169 residues out of 308 was
built using Resolve187
. These phases were extended to 1.5 Å using the native
dataset with DM in the CCP4 package, which resulted in a much improved
electron density map. The Rfree set was preserved and extended to 1.5 Å using the
CCP4 package. A model of 272 residues out of 308 was built using
ARP/wARP188
. Refinement against the 1.2 Å native apo-CgFMNAT dataset
proceeded in two stages using REFMAC189
with manual model building
performed with Coot190
. The first stage consisted of restrained refinements of
isotropic B-factors with tight restraints. In the second stage, anisotropic B-factors
were included in the refinements and stereochemical restraints were gradually
loosened with each refinement step. Anisotropic displacement parameters were
analyzed by ANISOANL in the CCP4 package and PARVATI server191
.

54
Anisotropic displacements parameters were assigned to atoms with B-factor
approximately 21 or lower and well defined electron density. Water molecules
were added by ARP/wARP and manually inspected. The final model has 291
residues out of 308, a glucose molecule and a chloride ion with Rwork 16.2% and
Rfree 17.8%. The model was assessed by MolProbity192
and complete model
statistics is listed in Table 2.1.
An anomalous difference map was generated from a native apo-
CgFMNAT crystal anomalous dataset collected at 1.48 Å at UT Southwestern
Medical in-house X-ray facility. The dataset was scaled with the anomalous flag
on in HKL2000. Using the CCP4 package, the phases were transferred from the
1.2 Å data to the 1.48 Å data and the anomalous difference map was generated
using FFT.
All images of structures, electron density and electrostatic surface
potentials were generated using iPyMol (http://www.pymol.org). The pdb2pqr
server193
was used to generate a pqr file using PARSE atomic radii and charges194
.
Electrostatic surface potentials were calculated using APBS195
plugin for PyMol
using the default settings, with a monovalent cation and anion concentration of
0.15 M and the potential ramped between -5 kT/e (red) and +5 kT/e (blue).
Structural alignment was performed using Secondary Structure Matching196
.

55
Adobe Creative Suite 2 (http://www.adobe.com) was used to label and format
images.
RESULTS
Quality of apo-CgFMNAT model
To obtain crystals that diffracted to 1.2 Å, the reagents and greased 24-
well plates needed to be chilled on ice before setting up crystallization drops. The
observation leading to such a procedure was the accumulation of condensed vapor
during plate set-up at room temperature (RT) and incubation at 20 ºC. Plate set-up
at RT, then incubation at lower temperatures, produced smaller crystals with poor
diffraction or slightly larger fragile crystals. Incubation at 16 °C, after set-up on
ice, produced large well-defined crystals diffracting to high resolution (Fig. 2.6a
and b). The crystal structure of apo-CgFMNAT was solved by the single-
wavelength anomalous diffraction (SAD) phasing method using selenomethionine
as the source of anomalous diffraction and was refined using data to a resolution
of 1.2 Å collected from a native crystal (Table 2.1). There is one CgFMNAT
molecule in the asymmetric unit and six molecules in the space group P3221.
Crystal-packing analysis and quaternary analysis from PISA197
suggests that the
functional unit of CgFMNAT is a monomer, which is consistent with the gel
filtration result that showed CgFMNAT is monomeric in solution (Fig. 2.7). The

56
refined model contains residues -3–304, except for residues 85–101, for which we
found no associated electron density and are presumably disordered. Residues -3–
0 (Gly-Ala-Met-Val) were introduced during cloning. For the model, the main
chain dihedral angles (, ) for all residues are in the allowed Ramachandran area
(Table 2.1) and has an average B-factor of 17.1 Å2 (Fig. 2.8). A -D-glucose
molecule was modeled with an average B-factor of 25.5 Å2 and is derived from
the cryoprotectant. A chloride ion, with a B-factor of 17.1 Å2 is modeled due to
the presence of a large spherical density situated in a positively charged pocket,
also referred to as an anion or oxy-anion pocket, formed by the amide-backbones
of a loop (PP-loop) connecting 1 to helix 3 (Fig. 2.9). Modeling a water
molecule resulted in an average B-factor of 9.2 Å2, lower than the surrounding
protein atoms, and with a presence of a strong positive Fo-Fc difference electron
density peak. Additionally, there is a positive peak in the anomalous difference
map at the same position from the dataset collected in-house at X-ray wavelength
1.5418 Å (Fig. 2.9). There are two known atom types in the crystal to contribute
to anomalous diffraction at the given wavelength. Sulfur atom from methionine
and cysteine residues, and chloride ion from the gel filtration buffer. The
environment of the anomalous difference peak indicates that a chloride ion is the
most likely candidate. Many side chain and main chain double conformations, and
loop flexibility were clearly observable in the electron density at 1.2 Å.

57
Figure 2.7 apo-CgFMNAT elution profile from a Superdex 75 16/60 gel filtration
column. The single peak maximum occurs at 68.0 ml, corresponding to a
molecular weight of ~38 kDa. The theoretical molecular mass for CgFMNAT is
35,568 Da.

58
Figure 2.8 Cartoon putty of CgFMNAT. The putty width becomes wider with an
increase in B-factor. The color is ramped from blue to red, with blue being the
lowest B-factor and red the highest B-factor. The lowest main chain B-factor for a
residue is 10.5 Å2 and the highest is 42.3 Å
2. Including the main chain and side
chain for each residue the lowest B-factor is 10.9 Å2 and the highest is 45.7 Å
2,
and the average is 17.1 Å2.

59
Figure 2.9 Electron density map of apo-CgFMNAT at 1.2 Å resolution. A 2Fo-Fc
electron density map (sky blue) contoured at 1.5 is shown for local residues of
apo-CgFMNAT surrounding an anion pocket. The protein is colored by atom type
with carbon atoms colored white. A chloride ion (green sphere) was identified in
the anion pocket by the presence of an anomalous difference peak contoured at 6
(magenta).

60
Figure 2.10 Ribbon representation of apo-CgFMNAT. The N-terminal domain
colored in raspberry is composed of residues 1–196 and the C-terminal domain
colored in dark blue is composed of residues 197–304. The dots connecting 3 to
2 represent the residues not modeled (disordered).
61
Other regions with less well defined electron density and increased B-factors can
be inferred as displaying conformational flexibility (Fig. 2.8).
Description of apo-CgFMNAT structure
CgFMNAT is composed of two domains (Fig. 2.10). The N-terminal
domain, containing residues 1−196, has an / fold with a central, twisted six-
stranded -sheet sandwiched by -helices. Five -strands of the central -sheet
are parallel to each other and have a Rossmann-like fold topology. Starting at the
N-terminus, CgFMNAT has two long helices, 1 and 2, that are followed by the
first -strand (1) of the Rossmann-like fold core. The core has a topology of
34231|5465, where the crossover helix 5 connects 3 to 4 and
places 4 parallel and adjacent to 1. Deviation from the typical Rossmann-
fold144
topology is in the orientation and placement of strand 5, which connects
4 and 6 and is anti-parallel to all other strands. In a typical Rossmann-fold
protein, an -helix would be in the place of 5 and connects 4 and the next
adjacent and parallel strand 6. The carboxyl-termini of 1 and 4 transform into
loops and extend in opposite directions from the -sheet plane. Like most
Rossmann-fold nucleotide-binding proteins, a crevice is formed between the two
central strands 1 and 4, constituting the primary nucleotide-binding site144
. The
loop extending from 1 to 3 (PP-loop) has the sequence 62
NGGKDC67, which is

62
slightly altered from the signature motif SGGxD(S/T)142
of the “adenine
nucleotide hydrolase-like” protein superfamily at the first position (Asn62
instead of a Ser).
The C-terminal domain, residues 197−304 of CgFMNAT, is composed
largely of loops (64%) interlaced by 6–9 and two short 310-helices (Fig. 2.10).
Upon examination of the crystal packing there was minimal inter-lattice contact,
therefore the C-terminal domain is intrinsically structural, as supported by the low
B-factors (Fig. 2.8). From 6 a loop extends upwards placing 7 and the
following hairpin loop above the crevice formed by 1 and 4. A long V-shaped
loop then connects 8 to 9, placing 9 adjacent to 7. This loop follows a V-
shaped outline formed by 1 and 4, and appears to be flexible at the vertex (Fig.
2.8). Following helix 9, a loop and a 310-helix extends towards the gap between
7 and 8 and places a 310-helix underneath the loop between 7 and 8. A
roughly flat surface is formed by the C-terminal domain (Fig. 2.11a). From an
electrostatic surface potential view, a negatively charged pocket exists on this face
of the molecule, flanked by a positively charged patch on the left and a negatively
charged patch on the right (Fig. 2.11b).
The crevice formed by 1 and 4 from the Rossmann-like N-terminal
domain is the primary nucleotide binding site in the superfamily. The area above

63
Figure 2.11 Ribbon diagram and electrostatic surface potential of apo-
CgFMNAT. a) The C-terminal domain (dark blue) is oriented in a manner that
places the flat surface parallel to the page. b) An electrostatic surface potential of
apo-CgFMNAT in the same orientation as in a) reveals a negatively charged
pocket formed by the C-terminal domain. Corresponding areas in a) and b) are
indicated with arrows.

64
Figure 2.12 Binding site for a chloride ion. Water molecules are shown as red
spheres and protein residues are colored by atom type with carbon atoms colored
forest green. Hydrogen bonds are indicated by black dash lines. a) A chloride ion
(green sphere) identified by the presence of an anomalous difference peak
contoured at 6 (magenta) forms hydrogen bonds with the surrounding protein
and water atoms with distances of 2.9–3.3 Å, typical for a chloride ion. b) The
chloride ion is positioned above 3, and in-line with the helix dipole.

65
helix 3 is an anion pocket generated by the positive dipole of 3, as the peptide
amides are oriented upward towards the pocket and the carbonyls oriented
downward. The -phosphate of ATP from N-type ATP pyrophosphatases and
PP-loop ATPase families is known to bind in this anion pocket. In apo-
CgFMNAT a chloride ion is located in the anion pocket and centered above 3
(Fig. 2.12a and b). The chloride ion forms five hydrogen bonds to the ammonium
group of Lys65 of the PP-loop (3.3 Å), hydroxyl of Tyr216 (2.9 Å), the amide of
Leu223 (3.2 Å) and two water molecules as depicted in Fig. 2.12b. A surface
representation shows the chloride ion located deep inside a large pocket,
presumably the nucleotide binding site, formed by 1 and 4 of the Rossmann-
like fold, the PP-loop, 3 and surrounding residues (Fig. 2.13). An electrostatic
surface potential shows the positive charge on the surface generated from residues
interacting with and surrounding the chloride ion and contributing to the anion
pocket (Fig. 2.13).
A modeled glucose molecule, as defined by the high resolution electron
density, is stacked between the protein monomer in the asymmetric unit and a
symmetry-related CgFMNAT molecule. The glucose molecule interacts with
several residues from both monomers and well defined water molecules (Fig.
2.14a). From the same asymmetric unit the glucose interacts with the main chain
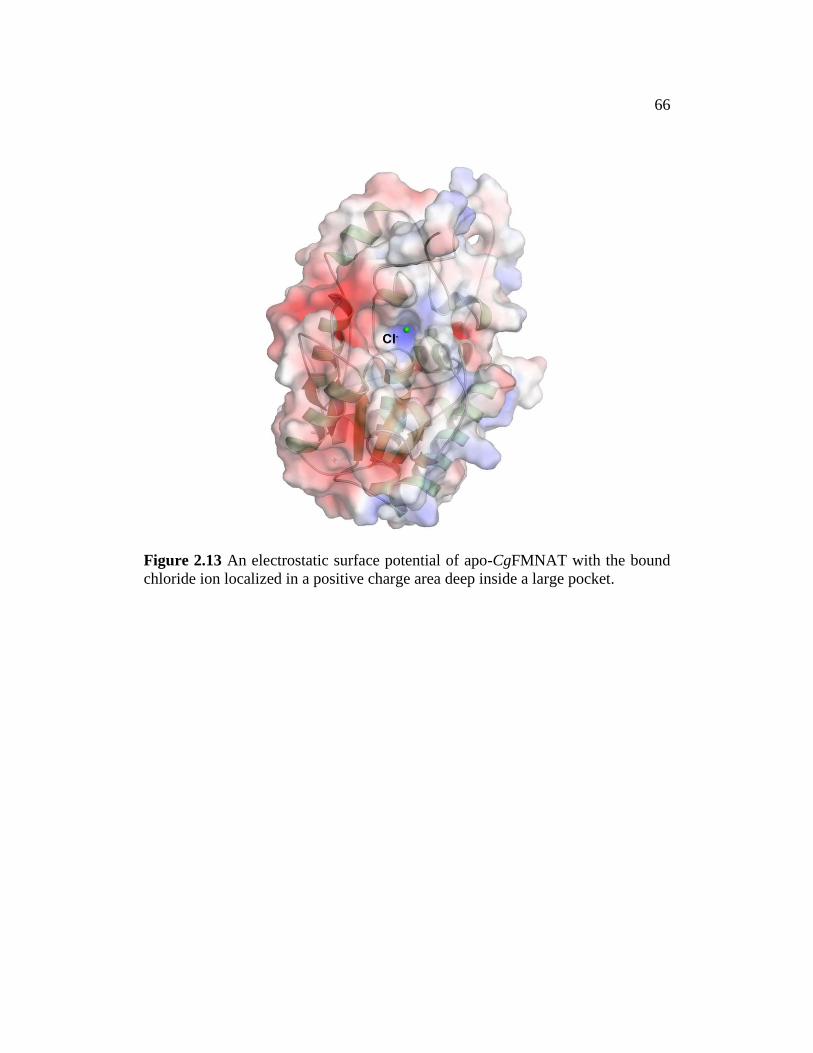
66
Figure 2.13 An electrostatic surface potential of apo-CgFMNAT with the bound
chloride ion localized in a positive charge area deep inside a large pocket.

67
Figure 2.14 Glucose interaction site. a) A 2Fo-Fc electron density map (blue)
contoured at 1.0 is shown for glucose, waters (red sphere) and residues
interacting with the glucose. Atoms are colored by atom type with carbon atoms
colored gray for apo-CgFMNAT and brown for the symmetry-related apo-
CgFMNAT. b) Ribbon representation of apo-CgFMNAT with residue K49, W50,
K158 and Y188 sites colored purple. c) The glucose is located in a positive charge
depression on apo-CgFMNAT.

68
carbonyl of Lys49 and ammonium group of Lys158 through hydrogen bonds, and
with Trp50 and Tyr188 through van der Waals interaction. Additional interactions
occur with residues Glu278’, His281’, Glu282’ and Asp283’ from a symmetry-
related CgFMNAT molecule, primarily through van der Waals interaction, with a
hydrogen bond to the main chain carbonyl of Asp283’. The arrangement of Lys49
and Trp50 following 2, Lys158 before 4 and Tyr188 on strand 6 may aide in
localizing the glucose molecule, as these residues form a positive charge
depression around the glucose (Fig. 2.14b and c). Capping the depression are
residues from the symmetry-related protein. The water molecules at the two
monomer interface may also contribute to the stability of the glucose.
There were a total of 27 residues for which double conformations are
observed and all occur at the solvent accessible region of apo-CgFMNAT (Fig.
2.15). Four residues adopt double conformations in the main chain regions (Fig.
2.16a and c), sixteen residues have double side chain conformations (Fig. 2.14a
and Fig. 2.16b and c) and the double conformations of seven residues involve
both main chain and side chain atoms (Fig. 2.17). The solvent exposed loop
connecting 1 to 2, residues 21−24, displays conformational flexibility of the
peptide bonds (Fig. 2.17). Double peptide bond conformations from Gly163 and
Ser222 are shown in Fig. 2.16a and c, which take part in forming the substrate

69
Figure 2.15 Residues with double conformations are shown on a ribbon
representation of apo-CgFMNAT. Residues with double conformations are shown
as spheres, with hydrophilic residues in blue and hydrophobic residues in orange.
All double conformations occur at the solvent accessible regions.

70
Figure 2.16 2Fo-Fc Electron density maps (blue) contoured at 1.0 for
representative residues modeled with double conformations. a) The carbonyl of
the peptide bond of S222 is observed fluctuating between two positions. b) Side
chain double conformations of S131. c) Two conformations for G163 main chain
are observed and a rotation of the guandinium group of R165 is clearly evident.
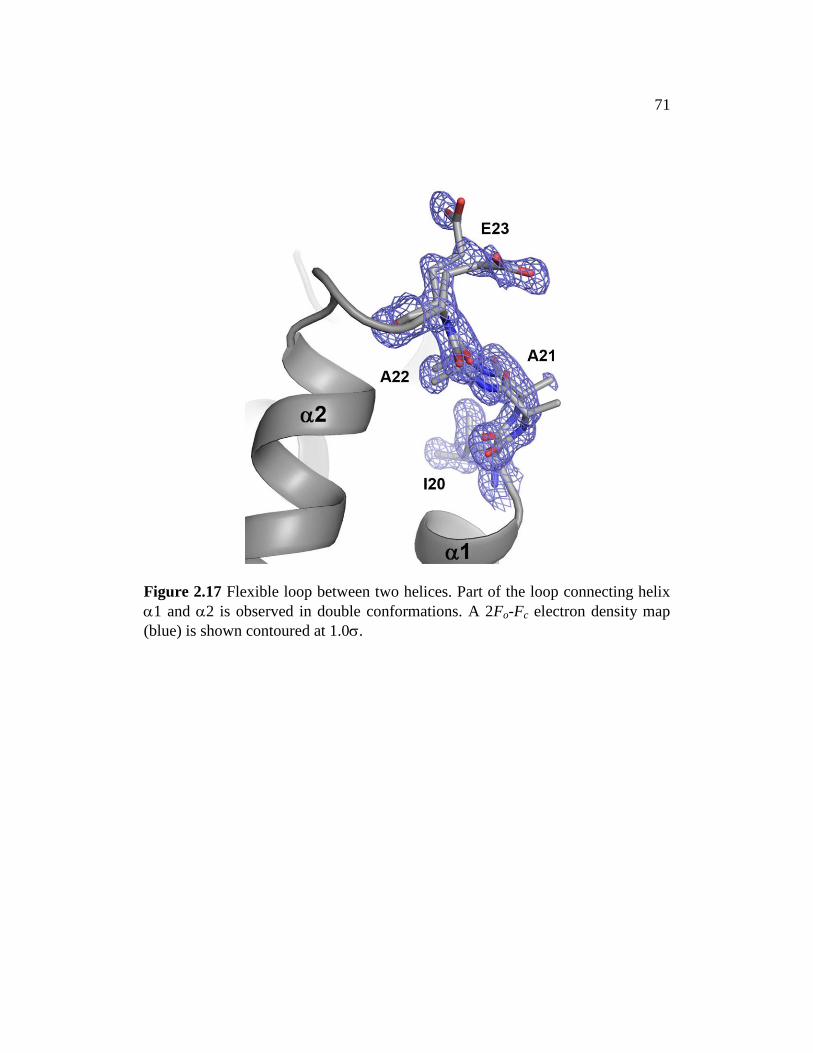
71
Figure 2.17 Flexible loop between two helices. Part of the loop connecting helix
1 and 2 is observed in double conformations. A 2Fo-Fc electron density map
(blue) is shown contoured at 1.0.

72
Table 2.2. apo-CgFMNAT Residues with Double Conformations
Residue Substrate Binding Site MC/SC1 SS
2
Ser16 No SC H (1)
Ile20 No MC L
Ala21 No MC/SC L
Ala22 No MC/SC L
Glu23 No MC/SC L
Ser40 No SC H (2)
Ser58 Yes SC S (1)
Lys102 No MC/SC L
Leu103 No MC/SC S (2)
Arg127 No SC H (4)
Ser131 No SC S (3)
Lys139 No SC L
Lys158 No SC L
Gly163 Yes MC/SC S (4)
Ile164 Yes MC L
Arg165 Yes SC L
Lys175 No SC L
Ile177 No SC S (5)
Glu214 No SC H (7)
Ser222 Yes MC L
Glu228 No SC L
Lys245 No SC L
Glu249 No SC H (8)
Ile267 No SC L
Asp271 No MC/SC L
Arg300 Yes MC L
Lys302 No SC L
1MC stands for main chain and SC stand for side chain.
2SS stands for secondary structure.
73
binding pocket. A summary of residues with double conformation is listed in
Table 2.2.
Structural comparison to adenine nucleotide hydrolase-like superfamily
Comparison of apo-CgFMNAT with known protein structures using the
Dali server198
indicates that the core of CgFMNAT is most similar to the members
of the PAPS reductase-like family. These include bacterial adenosine 5’-
phosphosulfate (APS) reductase138
[Protein Data Bank (PDB) ID 2goy; Z-score of
15.4 and rmsd of 2.5 Å for 174 superimposed C atoms], PAPS reductase140
(1sur, Z-score of 14.0 and rmsd of 2.4 Å for 159 superimposed C atoms), and
ATP sulfurylase139
(1zun, Z-score of 13.1 and rmsd of 2.9 Å for 160
superimposed C atoms). Similar to CgFMNAT, these proteins also have a core
domain of a modified Rossmann-fold topology where the 5th -strand of the
central six-stranded -sheet is anti-parallel to the rest of the strands (Fig. 2.18a).
This unique topological variation distinguishes them from other members of the
adenine nucleotide hydrolase-like protein superfamily, such as N-type ATP
pyrophosphatases (e.g., GMP synthetase143
and -lactam synthetase199
) and PP-
loop ATPase (e.g., tRNA-Ile-lysidine synthetase200
) (Fig. 2.18b). This unique
topological variation replaces a helix with a -strand, thereby altering the
topology at the edge of the domain. Furthermore, in PAPS reductase-like family

74
the central twisted -sheet is not enclosed by helices as in the N-type ATP
pyrophosphatases and PP-loop ATPase families (Fig. 2.18a and c).
The nucleotide binding motifs conserved in the superfamily are also
conserved in CgFMNAT. The PP-loop and adenine-loop (or LDTG in APS
reductase138
) are nucleotide binding motifs featured in all proteins in the
superfamily and are highlighted in three proteins in Fig. 2.18a and b. The PP-
loop connects the carboxy-terminus of the first -strand to the following helix.
The adenine-loop connects the second -stand and succeeding helix. Additional
motifs in the PAPS reductase-like family include the arginine-loop (Arg-loop),
which connects 4 to 5 in APS reductase and contains three conserved
arginines138
. This motif is also present in PAPS reductase and ATP sulfurylase
with three conserved arginines. An equivalent topological feature is also present
in CgFMNAT and has one arginine. From a structure-based alignment, this
arginine in CgFMNAT is well conserved in members of the PAP reductase-like
family (Fig. 2.19). For members of N-type ATP pyrophosphatases and PP-loop
ATPase families there is no Arg-loop and the corresponding region usually
contains one or more helices (Fig. 2.18b). The C-terminus of APS reductase that
superimposes with the last 310-helix and the proceeding loop at the C-terminus of
CgFMNAT (Fig. 2.18a) is shown to have two arginines interacting with the
substrate APS, which are conserved in CgFMNAT (Fig. 2.19).

75
Figure 2.18 Comparison of apo-CgFMNAT structure to members of the adenine
nucleotide hydrolase-like superfamily. Bound ligands are shown as sticks.
Equivalent structural motifs involved in substrate binding are colored dark blue
for PP-loop, dark green for adenine-loop and purple for Arg-loop motifs. a) C-
terminal domain of apo-CgFMNAT superimposible to APS reductase is colored
dark yellow. The APS and [4Fe,4S] cluster are colored by atom type with carbon
atoms colored raspberry. b) Region in -lactam synthetase corresponding to Arg-
loop is shown in magenta and removed region indicated by gray dots. c) -lactam
synthetase in the same orientation as in b) with removed helices shown. ATP in b)
and c) is colored by atom type with carbon atoms colored gray and a green sphere
for magnesium ion.

76
Figure 2.19 Structure-based multiple sequence alignment of protein
representatives from “adenine nucleotide hydrolase-like” superfamily. Each
sequence is labeled by the PDB code, except CgFMNAT. The residue numbers of
CgFMNAT are marked at the top of the alignment. Conserved structural motifs
are boxed and conserved residues within the motifs highlighted. Glycine and
proline residues are in red; conserved glycine and charged/polar residues are
highlighted in gray and conserved hydrophobic/aromatic residues in yellow.
Members of PAPS reductase-like family are 2goy (APS reductase), 1sur (PAPS
reductase) and 1zun (ATP sulfurylase); member of PP-loop ATPase family is
1ni5 (tRNA-Ile-lysidine synthetase); and members of N-type ATP
pyrophosphatases are 2nsy (NH3+
-dependent NAD synthetase) and 1gpm (GMP
synthetase).

77
The C-terminal domain of CgFMNAT is uniquely elaborated and
expanded with long loops. Compared to other members of the PAPS reductase-
like family, parts of the C-terminal domain structure are conserved, as shown for
APS reductase and ATP sulfurylase (Fig. 2.18a and Fig. 2.20). These include
regions from helix 6 to 7 of CgFMNAT corresponding to that of APS
reductase and ATP sulfurylase (Fig. 2.18a and Fig. 2.20), and the last 310 helix
and the proceeding loop of the C-terminus end corresponding to the C-terminus of
APS reductase (Fig. 2.18a). The aforementioned regions of CgFMNAT show
significant structural similarity to the equivalent regions of APS reductase.
DISCUSSION
Our high-resolution structure of yeast FMNAT presents the first
characterization of a eukaryotic version of this essential enzyme. Although the
overall structure of CgFMNAT shares significant similarity with PAPS reductase-
like family of proteins, as reflected in several shared nucleotide binding motifs
and the unique deviation from the typical Rossmann fold topology, the elaborated
C-terminal domain and the long N-terminal helix 1 are unique to CgFMNAT
(Fig. 2.18 and 2.20). Replacing the first conserved Ser in the PP-loop signature
motif SGGxD(S/T) with Asn (62
NGGKDC67), unique only to eukaryotic FMNAT

78
Figure 2.20 Superimposing CgFMNAT to ATP sulfurylase-regulatory G protein.
a) ATP sulfurylase-regulatory G protein complex. A portion of the Arg-loop in a)
ATP sulfurylase and b) apo-CgFMNAT is colored dark pink. b) Model of helix
1 and portion of the C-terminal domain specific to apo-CgFMNAT are colored
yellow and secondary structure clashes with the G domain and domain II are
colored cyan. Residues missing in the ATP sulfurylase-regulatory G protein
complex are shown with dots.
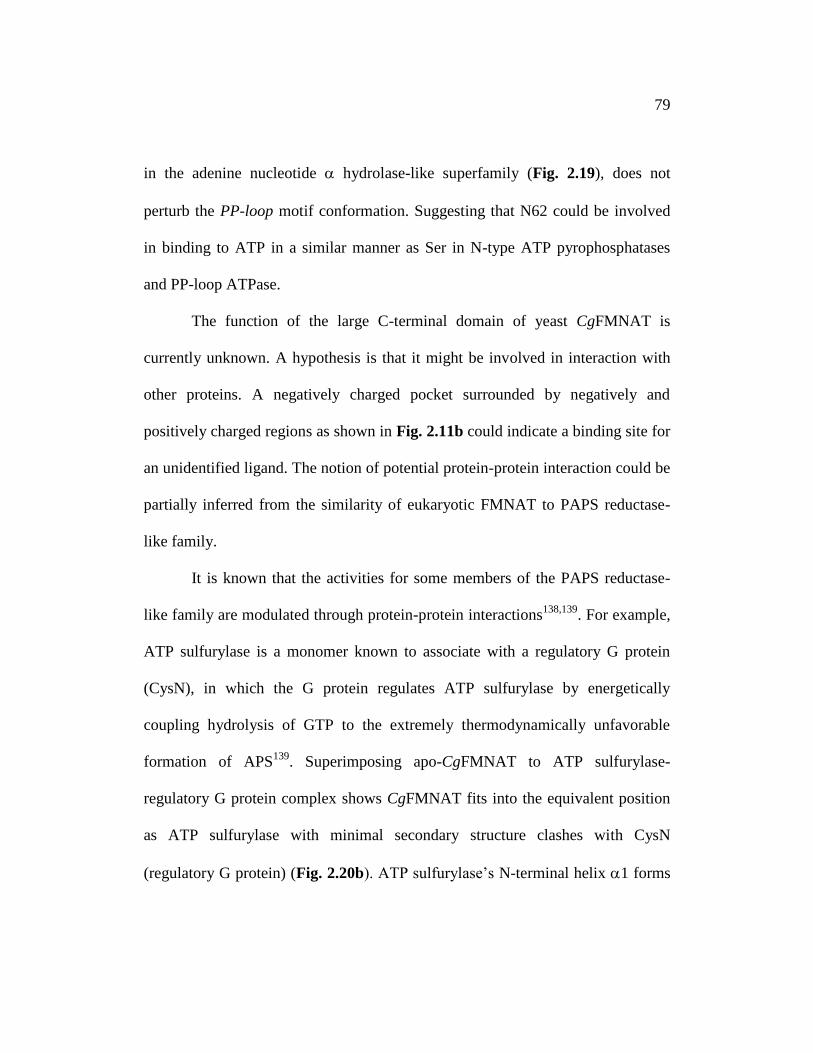
79
in the adenine nucleotide hydrolase-like superfamily (Fig. 2.19), does not
perturb the PP-loop motif conformation. Suggesting that N62 could be involved
in binding to ATP in a similar manner as Ser in N-type ATP pyrophosphatases
and PP-loop ATPase.
The function of the large C-terminal domain of yeast CgFMNAT is
currently unknown. A hypothesis is that it might be involved in interaction with
other proteins. A negatively charged pocket surrounded by negatively and
positively charged regions as shown in Fig. 2.11b could indicate a binding site for
an unidentified ligand. The notion of potential protein-protein interaction could be
partially inferred from the similarity of eukaryotic FMNAT to PAPS reductase-
like family.
It is known that the activities for some members of the PAPS reductase-
like family are modulated through protein-protein interactions138,139
. For example,
ATP sulfurylase is a monomer known to associate with a regulatory G protein
(CysN), in which the G protein regulates ATP sulfurylase by energetically
coupling hydrolysis of GTP to the extremely thermodynamically unfavorable
formation of APS139
. Superimposing apo-CgFMNAT to ATP sulfurylase-
regulatory G protein complex shows CgFMNAT fits into the equivalent position
as ATP sulfurylase with minimal secondary structure clashes with CysN
(regulatory G protein) (Fig. 2.20b). ATP sulfurylase’s N-terminal helix 1 forms
80
intermolecular contacts with CysN G domain and domain II (Fig. 2.20a). The
structural element equivalent to ATP sulfurylase’s 1 in CgFMNAT is 2, for
which similar intermolecular contacts could be formed, with secondary structure
clashes only at the loop connecting 1 to 2 and the first three residues of 2
(Fig. 2.20b). Taking into consideration the sequence and structural similarity to
the PAPS reductase-like family, and the comparative analysis to ATP sulfurylase-
regulatory G protein complex, it is possible that CgFMNAT could be a
modulatory monofunctional enzyme.
In summary, we present here a high-resolution structure of a eukaryotic
FMN adenylyltransferase revealing structural similarities and differences to
proteins in the PAPS reductase-like family and other members of the superfamily.
Details about the PP-loop configuration and a proposed region for βγ-phosphate
binding was obtained through the observation of a chloride ion bound in an anion
pocket conserved in the superfamily and known for interacting with the βγ-
phosphate of ATP. Unlike any other members of the PAPS reductase-like family,
currently, CgFMNAT is the only member in the family that is not part of the
sulfate assimilation pathway. It possesses a uniquely elaborated C-terminal
domain, which might have additional functions.

81
CHAPTER 3
Structures of CgFMNAT Complexes
(Parts of this chapter are adapted from Huerta et al., 2009)
INTRODUCTION
Structure determination of the apo-CgFMNAT shows that the overall fold
of the protein is very similar to PAPS reductase-like family, in which three
nucleotide binding motifs, the PP-loop, Arg-loop and ADE motif (termed LDTG
motif in ref. 136), are conserved. The structure also provided information about
the uniqueness of the tertiary structure, such as the long N-terminal helix 1 and
an elaborated organization of the C-terminal domain. Additionally, through
structural comparison the eukaryotic FMNAT PP-loop consensus sequence is
identified as NGGKDC, which contains residues Asn and Lys that are not
conserved in the superfamily.
Members of the PAPS reductase-like family are involved in the sulfate
assimilation pathway that binds to the nucleotide or a derivative of the nucleotide
ATP138-140
. APS and PAPS reductase bind to their respective substrates as stated
from their enzyme function, whereas ATP sulfurylase is currently the only
member that binds ATP138-140
. Closely related families to the PAPS reductase-like
family include the N-type ATP pyrophosphatases and PP-loop ATPase

82
families138-141
, which also belong the same adenine nucleotide hydrolase-like
superfamily130,142
. The N-type ATP pyrophosphatases family is comprised of
many protein members that bind ATP and synthesize different products, such
enzymes include GMP synthetase, NH3+-dependent NAD synthetase and -lactam
synthetase143,199,201
. All members share a similar nucleotide binding site that
conserves the PP-loop and ADE structural motifs.
A proposed region for ATP binding can be inferred by structural
superposition with homologous proteins, such as APS reductase and ATP
sulfurylase. However, the degree by which the ATP binding is altered by the Asn
and Lys of the eukaryotic FMNAT PP-loop is unknown. Additionally,
CgFMNAT has no structure and sequence similarity to other known
flavoproteins. The fact that CgFMNAT has no similarity to any other
flavoproteins is an indication the FMN binding site is likely to be unique.
Determining CgFMNAT structures with substrates and product FAD is thus
necessary for understanding substrate binding and catalytic mechanism of this
essential enzyme. Additionally, the structures will allow a more discriminatory
analysis between eukaryotic and bacterial FMNAT, as well as between FMNATs
from different eukaryotic organisms. Such analysis will address the fundamental
question of how eukaryotic and bacterial FMNAT accomplish the same chemistry
with different active site architectures. It will also benefit a structure-based
83
inhibitor development effort targeting bacterial FMNAT. We have determined the
crystal structures of CgFMNAT in three different complexed forms (with ATP,
with substrate FMN and the ATP analog AMPCPP, and with products FAD and
PPi, respectively). These structures reveal a novel flavin-binding mode and the
detailed catalytic site configuration that are likely shared among all eukaryotic
FMNATs.
MATERIALS
ATP, AMPCPP (,-methyleneadenosine 5’-triphosphate), FMN, FAD,
sodium pyrophosphate and all other reagents were purchased from Sigma-Aldrich
Inc. (St Louis, MO), unless stated otherwise. Seed bead kit, and other materials
and reagents used for crystallization, as previously stated in Chapter 2, were
purchased from Hampton Research (Aliso Viejo, CA). The 96-well U-bottom
plate manufactured by Nunc (Rochester, NY) was purchased from Fisher
Scientific (Pittsburgh, PA). Media and columns used for purification, as stated in
Chapter 2, were purchased from GE Healthcare (Piscataway, NJ).
METHODS
Expression and purification

84
The expression of CgFMNAT and purification of apo-CgFMNAT is
described in Chapter 2. Protein eluted from Resource Q anion exchange column
yielded two pools (Fig. 2.3). The first pool had a bright yellow color and was later
shown to contain the CgFMNAT-FAD complex. The second pool had a light
yellow color and was used to obtain homogeneous apo-CgFMNAT, as stated in
Chapter 2. The final purification step for CgFMNAT-FAD was gel filtration using
a Superdex 75 16/60 gel filtration column equilibrated with gel filtration buffer
(20 mM HEPES, pH 7.5, 150 mM NaCl, 5% glycerol and 1 mM DTT).
Crystallization
Crystallization set-up for CgFMNAT-ATP and CgFMNAT substrate
ternary complexes were performed using 24-well plates and the hanging drop
vapor diffusion method. A 100 mM ATP stock and a 50 mM FMN stock was
prepared by dissolving each molecule in 20 mM HEPES, pH 7.5. A 200 mM
AMPCPP stock was prepared by dissolving AMPCPP in ddH2O (distilled-
deionized H20). The FMN stock was stored at 4 ºC for one day, and the ATP and
AMPCPP stocks were stored at -20 ºC. To obtain CgFMNAT-ATP complex, ATP
at 10 mM final concentration was incubated with ~22 mg/ml protein on ice and
placed in a 4 ºC cold room for 6 hours. The CgFMNAT-ATP complex crystals
were grown under similar conditions as those for apo-CgFMNAT. Prism-shaped
crystals of 0.20 x 0.09 x 0.09 mm3 appeared within 2 days in 0.1 M sodium
85
acetate, pH 4.4–4.6 and 6–8% (w/v) PEG 4000. The CgFMNAT substrate ternary
complex was obtained by incubating 0.2 mM FMN and 5 mM AMPCPP with ~20
mg/ml protein on ice and placed in a 4 ºC cold room for 3 hours. Plate setup was
at RT and the co-crystals of CgFMNAT substrate ternary complex were grown at
20 °C under similar conditions as those for apo-CgFMNAT, though consecutive
streak-seeding procedure was performed in order to obtain single crystals. For the
first and second streak-seeding rounds, the protein concentration was reduced to
~10 mg/ml and incubated with 0.2 mM FMN and 5 mM AMPCPP. Plate crystals
of 0.15 x 0.15 x 0.05 mm3 appeared after several days in 0.1 M sodium acetate,
pH 4.6 and 8–10% (w/v) PEG 4000. All crystals were cryoprotected in a solution
containing all the reservoir components, appropriate concentration of substrate(s)
and increments of glucose [10%, 20% and 30% (w/v)], flash-frozen in liquid
propane and stored in liquid nitrogen. For cryoprotecting the substrate ternary
complex crystals, magnesium sulfate at 5 mM final concentration was added
along with glucose.
Hampton HT screens Salt, Index and Crystal Screen were used to identify
protein crystallization conditions for CgFMNAT-FAD complex. Three hits were
selected from Hampton Index and Crystal Screens for optimization: (1) 0.1 M
sodium acetate, pH 4.6, 0.2 M ammonium sulfate and 30% (w/v) PEG MME
2000, (2) 0.1 M sodium cacodylate, pH 6.5, 0.2 M magnesium acetate and 20%

86
(w/v) PEG 8000 and (3) 0.1 M Tris, pH 8.5, 0.2 M lithium sulfate and 25% (w/v)
PEG 3350 (Fig. 3.1a and b). The initial step for optimization of the
crystallization conditions was to vary the reagents in 24-well plates using the
hanging-drop and sitting-drop vapor diffusion method. Each plate was set-up by
mixing 1.5 l protein with equal volume of reservoir solution and equilibrated
against the following reservoir conditions at 20 °C: (1) 0.1 M sodium acetate, pH
4.4−5.4, 0.2 M ammonium sulfate and 24−30% (w/v) PEG MME 2000, (2) 0.1 M
sodium cacodylate, pH 5.4−7.4, 0.2 M magnesium acetate and 16−22% (w/v)
PEG 8000, and (3) 0.1 M Tris, pH 7.3−8.8, 0.2 M lithium sulfate and 21−27%
(w/v) PEG 3350. In parallel, different protein concentrations were tested at
approximately 10 mg/ml, 20 mg/ml and 50 mg/ml, with better crystal growth
occurring with ~20 mg/ml protein using the hanging-drop vapor diffusion
method. Further optimization of crystallization conditions were performed
according to a similar procedure as that for apo-CgFMNAT, as described in
Chapter 2, including MicroBatch crystallization202
using 96-well U-bottom plates
and micro-seeding using the Seed Bead kit. Optimizations, crystal quality and
selection of cryoprotection were checked by several diffraction images collected
in-house with X-ray from a rotating anode generator (Rigaku FRE SuperBright)
and recorded on an RAXIS IV++ (Rigaku) image plate detector (Fig. 3.2a and b).
The best crystals came from replacing the ammonium sulfate salt from the

87
Figure 3.1 Initial crystallization conditions giving CgFMNAT-FAD crystals. a)
Rock-shaped crystals from 0.1 M sodium acetate, pH 4.6, 0.2 M ammonium
sulfate and 30% (w/v) PEG MME 2000. b) Non-single crystals from 0.1 M
sodium cacodylate, pH 6.5, 0.2 M magnesium acetate and 20% (w/v) PEG 8000
and viewed through a polarized lens. Images were taken at 10x magnification.

88
Figure 3.2 Diffraction images from two CgFMNAT-FAD crystals. a) Diffraction
image at 2.6 Å from a crystal obtained in 0.1 M sodium acetate, pH 4.8, 0.2 M
magnesium sulfate and 26% (w/v) PEG MME 2000. b) Diffraction image at 2.6 Å
from a crystal obtained in 0.1 M sodium acetate, pH 4.0, 0.2 M magnesium
sulfate and 28% (w/v) PEG MME 2000 using the Microbatch method.

89
original condition [0.1 M sodium acetate, pH 4.6, 0.2 ammonium sulfate and 30%
(w/v) PEG MME 2000] with 0.2 M magnesium sulfate. This condition produced
non-single, hexagonal-shaped crystals of size 0.45 x 0.45 x 0.15 mm3 (Fig. 3.3a)
using the hang-drop or MicroBatch (100% paraffin oil) method. To obtain single
uniformly packed crystals, 2 mM sodium pyrophosphate was incubated with ~20
mg/ml CgFMNAT-FAD on ice and placed in a 4 ºC cold room overnight to yield
CgFMNAT product ternary complex prior to setting up crystallization trays. A
100 mM sodium pyrophosphate stock was prepared by dissolving sodium
pyrophosphate in ddH2O. The complex crystals were grown by mixing 1.5 l
CgFMNAT-FAD-PPi complex with 1.5 l reservoir solution composed of 0.1 M
sodium acetate, pH 4.4–5.4, 0.2 M magnesium sulfate and 20–26% (w/v) PEG
MME 2000, and equilibrating against the reservoir at 20ºC. Thin plate crystal of
0.3 x 0.3 x 0.05 mm3 appeared within 2 days in 0.1 M sodium acetate, pH 4.8, 0.2
M magnesium sulfate and 20–22% (w/v) PEG MME 2000 (Fig. 3.3b). Crystals
were cryoprotected in a solution containing all the reservoir components, 2 mM
sodium pyrophosphate and increments of glucose [10%, 20% and 30% (w/v)],
flash-frozen in liquid propane and stored in liquid nitrogen.
Data collection, X-ray structure determination and refinement
The 1.35 Å CgFMNAT product ternary complex data set was collected at
beam-line 19-ID at the Advance Photon Source (APS), Argonne National

90
Figure 3.3 CgFMNAT-FAD and ternary product complex crystals after
optimization from the original hits. a) A non-single hexagonal crystal of size 0.45
x 0.45 x 0.15 mm3 from 0.1 M sodium acetate pH 5.0, 0.2 M magnesium sulfate
and 23% (w/v) PEG MME 2000. b) A single plate crystal of size 0.3 x 0.3 x 0.05
mm3 from 0.1 M sodium acetate pH 4.8, 0.2 M magnesium sulfate and 20% (w/v)
PEG MME 2000, obtained after incubating the protein with 2 mM pyrophosphate.

91
Laboratory, with two passes. The first pass was collected at low intensity using
short exposure time to prevent individual spot overload on the detector at lower
resolutions, and the second pass was collected with higher intensity and longer
exposure time (Fig. 3.4). The frames collected from the two passes were scaled
together and the resolution was cut-off at 1.35 Å during scaling, according to the
criteria I/ ≥ 2.0 for the highest resolution shell. The CgFMNAT-ATP complex
data set at 1.87 Å and the 1.95 Å data set for the substrate ternary complex was
collected in-house with X-ray from a rotating anode generator (Rigaku FRE
SuperBright), recorded on an RAXIS IV++ (Rigaku) image plate detector. All
data were processed with the HKL2000 package203
. Data-collection statistics are
presented in Table 3.1.
The initial phases of all complexes were determined by the molecular
replacement method using the program MolRep204
and the refined apo-
CgFMNAT as the search model. The refinements were performed using
REFMAC189
and manual model building was performed with Coot190
. Refinement
against the 1.35 Å product ternary complex data occurred in two stages in a
similar manner as that for apo-CgFMNAT described in Chapter 2. Anisotropic B-
factors were analyzed by ANISOANL in the CCP4 package181
and PARVATI
server191
. Water molecules were added by PHENIX205
and manually inspected.
The Rwork/Rfree for the final model of ATP binary complex, and substrate and
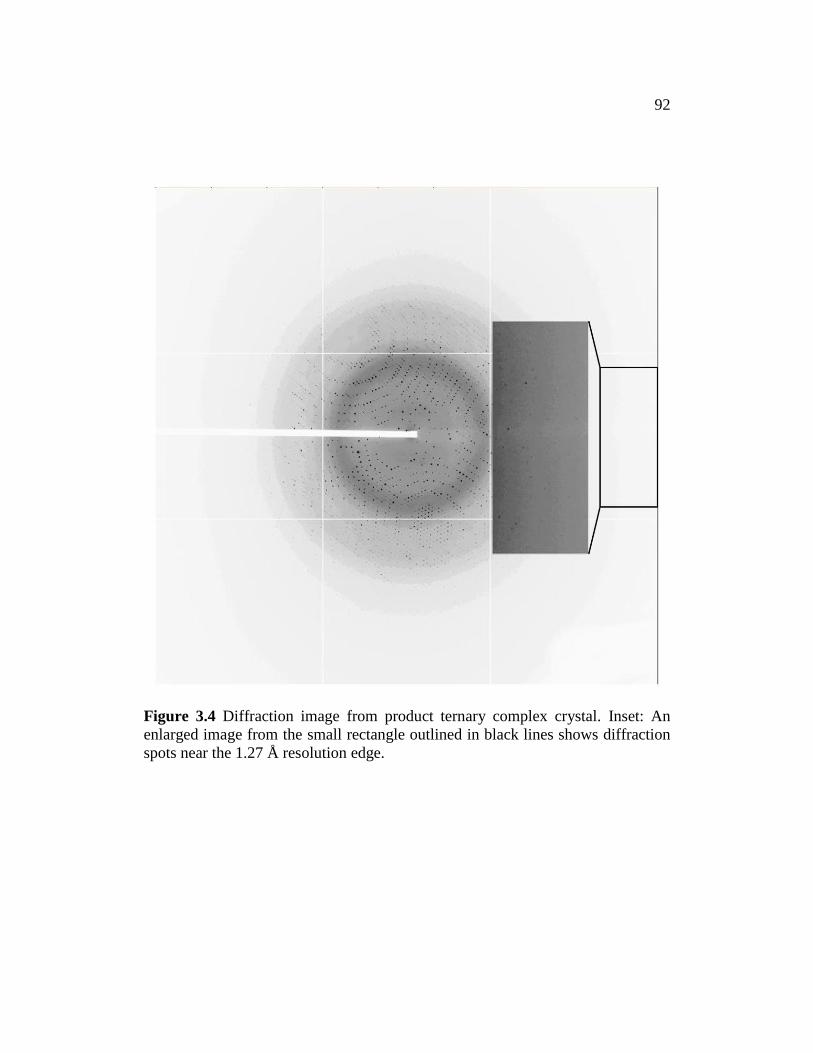
92
Figure 3.4 Diffraction image from product ternary complex crystal. Inset: An
enlarged image from the small rectangle outlined in black lines shows diffraction
spots near the 1.27 Å resolution edge.

93
product ternary complexes are 17.4%/22.2%, 17.5%/23.6% and 15.3%/18.7%,
respectively. The models were assessed by MolProbity192
and complete
refinement statistics are listed in Table 3.1.
All images of structures, ligands, electron density and electrostatic surface
potentials were generated using iPyMol (http://www.pymol.org). The pdb2pqr
server193
was used to generate a pqr file using PARSE atomic radii and charges194
.
Electrostatic surface potentials were calculated using APBS195
plugin for PyMol
using the default settings, with a monovalent cation and anion concentration of
0.15 M and the potential ramped between -5 kT/e (red) and +5 kT/e (blue).
Structure-based alignment was performed using Secondary Structure Matching196
.
Adobe Creative Suite 2 (http://www.adobe.com) was used to label and format
images.

94
Table 3.1. Data Collection and Refinement Statistics
Protein ATP complex Ternary complex with substrates
Ternary complex with products
Space Group/Monomer per Asymmetric Unit
P3221/1 C2/6 C2/6
Data Native Native Native
Wavelength (Å) 1.54178 1.54178 0.97874 Resolution (Å) 50.0-1.87 50.0-1.95 50.0-1.35 Unit cell dimensions a, b, c (Å)
, , (º)
79.79, 79.79, 77.94 90.0, 90.0, 120.0
207.83, 81.75, 136.70 90.0, 129.67, 90.0
206.58, 81.48, 136.60 90.0, 129.79, 90.0
Total no. of reflections 124769 312183 2800906 No. of unique reflections 24161 123738 380943 % Completeness 99.9 (99.6)
a 96.4 (97.1) 100 (99.8)
Rsymb 0.078 (0.549) 0.088 (0.447) 0.077 (0.551)
I/σ 22.0 (2.5) 11.5 (2.1) 35.9 (2.4) Mosaicity (º) 0.7 0.5 0.4 Model Refinement Isotropic Isotropic Anisotropic
e
Resolution range (Å) 50.0-1.87 35.1-1.95 32.2-1.35 Rwork
c (%) 17.4 17.5 15.3
Rfreed (%) 22.2 23.6 18.7
No. of protein atoms 2397 14700 14968 No. of ligand atoms 44 397 417 No. of water molecules 303 1790 1870 Average B-factor (Å
2)
Protein atoms 19.3 18.2 17.1 Ligand atoms 23.5 17.5 15.8 Water molecules 30.8 28.5 30.4 Rmsd bond length (Å) 0.015 0.014 0.014 Rmsd bond angle (º) 1.536 1.458 1.523 Ramachandran Plot % favored region 98.6 98.9 99.1 % allowed region 1.05 1.1 0.9 % outliers 0.35 0.0 0.0
aValues in parenthesis are for highest-resolution shell.
bRsym = hkl [(j (|Ij – <I>|) / jIj ] . <I> is the average for all j measurements of reflection hkl.
cRwork = hkl |Fo – Fc| / hkl |Fo|, where Fo and Fc are the observed and calculated structure factors, respectively.
dR-free calculated from randomly selected 5% reflections that is excluded from refinement for cross-validation.
eSix anisotropic displacement parameters are used for selected atoms, while isotropic B-factors were used for
remaining atoms. Anisotropic displacement parameters were evaluated and assigned using PARVATI and ANISOANL.
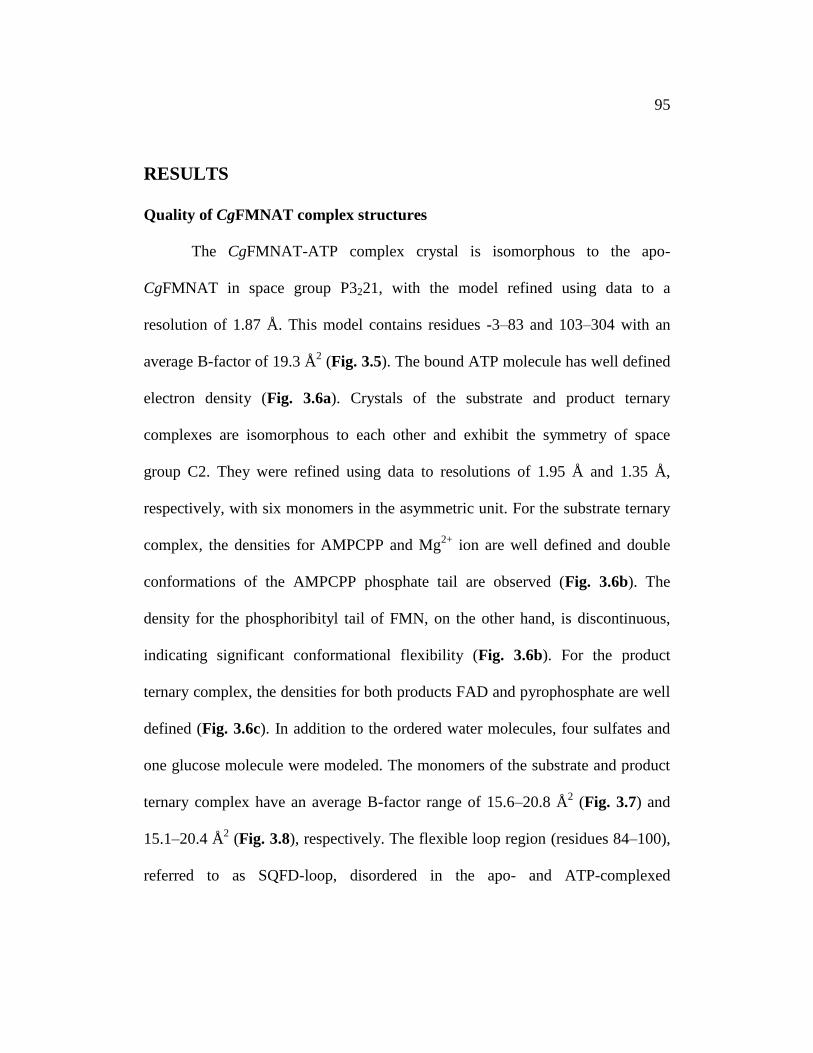
95
RESULTS
Quality of CgFMNAT complex structures
The CgFMNAT-ATP complex crystal is isomorphous to the apo-
CgFMNAT in space group P3221, with the model refined using data to a
resolution of 1.87 Å. This model contains residues -3–83 and 103–304 with an
average B-factor of 19.3 Å2 (Fig. 3.5). The bound ATP molecule has well defined
electron density (Fig. 3.6a). Crystals of the substrate and product ternary
complexes are isomorphous to each other and exhibit the symmetry of space
group C2. They were refined using data to resolutions of 1.95 Å and 1.35 Å,
respectively, with six monomers in the asymmetric unit. For the substrate ternary
complex, the densities for AMPCPP and Mg2+
ion are well defined and double
conformations of the AMPCPP phosphate tail are observed (Fig. 3.6b). The
density for the phosphoribityl tail of FMN, on the other hand, is discontinuous,
indicating significant conformational flexibility (Fig. 3.6b). For the product
ternary complex, the densities for both products FAD and pyrophosphate are well
defined (Fig. 3.6c). In addition to the ordered water molecules, four sulfates and
one glucose molecule were modeled. The monomers of the substrate and product
ternary complex have an average B-factor range of 15.6–20.8 Å2 (Fig. 3.7) and
15.1–20.4 Å2 (Fig. 3.8), respectively. The flexible loop region (residues 84–100),
referred to as SQFD-loop, disordered in the apo- and ATP-complexed
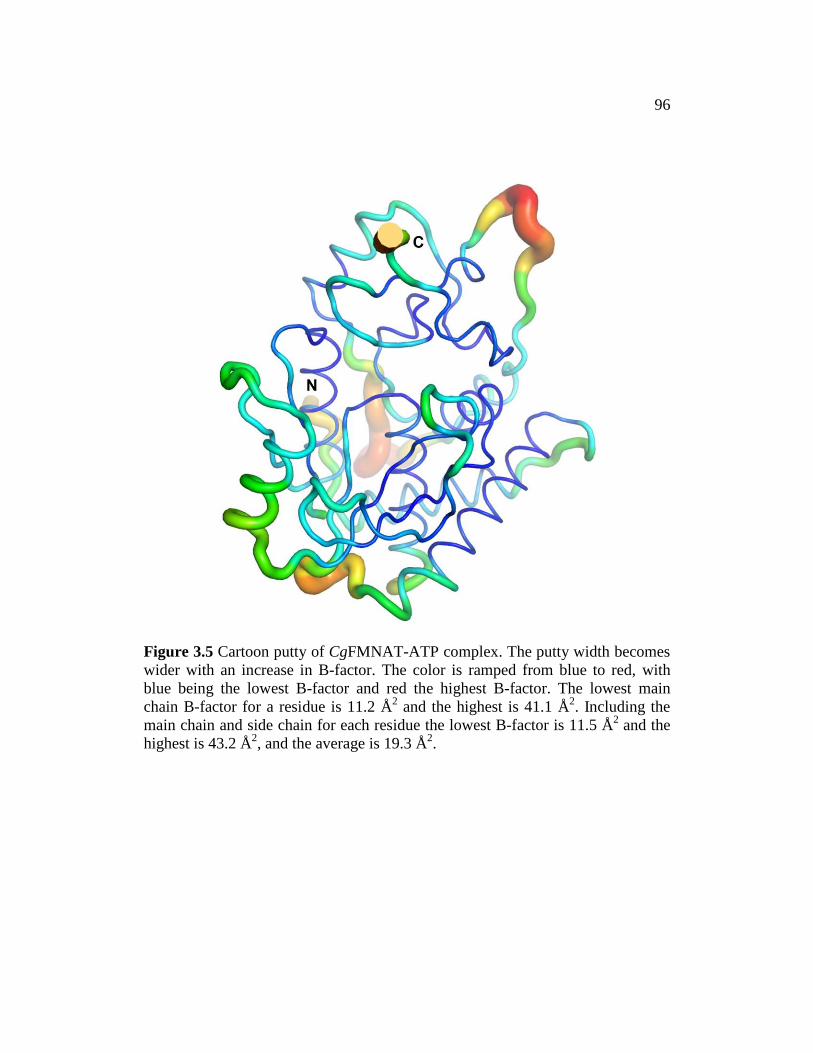
96
Figure 3.5 Cartoon putty of CgFMNAT-ATP complex. The putty width becomes
wider with an increase in B-factor. The color is ramped from blue to red, with
blue being the lowest B-factor and red the highest B-factor. The lowest main
chain B-factor for a residue is 11.2 Å2 and the highest is 41.1 Å
2. Including the
main chain and side chain for each residue the lowest B-factor is 11.5 Å2 and the
highest is 43.2 Å2, and the average is 19.3 Å
2.
97
Figure 3.6 Electron densities of the bound ligands. Simulated-annealing Fo-Fc
omit maps of a) ATP in the binary complex; b) AMPCPP and FMN from the
substrate ternary complex, and c) FAD and PPi from the product ternary complex.
The maps are contoured at 3.0 for a) and c), and 2.5 for b). Atoms are colored
by atom type, carbon atoms of ATP and AMPCPP are colored white, and FMN
and FAD carbon atoms are colored yellow. Magnesium ion is shown as a green
sphere.
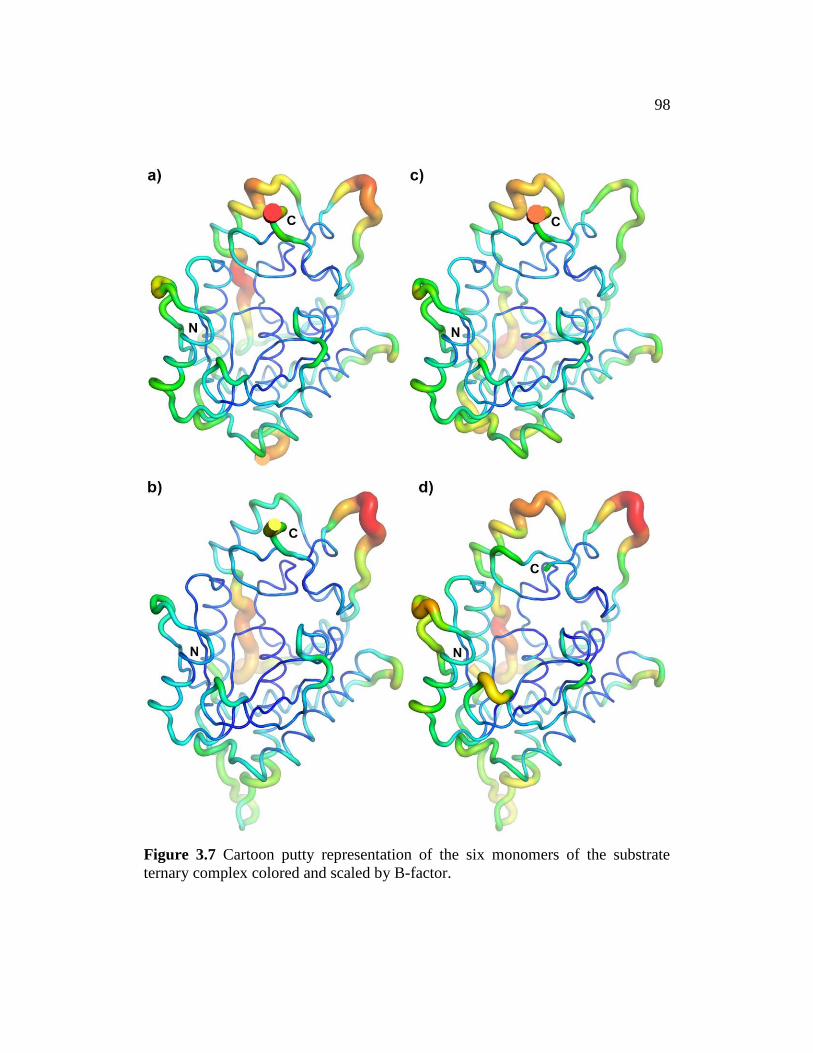
98
Figure 3.7 Cartoon putty representation of the six monomers of the substrate
ternary complex colored and scaled by B-factor.

99
Figure 3.7 (continued) Cartoon putty representation of the six monomers of the
substrate ternary complex colored and scaled by B-factor. The putty width
becomes wider with an increase in B-factor, with blue being the lowest B-factor
and red the highest B-factor. For each monomer the average B-factor is listed first
followed by the lowest and highest B-factor for main chain only, then main chain
and side chain combined. a) Monomer A 15.6 Å2, 6.9/38.2 Å
2 and 6.5/39.8 Å
2. b)
Monomer B 18.7 Å2, 8.2/53.5 Å
2 and 8.5/54.0 Å
2. c) Monomer C 18.1 Å
2,
8.2/40.3 Å2 and 8.3/41.8 Å
2. d) Monomer D 18.4 Å
2, 8.1/42.8 Å
2 and 7.9/43.2 Å
2.
e) Monomer E 20.8 Å2, 10.3/47.7 Å
2 and 10.3/49.0 Å
2. f) Monomer F 17.8 Å
2,
6.3/50.1 Å2 and 6.4/50.5 Å
2.

100
Figure 3.8 Cartoon putty representation of the six monomers of the product
ternary complex colored and scaled by B-factor.
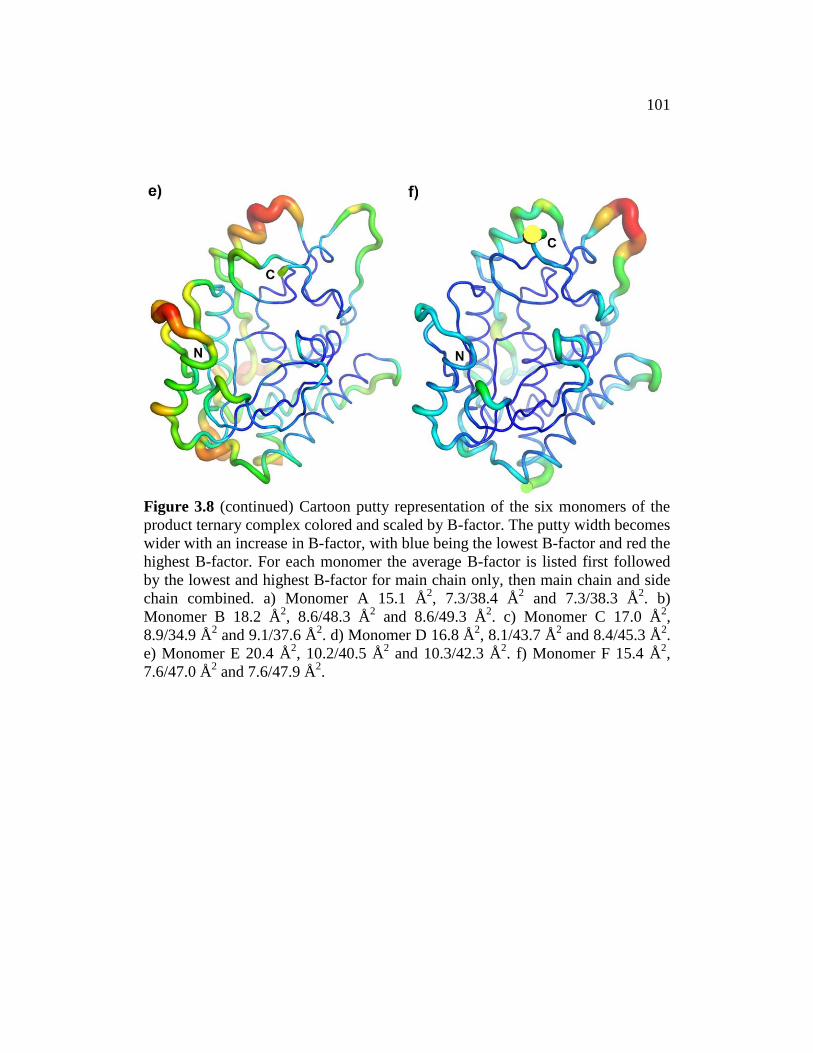
101
Figure 3.8 (continued) Cartoon putty representation of the six monomers of the
product ternary complex colored and scaled by B-factor. The putty width becomes
wider with an increase in B-factor, with blue being the lowest B-factor and red the
highest B-factor. For each monomer the average B-factor is listed first followed
by the lowest and highest B-factor for main chain only, then main chain and side
chain combined. a) Monomer A 15.1 Å2, 7.3/38.4 Å
2 and 7.3/38.3 Å
2. b)
Monomer B 18.2 Å2, 8.6/48.3 Å
2 and 8.6/49.3 Å
2. c) Monomer C 17.0 Å
2,
8.9/34.9 Å2 and 9.1/37.6 Å
2. d) Monomer D 16.8 Å
2, 8.1/43.7 Å
2 and 8.4/45.3 Å
2.
e) Monomer E 20.4 Å2, 10.2/40.5 Å
2 and 10.3/42.3 Å
2. f) Monomer F 15.4 Å
2,
7.6/47.0 Å2 and 7.6/47.9 Å
2.
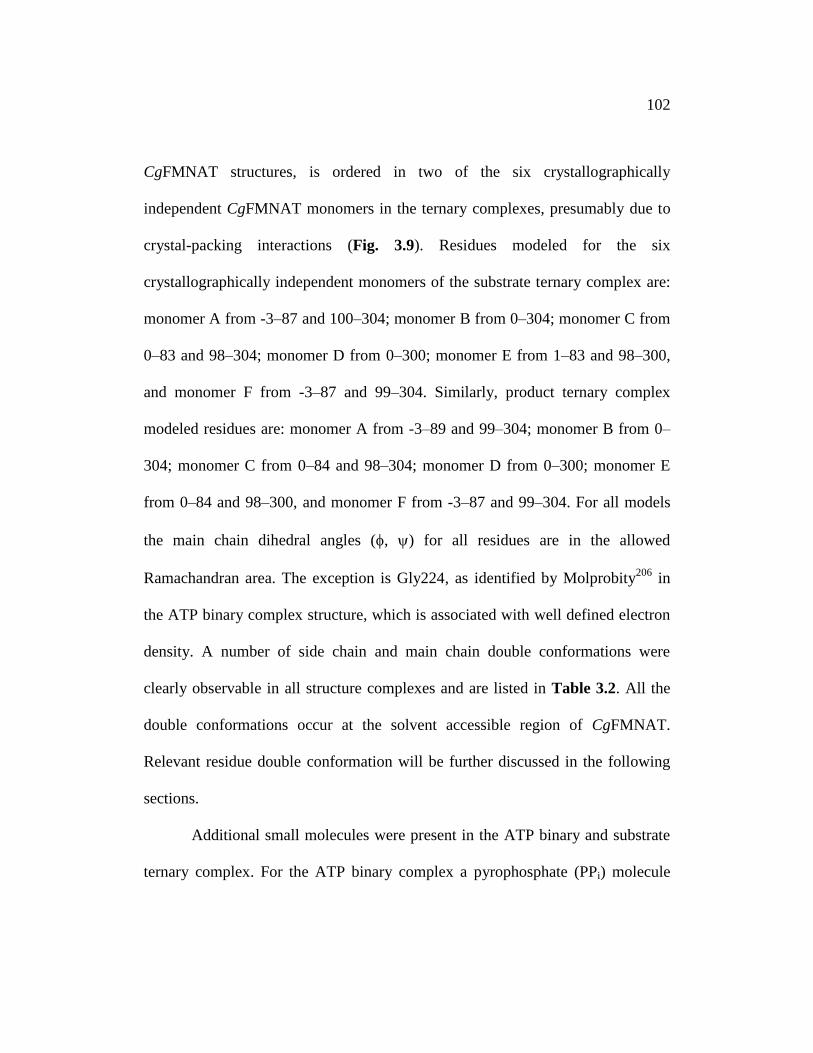
102
CgFMNAT structures, is ordered in two of the six crystallographically
independent CgFMNAT monomers in the ternary complexes, presumably due to
crystal-packing interactions (Fig. 3.9). Residues modeled for the six
crystallographically independent monomers of the substrate ternary complex are:
monomer A from -3–87 and 100–304; monomer B from 0–304; monomer C from
0–83 and 98–304; monomer D from 0–300; monomer E from 1–83 and 98–300,
and monomer F from -3–87 and 99–304. Similarly, product ternary complex
modeled residues are: monomer A from -3–89 and 99–304; monomer B from 0–
304; monomer C from 0–84 and 98–304; monomer D from 0–300; monomer E
from 0–84 and 98–300, and monomer F from -3–87 and 99–304. For all models
the main chain dihedral angles (, ) for all residues are in the allowed
Ramachandran area. The exception is Gly224, as identified by Molprobity206
in
the ATP binary complex structure, which is associated with well defined electron
density. A number of side chain and main chain double conformations were
clearly observable in all structure complexes and are listed in Table 3.2. All the
double conformations occur at the solvent accessible region of CgFMNAT.
Relevant residue double conformation will be further discussed in the following
sections.
Additional small molecules were present in the ATP binary and substrate
ternary complex. For the ATP binary complex a pyrophosphate (PPi) molecule
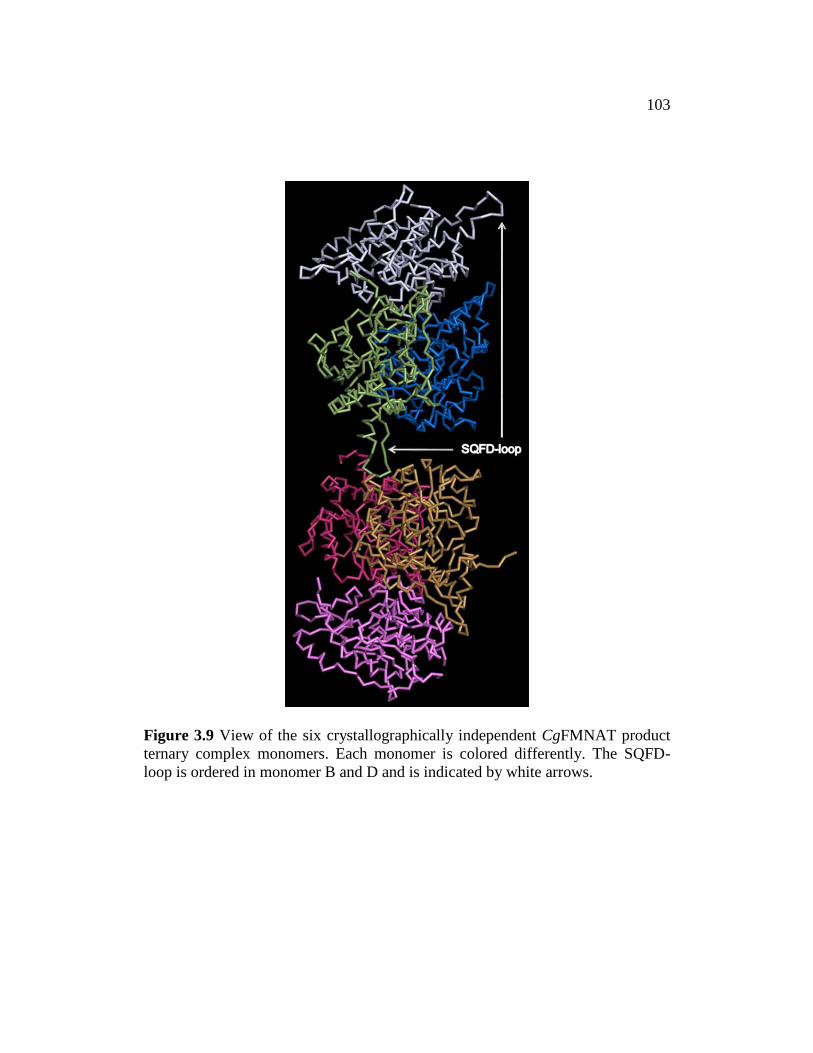
103
Figure 3.9 View of the six crystallographically independent CgFMNAT product
ternary complex monomers. Each monomer is colored differently. The SQFD-
loop is ordered in monomer B and D and is indicated by white arrows.
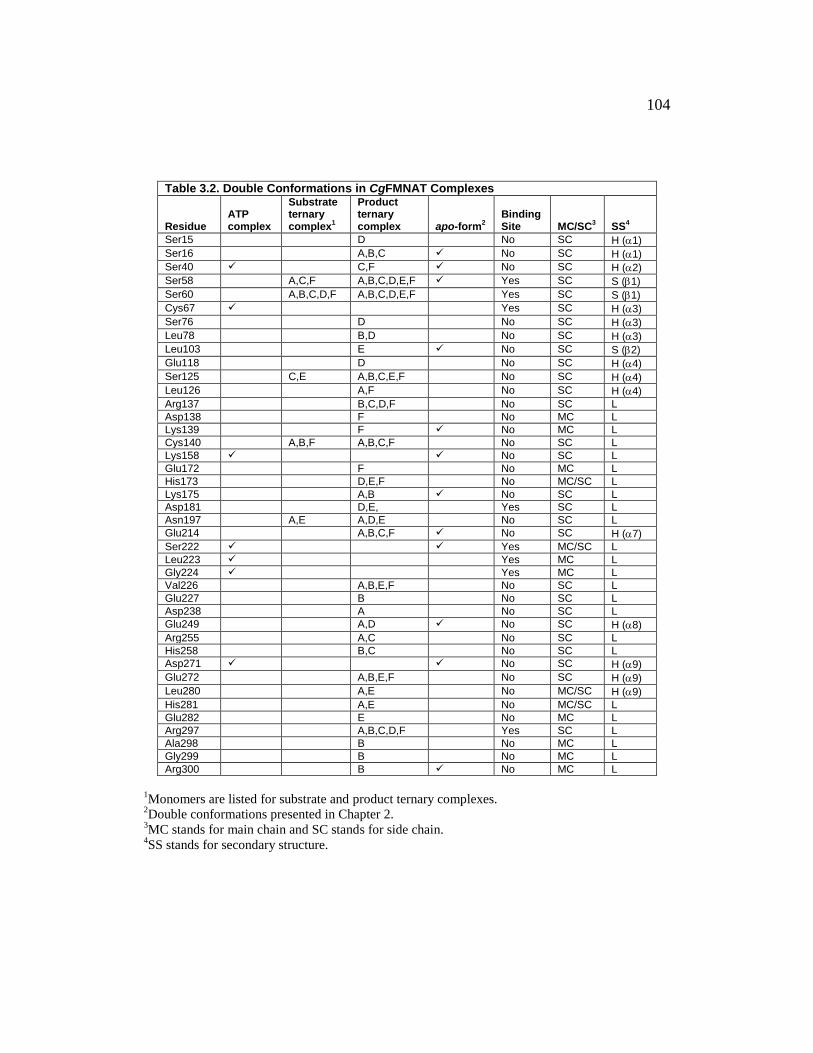
104
Table 3.2. Double Conformations in CgFMNAT Complexes
Residue ATP complex
Substrate ternary complex
1
Product ternary complex apo-form
2 Binding Site MC/SC
3 SS
4
Ser15 D No SC H (1)
Ser16 A,B,C No SC H (1)
Ser40 C,F No SC H (2)
Ser58 A,C,F A,B,C,D,E,F Yes SC S (1)
Ser60 A,B,C,D,F A,B,C,D,E,F Yes SC S (1)
Cys67 Yes SC H (3)
Ser76 D No SC H (3)
Leu78 B,D No SC H (3)
Leu103 E No SC S (2)
Glu118 D No SC H (4)
Ser125 C,E A,B,C,E,F No SC H (4)
Leu126 A,F No SC H (4)
Arg137 B,C,D,F No SC L
Asp138 F No MC L
Lys139 F No MC L
Cys140 A,B,F A,B,C,F No SC L
Lys158 No SC L
Glu172 F No MC L
His173 D,E,F No MC/SC L
Lys175 A,B No SC L
Asp181 D,E, Yes SC L
Asn197 A,E A,D,E No SC L
Glu214 A,B,C,F No SC H (7)
Ser222 Yes MC/SC L
Leu223 Yes MC L
Gly224 Yes MC L
Val226 A,B,E,F No SC L
Glu227 B No SC L
Asp238 A No SC L
Glu249 A,D No SC H (8)
Arg255 A,C No SC L
His258 B,C No SC L
Asp271 No SC H (9)
Glu272 A,B,E,F No SC H (9)
Leu280 A,E No MC/SC H (9)
His281 A,E No MC/SC L
Glu282 E No MC L
Arg297 A,B,C,D,F Yes SC L
Ala298 B No MC L
Gly299 B No MC L
Arg300 B No MC L
1Monomers are listed for substrate and product ternary complexes.
2Double conformations presented in Chapter 2.
3MC stands for main chain and SC stands for side chain.
4SS stands for secondary structure.

105
molecule and an acetate molecule were modeled. For the substrate ternary
complex a sulfate molecule was modeled. The presence of PPi in the ATP binary
complex is possibly derived from hydrolysis of ATP. Determination of the
identities of the small molecules was based on known components from the
crystallization solution fitting to the electron density and neighboring interactions.
Comparison of CgFMNAT complex structures
Superposition of the equivalent C backbones of monomers B through F
to monomer A of the substrate ternary complex gives a pair-wise root mean
square deviation (rmsd) of 0.40 Å, 0.39 Å, 0.50 Å, 0.46 Å and 0.30 Å; and
monomers B through F to monomer A of the product ternary complex gives 0.51
Å, 0.40 Å, 0.49 Å, 0.46 Å and 0.27 Å (Fig. 3.10), indicating the monomers in the
asymmetric unit are identical to each other. A closer examination of these
superpositions reveals conformational flexibility in loop regions, such as the
SQFD-loop and near the C-terminus. The last five residues in monomer D and E
of both ternary complexes are disordered and not modeled. Superposition of the
equivalent C backbones of apo-protein, ATP binary complex and substrate
ternary complex (monomer C) to product ternary complex (monomer B) gives a
pair-wise rmsd of 0.42 Å, 0.41 Å, and 0.27 Å, respectively, also indicating no
substantial global conformational changes among different structural states of
CgFMNAT (Fig. 3.11).
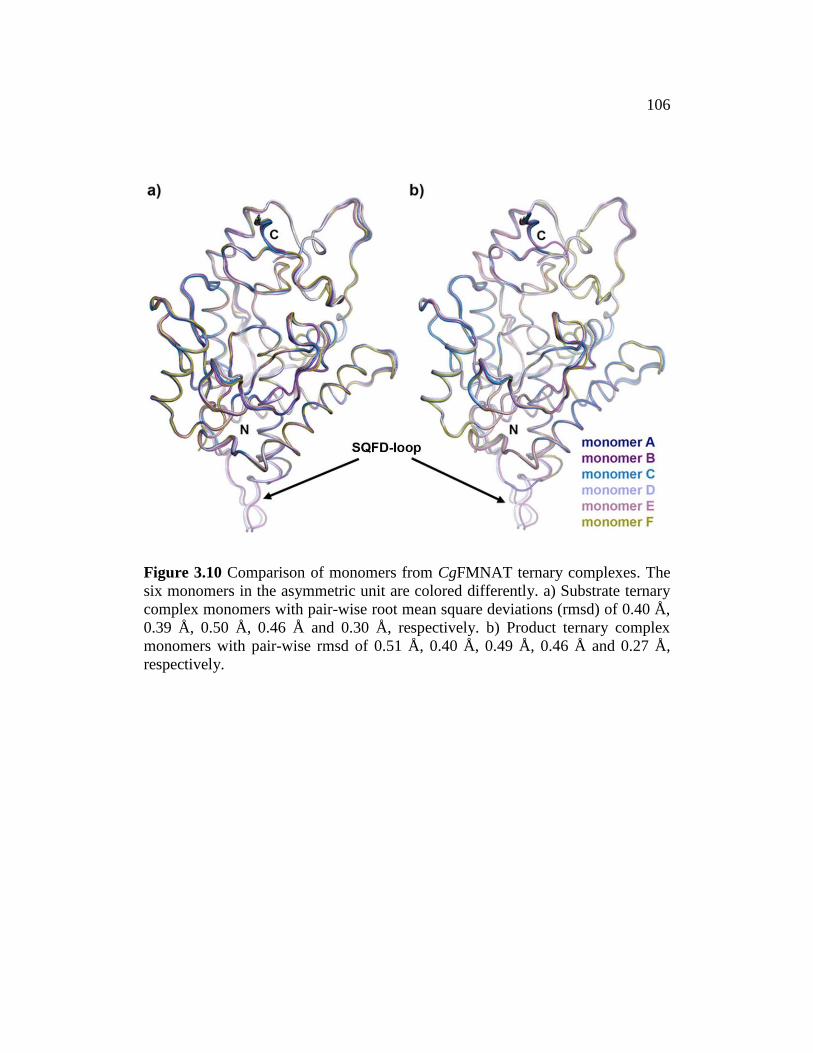
106
Figure 3.10 Comparison of monomers from CgFMNAT ternary complexes. The
six monomers in the asymmetric unit are colored differently. a) Substrate ternary
complex monomers with pair-wise root mean square deviations (rmsd) of 0.40 Å,
0.39 Å, 0.50 Å, 0.46 Å and 0.30 Å, respectively. b) Product ternary complex
monomers with pair-wise rmsd of 0.51 Å, 0.40 Å, 0.49 Å, 0.46 Å and 0.27 Å,
respectively.
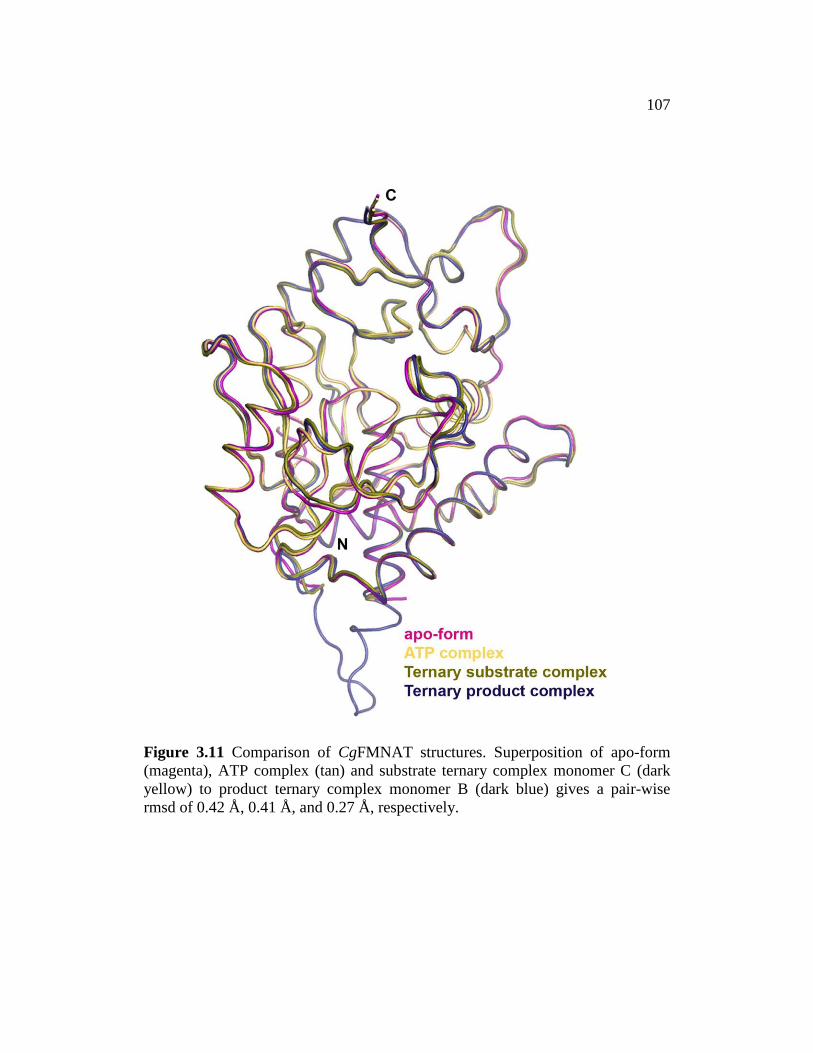
107
Figure 3.11 Comparison of CgFMNAT structures. Superposition of apo-form
(magenta), ATP complex (tan) and substrate ternary complex monomer C (dark
yellow) to product ternary complex monomer B (dark blue) gives a pair-wise
rmsd of 0.42 Å, 0.41 Å, and 0.27 Å, respectively.

108
A majority of the loop regions that display conformational changes in the
superposition, tend to have higher B-factors, as shown with the B-factor putty
(Fig. 2.7, 3.5, 3.7, and 3.8). Examples include the loop connecting 1 to 2, part
of the SQFP-loop and the loops of the C-terminal domain. Additional regions that
have higher B-factors, but do not show conformational changes from the
superposition, are helix 5 and 9. Most of these observations are consistent
across the different space groups, as well as between monomers of the same and
different ternary complexes. Given the resolution for each structural state of
CgFMNAT, the B-factors may correlate to conformational flexibility, thus
providing more information on the structure of CgFMNAT.
The loop connecting helix 3 to strand 2 is referred to as the SQFD-loop
due to the conserved sequence SQFD in Saccharomycetaceae family of yeasts
including C. glabrata and S. cerevisiae207,208
. This loop is disordered in the apo-
and ATP-CgFMNAT binary complex structures (Fig. 3.11), but becomes ordered
in two of the six crystallographically independent monomers in the ternary
complexes (Fig. 3.10). The tip of each loop containing the SQFD sequence packs
inside a cavity that is formed in part by helix 3 and portions of the SQFD-loop
of an adjacent monomer (Fig. 3.12a). The nature of the packing leads to the
burying of the SQFD hydrophobic residue Phe91 from the solvent, and formation
of intramolecular and intermolecular hydrogen bonds within the ordered loop and

109
with the adjacent monomer, respectively (Fig. 3.12a and b). In retrospect, the
cavity is present in all CgFMNAT structures with a disordered SQFD-loop,
therefore the formation of the interactions leading to an ordered SQFD-loop are
presumably due to crystal-packing.
Although the superposition of the equivalent C backbones of apo-form,
ATP binary complex and ternary complexes reveal no significant conformational
changes beyond loop flexibility, inspection of the molecular surfaces and
electrostatic potentials provides additional details. Orienting the C-terminal
domain as in Chapter 2 for the apo-form (Fig. 2.10) reveals variations of the
negatively charged pocket, with the exception of the ATP binary complex (Fig.
3.13), which is the same as the apo-CgFMNAT. In particular, the pocket opening
increases for five of the independently modeled six monomers of the substrate and
product ternary complexes (Fig. 3.14 and 3.15). Additionally, in the product
ternary complex the area of the positive surface potential reduces and a negative
surface potential develops, with the two charged surfaces separated by the
formation of a neutral surface potential (Fig. 3.15). Evaluation of the
superposition indicates side chain conformational change and loop flexibility
alters the width and surface potentials of the pocket (Fig. 3.16). It is notable that
these changes are specific for different states of CgFMNAT (apo-form and
ternary complexes) and are not artifacts of crystallization. Therefore, these
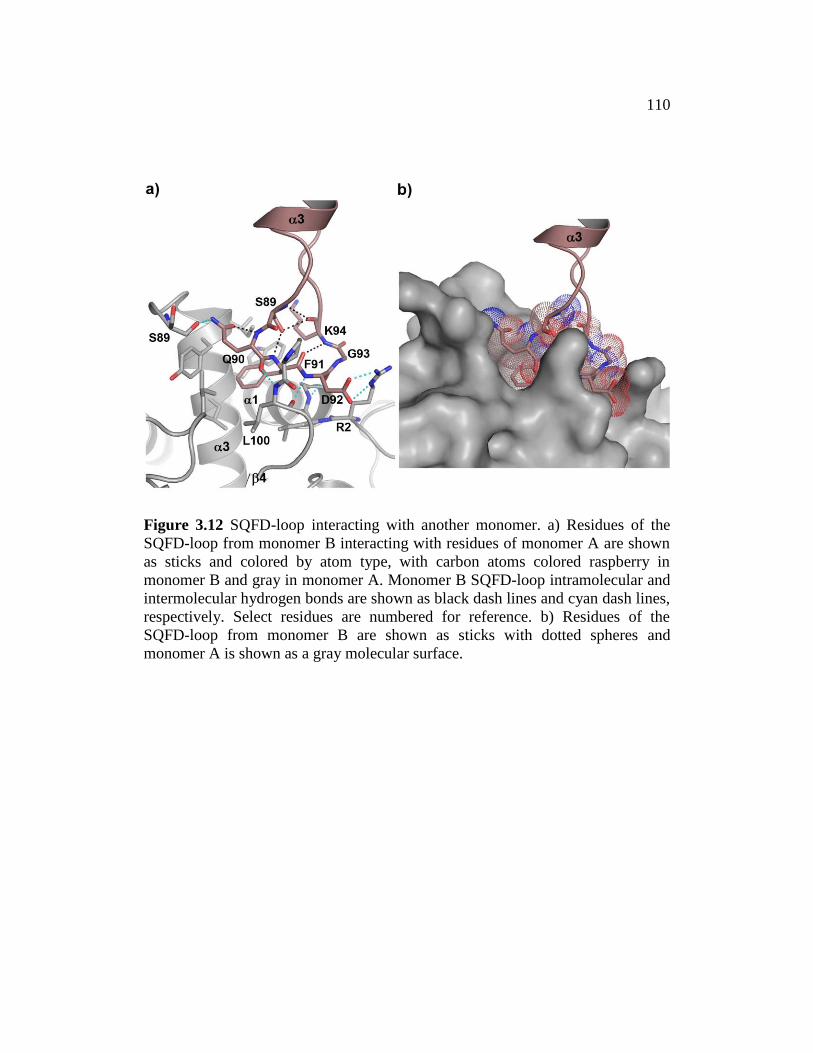
110
Figure 3.12 SQFD-loop interacting with another monomer. a) Residues of the
SQFD-loop from monomer B interacting with residues of monomer A are shown
as sticks and colored by atom type, with carbon atoms colored raspberry in
monomer B and gray in monomer A. Monomer B SQFD-loop intramolecular and
intermolecular hydrogen bonds are shown as black dash lines and cyan dash lines,
respectively. Select residues are numbered for reference. b) Residues of the
SQFD-loop from monomer B are shown as sticks with dotted spheres and
monomer A is shown as a gray molecular surface.
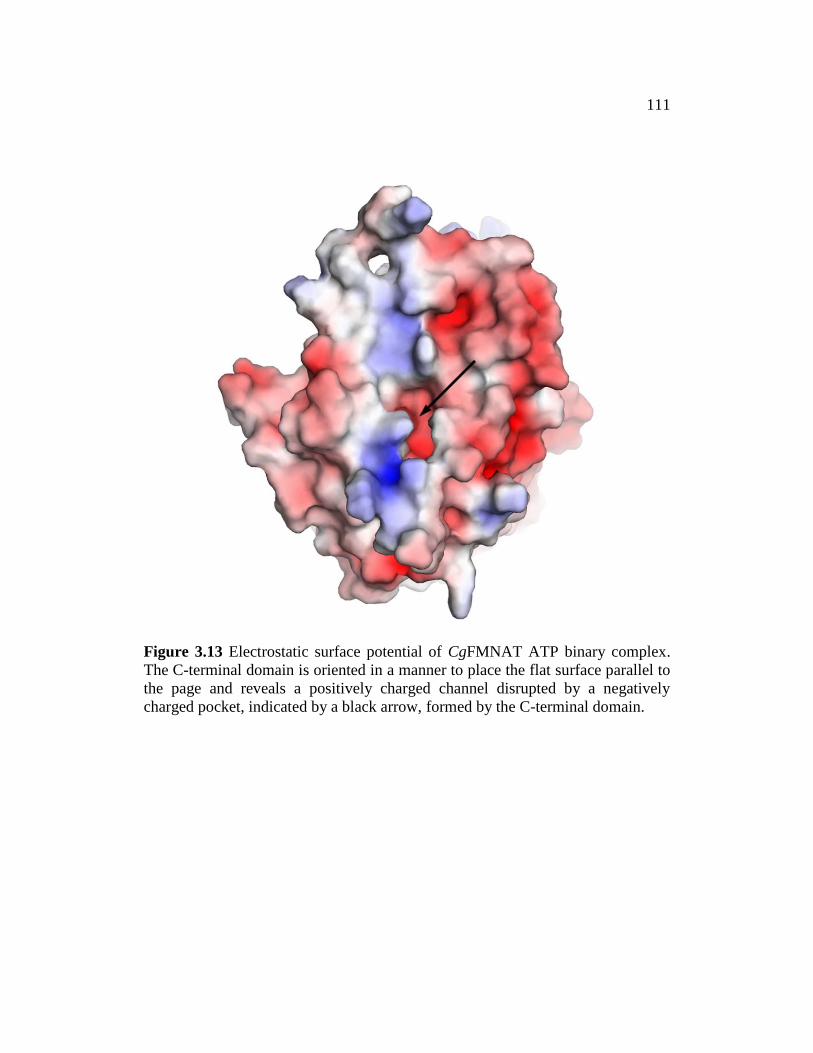
111
Figure 3.13 Electrostatic surface potential of CgFMNAT ATP binary complex.
The C-terminal domain is oriented in a manner to place the flat surface parallel to
the page and reveals a positively charged channel disrupted by a negatively
charged pocket, indicated by a black arrow, formed by the C-terminal domain.
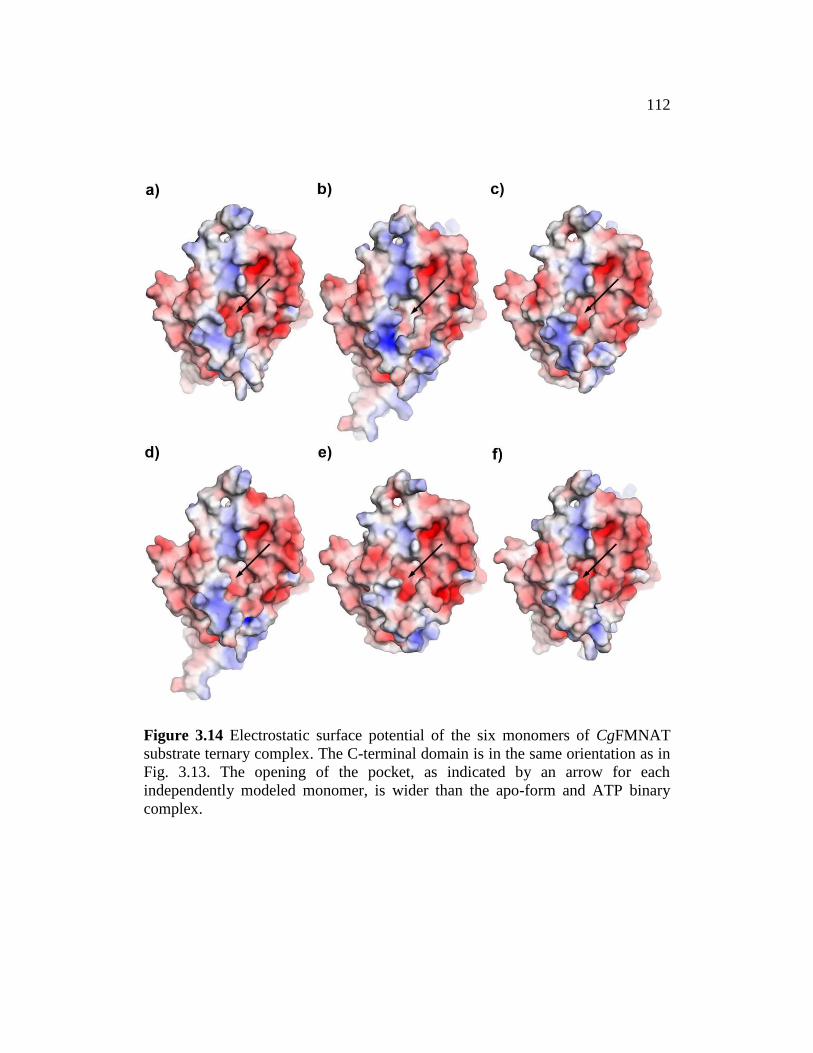
112
Figure 3.14 Electrostatic surface potential of the six monomers of CgFMNAT
substrate ternary complex. The C-terminal domain is in the same orientation as in
Fig. 3.13. The opening of the pocket, as indicated by an arrow for each
independently modeled monomer, is wider than the apo-form and ATP binary
complex.

113
Figure 3.15 Electrostatic surface potential of the six monomers of CgFMNAT
product ternary complex. The C-terminal domain is in the same orientation as in
Fig. 3.13. The opening of the pocket, as indicated by an arrow for each
independently modeled monomer, is similar to the substrate ternary complex.

114
Figure 3.16 Comparison of CgFMNAT C-terminal domains. Superposition of
apo-form (magenta), ATP complex (tan) and substrate ternary complex monomer
C (dark yellow) to product ternary complex monomer B (dark blue) provides
insight into the variation of the pocket size and charge. The pocket size and
charge are affected by loop flexibility and side chain conformation.
115
changes could potentially be relevant to the biological function of CgFMNAT as
the pocket is on the opposite side of the substrate binding site.
Substrate binary and ternary complexes - ATP binding site
The structures of the CgFMNAT-ATP binary complex and the substrate
ternary complex reveal details about the interactions between the enzyme and the
substrates. Five structural motifs are identified to be involved in ATP and Mg2+
binding (Fig. 3.17). As discussed in the previous chapter, the PP-loop motif,
extending from 1 to the N-terminus of 3, has the sequence of 60
SYNGGKDC67
and is generally conserved in the superfamily142
. The ADE motif, named for
ADEnine binding, corresponds to the LDTG motif in APS reductase138
and
consists of a short stretch of four residues, 107
FIDH110, following strand 2. The
first arginine-containing ARG1 motif (named Arg-loop in ref. 136) is located in
the loop connecting 4 to 5 and consists of residues 163
GIRHTD168. The
complexes further highlighted two additional nucleotide binding motifs. The -
phosphate motif encompasses part of 7 and the following hairpin loop from the
C-terminal domain situated above the nucleotide binding site. Near the C-
terminus of the protein, another arginine-rich motif, ARG2, of sequence
296ERAGR300 is also involved in nucleotide binding.
With the substrate ternary complex obtained in the presence of Mg2+
providing more information about the nucleotide binding site than the Mg2+
-free
116
ATP binary complex, the binding site will be discussed mostly in the context of
the ternary complex and compared to ATP binary complex (Fig. 3.18a). For
simplicity, the AMPCPP phosphoryl groups will be referred to as -, - and -
phosphates. The AMPCPP nucleotide adopts an anti-conformation with a 3’-endo
ribose pucker, and lies in the crevice formed by 1 and 4, with its -phosphate
tail positioned in the anion-binding pocket near the N-terminus of 3 (Fig. 3.18b
and Fig. 3.19a and b). A different configuration of the -phosphate tail is
observed in the ATP binary complex, which remains positioned in the same anion
pocket (Fig. 3.18a). In the apo-CgFMNAT structure a chloride ion, presumably
recruited from the crystallization medium, occupies this pocket (Fig. 3.18c). A
hydrogen-bond network is formed between AMPCPP and residues from four of
the six motifs (Fig. 3.18b), that include the PP-loop, ADE, ARG1, and -
phosphate motifs. The adenine N1 nitrogen and N6 amino groups are hydrogen
bonded to the main chain amide and carbonyl of Ile108 (part of the ADE motif),
respectively. The N3 of adenine forms a hydrogen bond to the side chain of Ser60
of the PP-loop motif, while the O2’ hydroxyl of AMPCPP ribose interacts with
the main chain carbonyl and an alternate side chain conformation of Ser60. The
O2’ hydroxyl forms another hydrogen bond with the main chain amide of Gly163
of the ARG1 motif, which no longer has double conformations upon nucleotide
binding. The phosphates of AMPCPP interact extensively with the PP-loop motif.

117
Figure 3.17 Ribbon diagram of CgFMNAT in complex with the products FAD,
PPi, and Mg2+
. Secondary structure elements are labeled. Structure motifs
involved in substrate binding and catalysis are labeled and highlighted with
different colors. In dark blue is PP-loop, forest green is ADE motif, magenta is
ARG1 motif, red is -phosphate motif and brown is the flavin motif. The
magnesium ion is shown as a green sphere.

118
Figure 3.18 Substrate binding site in ATP binary and substrate ternary
complexes. a) Details of the ATP-binding site. b) The catalytically competent
Mg2+
-AMPCPP conformer I shown. c) Superposition of the bound chloride ion
(dark green sphere) in apo-CgFMNAT to ATP. d) Details of FMN binding site.
The Mg2+
ion is shown as a green sphere and water ligands are shown as red
spheres. Hydrogen bonds are shown as dash lines and metal ligand interactions
are shown as solid lines.

119
Figure 3.19 Electrostatic surface potential of the substrate binding site. Two
views of the binding site electrostatic potential are presented for substrate ternary
complex in a) and b), and for product ternary complex in c) and d). Substrates and
products are shown as sticks. For a) and b), FMN and AMPCPP are colored by
atom type with carbon atoms colored cyan for AMPCPP and yellow for FMN. For
c) and d), FAD and PPi are colored by atom type with carbon atoms colored
yellow for FAD. The Mg2+
ion is shown as a green sphere.

120
through both main chain and side chain moieties. The -phosphate interacts with
the side chain of Asn62, the -phosphate interacts with the main chain amide of
Cys67 and the -phosphate forms two hydrogen bonds to the side chain of Lys65.
Despite the different configuration of the triphosphate tail in the ATP binary
complex, interactions with Asn62 and Lys65 are maintained (Fig. 3.18a).
Additionally, the -phosphate forms additional hydrogen bonds with the hydroxyl
of Tyr216 and Leu223 main chain amide. Both residues are from the -phosphate
motif (Fig. 3.18b).
In the presence of magnesium ions, as in the case of the substrate ternary
complex, the AMPCPP phosphate tail adopts two distinct conformations
(conformer I and II, Fig. 3.6b and Fig. 3.20a and b), both of which differ from
that observed in the Mg2+
-free ATP binary complex structure (Fig. 3.21). Among
the six CgFMNAT substrate ternary complexes in the asymmetric unit, three
contain the bound AMPCPP in conformer I (chain C, D, E), two in conformer II
(chain B and F), and one (chain A) in double conformations. In the first
conformer, the Mg2+
is liganded to the - and -phosphate oxygens, the Asp66
side chain carboxyl and three conserved water molecules, w2, w3, and w4 (Fig.
3.18b). W2 and w3 are further coordinated to the carboxylate group of Asp168 of
the ARG1 motif. In the second conformer, all three AMPCPP phosphoryl
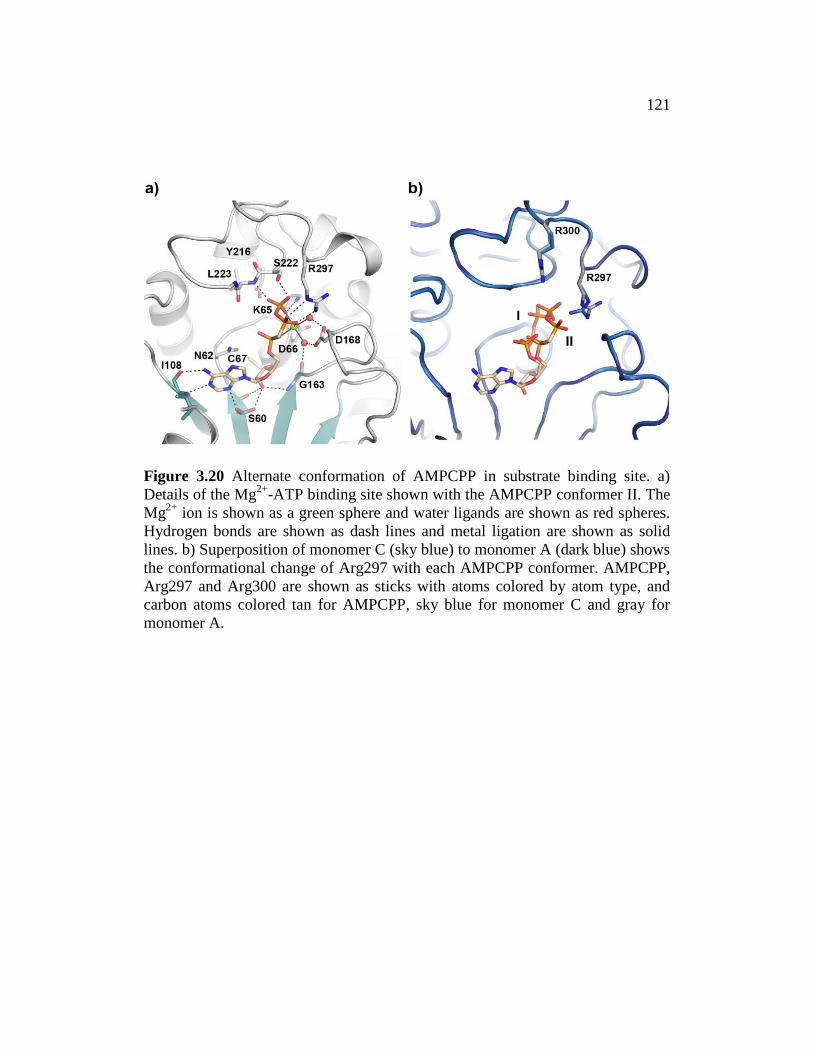
121
Figure 3.20 Alternate conformation of AMPCPP in substrate binding site. a)
Details of the Mg2+
-ATP binding site shown with the AMPCPP conformer II. The
Mg2+
ion is shown as a green sphere and water ligands are shown as red spheres.
Hydrogen bonds are shown as dash lines and metal ligation are shown as solid
lines. b) Superposition of monomer C (sky blue) to monomer A (dark blue) shows
the conformational change of Arg297 with each AMPCPP conformer. AMPCPP,
Arg297 and Arg300 are shown as sticks with atoms colored by atom type, and
carbon atoms colored tan for AMPCPP, sky blue for monomer C and gray for
monomer A.
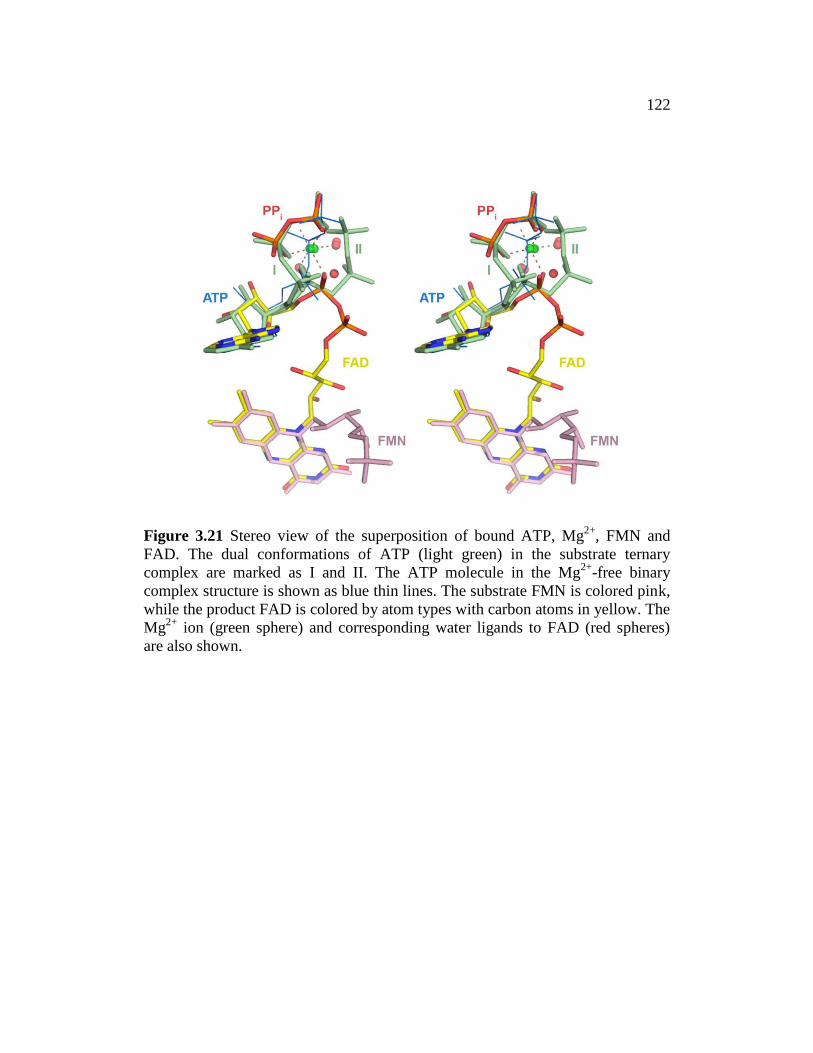
122
Figure 3.21 Stereo view of the superposition of bound ATP, Mg2+
, FMN and
FAD. The dual conformations of ATP (light green) in the substrate ternary
complex are marked as I and II. The ATP molecule in the Mg2+
-free binary
complex structure is shown as blue thin lines. The substrate FMN is colored pink,
while the product FAD is colored by atom types with carbon atoms in yellow. The
Mg2+
ion (green sphere) and corresponding water ligands to FAD (red spheres)
are also shown.

123
moieties are coordinated to the Mg2+
ion, with the -phosphate oxygen
substituting the w4 water ligand. The -phosphate in this conformation also
interacts with Arg279 of the ARG2 motif through two hydrogen bonds (Fig.
3.20a), which doesn’t occur for conformer I. The largest difference between these
AMPCPP conformations is in the position of the -phosphate, which moves 5.1 Å
between conformer I and II, while the - and -phosphates move 1.6 Å and 2.2 Å,
respectively. In both conformers, the bound Mg2+
ion remains in the same
position and maintains a six-ligand octahedral configuration (Fig. 3.21). In the
Mg2+
-free ATP binary complex structure, the position of the -phosphate largely
overlaps with the Mg2+
binding site (Fig. 3.21). Since AMPCPP is an analog of
ATP, it is reasonable to consider AMPCPP conformer I and II as representatives
of ATP conformations, and therefore the substrate ternary complex defines the
Mg2+
ATP binding site. From the two conformers, the Mg2+
ATP conformer I is
more relevant as discussed below.
Substrate ternary complex - Flavin binding site
Unexpectedly, the flavin-binding site, as revealed in the ternary substrate
complex, is located on the same side of the central -sheet as the adenosine
moiety of AMPCPP, where a deep trough is formed between the face of the -
sheet, helix 5, and the loop connecting the anti-parallel 5 to 6 (Fig. 3.18d and
124
3.19b). This pocket forms a unique binding site for the flavin isoalloxazine ring
different from that observed in any other FMN- or FAD-binding protein209
.
Residues from a broad range of structural elements are involved in the interaction
with the isoalloxazine ring (Fig. 3.17 and 3.18d). These include Met143 and
Phe147 from helix 5, Ile160 to Ile162 from strand 4; Asp181, Trp184 and
Phe187 from the loop connecting 5 to 6, and Arg189 from strand 6. These
residues are highly conserved among eukaryotic FMNATs (Fig. 3.22) and are
collectively referred to as the Flavin motif. The isoalloxazine ring is sandwiched
between the indole ring of Trp184 and the planar guanidinium group of Arg189
(Fig. 3.18d). Deeply buried in the flavin-binding pocket is the hydrophobic
dimethylbenzene moiety of the isoalloxazine ring, forming van der Waals
contacts with hydrophobic side chains of Met143, Phe147, Ile160, Ile162, and
Phe187 (Fig. 3.18d). The hydrophilic lumazine side of the ring forms two specific
hydrogen bonds with the enzyme, between its C4 carbonyl and the main chain
amide of Asp181, and between its N3 amide and the side chain of Asp 181,
respectively. The isoalloxazine group is also in van der Waals contact with the
adenosine moiety of AMPCPP (Fig. 3.21).
In contrast to the extensive interactions with the isoalloxazine ring, there
are few contacts between the enzyme and the FMN phosphoribityl tail (Fig.
3.18d). As a result, the conformation of this part of the substrate is not well

125

126
Figure 3.22 Multiple sequence alignment of eukaryotic FMNATs. The residue numbers and secondary structure
elements of CgFMNAT are marked at the top and bottom of the alignment, respectively. Each sequence is
labeled by the gi number, species name abbreviation, and common species name. The first and last residues of
each sequence are numbered at the beginning and end, with numbers in parentheses indicating residues not
shown and total number of residues in brackets. Structural motifs of CgFMNAT are boxed. Residues involved in
substrate/product interaction are indicated by asterisks (). Glycine and proline residues are in red; conserved
glycine, proline and charged/polar residues are highlighted in gray and conserved hydrophobic/aromatic residues
in yellow. Abbreviation of species name is as follow: Cg, Candida glabrata; Sc, Saccharomyces cerevisiae; Af,
Aspergillus fumigates; Sp, Schizosaccharomyces pombe; Hs, Homo sapiens; Cf, Canis familiaris; Mm, Mus
musculus; Dr, Danio rerio; Ce, Caenorhabditis elegans; Dm, Drosophila melanogaster; Tb, Trypanosoma
brucei; Pf, Plasmodium falciparum and At, Arabidopsis thaliana. Sequence alignment was constructed by
PROMALS177
and manually modified.

127
defined as indicated by the high B-factors, partial occupancy, and discontinuous
density (Fig. 3.6b). In five of the six monomers in the asymmetric unit, FMN
phosphoribityl tail is seen pointing toward the solvent, away from the bound
AMPCPP, probably due to electrostatic repulsion, and is positioned over the N-
terminal end of helix 5 (Fig. 3.18b and 3.19a and b). This observed
conformation of FMN is apparently not in the catalytically ready state, as the
phosphate is too far from the bound AMPCPP. Clearly the flexibility of FMN
phosphoribityl tail would allow it to adopt multiple conformations and to move
close to the ATP so that the adenylyltransferase reaction could occur. An
alternative position of the FMN phosphoribityl tail is observed and modeled based
on the observed density in monomer E and is within hydrogen bond distance to
Arg297 (Fig. 3.23). The position of the FMN phosphoribityl tail seems to be
energetically unfavorable as only one monomer adopts this conformation and the
density is not as well defined as the previously described FMN conformation.
These observations illustrate the considerable conformational flexibility of the
phosphoribityl tail of FMN in the binding site that allows it to move close to the
ATP.
Product ternary complex
The product ternary complex is formed between CgFMNAT and FAD
plus PPi (Fig. 3.24). Comparing the substrate and product ternary complexes,

128
Figure 3.23 Alternate conformation of FMN. A 2Fo-Fc electron density map
(blue) contoured at 1.0 is shown for the substrates in monomer E. The alternate
FMN conformation allows the phosphoryl group of FMN to hydrogen bond with
Arg297. The Mg2+
ion is shown as a green sphere and water ligands are shown as
red spheres. Hydrogen bonds are shown as dash lines and ionic interactions are
shown as solid lines.

129
the positions of the isoalloxazine ring of the flavin and the adenosine moieties of
the nucleotides remain essentially unchanged (Fig. 3.21). The isoalloxazine group
is in van der Waals contact with the adenosine moiety of either AMPCPP or FAD,
suggesting that the adenosine group is part of the isoalloxazine-binding pocket
(Fig. 3.21). The phosphoribityl of the product FAD becomes well ordered when
covalently linked to the adenylyl group of ATP (Fig. 3.6c). The position of the
PPi product is also well defined in the crystal structure and is identical to that of
the -phosphates of AMPCPP in conformer I (Fig. 3.21). The Mg2+
ion in the
product ternary complex is coordinated to the PPi, the adenylyl phosphate of
FAD, Asp66 and two water molecules in a configuration with features of both
AMPCPP conformers in the substrate ternary complex (Fig. 3.21 and 3.24).
Arg297 from the C-terminal ARG2 motif is found to interact with the diphosphate
moiety of FAD (Fig. 3.24) supporting its potential involvement in binding the
phosphate groups of both ATP and FMN substrates, and positioning them for the
adenylyl transfer reaction.
Superposition of the equivalent C backbones of monomers from the
substrate and product ternary complexes shows alternate conformations of the
ARG2 motif located at the C-terminus in two of the six monomers (Fig. 3.10a
and b). Interestingly, this alternate conformation causes the last five residues to
become disordered. Examination of the region from the product ternary complex

130
Figure 3.24 Stereo view of the FAD binding site. Protein residues interacting
with bound ligands are shown as sticks. The Mg2+
ion is shown as a green sphere,
and its two water ligands are shown as red spheres. Metal ligand and hydrogen
bonds are shown as dashed lines.
131
indicates the diphosphate moiety of FAD interacts with Arg300 through a
hydrogen bond and Arg297 is displaced and unable to interact with FAD (Fig.
3.25). Since, the alternate conformation is exhibited in the different ternary
complexes Arg300 could also be involved in positioning the phosphate of FMN
closer to ATP prior to catalysis.
Local conformational changes in different CgFMNAT states
With four different structural states of CgFMNAT providing snapshots of
the subtle conformational changes before and after the catalytic process, we have
gained first insights into the mechanics of substrate binding and product
interaction. At the beginning, binding of ATP causes the nucleotide binding
pocket to undergo subtle conformational changes, such that, the PP-loop Ser 60,
Asn62 and Lys65 form hydrogen bonds with the nucleotide, and Asp66 and
Cys67 reposition to avoid clashing with ATP (Fig. 3.26a). A notable feature of
the PP-loop is Cys67 adopting double conformations, which causes Tyr61 to shift
away with a rotation of the side chain to avoid clashes with the thiol of Cys67
(Fig. 3.26a). Other changes include Ile108 from the ADE motif to accommodate
the adenine of ATP and Asp168 from the ARG1 motif that moves toward ATP.
Ser222 from the -phosphate motif and Cys67 both adopt double conformations in
the ATP binary complex, but not in the substrate ternary complex (Table 3.2 and
Fig. 3.26a).

132
Figure 3.25 Alternate conformation of the C-terminal end. Superposition of
product ternary complex monomer D (forest green) to monomer B (raspberry)
illustrates the rearrangement of Arg297 and Arg300 interactions with product
FAD, which is colored by atom type with carbon atoms colored yellow and
hydrogen bonds are shown as dash lines.

133
Figure 3.26 Binding site residue motion prior and after catalysis. The apo-form is
magenta, ATP complex wheat, substrate ternary complex brown and product
ternary complex light blue. a) Side chains conformational changes upon substrate
binding. ATP, from the ATP binary complex, is shown as sticks and colored by
atom types with carbon atoms colored tan. The AMPCPP, FMN and Mg2+
ion
from the substrate ternary complex are colored brown, with substrates shown as
sticks and Mg2+
ion as a sphere. (b) Superposition of the substrate and product
ternary complex structures. The FAD and PPi are shown as sticks and colored by
atom types with carbon atoms in light blue. The Mg2+
ion is a green sphere.
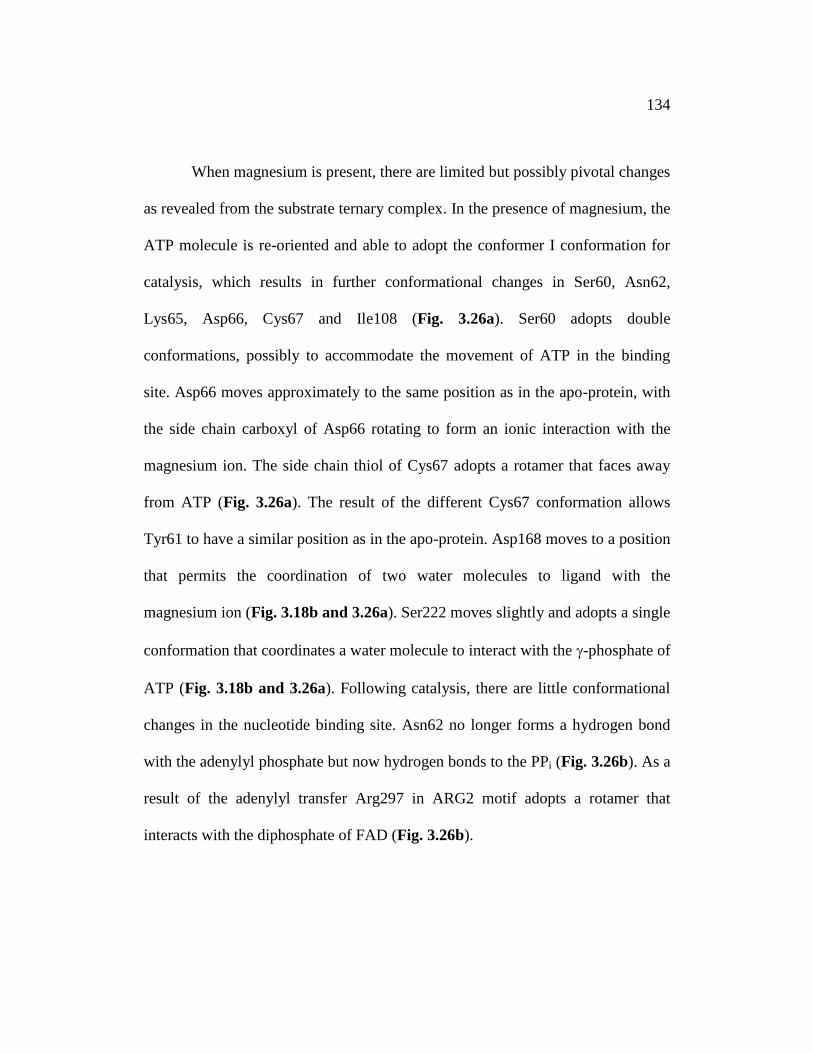
134
When magnesium is present, there are limited but possibly pivotal changes
as revealed from the substrate ternary complex. In the presence of magnesium, the
ATP molecule is re-oriented and able to adopt the conformer I conformation for
catalysis, which results in further conformational changes in Ser60, Asn62,
Lys65, Asp66, Cys67 and Ile108 (Fig. 3.26a). Ser60 adopts double
conformations, possibly to accommodate the movement of ATP in the binding
site. Asp66 moves approximately to the same position as in the apo-protein, with
the side chain carboxyl of Asp66 rotating to form an ionic interaction with the
magnesium ion. The side chain thiol of Cys67 adopts a rotamer that faces away
from ATP (Fig. 3.26a). The result of the different Cys67 conformation allows
Tyr61 to have a similar position as in the apo-protein. Asp168 moves to a position
that permits the coordination of two water molecules to ligand with the
magnesium ion (Fig. 3.18b and 3.26a). Ser222 moves slightly and adopts a single
conformation that coordinates a water molecule to interact with the -phosphate of
ATP (Fig. 3.18b and 3.26a). Following catalysis, there are little conformational
changes in the nucleotide binding site. Asn62 no longer forms a hydrogen bond
with the adenylyl phosphate but now hydrogen bonds to the PPi (Fig. 3.26b). As a
result of the adenylyl transfer Arg297 in ARG2 motif adopts a rotamer that
interacts with the diphosphate of FAD (Fig. 3.26b).

135
The movements of the flavin motif are similar to that of the motifs
interacting with ATP, in which there are subtle conformational changes. One of
the most prominent conformational changes is Met143, which rotates away from
the binding cavity in the substrate ternary complex (Fig. 3.26a and b). For all
CgFMNAT structural states, this conformation is seen only in the substrate
ternary complex. Phe147, Asp181, Trp184, Phe187 and Arg189 adjust to
accommodate the isoalloxazine ring (Fig. 3.26a and b). All of the subtle changes
are supported by the low B-factors for each structural state of CgFMNAT.
Comparison of the active site with other adenine hydrolase-like proteins
On the basis of structural alignment, the core of CgFMNAT is similar to
members of the PAPS reductase-like family where the 5th
-strand of the central
twisted six-stranded -sheet is anti-parallel to the rest of the strands (Fig. 3.27).
Compared to other PAPS reductase-like proteins, three of the five ATP binding
motifs in CgFMNAT, PP-loop, ADE and ARG1 motifs, are conserved (Fig. 3.28).
Although the -phosphate motif is also present in members of the PAPS
reductase-like family such as APS reductase and ATP sulfurylase, its role in
substrate binding and catalysis in these enzymes is not clear. Unique to
CgFMNAT and APS reductase is the presence of the ARG2 motif.
Extending the comparison of the nucleotide binding site to included the N-
type ATP pyrophosphatases and PP-loop ATPase families, which are in the same
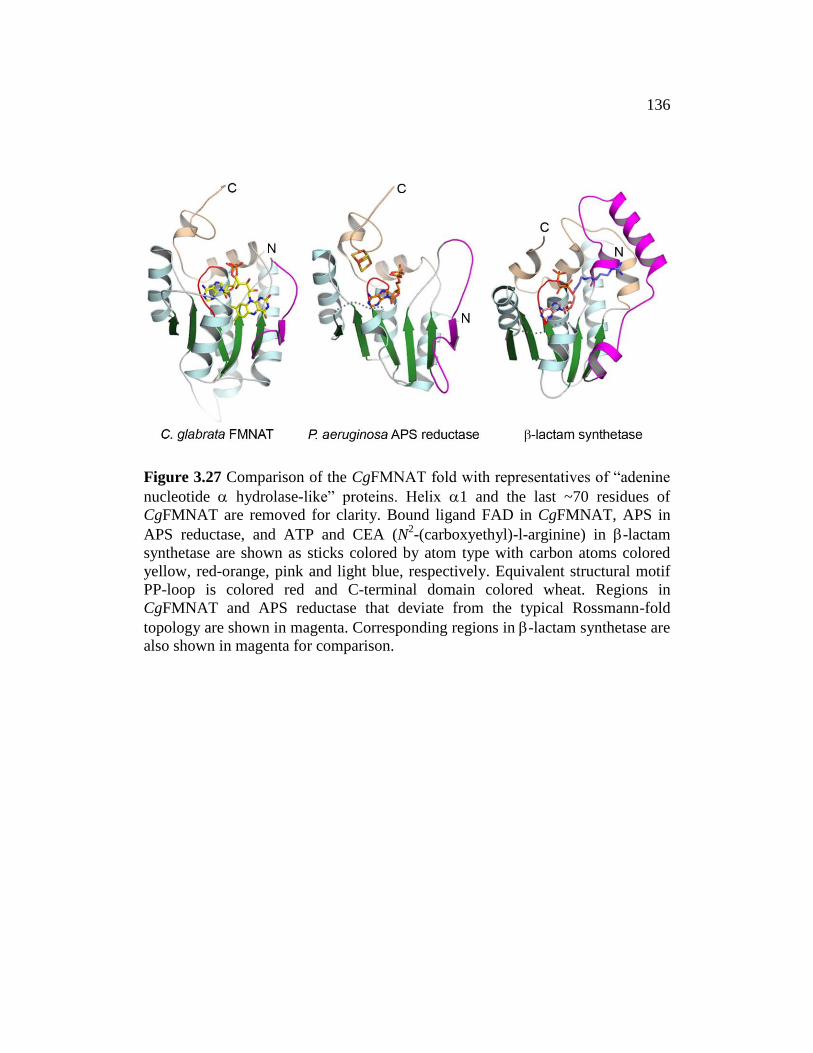
136
Figure 3.27 Comparison of the CgFMNAT fold with representatives of “adenine
nucleotide hydrolase-like” proteins. Helix 1 and the last ~70 residues of
CgFMNAT are removed for clarity. Bound ligand FAD in CgFMNAT, APS in
APS reductase, and ATP and CEA (N2-(carboxyethyl)-l-arginine) in -lactam
synthetase are shown as sticks colored by atom type with carbon atoms colored
yellow, red-orange, pink and light blue, respectively. Equivalent structural motif
PP-loop is colored red and C-terminal domain colored wheat. Regions in
CgFMNAT and APS reductase that deviate from the typical Rossmann-fold
topology are shown in magenta. Corresponding regions in -lactam synthetase are
also shown in magenta for comparison.

137

138
Figure 3.28 Structure-based multiple sequence alignment of protein representatives from “adenine nucleotide
hydrolase-like” superfamily. Each sequence is labeled by the PDB code, except CgFMNAT. The residue
numbers of CgFMNAT are marked at the top of the alignment. The sequence numbers at the beginning and end
of the alignment for each sequence are provided. Conserved structural motifs are boxed and conserved residues
within the motifs highlighted. Glycine and proline residues are in red; conserved glycine and charged/polar
residues are highlighted in gray and conserved hydrophobic/aromatic residues in yellow. Members of PAPS
reductase-like family are 2goy (APS reductase), 1sur (PAPS reductase) and 1zun (ATP sulfurylase); member of
PP-loop ATPase family is 1ni5 (tRNA-Ile-lysidine synthetase); and members of N-type ATP pyrophosphatases
are 2nsy (NH3+
-dependent NAD synthetase) and 1gpm (GMP synthetase).
139
superfamily, underscored the similarities and differences between different the
families. The conformation of the PP-loop between PAPS reductase-like, N-type
ATP pyrophosphatases and PP-loop ATPase families is similar, however the
generally conserved PP-loop sequence SGGxD(S/T) is altered in eukaryotic
FMNAT (Fig. 3.22 and 3.28). In part, by the replacement of the first conserved
Ser with CgFMNAT Asn62. In addition, the determined CgFMNAT PP-loop
sequence motif 60
SYNGGKDC67 is more similar to the canonical PP-loop
sequence142
, due to the two conserved glycines, rather than to the PP-loop
sequence of PAPS reductase-like family140
(Fig. 3.28). The replacement of the
first Ser of the canonical PP-loop sequence with Asn substitutes an
electronegative Ser hydroxyl with a less electronegative amine, along with a
longer side chain. The substitution may be responsible for the Asn amine of
CgFMNAT to hydrogen bond to the nucleotide -phosphate, rather than the -
phosphate, as in ATP sulfurylase and NH3+
-dependent NAD synthetase (Fig.
3.29c and d). Aside from eukaryotic FMNAT, ATP sulfurylase is the only
classified member of the superfamily with a Lys at the equivalent position to
Lys65 of CgFMNAT; however the ammonium group doesn’t engage in hydrogen
bonding, possibly due to the use of ATPS139
(Fig. 3.29c). A variant of the Lys
interaction is observed in NH3+
-dependent NAD synthetase, where Lys186 from a

140
Figure 3.29 Comparison of nucleotide binding site in adenine nucleotide
olase-like superfamily. a) Details of the ATP-binding site in CgFMNAT.
b) Details of the APS-binding site in APS reductase. c) Details of the ATP-
binding site in ATP sulfurylase. d) Details of the ATP-binding site in NH3+
-
dependent NAD synthetase. Nucleotides are colored by atom type with carbon
atoms colored gray. The Mg2+
ions and Na+ ion are shown as a green and purple
sphere, respectively, and water ligands are shown as red spheres. Metal ligand
interactions are shown as solid lines and hydrogen bonds are shown as dashed
lines.
141
nearby helix forms a hydrogen bond to the -phosphate (Fig. 3.29d). Residues at
the equivalent position of CgFMNAT Lys65 within the superfamily form a
hydrogen bond to the -phosphate of ATP through the main chain amide (Fig.
3.29c and d). A similar interaction is not observed in CgFMNAT (Fig. 3.29a).
Asp66 is a highly conserved residue within the superfamily (Fig. 3.28) that is a
direct ligand to a magnesium ion or a sodium ion, as is the case with ATP
sulfurylase139
(Fig. 3.29a, c and d). Cys67 of the CgFMNAT PP-loop is replaced
with a highly conserved Ser residue in the superfamily with both residues
hydrogen bonding to the nucleotide -phosphate (Fig. 3.29a, c and d).
As the PP-loop interacts with the phosphates and ribose of the nucleotide,
the ADE motif of CgFMNAT, which is conserved in the superfamily, is specific
to adenine binding and contains a conserved hydrophobic residue. The adenine
moiety of the nucleotide intimately forms hydrogen bonds to the hydrophobic
residue main chain143,200,210
(Fig. 3.29a-c). The interactions with the main chain
explains the adenine specificity and why substitutions, such as guanine, prevent
interaction at the adenine binding site150
. Interestingly, the corresponding residue
in NH3+
-dependent NAD synthetase does not engage in hydrogen bonding with
the adenine moiety. Instead, the adenine moiety forms hydrogen bonds with the
side chain of Arg78 and Gln84 from the same loop (Fig. 3.29d). There are
additional interactions between the adenine moiety with NH3+
-dependent NAD

142
synthetase and ATP sulfurylase, which involve a stacking interaction with Arg139
(Fig. 3.29d) and a hydrogen bond to Lys114 (Fig. 3.29c), respectively.
In contrast to the PP-loop and ADE motifs, the ARG1 motif is present
only in CgFMNAT and the PAPS reductase-like family and is located on the loop
connecting 5 to 6. For PAPS reductase-like family the motif has three
conserved arginines138,140
, for which the first arginine occurring on the motif is
invariant in eukaryotic FMNAT and the second arginine is highly conserved (Fig.
3.22 and 3.28). The conserved Gly of this motif, Gly163 in CgFMNAT, Gly161
in APS reductase and Gly 133 in ATP sulfurylase interacts with the ribose of the
nucleotide through a hydrogen bond from the main chain amide (Fig. 3.29a-c).
Unlike Glu138 in ATP sulfurylase and Glu162 in NH3+
-dependent NAD
synthetase that directly ligand to their respective cation species, CgFMNAT
Asp168 coordinates two waters to ligand to the metal ion.
For the last nucleotide binding motif, the -phosphate motif appears to be
conserved only in PAPS reductase-like family138,140
. In the structure of ATP
sulfurylase, a portion of this motif is disordered in the crystal139
, but it is close to
and could thus interact with ATP. Despite the structural and sequence similarity
to CgFMNAT -phosphate motif (Fig. 3.28 and 3.29b and c), few interactions
occur in ATP sulfurylase and APS reductase138,139
. Aside from the -phosphate
motif, APS reductase Lys144, equivalent to Lys114 in ATP sulfurylase, hydrogen

143
bonds to the -sulfate of the phosphosulfate group of APS. No similar interaction
is observed for CgFMNAT.
In APS reductase, Arg242 and Arg245 are near the protein C-terminus
(corresponding to Arg297 and Arg300 of CgFMNAT) and provide important
interactions with the phosphosulfate group of APS (Fig. 3.28 and 3.29b). Our
kinetic analysis of the R297A mutant shows that the apparent Km,ATP and Km,FMN
of the mutant are increased 5 and 3 times, respectively, compared to the wild-type
enzyme (discussed in Chapter 4), indicating that this Arg residue is indeed
involved in substrate binding, presumably through interactions with the
phosphoryl groups of the substrates.
The number of ions involved in nucleotide interaction is different for
CgFMNAT, N-type ATP pyrophosphatases and certain members of the PAPS
reductase-like families. One Mg2+
was observed in the nucleotide binding site for
CgFMNAT, whereas the structure of ATP sulfurylase revealed two cation binding
sites with one Mg2+
and Na+ ion. For N-type ATP pyrophosphatases family there
are two Mg2+
binding sites as exemplified in GMP synthetase143
and NH3+
-
dependent NAD synthetase201
(Fig. 3.29d). In each family, the second cation
interaction occurs on the side of the PP-loop where the conserved Ser is replaced
with Asn. In the absence of the second cation binding site in CgFMNAT, there are
seven hydrogen bonds, with five occurring to the -phosphate. For ATP

144
sulfurylase and NH3+
-dependent NAD synthetase, the phosphates of the
nucleotide form three and six hydrogen bonds, with one and four occurring with
the -phosphate, respectively.
Small molecule interaction sites on CgFMNAT surface
Interactions with small molecules on the surface of CgFMNAT were
observed for the ATP complex and ternary complexes. With 5 mM (final
concentration) magnesium sulfate added during cryoprotection of the substrate
ternary complex, a sulfate molecule is located near the N-terminus of helix 9
between monomers D and its symmetry-related counter part (Fig. 3.30a). Since
the sulfate lies close to the crystallographic 2-fold axis, the two symmetry-related
sulfate molecules are modeled with 50% occupancy. Stabilization of the sulfate
occurs through formation of hydrogen bonds with Asn119, Lys115 and a water
molecule. A similar interaction is also observed in the product ternary complex
where a sulfate concentration of 0.2 M is used in the crystallization condition
(Fig. 3.30b). In this condition, the electron density is better defined for the two
sulfate molecules. Another sulfate molecule is modeled with 50% occupancy
binding to the product ternary complex monomer F, in which the sulfate doesn’t
lie close to a crystallographic 2-fold axis. Even with different packing symmetry
around monomer F, the sulfate molecule maintains interaction with helix 9 and

145
Figure 3.30 Small molecule interactions at the surface of ternary and binary
complexes. Residues and small molecules are shown as sticks and are colored by
atom type with carbon atoms colored by monomer. Waters are shown as red
spheres. A 2Fo-Fc electron density map (blue) contoured at 1.0 is shown for the
small molecules. For a) and b) a sulfate molecule is interacting with monomer D
(brown) and a symmetry-related monomer D (gray). c) A sulfate molecule
interacts with monomer F (forest green), adjacent to monomer A (gray), and with
a symmetry-related monomer A (brown). d) A pyrophosphate is shown
interacting with the monomer (gray) and two symmetry-related monomers (forest
green and brown).

146
Figure 3.31 SQFD-loop interacting with a sulfate in the product ternary complex
monomer B. a) Protein residues and the sulfate are shown as sticks with 2Fo-Fc
electron density maps (blue) contoured at 1.0. b.) An electrostatic potential
mapped on the protein surface in the same orientation in a). Hydrogen bonds are
shown as dash lines.
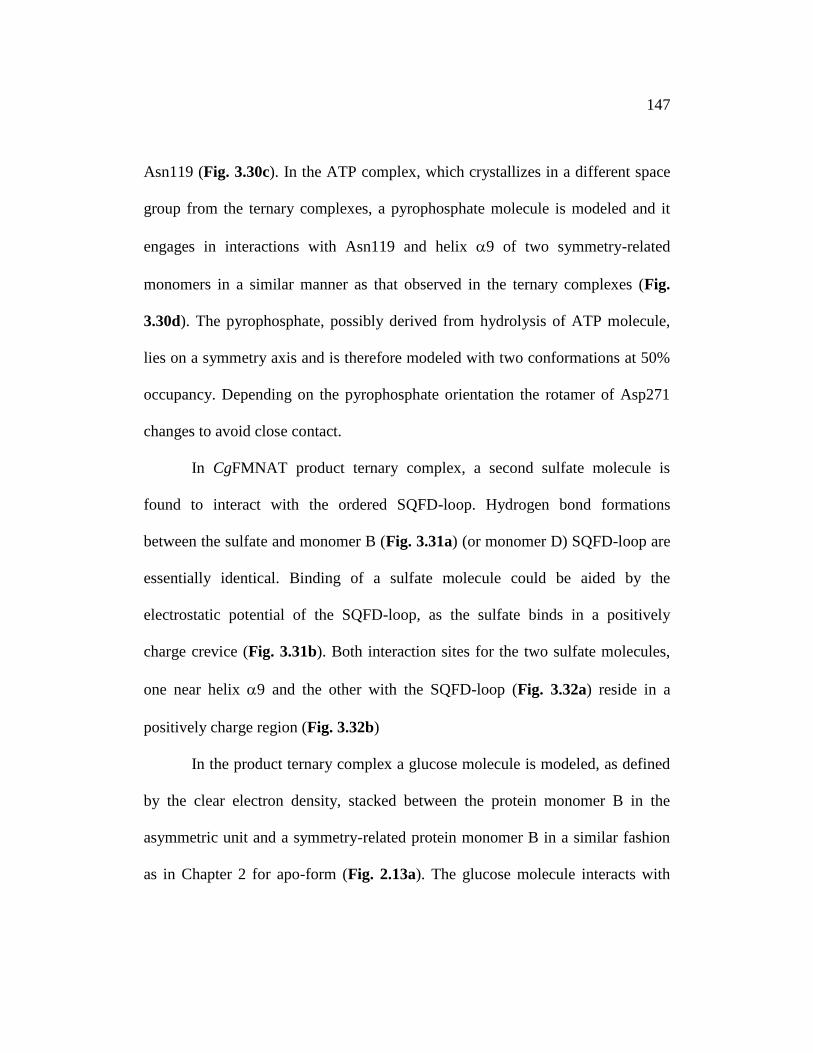
147
Asn119 (Fig. 3.30c). In the ATP complex, which crystallizes in a different space
group from the ternary complexes, a pyrophosphate molecule is modeled and it
engages in interactions with Asn119 and helix 9 of two symmetry-related
monomers in a similar manner as that observed in the ternary complexes (Fig.
3.30d). The pyrophosphate, possibly derived from hydrolysis of ATP molecule,
lies on a symmetry axis and is therefore modeled with two conformations at 50%
occupancy. Depending on the pyrophosphate orientation the rotamer of Asp271
changes to avoid close contact.
In CgFMNAT product ternary complex, a second sulfate molecule is
found to interact with the ordered SQFD-loop. Hydrogen bond formations
between the sulfate and monomer B (Fig. 3.31a) (or monomer D) SQFD-loop are
essentially identical. Binding of a sulfate molecule could be aided by the
electrostatic potential of the SQFD-loop, as the sulfate binds in a positively
charge crevice (Fig. 3.31b). Both interaction sites for the two sulfate molecules,
one near helix 9 and the other with the SQFD-loop (Fig. 3.32a) reside in a
positively charge region (Fig. 3.32b)
In the product ternary complex a glucose molecule is modeled, as defined
by the clear electron density, stacked between the protein monomer B in the
asymmetric unit and a symmetry-related protein monomer B in a similar fashion
as in Chapter 2 for apo-form (Fig. 2.13a). The glucose molecule interacts with

148
Figure 3.32 Overview of the sulfate interaction locations. Sulfates are shown as
sticks and colored by atom type. a) A ribbon representation of monomer D
product ternary complex colored raspberry for the N-terminal domain and dark
blue for the C-terminal domain. b) An electrostatic surface potential of monomer
D product ternary complex.
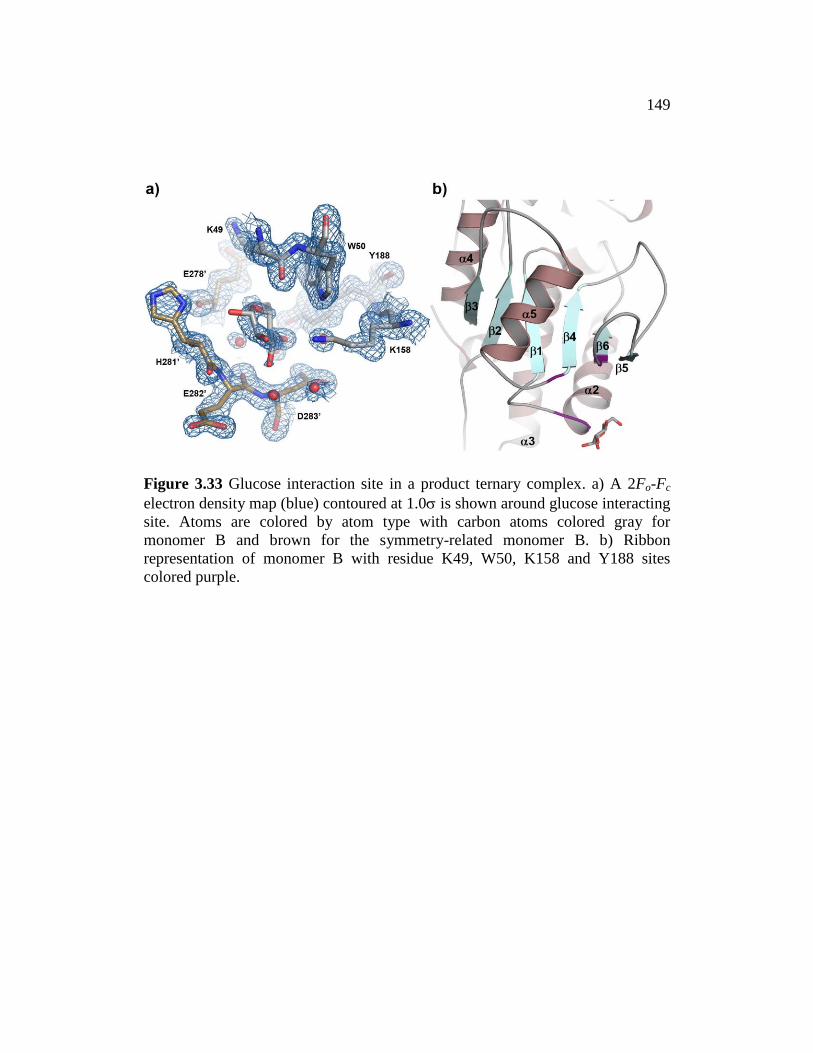
149
Figure 3.33 Glucose interaction site in a product ternary complex. a) A 2Fo-Fc
electron density map (blue) contoured at 1.0 is shown around glucose interacting
site. Atoms are colored by atom type with carbon atoms colored gray for
monomer B and brown for the symmetry-related monomer B. b) Ribbon
representation of monomer B with residue K49, W50, K158 and Y188 sites
colored purple.
150
several residues from both monomers and well defined water molecules (Fig.
3.33a). The orientation of the symmetry-related protein is slightly different from
that of apo-CgFMNAT due to the different space groups, consequently leading to
the different orientation of the glucose and weaker interactions as the glucose
electron density is less well-defined (Fig. 3.33a and b).
DISCUSSION
Novel flavin binding site in CgFMNAT
Our high-resolution structures of yeast FMNAT present the first
characterization of a eukaryotic version of this essential enzyme. Although the
overall structure of CgFMNAT shares significant similarity with PAPS reductase-
like family of proteins, as reflected in several shared ATP nucleotide binding
motifs, it is the only member in the superfamily that binds to flavins.
Unexpectedly, the mode of flavin binding by CgFMNAT has not been observed
before. In a 2001 survey by Dym and Eisenberg209
, all FAD-binding proteins with
known 3D structures were categorized into four different groups, represented by
glutathione reductase, ferredoxin reductase, p-cresol methylhydroxylase and
pyruvate oxidase, respectively. CgFMNAT is clearly distinct from any of these
FAD-binding proteins in both the conserved sequence motifs and in flavin-
binding mode. In Rossmann-fold FAD-binding proteins (e.g., glutathione

151
reductase and pyruvate oxidase groups) the isoalloxazine ring of FAD invariably
binds on the side of the central -sheet opposite from the adenine moiety and
across the top of the sheet between 1 and 4 (Fig. 3.34a and b). It often
interacts with residues from another domain. In contrast, in CgFMNAT, the
isoalloxazine ring binds to the face of the central -sheet on the same side as the
adenine, and the binding involves exclusively residues from the Rossmann-like
N-terminal domain. The deviation from the typical Rossmann-fold topology,
characterized by an anti-parallel strand 5 at the edge of the -sheet, opens up the
side of the -sheet to form the flavin-binding pocket. In the CgFMNAT product
ternary complex structure, FAD adopts a bent conformation with adenosine
moiety and isoalloxazine ring pack against each other. While the FAD cofactor in
most flavoproteins adopts an extended conformation, bent FAD has been
observed in flavodoxin reductase and DNA photolyase209
. Yet, the conformations
of these bent FADs are very different from that in CgFMNAT (Fig. 3.35), further
emphasizing the unique flavin-binding mode of eukaryotic FMNAT.
CgFMNAT and its closely related members of the PAPS reductase-like
family contain a unique ARG1-motif and an anti-parallel strand 5 at the edge of
the -sheet followed by a loop connecting 5 to 6. These structure elements
form part of the flavin-binding pocket. Helices at the corresponding position in
152
Figure 3.34 Ribbon representations of FAD binding proteins. a.) Rossmann-like
fold present in pyruvate oxidase211
. b.) Rossmann fold present in NADH
peroxidase212
.

153
Figure 3.35 Comparison of protein-bound FAD conformations. Representative
protein bound FAD molecules were superimposed over the isoalloxazine rings.
FAD bound to CgFMNAT (yellow) is compared to FAD from a) flavodoxin
reductase213
(blue) (PDB code 1fdr); b) DNA photolyase214
(magenta) (PDB code
1dnp); and c) glutathione reductase215
(green) (PDB code 3grs).

154
other members of the superfamily (Fig. 2.17 and 3.27) would prevent such a
binding pocket. Additionally, both APS reductase and CgFMNAT also share an
ARG2-motif at the C-terminus of the proteins. Whether the motif is present in
PAPS reductase and ATP sulfurylase is unknown as the C-termini of the proteins
are disordered in the models. Based on the sequence alignment, PAPS reductase
and ATP sulfurylase appear to alter the conservation of the two arginines (Fig.
2.1). Conversely, structure variation exists in the PAPS reductase-like family,
such as CgFMNAT and ATP sulfurylase having an extended C-terminus. In the
current model of ATP sulfurylase139
88 residues following the -phosphate motif
are disordered, therefore are not modeled. Both proteins are the only members
that have a conserved Lys (Lys65 and Lys37, respectively) and Asp (Asp66 and
Asp38, respectively) in the PP-loop. Conservation of the Asp may explain that
both CgFMNAT and ATP sulfurylase have an ATP pyrophosphatase activity.
From a structure-based multiple sequence alignment, eukaryotic FMNAT
shows evolutionary divergence from members of the PAPS reductase-like family.
The Asn62 of the PP-loop, Tyr216 of the -phosphate motif and the flavin motif
are unique to CgFMNAT. The interaction with the -phosphate of the nucleotide
with the PP-loop is different from other members in PAPS reductase-like family,
and could be a result of the substitution of Ser by Asn in eukaryotic FMNATs.
The C-terminal domain provides additional interactions with the -phosphate from
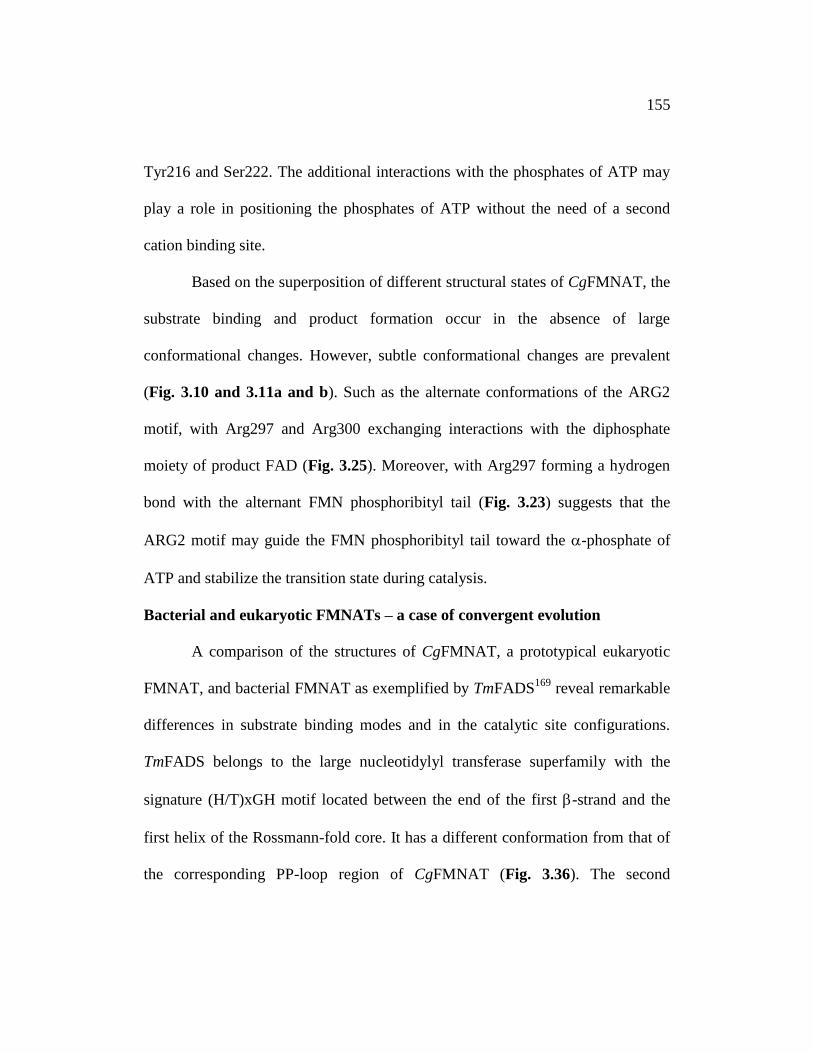
155
Tyr216 and Ser222. The additional interactions with the phosphates of ATP may
play a role in positioning the phosphates of ATP without the need of a second
cation binding site.
Based on the superposition of different structural states of CgFMNAT, the
substrate binding and product formation occur in the absence of large
conformational changes. However, subtle conformational changes are prevalent
(Fig. 3.10 and 3.11a and b). Such as the alternate conformations of the ARG2
motif, with Arg297 and Arg300 exchanging interactions with the diphosphate
moiety of product FAD (Fig. 3.25). Moreover, with Arg297 forming a hydrogen
bond with the alternant FMN phosphoribityl tail (Fig. 3.23) suggests that the
ARG2 motif may guide the FMN phosphoribityl tail toward the -phosphate of
ATP and stabilize the transition state during catalysis.
Bacterial and eukaryotic FMNATs – a case of convergent evolution
A comparison of the structures of CgFMNAT, a prototypical eukaryotic
FMNAT, and bacterial FMNAT as exemplified by TmFADS169
reveal remarkable
differences in substrate binding modes and in the catalytic site configurations.
TmFADS belongs to the large nucleotidylyl transferase superfamily with the
signature (H/T)xGH motif located between the end of the first -strand and the
first helix of the Rossmann-fold core. It has a different conformation from that of
the corresponding PP-loop region of CgFMNAT (Fig. 3.36). The second

156
conserved motif of the nucleotidylyl transferase superfamily, ISSTxxR, is located
at the N-terminal end of an -helix in a C-terminal subdomain and interacts with
the - and -phosphates of the ATP nucleotide. No equivalent structural motif
corresponding to ISSTxxR exists in CgFMNAT, though the -Phosphate motif
appears to perform a similar role. Most strikingly, the bound adenine nucleotides
in the two proteins are orientated in opposite directions with regard to the plane of
the central -sheet (Fig. 3.36), delineating two completely different nucleotide-
binding modes in these two protein superfamilies. Currently, no flavin-bound
bacterial FMNAT structure is available. Based on the structural similarity of
TmFADS to other members of nucleotidylyl transferases, such as nicotinamide
mononucleotide adenylyltransferases (NMNAT) for which extensive structural
information are available134-136
, the FMN substrate likely binds to a site
corresponding to the NMN-binding site in NMNAT on the opposite side of the
central -sheet from ATP so that the product FAD adopts a largely extended
conformation (Fig. 3.36). Again, this arrangement is very different from the
flavin-binding mode observed in CgFMNAT (Fig. 3.36). Thus, eukaryotic and
bacterial FMNAT present a remarkable case of ancient Rossmann-fold proteins
that, after first diverging into two distinct protein families with different
nucleotide-binding modes, have developed the same enzymatic activity through
different active site configurations.

157
Figure 3.36 Comparison of eukaryotic and bacterial FMNAT structures. Ribbon
diagrams of the Rossmann-like fold core of CgFMNAT-FAD complex (left) and
the FMNAT domain of TmFADS (right) are shown in roughly the same
orientation. An FAD molecule is modeled in the TmFMNAT active site based on
the TmFADS-AMP complex structure (PDB identifier 1t6y)169
and homologous
NMNAT-NAD complex structures. Corresponding structural elements are colored
identically in the two structures.

158
In summary, we present here high-resolution structures of a eukaryotic
FMN adenylyltransferase in different complexed states, which reveal details about
the active site configuration and a unique FAD-binding mode. Aside from the
nucleotide interactions being contributed from the conserved nucleotide binding
motifs shared in the PAPS reductase-like family, CgFMNAT complexes revealed
additional nucleotide binding motifs, namely the ARG1 and ARG2 motifs. The
distinctly conserved Asn residue of the eukaryotic FMNAT PP-loop motif
interacts with the ATP differently from that observed for the highly conserved Ser
in other members of the family, as well as members of the superfamily, which
leads to an alternate conformation of the ATP phosphates. Residues involved in
flavin interactions are identified from the previously uncharacterized and unique
flavin motif. These structures lay a foundation for future investigation of the
functional roles of active-site residues and the kinetic mechanism of the enzyme.

159
CHAPTER 4
Steady-state kinetics and mutagenic analysis
(Parts of this chapter are adapted from Huerta et al., 2009)
INTRODUCTION
Endogenous mammalian FMNAT has been studied extensively by steady-
state kinetics. These studies include determining flavin specificity using FMN
analogs as substrates to synthesize FAD analogs, cation selectivity and product
inhibition145,146,150
. Mammalian FMNAT catalyze the formation of FAD through
an ordered bi-bi mechanism with the substrate binding order being ATP binds
first followed by FMN and the product release order of PPi first followed by
FAD145
. Similar kinetic properties and the same substrate binding and product
release order are determined for bacterial FMNAT70
. Pronounced product
feedback inhibition was observed for rat liver FMNAT, and it was suggested that
such a property would enable FMNAT to play a role in regulating cellular FAD
homeostasis as the Ki values of FAD against FMN (0.75 M) and Mg2+
ATP (1.3
M) are close to the concentration of free FAD (0.4 M)145
. Maintenance of FAD
homeostasis is important, as several cellular processes, such as oxidative protein
folding and homocysteine metabolism are sensitive to FAD levels151,152
. Product
inhibition seems to be specific for eukaryotic FMNATs. Although no such studies

160
are reported for bacterial FMNAT, the protein is not co-purified with any flavin
product168,169,216
, suggesting a much less pronounced product inhibition.
From the thorough structural analysis of the four different structural states
of CgFMNAT, residues involved in substrate and product interactions, and
potentially involved in catalysis were suggested. To investigate the role of these
active site residues and to understand the catalytic mechanism of FAD synthesis
by eukaryotic FMNAT, mutagenesis and steady-state kinetics were performed.
The results allowed us to propose the substrate binding and product release order,
which is similar to that reported for the mammalian enzyme in a previous
study145
. Site-directed mutagenesis identified, unexpectedly, several
“supermutants”, in which the turnover rates are much faster than the wild-type
enzyme. Product inhibition analysis of the wild-type and a “supermutant”
CgFMNAT suggests that the enhanced activity is at least partially due to a relaxed
product inhibition.
MATERIALS
Inorganic pyrophosphatase (PPase), purine nucleoside phosphorylase
(PNP), FMN, ATP, FAD, sodium pyrophosphate, trisodium citrate dihydrate,
ammonium molybdate tetrahydrate, malachite green oxalate salt and all other
reagents were purchased from Sigma-Aldrich (St Louis, MO), unless stated

161
otherwise. 2-amino-6-mercapto-7-methylpurine riboside (MESG) was purchased
from Berry & Associates (Ann Arbor, MI). EnzChek pyrophosphate assay kit was
purchased from Molecular Probes (Eugene, OR). QuikChange site-directed
mutagenesis kit was purchased from Stratagene (La Jolla, CA). Primers were
ordered from Integrated DNA Technologies (Coralville, IA) and Sigma-Aldrich
Corp. (The Woodlands, TX).
METHODS
Mutagenesis, protein expression and purification
Point mutations of CgFMNAT were generated with primers containing the
desired mutations using QuikChange site-directed mutagenesis PCR amplification
procedure. The mutants generated were N62A, N62S, D66A, D168A, D181A,
W184A, R297A and a deletion mutant was also generated where the last three
lysines were removed (3K). The forward and reverse primers for each mutant
(with mutagenesis site underlined), along with the theoretical Tm and mutated
nucleic acid bases are listed in Table 4.1. Incorporation of the desired mutants
was confirmed by DNA sequencing from the McDermott Center at The
University of Texas Southwestern Medical Center. Protein expression and
purification were performed using the same procedure as that for apo-CgFMNAT,
except the last purification step. The phenyl-sepharose hydrophobic interaction

162
Table 4.1 Mutanta Primer Sequenceb Tm
c
N62A
(AAT→GCT) 5’-GGTGAAATATCGTTTTCCTATGCTGGAGGCAAAGACTGCCAGGTG-3’ 3’-CCACTTTATAGCAAAAGGATACGACCTCCGTTTCTGACGGTCCAC-5’
82.1ºC
N62S
(AAT→TCA) 5’-GGTGAAATATCGTTTTCCTATTCAGGAGGCAAAGACTGCCAGGTG-3’ 3’-CCACTTTATAGCAAAAGGATAAGTCCTCCGTTTCTGACGGTCCAC-5’
79.0ºC
D66A
(GAC→GCT) 5’-CGTTTTCCTATAATGGAGGCAAAGCTTGCCAGGTGCTGTTATTACTATA-3’ 3’-GCAAAAGGATATTACCTCCGTTTCGAACGGTCCACGACAATAATGATAT-5’
80.4ºC
D168A
(GAT→GCT) 5’-GTCATCGGTATAAGACACACTGCTCCATTTGGCGAGCATTTAAAG-3’ 3’-CAGTAGCCATATTCTGTGTGACGAGGTAAACCGCTCGTAAATTTC-5’
82.5ºC
D181A
(GAT→GCT) 5’-AAGCCTATTCAAAAGACAGCTGCTAATTGGCCAGATTTC-3’ 3’-TTCGGATAAGTTTTCTGTCGACGATTAACCGGTCTAAAG-5’
78.4ºC
W184A
(TGG→GCT) 5’-CCTATTCAAAAGACAGATGCTAATGCTCCAGATTTCTATCGTCTACAACCT-3’ 3’-GGATAAGTTTTCTGTCTACGATTACGAGGTCTAAAGATAGCAGATGTTGGA-5’
78.5ºC
R297A
(AGA→GCT)
5’-GTACCTAGTCGATGACAAACTTGAAGCTGCAGGAAGAATTAAAAAGAAATGAG-3’ 3’-CATGGATCAGCTACTGTTTGAACTTCGACGTCCTTCTTAATTTTTCTTTACTC-5’
78.6ºC
3K
(AAA→TAA)
5’-TGAAAGAGCAGGAAGAATTTAAAAGAAATGAGTCGACGAGC-3’ 3’-ACTTTCTCGTCCTTCTTAAATTTTCTTTACTCAGCTGCTCG-5’
78.6ºC
aCodons in parenthesis list the change from the native codon to the mutant codon.
bThe forward and reverse primers for each mutant are listed with the mutagenesis site underlined.
cTheoretical Tm for primer set.

163
chromatography step was omitted for D181A and W184A mutants, as the protein
samples were clear and contained no detectable flavin. The final step in
purification was dialysis in 2 L gel filtration buffer. A UV/visible absorption
spectrum for all mutants were performed to ensure no detectable flavin in the
protein. Protein purity was monitored by SDS-PAGE and the protein
concentration was determined by Bio-Rad protein assay. For native apo-
CgFMNAT kinetic studies, previously purified protein was utilized.
Steady-state kinetics analysis
A continuous spectrometric assay that couples the release of the product
inorganic pyrophosphate (PPi) to the generation of 2-amino-6-mercapto-7-
methylpurine217,218
was utilized to measure the steady-state kinetics of native and
mutant CgFMNATs (Fig. 4.1a). The rate of FAD formation by FMNAT is
measured spectrometrically by the conversion of PPi to inorganic phosphate (Pi)
through PPase, which is then used to convert MESG to its products ribose-1-
phosphate and 2-amino-6-mercapto-7-methylpurine by PNP. Conversion of
MESG to 2-amino-6-mercapto-7-methylpurine results in an increase in absorption
at 360 nm. To measure the initial rates of native CgFMNAT, the reaction mixture
(0.5 ml) contained 20 mM HEPES, pH 7.5, 2 mM magnesium chloride, 0.5 units
PNP, 0.015 units PPase, 0.2 mM MESG, 21 nM (10.5 pmole or 378 ng) apo-
CgFMNAT, 2.5 to 20 M FMN and 1 to 250 M ATP. All enzyme reactions

164
a.)
b.)
Figure 4.1 Scheme for coupled FMNAT assays. The rate of FAD formation by
FMNAT is measured by the release of inorganic pyrophosphate (PPi), which is
converted to inorganic phosphate (Pi) through inorganic pyrophosphatase (PPase).
a.) For the end-point assay, the Pi interacts with the malachite green reagent that
cause an increase in absorption between 620-650 nm. b.) For the continuous
coupled assay, MESG is converted to its products ribose-1-phosphate and 2-
amino-6-mercapto-7-methylpurine by purine nucleoside phosphorylase (PNP) in
the presence of Pi. Conversion of MESG to 2-amino-6-mercapto-7-methylpurine
results in an increase in absorption at 360 nm.

165
were carried out in duplicates using a Quartz cuvette and performed at 25 °C. The
reaction was initiated by the addition of 10 l of enzyme, and progress was
monitored by absorption at wavelength 360 nm for 5 minutes on a Beckman
Coulter DU 640 spectrophotometer. As a blank, apo-CgFMNAT was left out of
the reaction mixture. Residual enzymatic activity was measured by saturating the
reaction with 100 M ATP and omitting FMN, or with 100 M ATP and 20 M
FMN and omitting magnesium chloride. For each mutant, the protein
concentration in the reaction mixture was ~21 nM for determining percent
specific activity (nmole/min/mg protein), with ATP and FMN concentrations at
100 M and 20 M, respectively. For determination of steady-state kinetic
parameters the protein concentrations used were: ~40 nM for N62A, ~80 nM for
D168A, ~7 nM for D181A, ~300 nM for W184A and ~15.8 nM for R297A. A
substrate concentration range of 5 to 500 M FMN and 10 to 800 M ATP was
used for W184A mutant.
Steady-state kinetic parameters for native CgFMNAT were determined by
fitting the initial rates from multiple fixed FMN concentration while varying the
ATP concentration (and vice versa) to the general equation (1) describing a
bireactant ordered bi-bi system219
(Eq. (1)).
FMNATPFMNATP
FMNATPν
mATPmFMNmFMNiATP
max
KKKK
V (1)

166
Km,ATP and Km,FMN are the Michaelis-Menten constants, and Ki,ATP is the
dissociation constant for an ATP-enzyme complex. For Eq. (1) a nonlinear least-
squares method as implemented in the Sigma Plot Enzyme Kinetics module
(Systat Software, http://www.sigmaplot.com/home.php) was used to global fit the
data.
For native and mutant CgFMNATs the apparent steady-state kinetic
parameters were determined by fitting the initial rates to the general Michaelis-
Menten equation (2) (Eq. (2)).
S
Sν
appm,
appmax,
K
V (2)
Km,app is the apparent Michaelis-Menten constant, and [S] is the
concentration of ATP when FMN is at saturated concentration (20 M) or FMN
when ATP is at saturated concentration (100 M). A nonlinear least-squares
method as implemented in Sigma Plot was used to fit the data.
Product inhibition analysis
A colorimetric end-point assay was utilized to measure product inhibition
by FAD. The assay method measures the formation of PPi by the hydrolysis to Pi
through PPase using a modified malachite green end-point assay220-222
(Fig. 4.1b).
The malachite green end-point assay was used due its sensitivity to low phosphate
concentrations and to avoid the potential interference from the flavin absorption

167
in the UV range. During the development of the product inhibition assay for
CgFMNAT, it is observed that the incubation time of FAD with CgFMNAT
affects the reaction rate. Therefore, the product inhibition assays were performed
after incubation of FAD with the protein for 30 minutes. The reaction mixture
(0.3 ml) contained 20 mM HEPES, pH 7.5, 2 mM magnesium chloride, 0.06 units
PPase, 50 M ATP, 10 M FMN, 0.8 M FAD and 5 nM (1.5 pmole or 53.9 ng)
D181A mutant. The protein was preincubated with 0.8 M FAD on ice for 0, 5,
30 and 50 minutes before initiating the reaction. All enzyme reactions were
carried out in duplicates using polystyrene cuvettes and performed at 25 °C. The
reaction was initiated by the addition of 10 l of the enzyme and allowed to
progress for 1 to 18 minutes, prior to stopping the reaction with 300 L of the
malachite green reagent. The color development was quenched after 2 minutes
with 60 L of quenching solution and incubated for 20 minutes at 25 °C before
measuring the absorbance at wavelength 650 nm. Three different time points were
collected within the linear range for determining the initial rates. As a blank, apo-
CgFMNAT was left out of the reaction mixture. The stock solutions for the assay
were prepared as follow: reagent A, 41.9 mM ammonium molybdate in ddH2O;
reagent B, 3.1 M H2SO4; reagent C, 1.13 mM malachite green in ddH2O; and
reagent D, 0.660 % Poly (vinyl alcohol) in ddH2O. The malachite green reagent
was prepared by mixing the reagents to provide a final solution of 12.04 mM
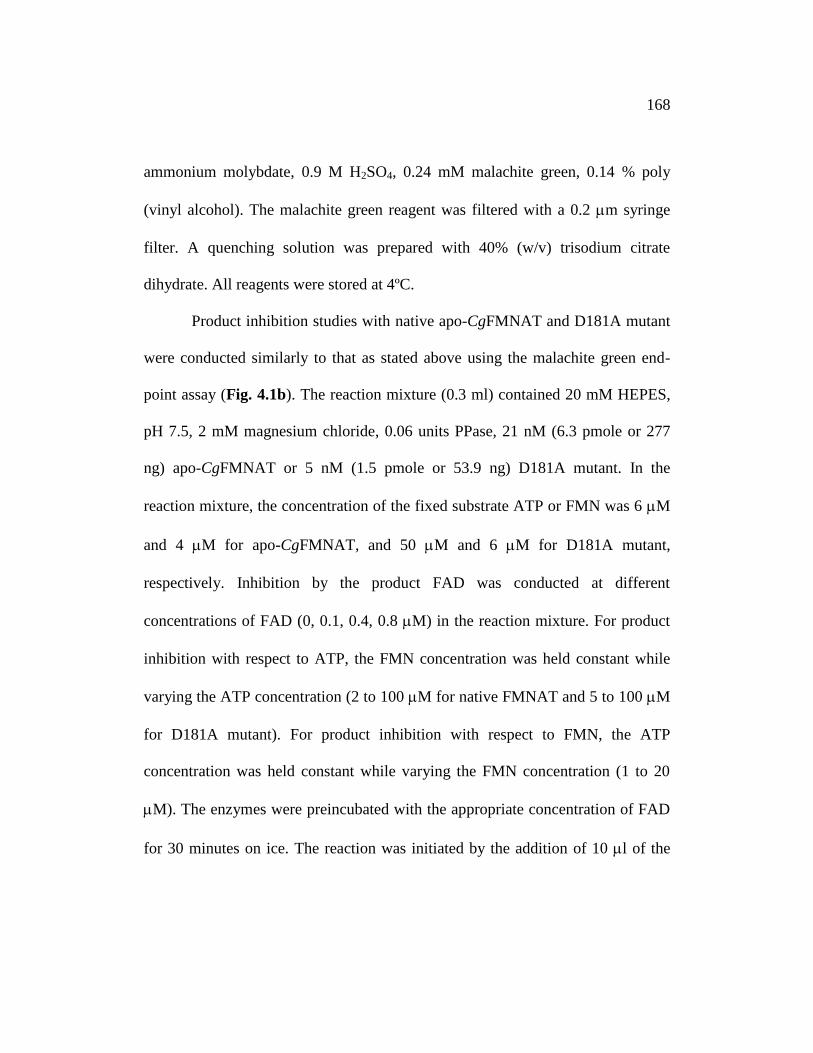
168
ammonium molybdate, 0.9 M H2SO4, 0.24 mM malachite green, 0.14 % poly
(vinyl alcohol). The malachite green reagent was filtered with a 0.2 m syringe
filter. A quenching solution was prepared with 40% (w/v) trisodium citrate
dihydrate. All reagents were stored at 4ºC.
Product inhibition studies with native apo-CgFMNAT and D181A mutant
were conducted similarly to that as stated above using the malachite green end-
point assay (Fig. 4.1b). The reaction mixture (0.3 ml) contained 20 mM HEPES,
pH 7.5, 2 mM magnesium chloride, 0.06 units PPase, 21 nM (6.3 pmole or 277
ng) apo-CgFMNAT or 5 nM (1.5 pmole or 53.9 ng) D181A mutant. In the
reaction mixture, the concentration of the fixed substrate ATP or FMN was 6 M
and 4 M for apo-CgFMNAT, and 50 M and 6 M for D181A mutant,
respectively. Inhibition by the product FAD was conducted at different
concentrations of FAD (0, 0.1, 0.4, 0.8 M) in the reaction mixture. For product
inhibition with respect to ATP, the FMN concentration was held constant while
varying the ATP concentration (2 to 100 M for native FMNAT and 5 to 100 M
for D181A mutant). For product inhibition with respect to FMN, the ATP
concentration was held constant while varying the FMN concentration (1 to 20
M). The enzymes were preincubated with the appropriate concentration of FAD
for 30 minutes on ice. The reaction was initiated by the addition of 10 l of the

169
enzyme and allowed to progress for 1 to 18 minutes prior to stopping the reaction
and allowing the color to develop before quenching.
The effect of product inhibition by FAD on the initial rates of native and
D181A CgFMNAT was investigated in order to provide support for the proposed
substrate binding order and to evaluate the inhibitory effect brought upon by
FAD. Initial rates were fitted to the general inhibition equation (3) (commonly
referred to as mixed-type inhibition) for readily reversible inhibitors219,223
(Eq.
(3)).
)/]I[1](S[)/]I[1(
Sν
iim
max
KKK
V
(3)
Where Ki is the inhibition constant, is a quantitative parameter that provides a
measure of the type of inhibition219,223
, and [I] is the concentration of the inhibitor
(FAD). Deducing the type of inhibition is based on the value of , where = ∞
indicates competitive inhibition; = 1 indicates noncompetitive inhibition; and
< 1 or >1 indicates mixed-type inhibition. For Eq. (3) a nonlinear least-
squares method as implemented in the Sigma Plot Enzyme Kinetics module
(Systat Software, http://www.sigmaplot.com/home.php) was used to global fit the
data.

170
RESULTS
Steady-state kinetic analysis of CgFMNAT
The steady-state kinetic parameters of CgFMNAT were determined using
the continuous coupled assay217,218
. The Lineweaver-Burk reciprocal plots of 1/v
vs. 1/[FMN] and 1/v vs. 1/[ATP] (Fig. 4.2a and b) are consistent with an ordered
bi-bi mechanism219
, with the substrate binding order being ATP first followed by
FMN. The same mechanism and substrate binding order were also proposed for
rat liver and bacterial FMNATs in early studies70,145
. The initial rates of the
reaction were globally fitted to the general equation for an ordered steady-state
bireactant model (insets of Fig. 4.2a and b). The steady-state kinetic parameters
obtained for CgFMNAT are: Km for ATP 10.7 ± 2.3 M, Km for FMN 0.76 ± 0.15
M, and kcat 0.087 s-1
. The Km,FMN value for CgFMNAT is similar to that obtained
for human FMNAT isoform II in a recent study (apparent Km,FMN 0.36 ± 0.06
M), while the kcat appears to be more than ten times higher than that of the
human enzyme (0.0036 ± 0.0001 s-1
)112
. These values are somewhat different
from those obtained for the endogenous rat-liver FMNAT, where the apparent Km
for ATP and FMN are 71 M and 9.1 M, respectively, with a Vmax of 345 nmole
FAD/min/mg of protein145
, corresponding to a kcat of 0.15 s-1
.

171
Figure 4.2 Adenylyl transfer mechanism for CgFMNAT. a) Initial rates
represented by the Lineweaver-Burk plots of 1/v versus 1/[ATP] at fixed FMN
concentrations. Inset: The same data represented by a hyperbolic plot (inset) as a
function of ATP concentration. b) Initial rates represented by the Lineweaver-
Burk plot of 1/v versus 1/[FMN] at fixed ATP concentrations. Inset: The same
data represented by a hyperbolic plot (inset) as a function of FMN concentration.
The rates in a) and b) were global fitted to the velocity equation for an ordered bi-
bi (Eq. (1)) reactant system.
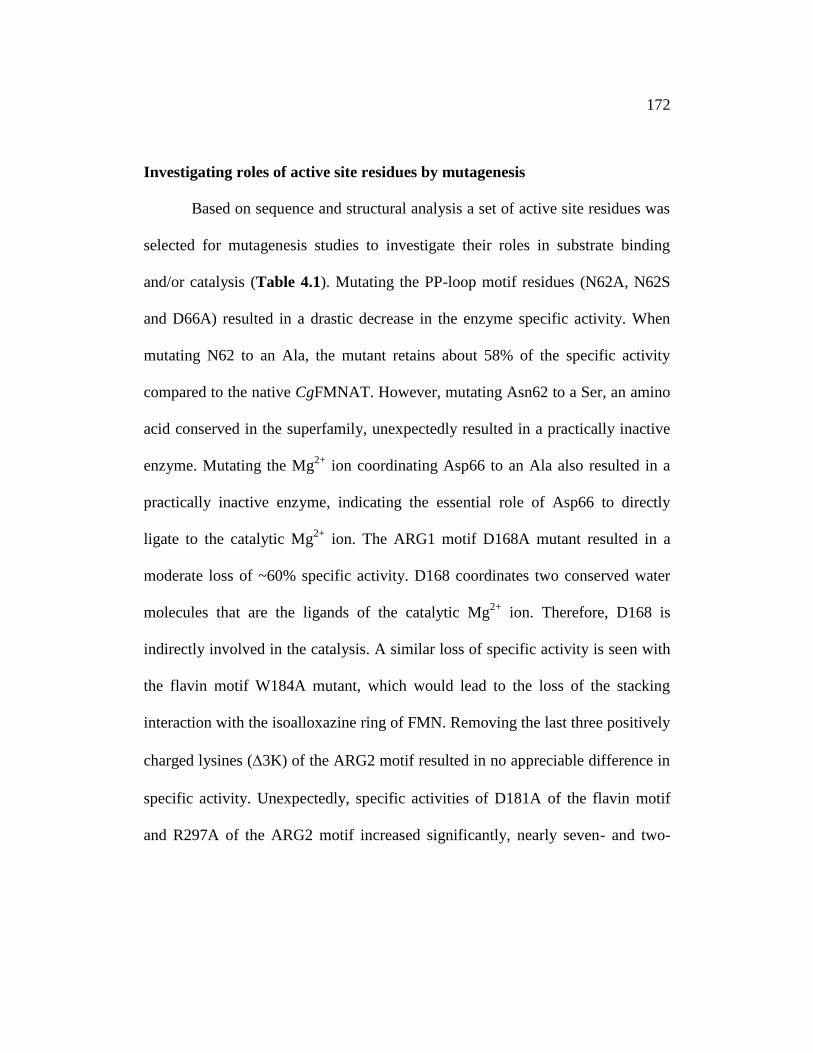
172
Investigating roles of active site residues by mutagenesis
Based on sequence and structural analysis a set of active site residues was
selected for mutagenesis studies to investigate their roles in substrate binding
and/or catalysis (Table 4.1). Mutating the PP-loop motif residues (N62A, N62S
and D66A) resulted in a drastic decrease in the enzyme specific activity. When
mutating N62 to an Ala, the mutant retains about 58% of the specific activity
compared to the native CgFMNAT. However, mutating Asn62 to a Ser, an amino
acid conserved in the superfamily, unexpectedly resulted in a practically inactive
enzyme. Mutating the Mg2+
ion coordinating Asp66 to an Ala also resulted in a
practically inactive enzyme, indicating the essential role of Asp66 to directly
ligate to the catalytic Mg2+
ion. The ARG1 motif D168A mutant resulted in a
moderate loss of ~60% specific activity. D168 coordinates two conserved water
molecules that are the ligands of the catalytic Mg2+
ion. Therefore, D168 is
indirectly involved in the catalysis. A similar loss of specific activity is seen with
the flavin motif W184A mutant, which would lead to the loss of the stacking
interaction with the isoalloxazine ring of FMN. Removing the last three positively
charged lysines (3K) of the ARG2 motif resulted in no appreciable difference in
specific activity. Unexpectedly, specific activities of D181A of the flavin motif
and R297A of the ARG2 motif increased significantly, nearly seven- and two-

173
times greater than native CgFMNAT, respectively, and are thus referred to as
“supermutants” (Fig. 4.3).
To assess the effect of the mutants on substrate interactions and turnover
rate (kcat), steady-state kinetic parameters were determined for CgFMNAT
mutants, except for N62S and N66A which have no measureable activity, and are
listed in Table 4.2. As predicted, N62A and D168A mutants resulted in a
decreased apparent kcat. Interestingly, N62A mutant has a much lower apparent
Km,ATP than native CgFMNAT, which was not expected as the loss of the ATP
interaction by Asn62 was predicted to increase the apparent Km,ATP. D168A
mutant gave a much higher apparent Km,ATP, consistent with D168’s role in ATP
substrate and metal ion interactions. The “supermutant” D181A, which was
designed to weaken the interaction with FMN, has an increased apparent kcat
about nine-times of native CgFMNAT. Additionally, D181A has relatively no
effect on the apparent Km,FMN, but has an increased apparent Km,ATP of ~3 times
that of the wild-type enzyme. In contrast to D181A, the loss of the stacking
interactions with FMN by W184A mutant resulted in a considerable increased
apparent Km,FMN of ~200 times that of the wild-type enzyme. W184A also
resulted in an increased apparent Km,ATP. Interestingly, the apparent kcat increased
~2–3 times of the wild-type enzyme. Originally, mutating R297 to an Ala was
expected to increase the apparent Km,FMN. Consequently, the apparent Km,ATP

174
Figure 4.3 Percent specific activity (nmole/min/mg protein) of CgFMNAT
mutants.
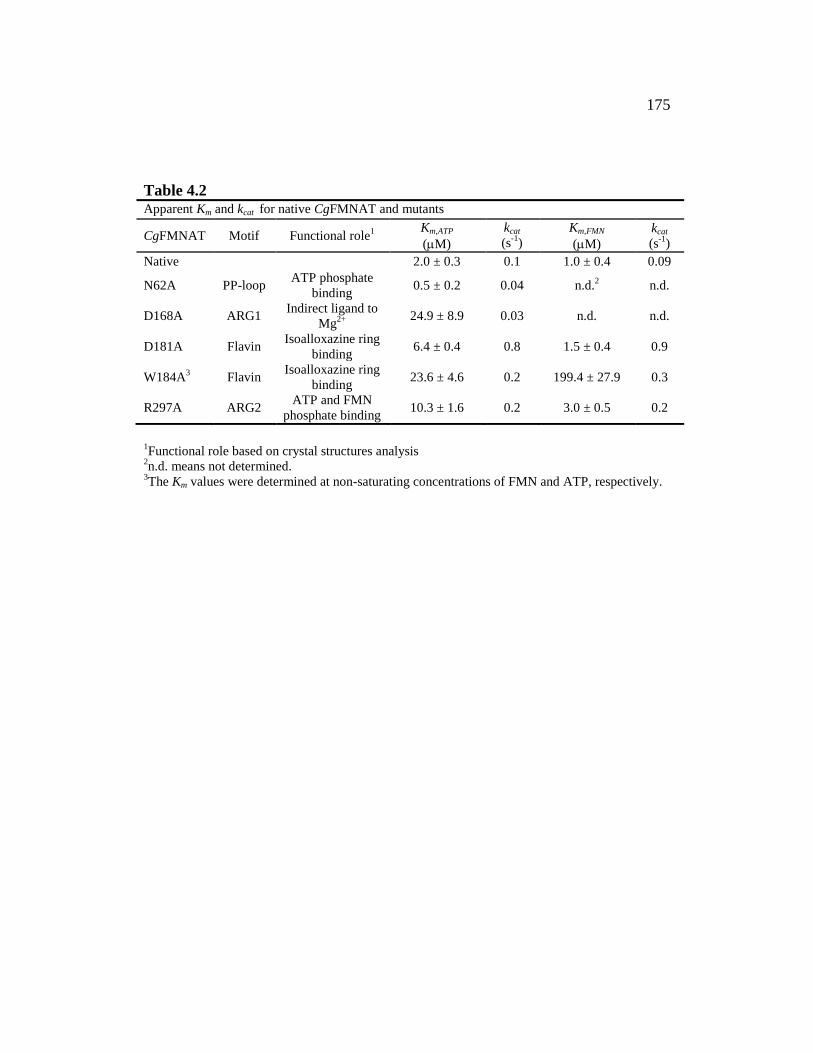
175
Table 4.2 Apparent Km and kcat for native CgFMNAT and mutants
CgFMNAT Motif Functional role1 Km,ATP
(M) kcat
(s-1
)
Km,FMN
(M) kcat
(s-1
)
Native 2.0 ± 0.3 0.1 1.0 ± 0.4 0.09
N62A PP-loop ATP phosphate
binding 0.5 ± 0.2 0.04 n.d.
2 n.d.
D168A ARG1 Indirect ligand to
Mg2+
24.9 ± 8.9 0.03 n.d. n.d.
D181A Flavin Isoalloxazine ring
binding 6.4 ± 0.4 0.8 1.5 ± 0.4 0.9
W184A3
Flavin Isoalloxazine ring
binding 23.6 ± 4.6 0.2 199.4 ± 27.9 0.3
R297A ARG2 ATP and FMN
phosphate binding 10.3 ± 1.6 0.2 3.0 ± 0.5 0.2
1Functional role based on crystal structures analysis
2n.d. means not determined.
3The Km values were determined at non-saturating concentrations of FMN and ATP, respectively.

176
increased about ~5 times, in addition to the expected increase of the apparent
Km,FMN, which increased marginally (~3 times) (Table 4.2). Despite the increases
in the apparent Km, the “supermutant” R297A has an increased apparent kcat of
about two-times of native CgFMNAT. These results indicate that R297 is
involved in binding of both ATP and FMN, which is consistent with the
observation in the product and substrate ternary complexes, where R297 is in
position to interact with the adenylyl phosphate of FAD and the FMN phosphate,
respectively (Fig. 3.23 and 3.24).
Product feedback inhibition analysis
It was observed that the incubation time of FAD with the D181A
“supermutant” affects the reaction rates. When the reaction is initiated by mixing
the reaction mixture containing FAD with D181A “supermutant”, the initial rate
is 614.7 nmole/min/mg of protein compared to that of 741.8 nmole/min/mg of
protein in the absence of FAD (Fig. 4.4). However, when the enzyme is
preincubated with FAD for 10 or 30 minutes the initial rate decreases by half
(338.5 and 315.5 nmole/min/mg of protein, respectively), suggesting that free
FAD binds slowly to the enzyme and eventually reaches equilibrium as there is
practically no change in rates between the 10 and 30 minute incubation time.
However, the rate after preincubation with FAD for 50 minutes is slightly higher
(431.5 nmole/min/mg of protein) than after the 10 or 30 minute preincubation.
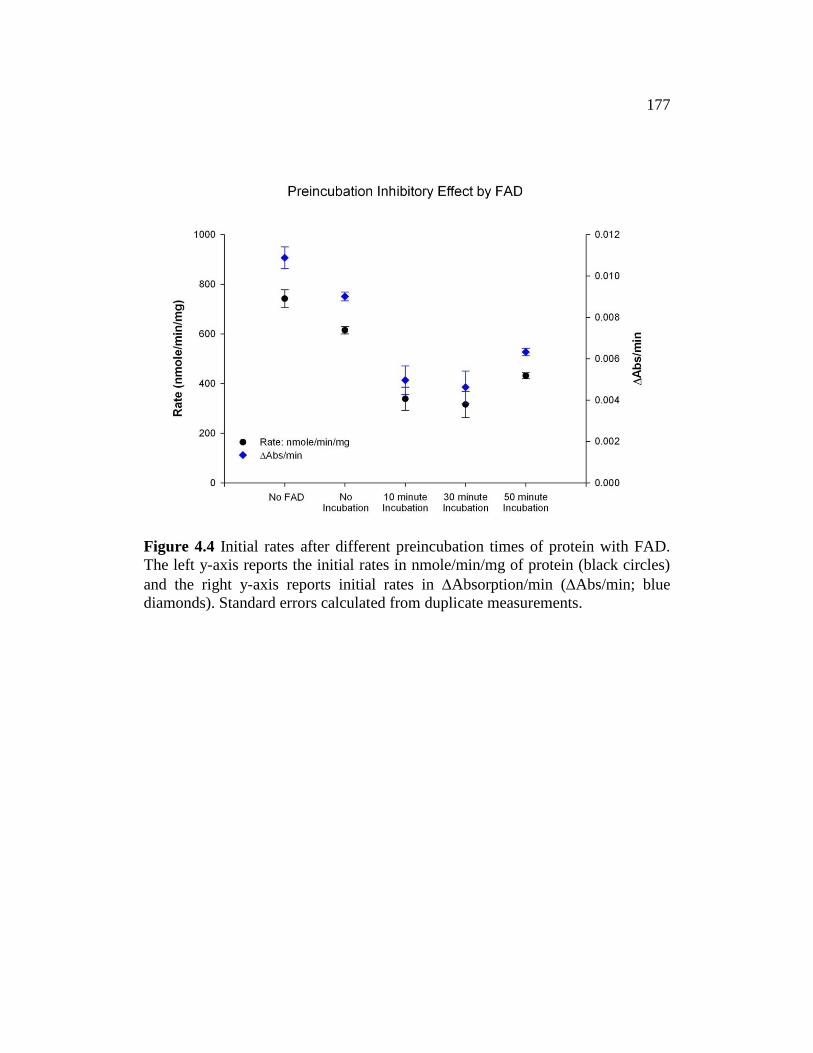
177
Figure 4.4 Initial rates after different preincubation times of protein with FAD.
The left y-axis reports the initial rates in nmole/min/mg of protein (black circles)
and the right y-axis reports initial rates in Absorption/min (Abs/min; blue
diamonds). Standard errors calculated from duplicate measurements.
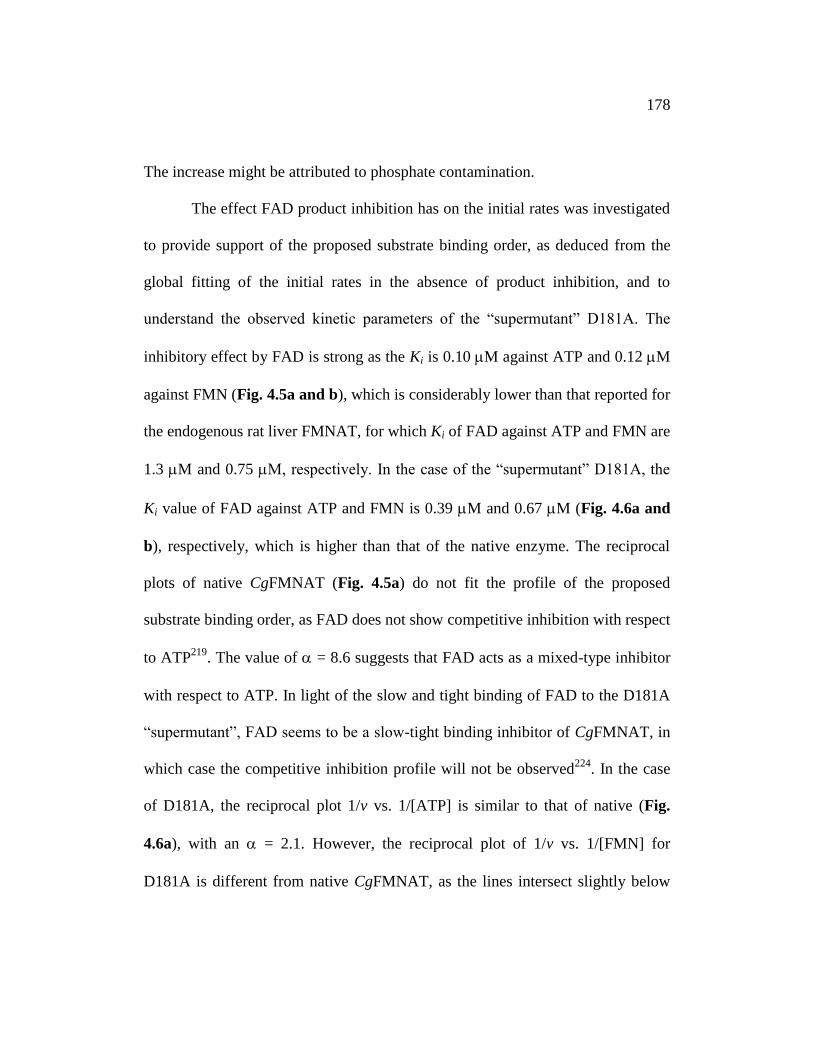
178
The increase might be attributed to phosphate contamination.
The effect FAD product inhibition has on the initial rates was investigated
to provide support of the proposed substrate binding order, as deduced from the
global fitting of the initial rates in the absence of product inhibition, and to
understand the observed kinetic parameters of the “supermutant” D181A. The
inhibitory effect by FAD is strong as the Ki is 0.10 M against ATP and 0.12 M
against FMN (Fig. 4.5a and b), which is considerably lower than that reported for
the endogenous rat liver FMNAT, for which Ki of FAD against ATP and FMN are
1.3 M and 0.75 M, respectively. In the case of the “supermutant” D181A, the
Ki value of FAD against ATP and FMN is 0.39 M and 0.67 M (Fig. 4.6a and
b), respectively, which is higher than that of the native enzyme. The reciprocal
plots of native CgFMNAT (Fig. 4.5a) do not fit the profile of the proposed
substrate binding order, as FAD does not show competitive inhibition with respect
to ATP219
. The value of = 8.6 suggests that FAD acts as a mixed-type inhibitor
with respect to ATP. In light of the slow and tight binding of FAD to the D181A
“supermutant”, FAD seems to be a slow-tight binding inhibitor of CgFMNAT, in
which case the competitive inhibition profile will not be observed224
. In the case
of D181A, the reciprocal plot 1/v vs. 1/[ATP] is similar to that of native (Fig.
4.6a), with an = 2.1. However, the reciprocal plot of 1/v vs. 1/[FMN] for
D181A is different from native CgFMNAT, as the lines intersect slightly below
179
Figure 4.5 Product inhibition of CgFMNAT by FAD. a) Initial rates represented
by the Lineweaver-Burk plots of 1/v versus 1/[ATP] at fixed FMN concentrations.
b) Initial rates represented by the Lineweaver-Burk plot of 1/v versus 1/[FMN] at
fixed ATP concentrations. The rates in a) and b) were global fitted to the velocity
equation for a general inhibition (Eq. (3)) reactant system.

180
Figure 4.6 Product inhibition of CgFMNAT D181A mutant by FAD. a) Initial
rates represented by the Lineweaver-Burk plots of 1/v versus 1/[ATP] at fixed
FMN concentrations. b) Initial rates represented by the Lineweaver-Burk plot of
1/v versus 1/[FMN] at fixed ATP concentrations. The rates in a) and b) were
global fitted to the velocity equation for a general inhibition (Eq. (3)) reactant
system.

181
the x-axis (Fig. 4.5b and 4.6b). The significance of the profile indicates that the
affinity of FMN increase in the presence the inhibitor FAD.
Proposed catalytic mechanism for CgFMNAT
The four high-resolution structures of CgFMNAT (apo form, complexes with
ATP, with substrate FMN+AMPCPP, and with products FAD+PPi) alongwith the
steady-state kinetic data allow us to envision the events in the enzyme active site
during catalysis (Fig. 4.7). In this process, ATP binds preferably first to the
enzyme as deduced from the global fitting of the steady-state kinetic data, and the
fact that the binding pocket would be partially blocked by FMN, which binds at a
site closer to the surface (Fig. 3.22a and b). Additionally, binding of ATP first
may help properly position the FMN substrate as the C8M methyl group of the
isoalloxazine ring is packed against the adenosine moiety of the bound ATP. The
binding of ATP induces small adjustment (0.3-0.5 Å) of several surrounding
residues, including Asn62, Lys65, Asp66, Ile108, and Asp168, presumably to
optimize their interactions with Mg2+
and ATP. In the presence of Mg2+
, the
phosphate tail of ATP can adopt either of the two discrete conformations I or II, in
which the Mg2+
ion position remains the same (Fig. 3.24). Upon subsequent
binding of FMN, side chains of several residues around the isoalloxazine ring,
e.g., Met143, Phe147, Asp181 and Trp184, also make small adjustments to
optimally interact with the substrate. Due to the lack of interaction between the

182
Figure 4.7 Proposed catalytic mechanism of CgFMNAT.
183
enzyme and the phosphoribityl tail of FMN, this part of the FMN substrate is
highly flexible and able to adopt multiple conformations. For the adenylation
reaction to occur, the FMN phosphate would move close to the -phosphate of
ATP for the ensuing nucleophilic attack. The presence of Mg2+
ion and interaction
with Arg297 (and potentially Arg300) of the ARG2 motif may help to
overcomethe electrostatic repulsion between the phosphate groups of the two
substrates, and position FMN phosphate for the attack on the -phosphate of
ATP. The cleavage of the -phosphodiester bond is facilitated by the
coordination of the Mg2+
ion, which is required for the reaction. The Mg2+
ATP in
the Conformer I position appears to be the catalytically competent conformation
which allows the FMN phosphate group to approach the -phosphate from the
direction opposite the -phosphate for the direct in-line nucleophilic attack (Fig.
4.8). Minimal structural rearrangements are observed after product formation. The
leaving diphosphate group is practically in the same position as the -phosphates
of the Conformer I of the nucleotide and interacts with the same set of protein
residues and Mg2+
ion. The transferred -phosphate moves about 2.5 Å away
from its original position and is now directly liganded to the Mg2+
ion (Fig. 3.24).
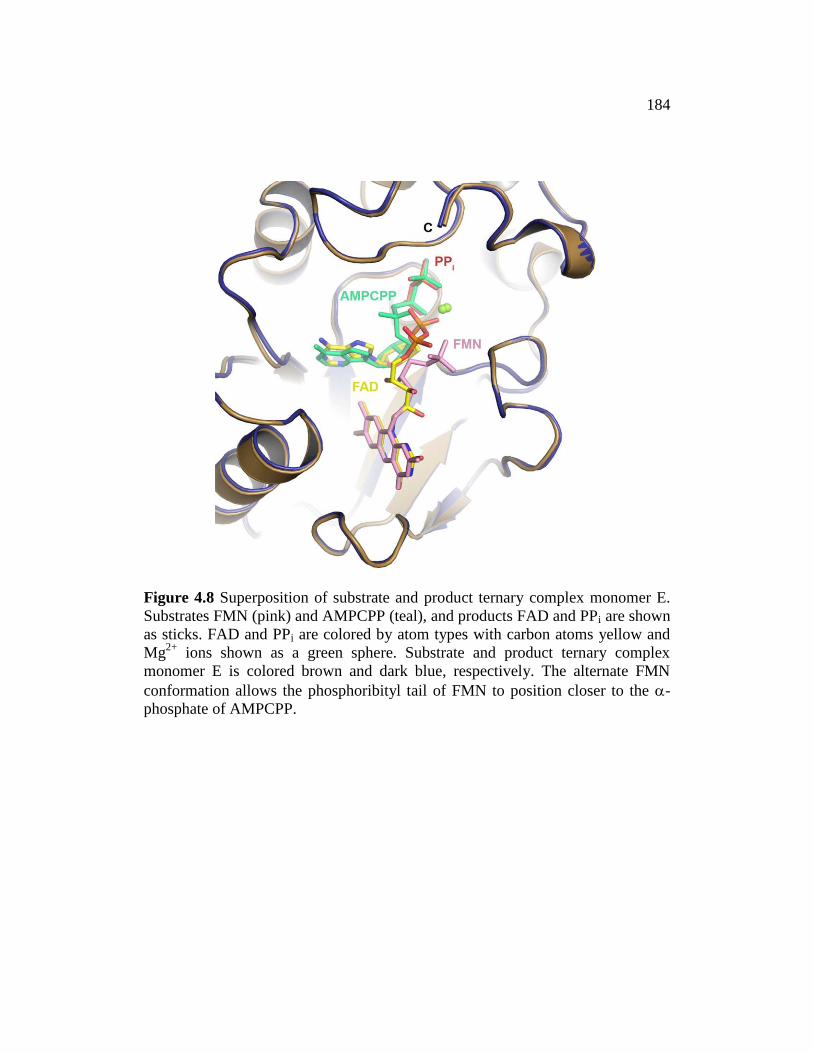
184
Figure 4.8 Superposition of substrate and product ternary complex monomer E.
Substrates FMN (pink) and AMPCPP (teal), and products FAD and PPi are shown
as sticks. FAD and PPi are colored by atom types with carbon atoms yellow and
Mg2+
ions shown as a green sphere. Substrate and product ternary complex
monomer E is colored brown and dark blue, respectively. The alternate FMN
conformation allows the phosphoribityl tail of FMN to position closer to the -
phosphate of AMPCPP.
185
DISCUSSION
Roles of the catalytic residues
Since the PP-loop motif has sequence and structural similarity within the
superfamily, a more in-depth understanding of their functional role in eukaryotic
FMNAT may be gained for N62A, N62S and D66A mutants. Of these mutants,
the most confounding is the N62A mutant that results in a decreased apparentin
the absence of a branched residue, the backbone amide of the conserved Gly64
and Lys65 in the PP-loop may provide additional interactions to - and -
phosphate of ATP. Such an interaction is observed in the superfamily for residues
equivalent to Lys65 (Fig. 3.29). Presumably, mutating Asn62 to a Ser should
maintain the hydrogen bond to the -phosphate of ATP and thus still permit the
enzyme to synthesize FAD. Interestingly, the N62S mutant results in a practically
dead enzyme. At the moment, there is no clear explanation for this observation. A
potential explanation is that the orientation of the phosphates of ATP change upon
mutating Asn62 to a Ser, which could be similar to that observed for the
nucleotide in ATP sulfurylase139
and NH3+
-dependent NAD synthetase201
(Fig.
3.29c and d). The conformation of the nucleotide observed in ATP sulfurylase
and NH3+
-dependent NAD synthetase may impede the nucleophilic attack by
FMN on the -phosphate of ATP in CgFMNAT. The critical catalytic role of the

186
well conserved Asp66 of the PP-loop is confirmed as the D66A mutant produced
a catalytic dead enzyme. Since an equivalent aspartate directly coordinates the
catalytic Mg2+
ion for members of the superfamily, a catalytic dead enzyme
should occur upon mutation.
The crystal structures of CgFMNAT revealed for the first time the detailed
interactions between the enzyme and the flavin substrate, which are different from
that observed in all other flavoproteins. Unexpectedly, there is a lack of
interaction between the enzyme and the phosphoribityl tail of FMN. In order for
the adenylation reaction to proceed, the phosphoribityl tail of FMN is required to
move closer to the -phosphate of ATP for the ensuing nucleophilic attack. The
crystal structures suggest that Arg297 of the ARG2 motif may interact with the
FMN phosphate and position it for the ensuing nucleophilic attack on the -
phosphate of ATP (Fig. 3.23 and 4.8). Such an interaction is supported by the
results from the R297A mutant, where an ~3 times increase in the apparent Km,FMN
is observed. Interestingly, R297A also has an increased apparent Km,ATP,
suggesting Arg297 also has a direct interaction with ATP. Although not observed
in the crystal structure (Fig. 3.18b), the proximity of the Arg297 side chain to
both phosphates of the FAD product, which comes from the ATP -phosphate
and FMN phosphate, it is reasonable to speculate that Arg297 could be involved
187
in the interaction with the phosphate groups of both substrates, and help to
position them for the nucleophilic attack and the adenylyltransfer reaction.
Interaction between ATP and FMN binding site
The most unexpected results are obtained with the “supermutant” D181A.
The Asp181 is shown to form two hydrogen bonds with the hetero-atom groups at
the hydrophilic edge of the isoalloxazine ring. However the “supermutant”
D181A results in no appreciable change in the apparent Km,FMN. Instead, the
apparent Km,ATP increases ~3 times that of native CgFMNAT. A potential
explanation is the loop connecting 5 to 6 that is part of the flavin motif, which
contains the mutant, becomes more flexible. For this explanation, the flexibility of
the loop minimally perturbs the FMN interactions, but promotes instability in the
binding of ATP. In any case, the D181A “supermutant” suggests that for the
native CgFMNAT, the substrate FMN plays a key role in maintaining the ATP
inside the binding site. The W184A mutant also increases the apparent Km,ATP.
However, the effect is in conjunction with a substantial increase in the apparent
Km,FMN, which is opposite to that of the D181A “supermutant”.
In light of the D181A “supermutant” affecting the apparent Km,ATP rather
than the apparent Km,FMN, an alternant role of Arg297 is postulated. The R297A
“supermutant” results in an increased apparent Km,FMN greater than that for
D181A, in which Asp181 is shown in the crystal structures to have more direct

188
interactions with the flavin substrate. Therefore, the increase in the apparent
Km,FMN by R297A “supermutant” must be derived from another source of direct
interaction. The ~3 times increased apparent Km,FMN by the R297A “supermutant”
may be a direct result from the ~5 times increased apparent Km,ATP. For such a
case, the stability of ATP may have a direct affect on the binding of FMN in the
substrate binding pocket. As shown in the crystal structures, the C8M methyl
group of the isoalloxazine ring is packed against the adenosine moiety of the
bound ATP (Fig. 3.21). Support for the proposal comes from Bowers-Komro,
DM et al150
studying the effect of FMN analogs on FAD biosynthesis. Replacing
the C7M and C8M methyl groups with a strong electronegative 7,8-dichloro-
FMN or less electronegative 7,8-dibromo-FMN analogue resulted in an increase
and decrease of Km,FMN, respectively, compared to FMN150
. Suggesting the C8
position of the isoalloxazine ring forms a favorable interaction with the adenine of
ATP. Thus, upon formation of the Mg2+
ATP binary complex an interaction site is
formed for the C8 position of the isoalloxazine ring. Absent from the study is the
effect of the FMN analogues on Km,ATP. From our study and Bowers-Komro, DM
et al150
, the interaction between ATP and FMN appear to be synergistic, whereby
a properly positioned ATP affects FMN binding and a properly positioned FMN
affects ATP binding, which provides more stability to each substrate.

189
Product inhibition of CgFMNAT
The fact that D181A results in no appreciable change in the Km,FMN means
Asp181 has an alternant role other than providing necessary stability for FMN in
the binding site. Instead, the “supermutant” D181A has a much faster kcat, ~9
times of the native enzyme. Since D181 is located far away from the catalytic
sites and unlikely to affect the chemistry step of the adenylyl transfer, the only
explanation is that it is primarily involved in regulating product release. Thus,
product release is the rate limiting step of the reaction. The fact that Asp181 is
involved in product release is also supported by FAD not co-purifying with
D181A “supermutant”, as it did with the native CgFMNAT. A similar effect is
also observed for Arg297. However, Arg297 may not contribute much to
regulating product release, as the turnover rate (kcat) is ~4 times less than D181A,
and the fact that FAD partially co-purifies with the R297A “supermutant”. These
“supermutants” provide support for earlier kinetic studies of rat liver FMNAT that
revealed the enzyme is markedly inhibited by the product FAD and suggested that
the biosynthesis of FAD is most likely regulated by product FAD at the last
FMNAT step of the pathway145
.
To corroborate CgFMNAT has the same substrate binding order of ATP
first followed by FMN, as described for rat liver FMNAT145
, product inhibition by
FAD was performed. Yamada Y. et al145
was able to propose a substrate binding

190
order based on FAD displaying competitive inhibition with respect to ATP.
However, we could not obtain the same results with CgFMNAT probably because
FAD has a slow-tight binding mode. Consequently, the inhibition kinetics has a
mixed-type characteristic, which is in-line with slow-tight binding inhibitors224
.
Instead, support for our proposed substrate binding order that ATP binds
first followed by FMN comes from the “supermutants” D181A and R297A.
Since, the lines intersect on the 1/v-axis for the Lineweaver-Burk plot of 1/v vs.
1/[FMN], an ordered bi-bi substrate binding mechanism was proposed219
(Fig.
4.2b). A potential explanation of the behavior is the effect ATP has on the binding
of FMN, as shown with the “supermutant” R297A. The “supermutant” results in
an increased apparent Km,FMN, indicating that binding of ATP increases the
stability of FMN. However, overcoming the dependence of ATP is shown with
the “supermutant” D181A. Therefore, increasing the concentration of FMN at low
ATP concentration, the same Vmax can be obtained as in the saturating
condition219
. A product release order is supported by the fact that during the
crystallization of native CgFMNAT, which co-purifies with FAD, the addition of
PPi is needed in order to form single crystals, indicating PPi releases first before
FAD.
A structure guided steady-state kinetic and mutagenesis study elaborated
on the residues defining the substrate binding site and highlighted the inter-

191
dependency of the two substrates. The study also provided the first detailed
description about the catalytic process and characterization of important catalytic
residues. Our study identified two “supermutants”, D181A of the flavin motif and
R297A of the ARG2 motif, which affect substrate binding but have faster
turnover rates probably due to an alleviated product inhibition. As such, the
residues may be referred to as “gate-keepers” of the product FAD. The kinetic
studies provided additional information that the product release may be the rate
limiting step of the CgFMNAT catalyzed reaction.

192
CHAPTER 5
Conclusions and future directions
Characterization of eukaryotic FMNAT began in 1949 with the partial
purification of the enzyme from brewer’s yeast (S. cerevisiae)225
. Since then many
studies of this essential enzyme have been carried out in a number of eukaryotic
species72,73,111-113,226
. Extensive biochemical studies have been performed for rat
liver FMNAT that span from product inhibition, specificity for flavin analogues,
alternative nucleotide triphosphate substrate and cation requirement145,146,150
.
However, the three dimensional structure and detailed active site architecture of
the enzyme remained unknown.
Over a half century later the first structure of a eukaryotic FMNAT from
yeast Candida glabrata, an opportunistic yeast pathogen, is presented in four
different complex states through the use of X-ray crystallography, with
resolutions ranging from 1.20-1.95 Å. These high resolution structures (apo-form,
and complexes with ATP, AMPCPPMg2+
+FMN and PPiMg2+
+FAD) of this
essential enzyme revealed the overall structure of CgFMNAT and the
architectures of the substrate binding and catalytic sites, which provided insight
into the structural basis of the kinetic properties of the enzymes145
. In addition to

193
maintaining the well conserved PP-loop and ADE motifs in the adenine
nucleotide hydrolase-like superfamily, eukaryotic FMNATs also has the
nucleotide binding motifs ARG1138
and ARG2 (Fig. 2.17 and Fig. 3.28), as well
as the -phosphate motif. Furthermore, eukaryotic FMNAT has a different PP-
loop consensus sequence of “SYNGGKDC,” which contains an Asn, Lys, and
Cys residues (Fig. 3.22 and 3.28). The additional SQFD-loop and the elaborate
organization of the C-terminal domain are also unique structural elements in
CgFMNAT, which are shared with the S. cerevisiae enzyme (Fig. 3.22).
Aside from the shared nucleotide binding motifs, the evolutionary
relationship of eukaryotic FMNAT to the PAPS reductase-like family proteins
seems to reside in the core fold that permits a FMN binding site (Fig. 3.27). As a
result, based on the substrate and product ternary complexes, the flavin binding
site (termed flavin motif) has no sequence and structural similarity to other known
flavoproteins. Additionally, the flavin binding mode in the substrate binding site
and the conformation of the bent FAD in CgFMNAT is also unique. It is different
from all other FAD-binding proteins with known 3D structures based on the 2001
survey by Dym and Eisenberg209
. The uniqueness of the flavin binding mode may
pose as an opportunity to selectively target yeast pathogens, such as the
pathogenic Candida species that cause invasive candidiasis and candidemia164-167
,
without affecting other FAD binding proteins in humans and potentially human

194
FMNAT. To accomplish such a task, more information is required from human
FMNAT that includes variations within the substrate binding site, which our
research may help foster.
The structure guided site-directed mutagenesis allowed the discovery of
two “supermutants”, D181A and R297A. D181 of the flavin motif is implicated in
regulating product release as the turnover rate for the D181A mutant increases ~9
times with minimal change in the apparent Km,FMN when compared to native
CgFMNAT. This result suggests that product release is likely the rate limiting
step of the reaction. As for R297 of the ARG2 motif, the involvement in product
release is also implicated, though to a lesser extent, as the R297A mutant
increases the turnover rate only ~2 times. With the identification of the two
“supermutants”, the term “gate-keeper” is given to these two residues (D181 and
R297) based on the kinetic parameters. Furthermore, FAD doesn’t co-purify with
D181A mutant and co-purifies to a smaller degree with the R297A mutant (data
not shown).
Structural analysis of CgFMNAT complex states and data from the site-
directed mutagenesis suggests further research to understand the catalytic process,
product inhibition, product FAD release, and potential cellular cues that may
regulate FAD synthesis and release. One of the first studies to undertake is
defining the role of the Asn residue in the PP-loop. The N62S mutant generates a

195
dead enzyme for reasons we can only speculate. Structure determination of the
mutant in an ATP binary or substrate ternary complex state is the key to
understanding the mechanism for such an outcome. As the D181A mutant
resulted in a ~4–7 times decrease in the Ki value of FAD when compared to native
CgFMNAT, the Ki value is still in the nano-Molar range. However, FAD doesn’t
co-purify with the “supermutant”, suggesting that the affinity of the FAD to the
“supermutant” enzyme is much lower than the wild-type CgFMNAT.
Determining the binding affinity (Kd) and the off rate (koff) for FAD will aide in
understanding whether FAD release is the rate limiting step. A glucose molecule
was observed to interact with CgFMNAT in the apo-form and product ternary
complex. Whether the site of interaction is a crystallographic artifact or possesses
an actual protein-protein or protein-ligand interaction site, can be partially
investigated by the effect different glucose concentrations have on the initial rates
in steady-state kinetics. To this end, a larger question can be asked that pertains to
eukaryotic FMNAT associating with other proteins that may regulate catalysis
and FAD release.
One of the first observations that may suggest CgFMNAT participates in
protein-protein interaction comes from the C-terminal domain of CgFMNAT
composed of a roughly flat surface. From an electrostatic surface potential view, a
negatively charged pocket exists on this face of the molecule, flanked by a

196
positively charged patch on the left and a negatively charged patch on the right
(Fig. 2.10a and 2.10b). In the ternary complexes, the negatively charge pocket
changes shape and size, that leads to changes of the electrostatic surface potential.
Due to the nature of the surface shape and electrostatic potential, the region of the
C-terminal domain can be proposed as a potential protein-protein interaction site.
A possible candidate would be the MoCo-binding protein-like domain that is in
the gene encoding FMNAT in higher eukaryotes (Fig. 1.9). A protein with 27%
sequence identity to the MoCo-binding protein-like domain exists in C. glabrata
(gi:50286295) and can be purified. Spectroscopic analysis can be performed to
determine if a metabolite co-purifies with the “MoCo” protein. Determining if the
“MoCo” protein interacts with CgFMNAT can be investigated by mixing the
proteins together and measuring FMNAT activity in the presence of the “MoCo”
protein. Further investigations into the potential protein-protein interaction can be
done with isothermal calorimetry and X-ray crystallography to determine the site
of interaction, as well as with site-directed mutagenesis.
Secondly, CgFMNAT is homologous in sequence and structure to
members of the PAPS reductase-like family, for which their respective catalysis is
modulated through protein-protein interactions138,139
. As shown in Chapter 2,
CgFMNAT fits into the equivalent position as ATP sulfurylase in a complex with
a regulatory G protein (CysN), with minimal structure clashes (Fig. 2.19a). In a

197
study by Davierwala AP et al, ScFMNAT was shown to interact with Cdc42, a
Rho-like small GTPase, in a yeast-two-hybrid screen227
. Lastly, in bacterial FADS
the FMNAT domain is associated with RFK domain71,109
. Whether eukaryotic
FMNAT associates with RFK is not known.
In closing, our high-resolution structures of yeast FMNAT presents the
first characterization of a eukaryotic version of this essential enzyme. The
structures and kinetic studies provided many new insights into the architecture
and function of the enzyme. The structural comparison between eukaryotic and
bacterial FMNATs delineated the structural differences in the substrate binding
sites. With the essentiality of bacterial FMNAT already established
experimentally, the significant differences between eukaryotic and bacterial
FMNATs may promote the development of selective anti-infectious drugs
towards pathogenic bacteria. Moreover, two “supermutants” were discovered that
increased the turnover rates and allowed identification of two residues functioning
as “gate-keepers” of FAD. To determine whether their biological significance is
in the maintenance of FAD homeostasis, which is important in eukaryotic cellular
processes, will require in vivo studies. As such, the outcome of the current studies
may facilitate the development of novel anti-infectious drugs and lead to profound
changes in our understanding of the way RFK and FMNAT function in the cell.

198
REFERENCES
1. Massey, V. (2000). The chemical and biological versatility of riboflavin.
Biochem Soc Trans 28, 283-96.
2. Joosten, V. & van Berkel, W. J. (2007). Flavoenzymes. Curr Opin Chem
Biol 11, 195-202.
3. Merrill, A. H., Jr., Lambeth, J. D., Edmondson, D. E. & McCormick, D.
B. (1981). Formation and mode of action of flavoproteins. Annu Rev Nutr
1, 281-317.
4. (1991). Chemistry and Biochemistry of Flavoenzymes (Müller, F., Ed.), I,
CRC Press, Boca Raton, FL.
5. Powers, H. J. (2003). Riboflavin (vitamin B-2) and health. Am J Clin Nutr
77, 1352-60.
6. De Colibus, L. & Mattevi, A. (2006). New frontiers in structural
flavoenzymology. Curr Opin Struct Biol 16, 722-8.
7. Mansoorabadi, S. O., Thibodeaux, C. J. & Liu, H. W. (2007). The diverse
roles of flavin coenzymes--nature's most versatile thespians. J Org Chem
72, 6329-42.
8. Salomon, M., Christie, J. M., Knieb, E., Lempert, U. & Briggs, W. R.
(2000). Photochemical and mutational analysis of the FMN-binding
domains of the plant blue light receptor, phototropin. Biochemistry 39,
9401-10.
9. Crosson, S. & Moffat, K. (2002). Photoexcited structure of a plant
photoreceptor domain reveals a light-driven molecular switch. Plant Cell
14, 1067-75.
10. Mewies, M., McIntire, W. S. & Scrutton, N. S. (1998). Covalent
attachment of flavin adenine dinucleotide (FAD) and flavin
mononucleotide (FMN) to enzymes: the current state of affairs. Protein
Sci 7, 7-20.
11. Huang, C. H., Lai, W. L., Lee, M. H., Chen, C. J., Vasella, A., Tsai, Y. C.
& Liaw, S. H. (2005). Crystal structure of glucooligosaccharide oxidase

199
from Acremonium strictum: a novel flavinylation of 6-S-cysteinyl, 8alpha-
N1-histidyl FAD. J Biol Chem 280, 38831-8.
12. Massey, V. (1994). Activation of molecular oxygen by flavins and
flavoproteins. J Biol Chem 269, 22459-62.
13. Mattevi, A., Vanoni, M. A., Todone, F., Rizzi, M., Teplyakov, A., Coda,
A., Bolognesi, M. & Curti, B. (1996). Crystal structure of D-amino acid
oxidase: a case of active site mirror-image convergent evolution with
flavocytochrome b2. Proc Natl Acad Sci U S A 93, 7496-501.
14. van Berkel, W. J. H. (2008). Chemistry of Flavoenzymes. In Wiley
Encyclopedia of Chemical Biology August 15, 2008 edit. John Wiley &
Sons, Inc.
15. Shi, Y., Lan, F., Matson, C., Mulligan, P., Whetstine, J. R., Cole, P. A.,
Casero, R. A. & Shi, Y. (2004). Histone demethylation mediated by the
nuclear amine oxidase homolog LSD1. Cell 119, 941-53.
16. Forneris, F., Binda, C., Dall'Aglio, A., Fraaije, M. W., Battaglioli, E. &
Mattevi, A. (2006). A highly specific mechanism of histone H3-K4
recognition by histone demethylase LSD1. J Biol Chem 281, 35289-95.
17. Ballas, N., Grunseich, C., Lu, D. D., Speh, J. C. & Mandel, G. (2005).
REST and its corepressors mediate plasticity of neuronal gene chromatin
throughout neurogenesis. Cell 121, 645-57.
18. Saleque, S., Kim, J., Rooke, H. M. & Orkin, S. H. (2007). Epigenetic
regulation of hematopoietic differentiation by Gfi-1 and Gfi-1b is
mediated by the cofactors CoREST and LSD1. Mol Cell 27, 562-72.
19. Metzger, E., Wissmann, M., Yin, N., Muller, J. M., Schneider, R., Peters,
A. H., Gunther, T., Buettner, R. & Schule, R. (2005). LSD1 demethylates
repressive histone marks to promote androgen-receptor-dependent
transcription. Nature 437, 436-9.
20. Kahl, P., Gullotti, L., Heukamp, L. C., Wolf, S., Friedrichs, N.,
Vorreuther, R., Solleder, G., Bastian, P. J., Ellinger, J., Metzger, E.,
Schule, R. & Buettner, R. (2006). Androgen receptor coactivators lysine-
200
specific histone demethylase 1 and four and a half LIM domain protein 2
predict risk of prostate cancer recurrence. Cancer Res 66, 11341-7.
21. Culhane, J. C. & Cole, P. A. (2007). LSD1 and the chemistry of histone
demethylation. Curr Opin Chem Biol 11, 561-8.
22. Shi, Y. (2007). Histone lysine demethylases: emerging roles in
development, physiology and disease. Nat Rev Genet 8, 829-33.
23. Ye, H., Cande, C., Stephanou, N. C., Jiang, S., Gurbuxani, S., Larochette,
N., Daugas, E., Garrido, C., Kroemer, G. & Wu, H. (2002). DNA binding
is required for the apoptogenic action of apoptosis inducing factor. Nat
Struct Biol 9, 680-4.
24. Mate, M. J., Ortiz-Lombardia, M., Boitel, B., Haouz, A., Tello, D., Susin,
S. A., Penninger, J., Kroemer, G. & Alzari, P. M. (2002). The crystal
structure of the mouse apoptosis-inducing factor AIF. Nat Struct Biol 9,
442-6.
25. Susin, S. A., Lorenzo, H. K., Zamzami, N., Marzo, I., Snow, B. E.,
Brothers, G. M., Mangion, J., Jacotot, E., Costantini, P., Loeffler, M.,
Larochette, N., Goodlett, D. R., Aebersold, R., Siderovski, D. P.,
Penninger, J. M. & Kroemer, G. (1999). Molecular characterization of
mitochondrial apoptosis-inducing factor. Nature 397, 441-6.
26. Yu, S. W., Wang, H., Poitras, M. F., Coombs, C., Bowers, W. J., Federoff,
H. J., Poirier, G. G., Dawson, T. M. & Dawson, V. L. (2002). Mediation
of poly(ADP-ribose) polymerase-1-dependent cell death by apoptosis-
inducing factor. Science 297, 259-63.
27. Miramar, M. D., Costantini, P., Ravagnan, L., Saraiva, L. M., Haouzi, D.,
Brothers, G., Penninger, J. M., Peleato, M. L., Kroemer, G. & Susin, S. A.
(2001). NADH oxidase activity of mitochondrial apoptosis-inducing
factor. J Biol Chem 276, 16391-8.
28. Vahsen, N., Cande, C., Briere, J. J., Benit, P., Joza, N., Larochette, N.,
Mastroberardino, P. G., Pequignot, M. O., Casares, N., Lazar, V., Feraud,
O., Debili, N., Wissing, S., Engelhardt, S., Madeo, F., Piacentini, M.,
Penninger, J. M., Schagger, H., Rustin, P. & Kroemer, G. (2004). AIF
deficiency compromises oxidative phosphorylation. Embo J 23, 4679-89.
201
29. Joza, N., Oudit, G. Y., Brown, D., Benit, P., Kassiri, Z., Vahsen, N.,
Benoit, L., Patel, M. M., Nowikovsky, K., Vassault, A., Backx, P. H.,
Wada, T., Kroemer, G., Rustin, P. & Penninger, J. M. (2005). Muscle-
specific loss of apoptosis-inducing factor leads to mitochondrial
dysfunction, skeletal muscle atrophy, and dilated cardiomyopathy. Mol
Cell Biol 25, 10261-72.
30. Klein, J. A., Longo-Guess, C. M., Rossmann, M. P., Seburn, K. L., Hurd,
R. E., Frankel, W. N., Bronson, R. T. & Ackerman, S. L. (2002). The
harlequin mouse mutation downregulates apoptosis-inducing factor.
Nature 419, 367-74.
31. Terman, J. R., Mao, T., Pasterkamp, R. J., Yu, H. H. & Kolodkin, A. L.
(2002). MICALs, a family of conserved flavoprotein oxidoreductases,
function in plexin-mediated axonal repulsion. Cell 109, 887-900.
32. Nadella, M., Bianchet, M. A., Gabelli, S. B., Barrila, J. & Amzel, L. M.
(2005). Structure and activity of the axon guidance protein MICAL. Proc
Natl Acad Sci U S A 102, 16830-5.
33. Siebold, C., Berrow, N., Walter, T. S., Harlos, K., Owens, R. J., Stuart, D.
I., Terman, J. R., Kolodkin, A. L., Pasterkamp, R. J. & Jones, E. Y.
(2005). High-resolution structure of the catalytic region of MICAL
(molecule interacting with CasL), a multidomain flavoenzyme-signaling
molecule. Proc Natl Acad Sci U S A 102, 16836-41.
34. Pasterkamp, R. J., Dai, H. N., Terman, J. R., Wahlin, K. J., Kim, B.,
Bregman, B. S., Popovich, P. G. & Kolodkin, A. L. (2006). MICAL
flavoprotein monooxygenases: expression during neural development and
following spinal cord injuries in the rat. Mol Cell Neurosci 31, 52-69.
35. Pollegioni, L., Piubelli, L., Sacchi, S., Pilone, M. S. & Molla, G. (2007).
Physiological functions of D-amino acid oxidases: from yeast to humans.
Cell Mol Life Sci 64, 1373-94.
36. Kleckner, N. W. & Dingledine, R. (1988). Requirement for glycine in
activation of NMDA-receptors expressed in Xenopus oocytes. Science
241, 835-7.
202
37. Baranano, D. E., Ferris, C. D. & Snyder, S. H. (2001). Atypical neural
messengers. Trends Neurosci 24, 99-106.
38. Harrison, P. J. & Owen, M. J. (2003). Genes for schizophrenia? Recent
findings and their pathophysiological implications. Lancet 361, 417-9.
39. Katsuki, H., Nonaka, M., Shirakawa, H., Kume, T. & Akaike, A. (2004).
Endogenous D-serine is involved in induction of neuronal death by N-
methyl-D-aspartate and simulated ischemia in rat cerebrocortical slices. J
Pharmacol Exp Ther 311, 836-44.
40. Sasamura, T., Matsuda, A. & Kokuba, Y. (2002). Determination of D-
amino acid oxidase activity in tumour cells. Ann Clin Biochem 39, 595-8.
41. Stegman, L. D., Zheng, H., Neal, E. R., Ben-Yoseph, O., Pollegioni, L.,
Pilone, M. S. & Ross, B. D. (1998). Induction of cytotoxic oxidative stress
by D-alanine in brain tumor cells expressing Rhodotorula gracilis D-
amino acid oxidase: a cancer gene therapy strategy. Hum Gene Ther 9,
185-93.
42. Shih, J. C., Chen, K. & Ridd, M. J. (1999). Monoamine oxidase: from
genes to behavior. Annu Rev Neurosci 22, 197-217.
43. Krishnan, K. R. (2007). Revisiting monoamine oxidase inhibitors. J Clin
Psychiatry 68 Suppl 8, 35-41.
44. Fischer, M. & Bacher, A. (2005). Biosynthesis of flavocoenzymes. Nat
Prod Rep 22, 324-50.
45. Bacher, A., Eberhardt, S., Fischer, M., Kis, K. & Richter, G. (2000).
Biosynthesis of vitamin b2 (riboflavin). Annu Rev Nutr 20, 153-67.
46. Ritz, H., Schramek, N., Bracher, A., Herz, S., Eisenreich, W., Richter, G.
& Bacher, A. (2001). Biosynthesis of riboflavin: studies on the mechanism
of GTP cyclohydrolase II. J Biol Chem 276, 22273-7.
47. Baugh, C. M. & Krumdieck, C. L. (1969). Biosynthesis of riboflavine in
Corynebacterium species: the purine precursor. J Bacteriol 98, 1114-9.
203
48. Mailander, B. & Bacher, A. (1976). Biosynthesis of riboflavin. Structure
of the purine precursor and origin of the ribityl side chain. J Biol Chem
251, 3623-8.
49. Foor, F. & Brown, G. M. (1975). Purification and properties of guanosine
triphosphate cyclohydrolase II from Escherichia coli. J Biol Chem 250,
3545-51.
50. Graham, D. E., Xu, H. & White, R. H. (2002). A member of a new class of
GTP cyclohydrolases produces formylaminopyrimidine nucleotide
monophosphates. Biochemistry 41, 15074-84.
51. Burrows, R. B. & Brown, G. M. (1978). Presence of Escherichia coli of a
deaminase and a reductase involved in biosynthesis of riboflavin. J
Bacteriol 136, 657-67.
52. Fischer, M., Romisch, W., Saller, S., Illarionov, B., Richter, G., Rohdich,
F., Eisenreich, W. & Bacher, A. (2004). Evolution of vitamin B2
biosynthesis: structural and functional similarity between pyrimidine
deaminases of eubacterial and plant origin. J Biol Chem 279, 36299-308.
53. Richter, G., Fischer, M., Krieger, C., Eberhardt, S., Luttgen, H.,
Gerstenschlager, I. & Bacher, A. (1997). Biosynthesis of riboflavin:
characterization of the bifunctional deaminase-reductase of Escherichia
coli and Bacillus subtilis. J Bacteriol 179, 2022-8.
54. Chen, S. C., Chang, Y. C., Lin, C. H., Lin, C. H. & Liaw, S. H. (2006).
Crystal structure of a bifunctional deaminase and reductase from Bacillus
subtilis involved in riboflavin biosynthesis. J Biol Chem 281, 7605-13.
55. Stenmark, P., Moche, M., Gurmu, D. & Nordlund, P. (2007). The crystal
structure of the bifunctional deaminase/reductase RibD of the riboflavin
biosynthetic pathway in Escherichia coli: implications for the reductive
mechanism. J Mol Biol 373, 48-64.
56. Chatwell, L., Krojer, T., Fidler, A., Romisch, W., Eisenreich, W., Bacher,
A., Huber, R. & Fischer, M. (2006). Biosynthesis of riboflavin: structure
and properties of 2,5-diamino-6-ribosylamino-4(3H)-pyrimidinone 5'-
phosphate reductase of Methanocaldococcus jannaschii. J Mol Biol 359,
1334-51.

204
57. Graupner, M., Xu, H. & White, R. H. (2002). The pyrimidine nucleotide
reductase step in riboflavin and F(420) biosynthesis in archaea proceeds
by the eukaryotic route to riboflavin. J Bacteriol 184, 1952-7.
58. Bacher, A. & Lingens, F. (1970). Biosynthesis of riboflavin. Formation of
2,5-diamino-6-hydroxy-4-(1'-D-ribitylamino)pyrimidine in a riboflavin
auxotroph. J Biol Chem 245, 4647-52.
59. Keller, P. J., Le Van, Q., Kim, S. U., Bown, D. H., Chen, H. C., Kohnle,
A., Bacher, A. & Floss, H. G. (1988). Biosynthesis of riboflavin:
mechanism of formation of the ribitylamino linkage. Biochemistry 27,
1117-20.
60. Sadique, J., Shanmugasundaram, R. & Shanmugasundaram, E. R. (1966).
Isolation of 5-amino-4-ribitylaminouracil from a riboflavineless mutant of
Aspergillus nidulans. Biochem J 101, 2C-3C.
61. Harzer, G., Rokos, H., Otto, M. K., Bacher, A. & Ghisla, S. (1978).
Biosynthesis of riboflavin. 6,7-Dimethyl-8-ribityllumazine 5'-phosphate is
not a substrate for riboflavin synthase. Biochim Biophys Acta 540, 48-54.
62. Neuberger, G. & Bacher, A. (1986). Biosynthesis of riboflavin. Enzymatic
formation of 6,7-dimethyl-8-ribityllumazine by heavy riboflavin synthase
from Bacillus subtilis. Biochem Biophys Res Commun 139, 1111-6.
63. Kis, K., Volk, R. & Bacher, A. (1995). Biosynthesis of riboflavin. Studies
on the reaction mechanism of 6,7-dimethyl-8-ribityllumazine synthase.
Biochemistry 34, 2883-92.
64. Volk, R. & Bacher, A. (1990). Studies on the 4-carbon precursor in the
biosynthesis of riboflavin. Purification and properties of L-3,4-dihydroxy-
2-butanone-4-phosphate synthase. J Biol Chem 265, 19479-85.
65. Volk, R. & Bacher, A. (1991). Biosynthesis of riboflavin. Studies on the
mechanism of L-3,4-dihydroxy-2-butanone 4-phosphate synthase. J Biol
Chem 266, 20610-8.
66. Harvey, R. A. & Plaut, G. W. (1966). Riboflavin synthetase from yeast.
Properties of complexes of the enzyme with lumazine derivatives and
riboflavin. J Biol Chem 241, 2120-36.

205
67. Plaut, G. W. (1963). Studies on the nature of the enzymic conversion of
6,7-dimethyl-8-ribityllumazine to riboflavin. J Biol Chem 238, 2225-43.
68. Plaut, G. W., Beach, R. L. & Aogaichi, T. (1970). Studies on the
mechanism of elimination of protons from the methyl groups of 6,7-
dimethyl-8-ribityllumazine by riboflavin synthetase. Biochemistry 9, 771-
85.
69. Wacker, H., Harvey, R. A., Winestock, C. H. & Plaut, G. W. (1964). 4-(1'-
D-Ribitylamino)-5-Amino-2,6-Dihydroxypyrimidine, the Second Product
of the Riboflavin Synthetase Reaction. J Biol Chem 239, 3493-7.
70. Efimov, I., Kuusk, V., Zhang, X. & McIntire, W. S. (1998). Proposed
steady-state kinetic mechanism for Corynebacterium ammoniagenes FAD
synthetase produced by Escherichia coli. Biochemistry 37, 9716-23.
71. Manstein, D. J. & Pai, E. F. (1986). Purification and characterization of
FAD synthetase from Brevibacterium ammoniagenes. J. Biol. Chem. 261,
16169-16173.
72. Santos, M. A., Jimenez, A. & Revuelta, J. L. (2000). Molecular
characterization of FMN1, the structural gene for the monofunctional
flavokinase of Saccharomyces cerevisiae. J. Biol. Chem. 275, 28618-
28624.
73. Wu, M., Repetto, B., Glerum, D. M. & Tzagoloff, A. (1995). Cloning and
characterization of FAD1, the structural gene for flavin adenine
dinucleotide synthetase of Saccharomyces cerevisiae. Mol Cell Biol 15,
264-71.
74. Mashhadi, Z., Zhang, H., Xu, H. & White, R. H. (2008). Identification and
characterization of an archaeon-specific riboflavin kinase. J Bacteriol 190,
2615-8.
75. Ammelburg, M., Hartmann, M. D., Djuranovic, S., Alva, V., Koretke, K.
K., Martin, J., Sauer, G., Truffault, V., Zeth, K., Lupas, A. N. & Coles, M.
(2007). A CTP-dependent archaeal riboflavin kinase forms a bridge in the
evolution of cradle-loop barrels. Structure 15, 1577-90.
206
76. Bereswill, S., Hinkelmann, S., Kist, M. & Sander, A. (1999). Molecular
analysis of riboflavin synthesis genes in Bartonella henselae and use of the
ribC gene for differentiation of Bartonella species by PCR. J Clin
Microbiol 37, 3159-66.
77. Fuller, T. E. & Mulks, M. H. (1995). Characterization of Actinobacillus
pleuropneumoniae riboflavin biosynthesis genes. J Bacteriol 177, 7265-
70.
78. Lee, C. Y., O'Kane, D. J. & Meighen, E. A. (1994). Riboflavin synthesis
genes are linked with the lux operon of Photobacterium phosphoreum. J
Bacteriol 176, 2100-4.
79. Fassbinder, F., Kist, M. & Bereswill, S. (2000). Structural and functional
analysis of the riboflavin synthesis genes encoding GTP cyclohydrolase II
(ribA), DHBP synthase (ribBA), riboflavin synthase (ribC), and riboflavin
deaminase/reductase (ribD) from Helicobacter pylori strain P1. FEMS
Microbiol Lett 191, 191-7.
80. Lin, J. W., Chao, Y. F. & Weng, S. F. (2001). Riboflavin synthesis genes
ribE, ribB, ribH, ribA reside in the lux operon of Photobacterium
leiognathi. Biochem Biophys Res Commun 284, 587-95.
81. Grill, S., Yamaguchi, H., Wagner, H., Zwahlen, L., Kusch, U. & Mack, M.
(2007). Identification and characterization of two Streptomyces
davawensis riboflavin biosynthesis gene clusters. Arch Microbiol 188,
377-87.
82. Oltmanns, O., Bacher, A., Lingens, F. & Zimmermann, F. K. (1969).
Biochemical and genetic classification of riboflavine deficient mutants of
Saccharomyces cerevisiae. Mol Gen Genet 105, 306-13.
83. Oltmanns, O. & Bacher, A. (1972). Biosynthesis of riboflavine in
Saccharomyces cerevisiae: the role of genes rib 1 and rib 7. J Bacteriol
110, 818-22.
84. Santos, M. A., Garcia-Ramirez, J. J. & Revuelta, J. L. (1995). Riboflavin
biosynthesis in Saccharomyces cerevisiae. Cloning, characterization, and
expression of the RIB5 gene encoding riboflavin synthase. J Biol Chem
270, 437-44.
207
85. Garcia-Ramirez, J. J., Santos, M. A. & Revuelta, J. L. (1995). The
Saccharomyces cerevisiae RIB4 gene codes for 6,7-dimethyl-8-
ribityllumazine synthase involved in riboflavin biosynthesis. Molecular
characterization of the gene and purification of the encoded protein. J Biol
Chem 270, 23801-7.
86. Kanehisa, M. & Goto, S. (2000). KEGG: kyoto encyclopedia of genes and
genomes. Nucleic Acids Res 28, 27-30.
87. Herz, S., Eberhardt, S. & Bacher, A. (2000). Biosynthesis of riboflavin in
plants. The ribA gene of Arabidopsis thaliana specifies a bifunctional GTP
cyclohydrolase II/3,4-dihydroxy-2-butanone 4-phosphate synthase.
Phytochemistry 53, 723-31.
88. Jordan, D. B., Bacot, K. O., Carlson, T. J., Kessel, M. & Viitanen, P. V.
(1999). Plant riboflavin biosynthesis. Cloning, chloroplast localization,
expression, purification, and partial characterization of spinach lumazine
synthase. J Biol Chem 274, 22114-21.
89. Koch, M., Breithaupt, C., GerhardtHaase, S., Weber, S., Cushman, M.,
Huber, R., Bacher, A. & Fischer, M. (2004). Structural basis of charge
transfer complex formation by riboflavin bound to 6,7-dimethyl-8-
ribityllumazine synthase. Eur J Biochem 271, 3208-14.
90. Gerhardt, S., Haase, I., Steinbacher, S., Kaiser, J. T., Cushman, M.,
Bacher, A., Huber, R. & Fischer, M. (2002). The structural basis of
riboflavin binding to Schizosaccharomyces pombe 6,7-dimethyl-8-
ribityllumazine synthase. J Mol Biol 318, 1317-29.
91. Meining, W., Mortl, S., Fischer, M., Cushman, M., Bacher, A. &
Ladenstein, R. (2000). The atomic structure of pentameric lumazine
synthase from Saccharomyces cerevisiae at 1.85 A resolution reveals the
binding mode of a phosphonate intermediate analogue. J Mol Biol 299,
181-97.
92. Braden, B. C., Velikovsky, C. A., Cauerhff, A. A., Polikarpov, I. &
Goldbaum, F. A. (2000). Divergence in macromolecular assembly: X-ray
crystallographic structure analysis of lumazine synthase from Brucella
abortus. J Mol Biol 297, 1031-6.

208
93. Persson, K., Schneider, G., Jordan, D. B., Viitanen, P. V. & Sandalova, T.
(1999). Crystal structure analysis of a pentameric fungal and an
icosahedral plant lumazine synthase reveals the structural basis for
differences in assembly. Protein Sci 8, 2355-65.
94. Zhang, X., Meining, W., Fischer, M., Bacher, A. & Ladenstein, R. (2001).
X-ray structure analysis and crystallographic refinement of lumazine
synthase from the hyperthermophile Aquifex aeolicus at 1.6 A resolution:
determinants of thermostability revealed from structural comparisons. J
Mol Biol 306, 1099-114.
95. Mortl, S., Fischer, M., Richter, G., Tack, J., Weinkauf, S. & Bacher, A.
(1996). Biosynthesis of riboflavin. Lumazine synthase of Escherichia coli.
J Biol Chem 271, 33201-7.
96. Haase, I., Mortl, S., Kohler, P., Bacher, A. & Fischer, M. (2003).
Biosynthesis of riboflavin in archaea. 6,7-dimethyl-8-ribityllumazine
synthase of Methanococcus jannaschii. Eur J Biochem 270, 1025-32.
97. Zhang, X., Meining, W., Cushman, M., Haase, I., Fischer, M., Bacher, A.
& Ladenstein, R. (2003). A structure-based model of the reaction
catalyzed by lumazine synthase from Aquifex aeolicus. J Mol Biol 328,
167-82.
98. Ritsert, K., Huber, R., Turk, D., Ladenstein, R., Schmidt-Base, K. &
Bacher, A. (1995). Studies on the lumazine synthase/riboflavin synthase
complex of Bacillus subtilis: crystal structure analysis of reconstituted,
icosahedral beta-subunit capsids with bound substrate analogue inhibitor
at 2.4 A resolution. J Mol Biol 253, 151-67.
99. Ladenstein, R., Ritsert, K., Huber, R., Richter, G. & Bacher, A. (1994).
The lumazine synthase/riboflavin synthase complex of Bacillus subtilis.
X-ray structure analysis of hollow reconstituted beta-subunit capsids. Eur
J Biochem 223, 1007-17.
100. Ladenstein, R., Schneider, M., Huber, R., Bartunik, H. D., Wilson, K.,
Schott, K. & Bacher, A. (1988). Heavy riboflavin synthase from Bacillus
subtilis. Crystal structure analysis of the icosahedral beta 60 capsid at 3.3
A resolution. J Mol Biol 203, 1045-70.
209
101. Eberhardt, S., Korn, S., Lottspeich, F. & Bacher, A. (1997). Biosynthesis
of riboflavin: an unusual riboflavin synthase of Methanobacterium
thermoautotrophicum. J Bacteriol 179, 2938-43.
102. Fischer, M., Schott, A. K., Romisch, W., Ramsperger, A., Augustin, M.,
Fidler, A., Bacher, A., Richter, G., Huber, R. & Eisenreich, W. (2004).
Evolution of vitamin B2 biosynthesis. A novel class of riboflavin synthase
in Archaea. J Mol Biol 343, 267-78.
103. Ramsperger, A., Augustin, M., Schott, A. K., Gerhardt, S., Krojer, T.,
Eisenreich, W., Illarionov, B., Cushman, M., Bacher, A., Huber, R. &
Fischer, M. (2006). Crystal structure of an archaeal pentameric riboflavin
synthase in complex with a substrate analog inhibitor: stereochemical
implications. J Biol Chem 281, 1224-32.
104. Fischer, M., Romisch, W., Illarionov, B., Eisenreich, W. & Bacher, A.
(2005). Structures and reaction mechanisms of riboflavin synthases of
eubacterial and archaeal origin. Biochem Soc Trans 33, 780-4.
105. Liao, D. I., Wawrzak, Z., Calabrese, J. C., Viitanen, P. V. & Jordan, D. B.
(2001). Crystal structure of riboflavin synthase. Structure 9, 399-408.
106. Vitreschak, A. G., Rodionov, D. A., Mironov, A. A. & Gelfand, M. S.
(2002). Regulation of riboflavin biosynthesis and transport genes in
bacteria by transcriptional and translational attenuation. Nucleic Acids Res
30, 3141-51.
107. Burgess, C. M., Slotboom, D. J., Geertsma, E. R., Duurkens, R. H.,
Poolman, B. & van Sinderen, D. (2006). The riboflavin transporter RibU
in Lactococcus lactis: molecular characterization of gene expression and
the transport mechanism. J Bacteriol 188, 2752-60.
108. Fischer, M. & Bacher, A. (2008). Biosynthesis of vitamin B2: Structure
and mechanism of riboflavin synthase. Arch Biochem Biophys 474, 252-
65.
109. Coquard, D., Huecas, M., Ott, M., van Dijl, J. M., van Loon, A. P. &
Hohmann, H. P. (1997). Molecular cloning and characterisation of the
ribC gene from Bacillus subtilis: a point mutation in ribC results in
riboflavin overproduction. Mol Gen Genet 254, 81-4.
210
110. Sandoval, F. J. & Roje, S. (2005). An FMN hydrolase is fused to a
riboflavin kinase homolog in plants. J Biol Chem 280, 38337-45.
111. Sandoval, F. J., Zhang, Y. & Roje, S. (2008). Flavin nucleotide
metabolism in plants: monofunctional enzymes synthesize fad in plastids.
J Biol Chem 283, 30890-900.
112. Galluccio, M., Brizio, C., Torchetti, E. M., Ferranti, P., Gianazza, E.,
Indiveri, C. & Barile, M. (2007). Over-expression in Escherichia coli,
purification and characterization of isoform 2 of human FAD synthetase.
Protein Expr Purif 52, 175-81.
113. Brizio, C., Galluccio, M., Wait, R., Torchetti, E. M., Bafunno, V.,
Accardi, R., Gianazza, E., Indiveri, C. & Barile, M. (2006). Over-
expression in Escherichia coli and characterization of two recombinant
isoforms of human FAD synthetase. Biochem Biophys Res Commun 344,
1008-16.
114. Liu, M. T., Wuebbens, M. M., Rajagopalan, K. V. & Schindelin, H.
(2000). Crystal structure of the gephyrin-related molybdenum cofactor
biosynthesis protein MogA from Escherichia coli. J Biol Chem 275, 1814-
22.
115. Schrag, J. D., Huang, W., Sivaraman, J., Smith, C., Plamondon, J.,
Larocque, R., Matte, A. & Cygler, M. (2001). The crystal structure of
Escherichia coli MoeA, a protein from the molybdopterin synthesis
pathway. J Mol Biol 310, 419-31.
116. Solovieva, I. M., Kreneva, R. A., Leak, D. J. & Perumov, D. A. (1999).
The ribR gene encodes a monofunctional riboflavin kinase which is
involved in regulation of the Bacillus subtilis riboflavin operon.
Microbiology 145, 67-73.
117. Kearney, E. B., Goldenberg, J., Lipsick, J. & Perl, M. (1979). Flavokinase
and FAD synthetase from Bacillus subtilis specific for reduced flavins. J
Biol Chem 254, 9551-7.
118. Clarebout, G., Villers, C. & Leclercq, R. (2001). Macrolide resistance
gene mreA of Streptococcus agalactiae encodes a flavokinase. Antimicrob
Agents Chemother 45, 2280-6.

211
119. Cheek, S., Zhang, H. & Grishin, N. V. (2002). Sequence and structure
classification of kinases. J. Mol. Biol. 320, 855-881.
120. Camporeale, G. & Zempleni, J. (2003). Oxidative folding of interleukin-2
is impaired in flavin-deficient jurkat cells, causing intracellular
accumulation of interleukin-2 and increased expression of stress response
genes. J Nutr 133, 668-72.
121. Manthey, K. C., Rodriguez-Melendez, R., Hoi, J. T. & Zempleni, J.
(2006). Riboflavin deficiency causes protein and DNA damage in HepG2
cells, triggering arrest in G1 phase of the cell cycle. J Nutr Biochem 17,
250-6.
122. Werner, R., Manthey, K. C., Griffin, J. B. & Zempleni, J. (2005). HepG2
cells develop signs of riboflavin deficiency within 4 days of culture in
riboflavin-deficient medium. J Nutr Biochem 16, 617-24.
123. Foraker, A. B., Khantwal, C. M. & Swaan, P. W. (2003). Current
perspectives on the cellular uptake and trafficking of riboflavin. Adv Drug
Deliv Rev 55, 1467-83.
124. Forster, C., Revuelta, J. L. & Kramer, R. (2001). Carrier-mediated
transport of riboflavin in Ashbya gossypii. Appl Microbiol Biotechnol 55,
85-9.
125. Perl, M., Kearney, E. B. & Singer, T. P. (1976). Transport of riboflavin
into yeast cells. J Biol Chem 251, 3221-8.
126. Cecchini, G., Perl, M., Lipsick, J., Singer, T. P. & Kearney, E. B. (1979).
Transport and binding of riboflavin by Bacillus subtilis. J Biol Chem 254,
7295-301.
127. Reihl, P. & Stolz, J. (2005). The monocarboxylate transporter homolog
Mch5p catalyzes riboflavin (vitamin B2) uptake in Saccharomyces
cerevisiae. J Biol Chem 280, 39809-17.
128. Vogl, C., Grill, S., Schilling, O., Stulke, J., Mack, M. & Stolz, J. (2007).
Characterization of riboflavin (vitamin B2) transport proteins from
Bacillus subtilis and Corynebacterium glutamicum. J Bacteriol 189, 7367-
75.

212
129. Karthikeyan, S., Zhou, Q., Mseeh, F., Grishin, N. V., Osterman, A. L. &
Zhang, H. (2003). Crystal structure of human riboflavin kinase reveals a
Beta barrel fold and a novel active site arch. Structure (Camb) 11, 265-
273.
130. Murzin, A. G., Brenner, S. E., Hubbard, T. & Chothia, C. (1995). SCOP: a
structural classification of proteins database for the investigation of
sequences and structures. J. Mol. Biol. 247, 536-540.
131. Finn, R. D., Tate, J., Mistry, J., Coggill, P. C., Sammut, S. J., Hotz, H. R.,
Ceric, G., Forslund, K., Eddy, S. R., Sonnhammer, E. L. & Bateman, A.
(2008). The Pfam protein families database. Nucleic Acids Res 36, D281-
8.
132. Bork, P., Holm, L., Koonin, E. V. & Sander, C. (1995). The
cytidylyltransferase superfamily: identification of the nucleotide-binding
site and fold prediction. Proteins 22, 259-66.
133. Izard, T. & Geerlof, A. (1999). The crystal structure of a novel bacterial
adenylyltransferase reveals half of sites reactivity. Embo J 18, 2021-30.
134. Saridakis, V., Christendat, D., Kimber, M. S., Dharamsi, A., Edwards, A.
M. & Pai, E. F. (2001). Insights into ligand binding and catalysis of a
central step in NAD+ synthesis: structures of Methanobacterium
thermoautotrophicum NMN adenylyltransferase complexes. J Biol Chem
276, 7225-32.
135. Zhang, H., Zhou, T., Kurnasov, O., Cheek, S., Grishin, N. V. & Osterman,
A. (2002). Crystal structures of E. coli nicotinate mononucleotide
adenylyltransferase and its complex with deamido-NAD. Structure
(Camb) 10, 69-79.
136. Zhou, T., Kurnasov, O., Tomchick, D. R., Binns, D. D., Grishin, N. V.,
Marquez, V. E., Osterman, A. L. & Zhang, H. (2002). Structure of human
nicotinamide/nicotinic acid mononucleotide adenylyltransferase. Basis for
the dual substrate specificity and activation of the oncolytic agent
tiazofurin. J Biol Chem 277, 13148-54.
213
137. Weber, C. H., Park, Y. S., Sanker, S., Kent, C. & Ludwig, M. L. (1999). A
prototypical cytidylyltransferase: CTP:glycerol-3-phosphate
cytidylyltransferase from bacillus subtilis. Structure 7, 1113-24.
138. Chartron, J., Carroll, K. S., Shiau, C., Gao, H., Leary, J. A., Bertozzi, C.
R. & Stout, C. D. (2006). Substrate recognition, protein dynamics, and
iron-sulfur cluster in Pseudomonas aeruginosa adenosine 5'-
phosphosulfate reductase. J Mol Biol 364, 152-69.
139. Mougous, J. D., Lee, D. H., Hubbard, S. C., Schelle, M. W., Vocadlo, D.
J., Berger, J. M. & Bertozzi, C. R. (2006). Molecular basis for G protein
control of the prokaryotic ATP sulfurylase. Mol Cell 21, 109-22.
140. Savage, H., Montoya, G., Svensson, C., Schwenn, J. D. & Sinning, I.
(1997). Crystal structure of phosphoadenylyl sulphate (PAPS) reductase: a
new family of adenine nucleotide alpha hydrolases. Structure 5, 895-906.
141. Aravind, L., Anantharaman, V. & Koonin, E. V. (2002). Monophyly of
class I aminoacyl tRNA synthetase, USPA, ETFP, photolyase, and PP-
ATPase nucleotide-binding domains: implications for protein evolution in
the RNA. Proteins 48, 1-14.
142. Bork, P. & Koonin, E. V. (1994). A P-loop-like motif in a widespread
ATP pyrophosphatase domain: implications for the evolution of sequence
motifs and enzyme activity. Proteins 20, 347-55.
143. Tesmer, J. J., Klem, T. J., Deras, M. L., Davisson, V. J. & Smith, J. L.
(1996). The crystal structure of GMP synthetase reveals a novel catalytic
triad and is a structural paradigm for two enzyme families. Nat Struct Biol
3, 74-86.
144. Rossmann, M. G., Moras, D. & Olsen, K. W. (1974). Chemical and
biological evolution of nucleotide-binding protein. Nature 250, 194-9.
145. Yamada, Y., Merrill, A. H., Jr. & McCormick, D. B. (1990). Probable
reaction mechanisms of flavokinase and FAD synthetase from rat liver.
Arch Biochem Biophys 278, 125-30.

214
146. Oka, M. & McCormick, D. B. (1987). Complete purification and general
characterization of FAD synthetase from rat liver. J Biol Chem 262, 7418-
22.
147. Walsh, C., Fisher, J., Spencer, R., Graham, D. W., Ashton, W. T., Brown,
J. E., Brown, R. D. & Rogers, E. F. (1978). Chemical and enzymatic
properties of riboflavin analogues. Biochemistry 17, 1942-51.
148. Light, D. R., Walsh, C. & Marletta, M. A. (1980). Analytical and
preparative high-performance liquid chromatography separation of flavin
and flavin analog coenzymes. Anal Biochem 109, 87-93.
149. Hausinger, R. P., Honek, J. F. & Walsh, C. (1986). Separation of flavins
and flavin analogs by high-performance liquid chromatography. Methods
Enzymol 122, 199-209.
150. Bowers-Komro, D. M., Yamada, Y. & McCormick, D. B. (1989).
Substrate specificity and variables affecting efficiency of mammalian
flavin adenine dinucleotide synthetase. Biochemistry 28, 8439-46.
151. Hustad, S., Ueland, P. M., Vollset, S. E., Zhang, Y., Bjorke-Monsen, A. L.
& Schneede, J. (2000). Riboflavin as a determinant of plasma total
homocysteine: effect modification by the methylenetetrahydrofolate
reductase C677T polymorphism. Clin Chem 46, 1065-71.
152. Tu, B. P. & Weissman, J. S. (2002). The FAD- and O(2)-dependent
reaction cycle of Ero1-mediated oxidative protein folding in the
endoplasmic reticulum. Mol Cell 10, 983-94.
153. Brewer, J. W. & Diehl, J. A. (2000). PERK mediates cell-cycle exit during
the mammalian unfolded protein response. Proc Natl Acad Sci U S A 97,
12625-30.
154. Pahl, H. L. (1999). Signal transduction from the endoplasmic reticulum to
the cell nucleus. Physiol Rev 79, 683-701.
155. Gelfand, M. S., Mironov, A. A., Jomantas, J., Kozlov, Y. I. & Perumov,
D. A. (1999). A conserved RNA structure element involved in the
regulation of bacterial riboflavin synthesis genes. Trends Genet 15, 439-
42.

215
156. Kil, Y. V., Mironov, V. N., Gorishin, I., Kreneva, R. A. & Perumov, D. A.
(1992). Riboflavin operon of Bacillus subtilis: unusual symmetric
arrangement of the regulatory region. Mol Gen Genet 233, 483-6.
157. Mack, M., van Loon, A. P. & Hohmann, H. P. (1998). Regulation of
riboflavin biosynthesis in Bacillus subtilis is affected by the activity of the
flavokinase/flavin adenine dinucleotide synthetase encoded by ribC. J.
Bacteriol. 180, 950-955.
158. Solovieva, I. M., Kreneva, R. A., Leak, D. J. & Perumov, D. A. (1999).
The ribR gene encodes a monofunctional riboflavin kinase which is
involved in regulation of the Bacillus subtilis riboflavin operon.
Microbiology 145 ( Pt 1), 67-73.
159. Winkler, W. C., Cohen-Chalamish, S. & Breaker, R. R. (2002). An mRNA
structure that controls gene expression by binding FMN. Proc Natl Acad
Sci U S A 99, 15908-13.
160. Mironov, A. S., Gusarov, I., Rafikov, R., Lopez, L. E., Shatalin, K.,
Kreneva, R. A., Perumov, D. A. & Nudler, E. (2002). Sensing small
molecules by nascent RNA: a mechanism to control transcription in
bacteria. Cell 111, 747-56.
161. Gerdes, S. Y., Scholle, M. D., D'Souza, M., Bernal, A., Baev, M. V.,
Farrell, M., Kurnasov, O. V., Daugherty, M. D., Mseeh, F., Polanuyer, B.
M., Campbell, J. W., Anantha, S., Shatalin, K. Y., Chowdhury, S. A.,
Fonstein, M. Y. & Osterman, A. L. (2002). From genetic footprinting to
antimicrobial drug targets: examples in cofactor biosynthetic pathways. J.
Bacteriol. 184, 4555-4572.
162. Becker, D., Selbach, M., Rollenhagen, C., Ballmaier, M., Meyer, T. F.,
Mann, M. & Bumann, D. (2006). Robust Salmonella metabolism limits
possibilities for new antimicrobials. Nature 440, 303-7.
163. Rollenhagen, C. & Bumann, D. (2006). Salmonella enterica highly
expressed genes are disease specific. Infect Immun 74, 1649-60.
164. Krcmery, V. & Barnes, A. J. (2002). Non-albicans Candida spp. causing
fungaemia: pathogenicity and antifungal resistance. J Hosp Infect 50, 243-
60.

216
165. Ostrosky-Zeichner, L., Rex, J. H., Pappas, P. G., Hamill, R. J., Larsen, R.
A., Horowitz, H. W., Powderly, W. G., Hyslop, N., Kauffman, C. A.,
Cleary, J., Mangino, J. E. & Lee, J. (2003). Antifungal susceptibility
survey of 2,000 bloodstream Candida isolates in the United States.
Antimicrob Agents Chemother 47, 3149-54.
166. Fidel, P. L., Jr., Vazquez, J. A. & Sobel, J. D. (1999). Candida glabrata:
review of epidemiology, pathogenesis, and clinical disease with
comparison to C. albicans. Clin Microbiol Rev 12, 80-96.
167. Li, L., Redding, S. & Dongari-Bagtzoglou, A. (2007). Candida glabrata:
an emerging oral opportunistic pathogen. J Dent Res 86, 204-15.
168. Wang, W., Kim, R., Jancarik, J., Yokota, H. & Kim, S.-H. (2003). Crystal
Structure of a Flavin-Binding Protein from Thermotoga maritima.
Proteins 52, 633-635.
169. Wang, W., Kim, R., Yokota, H. & Kim, S. H. (2005). Crystal structure of
flavin binding to FAD synthetase of Thermotoga maritima. Proteins 58,
246-8.
170. Komarnisky, L. A., Christopherson, R. J. & Basu, T. K. (2003). Sulfur: its
clinical and toxicologic aspects. Nutrition 19, 54-61.
171. Marzluf, G. A. (1997). Molecular genetics of sulfur assimilation in
filamentous fungi and yeast. Annu Rev Microbiol 51, 73-96.
172. Saito, K. (2004). Sulfur assimilatory metabolism. The long and smelling
road. Plant Physiol 136, 2443-50.
173. Townsend, D. M., Tew, K. D. & Tapiero, H. (2004). Sulfur containing
amino acids and human disease. Biomed Pharmacother 58, 47-55.
174. Moore, K. L. (2003). The biology and enzymology of protein tyrosine O-
sulfation. J Biol Chem 278, 24243-6.
175. Hemmerich, S. & Rosen, S. D. (2000). Carbohydrate sulfotransferases in
lymphocyte homing. Glycobiology 10, 849-56.
176. Hemmerich, S., Verdugo, D. & Rath, V. L. (2004). Strategies for drug
discovery by targeting sulfation pathways. Drug Discov Today 9, 967-75.

217
177. Pei, J. & Grishin, N. V. (2007). PROMALS: towards accurate multiple
sequence alignments of distantly related proteins. Bioinformatics 23, 802-
8.
178. Sheffield, P., Garrard, S. & Derewenda, Z. (1999). Overcoming
expression and purification problems of RhoGDI using a family of
"parallel" expression vectors. Protein Expr Purif 15, 34-9.
179. Doublie, S. (1997). Preparation of selenomethionyl proteins for phase
determination. Methods Enzymol. 276, 523-530.
180. Minor, W., Cymborowski, M., Otwinowski, Z. & Chruszcz, M. (2006).
HKL-3000: the integration of data reduction and structure solution--from
diffraction images to an initial model in minutes. Acta Crystallogr D Biol
Crystallogr 62, 859-66.
181. Potterton, E., Briggs, P., Turkenburg, M. & Dodson, E. (2003). A
graphical user interface to the CCP4 program suite. Acta Crystallogr D
Biol Crystallogr 59, 1131-7.
182. Hendrickson, W. A., Horton, J. R. & LeMaster, D. M. (1990).
Selenomethionyl proteins produced for analysis by multiwavelength
anomalous diffraction (MAD): a vehicle for direct determination of three-
dimensional structure. Embo J 9, 1665-72.
183. Gonzalez, A. (2003). Optimizing data collection for structure
determination. Acta Crystallogr D Biol Crystallogr 59, 1935-42.
184. Dodson, E. (2003). Is it jolly SAD? Acta Crystallogr D Biol Crystallogr
59, 1958-65.
185. Otwinowski, Z. (1991). Maximum likelihood refinement of heavy atom
parameters. In Isomorphous Replacement and Anomalous Scattering
(Wolf, W., Evans, P. R. & Leslie, A. G. W., eds.), pp. 80-86. Daresbury
Laboratory, Warrington, UK.
186. Cowtan, K. (1994). 'DM': an automated procedure for phase improvement
by density modification. Joint CCP4 and ESF-EACBM Newsletter on
Protein Crystallography 31, 34-38.

218
187. Terwilliger, T. C. (2003). SOLVE and RESOLVE: automated structure
solution and density modification. Methods Enzymol 374, 22-37.
188. Morris, R. J., Perrakis, A. & Lamzin, V. S. (2003). ARP/wARP and
automatic interpretation of protein electron density maps. Methods
Enzymol 374, 229-44.
189. Murshudov, G. N., Vagin, A. A. & Dodson, E. J. (1997). Refinement of
macromolecular structures by the maximum-likelihood method. Acta
Crystallogr D Biol Crystallogr 53, 240-55.
190. Emsley, P. & Cowtan, K. (2004). Coot: model-building tools for
molecular graphics. Acta Crystallogr D Biol Crystallogr 60, 2126-32.
191. Merritt, E. A. (1999). Expanding the model: anisotropic displacement
parameters in protein structure refinement. Acta Crystallogr D Biol
Crystallogr 55, 1109-17.
192. Lovell, S. C., Davis, I. W., Arendall, W. B., 3rd, de Bakker, P. I., Word, J.
M., Prisant, M. G., Richardson, J. S. & Richardson, D. C. (2003).
Structure validation by Calpha geometry: phi,psi and Cbeta deviation.
Proteins 50, 437-50.
193. Dolinsky, T. J., Nielsen, J. E., McCammon, J. A. & Baker, N. A. (2004).
PDB2PQR: an automated pipeline for the setup of Poisson-Boltzmann
electrostatics calculations. Nucleic Acids Res 32, W665-7.
194. Sitkoff, D., Sharp, K. A. & Honig, B. (1994). Accurate Calculation of
Hydration Free Energies Using Macroscopic Solvent Models. The Journal
of Physical Chemistry 98, 1978-1988.
195. Baker, N. A., Sept, D., Joseph, S., Holst, M. J. & McCammon, J. A.
(2001). Electrostatics of nanosystems: application to microtubules and the
ribosome. Proc Natl Acad Sci U S A 98, 10037-41.
196. Krissinel, E. & Henrick, K. (2004). Secondary-structure matching (SSM),
a new tool for fast protein structure alignment in three dimensions. Acta
Crystallogr D Biol Crystallogr 60, 2256-68.

219
197. Krissinel, E. & Henrick, K. (2007). Inference of macromolecular
assemblies from crystalline state. J Mol Biol 372, 774-97.
198. Holm, L. & Sander, C. (1995). Dali: a network tool for protein structure
comparison. Trends Biochem. Sci. 20, 478-480.
199. Miller, M. T., Bachmann, B. O., Townsend, C. A. & Rosenzweig, A. C.
(2001). Structure of beta-lactam synthetase reveals how to synthesize
antibiotics instead of asparagine. Nat Struct Biol 8, 684-9.
200. Nakanishi, K., Fukai, S., Ikeuchi, Y., Soma, A., Sekine, Y., Suzuki, T. &
Nureki, O. (2005). Structural basis for lysidine formation by ATP
pyrophosphatase accompanied by a lysine-specific loop and a tRNA-
recognition domain. Proc Natl Acad Sci U S A 102, 7487-92.
201. Devedjiev, Y., Symersky, J., Singh, R., Jedrzejas, M., Brouillette, C.,
Brouillette, W., Muccio, D., Chattopadhyay, D. & DeLucas, L. (2001).
Stabilization of active-site loops in NH3-dependent NAD+ synthetase
from Bacillus subtilis. Acta Crystallogr D Biol Crystallogr 57, 806-12.
202. Chayen, N. E., Shaw Steward, P.D., Maeder, D.L., and Blow D.M. (1990).
An automated system for micro-batch protein crystallization and
screening. Journal of Applied Crystallography 23, 297-302.
203. Otwinowski, Z. & Minor, W. (1997). Processing of X-ray diffraction data
collected in oscillation mode. Methods Enzymol. 276, 307-326.
204. Teplyakov, A. V. a. A. (1997). MOLREP: an Automated Program for
Molecular Replacement. Journal of Applied Crystallography 30, 4.
205. Adams, P. D., Grosse-Kunstleve, R. W., Hung, L. W., Ioerger, T. R.,
McCoy, A. J., Moriarty, N. W., Read, R. J., Sacchettini, J. C., Sauter, N.
K. & Terwilliger, T. C. (2002). PHENIX: building new software for
automated crystallographic structure determination. Acta Crystallogr D
Biol Crystallogr 58, 1948-54.
206. Davis, I. W., Leaver-Fay, A., Chen, V. B., Block, J. N., Kapral, G. J.,
Wang, X., Murray, L. W., Arendall, W. B., 3rd, Snoeyink, J., Richardson,
J. S. & Richardson, D. C. (2007). MolProbity: all-atom contacts and
220
structure validation for proteins and nucleic acids. Nucleic Acids Res 35,
W375-83.
207. Sayers, E. W., Barrett, T., Benson, D. A., Bryant, S. H., Canese, K.,
Chetvernin, V., Church, D. M., DiCuccio, M., Edgar, R., Federhen, S.,
Feolo, M., Geer, L. Y., Helmberg, W., Kapustin, Y., Landsman, D.,
Lipman, D. J., Madden, T. L., Maglott, D. R., Miller, V., Mizrachi, I.,
Ostell, J., Pruitt, K. D., Schuler, G. D., Sequeira, E., Sherry, S. T.,
Shumway, M., Sirotkin, K., Souvorov, A., Starchenko, G., Tatusova, T.
A., Wagner, L., Yaschenko, E. & Ye, J. (2009). Database resources of the
National Center for Biotechnology Information. Nucleic Acids Res 37, D5-
15.
208. Benson, D. A., Karsch-Mizrachi, I., Lipman, D. J., Ostell, J. & Sayers, E.
W. (2009). GenBank. Nucleic Acids Res 37, D26-31.
209. Dym, O. & Eisenberg, D. (2001). Sequence-structure analysis of FAD-
containing proteins. Protein Sci 10, 1712-28.
210. Larsen, T. M., Boehlein, S. K., Schuster, S. M., Richards, N. G., Thoden,
J. B., Holden, H. M. & Rayment, I. (1999). Three-dimensional structure of
Escherichia coli asparagine synthetase B: a short journey from substrate to
product. Biochemistry 38, 16146-57.
211. Muller, Y. A., Schumacher, G., Rudolph, R. & Schulz, G. E. (1994). The
refined structures of a stabilized mutant and of wild-type pyruvate oxidase
from Lactobacillus plantarum. J Mol Biol 237, 315-35.
212. Yeh, J. I., Claiborne, A. & Hol, W. G. (1996). Structure of the native
cysteine-sulfenic acid redox center of enterococcal NADH peroxidase
refined at 2.8 A resolution. Biochemistry 35, 9951-7.
213. Ingelman, M., Bianchi, V. & Eklund, H. (1997). The three-dimensional
structure of flavodoxin reductase from Escherichia coli at 1.7 A resolution.
J Mol Biol 268, 147-57.
214. Park, H. W., Kim, S. T., Sancar, A. & Deisenhofer, J. (1995). Crystal
structure of DNA photolyase from Escherichia coli. Science 268, 1866-72.

221
215. Karplus, P. A. & Schulz, G. E. (1987). Refined structure of glutathione
reductase at 1.54 A resolution. J Mol Biol 195, 701-29.
216. Grill, S., Busenbender, S., Pfeiffer, M., Kohler, U. & Mack, M. (2008).
The bifunctional flavokinase/flavin adenine dinucleotide synthetase from
Streptomyces davawensis produces inactive flavin cofactors and is not
involved in resistance to the antibiotic roseoflavin. J Bacteriol 190, 1546-
53.
217. Webb, M. R. (1992). A continuous spectrophotometric assay for inorganic
phosphate and for measuring phosphate release kinetics in biological
systems. Proc Natl Acad Sci U S A 89, 4884-7.
218. Upson, R. H., Haugland, R. P., Malekzadeh, M. N. & Haugland, R. P.
(1996). A spectrophotometric method to measure enzymatic activity in
reactions that generate inorganic pyrophosphate. Anal Biochem 243, 41-5.
219. Segel, I. H. (1993). Enzyme Kinetics: Behavior and Analysis of Rapid
Equilibrium and Steady-State Enzyme Systems, Wiley-Interscience, New
York.
220. Newton, G. L., Ta, P., Sareen, D. & Fahey, R. C. (2006). A coupled
spectrophotometric assay for l-cysteine:1-D-myo-inosityl 2-amino-2-
deoxy-alpha-D-glucopyranoside ligase and its application for inhibitor
screening. Anal Biochem 353, 167-73.
221. Cogan, E. B., Birrell, G. B. & Griffith, O. H. (1999). A robotics-based
automated assay for inorganic and organic phosphates. Anal Biochem 271,
29-35.
222. Rumsfeld, J., Ziegelbauer, K. & Spaltmann, F. (2000). High-throughput
assay for inorganic pyrophosphatases using the cytosolic enzymes of
Saccharomyces cerevisiae and human as an example. Protein Expr Purif
18, 303-9.
223. Kolobe, D., Sayed, Y. & Dirr, H. W. (2004). Characterization of
bromosulphophthalein binding to human glutathione S-transferase A1-1:
thermodynamics and inhibition kinetics. Biochem J 382, 703-9.

222
224. Williams, J. W. & Morrison, J. F. (1979). The Kinetics of Reversible
Tight-Binding Inhibition. In Methods in Enzymology (Purich, D. L., ed.),
Vol. 63, pp. 437-467. Elsevier Academic Press, Boston.
225. Schrecker, A. W. & Kornberg, A. (1950). Reversible Enzymatic Synthesis
of Flavin-Adenine Dinucleotide. J Biol Chem 182, 795-803.
226. Giri, K. V., Rao, N. A., Cama, H. R. & Kumar, S. A. (1960). Studies on
flavinadenine dinucleotide-synthesizing enzyme in plants. Biochem J 75,
381-6.
227. Davierwala, A. P., Haynes, J., Li, Z., Brost, R. L., Robinson, M. D., Yu,
L., Mnaimneh, S., Ding, H., Zhu, H., Chen, Y., Cheng, X., Brown, G. W.,
Boone, C., Andrews, B. J. & Hughes, T. R. (2005). The synthetic genetic
interaction spectrum of essential genes. Nat Genet 37, 1147-52.