Embed Size (px)
Citation preview
Structure and Dynamics of Carbon Black-Filled Elastomers
K. YUREKLI,1 R. KRISHNAMOORTI,1 M. F. TSE,2 K. O. MCELRATH,2 A. H. TSOU,2 H.-C. WANG2
1 Department of Chemical Engineering, University of Houston, 4800 Calhoun, Houston, Texas 77204-4792
2 ExxonMobil Chemical Company, Baytown Polymers Center, 5200 Bayway Drive, Baytown, Texas 77520
Received 24 May 2000; revised 27 October 2000; accepted 14 November 2000Published online 00 Month 2000
ABSTRACT: The linear and nonlinear melt viscoelastic properties for a series of carbonblack-filled polymer composites were studied. Complementary tapping-mode atomicforce microscopy (AFM) studies were used to examine the dispersion and structuralcorrelations of the filler particles in these composites. The low-frequency dependence ofthe linear viscoelastic moduli gradually changes from liquidlike behavior for the un-filled polymer to pseudosolid character for composites with more than 9 vol % carbonblack filler. The plateau modulus, inferred from the linear viscoelastic response, exhib-its a somewhat discontinuous change at about 9 vol % filler. On the basis of the linearviscoelastic response, we postulate that the carbon black filler forms a continuouspercolated network structure beyond 9 vol % filler, considerably lower than thatexpected from theoretical calculations for overlapping spheres and ellipsoids. We sug-gest that the lower threshold for percolation is due to the polymer mediation of the fillerstructure, resulting from the low functionality of the polymer and, consequently, fewstrong polymer–filler interactions, allowing for long loops and tails that can eitherbridge filler particles or entangle with one another. Furthermore, the strain amplitudefor the transition from linear behavior to nonlinear behavior of the modulus for thecomposites with greater than 9 vol % filler is independent of frequency, and this criticalstrain amplitude decreases with increasing filler concentration. Complementary AFMmeasurements suggest a well-dispersed carbon black structure with the nearest neigh-bor distance showing a discontinuous decrease at about 9 vol % filler, again consistentwith the formation of a filler network structure beyond 9 vol % carbon black. © 2000 JohnWiley & Sons, Inc. J Polym Sci B: Polym Phys 39: 256–275, 2001Keywords: elastomer; carbon black; filled; structure; dynamics
INTRODUCTION
Because of improved mechanical and barrierproperties, ease of production, and economical ad-vantages, particle-filled elastomers (e.g., polyiso-prene, polybutadiene, terpolymers of ethylene,propylene and diene (EPDM), polyisobutylene(PIB), and styrene–butadiene rubber) are amongthe most commonly used classes of polymeric
composites. Carbon black-based composites ofthese elastomers are widely used in the tire in-dustry, and their structure and dynamic behaviorhave been extensively studied over the last 50years.1–3 The carbon black aggregates in the poly-mer tend to agglomerate, and at high concentra-tions they are expected to form a continuous fillernetwork. Warring4 and Fletcher and Gent5 werethe first to observe this filler network, which isheld together by relatively weak Van der Waalsforces. Furthermore, they observed that thesenetwork structures break up with increasing dy-namic strain amplitude. The dissociation of thefiller structure, also called the Payne effect, re-
Correspondence to: R. Krishnamoorti (E-mail: [email protected]) or M. F. TseJournal of Polymer Science: Part B: Polymer Physics, Vol. 39, 256–275 (2001)© 2000 John Wiley & Sons, Inc.
256
sults in the removal of a significant part of thefiller reinforcement, leading to a drop in the stor-age modulus G9. The concept of a filler networkwas further supported by dynamic mechanicalstudies by Payne6–9 and electrical conductivityand dynamic mechanical measurements by Voetet al.10–12
Furthermore, with the removal of the appliedstrain, the network is at least partially restored.The rate of reformation has been reported to besimilar to that of the relaxation times of the poly-mer matrix estimated from small-strain–stressrelaxation measurements.13,14 Full recovery ofthe network is possible only in crosslinked poly-mers, presumably because of the restoring force ofthe elastic network and the crosslinked polymerbridges between particles, providing a drivingforce for the reestablishment of particle–particlecontact. Thus, it has been postulated that the
formation, maintenance, and destruction of afiller network, as interpreted from the viscoelasticmeasurements and electrical conductivity mea-surements, dominate the mechanical behavior ofhighly filled composite materials in response tothe applied deformation.15
However, the development of the filler struc-ture and the influence of polymer–filler interac-tion on the systematic variation of the filler struc-ture and composites’ properties have not beenthoroughly investigated. Furthermore, many ofthese studies of filler effects on composite proper-ties and flow behavior have been performed oncrosslinked systems, complicating the under-standing of the effect of filler structure on thedynamics and properties of these systems. Addi-tionally, the advent of powerful atomic force mi-croscopy (AFM) methods have allowed a detaileddetermination of the nanoscopic and mesoscopic
Figure 1. Time–temperature superposed linear viscoelastic master curve for theunfilled polymer with a reference temperature (To) of 120 °C. The viscoelastic responseis characteristic of a well-entangled polymer with a crossover frequency (vc) of approx-imately 0.4 rad/s, below which liquidlike relaxation is observed. The frequency-shiftfactors (aT) are shown in Figure 5, and the modulus shift factors (bT) ranged from 0.9to 1.1.
CARBON BLACK-FILLED ELASTOMERS 257
dispersion and the structure of polymer and com-posite materials, suggesting the possibility of con-ducting detailed simultaneous studies of thestructure and properties of these composite ma-terials.
We investigated the viscoelastic behavior andmesoscopic dispersion and structure for a series ofcarbon black-filled polyisobutylene-based compos-ites. A polyisobutylene-based terpolymer of isobu-tylene, para-methyl styrene (PMS), and bromo-para-methyl styrene (BrPMS) was used becauseof its potential for exhibiting strong interactionswith carbon black and the ability to alter thisinteraction with changes in the amount of BrPMSincorporated. We used the uncrosslinked poly-mers to avoid complications resulting from theinfluence of the crosslinked network and to avoidthe influence of fillers in altering the nature of thecrosslinking. The evolution of viscoelastic proper-ties of the composite with increasing filler concen-tration (#20 vol %) is reported in this article.These dynamic measurements and their implica-
tions regarding the structure of the nanocompos-ite are corroborated by a systematic study withAFM of the mesostructure, with detailed analysisof the AFM data to provide a quantitative descrip-tion of the dispersion and mesostructure of thefiller.
EXPERIMENTAL
The polymer used in this study was a terpolymerof isobutylene, PMS, and BrPMS called bromi-nated isobutylene paramethylstyrene; it was pro-vided by ExxonMobil Chemical Co. The randomterpolymer contained 1.2 mol % BrPMS and 2.5mol % PMS. The number-average and weight-average molecular weights were 174,000 and423,000, respectively, and were determined witha Waters gel permeation chromatograph, with tet-rahydrofuran (THF) as the mobile phase, cali-brated with polystyrene standards. Molecular
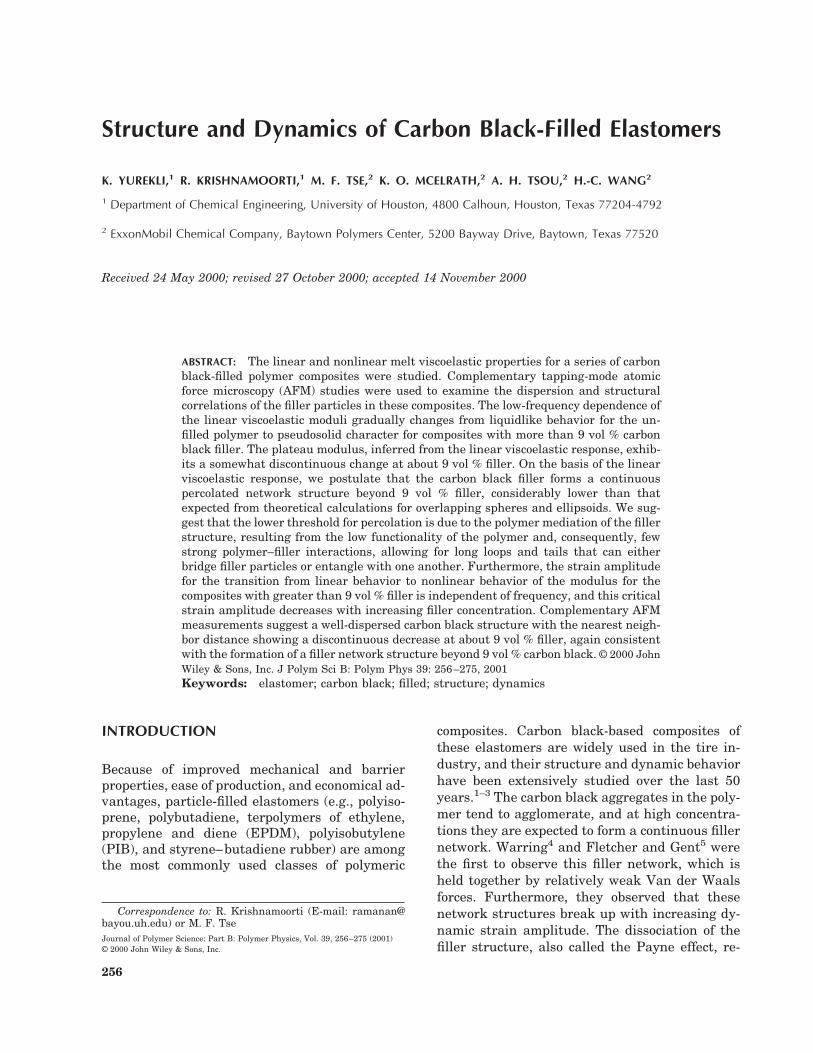
Figure 2. Time–temperature superposed linear viscoelastic master curve for a com-posite with 15 vol % loading of carbon black. vc is the crossover frequency from theplateau region to the terminal zone for the unfilled polymer. Note the weak frequencydependence of G9 in the low-frequency region and the concomitant maximum in tan d.
258 YUREKLI ET AL.
weights were corrected with the Mark–Houwinkconstants for polyisobutylene in THF. The densityof the polymer was about 0.92 g/cm3. The carbonblack filler employed was N234, a reinforcing car-bon black obtained from Cabot Corp. The carbonblack had a nitrogen surface area of 126 m2/g, adensity of 1.8 g/cm3, a dibutyl phthalate adsorp-tion of 125 mL/100 g, and a nominal number-average primary particle diameter of 20 nm, withnumber-average and weight-average aggregatesizes of 60 and 78 nm, respectively.16
The mixing of the carbon black with the poly-mer was accomplished in a Banbury mixer. Themixing was started at 65 °C and discharged after3–5 min between 150 and 230 °C. Subsequentsheeting on a two-roll mill was performed toachieve a good dispersion of carbon black. Themixing and milling were repeated to ensure ho-mogeneous mixing of the polymer and carbonblack. For the melt-state viscoelastic measure-ments, disks about 2 mm thick with 25-mm diam-
eters were prepared by the samples being vac-uum-molded at about 170 °C for 2 h. The vis-coelastic measurements were carried out in aRheometrics ARES melt-state rheometer. The op-erating range for the transducer used was 0.2–2000 g/cm. A sinusoidal strain of the form g(t)5 go sin(vt) was applied, and the resulting mea-sured stress was converted to the in-phase stor-age modulus (G9) and the out-of-phase loss mod-ulus (G0). Both the constant strain amplitude(constant go) frequency sweeps and strain sweepsat constant frequency (constant v) were per-formed with a 25-mm parallel-plate geometry.Frequency sweeps were carried out as a functionof temperature between 60 and 180 °C and weretime–temperature-superposed to obtain mastercurves. Strain sweeps for all filler concentrationsbelow 20 vol % were conducted at 90 °C. For the20 vol % sample, a temperature of 120 °C wasused because the stiffness of the material at 90 °Cled to measurements complicated by instrumen-
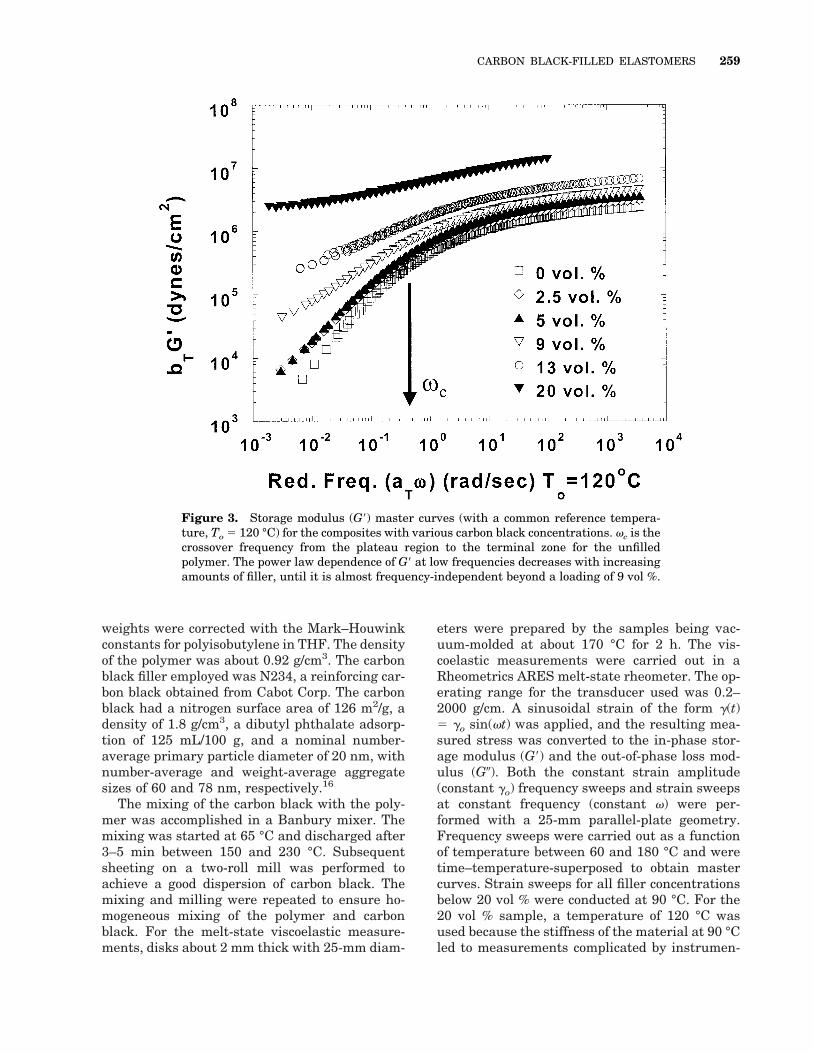
Figure 3. Storage modulus (G9) master curves (with a common reference tempera-ture, To 5 120 °C) for the composites with various carbon black concentrations. vc is thecrossover frequency from the plateau region to the terminal zone for the unfilledpolymer. The power law dependence of G9 at low frequencies decreases with increasingamounts of filler, until it is almost frequency-independent beyond a loading of 9 vol %.
CARBON BLACK-FILLED ELASTOMERS 259
tal compliance issues. All experiments at andabove 120 °C were performed under a nitrogenenvironment to prevent oxidative crosslinking ofthe polymer. Before any data were collected, thesample was left under oscillatory shear overnightat 90 °C with a strain amplitude of 0.1% and afrequency of 0.01 Hz to ensure good adhesion.
The samples for AFM were cryo-sectioned andstudied immediately after sectioning to avoidchanges to the surface by surface reconstruction.The AFM used in this study was a Digital Instru-ments Dimension 3000 operated in tapping modewith rectangular Si cantilevers that had resonantfrequencies between 60 and 70 kHz. Several (usu-ally in excess of 10) 10 3 10 mm images of eachsample were taken to have a representative dis-tribution of particles. The scan rate used variedbetween 1 and 2 Hz, and the scans typically had adepth resolution of roughly 5 nm. The atomicforce micrographs were analyzed with standardimage-processing computer software. The analy-sis required the thresholding of the gray-scale
image to obtain a black and white image. Thecenter coordinates for the aggregates, their equiv-alent spherical diameters, form factors, and as-pect ratios were then determined from these data.Subsequently, nearest neighbor center-to-centerdistances for the filler aggregates were calcu-lated.
RESULTS AND DISCUSSION
Linear Viscoelasticity
The linear dynamic viscoelastic moduli mastercurves for the unfilled polymer are shown in Fig-ure 1. Superpositioning of the isothermal fre-quency scans was achieved by shifting all vis-coelastic functions to a reference temperature Toof 120 °C (a common reference temperature for allmaster curves shown in this article) with the ap-plication of both moduli (vertical) shift factors (bT)and frequency (horizontal) shift factors (aT). The
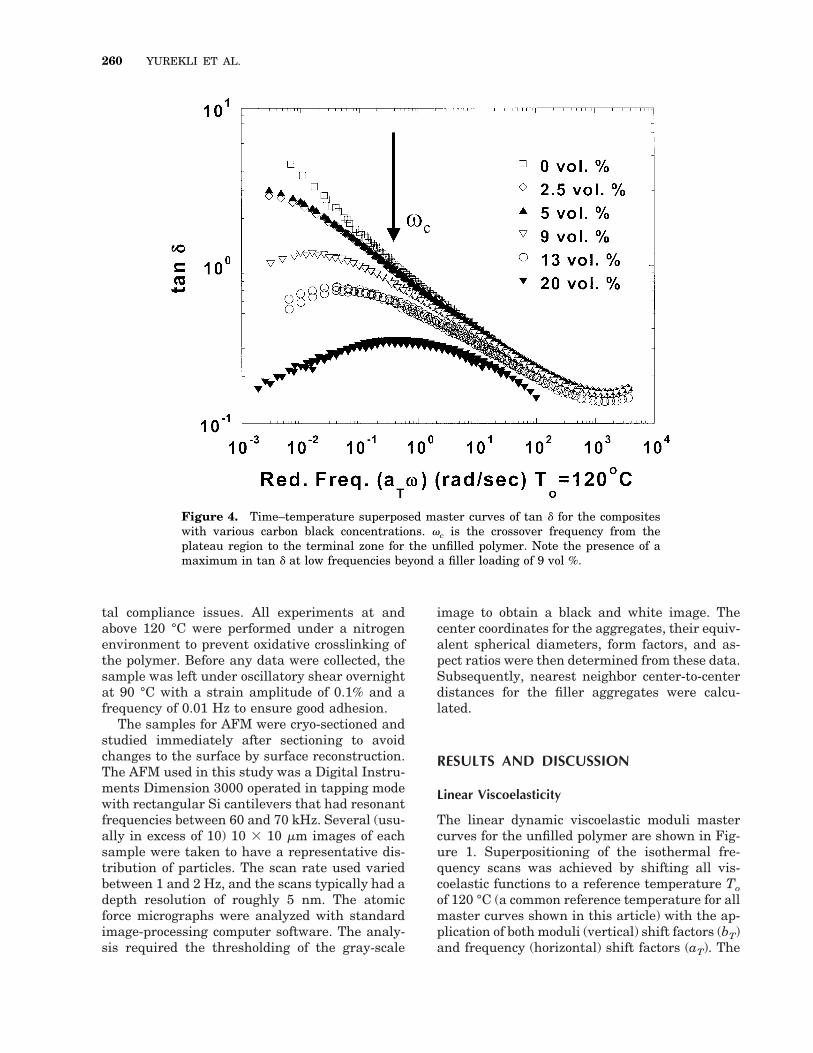
Figure 4. Time–temperature superposed master curves of tan d for the compositeswith various carbon black concentrations. vc is the crossover frequency from theplateau region to the terminal zone for the unfilled polymer. Note the presence of amaximum in tan d at low frequencies beyond a filler loading of 9 vol %.
260 YUREKLI ET AL.
data shown in Figure 1 and other linear viscoelas-tic master curves shown in this article were de-termined to be in the linear regime by confirma-tion of the independence of the viscoelastic pa-rameters to strain amplitude. In light of thepreviously observed strain sensitivity of the vis-coelastic measurements, we examine the linearityof the measured data for the composites in detailin the following section. The unfilled polymer hasthe characteristic viscoelastic response of a well-entangled polymer with a crossover frequency ofabout 0.4 rad/s (at 120 °C), below which it dis-plays liquidlike relaxation.
The linear viscoelastic master curves for a com-posite with 15 vol % loading of carbon black areshown in Figure 2. When these curves are com-pared with the curve of the unfilled polymer (Fig.1), several distinct differences are noted. First,the moduli for the composites are higher than themodulus of the unfilled polymer at all frequen-cies. Furthermore, no crossover of G9 and G0 cor-responding to the terminal relaxation of the poly-
mer is observed for the composite (Fig. 2), with G9remaining higher than G0 throughout the mea-sured frequency range. Additionally, in the low-frequency region, corresponding to frequencieswell below the terminal relaxation of the unfilledpolymer (v , vc), the frequency dependence of G9is quite weak. In this low-frequency region, thedifference between G9 and G0 increases with de-creasing frequencies, leading to a diminishmentof tan d (tan d 5 G0/G9). These low-frequencyviscoelastic features are characteristics of apseudosolidlike behavior. True solidlike behaviorwould be said to occur if both G9 and G0 becameindependent of frequency with G9 vastly exceed-ing G0.
Interestingly, for the frequency dependence oftan d (G0/G9) for the 15 vol % composite shown inFigure 2, a peak is observed at low frequencies.For the composites, in the frequency regime cor-responding to the crossover from the entangle-ment plateau to the terminal relaxation regimefor the unfilled polymer, G9 decreases faster than
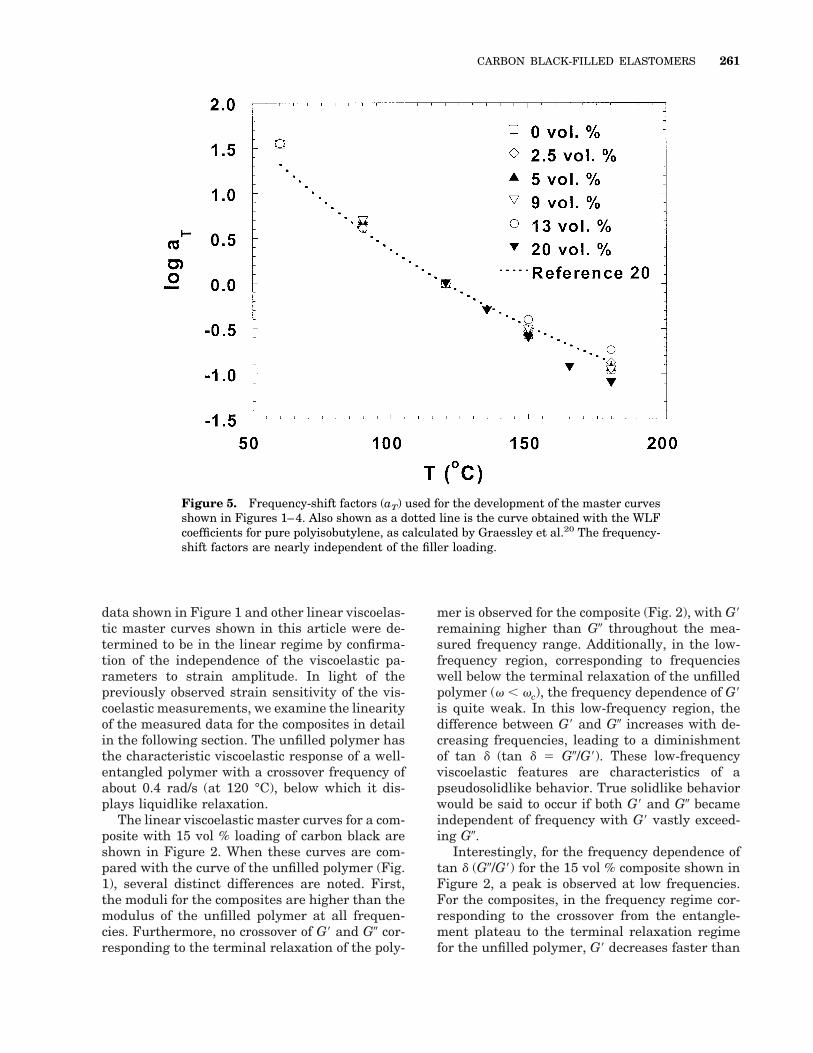
Figure 5. Frequency-shift factors (aT) used for the development of the master curvesshown in Figures 1–4. Also shown as a dotted line is the curve obtained with the WLFcoefficients for pure polyisobutylene, as calculated by Graessley et al.20 The frequency-shift factors are nearly independent of the filler loading.
CARBON BLACK-FILLED ELASTOMERS 261
G0, leading to an increase in tan d with increasingv. However, at lower frequencies the terminalrelaxation is dampened by the emergence of theslower pseudosolidlike response, resulting in adecrease in the slope of G9 with v. Because G0continues to decrease with roughly the sameslope, this combination translates into a maxi-mum in tan d at the frequency where the slopes ofG9 and G0 versus v are roughly equal. Similarfeatures have been observed for ordered blockcopolymers and have been attributed to the onsetof microdomain and defect-related dynamics dom-inating over single-chain relaxation.17
To examine the effect of filler loading on linearviscoelastic properties, G9 and tan d mastercurves for the composites with various carbonblack loadings are shown in Figures 3 and 4,respectively. The frequency range over whichdata were obtained at 180 °C was restricted be-
cause of the tendency of the polymer to undergocrosslinking with extended exposure to high tem-peratures even in an inert nitrogen atmosphere.The viscoelastic responses for all carbon blackconcentrations obey the principle of time–tem-perature superposition. Not surprisingly, G9 andG0 increase monotonically with carbon black load-ing at all frequencies, as expected for filler-rein-forced systems.18 Furthermore, the progressiontoward the pseudosolidlike behavior is apparentas the power law dependence of G9 at low frequen-cies decreases with increasing amounts of filler,until it is almost frequency-independent beyond aloading of 9 vol %. Additionally, the peak at lowfrequencies in tan d is observed for compositeswith carbon black loadings in excess of 9 vol %.The near independence of G9 with frequency atlow frequencies and the presence of a peak in tand at low frequencies (from the increasing domi-
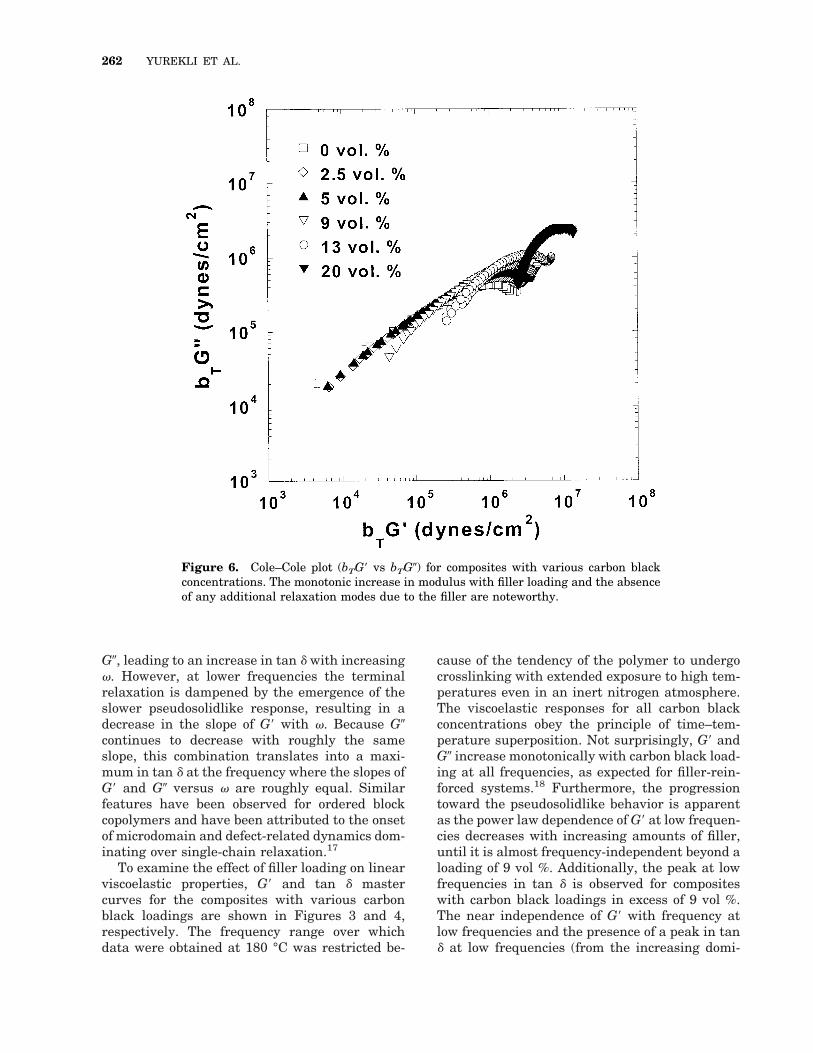
Figure 6. Cole–Cole plot (bTG9 vs bTG0) for composites with various carbon blackconcentrations. The monotonic increase in modulus with filler loading and the absenceof any additional relaxation modes due to the filler are noteworthy.
262 YUREKLI ET AL.
nance of G9 over G0) suggests that the compositeswith more than 9 vol % carbon black displaypseudosolid behavior. The structural origins ofthis transition to pseudosolid behavior are dis-cussed next.
As noted earlier, both frequency and modulishift factors (aT and bT, respectively) were re-quired to obtain time–temperature superposition-ing of the viscoelastic functions. The bT valuesranged from 0.9 to 1.1 and were in good agree-ment with the values calculated for the tempera-ture range with19
bT 5r0
r
T0
T (1)
where r and ro are the densities at T and To (thereference temperature), respectively. However,the values of aT, shown in Figure 5, are nearly
independent of the filler loading and similar tothose reported for narrow molecular weight dis-tribution PIB samples. We calculate the coeffi-cients of the Williams–Landell–Ferry (WLF) ex-pression, C1 and C2 as 7.8 and 152 K, respec-tively. These values are consistent, withinexperimental error, with the values reported byGraessley et al.20 The fact that the values of aT
are nearly independent of the filler concentrationsuggests that the temperature dependence of therelaxation probed is similar in the composites andthe unfilled polymer. Furthermore, Cole–Coleplots of bTG9 versus bTG0, shown in Figure 6,clearly illustrate the monotonic increase in mod-ulus with filler loading and the absence of anyadditional relaxation modes due to the filler.
The linear viscoelastic data presented can beexplained in one of two ways. One possibility isthat the relaxations of individual chains are
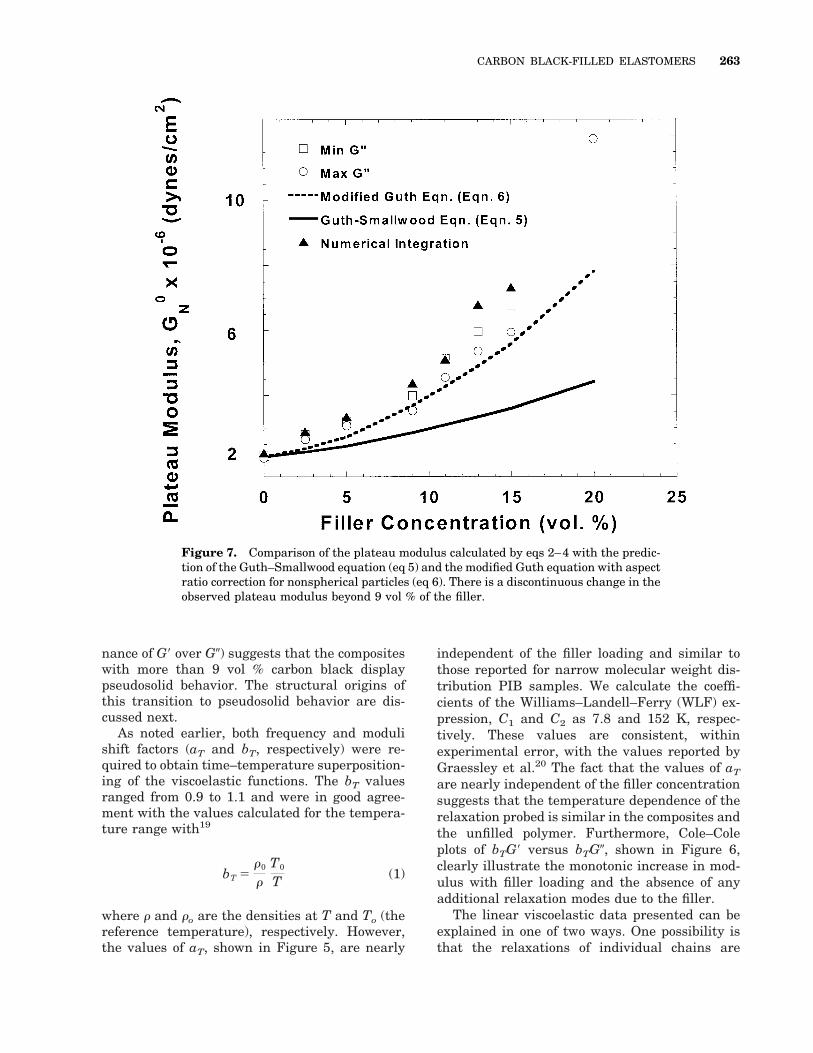
Figure 7. Comparison of the plateau modulus calculated by eqs 2–4 with the predic-tion of the Guth–Smallwood equation (eq 5) and the modified Guth equation with aspectratio correction for nonspherical particles (eq 6). There is a discontinuous change in theobserved plateau modulus beyond 9 vol % of the filler.
CARBON BLACK-FILLED ELASTOMERS 263
slowed, although the chains are not immobilized,as they are strongly adsorbed on the carbonblack.21 This slowing down as a result of adsorp-tion would lead to a bimodal distribution of relax-ation times and temperature dependence of relax-ation times, corresponding to the slower relax-ation of the adsorbed chains and the fasterrelaxation of the unaffected chains, respectively.However, as seen in Figure 6, all composites dis-play a single mode of relaxation. This, however,does not preclude the possibility of a temperature-independent completely immobile fraction of poly-mer chains that form a network structure. In fact,
the second possibility is the formation of a perco-lated filler network mediated by polymer chains,strongly adsorbed by the well-spaced bromine an-chors, beyond a critical filler concentration. Thepseudosolid behavior observed in the mastercurves with filler loadings of 9 vol % and higher isconsistent with the evolution of such a network. Ifsuch a network were indeed formed, the plateaumodulus would change discontinuously at a crit-ical carbon black loading because of a change inthe nature of the filler reinforcement. At low fillerloadings, it would be expected that the reinforce-ment would be a result of individual, well-dis-
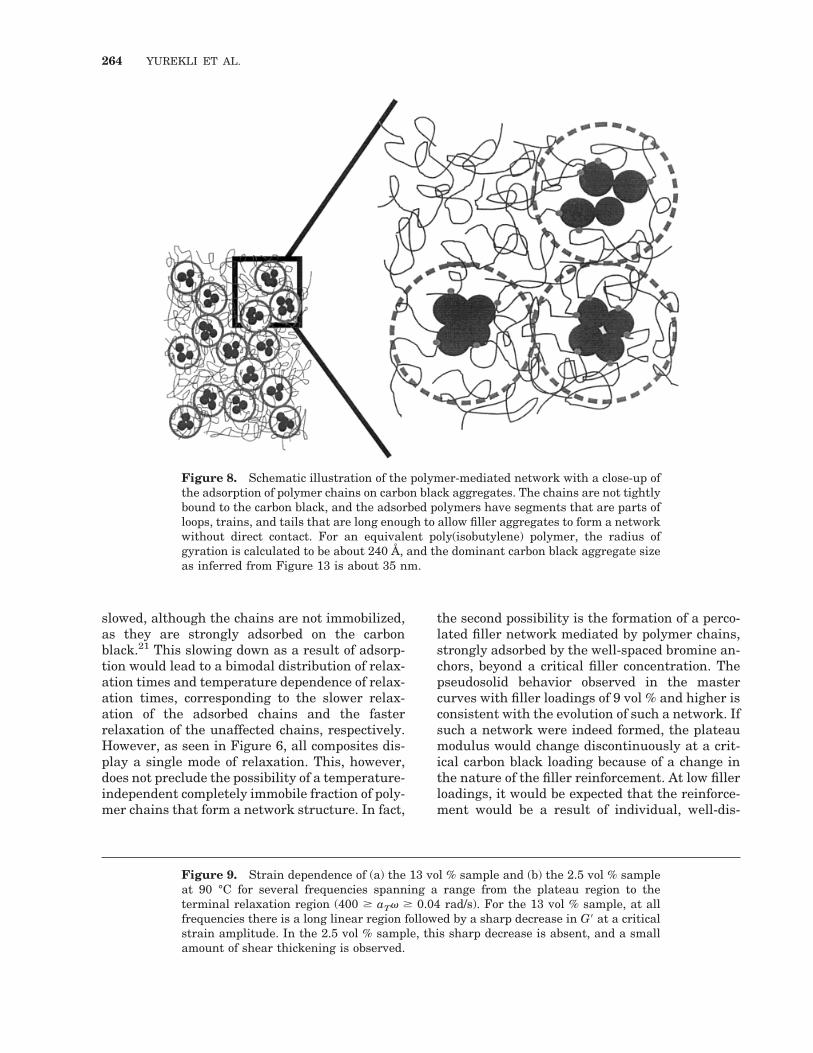
Figure 8. Schematic illustration of the polymer-mediated network with a close-up ofthe adsorption of polymer chains on carbon black aggregates. The chains are not tightlybound to the carbon black, and the adsorbed polymers have segments that are parts ofloops, trains, and tails that are long enough to allow filler aggregates to form a networkwithout direct contact. For an equivalent poly(isobutylene) polymer, the radius ofgyration is calculated to be about 240 Å, and the dominant carbon black aggregate sizeas inferred from Figure 13 is about 35 nm.
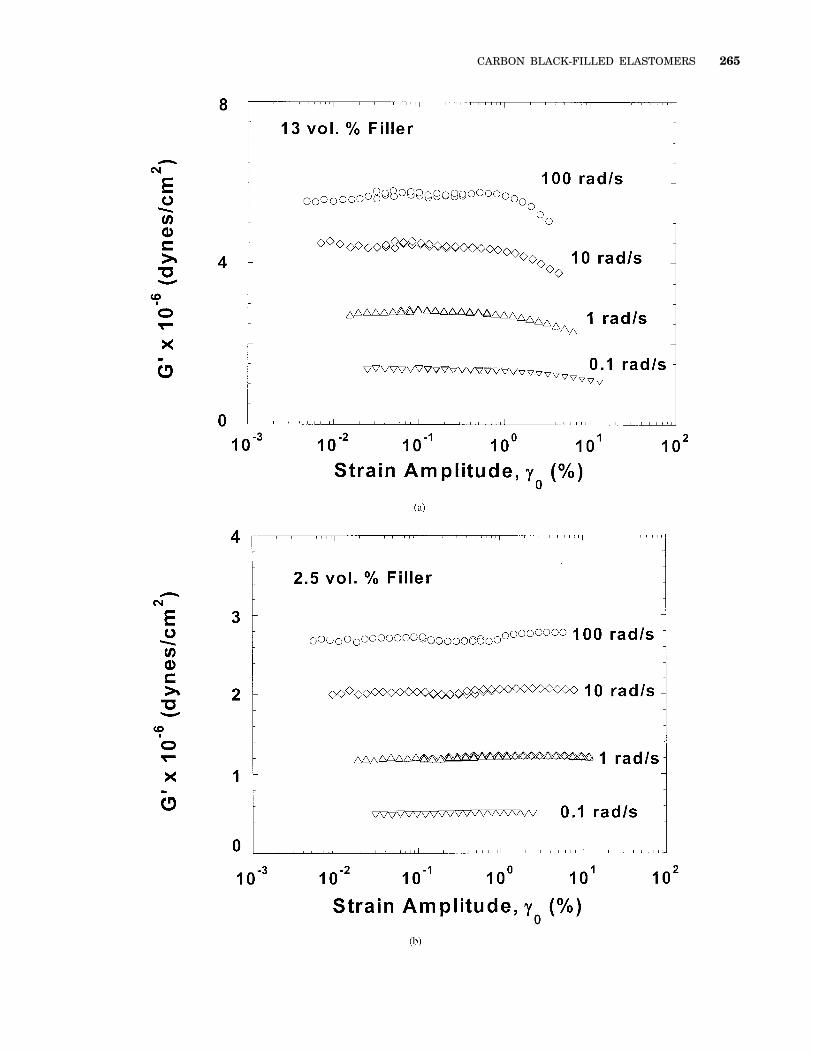
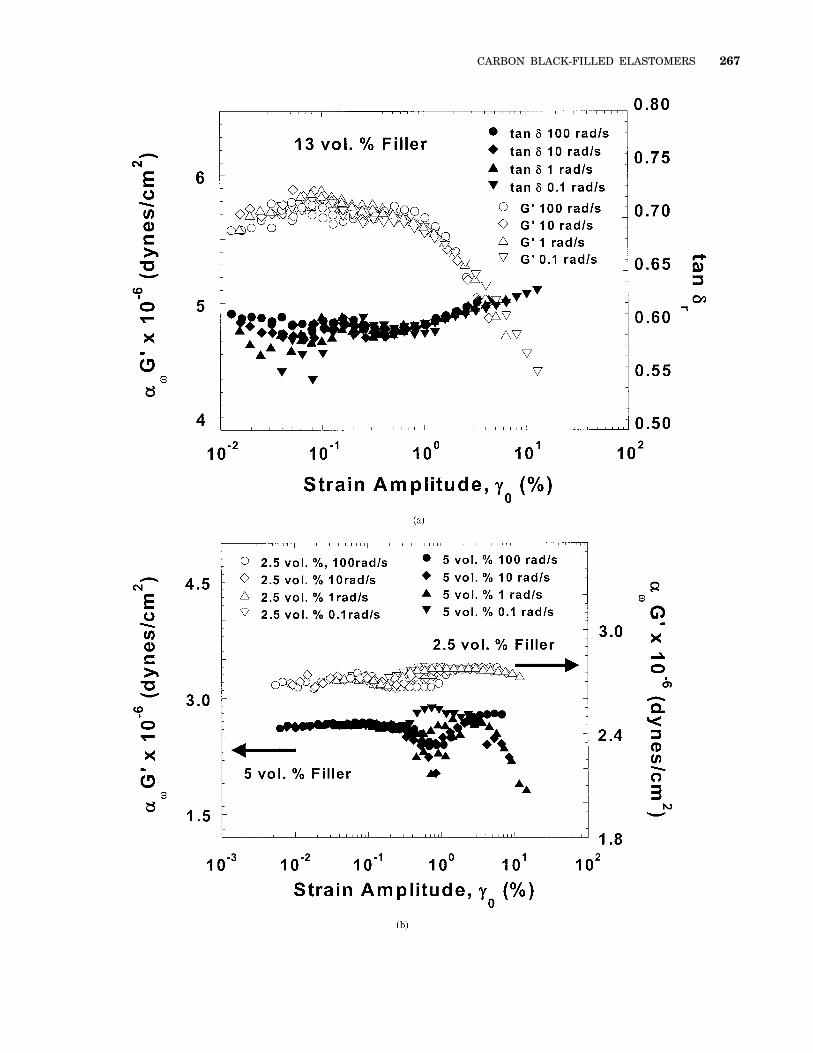
Figure 9. Strain dependence of (a) the 13 vol % sample and (b) the 2.5 vol % sampleat 90 °C for several frequencies spanning a range from the plateau region to theterminal relaxation region (400 $ aTv $ 0.04 rad/s). For the 13 vol % sample, at allfrequencies there is a long linear region followed by a sharp decrease in G9 at a criticalstrain amplitude. In the 2.5 vol % sample, this sharp decrease is absent, and a smallamount of shear thickening is observed.
264 YUREKLI ET AL.
CARBON BLACK-FILLED ELASTOMERS 265
persed inorganic particles, whereas beyond thecritical loading it would be expected that the re-inforcement would primarily be a consequence ofthe filler network and not individual particles.
The plateau modulus is determined from theviscoelastic data with three different methods.The first method is performed by obtaining thevalue of G9 at the minimum of G0 in the plateauregion:
GN0 5 G9 ~Corresponding to the minimum in G0!
(2)
The second method is based on a correlation byFerry:19
GN0 5
G 0max
0.207 (3)
where G0max is the maximum value of G0 in theplateau region. Finally, the plateau modulus isalso estimated by numerical integration of G0over the polymeric region:19
GN0 5
2p E
0
`
G9 d ln v (4)
The integration was carried out by the extrapola-tion of G0 to a low frequency with a power lawexpression and the numerical evaluation of theintegral up to the maximum in G0. We assumethat the G0 dependence is roughly symmetricalabout this maximum, and the value obtained byintegration of G0 from low frequency to the max-imum in G0 was multiplied by two to arrive at theplateau modulus. Although this assumption isrigorously incorrect even for homopolymers, it isexpected to break down severely for the highlyfilled composites because the mesoscopic struc-ture of the filler is likely to affect the low-fre-quency behavior. However, the high-frequencybehavior for the composites would only be affectedby shorter length scale dispersion and interactionbetween the polymer and the filler.
The plateau modulus (shown in Figure 7) forthe unfilled polymer calculated with this integra-tion and eqs 2 and 3 is in excellent agreementwith the value reported for PIB by Ferry19 andGraessley et al.20 The plateau modulus valuescalculated by the three different methods, de-scribed in eqs 2–4, are in good mutual agreementat low filler loadings. Beyond 11 vol %, however,the integration method seems to overestimate themodulus. The most likely reason for this discrep-ancy is the severe breakdown of the symmetryassumption for the shape of the G0 curve, as ex-plained previously.
For filled systems, the dependence of the mod-ulus on the filler loading is typically modeled withthe Guth–Smallwood equation, which for spheri-cal particles is given as22(a,b)
GN0 ~f! 5 GN
0 ~0!~1 1 2.5f 1 14.1f2! (5)
where GN0 (0) is the plateau modulus of the poly-
mer matrix, GN0 (f) is the modulus of the compos-
ite, and f is the volume fraction of the filler inthe composite. For filler particles that are non-spherical, this expression has been modified byGuth:22(b)
GN0 ~f! 5 GN
0 ~0!~1 1 0.67~af! 1 1.62~a2f2!! (6)
where a is the aspect ratio of the filler particles.As observed in Figure 7, the plateau modulus isnever well approximated by the Guth–Smallwoodequation (eq 5). The modified Guth equation withthe aspect ratio correction (eq 6) fits the databelow a filler loading of 9 vol % fairly well with a5 5.4, suggesting a considerably anisotropicstructure for the filler even at low filler loadings.This value of the aspect ratio turns out to be quiteunreasonable to describe the composites here, aswe show in the section where we discuss the AFMdata. However, above 9 vol % the increase inmodulus with f becomes sharper and deviateseven farther from the modified Guth equation (eq6). In fact, the data can be fitted with two func-tional forms corresponding to filler concentrations
Figure 10. Vertically shifted strain response of (a) the 13 vol % sample and (b) the 2.5and 5 vol % samples at 90 °C. For the 13 vol % sample, both G9 and tan d show goodtime–strain superposition with a critical strain amplitude of about 0.4% for the tran-sition from linear behavior to nonlinear behavior. In contrast, for the 2.5 vol % and 5 vol% samples, at least in G9, the strain amplitude where nonlinearity appears depends onthe frequency of the measurement, leading to poor time–strain superposition.
266 YUREKLI ET AL.
CARBON BLACK-FILLED ELASTOMERS 267
below and above 9 vol %. In light of the qualita-tive difference observed at 9 vol % in the linearviscoelasticity measurements, we suggest thatthe deviation from the modified Guth equation forthe composites with more than 9 vol % carbonblack is a result of the formation of a percolatednetwork structure of the filler.
The value for the percolation threshold for thefiller network in the composites examined is re-markable when compared with the percolationthresholds for other model systems and theoreti-cal calculations. For example, the critical volumefraction for the percolation of randomly distrib-uted overlapping spherical particles was reportedto be 29.5 vol % from theory.23(a) Although theparticles considered here are better representedby a model of excluded volume spheres, the per-colation threshold changes only slightly when in-teractions of the spheres are taken into ac-count.24,25 Employing the percolation thresholds
for prolate and oblate ellipsoids with effective as-pect ratios (a) of 5.4 suggests values of the perco-lation threshold of about 17 vol %.23(b) Further-more, for a system of conductive and insulatingspheres, it has been shown that percolation, asmeasured by electrical conductivity, occurs at 16vol %.26
The fact that the network formation in thiscase occurs below the expected percolationthreshold for spherical particles can be explainedby the presence of either highly anisotropic aggre-gation of carbon black27 or polymer chains thatmediate the interaction between filler particles,resulting in a percolated structure. As is shown inthe discussion of the AFM data, the carbon blackaggregates are small and only slightly anisotro-pic. However, the polymer chains adsorb on thefiller-particle aggregates as a result of the Lewisacid–base interactions between the Br groups onthe chains and the polar carbon black surface.
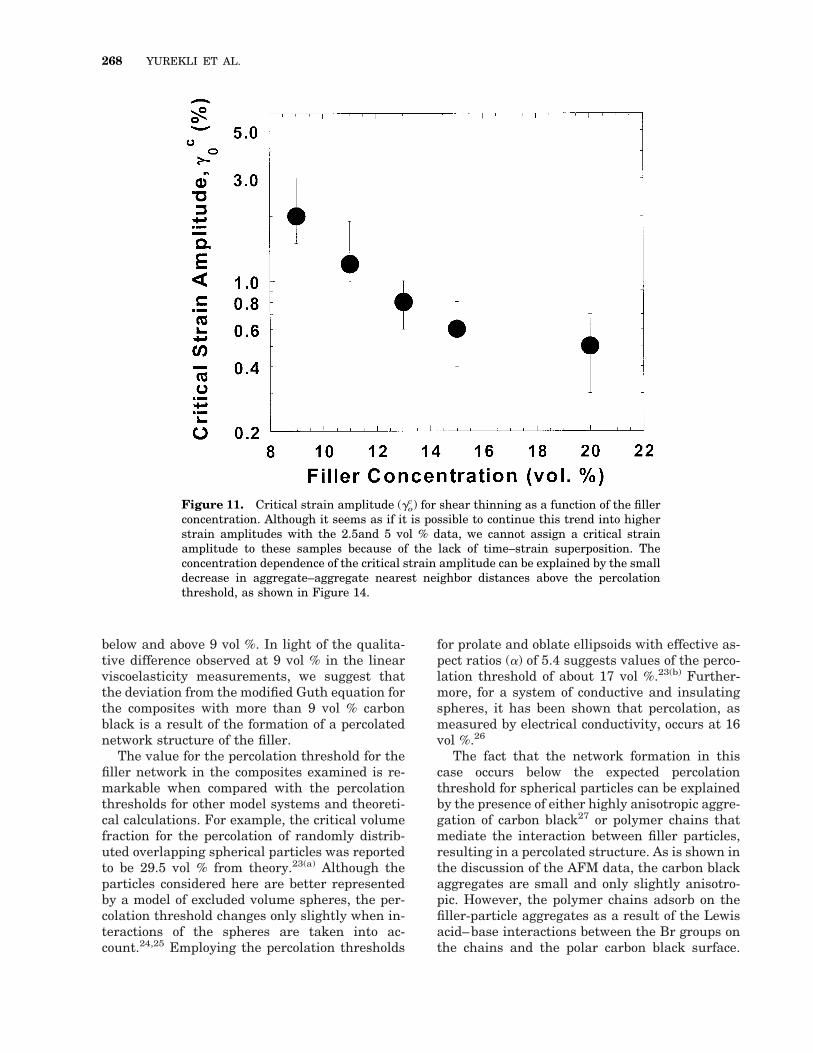
Figure 11. Critical strain amplitude (goc) for shear thinning as a function of the filler
concentration. Although it seems as if it is possible to continue this trend into higherstrain amplitudes with the 2.5and 5 vol % data, we cannot assign a critical strainamplitude to these samples because of the lack of time–strain superposition. Theconcentration dependence of the critical strain amplitude can be explained by the smalldecrease in aggregate–aggregate nearest neighbor distances above the percolationthreshold, as shown in Figure 14.
268 YUREKLI ET AL.
The presence of Br groups on polymer chains hasbeen shown to have strong interactions with polarsurfaces and has manifested as a dramaticchange in the friction coefficient of the polymersegments.28 Because there is approximately onlyone Br group for every 100 repeat units on thepolymer chain, the chains are not tightly bound tothe carbon black. Adsorbed polymers have seg-ments that are parts of loops, trains, and tails. Inthis case, the polymer loops and tails are longenough either to be adsorbed on more than onefiller aggregate or to be entangled with otherloops and tails from other adsorbed chains. Asillustrated in Figure 8, the filler aggregates do notneed to be in direct contact to form a network thatspans the whole material. This supporting of thenetwork by the polymer chains effectively in-creases the apparent volume fraction of the filleraggregates and decreases the percolation thresh-old for network formation. In fact, in a study ofthe percolation of carbon black in the presence ofdifferent polymer matrices, the percolationthreshold changed with the chemical nature ofthe polymer and was attributed to a change in thepolymer surface tension.29
Nonlinear Viscoelasticity
The strain-amplitude dependence of the storagemodulus for the 2.5 vol % sample and the 13 vol %sample at several frequencies is shown in Figure9. These frequencies span a range from the pla-teau region to the terminal relaxation region (400$ aTv $ 0.04 rad/s). We note that the frequenciesof measurement reported here do not extend wellbeyond the terminal relaxation frequency as aresult of potential crosslinking by extended expo-sure to high temperatures. Unlike what has usu-ally been observed previously for crosslinked sys-tems,6,7 the linear region in fact spans quite alarge strain-amplitude range. These results con-firm the linearity of the viscoelastic measure-ments presented in the previous section.
Furthermore, the G9 and G0 data for the 13 vol% composite at different strain amplitudes can besuperposed with the application of a vertical shift[Fig. 10(a)], suggesting that the transition of lin-ear behavior to nonlinear behavior is only a func-tion of strain amplitude. The vertical shifts forthe moduli are the ratios of the linear viscoelasticmodulus at the frequencies of measurement. Thefrequency-independent strain amplitude identify-ing the transition from linear viscoelasticity tononlinear viscoelasticity is denoted as a critical
strain amplitude (goc) and, for the 13 vol % com-
posite, is about 0.4%. Similar superpositioning oftan d was also achieved through vertically shift-ing by the addition or subtraction of a shift factor[Fig. 10(a)]. This ability to superpose viscoelasticdata at different frequencies is representative ofall samples with filler loadings of 9 vol % andhigher. However, the data for the 2.5 and 5 vol %composites do not show a significant linear–non-linear transition, and as seen from Figure 10(b),the data (at least G9) for these samples cannot besuperposed by a mere vertical shift. On the basisof the master curves of the strain-amplitude de-pendence of the modulus, we identify criticalstrain amplitudes (go
c) as a function of the carbonblack loading; these critical strain amplitudes areshown in Figure 11.
The presence of a critical strain amplitude andthe sharp decrease in the storage modulus beyondthe critical strain amplitude for composites withmore than 9 vol % carbon black are consistentwith the earlier postulated polymer-mediatedpercolated filler network for those composites.The network, which is held together by the ad-sorption of the polymer chains on the fillerthrough Lewis acid–base interactions, breaksdown with the imposition of large deformations,leading to the sharp decrease in the modulus be-yond the critical strain amplitude. Furthermore,the strain-amplitude dependence was reproduc-ible within minutes of the previous deformation(data not shown), suggesting that the filler net-work reforms quickly with the removal of theapplied large-amplitude oscillatory strain. Asnoted in the introduction, previous studies havesuggested that the recovery of the structure inhighly filled systems was possible only in the caseof crosslinked polymer matrices. The completerecovery of the network despite the use of un-crosslinked polymer probably occurred becausethe maximum applied strain amplitude in thesemeasurements was insufficient to completely dis-sociate the network. Complete dissociation wouldrequire the filler particles to not be connected toneighboring particles through a relatively shortpolymer matrix strand and also be far enoughapart once the strain is removed that a bridgecannot reform.
The fact that goc does not depend on v (and is,
therefore, independent of the shear stress orstrain energy) for the samples with carbonblack concentrations greater than 9 vol % sug-gests the breakdown of the filler network isindependent of the mechanical response of the
CARBON BLACK-FILLED ELASTOMERS 269
polymer matrix and is reflective of the fillernetwork structure. This result is consistentwith the findings of Roland30 and Aranguren etal.,31 who showed that the breakup of the fillernetwork is essentially only dependent on thestrain amplitude. The concentration depen-dence of the critical strain amplitude can beexplained by the small decrease in aggregate–aggregate nearest neighbor distances above thepercolation threshold, as determined by AFMmeasurements (described in the following sec-tion). In the composites with the higher concen-trations of filler, the filler aggregates are heldtogether more closely and can be disrupted bythe application of smaller strains. For the 2.5and 5 vol % samples, which exhibit a frequency-dependent transition from linear behavior tononlinear behavior, the relaxation processesare still dictated by the free polymer matrix andnot by the filler network. Furthermore, in thesesamples G9 exhibits a maximum at intermedi-ate strain amplitudes before decreasing withincreasing strain amplitude. This might be dueto a slight ordering of the local correlations ofthe filler particles with the application of shearstrain. Once a small amplitude strain is ap-
plied, the presence of some mediating polymerchains between particles can cause the fillerparticles to align and provide better reinforce-ment, leading to the maximum in G9 at inter-mediate strain amplitudes.32
AFM
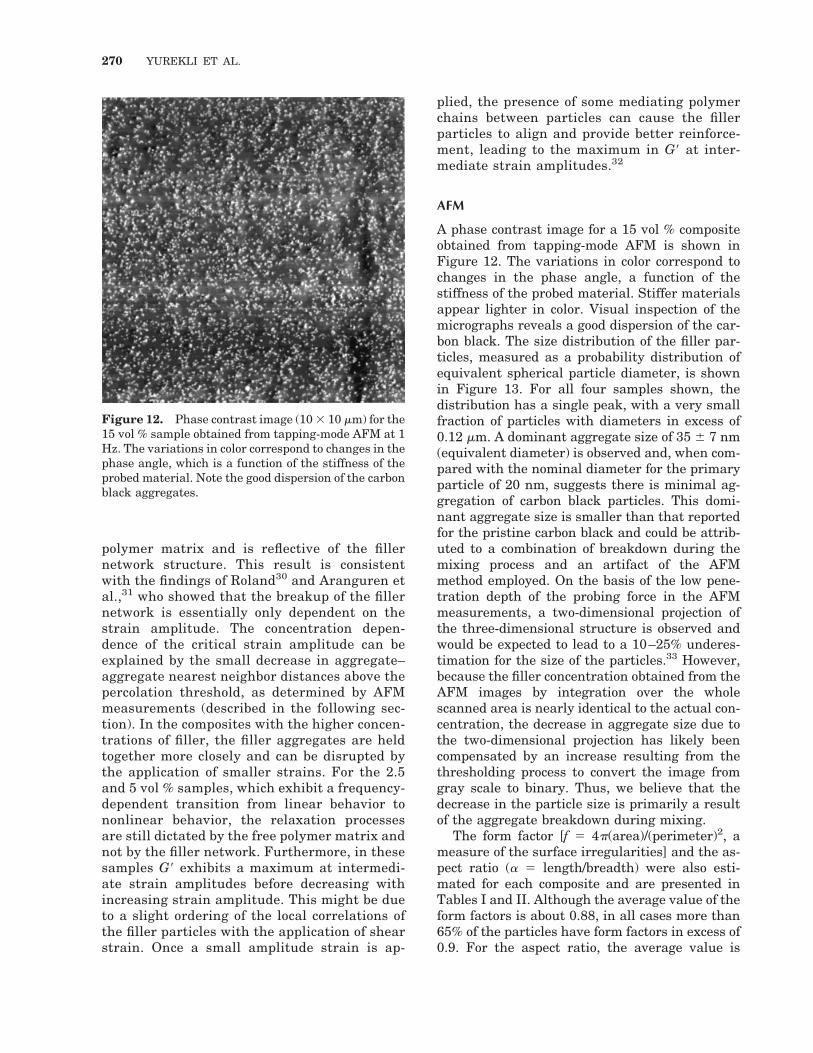
A phase contrast image for a 15 vol % compositeobtained from tapping-mode AFM is shown inFigure 12. The variations in color correspond tochanges in the phase angle, a function of thestiffness of the probed material. Stiffer materialsappear lighter in color. Visual inspection of themicrographs reveals a good dispersion of the car-bon black. The size distribution of the filler par-ticles, measured as a probability distribution ofequivalent spherical particle diameter, is shownin Figure 13. For all four samples shown, thedistribution has a single peak, with a very smallfraction of particles with diameters in excess of0.12 mm. A dominant aggregate size of 35 6 7 nm(equivalent diameter) is observed and, when com-pared with the nominal diameter for the primaryparticle of 20 nm, suggests there is minimal ag-gregation of carbon black particles. This domi-nant aggregate size is smaller than that reportedfor the pristine carbon black and could be attrib-uted to a combination of breakdown during themixing process and an artifact of the AFMmethod employed. On the basis of the low pene-tration depth of the probing force in the AFMmeasurements, a two-dimensional projection ofthe three-dimensional structure is observed andwould be expected to lead to a 10–25% underes-timation for the size of the particles.33 However,because the filler concentration obtained from theAFM images by integration over the wholescanned area is nearly identical to the actual con-centration, the decrease in aggregate size due tothe two-dimensional projection has likely beencompensated by an increase resulting from thethresholding process to convert the image fromgray scale to binary. Thus, we believe that thedecrease in the particle size is primarily a resultof the aggregate breakdown during mixing.
The form factor [f 5 4p(area)/(perimeter)2, ameasure of the surface irregularities] and the as-pect ratio (a 5 length/breadth) were also esti-mated for each composite and are presented inTables I and II. Although the average value of theform factors is about 0.88, in all cases more than65% of the particles have form factors in excess of0.9. For the aspect ratio, the average value is
Figure 12. Phase contrast image (10 3 10 mm) for the15 vol % sample obtained from tapping-mode AFM at 1Hz. The variations in color correspond to changes in thephase angle, which is a function of the stiffness of theprobed material. Note the good dispersion of the carbonblack aggregates.
270 YUREKLI ET AL.
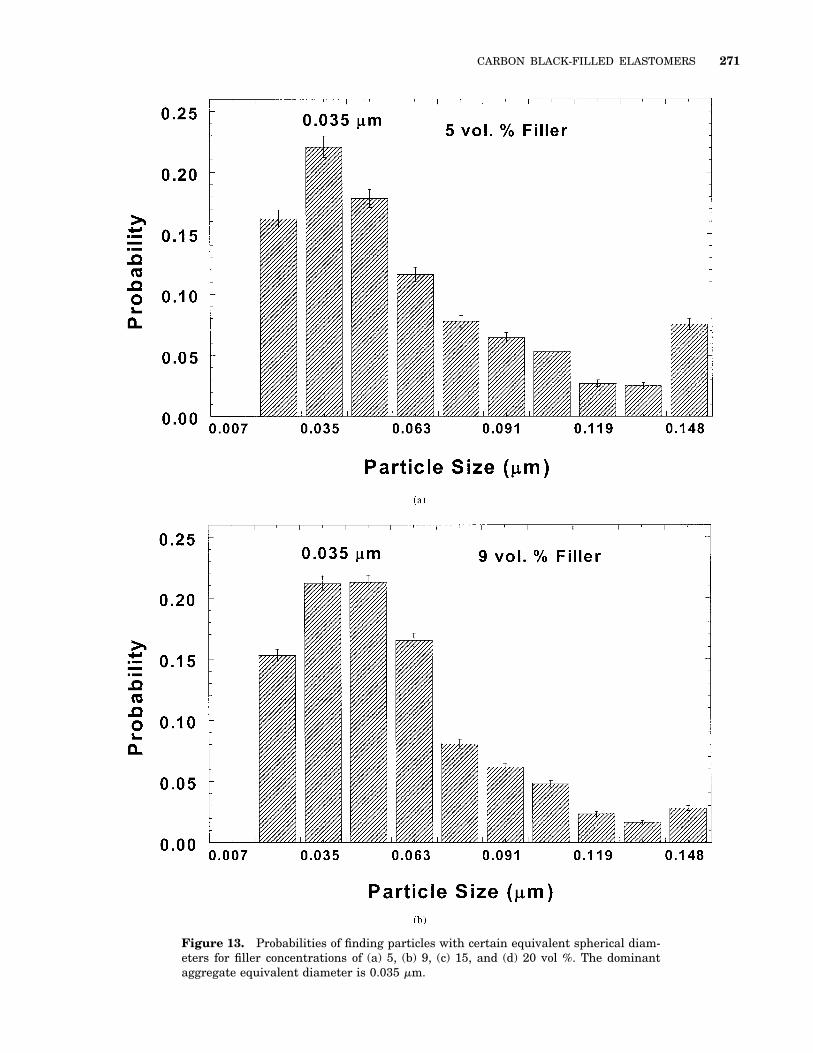
Figure 13. Probabilities of finding particles with certain equivalent spherical diam-eters for filler concentrations of (a) 5, (b) 9, (c) 15, and (d) 20 vol %. The dominantaggregate equivalent diameter is 0.035 mm.
CARBON BLACK-FILLED ELASTOMERS 271
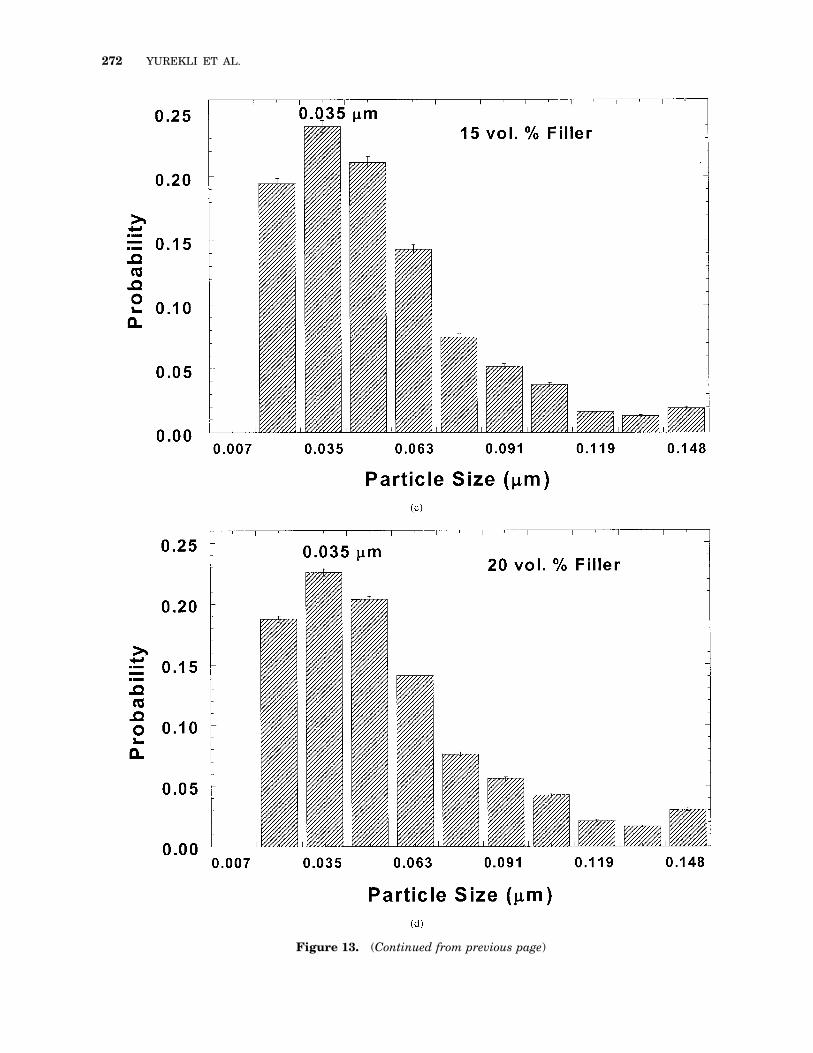
Figure 13. (Continued from previous page)
272 YUREKLI ET AL.
about 1.9, with about 90% of the particles havingaspect ratios less than 2.5. This suggests that thecarbon black aggregates in these composites, al-though exhibiting minimal aggregation, are alsoroughly spherical with a slight anisotropy. Wenote that employing the calculations for the per-colation threshold for prolate and oblate ellipsoidswith aspect ratios of 1.9 suggests a threshold vol-ume fraction of about 26 vol %.23(b) Also, althoughnot shown here, for all composites the value of theform factor determined experimentally decreasesslightly as the aggregate size increases. This isexpected as a result of the increased number sur-face irregularities as more particles are added tothe aggregate.
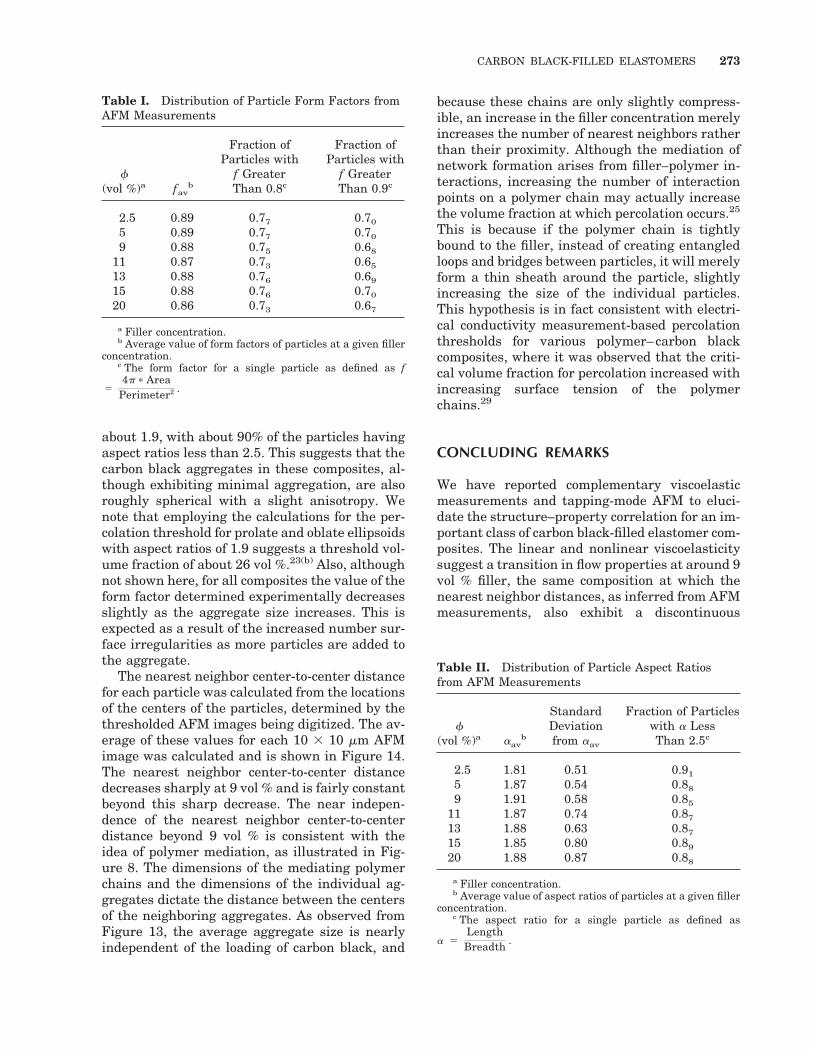
The nearest neighbor center-to-center distancefor each particle was calculated from the locationsof the centers of the particles, determined by thethresholded AFM images being digitized. The av-erage of these values for each 10 3 10 mm AFMimage was calculated and is shown in Figure 14.The nearest neighbor center-to-center distancedecreases sharply at 9 vol % and is fairly constantbeyond this sharp decrease. The near indepen-dence of the nearest neighbor center-to-centerdistance beyond 9 vol % is consistent with theidea of polymer mediation, as illustrated in Fig-ure 8. The dimensions of the mediating polymerchains and the dimensions of the individual ag-gregates dictate the distance between the centersof the neighboring aggregates. As observed fromFigure 13, the average aggregate size is nearlyindependent of the loading of carbon black, and
because these chains are only slightly compress-ible, an increase in the filler concentration merelyincreases the number of nearest neighbors ratherthan their proximity. Although the mediation ofnetwork formation arises from filler–polymer in-teractions, increasing the number of interactionpoints on a polymer chain may actually increasethe volume fraction at which percolation occurs.25
This is because if the polymer chain is tightlybound to the filler, instead of creating entangledloops and bridges between particles, it will merelyform a thin sheath around the particle, slightlyincreasing the size of the individual particles.This hypothesis is in fact consistent with electri-cal conductivity measurement-based percolationthresholds for various polymer–carbon blackcomposites, where it was observed that the criti-cal volume fraction for percolation increased withincreasing surface tension of the polymerchains.29
CONCLUDING REMARKS
We have reported complementary viscoelasticmeasurements and tapping-mode AFM to eluci-date the structure–property correlation for an im-portant class of carbon black-filled elastomer com-posites. The linear and nonlinear viscoelasticitysuggest a transition in flow properties at around 9vol % filler, the same composition at which thenearest neighbor distances, as inferred from AFMmeasurements, also exhibit a discontinuous
Table I. Distribution of Particle Form Factors fromAFM Measurements
f(vol %)a fav
b
Fraction ofParticles with
f GreaterThan 0.8c
Fraction ofParticles with
f GreaterThan 0.9c
2.5 0.89 0.77 0.70
5 0.89 0.77 0.70
9 0.88 0.75 0.68
11 0.87 0.73 0.65
13 0.88 0.76 0.69
15 0.88 0.76 0.70
20 0.86 0.73 0.67
a Filler concentration.b Average value of form factors of particles at a given filler
concentration.c The form factor for a single particle as defined as f
54p p Area
Perimeter2 .
Table II. Distribution of Particle Aspect Ratiosfrom AFM Measurements
f(vol %)a aav
b
StandardDeviationfrom aav
Fraction of Particleswith a LessThan 2.5c
2.5 1.81 0.51 0.91
5 1.87 0.54 0.88
9 1.91 0.58 0.85
11 1.87 0.74 0.87
13 1.88 0.63 0.87
15 1.85 0.80 0.89
20 1.88 0.87 0.88
a Filler concentration.b Average value of aspect ratios of particles at a given filler
concentration.c The aspect ratio for a single particle as defined as
a 5LengthBreadth .
CARBON BLACK-FILLED ELASTOMERS 273
change. We suggest that these changes in struc-tural and dynamic properties are indicative of theformation of a percolated filler network for com-posites with more than 9 vol % carbon black. Thepercolation threshold is considerably lower thanthat expected from the theoretical calculations ofoverlapping spheres, prolate and oblate ellipsoidswith modest aspect ratios, and those based on theelectrical conductivity measurements of conduct-ing and insulating spheres. Furthermore, AFMmeasurements clearly indicate that the carbonblack particles are not aggregated and also sug-gest that their shape is only slightly anisotropic,thereby eliminating the possibility that the pres-ence of highly anisotropic filler particles or aggre-gates are primarily responsible for the decreasedpercolation threshold. It is suggested that thepresence of a few bromine groups along the poly-mer chains results in the adsorption of a singlepolymer chain over several aggregates, or the en-tanglement of loops of adsorbed chains on adja-cent filler particles, leading to a strong mediation
of the carbon black-filler network structure. Onthe basis of this hypothesis, we expect that usinga polymer with a strong affinity for carbon blackmight in fact raise the percolation threshold, as itwould form a thin sheath around the filler parti-cle and not mediate the filler network as effec-tively. We are currently studying this possibilityby varying the amount of bromine substitution ofthe polymer chain and also by altering the size ofthe carbon black filler.
K. Yurekli and R. Krishnamoorti are grateful for finan-cial support from the donors of the Petroleum ResearchFund administered by the American Chemical Societyand from Exxon Chemical Co. (Baytown, TX). The au-thors thank Dr. C. Garcia-Franco and Dr. A. J. Dias foruseful discussions.
REFERENCES AND NOTES
1. Medalia, A. I. Rubber Chem Technol 1978, 51, 437–523.
Figure 14. Closest neighbor distance for a filler aggregate as a function of the fillerconcentration. Each diamond represents an average of values from each filler particleon a single 10 3 10 mm micrograph. The number of particles on a single micrographranges from about 500 for the 2.5 vol % sample to about 5000 for the 20 vol % sample.The filled circles are the averages for each loading from all micrographs obtained.
274 YUREKLI ET AL.
2. Wolff, S. In Carbon Black Science and Technology,2nd ed.; Donnet, J.-B.; Bansal, R. C.; Wang, M.-J.,Eds.; Marcel Dekker: New York, 1993; p 289.
3. Gerspacher, M. In Carbon Black Science and Tech-nology, 2nd ed.; Donnet, J.-B.; Bansal, R. C.; Wang,M.-J., Eds.; Marcel Dekker: New York, 1993; p 377.
4. Warring, J. R. S. Trans Inst Rubber Ind 1950, 26, 4.5. Fletcher, W. P.; Gent, A. N. Trans Inst Rubber Ind
1953, 29, 266.6. Payne, A. R. J Appl Polym Sci 1962, 6, 57–63.7. Payne, A. R.; Watson, W. F. Rubber Chem Technol
1963, 36, 147–155.8. Payne, A. R. In Reinforcement of Elastomers;
Kraus, G., Ed.; Interscience: New York, 1965; pp69–123.
9. Payne, A. R.; Whittaker, R. E. Rubber Chem Tech-nol 1971, 44, 440–476.
10. Voet, A.; Cook, F. R. Rubber Chem Technol 1968,41, 1207–1214.
11. Voet, A.; Morawski, J. C. Rubber Chem Technol1974, 47, 765–777.
12. Voet, A. Rubber Chem Technol 1981, 54, 42–50.13. Isono, Y.; Ferry, J. D. Rubber Chem Technol 1984,
57, 925–943.14. Arai, K.; Ferry, J. D. Rubber Chem Technol 1986,
59, 241–254.15. Donnet, J.-B. Rubber Chem Technol 1998, 71, 323–
341.16. Barbin, W. W.; Rodgers, M. B. In Science and Tech-
nology of Rubber, 2nd ed.; Mark, J. E.; Erman, B.;Eirich, F. R., Eds.; Academic: New York, 1994; p433.
17. (a) Fredrickson, G. H.; Bates, F. S. Annu Rev MaterSci 1996, 26, 501–550; (b) Larson, R. G.; Winey,K. I.; Patel, S. S.; Watanabe, H.; Bruinsma, R.Rheol Acta 1993, 32, 245–253; (c) Colby, R. H. CurrOpin Col Inter Sci 1996, 1, 454; (d) Kossuth, M. B.;Morse, D. C.; Bates, F. S. J Rheology 1999, 43,167–196.
18. (a) Khan, S. A.; Prud’homme, R. K. Rev Chem Eng1987, 4, 205–270; (b) Wang, M.-J. Rubber ChemTechnol 1998, 71, 520–589; (c) Gandhi, K.; Salovey,R. Polym Eng Sci 1988, 28, 877–887.
19. Ferry, J. D. Viscoelastic Properties of Polymers,3rd ed.; Wiley: New York, 1980.
20. Fetters, L. J.; Graessley, W. W.; Kiss, A. D. Macro-molecules 1991, 24, 3136–3141.
21. To characterize the filler–polymer interaction andverify that the interaction was a strong adsorptionand not a chemical crosslink, we examined thebound rubber content. The bound rubber content,defined as the weight percentage of the polymer
that could not be extracted from the polymer–fillercomposite with a good solvent, was measured fordifferent concentrations of carbon black at a num-ber of temperatures and was suggestive of thestrength of the polymer–filler interaction. Theamount of bound rubber increased monotonicallywith filler concentration. At a filler concentration of15 vol %, the bound rubber content was 23.0% atroom temperature, 18.5% at 80 °C, and 12.0% at120 °C. The room temperature and 80 °C measure-ments were carried out in cyclohexane, whereasthe measurements at 120 °C were performed withtoluene. This decrease in bound rubber with in-creasing temperature suggests that the interactionbetween the filler and the polymer was at least tosome extent physical adsorption and not chemicalcrosslinking, although the absence of some level ofchemical crosslinking could not be ruled out.
22. (a) Smallwood, H. M. J Appl Phys 1944, 15, 758–766; (b) Guth, E. J Appl Phys 1945, 16, 20–25.
23. (a) Isichenko, M. B. Rev Mod Phys 1998, 64, 961–1043; (b) Garboczi, E. J.; Snyder, K. A.; Douglas,J. F.; Thorpe, M. F. Phys Rev E, Stat Phys, Plas-mas, Fluids, and Related Interdisciplinary Topics1995, 52, 819–828.
24. (a) Pike, G. E.; Seager, C. H. Phys Rev B, SolidState 1974, 10, 1421–1434; (b) Gawlinski, E. T.;Redner, S. J Phys A: Math Gen 1983, 16, 1063–1071.
25. Bug, A. L. R.; Safran, S. A.; Grest, G. S.; Webman,I. Phys Rev Lett 1985, 55, 1896–1899.
26. (a) McLachlan, D. S.; Blaszkiewicz, M.; Newnham,R. E. J Am Ceram Soc 1990, 73, 2187–2203; (b)Fitzpatrick, J. P.; Malt, R. B.; Spaepen, F. PhysLett A 1974, 47, 207–208.
27. Ren, J.; Silva, A. S.; Krishnamoorti, R. Macromol-ecules 2000, 33, 3739–3746.
28. Manias, E.; Chen, H.; Krishnamoorti, R.; Genzer,J.; Kramer, E. J.; Giannelis, E. P. Macromolecules2000, 33, 7955–7966.
29. Miyasaka, K.; Watanabe, K.; Jojima, E.; Aida, H.;Sumita, M.; Ishikawa, K. J Mater Sci 1982, 17,1610–1615.
30. Roland, C. M. J Rheol 1990, 34, 25–34.31. Aranguren, M. I.; Mora, E.; De Groot, J. V., Jr.;
Macosko, C. W. J Rheol 1992, 36, 1165–1182.32. Newstein, M. C.; Wang, H.; Balsara, N. P.; Lefeb-
vre, A. A.; Shnidman, Y.; Watanabe, H.; Osaki, K.;Shikata, T.; Niwa, H.; Morishima, Y. J Chem Phys1999, 111, 4827–4838.
33. Gruber, T. C.; Herd, C. R. Rubber Chem Technol1997, 70, 727–746.
CARBON BLACK-FILLED ELASTOMERS 275