Embed Size (px)
Citation preview
S1
Structural Understanding of Superior Battery Properties of Partially Ni-doped
Li2MnO3 as Cathode Material Toshiyuki Matsunaga,*a Hideyuki Komatsu,a Keiji Shimoda,a Taketoshi Minato,a Masao Yonemura,b Takashi Kamiyama,b Shunsuke Kobayashi,c Takeharu Kato,c
Tsukasa Hirayama,c Yuichi Ikuhara,c, d Hajime Arai,a Yoshio Ukyo,a Yoshiharu Uchimoto,e and Zempachi Ogumia
aOffice of Society-Academia Collaboration for Innovation, Kyoto University, Gokasho, Uji, Kyoto 611-0011, Japan
bNeutron Science Laboratory, Institute of Materials Structure Science, High Energy Accelerator Research Organization, 1-1 Oho, Tsukuba, Ibaraki 305-0801, Japan
§cNanostructures Research Laboratory, Japan Fine Ceramics Center, 2-4-1 Mutsuno, Atsuta, Nagoya 456-8587, Japan
dInstitute of Engineering Innovation, University of Tokyo, 2-11-16 Yayoi, Bunkyo-ku, Tokyo 113-8656, Japan
eGraduate School of Human and Environmental Studies, Kyoto University, Yoshida-nihonmatsu-cho, Sakyo-ku, Kyoto 606-8501, Japan
S2
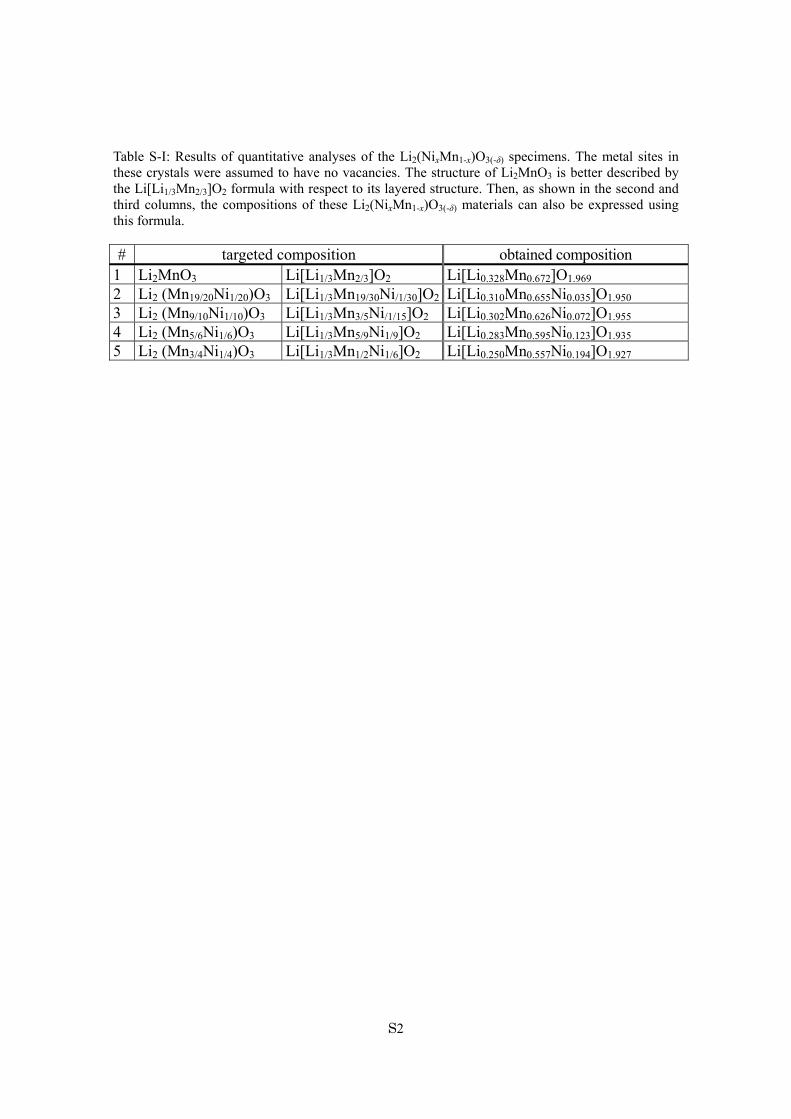
Table S-I: Results of quantitative analyses of the Li2(NixMn1-x)O3(-δ) specimens. The metal sites in these crystals were assumed to have no vacancies. The structure of Li2MnO3 is better described by the Li[Li1/3Mn2/3]O2 formula with respect to its layered structure. Then, as shown in the second and third columns, the compositions of these Li2(NixMn1-x)O3(-δ) materials can also be expressed using this formula. # targeted composition obtained composition
1 Li2MnO3 Li[Li1/3Mn2/3]O2 Li[Li0.328Mn0.672]O1.969 2 Li2 (Mn19/20Ni1/20)O3 Li[Li1/3Mn19/30Ni/1/30]O2 Li[Li0.310Mn0.655Ni0.035]O1.950 3 Li2 (Mn9/10Ni1/10)O3 Li[Li1/3Mn3/5Ni/1/15]O2 Li[Li0.302Mn0.626Ni0.072]O1.955 4 Li2 (Mn5/6Ni1/6)O3 Li[Li1/3Mn5/9Ni1/9]O2 Li[Li0.283Mn0.595Ni0.123]O1.935 5 Li2 (Mn3/4Ni1/4)O3 Li[Li1/3Mn1/2Ni1/6]O2 Li[Li0.250Mn0.557Ni0.194]O1.927
S3
0.0 0.1 0.2 0.3 0.4 0.50.0
0.1
0.2
0.3
0.4
0.50.5
0.6
0.7
0.8
0.9
1.0
54321
3
Mn1/2Ni1/2
Li1/3Mn1/2Ni1/6
5
42
1 LiMn
Ni
Li1/3Mn2/3
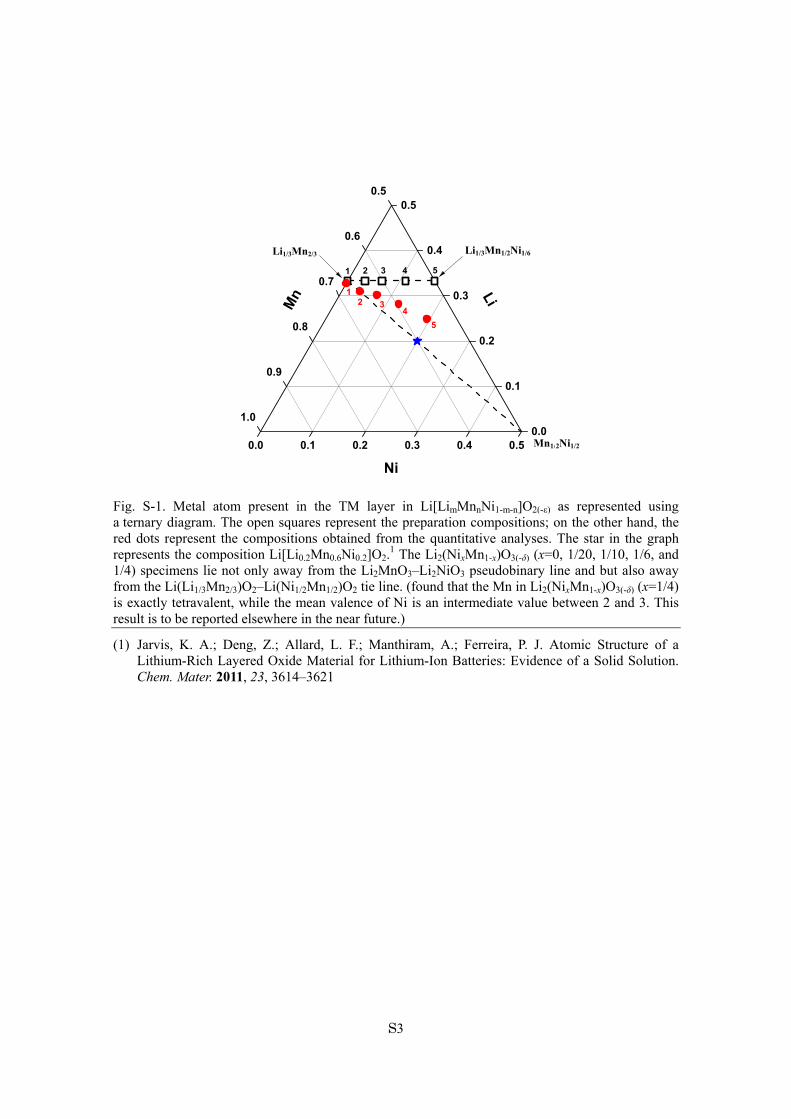
Fig. S-1. Metal atom present in the TM layer in Li[LimMnnNi1-m-n]O2(-ε) as represented using a ternary diagram. The open squares represent the preparation compositions; on the other hand, the red dots represent the compositions obtained from the quantitative analyses. The star in the graph represents the composition Li[Li0.2Mn0.6Ni0.2]O2.
1 The Li2(NixMn1-x)O3(-δ) (x=0, 1/20, 1/10, 1/6, and 1/4) specimens lie not only away from the Li2MnO3–Li2NiO3 pseudobinary line and but also away from the Li(Li1/3Mn2/3)O2–Li(Ni1/2Mn1/2)O2 tie line. (found that the Mn in Li2(NixMn1-x)O3(-δ) (x=1/4) is exactly tetravalent, while the mean valence of Ni is an intermediate value between 2 and 3. This result is to be reported elsewhere in the near future.)
(1) Jarvis, K. A.; Deng, Z.; Allard, L. F.; Manthiram, A.; Ferreira, P. J. Atomic Structure of a Lithium-Rich Layered Oxide Material for Lithium-Ion Batteries: Evidence of a Solid Solution. Chem. Mater. 2011, 23, 3614–3621
S4
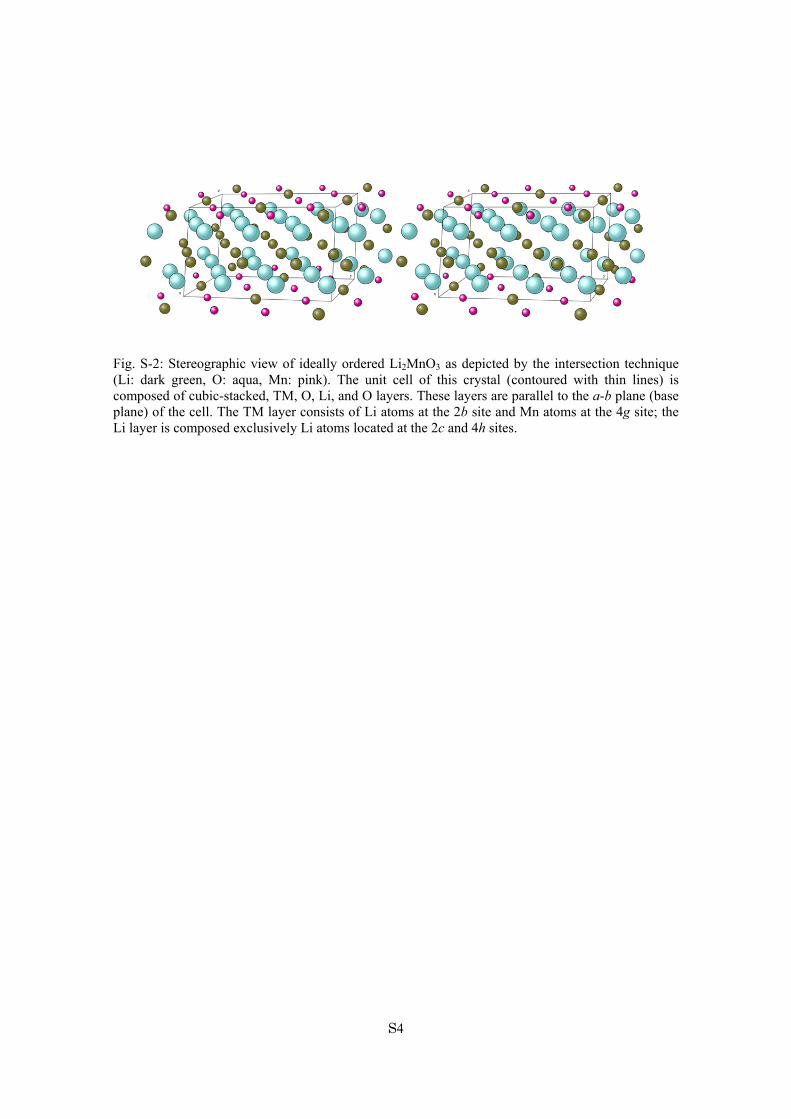
Fig. S-2: Stereographic view of ideally ordered Li2MnO3 as depicted by the intersection technique (Li: dark green, O: aqua, Mn: pink). The unit cell of this crystal (contoured with thin lines) is composed of cubic-stacked, TM, O, Li, and O layers. These layers are parallel to the a-b plane (base plane) of the cell. The TM layer consists of Li atoms at the 2b site and Mn atoms at the 4g site; the Li layer is composed exclusively Li atoms located at the 2c and 4h sites.
S5
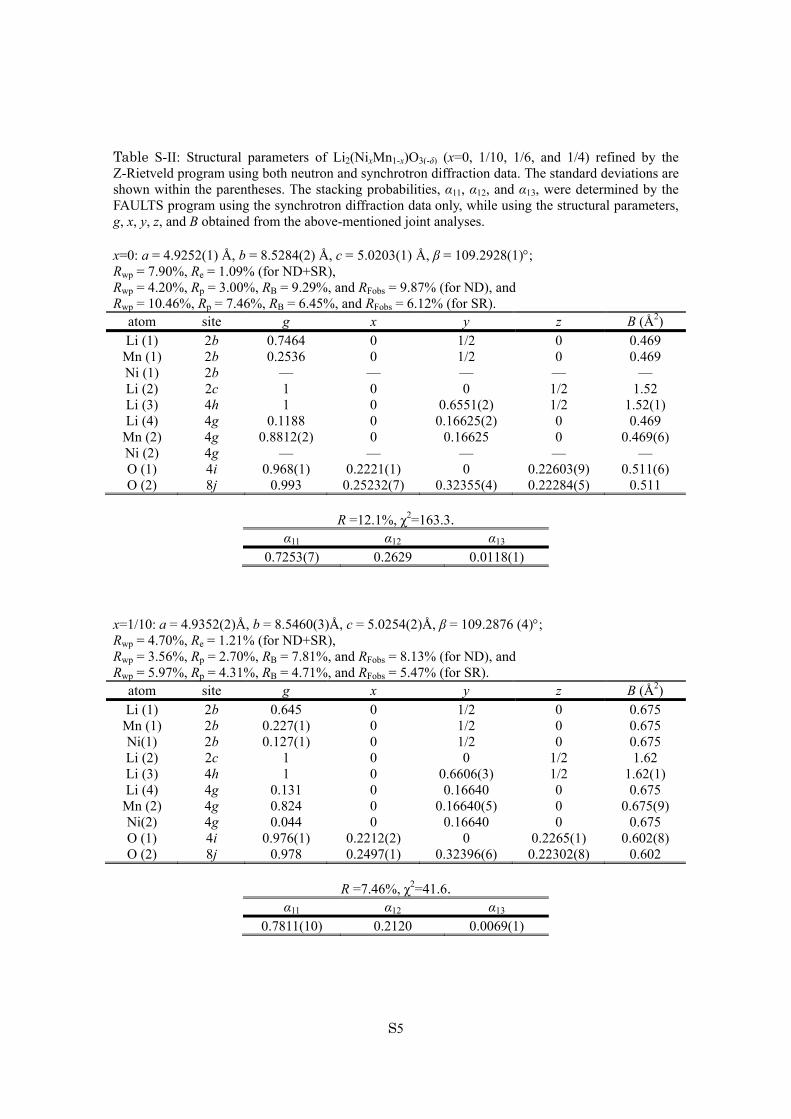
Table S-II: Structural parameters of Li2(NixMn1-x)O3(-δ) (x=0, 1/10, 1/6, and 1/4) refined by the Z-Rietveld program using both neutron and synchrotron diffraction data. The standard deviations are shown within the parentheses. The stacking probabilities, α11, α12, and α13, were determined by the FAULTS program using the synchrotron diffraction data only, while using the structural parameters, g, x, y, z, and B obtained from the above-mentioned joint analyses. x=0: a = 4.9252(1) Å, b = 8.5284(2) Å, c = 5.0203(1) Å, β = 109.2928(1); Rwp = 7.90%, Re = 1.09% (for ND+SR), Rwp = 4.20%, Rp = 3.00%, RB = 9.29%, and RFobs = 9.87% (for ND), and Rwp = 10.46%, Rp = 7.46%, RB = 6.45%, and RFobs = 6.12% (for SR).
atom site g x y z B (Å2) Li (1) 2b 0.7464 0 1/2 0 0.469
Mn (1) 2b 0.2536 0 1/2 0 0.469 Ni (1) 2b ‒‒ ‒‒ ‒‒ ‒‒ ‒‒ Li (2) 2c 1 0 0 1/2 1.52 Li (3) 4h 1 0 0.6551(2) 1/2 1.52(1) Li (4) 4g 0.1188 0 0.16625(2) 0 0.469
Mn (2) 4g 0.8812(2) 0 0.16625 0 0.469(6) Ni (2) 4g ‒‒ ‒‒ ‒‒ ‒‒ ‒‒ O (1) 4i 0.968(1) 0.2221(1) 0 0.22603(9) 0.511(6) O (2) 8j 0.993 0.25232(7) 0.32355(4) 0.22284(5) 0.511
R =12.1%, χ2=163.3.
α11 α12 α13 0.7253(7) 0.2629 0.0118(1)
x=1/10: a = 4.9352(2)Å, b = 8.5460(3)Å, c = 5.0254(2)Å, β = 109.2876 (4); Rwp = 4.70%, Re = 1.21% (for ND+SR), Rwp = 3.56%, Rp = 2.70%, RB = 7.81%, and RFobs = 8.13% (for ND), and Rwp = 5.97%, Rp = 4.31%, RB = 4.71%, and RFobs = 5.47% (for SR).
atom site g x y z B (Å2) Li (1) 2b 0.645 0 1/2 0 0.675
Mn (1) 2b 0.227(1) 0 1/2 0 0.675 Ni(1) 2b 0.127(1) 0 1/2 0 0.675 Li (2) 2c 1 0 0 1/2 1.62 Li (3) 4h 1 0 0.6606(3) 1/2 1.62(1) Li (4) 4g 0.131 0 0.16640 0 0.675
Mn (2) 4g 0.824 0 0.16640(5) 0 0.675(9) Ni(2) 4g 0.044 0 0.16640 0 0.675 O (1) 4i 0.976(1) 0.2212(2) 0 0.2265(1) 0.602(8) O (2) 8j 0.978 0.2497(1) 0.32396(6) 0.22302(8) 0.602
R =7.46%, χ2=41.6.
α11 α12 α13 0.7811(10) 0.2120 0.0069(1)
S6
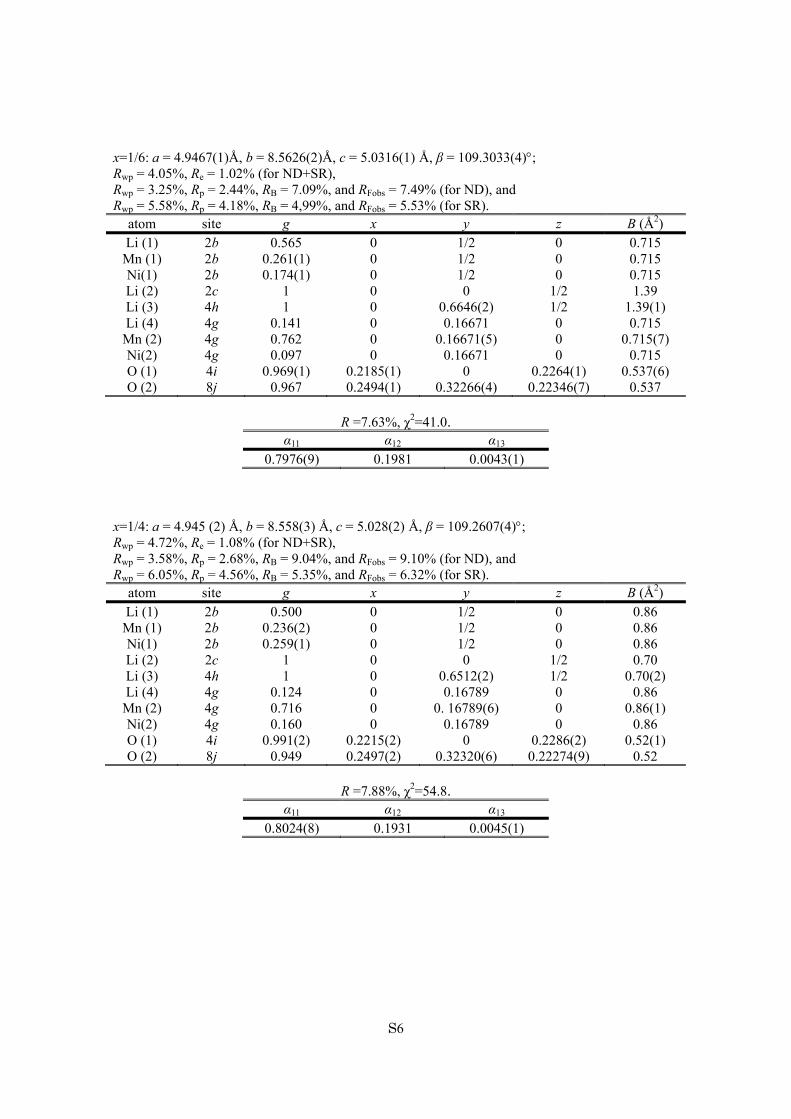
x=1/6: a = 4.9467(1)Å, b = 8.5626(2)Å, c = 5.0316(1) Å, β = 109.3033(4); Rwp = 4.05%, Re = 1.02% (for ND+SR), Rwp = 3.25%, Rp = 2.44%, RB = 7.09%, and RFobs = 7.49% (for ND), and Rwp = 5.58%, Rp = 4.18%, RB = 4,99%, and RFobs = 5.53% (for SR).
atom site g x y z B (Å2) Li (1) 2b 0.565 0 1/2 0 0.715
Mn (1) 2b 0.261(1) 0 1/2 0 0.715 Ni(1) 2b 0.174(1) 0 1/2 0 0.715 Li (2) 2c 1 0 0 1/2 1.39 Li (3) 4h 1 0 0.6646(2) 1/2 1.39(1) Li (4) 4g 0.141 0 0.16671 0 0.715
Mn (2) 4g 0.762 0 0.16671(5) 0 0.715(7) Ni(2) 4g 0.097 0 0.16671 0 0.715 O (1) 4i 0.969(1) 0.2185(1) 0 0.2264(1) 0.537(6) O (2) 8j 0.967 0.2494(1) 0.32266(4) 0.22346(7) 0.537
R =7.63%, χ2=41.0.
α11 α12 α13 0.7976(9) 0.1981 0.0043(1)
x=1/4: a = 4.945 (2) Å, b = 8.558(3) Å, c = 5.028(2) Å, β = 109.2607(4); Rwp = 4.72%, Re = 1.08% (for ND+SR), Rwp = 3.58%, Rp = 2.68%, RB = 9.04%, and RFobs = 9.10% (for ND), and Rwp = 6.05%, Rp = 4.56%, RB = 5.35%, and RFobs = 6.32% (for SR).
atom site g x y z B (Å2) Li (1) 2b 0.500 0 1/2 0 0.86
Mn (1) 2b 0.236(2) 0 1/2 0 0.86 Ni(1) 2b 0.259(1) 0 1/2 0 0.86 Li (2) 2c 1 0 0 1/2 0.70 Li (3) 4h 1 0 0.6512(2) 1/2 0.70(2) Li (4) 4g 0.124 0 0.16789 0 0.86
Mn (2) 4g 0.716 0 0. 16789(6) 0 0.86(1) Ni(2) 4g 0.160 0 0.16789 0 0.86 O (1) 4i 0.991(2) 0.2215(2) 0 0.2286(2) 0.52(1) O (2) 8j 0.949 0.2497(2) 0.32320(6) 0.22274(9) 0.52
R =7.88%, χ2=54.8.
α11 α12 α13 0.8024(8) 0.1931 0.0045(1)
S7
2.0 4.0 6.0 8.0 10.01.0 11.0
0.1
0.2
0.3
0.4
0.5
0.0
0.6
110
020
111
021
-111
001
Inte
nsi
ty (
arb
. un
it)
q (Å-1)
ND
-0.060.000.06
2.0 4.0 6.0 8.0 10.01.0 11.0
0
100
200
300
400
-50
500
110
020
111
021
-111
001
Inte
nsi
ty (
kco
un
ts)
q (Å-1)
SR
-50050
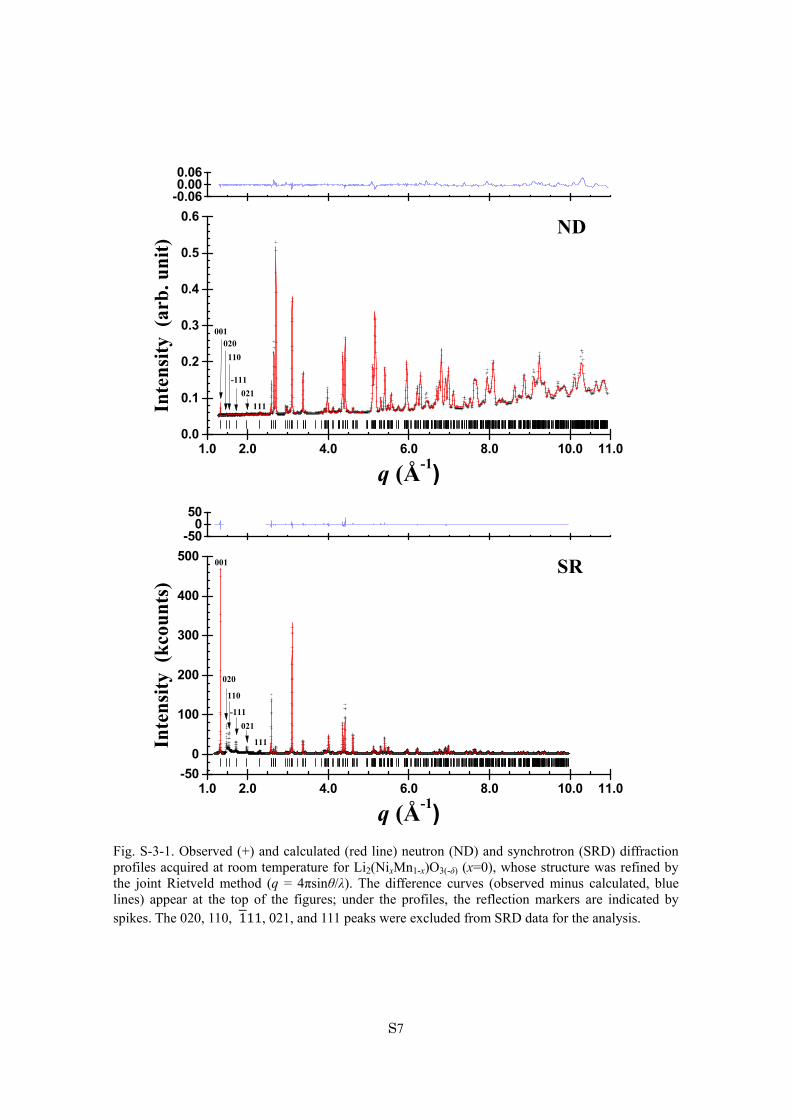
Fig. S-3-1. Observed (+) and calculated (red line) neutron (ND) and synchrotron (SRD) diffraction profiles acquired at room temperature for Li2(NixMn1-x)O3(-δ) (x=0), whose structure was refined by the joint Rietveld method (q = 4πsinθ/λ). The difference curves (observed minus calculated, blue lines) appear at the top of the figures; under the profiles, the reflection markers are indicated by spikes. The 020, 110, 111, 021, and 111 peaks were excluded from SRD data for the analysis.
S8
2.0 4.0 6.0 8.0 10.01.0 11.0
0.1
0.2
0.3
0.4
0.5
0.0
0.6
110
020
111021
-111
001
Inte
nsi
ty (
arb
. un
it)
q (Å-1)
ND
-0.060.000.06
2.0 4.0 6.0 8.0 10.01.0 11.0
0
50
100
150
200
-25
250
110
020
111
021
-111
001
Inte
nsi
ty (
kco
un
ts)
q (Å-1)
SR
-25025
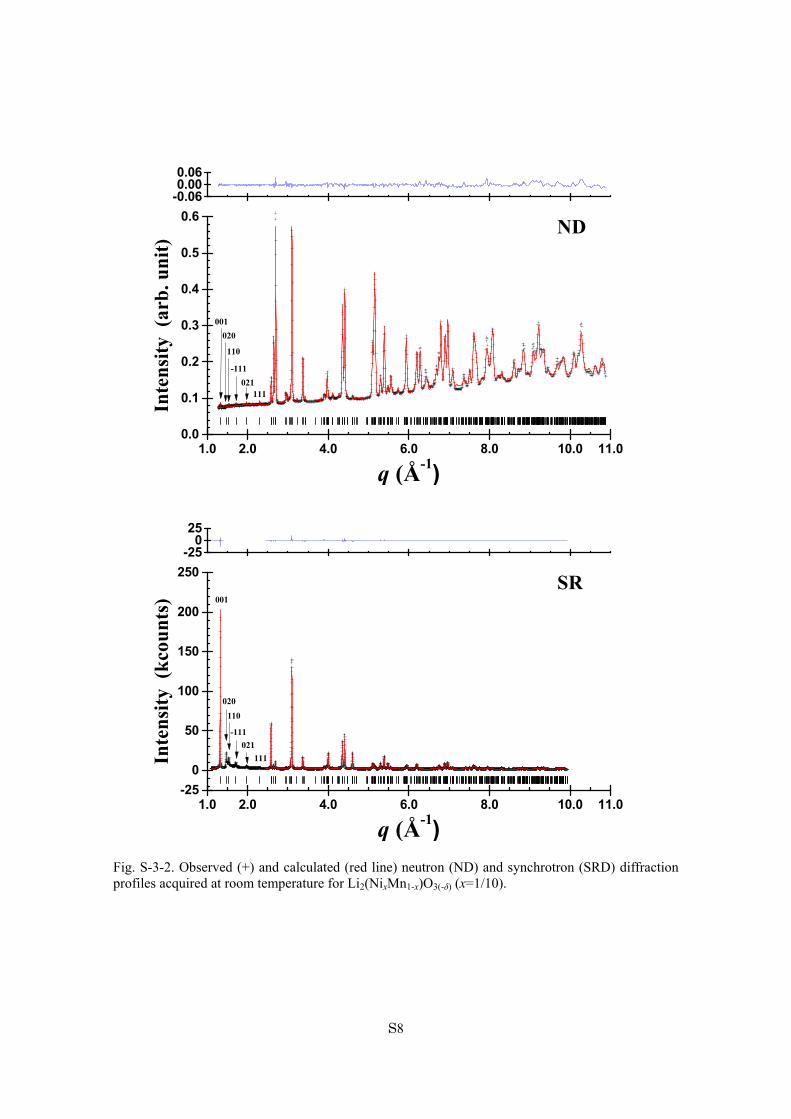
Fig. S-3-2. Observed (+) and calculated (red line) neutron (ND) and synchrotron (SRD) diffraction profiles acquired at room temperature for Li2(NixMn1-x)O3(-δ) (x=1/10).
S9
2.0 4.0 6.0 8.0 10.01.0 11.0
0.1
0.2
0.3
0.4
0.5
0.6
0.0
0.7
110
020
111021
-111
001
Inte
nsi
ty (
arb
. un
it)
q (Å-1)
ND
-0.050.000.05
2.0 4.0 6.0 8.0 10.01.0 11.0
0
50
100
150
200
-25
250
110
020
111
021-111
001
Inte
nsi
ty (
kco
un
ts)
q (Å-1)
SR
-25025
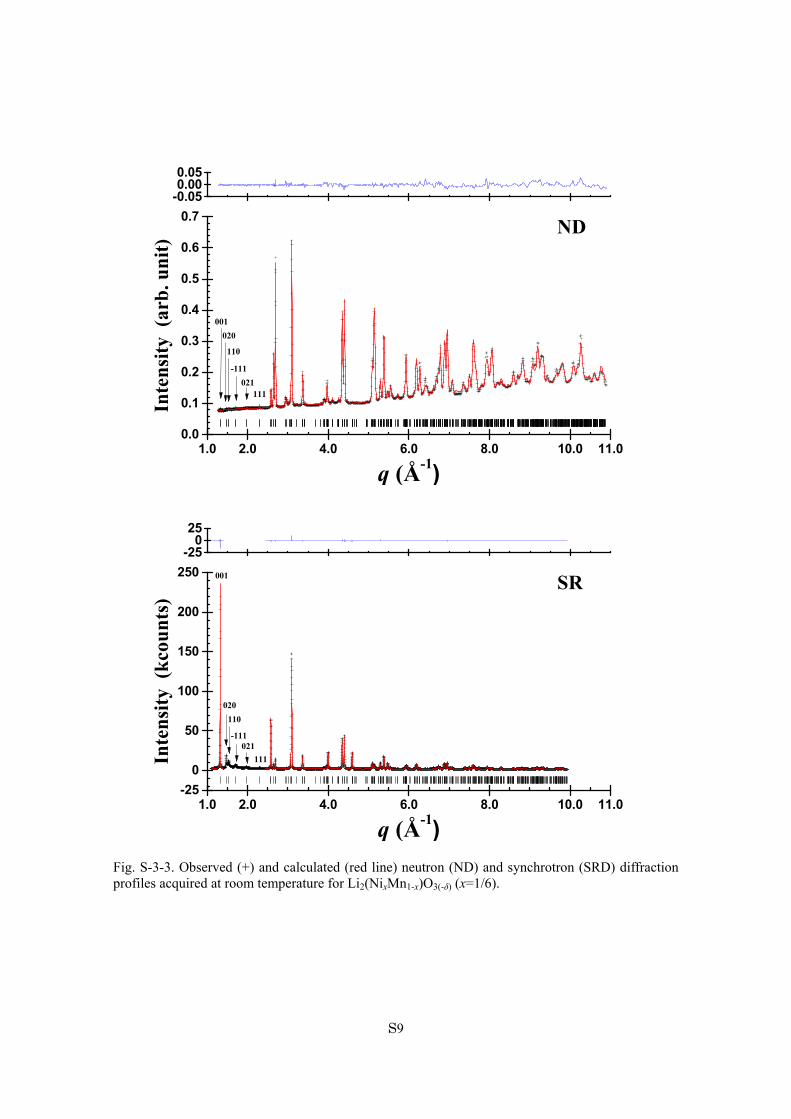
Fig. S-3-3. Observed (+) and calculated (red line) neutron (ND) and synchrotron (SRD) diffraction profiles acquired at room temperature for Li2(NixMn1-x)O3(-δ) (x=1/6).
S10
2.0 4.0 6.0 8.0 10.01.0 11.0
0.1
0.2
0.3
0.4
0.0
0.5
110
020
111021
-111
001
Inte
nsi
ty (
arb
. un
it)
q (Å-1)
ND
-0.050.000.05
2.0 4.0 6.0 8.0 10.01.0 11.0
0
50
100
150
200
250
300
-30
350
110
020
111
021-111
001
Inte
nsi
ty (
kco
un
ts)
q (Å-1)
SR
-35035
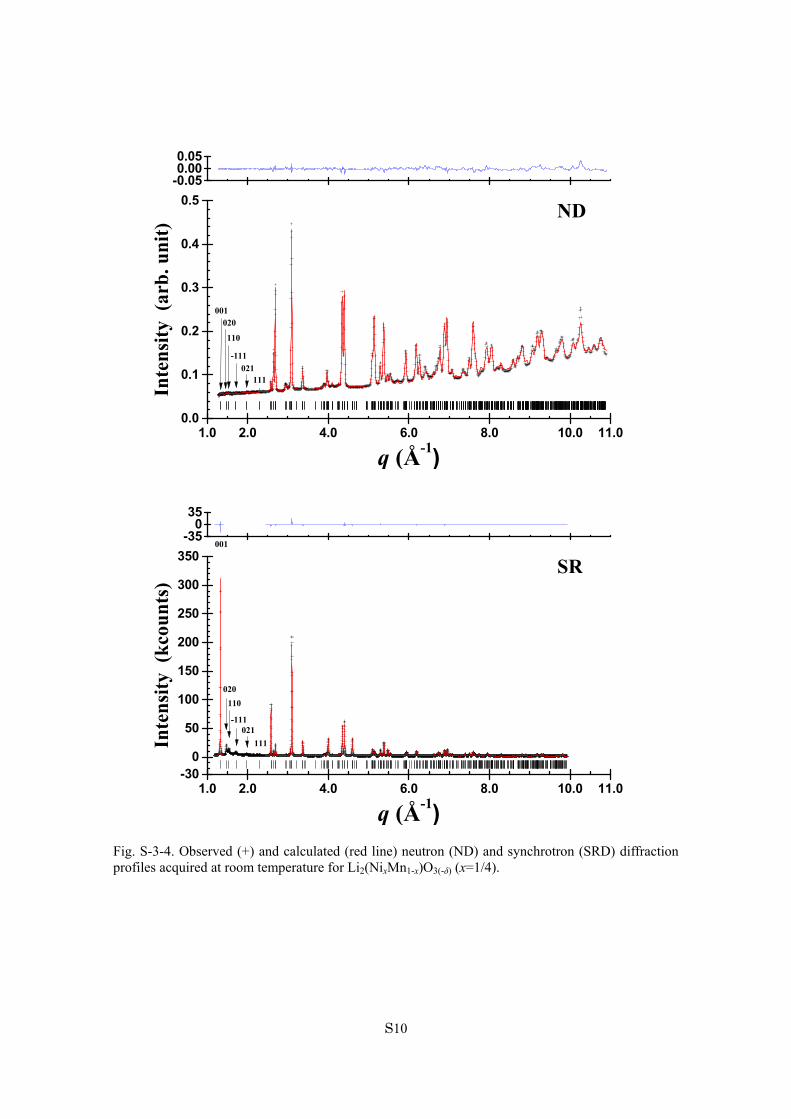
Fig. S-3-4. Observed (+) and calculated (red line) neutron (ND) and synchrotron (SRD) diffraction profiles acquired at room temperature for Li2(NixMn1-x)O3(-δ) (x=1/4).
S11
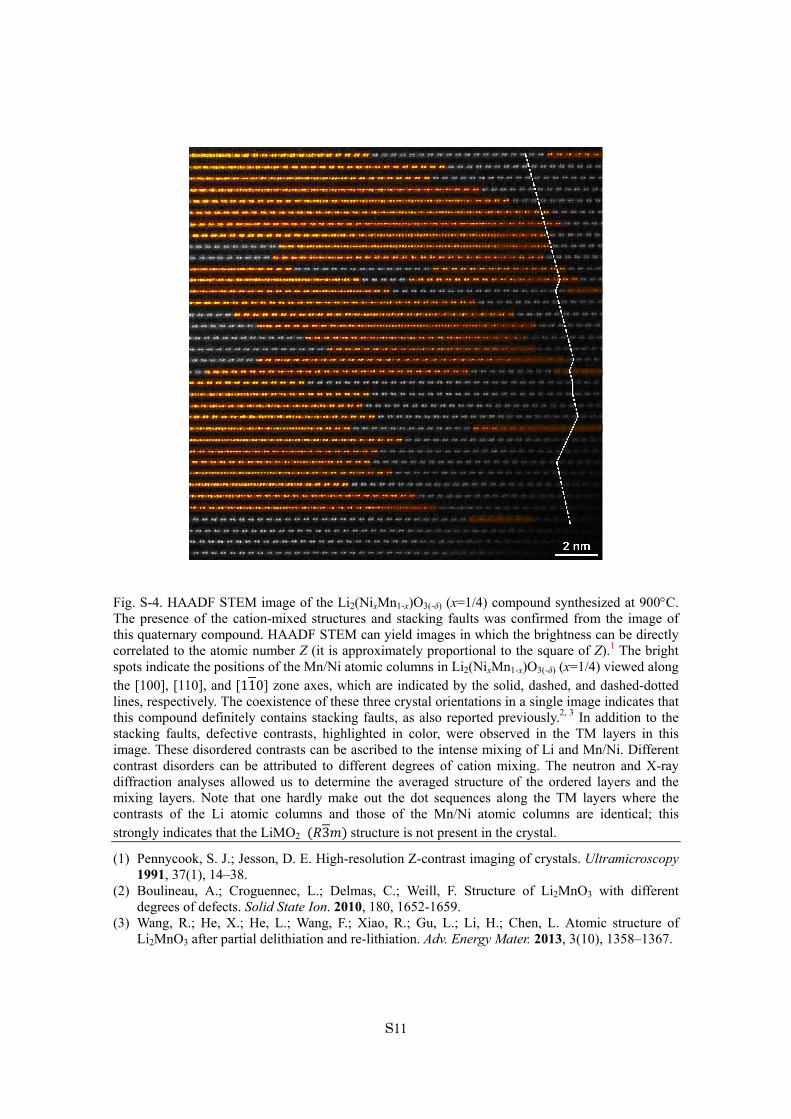
Fig. S-4. HAADF STEM image of the Li2(NixMn1-x)O3(-δ) (x=1/4) compound synthesized at 900C. The presence of the cation-mixed structures and stacking faults was confirmed from the image of this quaternary compound. HAADF STEM can yield images in which the brightness can be directly correlated to the atomic number Z (it is approximately proportional to the square of Z).1 The bright spots indicate the positions of the Mn/Ni atomic columns in Li2(NixMn1-x)O3(-δ) (x=1/4) viewed along the [100], [110], and [110] zone axes, which are indicated by the solid, dashed, and dashed-dotted lines, respectively. The coexistence of these three crystal orientations in a single image indicates that this compound definitely contains stacking faults, as also reported previously.2, 3 In addition to the stacking faults, defective contrasts, highlighted in color, were observed in the TM layers in this image. These disordered contrasts can be ascribed to the intense mixing of Li and Mn/Ni. Different contrast disorders can be attributed to different degrees of cation mixing. The neutron and X-ray diffraction analyses allowed us to determine the averaged structure of the ordered layers and the mixing layers. Note that one hardly make out the dot sequences along the TM layers where the contrasts of the Li atomic columns and those of the Mn/Ni atomic columns are identical; this strongly indicates that the LiMO2 3 structure is not present in the crystal.
(1) Pennycook, S. J.; Jesson, D. E. High-resolution Z-contrast imaging of crystals. Ultramicroscopy 1991, 37(1), 14–38.
(2) Boulineau, A.; Croguennec, L.; Delmas, C.; Weill, F. Structure of Li2MnO3 with different degrees of defects. Solid State Ion. 2010, 180, 1652-1659.
(3) Wang, R.; He, X.; He, L.; Wang, F.; Xiao, R.; Gu, L.; Li, H.; Chen, L. Atomic structure of Li2MnO3 after partial delithiation and re-lithiation. Adv. Energy Mater. 2013, 3(10), 1358–1367.

S12
Fig. S-5-1. Layer stacking structures of Li2MnO3 (Li: dark green, O: aqua, Mn: pink). Slabs, which consist of four atomic layers, can slip by the translation vector, [0, 0], [1/2, -1/6], or [1/6, -1/6], producing stacking faults in the crystal. The thin lines represent the unit cells while the red dots indicate the alignment points of the upper and lower slabs.
z = 1/2 z = 1/4 z = 0 z = -1/4
z = 3/2 z = 5/4 z = 1 z = 3/4
[1/6, -1/6][0, 0]
[1/2, -1/6]
S13
(a)
(b)
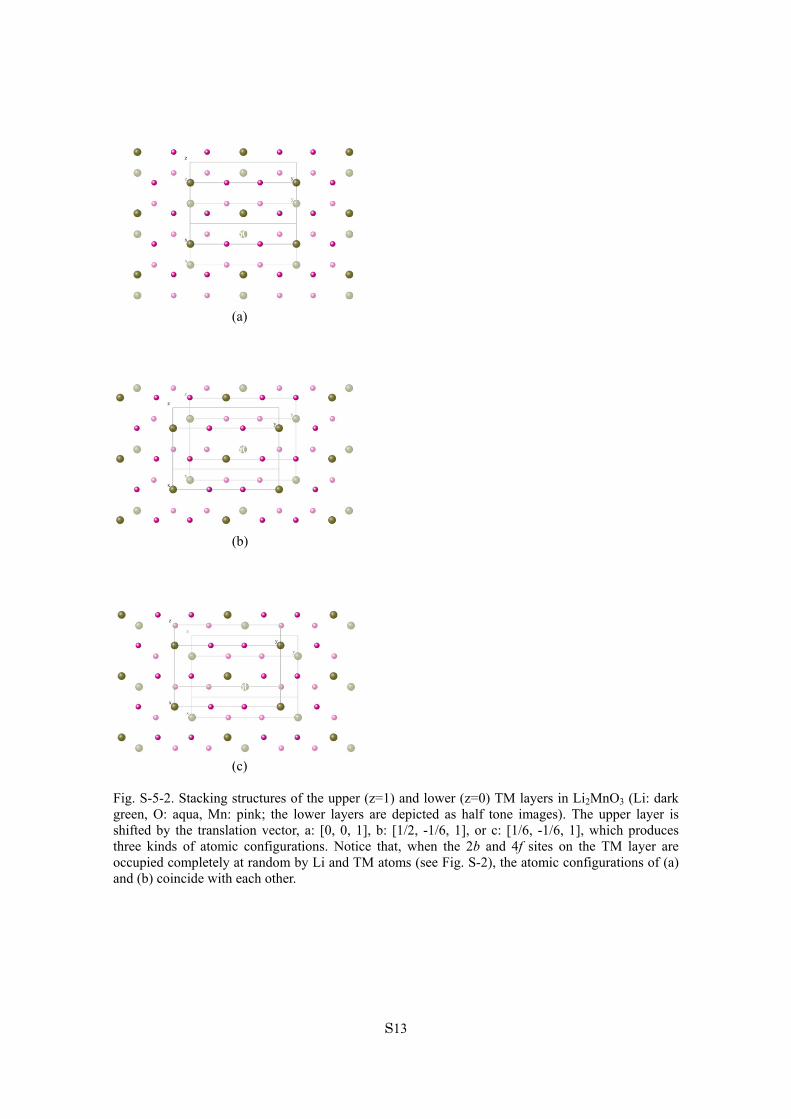
(c) Fig. S-5-2. Stacking structures of the upper (z=1) and lower (z=0) TM layers in Li2MnO3 (Li: dark green, O: aqua, Mn: pink; the lower layers are depicted as half tone images). The upper layer is shifted by the translation vector, a: [0, 0, 1], b: [1/2, -1/6, 1], or c: [1/6, -1/6, 1], which produces three kinds of atomic configurations. Notice that, when the 2b and 4f sites on the TM layer are occupied completely at random by Li and TM atoms (see Fig. S-2), the atomic configurations of (a) and (b) coincide with each other.
50
50
50 50
S14
2 3 4 5 6 71 8
10
100
1
800
111
021
110
-111
020
Inte
nsi
ty (
kcp
s)
q (Å-1)
001
-80080
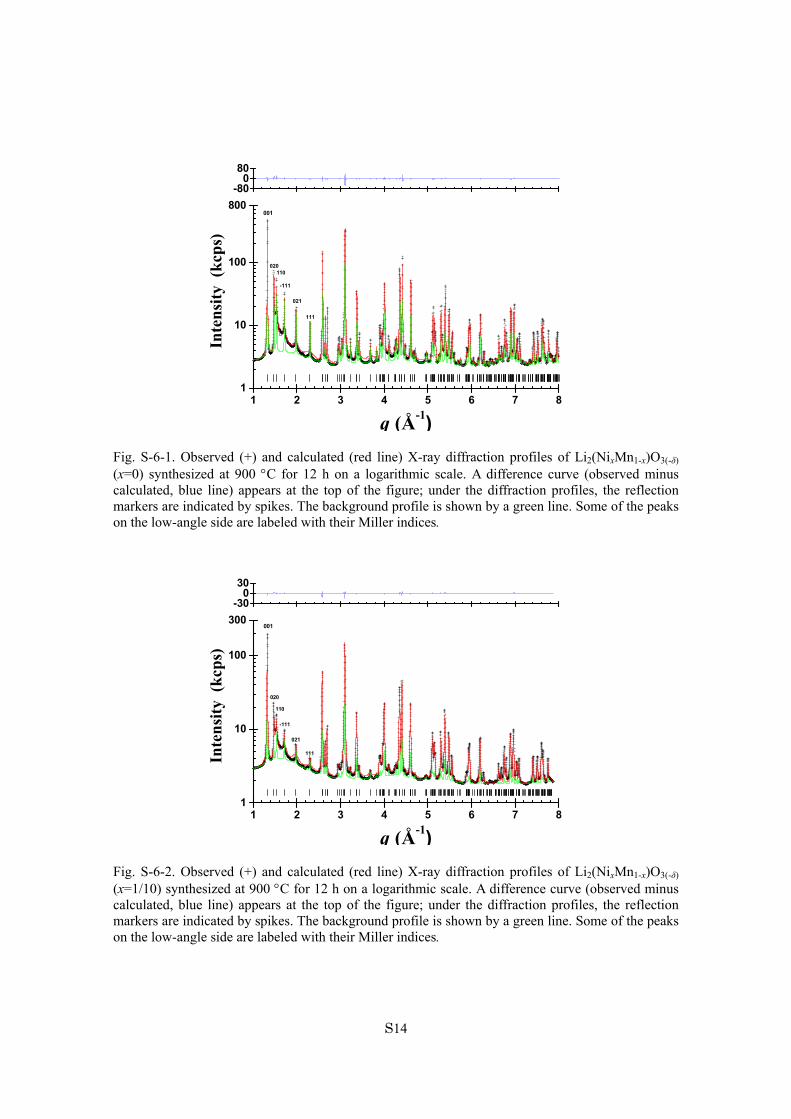
Fig. S-6-1. Observed (+) and calculated (red line) X-ray diffraction profiles of Li2(NixMn1-x)O3(-δ) (x=0) synthesized at 900 C for 12 h on a logarithmic scale. A difference curve (observed minus calculated, blue line) appears at the top of the figure; under the diffraction profiles, the reflection markers are indicated by spikes. The background profile is shown by a green line. Some of the peaks on the low-angle side are labeled with their Miller indices.
2 3 4 5 6 71 8
10
100
1
300
111
021
110
-111
020
Inte
nsi
ty (
kcp
s)
q (Å-1)
001
-30030
Fig. S-6-2. Observed (+) and calculated (red line) X-ray diffraction profiles of Li2(NixMn1-x)O3(-δ) (x=1/10) synthesized at 900 C for 12 h on a logarithmic scale. A difference curve (observed minus calculated, blue line) appears at the top of the figure; under the diffraction profiles, the reflection markers are indicated by spikes. The background profile is shown by a green line. Some of the peaks on the low-angle side are labeled with their Miller indices.
S15
2 3 4 5 6 71 8
10
100
1
400
111
021
110
-111
020
Inte
nsi
ty (
kcp
s)
q (Å-1)
001
-40040
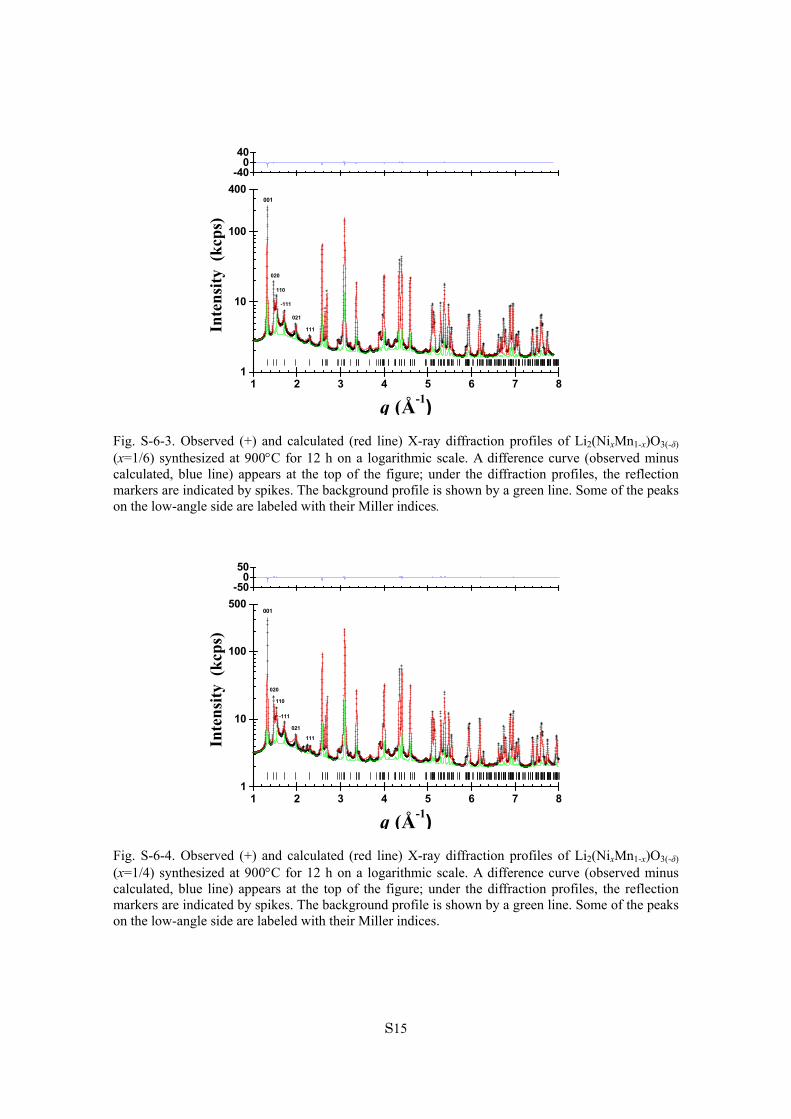
Fig. S-6-3. Observed (+) and calculated (red line) X-ray diffraction profiles of Li2(NixMn1-x)O3(-δ) (x=1/6) synthesized at 900C for 12 h on a logarithmic scale. A difference curve (observed minus calculated, blue line) appears at the top of the figure; under the diffraction profiles, the reflection markers are indicated by spikes. The background profile is shown by a green line. Some of the peaks on the low-angle side are labeled with their Miller indices.
2 3 4 5 6 71 8
10
100
1
500
111
021
110
-111
020
Inte
nsi
ty (
kcp
s)
q (Å-1)
001
-50050
Fig. S-6-4. Observed (+) and calculated (red line) X-ray diffraction profiles of Li2(NixMn1-x)O3(-δ) (x=1/4) synthesized at 900C for 12 h on a logarithmic scale. A difference curve (observed minus calculated, blue line) appears at the top of the figure; under the diffraction profiles, the reflection markers are indicated by spikes. The background profile is shown by a green line. Some of the peaks on the low-angle side are labeled with their Miller indices.
S16
1. additional explanation about replacement Mn with reactive transition metals
In Li2NiO3 in which non-reactive Mn4+ of Li2MnO3 is all replaced with Ni4+, its capacity is expected to be almost the same to Li2MnO3. As expected, the specific capacity of Li2NiO3 is no more than 240mAh/g1). While on the other hand, in Li2MoO3 in which Mn is all substituted with reactive Mo, its capacity is expected to be significantly increased compared with Li2MnO3. But actually, the specific capacity of Li2MoO3 is no more than 230mAh/g2). Furthermore, in Li2RuO3 in which Mn is all exchanged with reactive Ru, its capacity is expected to be considerably increased. But actually, the specific capacity is no more than 270mAh/g3). These mean that, even if non-active Mn is replaced by active transition metals, the resultant materials do not show much improvement in capacity. Assuming that only the two-electron reaction of Ni2+ ↔ Ni4+ contributes to increase of the specific capacity, it corresponds to increase of 125mA/g, for example, for Li2(Mn0.75Ni0.25)O3; however, as can be seen in Fig. 1, the capacity increases more than expected. This difference is deemed to be provided by the formation of Li percolation paths as shown in the main text.
(1) http://www.kri-inc.jp/ts/dept/pdf/nano-h_4-4.pdf (2) 3rd Euro-Mediterranean Conference on Materials and Renewable Energies EMCMRE-3,
Marrakech-Morocco, November 2-6, 2015 (3) Yao, Y.; Bie, X.; Wang, C.; Wei, Y.; Chen, G.; Du, F. J. Mater. Chem. A, 2015, 3 , 18273–18278
S17
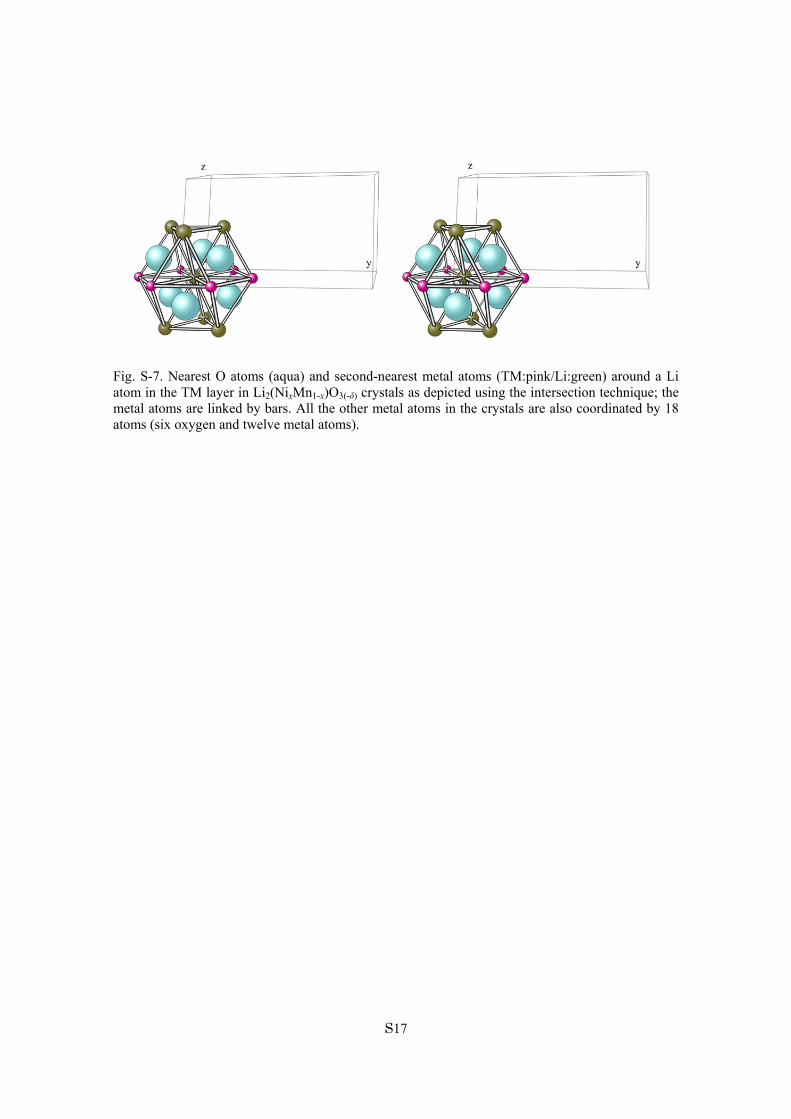
Fig. S-7. Nearest O atoms (aqua) and second-nearest metal atoms (TM:pink/Li:green) around a Li atom in the TM layer in Li2(NixMn1-x)O3(-δ) crystals as depicted using the intersection technique; the metal atoms are linked by bars. All the other metal atoms in the crystals are also coordinated by 18 atoms (six oxygen and twelve metal atoms).
S18
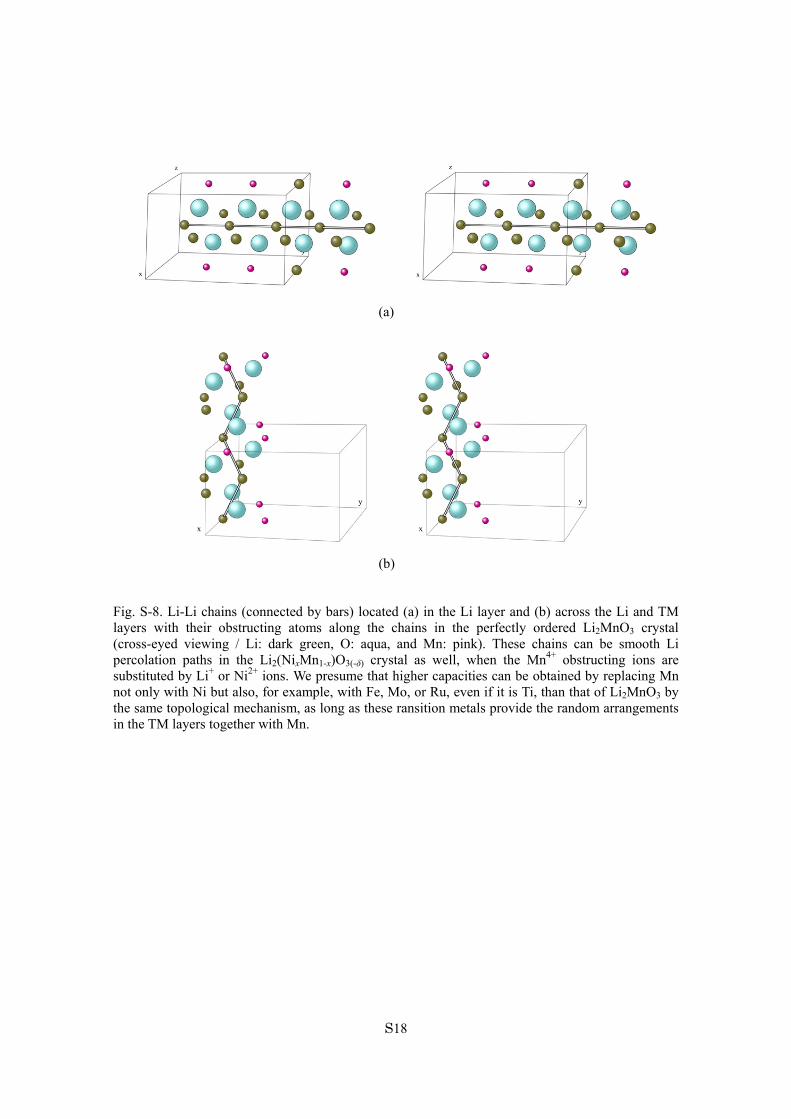
(a)
(b) Fig. S-8. Li-Li chains (connected by bars) located (a) in the Li layer and (b) across the Li and TM layers with their obstructing atoms along the chains in the perfectly ordered Li2MnO3 crystal (cross-eyed viewing / Li: dark green, O: aqua, and Mn: pink). These chains can be smooth Li percolation paths in the Li2(NixMn1-x)O3(-δ) crystal as well, when the Mn4+ obstructing ions are substituted by Li+ or Ni2+ ions. We presume that higher capacities can be obtained by replacing Mn not only with Ni but also, for example, with Fe, Mo, or Ru, even if it is Ti, than that of Li2MnO3 by the same topological mechanism, as long as these ransition metals provide the random arrangements in the TM layers together with Mn.
S19
2. Brief comments on the structural evolution and charge compensation during the charge-discharge processes
Assuming that the partially delithiated Li2MnO3, Li2–y(NixMn1–x)O3, keeps the C2/m monoclinic structure with delithiation, Li atoms in the lattice are simply substituted by vacancies. This replacement is expected to facilitate the Li diffusion in the lattice, because the vacancy decreases the Coulomb potential on the percolation paths compared with Li+. It is reported that the spinel structures are generated in the charging process of Li2MnO3,
1 which are presumed to decrease the capacity. Therefore, it is very likely that such unnecessary structures are generated also in Li2–
y(NixMn1–x)O3. Suppressing the spinel formation and stabilizing the original monoclinic structure will be an essential issue to obtain higher capacities and cyclabilities.
Very recently, we reported that the Ni and O ions contribute to the charge compensation for the delithiation from a Li2–y(NixMn1–x)O3 electrode sample (x = 1/4).2 By introducing Ni ions into Li2MnO3 structure, the additional Ni redox reactions can be available, which would contribute to the observed capacities for Li2(NixMn1–x)O3(–δ). We stress that in addition to these redox reaction mechanisms, the disordered arrangement within the TM layer, which fosters the formation of longer and smoother Li percolation path, contributes to the better electrochemical performances.
(1) Phillips, P. J.; Bareno, J.; Li, Y.; Abraham, D. P.; Klie, R. F. On the Localized Nature of the Structural Transformations of Li2MnO3 Following Electrochemical Cycling. Adv. Energy Mater. 2015, 5, 1501252 1-12.
(2) Shimoda, K.; Minato, T.; Nakanishi, K.; Komatsu, H.; Matsunaga, T.; Tanida, H.; Arai, H.; Ukyo, Y.; Uchimoto, Y.; Ogumi, Z. Oxidation behaviour of lattice oxygen in Li-rich manganese-based layered oxide studied by hard X-ray photoelectron spectroscopy. J. Mater. Chem. A 2016, 4, 5909-5916.


![Effects of state of charge on elastic properties of 3D structural ... … · Dionisi et al. [20]. In contrast to ordinary batteries, the active materials in the structural battery](https://img.pdfslide.us/doc/110x75/613069111ecc515869441450/effects-of-state-of-charge-on-elastic-properties-of-3d-structural-dionisi-et.jpg)