Embed Size (px)
Citation preview

Report No SSRP0903
November 2008
STRUCTURAL SYSTEMS
RESEARCH PROJECT
STRUCTURAL RESPONSE OF NEAR SURFACE MOUNTED CFRP STRENGTHENED REINFORCED CONCRETE BRIDGE DECK OVERHANG
by
ANNA B PRIDMORE
VISTASP M KARBHARI
Final Report Submitted to the California Department of Transportation Under Contract No 59A0630
Department of Structural Engineering University of California San Diego La Jolla California 92093-0085 amp University of Alabama in Huntsville Huntsville AL 35899
University of California San Diego
Department of Structural Engineering
Structural Systems Research Project
Report No SSRP0903
Structural Response of Near Surface Mounted CFRP Strengthened Reinforced Concrete Bridge Deck Overhang
by
Anna B Pridmore Graduate Student Researcher
Vistasp M Karbhari
Professor of Structural Engineering
Final Report submitted to the California Department of Transportation Under Contract No 59A0630
Department of Structural Engineering
University of California San Diego
La Jolla California 92093-0085
amp University of Alabama in Huntsville
Huntsville AL 35899
November 2008
Technical Report Documentation Page 1 Report No 2 Government Accession No 3 Recipientrsquos Catalog No
4 Title and Subtitle
Structural Response of Near Surface Mounted CFRP Strengthened Reinforced Concrete Bridge Deck Overlay
5 Report Date
November 2008
6 Performing Organization Code
7 Author(s)
Anna Pridmore and Vistasp M Karbhari 8 Performing Organization Report No
UCSD SSRP- 0903
9 Performing Organization Name and Address
University of California San Diego La Jolla California 92093-0085
amp University of Alabama in Huntsville Huntsville Al 35899
10 Work Unit No (TRAIS)
11 Contract or Grant No
59A0630
12 Sponsoring Agency Name and Address
California Department of Transportation Engineering Service Center 1801 30th St West Building MS-9 Sacramento California 95807
13 Type of Report and Period Covered
Final Report
14 Sponsoring Agency Code
15 Supplementary Notes
Prepared in cooperation with the State of California Department of Transportation
16 Abstract
This report presents the results from an experimental investigation which explores the change in structural response due to the addition of near-surface-mounted (NSM) carbon fiber reinforced polymer (CFRP) reinforcement for increasing the capacity of the edge region of a reinforced concrete bridge deck The motivation for rehabilitating bridge deck overhangs using NSM reinforcement is to increase the load carrying capacity of the region so that the overhang can accommodate the larger than designed for loads caused by the installation of sound barrier walls onto the edges of the bridge deck The experimental testing of an as-built reinforced concrete specimen without FRP was used as the baseline test to evaluate the effectiveness of the NSM CFRP strengthening scheme Details regarding the capacity calculations experimental setup testing protocol and experimental results for the as-built specimen and FRP rehabilitated specimen are discussed in this report This report also presents the NSM CFRP strengthening design options examined for achieving the desired capacity increase and evaluates the change in structural response of the rehabilitated system as compared to the as-built test specimen
17 Key Words
Composite Strengthening Near Surface mounted Reinforcement Overhang Sound Walls
18 Distribution Statement
No restrictions
19 Security Classification (of this report)
Unclassified
20 Security Classification (of this page)
Unclassified
21 No of Pages
174 22 Price
Form DOT F 17007 (8-72) Reproduction of completed page authorized
DISCLAIMER
The contents of this report reflect the views of the authors who are responsible for the facts and
accuracy of the data presented herein The contents do not necessarily reflect the official views
or policies of the State of California or the Federal Highway Administration This report does
not constitute a standard specification or regulation
ii
TABLE OF CONTENTS
Abstract iv 1 Introduction 1 11 Project-Specific Need for FRP Rehabilitation 1 12 Methods of FRP Rehabilitation 2 13 Near Surface Mounted FRP Reinforcement 3 131 Variations 4 132 Prior Use 5 133 Available Codes and Specifications 6 2 Goals and Objectives 7 3 Overall Experimental Setup 8 31 Specimen Geometry and Construction 8 32 Loading Setup 10 4 As-Built Test 12 41 Demand Calculations 12 42 Capacity Calculations 13 43 Instrumentation 15 44 Loading Protocol 16 45 Experimental Results 18 46 Comparison with Theory 26 5 Rehabilitated Test 27 51 Calculations for Potential CFRP NSM Strengthening Schemes 27 52 Options for Rehabilitation 29 53 Rehabilitation Construction 35 54 Capacity Calculations 38 55 Instrumentation 39 56 Loading Protocol 42 57 Experimental Results 43 58 Comparison with Theory 54 59 Comparison with As-Built 55 6 Summary of Results and Recommendations for Future Research 60 7 References 62
iii
ABSTRACT
This report presents the results from an experimental investigation which explores the change in
structural response due to the addition of near-surface-mounted (NSM) carbon fiber reinforced
polymer (CFRP) reinforcement for increasing the capacity of the edge region of a reinforced
concrete bridge deck The motivation for rehabilitating bridge deck overhangs using NSM
reinforcement is to increase the load carrying capacity of the region so that the overhang can
accommodate larger than designed for loads caused by the installation of sound barrier walls
onto the edges of the bridge deck The experimental testing of an as-built reinforced concrete
specimen without FRP was used as the baseline test to evaluate the effectiveness of the NSM
CFRP strengthening scheme Details regarding the capacity calculations experimental setup
testing protocol and experimental results for the as-built specimen and FRP rehabilitated
specimen are discussed in this report This report also presents the NSM CFRP strengthening
design options examined for achieving the desired capacity increase and evaluates the change in
structural response of the rehabilitated system as compared to the as-built test specimen
iv
1 Introduction
11 Project-Specific Need for FRP Rehabilitation
In order to improve the quality of life for residents who live close to major highways Caltrans is
installing sound barriers along many roadways in California When these sound barrier walls are
installed onto bridges they are placed on the edge of the deck slab overhang on top of traffic
barriers The sound barrier walls are often made of concrete or masonry which add additional
loads to the edges of the bridges in excess of the original design loads The current solution
employed is to remove the entire edge region of the bridge deck and rebuild it with additional
reinforcement to accommodate the increased loading However this process necessitates road
closures and is time consuming and costly An alternative to replacement of the bridge deck slab
overhang is strengthening of the overhang through the use of fiber reinforced polymers (FRPs)
FRPs have been shown to be very beneficial for a variety of civil applications including
strengthening of bridge decks because of their high strength to weight ratio tailor able properties
and potential for enhanced durability and corrosion resistance over traditional structural
materials The ease of installation of FRP rehabilitation systems as compared to traditional
strengthening materials and methods allows for reduced highway closure time and disruption of
traffic flow
The current research is a preliminary experimental investigation to explore the application of
composites for increasing the capacity of the overhang region of the bridge deck to accommodate
the larger loads caused by the addition of the sound barrier walls Under the scope of the project
the aim was to test a single method of rehabilitation in order to provide preliminary validation of
the technique The overall project is divided into two phases with this being the first phase The
second phase includes a detailed literature review and state-of-the-art report in addition to a
focused building-block based approach to the assessment of the use of near surface mounted
reinforcement aimed at the development of a design guideline for Caltrans It is emphasized that
the current research was based on the use of an existing specimen and hence the test does not
directly mimic some cases that may be under consideration The goal as mentioned earlier was
to show viability rather than to provide a direct set of design guidelines However the research
1
was based on submission of detailed test plans and alternatives to Caltrans along with
recommendations for the rehabilitation Caltrans approval was obtained prior to initiation of the
test program and was again obtained for the down-selected rehabilitation option
12 Methods of FRP Rehabilitation
FRP rehabilitation can serve to efficiently strengthen repair or seismically retrofit a wide variety
of existing civil structures The use of FRP reinforcement which is bonded to the tension side of
concrete beams slabs or girders can provide improved flexural strength whereas use of the FRP
reinforcement bonded to the sides of girders and beams can provide additional shear strength for
the structure FRP reinforcement may also be used to wrap columns in order to provide
confinement for the concrete and additional ductility for the column during a seismic event
Figure 1 shows a variety of rehabilitation methods applied to columns which involve the use of
FRP reinforcement
Figure1 Methods of FRP rehabilitation for columns [1]
2
The two main categories for FRP rehabilitation techniques are externally bonded FRP systems
and near-surface-mounted FRP systems Externally bonded FRP systems include but are not
limited to wet layup processes bonding of pre-cured FRP profiles to a structure resin infusion of
dry fabric after installation of the FRP and use of prepreg sheets [2] An application of
externally bonded prefabricated strips and externally bonded on site impregnated fabric
laminates for the rehabilitation of bridge deck slabs are shown in Figures 2(a) and (b)
respectively
a) Pultruded strips b) Wet layup fabric laminates
Figure 2 Rehabilitation of bridge deck slabs using externally bonded FRP reinforcement [3]
13 Near Surface Mounted FRP Reinforcement
Near surface mounted FRP systems are a recent development although the general use of the
strategy can be traced to the use of steel rebar in surface cut grooves in Europe in the 1950s
This approach involves the installation of the FRP reinforcement into precut grooves in the cover
region of the concrete substrate to be strengthened The reinforcement is thus placed inside the
concrete substrate and covered with other material (cementitious or a polymer adhesive) rather
than being adhesively bonded to the surface The use of near-surface-mounted (NSM) FRP
reinforcement for rehabilitation has a number of advantages over the more common externally
bonded FRP reinforcement These advantages include the potential for reduced site installation
work since surface preparation beyond the creation of grooves for the FRP is no longer required
the reduced likelihood of debonding failures from the concrete surface due to significantly
improved anchoring ability and improved protection from mechanical damage provided by
3
recess of the NSM reinforcement into the concrete surface [45] The use of near surface
mounted FRP rehabilitation techniques provide particular advantages for flexural strengthening
of the negative moment region of reinforced concrete slabs and decks In these applications the
top surface of the deck may be subject to harsh environmental and use conditions which would
require the FRP reinforcement to be surrounded by a protective cover This would more difficult
to achieve using externally bonded strips whereas the near surface mounted reinforcement is
already embedded and therefore not exposed to these influences
131 Variations
FRP reinforcement used for near-surface-mounted applications can be manufactured in a wide
variety of shapes including round oval square and rectangular bars as well as strips with
varying width-to-thickness ratios Figure 3 shows a variety of different FRP bars and strips that
are commonly available for NSM applications
Figure 3 A selection of types of FRP bars and strips available for NSM applications [4]
Carbon fiber reinforced polymer composite NSM reinforcement is the primary type of FRP
material used to rehabilitate concrete structures because of the higher tensile strength and tensile
modulus of carbon over glass or aramid as well as the inertness of the fiber which reduces the
effect of concrete based alkalinity on the FRP itself These superior tensile properties allow for a
smaller cross-sectional area CFRP bar to be used over a GFRP or AFRP bar with the same
tensile capacity which has additional constructability benefits by reducing the risk of interfering
with the internal steel reinforcement
4
It should be noted that while the initial use of NSM was with circular bars the transition to
rectangular strips was predicated on the desire to attain higher strains in the reinforcing prior to
debonding It has been proven that all other factors being equal NSM strips have higher average
bond strengths than circular bars because of the development of a three-dimensional distribution
of bond stresses in the surrounding concrete Further in the case of round bars forces due to
radial stresses can induce tensile forces that can force the bar out of the groove resulting in
splitting and bond failure It should also be noted that since strips have significantly larger ratios
of perimeter to cross-sectional area than circular or rectangular rods bond stresses are lower The
primary failure modes for NSM include concrete crushing FRP rupture adhesive splitting
concrete splitting combined splitting and separation of the concrete cover region These are
exacerbated by round and rectangular rods as compared to flat strips due to the greater depth of
embedment and larger cross-sectional area as compared to surface area It should also be
emphasized that while the technique is extremely simple the use of square bars and rods requires
use of larger and deeper grooves than flat strips placed horizontally in order to achieve the same
efficiency A significantly more in-depth review of differences and modes of failure will be
reported in the Phase-2 report
132 Prior Use
While NSM FRP has been used successfully for flexural strengthening of concrete beams [678]
there is still limited work on the use of NSM FRP applications to increase the flexural capacity
of concrete slabs Parretti and Nanni discuss a design example of flexural strengthening a one
way RC slab in the negative moment region using NSM CRFP strips [9] and Bonaldo et al have
researched the structural performance of a reinforced concrete slab flexurally strengthened with
FRP and a steel fiber reinforced concrete overlay [10] however despite increasing field use
there is very little detailed literature relating to experimental work on the strengthening of the
negative moment region of a reinforced concrete slab
5
133 Available Codes and Specifications
The Concrete Society Technical Report No 55 discusses a variety of applications for
strengthening with NSM reinforcement (TR 55 Section 64) and recommends that for aspects
other than FRP curtailment design of flexural strengthening with NSM reinforcement should be
done using the design methods described for surface mounted reinforcement with the allowance
made to adjust the location of the reinforcement from the surface of the section to within the
section such that the strains in the FRP are lowered appropriately [11] Approaches for
anchorage design are detailed and design suggestions for reducing the likelihood of different
common modes of failure for NSMR are described
ACI 44002 makes no specific mention of strengthening using NSMR however contains
extensive information pertaining to surface mounted reinforcement Sections pertaining to near
surface mounted reinforcement are being added to the most recent edition of the ACI 440 code
however these sections are still in draft form and are not currently available [12]
The Canadian Highway Bridge Design Code includes strengthening with NSMR as part of its
discussion on flexural and axial rehabilitation (Section 16112) and gives resistance factors
pultruded carbon glass and aramid FRP NSMR (Section 1653) [13] This code determines
NSMR anchorage lengths for flexure using the same calculation provided for internal FRP bars
(Sections 1611244 and 16841) and provides only a general description of failure modes for
FRP strengthened systems without mention of NSMR specific modes of failure
6
2 GOALS AND OBJECTIVES
The goals of the experimental investigations presented in this report are to examine the changes
in vertical load carrying capacity and structural response of a steel reinforced concrete box girder
bridge deck overhang which has been rehabilitated with NSM reinforcement The desired
increase in capacity which will allow the overhang to safely accommodate the increased dead
load from the addition of the soundwalls and the feasible design options for achieving this
increased capacity objective must first be determined Once the chosen CFRP NSM
reinforcement strengthening scheme has been implemented and tested the objectives of this
project are to compare the rehabilitated specimenrsquos experimental results to theoretical predictions
and to the experimental results from the testing of the as-built reinforced concrete specimen
without FRP
7
3 OVERALL EXPERIMENTAL SETUP
31 Specimen Geometry and Construction
The overall test configuration used for this experimental work consists of a reinforced concrete
two-cell box girder with a center-to-center span of 1830 mm (6 ft) between each of the girders
and a length of 3660 mm (12 ft) as shown in Figure 4 The specimen deck is 178 mm (7 in)
thick and the distance from the stem wall to the edge of the overhang is 483 mm (19 in)
Figure 4 Overall dimensions of test specimen
610 mm 1829 mm 1829 mm 610 mm 4877 mm
252 mm 1549 mm 305 mm 1549 mm 254 mm
3912 mm
152
1346
mm
17
8
1676
mm
All steel reinforcement used within the test specimen was designed in accordance with the
AASHTO-LRFD specifications [14] and the construction practices employed mimicked field
techniques The steel reinforcement in the deck slab consisted of a top and bottom layer of 16
(5) rebar as shown in Figure 5 with the transverse rebar spaced at 203 mm (8 in) on center and
variable spacing for the longitudinal rebar in order to accommodate the location of the girder
stems The rebar used had an experimentally determined yield strength of 430 MPa (62 ksi) and
an ultimate strength of 703 MPa (102 ksi) A clear cover of 25 mm (1 in) was used throughout
the specimen The specimen deck slab and the upper portion of the stems were cast in place
monolithically using concrete with an average aggregate size of 127 mm (05 in) The concrete
strength at 28 days was 34 MPa (50 ksi)
8
4829 mm 152 152 159 229 152 (5) at 254 mm 152 279 149 (5) at 254 mm 152 229 159 152 152
178
(5) a
t 203
mm
36
58 m
m
162
Figure 5 Reinforcement layout for deck slab
Following construction of the described test specimen the specimen was used for a separate test
series [15] after completion of which two 203 mm (8 in) deep cuts located 305 mm (12 in) apart
from each other were created that ran longitudinally along the entire width of the specimen
(Figure 6)) It should be noted that previous testing was restricted to loading applied at the
central section of each cell and did not involve any load application or distress to the overhang
regions The two edge segments of the deck bounded by the longitudinal cuts were also removed
as shown in Figure 6 The purpose of the cuts was to allow for multiple independent tests on
sections of edge slab 168 m (5ft 6in) long
9
3658 mm 4877 mm
1676 mm
1676 mm
305 mm 483 mm
a) Original specimen b) Sectioned specimen as tested
Figure 6 Test Section
32 Loading Setup
Vertical loads were applied to the edge region of the deck slab using two hydraulic jacks spaced
183 m (6 feet) apart and mounted below the strong floor of the testing facility The load was
transferred through two 445 mm (1 frac34 in) diameter threaded rods to a steel loading beam
positioned 76 mm (3 in) on-center back from the end of the overhang section of the deck A 51
mm (2 in) thick and 152 mm (6 in) wide elastomeric bearing pad was placed between the steel
beam and the deck slab in order to reduce stress concentrations and provide more even loading of
the test specimen (Figure 7) The overall test setup is shown in Figure 8
Threaded rods Loading beam
Bearing pad Concrete deck
183 m
Figure 7 Test Setup Schematic
10
Figure 8 Overall Test Setup
11
4 AS-BUILT TEST
In order to establish a baseline for the effectiveness of the FRP repair the test specimen used was
isolated into separate sections as described in Section 31 and a portion of the concrete box girder
specimen was tested as-built without FRP rehabilitation The following section of the report
discusses the calculations experimental setup loading test observations and results from the
testing of this section of as-built reinforced concrete bridge deck
41 Demand Calculations
The combined dead weight of a typical sound wall and
traffic barrier used for bridges in California was
calculated from the Caltransrsquo concrete masonry
soundwall design on bridges as shown in Figure 9 [16]
Using this design with normal weight grout and
concrete the gravity load per unit length for the
soundwall and traffic barrier were determined to be
135 kNm (092 kipft) and 81 kNm (056 kipft)
respectively for a combined weight per unit length of
216 kNm (15 kipft) The tested section of overhang
was 1600 mm (5 ft 6 in) long therefore the total load
applied to the specimen from the soundwall and traffic
barrier is 362 kN (825 kip)
As mentioned previously the load was applied to the
structure by two hydraulic jacks such that each jack
applied half the total loading to the overhang In
equation form this can be expressed as
weightwall Figure 9 Standard Caltrans masonry weightwall _ per _ jack = (2)2 soundwall design [16]
12
where weightwall is the total load applied to the overhang due to the combined weight of the
soundwall and the traffic barrier This yields a load per hydraulic jack of approximately 18 kN
(4 kip) to represent the equivalent sound wall load which is corresponds to a distributed load of
107 kNm (074 kipft)
42 Capacity Calculations
The shear capacity of the slab was computed according to ACI 318-08 Section 113 using both
the general and the more detailed calculations [17] Note that the California Bridge Design
Specifications for reinforced concrete structures used by Caltrans were patterned after and are in
conformity with ACI Standard 318 [18] The general calculation for shear capacity of the slab
was given by the ACI 318-08 equation 11-3 as
Vc = 2 fc bwd (3)
where fc is the concrete compressive strength in ksi bw is the width of the concrete slab in
inches and d is the distance from the extreme compression fiber to the centroid of the tensile
reinforcement in inches This equation yields a total shear capacity of 236 kN (53 kip) for the
slab which translates to an applied force of 118 kN (265 kip) per hydraulic jack
The more detailed shear capacity equation is given by ACI 318-08 equation 11-5 as
Vud ⎞Vc = ⎛⎜⎜19 fc + 2500ρw ⎟⎟bwd (4)⎝ Mu ⎠
where fc is the concrete compressive strength in ksi ρw is the reinforcement ratio of the slab in
the direction perpendicular to traffic flow Vu and Mu are the factored moment and shear in the
slab at the edge of the stem respectively bw is the width of the concrete slab in inches and d is
the distance from the extreme compression fiber to the centroid of the tensile reinforcement in
inches This equation yields a slightly more conservative total shear capacity of 233 kN (524
kip) for the slab which translates to an applied force of 116 kN (262 kip) per hydraulic jack
The moment capacity of the slab was calculated as
13
⎛⎜⎝
a ⎞⎟⎠
M =As f d minus (5)n y 2
where As is the area of steel reinforcement in the direction perpendicular to traffic flow f y is the
yield strength of the slab steel d is the distance from the compression fiber to the centroid of the
tensile reinforcement and a is the depth of the equivalent rectangular compression stress block
This equation yields a total moment capacity of 970 kN-m (716 kip-ft)
The equivalent force applied through the loading beam can be obtained by dividing the moment
by the distance between the applied load and the edge of the stem also known as the moment
arm The equivalent applied force per hydraulic jack was 101 kN (23 kip) Since this capacity
value is lower than the computed shear capacity it is predicted that flexural damage will be
govern the performance of the slab
The moment capacity of the specimen was also found from the moment-curvature response
obtained by computer program (RESPONSE 2000) to be 1172 kN-m (856 kip-ft) This
corresponds to a maximum load per hydraulic jack of 122 kN (275 kip) [19] The moment
curvature response of the as-built reinforced concrete deck slab is shown below
140
120
100
0 50 100 150 200 250
Mom
ent
(kN
-m)
80
60
40
20
0
Curvature (10-3 radm)
Figure 10 Moment-curvature response for as-built specimen [19]
14
43 Instrumentation
The total instrumentation for this experiment consisted of 16 linear potentiometers and 2 load
cells One central row and two outer rows each with four linear potentiometers were used to
measure the vertical deflection of the deck slab The four linear potentiometers within each row
were positioned at the midspan of the adjacent cell above the adjacent stem in between the stem
and the loading beam and directly below the loading beam as shown in Figures 11(a) and (b)
Elastomeric Bearing Pad
Linear Potentiometers
1 2 3 4 A
B
M
76
CL
CL
2438 1524
610 279
152
838
1524
1676
1829
(a) Plan view of specimen (b) Section of deck slab with linear potentiometer details Figure 11 Position of linear potentiometers for measuring deflections of deck slab (Note not to
scale)
The deflection of the elastomeric bearing pad was measured using four linear potentiometers
with one linear potentiometer at each corner of the loading beam as shown in Figure 12
15
2438
152
CL
152
1524
1676
1829
CL
(a) Instrumentation detailing for bearing pad (b) Representative linear potentiometer
Figure 12 Position of linear potentiometers for measuring compression of bearing pad
44 Loading Protocol
In addition to the test setup described in Section 31 a 64 mm (2frac12 in) diameter hole was drilled
through the deck of the specimen at a distance 76 mm (3 in) by 76 mm (3 in) on center away
from the corner of the deck as shown in Figure 13 in order to accommodate the spacing
constraints imposed by the testing setup
Elastomeric Bearing Pad
Linear Potentiometers
1600 mm 76229 1829 mm
Threaded rods Loading beam
Bearing pad Concrete deck
Figure 13 Specific test setup schematic for as-built specimen
The overhang of the deck slab was tested by incrementally increasing the hydraulic pressure
supplied to the two hydraulic jacks which loaded the overhang through the test setup shown in
16
Figure 13 Adequate time was taken between loading levels to ensure that the hydraulic pressure
had stabilized and the pressure had equalized as much as possible between the two jacks The
load applied to the deck slab was monotonically increased following the loading sequence shown
in Table 1 The load was held briefly at each load level so that observations could be made at
each stage
Loading step
Load per hydraulic
jack
Equivalent uniform
distributed load Load level Notes
(kN) (kip) (kNm) (kipft) 1 24 5 300 21 --- Initial load 2 36 8 450 31 2x wall load ---3 48 11 600 41 --- ---4 60 13 750 51 --- ---5 72 16 900 62 4x wall load ---6 84 19 1050 72 --- 1st set of cracks observed 7 90 20 1125 77 5x wall load ---8 96 22 1200 82 --- ---9 102 23 1263 87 Calculated moment capacity 2nd set of cracks observed
10 114 26 1425 98 633x wall load Ultimate Capacity --- 116 26 1450 99 Calculated shear capacity ---
Table 1 Loading protocol for as-built test specimen
17
45 Experimental Results
The ultimate capacity of the slab was reached at an applied load of 114 kN (26 kips) per
hydraulic jack equivalent to a uniform distributed load of 1425 kNm (98 kipft) which is
633x the nominal wall load Note that the additional load carrying capacity of the deck slab
overhang beyond the dead load of a single sound barrier is necessary to resist lateral loading As
the loading of the edge of the slab was increased the top layer of transverse reinforcement above
the outer edge of the stem yielded followed by loss of aggregate interlock resulting in failure
The deflection of the middle of the slab directly under the loading beam when the system was
loaded to ultimate capacity was 636 mm (025 in)
As a baseline Figure 14 shows the specimen prior to testing The markings on the top of the
deck in this figure show preexisting hairline cracks in the deck
Figure 14 Deck slab prior to experimental testing
Cracking was first observed on the top side of the deck at the 84 kN (19 kip) load per jack and
were marked on the specimen in dark blue ink The thin cracking on the top of the deck surface
was discontinuous and approximately followed the two top longitudinal steel reinforcement bars
adjacent to the edge of the stem wall as shown in Figure 15
18
Figure 15 Initial craking of deck slab at 84kN (19 kip) per jack- top view of deck
Minor diagonal cracks along both the central and the exterior edge of the deck slab were also
observed at this load level as seen in Figure 16 Small diagonal cracks initiating on the top
surface of the deck observed at each end of the specimen are shown in Figures 16(a) and (b)
(a) Detail of central edge of slab (b) Detail of exterior edge of slab
Figure 16 Initial cracking of deck slab at 84kN (19 kip) per jack - side view of deck
Additional opening of small cracks was observed at the load level of 102 kN (23 kip) per jack
and these cracks were marked with red ink as shown in Figure 17 The cracks that followed the
two top longitudinal bars opened further and became continuous over the majority of the
specimen Additional cracks going across the width of the specimen formed on the top of the
slab as seen in Figure 17
19
Figure 17 Crack marking of deck slab at 102 kN (23 kip) per jack- top view of deck
When the load level of 114 kN (26 kip) per jack was reached a large diagonal crack opened and
quickly propagated which was clearly visible on the central edge of the slab as shown in Figure
18(a) This load level was determined to be the ultimate capacity of the overhang for resisting
vertical loads
(a) Central side of slab (b) Exterior side of slab
Figure 18 Cracking observed at ultimate capacity- side view of deck
The cracking progressed rapidly along the top surface of the deck as shown in Figure 19 and the
concrete adjacent to the loading beam settled several millimeters as seen in Figure 20
20
Figure 19 Cracking observed at ultimate capacity- top view deck
Figure 20 Detail of cracking at ultimate capacity in central section of deck near loading beam
After the loading of the specimen was completed all testing equipment and instrumentation was
fully removed and the observed cracks were marked in orange ink The orange diagonal cracks
on the top surface of the deck face toward the hole in the deck as shown in the upper left-hand
corner of Figure 21
Figure 21 Cracks observed on top of slab tested to ultimate capacity
The loose concrete was then removed in order to better observe the failure surfaces as shown in
Figure 22 and Figure 23 Increased damage was present on the central side of the deck as
compared to the exterior side
21
Figure 22 Top view of deck slab tested to ultimate capacity after removal of loose concrete
In Figure 23(b) the slight deformation in the rebar due to the yielding of the steel is observed It
is also noted that the concrete remained firmly attached beyond the longitudinal rebar
(a) Edge of deck prior to loose concrete removal (b) After removal
Figure 23 Detail of most severely damage section
The primary variables in defining the overall structural response of the bridge deck slab are the
load per hydraulic jack at which significant damage or failure occurred and the corresponding
center deflection of the slab directly below the actuator Additional instrumentation serves to
add supplementary data regarding the deformation of the specimen during testing As observed
in Figure 24 the deflection of the three linear potentiometers directly below the loading beam
indicate comparable deflections for lower loading levels and higher deflections with increasing
load at the central edge of the overhang which contains linear potentiometer B4
22
20
40
60
80
100
120
140 10
9
8
0 2 4 6 8 10 Deflection (mm)
A4
B4
M4
A4 B4M4
1st cracks observed
2nd cracks observed
Ultimate Capacity
Def
lect
ion
(mm
)
A4 M4 B4
A4
B4
M4
2nd cracks observed
1st cracks observed
Ultimate Capacity
Load
per
hyd
raul
ic ja
ck (k
N)
7
6
5
4
3
2
1
00 24 36 48 60 72 84 96 102 114
Load Level (kNhydraulic jack)
(a) Load versus deflection profiles (b) Comparison of linear potentiometers below loading beam
Figure 24 Comparisons of deflections at the edge of the deck slab overhang
At the load level of 84 kN (19 kips) per hydraulic jack where cracking in the deck was first
observed equivalent to a uniform distributed dead load of 105 kNm (72 kipft) or
approximately 5x the nominal wall load linear potentiometers A4 and M4 deflected similarly
while the linear potentiometer B4 exhibited a 13 mm (0051 in) or 37 greater deflection value
At the load level of 102 kN (23 kip) per hydraulic jack where the 2nd set of crack marking took
place equivalent to a uniform distributed dead load of 126 kNm (87 kipft) or nearly 6x the
nominal wall load the deflection at B4 was 20 mm (0078 in) or 39 greater than the other two
linear potentiometers The difference is due to levels of cracking The profiles along the center
of the specimen (Figure 26) and at both edges (Figures 25 and 27) shown below exhibit similar
deflection profiles and indicate that negligible vertical deformations occur in the deck beyond the
adjacent stem wall due to edge loading of the deck slab overhang
23
0 0 kN Location of linear potentiometers
24 kNDistance from edge (mm)
Def
lect
ion
(mm
)
2 60 kN
84 kN 4
102 kN
114 kN 6
8
76 279
610 1524
A1 A2 A3 A4AA
10
Figure 25 Deflection profile along the outer edge of specimen (Line A)
0 kNLocation of linear potentiometers 0 Distance from edge (mm) 24 kN
A1 A2 A3 A4 Linear Potentiometer Designation
M1 M2 M3 M4 Linear Potentiometer Designation
76 279
610 1524
M1 M2 M3 M4 MM
8
10
Figure 26 Deflection profile along center of specimen (Line M)
0
60 kN
84 kN
2
4 102 kN
6 114 kN
Def
lect
ion
(mm
)
B1 B2 B3 B4 Linear Potentiometer Designation
0 kN Location of linear potentiometers 24 kNDistance from edge (mm)
76 279
610 1524
B1 B2 B3 B4114 kNBB
10
Figure 27 Deflection profile along the central edge of specimen (Line B)
2 60 kN
4
84 kN
6 102 kN
8
Def
lect
ion
(mm
)
24
The deflection profile shown in Figure 28 shows comparable deflections along the overhang at a
distance midway to the adjacent stem wall Figure 29 illustrates comparable deflections directly
below the point of load application along the overhang for lower load levels with less symmetric
deformations observed for higher load levels after cracking was observed throughout the
specimen Through a comparison of these figures the results indicate a symmetric structural
response for load levels prior to the initial observation of cracking in the specimen and greater
deflections on one side at higher loading levels
0 0 kN 24 kN
Location of linear potentiometers Distance from edge (mm) 2 84 kN
60 kN
3 102 kN
838
152
1524
3
B3
M3
A3D
efle
ctio
n (m
m) 114 kN
4
6
8
10 B3 M3 A3
Linear Potentiometer Designation
Figure 28 Deflections midway along overhang (Line 3)
0 0 kN
24 kN Location of linear potentiometers
Distance from edge (mm) 2 60 kN 4
838
152
1524
4
B4
M4
A4
Def
lect
ion
(mm
)
84 kN 4 102 kN
114 kN 6
8
10 B4 M4 A4
Linear Potentiometer Designation
Figure 29 Deflections directly below loading beam (Line 4)
25
46 Comparison with Theory
The max moment found via moment curvature analysis of 1172 kN-m (856 kip-ft) was within
65 of the actual moment applied to the structure at the max loading of 114 kN (26 kip) per
hydraulic jack which corresponds to an applied moment of 1100 kN-m (810 kip-ft) The
moment capacity estimate of 970 kN-m (716 kip-ft) determined using the ACI 318-08
prescribed equation was off from the experimentally determined moment capacity by 118
26
5 REHABILITATED TEST
The following section presents NSM FRP strengthening design options for achieving the desired
capacity increase and describes the implementation testing and analysis of the chosen
rehabilitation design
51 Calculations for Potential CFRP NSM Strengthening Schemes
The increased moment demand on the test specimenrsquos deck slab due to the addition of the
soundwall is calculated and this value is used as the basis for determining the desired capacity
increase The corresponding total area of NSM CFRP needed to achieve the desired moment
capacity increase is calculated and design options for five different available CFRP
reinforcement products are presented
The dead weight of a typical sound wall used for bridges in California was calculated from the
Caltransrsquo concrete masonry soundwall design on bridges [20] Using this design with normal
weight concrete the gravity load per unit length for the soundwall was determined to be 135
kNm (092 kipft) Note that the weight of the traffic barrier is not included as part of the
increased moment demand calculation because it is assumed that the weight of the traffic barrier
was already accounted for in the original design of the deck slab overhang The tested section of
overhang was 1600 mm (5 ft 6 in) long therefore the total load applied to the specimen from the
soundwall is 226 kN (508 kip) The equivalent moment applied to the structure due to this dead
load can be obtained by multiplying the total load applied by the distance between the applied
load and the edge of the stem also known as the moment arm The equivalent additional
moment demand due to the soundwall was found to be 1091 kN-m (805 kip-ft)
A successful repair would strengthen the overhang to accommodate this increased moment
demand with a reasonable safety margin For initial calculation purposes a safety margin of 3
was deemed appropriate
M demand _ increase = M wall sdot3 (6)
27
This translates to an increase in moment demand of 327 kN-m (241 kipmiddotft) Therefore the
NSM flexural strengthening will be designed to increase the capacity of the overhang by at least
this value The experimentally determined moment capacity of the as-built reinforced concrete
deck slab overhang without FRP was found to be 110 kN-m (81 kip-ft) Therefore the new
moment capacity after strengthening should be at least 1427 kN-m (1051 kip-ft) which
corresponds to a minimum required moment capacity increase of 297 percent over the capacity
of the as-built specimen without FRP
The increased moment capacity due to FRP strengthening is equal to the sum of the contribution
from the tension steel (compression steel is ignored for this calculation) and the contribution
from the FRP reinforcement
⎛⎜⎝
⎞⎟⎠
⎛⎜⎝
⎞⎟⎠
a aψ f+
The definitions of the variables in the above equation are shown below
Steel properties
As = Total area of tension steel in slab overhang test specimen
fs = Experimentally determined yield strength of steel reinforcement
d = Distance to centroid of tensile steel reinforcement
a = Depth of concrete compression block assuming rectangular stress distribution
FRP properties
M As f d Af f dminus sdot sdot minus (8)= strengthened fe fn y 2 2_
Ψ f = Additional reduction factor recommended by ACI 4402R (Section 961) [12]
df = Distance from the compression fiber to the centroid of the FRP
ffe = Efmiddotεfe Effective stress in the FRP assuming elastic behavior
Ef = Experimentally determined modulus of elasticity of FRP
εfe = Effective strain in FRP reinforcement
By rearranging equation 8 an expression for the area of FRP reinforcement required in order to
achieve a specified moment capacity increased can be obtained
28
⎛ a ⎞M n _ strengthened minus As f y ⎜ d minus ⎟ ⎝ 2 ⎠Af _ required = (9)
⎛ a ⎞ψ sdot f sdot ⎜ d minus ⎟f fe f⎝ 2 ⎠
The required area of FRP obtained from this expression can be used to evaluate the feasibility of
different FRP strengthening options Note that the area of FRP required is the total area needed
for the specimen overhang and thus must be distributed along the width of the slab overhang
52 Options for Rehabilitation
The seven product options evaluated for this rehabilitation design were different sizes of SIKArsquos
pultruded carbon fiber CarboDur rods and strips as well as Hughes Brothersrsquo pultruded carbon
fiber Aslan 500 rectangular rods The physical characteristics of each option are provided in
Table 2 for reference
29
Product
Type
Source Product
Designation
Diameter Thickness Width Area Tensile
Modulus
mm in mm in mm in mm2 in2 GPa Msi
Rod SIKA frac14 in dia 635 025 127 005 155 225
Rod SIKA 38 in dia 953 0375 279 011 155 225
Strip SIKA S512 12 0047 50 197 60 0093 165 239
Strip SIKA S812 12 0047 80 315 96 0149 165 239
Strip SIKA S1012 12 0047 100 394 120 0186 165 239
Bar Hughes
Brothers
2 2 0079 16 063 312 0049 124 18
Bar Hughes
Brothers
3 45 0177 16 063 713 0110 124 18
Table 2 Physical properties of pultruded CFRP strengthening product options [212223]
30
The number of reinforcements required to attain the desired moment capacity increase was
calculated for each of the seven potential options using calculations described in the previous
section (Equation 9) and the results are shown in Table 3 For calculation of the effective stress
in the FRP εfe a strain of 065 was assumed based on design recommendations for FRP postshy
strengthening of reinforced concrete slabs [24 25] The tensile modulus for each of the different
FRP reinforcement options was obtained from manufacturer reported data Since the FRP
reinforcement type had not been selected yet the distance from the compression fiber to the
centroid of the FRP df was assumed to be the full depth of the slab Note that this assumption
will slightly overestimate the moment capacity contribution from the FRP because for NSMR
applications the reinforcement is located slightly below the surface of the structure Assuming
that the centroid of the FRP reinforcement is below the surface of the structure by a distance of
between 2 mm (0079 in) and 10 mm (0393 in) the calculations would have overestimated the
moment capacity increase due to the FRP reinforcement by between 1 and 6
Spacing requirements were also considered in the calculations performed for each FRP
strengthening option The maximum spacing recommendations provided by the manufacturer
[26] state that on center spacing should be limited to no more than the lesser of 02 times the
span length (L) or five times the slab thickness (h)
slim it = min(02L 5h) (10)
Note that the span for cantilever is taken as twice the distance to the support This spacing limit
yields a maximum recommended spacing of 203 mm (8 in) Table 3 below shows the number of
units needed as well as the theoretical moment capacity increase for each type of CFRP
reinforcement As observed in the Table 3 spacing limitations govern rather than actual strength
requirement limitations Since all seven of the design options are able to achieve the increased
capacity requirements other aspects such as cost and constructability are now used to select the
FRP reinforcement system
One notable difference between the installation of CFRP strips as opposed to rods is the required
depth of grooves cut into the deck The 64 mm (14 in) diameter rods require 127 mm (12 in)
31
deep slots and the 95 mm (38 in) rods require 159 mm (58 in) deep rods while the strips only
require a 4 mm (016 in) deep groove From a construction viewpoint strips as opposed to rods
are far easier to implement due to required groove depth Given that there is often less cover on
the top of a slab than would be required cutting deeper grooves is hazardous in that the cuts
could easily cut through existing steel reinforcing bars Thus having shallower grooves is
preferred in Europe based on extensive field use
The lower modulus of the CFRP tape of 124 GPa (180 Msi) versus that of the CFRP strips 165
GPa (239 Msi) resulted in appreciably greater material usage for comparable strengthening
schemes As a comparison the S512 CFRP strip has an estimated moment capacity increase of
81 whereas the 3 size CFRP tape has an estimated moment capacity increase of only 71
and requires an additional 19 of material above that used for the strip to achieve this increase
Based on guidelines material cost considerations the CarboDur strips were recommended for
use to Caltrans On receipt of approval from Caltrans to use this option experimental work was
initiated using the flat option Because the smallest size strip far exceeded the required moment
capacity the CarboDur S512 strips were selected which have a 50 mm (2 in) width The
spacing was set at 203 mm (8 in) on center for the width of the test specimen such that nine total
CFRP strips were used The bars were extended past the point of inflection to achieve a
necessary development length of 300 mm (118 in)
32
Previously tested as-built specimen without FRP
Current specimen with to be strengthened using NSM CFRP strips
CFRP strips spaced at 203 mm (8 in) o c
Ld Point of inflection
Figure 30 Plan view of deck illustrating chosen CFRP strengthening scheme
33
R
einf
orce
men
t ty
pe
Prod
uct
Cro
ss-
sect
iona
l Are
a
of u
nits
ne
eded
Spac
ing
wo
co
nsid
erin
gsp
acin
g lim
its
Spac
ing
used
Act
ual
of
uni
ts
Tot
al a
rea
ofFR
P us
ed
The
oret
ical
m
omen
t ca
paci
ty
Mom
ent
capa
cit y
incr
ease
(Rod
or s
trip)
(N
ame
and
size
) (m
m2 )
(in 2 )
(rou
nded
up
)
(rou
nded
tone
ares
t in)
(c
onsi
derin
g sp
acin
g lim
its )
(rou
nded
up
) (m
2 )(in
2 )m
(kN
-m)
(kip
-ft)
(mm
) (in
) (m
m)
(in)
Rod
1
4
diam
eter
32
0
05
7 25
4 10
10
2 4
9 22
6 0
45
140
7 10
37
28
Rod
3
8
diam
eter
71
0
11
4 43
2 17
20
3 8
9 63
9 0
99
191
8 14
15
74
Strip
S5
12-
50m
m
wid
th
60
009
3 4
432
17
203
8 9
540
084
18
24
134
5 66
Strip
S8
12-
80m
m
wid
th
96
014
9 3
559
22
203
8 9
865
134
23
32
172
0 11
2
Strip
S1
012-
10
0mm
w
idth
12
0 0
186
2 83
8 33
20
3 8
9 10
80
167
25
66
189
2 13
3
Tape
2
31
0
049
9 20
3 8
203
8 9
281
044
13
15
969
20
Tape
3
71
0
11
4 43
2 17
20
3 8
9 64
2 0
99
173
1 12
76
57
Table 3 Calculation table using different FRP strengthening options
34
53 Rehabilitation Construction
The following section details the implementation of the NSMR strengthening scheme chosen in
Section 52 Nine (9) rectangular groves spaced at 203 mm (8 in) oc were cut in the top deck of
the test specimen with dimensional tolerances of 70 mm - 76 mm (2 frac34 in - 3 in) for the width
and 6 mm - 13 mm (frac14 in to frac12 in) for depth The grooves were each 274 m (8 ft) long and the
cut grooves are shown in Figure 31
Figure 31 Grooves cut in deck for NSM strengthening
After the grooves were cut to the proper dimensions the surface was roughened to achieve the
minimum required concrete surface profile (CSP) of 3 as defined by the ICRI surface profile
guidelines [27]
The CarboDur S 512 carbon fiber laminate strips were cut to length and the top and bottom
surfaces were wiped clean using methyl ethyl ketone (MEK) to remove all residual carbon dust
from the surface prior to the installation of strain gages on the top surface of the strips An
additional cleaning with MEK was performed immediately prior to installation of the strips into
the test specimen to remove any remaining contaminates and surface oxidization A highshy
modulus high-strength structural epoxy paste known as SikaDur 30 was used for bonding the
CFRP strips to the concrete The structural properties of the CarboDur S 512 strips and SikaDur
30 resin system were experimentally determined through material characterizations performed at
the University of California San Diego within the authorsrsquo research group and these properties
are shown below from [28]
35
Tensile Properties (ASTM D-638)
SikaDur 30
Mean Standard Deviation 7 day Tensile Strength 2529 MPa (3671 ksi) 254 MPa (0369 ksi) Modulus of Elasticity 693 GPa (1006 Msi) 048 GPa (00697 Msi)
Table 4 Tensile properties of SikaDur 30 resin system [28]
Tensile Properties (ASTM D-3039)
CarboDur S 512
Mean Standard Deviation Ultimate Tensile Strength 2505 MPa (3636 ksi) 8285 MPa (120 ksi) Ultimate Tensile Modulus 1381 GPa (2005 Msi) 522 GPa (076 Msi)
Ultimate Tensile Strain 1580 0084
Table 5 Tensile properties of SIKA CarboDur S512 CFRP strips [28]
After the SikaDur 30 resin system was thoroughly mixed the neat resin was applied to each
groove as a primer using a spatula to form a uniform thickness of 16 mm (116 in) as shown in
Figure 32 A specialized applicator was also used to apply a precisely controlled thickness of
resin onto each of the carbon fiber strips and the strips were carefully placed in the grooves
Figure 32 Application of resin system used in grooves to bond CFRP strips to concrete
A rubber roller was then used to properly seat each strip using adequate pressure to force
SikaDur 30 gel out on both sides of the laminate so that the bond line between the concrete and
36
FRP strip does not exceed 3 mm (18 in) [29] Excess gel was carefully removed and the
installed strips are shown in Figure 33
Figure 33 CFRP strips installed
After the resin system had cured for 24 hours a low viscosity resin system which was used for
the wear surface applied to the top of the FRP strips was poured over the top of the strips up to
the level of the original concrete deck The top layer of resin was mixed with sand to allow for
improved thermal compatibility with the surrounding concrete and to provide a non-skid wear
surface for the top of the deck After the installation of the NSM CFRP strengthening scheme
was completed the instrumentation was installed and the specimen was ready for testing to
determine the effectiveness of the repair
In order to monitor the curing of the CarboDur 30 resin system used to attach the CFRP strips to
the deck slab small test samples were made using resin mixed for installation of the strips and
the samples were placed adjacent to the test specimen to ensure comparable curing conditions
These resin samples were tested daily for a period of seven days using both dynamic mechanical
thermal analysis (DMTA) and differential scanning calorimetry (DSC) techniques The results
obtained from these experiments regarding the glass transition temperature Tg of the resin
system are shown in Table 6 The trends from the glass transition temperature data over time
shown below indicate that the SikaDur 30 resin system achieved nearly full cure after
approximately 4-5 days
37
Time DMTA Tg results DSC Tg results degC degC
Day 1 5713 3750 Day 2 5915 3850 Day 3 --- ---Day 4 6439 4150 Day 5 6226 4225 Day 6 6426 4300 Day 7 6361 4300
Table 6 Tg progression of CarboDur 30 resin used in NSMR installation
54 Capacity Calculations
Following the implementation of the chosen NSM CFRP strip rehabilitation scheme theoretical
predictions for capacity were recalculated using the experimentally determined material
properties given in Table 6 along with an assumed CFRP strip embedment depth of 3 mm (18
in) and reduced FRP strain capacity of 065 as described in Section 51 The increased
moment capacity calculation due to FRP strengthening described in Section 51 yields a
theoretical moment capacity of 1673 kN-m (1234 kip-ft) which corresponds to a 52 increase
in moment capacity over the experimentally determined value for the as-built specimen The
moment curvature analysis performed on the FRP rehabilitated specimen yielded a moment
capacity of 1855 kN-m (1364 kip-ft) which corresponds to a 69 increase in load carrying
capacity over the as-built specimen
38
152
55 Instrumentation
The total instrumentation for this experiment consisted of 16 linear potentiometers 47 strain
gages and 2 load cells One central row and two outer rows each with four linear potentiometers
were used to measure the vertical deflection of the deck slab The four linear potentiometers
within each row were positioned at the midspan of the adjacent cell above the adjacent stem in
between the stem and the loading beam and directly below the loading beam as shown in
Figures 11(a) and (b)
2438
1 2 3 4
M
B
A
76
610 279CL
152
1524
838
Elastomeric Bearing Pad 1524
Linear Potentiometers CL
1676
(a) Plan view of specimen (b) Section of deck slab with linear potentiometer details
Figure 34 Position of linear potentiometers for measuring deflections of deck slab
The deflection of the elastomeric bearing pad was measured using four linear potentiometers
with one linear potentiometer at each corner of the loading beam using the same layout as the asshy
built specimen shown in Figure 12
All 47 strain gages were applied to the top side of the nine pultruded CFRP strips parallel to the
direction of the fibers as shown in Figure 33 The two strain gage layout patterns used on this
specimen illustrated in Figure 35 were applied to alternating CFRP strips throughout the width
of the specimen as shown in Figure 36
39
Pattern 1
1626 1168
737 483
76
22362
2057
G F E D C B A
Pattern 2
1168 483
2057
F D B
Figure 35 Strain gage patterns and designations
G F E D C B A
1
2 1
2 1
2 1 2 1
Pattern
Figure 36 Position of strain gages attached to CFRP strips
40
Figure 37 Completed installation of CFRP strips with full instrumentation setup
41
56 Loading Protocol
The overhang of the deck slab was loaded using the test setup shown in Figure 7 and described in
Section 31 by incrementally increasing the hydraulic pressure supplied to the two hydraulic
jacks Adequate time was taken between loading levels to ensure that the hydraulic pressure had
stabilized and the pressure had equalized as much as possible between the two jacks The load
applied to the deck slab was monotonically increased following the loading sequence shown in
Table 7 The load was held briefly at each load level so that observations could be made
Loading step
Load per hydraulic
jack
Equivalent uniform
distributed load Load Level Notes
(kN) (kip) (kNm) (kipft) 1 24 5 300 21 --- Initial load 2 36 8 450 31 2x wall load ---3 48 11 600 41 --- ---4 60 13 750 51 --- ---5 72 16 900 62 4x wall load ---
6 84 19 1050 72 1st set of cracks observed
for as-built specimen ---
7 90 20 1125 77 5x wall load ---
9 101 23 1263 87 Calcd moment capacity asshy
built specimen ---
10 114 26 1425 98 Ultimate capacity as-built
specimen --shy
11 116 26 1450 99 Calcd shear capacity asshy
built specimen 1st set of cracks observed
12 130 29 1625 111 ---13 136 31 1700 116 --- 2nd set of cracks observed 14 142 32 1775 122 ~8x wall load ---15 148 33 1850 127 --- ---16 160 36 2000 137 ~9x wall load 3rd set of cracks observed 17 166 37 2075 142 --- ---18 172 39 2150 147 --- ---19 178 40 2225 152 ~10x wall load ---20 184 41 2300 158 --- 4th set of cracks observed 21 190 43 2375 163 --- ---22 196 44 2450 168 ~11x wall load Ultimate Capacity
Table 7 Loading protocol used for FRP rehabilitated specimen
42
57 Experimental Results
The ultimate capacity of the FRP rehabilitated deck slab was reached at an applied load of 196
kN (44 kips) per hydraulic jack equivalent to a uniform distributed load of 245 kNm (168
kipft) which is 11 x the nominal soundwall load At this load level the deflection of the middle
of the slab under the loading beam was 873 mm (034 in) The maximum strain value achieved
in the CFRP strips at ultimate capacity was 3846 microstrains At the ultimate capacity of the
specimen debonding of the FRP from the concrete occurred due to a tensile failure of the
concrete cover layer located between the FRP and the top layer of rebar This loss of
compatibility within the section was quickly followed by the opening and propagation of a large
diagonal crack along the compression strut formed with the adjacent stem wall
Cracking was observed and marked on the specimen at the four load levels of 116 kN (26 kip)
136 kN (31 kip) 160 kN (36 kip) and 184 kN (41 kip) per hydraulic jack The extent of visible
cracking on the top and sides of the deck of the FRP rehabilitated specimen shown in Figure 38
and Figure 39 occurred at the load level of 184 kN (41 kip) per hydraulic jack which was over
twice the load at which comparable cracking was observed on the as-built specimen The
comparable initial cracking observed on the as-built specimen which was described in section
45 occurred at a load level of 84 kN (19 kip) per hydraulic jack and is shown in Figure 15 and
Figure 16 on page 19 The thin cracking on the top of the deck surface that occurred in the FRP
rehabilitated specimen observed at the load level of 184 kN (41 kip) per hydraulic jack was
discontinuous and approximately followed the top longitudinal steel reinforcement bars adjacent
to the edge of the stem wall as shown in Figure 38
43
Figure 38 Craking of deck slab at 184 kN (41 kip) per jack- top view of deck
Minor diagonal cracks along both the edges of the slab which initiated from the top surface of
the deck are shown in Figure 39
(a) Detail of central edge of slab (b) Detail of exterior edge of slab
Figure 39 Cracking of deck slab at 184 kN (41kip) per jack - side view of deck
When the load level of 196 kN (44 kips) per hydraulic jack was reached the ultimate tensile
strength of the top concrete cover layer was exceeded and the bond between the FRP and the
concrete was lost This damage was quickly followed by the opening and propagation of a large
diagonal crack along the compression strut formed with the adjacent stem wall shown in Figure
40 This load level was determined to be the ultimate capacity of the overhang for resisting
vertical loads
44
(a) Central side of slab (b) Exterior side of slab
Figure 40 Cracking observed at ultimate capacity- side view of deck
The top surface of the deck slab after failure of the specimen can be observed in Figure 41 and
the cracking due to the interfacial failure between the FRP strips and the concrete can be
observed in the in the upper left hand corner of Figure 41 adjacent to the loading beam
Figure 41 Cracking of deck slab at ultimate capacity- top view of deck
After the loading of the specimen was completed all testing equipment and instrumentation was
fully removed to allow for easier observation of the damage present on the specimen Figure 42
shows the top view of the deck at ultimate capacity Any loose concrete was removed in order
to better observe the failure surfaces however unlike the as-built specimen in which significant
loose concrete was removed after it was tested nearly all of the concrete remained attached to
the tested FRP rehabilitated specimen despite the interfacial failure that occurred between the
FRP and the concrete Note that the debonding of the CFRP strips from the concrete occurred
adjacent to where the tensile stresses on the top of the deck are maximum while the CFRP strips
remained attached for the majority of the of the slab overhang
45
Figure 42 Side view of tested FRP rehabilitated specimen after removal of loose concrete
As observed in Figure 43 the three linear potentiometers directly below the loading beam
maintained comparable deflections throughout the loading range applied to the test specimen At
the failure load for the specimen the deflections of these three linear potentiometers were within
10 of each other which corresponds to less than 1 mm (004 in) difference in deflection values
46
80
140
10220 Ultimate Capacity Ultimate Capacity B4200 9 4th cracks
observed 4th cracks observed 180 8
M43rd cracks 160 3rd cracks 7observed
Load
per
hyd
raul
ic ja
ck (k
N)
Def
lect
ion
(mm
) observed 2nd cracks observed B4
120 1st cracks M4
100 observed A4
A46 2nd cracks
5 observed 1st cracks 4 observed B4B4 3
M460 2M4 A440
20 A4 1
0 0
0 2 4 6 8 10 24 60 84 116 136 160 172 184 196 Deflection (mm) Load per hydralulic jack (kN)
(a) Load versus deflection profiles (b) Comparison of linear potentiometers below loading beam
Figure 43 Comparisons of deflections at the edge of the deck slab overhang
The profiles along the center of the specimen (Figure 45) and at both edges (Figure 44 and
Figure 46) shown below exhibit similar deflection profiles throughout the loading range
0 24 kN Location of linear potentiometers
Distance from edge (mm) 60 kN 2 84 kN
B3 B4B1 B2 BB
Def
lect
ion
(mm
)
116 kN 4
136 kN
160 kN 6
8 184 kN 76
279 610 196 kN 101524 B1 B2 B3 B4
Linear Potentiometer Designation
Figure 44 Deflection profile along the central edge of specimen (Line B)
47
Location of linear potentiometers 0 24 kN Distance from edge (mm)
279 610
1524
76
M1 M2 M3 M4
60 kN 2 84 kN
M1 M2 M3 M4 Linear Potentiometer Designation
MM
Def
lect
ion
(mm
) 116 kN 4
136 kN
160 kN 6
184 kN 8
196 kN
10
Figure 45 Deflection profile along center of specimen (Line M)
0Location of linear potentiometers 24 kN Distance from edge (mm)
60 kN 2
84 kN
A1 A2 A3 A4 Linear Potentiometer Designation
279 610
1524
76
A1 A2 A3 A4 AA
Def
lect
ion
(mm
)
116 kN
136 kN
6
4
160 kN
8 184 kN
196 kN 10
Figure 46 Deflection profile along the outer edge of specimen (Line A)
The deflection profiles shown in Figure 47 and Figure 48 also indicate comparable deflections
along the overhang at a distance midway to the adjacent stem wall and directly below the point
of load application respectively
48
0 24 kN 60 kN 84 kN Location of linear potentiometers 116 kN 2Distance from edge (mm)
136 kN 160 kN
A3 M3 B3 Linear Potentiometer Designation
Def
lect
ion
(mm
)
3 184 kN 4 196 kN
8
10
838
152
1524
3
A3
M3
B3
Figure 47 Deflections midway along overhang (Line 3)
6
0
2
4
6
8
10
Def
lect
ion
(mm
)
84 kN 60 kN 24 kN
196 kN
184 kN
116 kN
136 kN
160 kN
A4 M4 B4
Location of linear potentiometers Distance from edge (mm)
838
152
1524
4
4
A4
M4
B4
Linear Potentiometer Designation
Figure 48 Deflections directly below loading beam (Line 4)
The strains in the FRP strips are also examined throughout the NSM CFRP rehabilitated
specimen The strain profiles along the edges and the middle of the specimen are shown in
Figure 49 Figure 50 and Figure 51 respectively These strain profiles indicate that the
maximum strain in the CFRP strips occurs directly above the edge of the stem wall adjacent to
the deck slab overhang referred to with the designation ldquoline Brdquo At ultimate capacity the
maximum strain in the specimen of 3846 microstrains occurs in strain gage 4B which is located
in line B near the middle of the specimen overhang
49
4000
Location of strain gages 3500 (See Figure for detailed schematic)
196 kN 3000
Stra
ins (
mic
rost
rain
s) 184 kN 9G 9F 9E 9D 9C 9B 160 kN9 9 2500
2000
1500
1000 60 kN
500 24 kN 0
136 kN 116 kN
84 kN
(Note Vertical gridlines in figure are -500 positioned at a spacing of 3048 mm (1 ft) 9G 9F 9E 9D 9C 9B Strain Gage Designation
Figure 49 Strain profile along the central edge of specimen (Line 9)
4000 196 kN
3500 184 kN (See Figure for detailed schematic)
Location of strain gages
3000 160 kN136 kN
Stra
ins (
mic
rost
rain
s)
2500
2000
1500
1000 60 kN 500 24 kN
0 (Note Vertical gridlines in figure are
-500 positioned at a spacing of 3048 mm (1 ft) 5G 5F 5E 5D 5C 5B 5A Strain Gage Designation
Figure 50 Strain profile along the middle of specimen (Line 5)
4000 Location of strain gages
(See Figure for detailed schematic) 3500 196 kN
116 kN
5G 5F 5E 5D 5C 5B 5A 5 84 kN 5
Stra
ins (
mic
rost
rain
s) 3000
2500
2000
1500
1000
1 500 24 kN
184 kN
160 kN136 kN 116 kN
84 kN
60 kN 1G 1F 1E 1D 1C 1B 1A 1
0(Note Vertical gridlines in figure are positioned at a spacing of 3048 mm (1 ft))
-500 1G 1F 1E 1D 1C 1B 1A
Strain Gage Designation
Figure 51 Strain profile along the outer edge of specimen (Line 1)
50
The strains drop off sharply for distances further away from the end of the overhang with the
majority of the strain gages on the opposite side of the stem wall (line C) exhibiting less than a
third of the strain values shown in line B The sharp drop in strain values at distances away from
the adjacent stem wall and the insignificant strains within these regions indicate that the
significantly shorter lengths of CFRP strips could be used to optimize material usage and
improve constructability without affecting load transfer and the overall system response
The strains along line B the location where the maximum strains occur in the specimen is shown
in Figure 52 This figure indicates that the distribution of strains was even along the specimen
until the load level of 116 kN (26 kip) per jack was reached At this level cracking was first
observed on the specimen and higher loading levels showed comparable but slightly less uniform
strains along the specimen The average strain along line B in the specimen at ultimate capacity
was 3423 microstrains whereas the minimum and maximum strains along line B were 2943
microstrains and 3846 microstrains respectively
4000
Location of strain gages 3500(See Figure for detailed schematic)
1B 3B 4B 5B 6B 7B 8B 9B Strain Gage Designation
Stra
ins (
mic
rost
rain
s) 3000 196 kN B 184 kN
160 kN 2500
1B
4B 3B
5B
9B 8B 7B 6B
B
136 kN 2000 116 kN
1500 84 kN
1000 60 kN
500
24 kN 0
(Note Vertical gridlines in figure are positioned at a spacing of 3048 mm (1 ft))
Figure 52 Strains along the edge of the stem wall adjacent to the deck slab overhang (Line B)
Using the strain data throughout the specimen and following a procedure described by Siem et al
[24] the shear stress between the concrete and the CFRP strips were calculated using the
following equation
51
9
(ε minus ε )sdot E sdot tn+1 n L Lτ nn+1 = (11)(x minus x )n+1 n
Where (x minus x )= distance between two strain gages EL= the tensile elastic modulus of then+1 n
CFRP strip and tL = thickness of the CFRP strips For these calculations EL= 1381 GPa (2005
Msi) and tL = 12 mm (0047 in) were used for the CFRP strips The calculated shear stress
values within the adhesive are simply the mean value between two strain gages which ignore
localized stress peaks and gradients
Distance from west edge (m) 27 24 21 18 15 12 09 06 03 00
Location of strain gages 20 (See Figure for detailed schematic)
15
196 kN
116 kN 160 kN
9B9G 9F 9E 9D 9C
(Note Vertical gridlines in figure are positioned at a spacing of 3048 mm (1 ft)
9
Stre
ss (M
Pa) 10
05
00
-05
-10
-15
-20
Figure 53 Calculated shear stress within adhesive along the central edge of specimen (Line 9)
Distance from west edge(m) 27 24 21 18 15 12 09 06 03 00
Location of strain gages (See Figure for detailed schematic) 20
196 kN
116 kN
160 kN
5 00
(Note Vertical gridlines in figure are positioned at a spacing of 3048 mm (1 ft)
3B5G 5F 5E 5A5D 5C
Stre
ss (M
Pa)
15
10
05
-05
-10
-15
-20
Figure 54 Calculated shear stress within adhesive along the middle of specimen (Line 5)
52
5
Distance from west edge(m) 27 24 21 18 15 12 09 06 03 00
Location of strain gages 20 (See Figure for detailed schematic)
196 kN
116 kN 160 kN
Stre
ss (M
Pa) 15
10
05
00
-05 3
(Note Vertical gridlines in figure are positioned at a spacing of 3048 mm (1 ft)
3B3G 3F 3E 3D 3C 3A 3
-10
-15
-20
Figure 55 Calculated shear stress within adhesive along an interior CFRP strip (Line 3)
Distance from west edge (m) 27 24 21 18 15 12 09 06 03 00
Location of strain gages 20 (See Figure for detailed schematic)
-20
196 kN
116 kN 160 kN
Stre
ss (M
Pa)
15
10
05
00
-05
-10
-15
1G 1F 1E 1D 1B1C 1A 11
(Note Vertical gridlines in figure are positioned at a spacing of 3048 mm (1 ft))
1G 1F 1E 1D 1C 1B 1A Strain Gage Designation
Figure 56 Calculated shear stress within adhesive along the outer edge of specimen (Line 1)
53
After the testing of the NSM CFRP rehabilitated specimen was completed the overhang of the
specimen was cut off and carefully removed from the rest of the test specimen as shown in
Figure 57 to allow for further examination of this critical region
432 mm (17 in)
Figure 57 Location of cut for removal of FRP rehabilitated overhang from test specimen
One point of interest to examine on the removed overhang was the actual location of the CFRP
strip reinforcement within the section Figure 58 shows that the actual embedment depth of the
near surface mounted CFRP strips was approximately 6 mm (025
in) and the actual thickness of the SikaDur 30 resin layer used to
bond the CFRP strips to the concrete was also approximately 6 mm
(025 mm) An embedment depth of 6 mm (025 in) is reasonable
for NSM applications because it allows enough space for an
adequate top surface of resin which will serve as environmental
protection and the wear surface for the deck However the 6 mm
(025 mm) thickness of the SikaDur 30 bottom resin layer exceeded
the maximum manufacturer recommended value of 3 mm (18
inch) While the current system performed very well the use of an
overly thick resin layer could have had an negative effect on the
overall structural response of the system Figure 58 Detail showing actual location of reinforcement
Figure 59 shows the failure surface of an FRP strip which has been detached from the top
surface of the deck The center portion of the strip with the firmly attached concrete was the
region in which the interfacial failure in the concrete occurred while the outer sections of the
strip were neatly detached from the resin system due to the method of removal of the strip
54
Figure 59 Detail of failure surface of FRP strip
58 Comparison with Theory
The NSM CFRP rehabilitated specimen reached ultimate capacity under an applied load of 196
kN (44 kip) per hydraulic jack which is equivalent to an applied moment of 1892 kN-m (1392
kip-ft) This improved performance corresponds to a 72 increase in ultimate capacity over the
as-built specimen which failed under an applied load of 114 kN (26 kip) corresponding to an
applied moment of 1100 kN-m (810 kip-ft) The ACI 440-02 calculation for externally bonded
FRP reinforcement predicted a maximum moment capacity of 1660 kN-m (1224 kip-ft) which
corresponds to a 51 increase in load carrying capacity over the experimentally determined
capacity of the as-built specimen The moment curvature analysis predicted a maximum moment
capacity of 1855 kN-m (1364 kip-ft) which corresponds to a 69 increase in load carrying
capacity over the as-built specimen The theoretical predictions and experimental results were
within 12 using the ACI 440 approach and were in close agreement with only a 2 error
using the moment curvature analysis The larger disagreement with experimental data found
from the ACI 440 moment capacity increase equation likely exists because this calculation is a
more simplified approach that does not take into account the over strength of the steel
reinforcement
55
3rd cracks observed
1st cracks observed
200
220
59 Comparison with As-Built
The ultimate capacity of the near surface mounted CFRP strip rehabilitated slab was reached at
an applied load of 196 kN (44 kips) equivalent to a uniform distributed load of 245 kNm (168
kipft) which is 11x the nominal soundwall load This ultimate capacity is 78 greater than that
obtained by the as-built specimen which occurred at 114 kN (26 kips) per hydraulic jack
equivalent to a uniform distributed load of 1425 kNm (98 kipft) which is 633x the nominal
wall load The center deflections under the loading beam for both specimens over the complete
loading ranges applied are compared in Figure 60(a) and Figure 60(b) At the failure load level
of the as-built specimen the as-built specimen had a center deflection under the loading beam of
636 mm (025 in) whereas the FRP rehabilitated specimen deflected approximately half that of
the as-built specimen or 333 mm (013 in) At ultimate capacity of the FRP rehabilitated
specimen the center deflection under the loading beam was 873 mm (034 in) which indicates
the rehabilitated specimen exhibited a 318 increase in deformation capacity over the as-built
specimen
10
0 2 4 6 8 10
Ultimate Capacity
1st cracks observed
2nd cracks observed
4th cracks observed
As-built test
3rd cracks observed
2nd cracks observed 1st cracks observed
Ultimate Capacity
Rehabilitated test
Def
lect
ion
(mm
)
6
5
4
360
240 120
0 0
Deflection (mm) Load per hydralulic jack (kN)
As-built specimenRehabilitated specimen
Ultimate Capacity
Ultimate Capacity
24 36 48 60 72 84 96 102 114 136 160 184 196
9
180
Load
per
hyd
raul
ic ja
ck (k
N) 8
160 7 140
120
100
80
a) Load versus deflection profiles (b) Comparison of linear potentiometers below loading beam
Figure 60 Comparisons of middle center deflections of the deck slab overhang
In addition to increasing the overall load and deformation capacity of the system the near
surface mounted CFRP strips act to increase the stiffness and improve the stability of the system
56
The load versus deflection profile shown in Figure 60(a) shows the significantly increased
stiffness and more linear profile for the FRP rehabilitated specimen over the as-built specimen
The deflection profile comparison at the 114 kN (26 kips) per jack load level along the middle of
the two slabs is shown in Figure 61 This figure illustrates that for the same load level the
deflections within the FRP rehabilitated specimen are lower than the deflections of the as-built
specimen throughout the deck slab and not just at the point of load application
Location of linear potentiometers 0 Distance from edge (mm)
279 610
1524
76
M1 M2 M3 M4
2
4
M M
6
8
10
FRP rehabilited specimen at 114 kN per jack
As-built specimen at 114 kN per jack
M1 M2 M3 M4 Linear Potentiometer Designation
Figure 61 Comparison of deflection profiles along center of specimens (Line M)
The first set cracking observed on the as-built specimen occurred at the load level of 84 kN (19
kip) whereas the first set cracking observed on the FRP rehabilitated specimen occurred at 116
kN (26 kip) which is corresponds to a 38 greater load A comparison of the deflection profiles
along the center of the specimens at these loading levels shown in Figure 62 reveals nearly
identical deformations for the two specimens
57
10
10
M1
1524
279 610
76
M2 M3 M4
Location of linear potentiometers Distance from edge (mm)
FRP rehabilited specimen at 1st observed cracking
(116 kN per jack)
0
2 As-built specimen
at 1st observed cracking (84 kN per jack) 4
M
Def
lect
ion
(mm
)
M
6
8
M1 M2 M3 M4 Linear Potentiometer Designation
Figure 62 Comparison of center deflection profiles at 1st observed cracking loads (Line M)
The second set of cracking observed on the as-built specimen occurred at the load level of 101
kN (23 kip) whereas the second set of cracking observed on the FRP rehabilitated specimen
occurred at 136 kN (31 kip) which is corresponds to a 35 greater load The deflection profile
comparison at the load levels where the second set of cracking was observed in Figure 64 also
exhibits nearly identical deformations for the two specimens This indicates that while the FRP
reinforcement acts to stiffen the system and increase the load carrying capacity of the overhang
region the shape of the deflection response profile of the system is not modified significantly
with the addition of the CFRP strips
0FRP rehabilited specimen at 2nd observed cracking
(136 kN per jack)
As-built specimen at 2nd observed cracking
(101 kN per jack)
Location of linear potentiometers Distance from edge (mm)
279 610
1524
76
M M1 M2 M3 M4
2
4
Def
lect
ion
(mm
)
M
6
8
M1 M2 M3 M4 Linear Potentiometer Designation
Figure 63 Comparison of center deflection profiles at 2nd observed cracking loads (Line M)
58
Figure 64 shows the side by side top decks of the two specimens after testing has been completed
and all loose concrete on the top deck removed Details of the critical region of the as-built and
FRP rehabilitated top deck are shown in Figure 65 and Figure 66 respectively
Figure 64 Top view of deck slab tested to ultimate capacity after removal of loose concrete
59
For the as-built specimen extensive damage and spalling of the concrete on the top of the deck
slab was seen Yielding in the transverse steel reinforcement followed by loss of aggregate
interlock resulting in failure was observed
Figure 65 Detail of cracking observed at ultimate capacity- top view of as-built deck
For the FRP rehabilitated specimen negligible spalled concrete and loose concrete rubble was
detected A concrete splitting failure mode was observed in the FRP rehabilitated specimen
Figure 66 Detail of cracking observed at ultimate capacity- top view of FRP rehabilitated deck
60
6 SUMMARY OF RESULTS AND RECOMMENDATIONS FOR FUTURE RESEARCH
Experimental results from the testing of the rehabilitated specimen indicate that the NSMR
strengthening scheme was successful at achieving the desired load carrying capacity increase
The ultimate load carrying capacity of the FRP rehabilitated specimen was 196 kN (44 kips) per
hydraulic jack which was 78 higher that the ultimate load of the as- built specimen of 114 kN
(26 kips) per hydraulic jack This value well exceeded the desired load capacity increase of
297 above the experimentally determined capacity of the as-built specimen exhibited a very
stable structural response and increased the deformation capacity of the system The theoretical
moment capacity predictions for the as-built specimen were within 11 and 65 of the
experimentally determined value using ACI 318 and moment curvature analysis respectively
The theoretical moment capacity predictions for the FRP rehabilitated specimen were within
12 of the experimental value using the modified ACI 440-02 approach and were within 2
using moment curvature analysis
The NSM FRP rehabilitated specimen exhibits a variety of structural performance improvements
over the as-built specimen including increased ultimate load carrying capacity enhanced
deformation capacity and more stable overall structural performance Design options for the
near surface mounted CFRP strengthening schemes allow for great flexibility in terms of
tailoring the reinforcement parameters for specific applications With consideration of the
minimal disruption to traffic flow and ease of installation this system is a viable and very
attractive rehabilitation option for bridge deck slab overhangs
The purpose of Phase 1 was to conduct an experimental analysis of the use of NSM for purposes
of strengthening and to provide the basis for the planning of Phase 2 as detailed in the initial
proposal submitted to Caltrans Based on the extensive literature review already conducted
(although according to the project funding provided by Caltrans is to be completed and reported
on in Phase 2) and on the experimental results the following aspects are recommended for further
study in Phase 2
61
bull Complete review of the failure modes and mechanisms seen with use of barsrods as
compared to flat strips for purposes of documenting advantages of strips It is noted that
a very brief summary is given in the introductory portion of this report
bull Optimization of groove dimensions and spacing for NSM use through both analytical and
experimental study
bull Study of adhesive rheology and bond quality as well as durability
bull Study of minimum development length and effect of insertion into girder stems
bull Study of use for specific strengthening applications
bull Development of design guide for Caltrans and development of example comparing NSM
use to surface bonding
It is emphasized that the studies should be conducted on specimens of sufficient size since small
scale tests are likely to provide erroneous results due to effects of scale and configuration It is
recommended that these tests only be conducted after a review of advances in Europe and
Australia are completed and sufficient analytical work is completed on optimization of grove
dimensions and spacing Since the efficacy of the method is intrinsically related to the ability of
the adhesive to not only bond the reinforcement to the concrete substrate but to also enable
efficient stress transfer study also needs to be conducted on adhesive rheology performance
characteristics and cure It is recommended that this be based on the completed durability study
which should provide a base-line for further study Also since it is likely that the NSM will be
covered by asphalt the effect of heat due to asphalt on the adhesive and bond should also be
studied
62
7 REFERENCES
[1] VM Karbhari and L Zhao ldquoUse of composites for 21st century civil infrastructurerdquo
Computer Method Appl Mech Eng 185 pp 433ndash454 (2000)
[2] S Rizkalla T Hassan N Hassan ldquoDesign recommendations for the use of FRP for
strengthening of concrete structuresrdquo Prog Struct Engng Mater 5 pp 16ndash28 (2003)
[3] K K Ghosh ldquoAssessment of FRP composite strengthened reinforced concrete bridge
structures at the component and systems level through progressive damage and nonshy
destructive evaluation (NDE) [PhD dissertation] University of California San Diego
(2006)
[4] L De Lorenzis JG Teng ldquoNear-surface mounted FRP reinforcement An emerging
technique for strengthening structuresrdquo Composites Part B 38 pp 119-143 (2007)
[5] R Parretti A Nanni ldquoStrengthening of RC Members Using Near-Surface Mounted FRP
Composites Design Overviewrdquo Advances in Structural Engineering 7 5 pp 1-16 (2004)
[6] J R Yost S P Gross D W Dinehart and J J Mildenberg ldquoFlexural Behavior of
Concrete Beams Strengthened with Near-Surface-Mounted CFRP Stripsrdquo ACI Structural
Journal July-August pp 430-437(2007)
[7] L A DeLorenzis A Nanni and A L Tegila ldquoFlexural and Shear Strengthening of
Reinforced Concrete Structures with Near Surface Mounted FRP Barsrdquo Proceedings of the
3rd International Conference on Advanced Composite Materials in Bridges and Structures
Ottawa Canada Aug 15-18 pp 521-528 (2000)
[8] El-Hacha R and Rizkalla S 2004 ldquoNear-Surface-Mounted Fiber- Reinforced Polymer
Reinforcements for Flexural Strengthening of Concrete Structuresrdquo ACI Structural Journal
V 101 V 5 Sept-Oct pp 717-726
[9] R Parretti and A Nanni ldquoStrengthening of RC Members Using Near-Surface Mounted
FRP Composites Design Overviewrdquo Advances in Structural Engineering V 7 (5) (2004)
63
[10] E Bonaldo J A Oliveira de Barros and P B Lourenccedilo ldquoEfficient Strengthening
Technique to Increase the Flexural Resistance of Existing RC Slabsrdquo ASCE Journal of
Composites for Construction MarchApril pp149-159 (2008)
[11] The Concrete Society Design Guidance for Strengthening Concrete Structures using Fibre
Composite Materials Concrete Society Technical Report 55 2nd Edition (2004)
[12] ACI Committee 440 Guide for the Design and Construction of Externally Bonded FRP
Systems for Strengthening Concrete Structures ACI 4402 R-02 (2002)
[13] Canadian Standards Association Canadian Highway Bridge Design Code- Section 16
Fibre-Reinforced Structures (2006)
[14] AASHTO LRFD bridge design specifications 3rd Ed AASHTO Washington DC
(2004)
[15] A B Pridmore V M Karbhari ldquoEvaluation of Prefabricated FRP Structural Formwork
Bridge Deck Systemsrdquo SAMPE 53rd International Technical Conference (2008)
[16] Caltrans ldquoMemo to Designers 22-1 Soundwall Design Criteriardquo (2004)
[17] ACI 318-08 Building Code Requirements for Structural Concrete (2008)
[18] Caltrans Bridge Design Specifications Section 8- Reinforced Concrete (2003)
[19] Bentz E and Collins M P lsquolsquoRESPONSE-2000mdashReinforced Concrete Section al Analysis
using the Modified Compression Field Theoryrdquo Version 105 Toronto Canada (2000)
[20] Caltrans ldquoMemo to Designers 22-1 Soundwall Design Criteriardquo (2004)
[21] Sika Corporation Product Data Sheet for Sika CarboDur Rods- carbon fiber rods for
structural strengthening Edition 9 (2003)
[22] Sika Corporation Product Data Sheet for Sika CarboDur- Carbon fiber laminate for
structural strengthening Edition 722 (2005)
[23] Hughes Brothers Inc Product data sheet for Aslan 500- CFRP tape wwwhughesbroscom
(2002)
64
[24] W Seim Y Vasquez VM Karbhari and F Seible ldquoPost-Strengthening of Concrete
Slabs Full Scale Testing and Design Recommendationrdquo ASCE Journal of Structural
Engineering 129[6] pp 743-752 (2003)
[25] W Seim M Hormann VM Karbhari and F Seible External FRP Poststrengthening of
Scaled Concrete Slabs ASCE Journal of Composites in Construction 5[2] pp 67-75
(2001)
[26] Sika Europe- German Institute of Construction Technology 1998
[27] International Concrete Repair Institute ICRI Guideline No 037324 ldquoSelecting and
Specifying Concrete Surface Preparation for Sealers Coatings and Polymer Overlaysrdquo
(1997)
[28] S J Jin ldquoStatistical Characterization of Prefabricated FRP Composite Materials for
Rehabilitation of Concrete Structuresrdquo Master Thesis Department of Structural
Engineering University of California San Diego (2008)
[29] Sika Corporation ldquoCarboDur Installation Guiderdquo Sika construction documents
65

University of California San Diego
Department of Structural Engineering
Structural Systems Research Project
Report No SSRP0903
Structural Response of Near Surface Mounted CFRP Strengthened Reinforced Concrete Bridge Deck Overhang
by
Anna B Pridmore Graduate Student Researcher
Vistasp M Karbhari
Professor of Structural Engineering
Final Report submitted to the California Department of Transportation Under Contract No 59A0630
Department of Structural Engineering
University of California San Diego
La Jolla California 92093-0085
amp University of Alabama in Huntsville
Huntsville AL 35899
November 2008
Technical Report Documentation Page 1 Report No 2 Government Accession No 3 Recipientrsquos Catalog No
4 Title and Subtitle
Structural Response of Near Surface Mounted CFRP Strengthened Reinforced Concrete Bridge Deck Overlay
5 Report Date
November 2008
6 Performing Organization Code
7 Author(s)
Anna Pridmore and Vistasp M Karbhari 8 Performing Organization Report No
UCSD SSRP- 0903
9 Performing Organization Name and Address
University of California San Diego La Jolla California 92093-0085
amp University of Alabama in Huntsville Huntsville Al 35899
10 Work Unit No (TRAIS)
11 Contract or Grant No
59A0630
12 Sponsoring Agency Name and Address
California Department of Transportation Engineering Service Center 1801 30th St West Building MS-9 Sacramento California 95807
13 Type of Report and Period Covered
Final Report
14 Sponsoring Agency Code
15 Supplementary Notes
Prepared in cooperation with the State of California Department of Transportation
16 Abstract
This report presents the results from an experimental investigation which explores the change in structural response due to the addition of near-surface-mounted (NSM) carbon fiber reinforced polymer (CFRP) reinforcement for increasing the capacity of the edge region of a reinforced concrete bridge deck The motivation for rehabilitating bridge deck overhangs using NSM reinforcement is to increase the load carrying capacity of the region so that the overhang can accommodate the larger than designed for loads caused by the installation of sound barrier walls onto the edges of the bridge deck The experimental testing of an as-built reinforced concrete specimen without FRP was used as the baseline test to evaluate the effectiveness of the NSM CFRP strengthening scheme Details regarding the capacity calculations experimental setup testing protocol and experimental results for the as-built specimen and FRP rehabilitated specimen are discussed in this report This report also presents the NSM CFRP strengthening design options examined for achieving the desired capacity increase and evaluates the change in structural response of the rehabilitated system as compared to the as-built test specimen
17 Key Words
Composite Strengthening Near Surface mounted Reinforcement Overhang Sound Walls
18 Distribution Statement
No restrictions
19 Security Classification (of this report)
Unclassified
20 Security Classification (of this page)
Unclassified
21 No of Pages
174 22 Price
Form DOT F 17007 (8-72) Reproduction of completed page authorized
DISCLAIMER
The contents of this report reflect the views of the authors who are responsible for the facts and
accuracy of the data presented herein The contents do not necessarily reflect the official views
or policies of the State of California or the Federal Highway Administration This report does
not constitute a standard specification or regulation
ii
TABLE OF CONTENTS
Abstract iv 1 Introduction 1 11 Project-Specific Need for FRP Rehabilitation 1 12 Methods of FRP Rehabilitation 2 13 Near Surface Mounted FRP Reinforcement 3 131 Variations 4 132 Prior Use 5 133 Available Codes and Specifications 6 2 Goals and Objectives 7 3 Overall Experimental Setup 8 31 Specimen Geometry and Construction 8 32 Loading Setup 10 4 As-Built Test 12 41 Demand Calculations 12 42 Capacity Calculations 13 43 Instrumentation 15 44 Loading Protocol 16 45 Experimental Results 18 46 Comparison with Theory 26 5 Rehabilitated Test 27 51 Calculations for Potential CFRP NSM Strengthening Schemes 27 52 Options for Rehabilitation 29 53 Rehabilitation Construction 35 54 Capacity Calculations 38 55 Instrumentation 39 56 Loading Protocol 42 57 Experimental Results 43 58 Comparison with Theory 54 59 Comparison with As-Built 55 6 Summary of Results and Recommendations for Future Research 60 7 References 62
iii
ABSTRACT
This report presents the results from an experimental investigation which explores the change in
structural response due to the addition of near-surface-mounted (NSM) carbon fiber reinforced
polymer (CFRP) reinforcement for increasing the capacity of the edge region of a reinforced
concrete bridge deck The motivation for rehabilitating bridge deck overhangs using NSM
reinforcement is to increase the load carrying capacity of the region so that the overhang can
accommodate larger than designed for loads caused by the installation of sound barrier walls
onto the edges of the bridge deck The experimental testing of an as-built reinforced concrete
specimen without FRP was used as the baseline test to evaluate the effectiveness of the NSM
CFRP strengthening scheme Details regarding the capacity calculations experimental setup
testing protocol and experimental results for the as-built specimen and FRP rehabilitated
specimen are discussed in this report This report also presents the NSM CFRP strengthening
design options examined for achieving the desired capacity increase and evaluates the change in
structural response of the rehabilitated system as compared to the as-built test specimen
iv
1 Introduction
11 Project-Specific Need for FRP Rehabilitation
In order to improve the quality of life for residents who live close to major highways Caltrans is
installing sound barriers along many roadways in California When these sound barrier walls are
installed onto bridges they are placed on the edge of the deck slab overhang on top of traffic
barriers The sound barrier walls are often made of concrete or masonry which add additional
loads to the edges of the bridges in excess of the original design loads The current solution
employed is to remove the entire edge region of the bridge deck and rebuild it with additional
reinforcement to accommodate the increased loading However this process necessitates road
closures and is time consuming and costly An alternative to replacement of the bridge deck slab
overhang is strengthening of the overhang through the use of fiber reinforced polymers (FRPs)
FRPs have been shown to be very beneficial for a variety of civil applications including
strengthening of bridge decks because of their high strength to weight ratio tailor able properties
and potential for enhanced durability and corrosion resistance over traditional structural
materials The ease of installation of FRP rehabilitation systems as compared to traditional
strengthening materials and methods allows for reduced highway closure time and disruption of
traffic flow
The current research is a preliminary experimental investigation to explore the application of
composites for increasing the capacity of the overhang region of the bridge deck to accommodate
the larger loads caused by the addition of the sound barrier walls Under the scope of the project
the aim was to test a single method of rehabilitation in order to provide preliminary validation of
the technique The overall project is divided into two phases with this being the first phase The
second phase includes a detailed literature review and state-of-the-art report in addition to a
focused building-block based approach to the assessment of the use of near surface mounted
reinforcement aimed at the development of a design guideline for Caltrans It is emphasized that
the current research was based on the use of an existing specimen and hence the test does not
directly mimic some cases that may be under consideration The goal as mentioned earlier was
to show viability rather than to provide a direct set of design guidelines However the research
1
was based on submission of detailed test plans and alternatives to Caltrans along with
recommendations for the rehabilitation Caltrans approval was obtained prior to initiation of the
test program and was again obtained for the down-selected rehabilitation option
12 Methods of FRP Rehabilitation
FRP rehabilitation can serve to efficiently strengthen repair or seismically retrofit a wide variety
of existing civil structures The use of FRP reinforcement which is bonded to the tension side of
concrete beams slabs or girders can provide improved flexural strength whereas use of the FRP
reinforcement bonded to the sides of girders and beams can provide additional shear strength for
the structure FRP reinforcement may also be used to wrap columns in order to provide
confinement for the concrete and additional ductility for the column during a seismic event
Figure 1 shows a variety of rehabilitation methods applied to columns which involve the use of
FRP reinforcement
Figure1 Methods of FRP rehabilitation for columns [1]
2
The two main categories for FRP rehabilitation techniques are externally bonded FRP systems
and near-surface-mounted FRP systems Externally bonded FRP systems include but are not
limited to wet layup processes bonding of pre-cured FRP profiles to a structure resin infusion of
dry fabric after installation of the FRP and use of prepreg sheets [2] An application of
externally bonded prefabricated strips and externally bonded on site impregnated fabric
laminates for the rehabilitation of bridge deck slabs are shown in Figures 2(a) and (b)
respectively
a) Pultruded strips b) Wet layup fabric laminates
Figure 2 Rehabilitation of bridge deck slabs using externally bonded FRP reinforcement [3]
13 Near Surface Mounted FRP Reinforcement
Near surface mounted FRP systems are a recent development although the general use of the
strategy can be traced to the use of steel rebar in surface cut grooves in Europe in the 1950s
This approach involves the installation of the FRP reinforcement into precut grooves in the cover
region of the concrete substrate to be strengthened The reinforcement is thus placed inside the
concrete substrate and covered with other material (cementitious or a polymer adhesive) rather
than being adhesively bonded to the surface The use of near-surface-mounted (NSM) FRP
reinforcement for rehabilitation has a number of advantages over the more common externally
bonded FRP reinforcement These advantages include the potential for reduced site installation
work since surface preparation beyond the creation of grooves for the FRP is no longer required
the reduced likelihood of debonding failures from the concrete surface due to significantly
improved anchoring ability and improved protection from mechanical damage provided by
3
recess of the NSM reinforcement into the concrete surface [45] The use of near surface
mounted FRP rehabilitation techniques provide particular advantages for flexural strengthening
of the negative moment region of reinforced concrete slabs and decks In these applications the
top surface of the deck may be subject to harsh environmental and use conditions which would
require the FRP reinforcement to be surrounded by a protective cover This would more difficult
to achieve using externally bonded strips whereas the near surface mounted reinforcement is
already embedded and therefore not exposed to these influences
131 Variations
FRP reinforcement used for near-surface-mounted applications can be manufactured in a wide
variety of shapes including round oval square and rectangular bars as well as strips with
varying width-to-thickness ratios Figure 3 shows a variety of different FRP bars and strips that
are commonly available for NSM applications
Figure 3 A selection of types of FRP bars and strips available for NSM applications [4]
Carbon fiber reinforced polymer composite NSM reinforcement is the primary type of FRP
material used to rehabilitate concrete structures because of the higher tensile strength and tensile
modulus of carbon over glass or aramid as well as the inertness of the fiber which reduces the
effect of concrete based alkalinity on the FRP itself These superior tensile properties allow for a
smaller cross-sectional area CFRP bar to be used over a GFRP or AFRP bar with the same
tensile capacity which has additional constructability benefits by reducing the risk of interfering
with the internal steel reinforcement
4
It should be noted that while the initial use of NSM was with circular bars the transition to
rectangular strips was predicated on the desire to attain higher strains in the reinforcing prior to
debonding It has been proven that all other factors being equal NSM strips have higher average
bond strengths than circular bars because of the development of a three-dimensional distribution
of bond stresses in the surrounding concrete Further in the case of round bars forces due to
radial stresses can induce tensile forces that can force the bar out of the groove resulting in
splitting and bond failure It should also be noted that since strips have significantly larger ratios
of perimeter to cross-sectional area than circular or rectangular rods bond stresses are lower The
primary failure modes for NSM include concrete crushing FRP rupture adhesive splitting
concrete splitting combined splitting and separation of the concrete cover region These are
exacerbated by round and rectangular rods as compared to flat strips due to the greater depth of
embedment and larger cross-sectional area as compared to surface area It should also be
emphasized that while the technique is extremely simple the use of square bars and rods requires
use of larger and deeper grooves than flat strips placed horizontally in order to achieve the same
efficiency A significantly more in-depth review of differences and modes of failure will be
reported in the Phase-2 report
132 Prior Use
While NSM FRP has been used successfully for flexural strengthening of concrete beams [678]
there is still limited work on the use of NSM FRP applications to increase the flexural capacity
of concrete slabs Parretti and Nanni discuss a design example of flexural strengthening a one
way RC slab in the negative moment region using NSM CRFP strips [9] and Bonaldo et al have
researched the structural performance of a reinforced concrete slab flexurally strengthened with
FRP and a steel fiber reinforced concrete overlay [10] however despite increasing field use
there is very little detailed literature relating to experimental work on the strengthening of the
negative moment region of a reinforced concrete slab
5
133 Available Codes and Specifications
The Concrete Society Technical Report No 55 discusses a variety of applications for
strengthening with NSM reinforcement (TR 55 Section 64) and recommends that for aspects
other than FRP curtailment design of flexural strengthening with NSM reinforcement should be
done using the design methods described for surface mounted reinforcement with the allowance
made to adjust the location of the reinforcement from the surface of the section to within the
section such that the strains in the FRP are lowered appropriately [11] Approaches for
anchorage design are detailed and design suggestions for reducing the likelihood of different
common modes of failure for NSMR are described
ACI 44002 makes no specific mention of strengthening using NSMR however contains
extensive information pertaining to surface mounted reinforcement Sections pertaining to near
surface mounted reinforcement are being added to the most recent edition of the ACI 440 code
however these sections are still in draft form and are not currently available [12]
The Canadian Highway Bridge Design Code includes strengthening with NSMR as part of its
discussion on flexural and axial rehabilitation (Section 16112) and gives resistance factors
pultruded carbon glass and aramid FRP NSMR (Section 1653) [13] This code determines
NSMR anchorage lengths for flexure using the same calculation provided for internal FRP bars
(Sections 1611244 and 16841) and provides only a general description of failure modes for
FRP strengthened systems without mention of NSMR specific modes of failure
6
2 GOALS AND OBJECTIVES
The goals of the experimental investigations presented in this report are to examine the changes
in vertical load carrying capacity and structural response of a steel reinforced concrete box girder
bridge deck overhang which has been rehabilitated with NSM reinforcement The desired
increase in capacity which will allow the overhang to safely accommodate the increased dead
load from the addition of the soundwalls and the feasible design options for achieving this
increased capacity objective must first be determined Once the chosen CFRP NSM
reinforcement strengthening scheme has been implemented and tested the objectives of this
project are to compare the rehabilitated specimenrsquos experimental results to theoretical predictions
and to the experimental results from the testing of the as-built reinforced concrete specimen
without FRP
7
3 OVERALL EXPERIMENTAL SETUP
31 Specimen Geometry and Construction
The overall test configuration used for this experimental work consists of a reinforced concrete
two-cell box girder with a center-to-center span of 1830 mm (6 ft) between each of the girders
and a length of 3660 mm (12 ft) as shown in Figure 4 The specimen deck is 178 mm (7 in)
thick and the distance from the stem wall to the edge of the overhang is 483 mm (19 in)
Figure 4 Overall dimensions of test specimen
610 mm 1829 mm 1829 mm 610 mm 4877 mm
252 mm 1549 mm 305 mm 1549 mm 254 mm
3912 mm
152
1346
mm
17
8
1676
mm
All steel reinforcement used within the test specimen was designed in accordance with the
AASHTO-LRFD specifications [14] and the construction practices employed mimicked field
techniques The steel reinforcement in the deck slab consisted of a top and bottom layer of 16
(5) rebar as shown in Figure 5 with the transverse rebar spaced at 203 mm (8 in) on center and
variable spacing for the longitudinal rebar in order to accommodate the location of the girder
stems The rebar used had an experimentally determined yield strength of 430 MPa (62 ksi) and
an ultimate strength of 703 MPa (102 ksi) A clear cover of 25 mm (1 in) was used throughout
the specimen The specimen deck slab and the upper portion of the stems were cast in place
monolithically using concrete with an average aggregate size of 127 mm (05 in) The concrete
strength at 28 days was 34 MPa (50 ksi)
8
4829 mm 152 152 159 229 152 (5) at 254 mm 152 279 149 (5) at 254 mm 152 229 159 152 152
178
(5) a
t 203
mm
36
58 m
m
162
Figure 5 Reinforcement layout for deck slab
Following construction of the described test specimen the specimen was used for a separate test
series [15] after completion of which two 203 mm (8 in) deep cuts located 305 mm (12 in) apart
from each other were created that ran longitudinally along the entire width of the specimen
(Figure 6)) It should be noted that previous testing was restricted to loading applied at the
central section of each cell and did not involve any load application or distress to the overhang
regions The two edge segments of the deck bounded by the longitudinal cuts were also removed
as shown in Figure 6 The purpose of the cuts was to allow for multiple independent tests on
sections of edge slab 168 m (5ft 6in) long
9
3658 mm 4877 mm
1676 mm
1676 mm
305 mm 483 mm
a) Original specimen b) Sectioned specimen as tested
Figure 6 Test Section
32 Loading Setup
Vertical loads were applied to the edge region of the deck slab using two hydraulic jacks spaced
183 m (6 feet) apart and mounted below the strong floor of the testing facility The load was
transferred through two 445 mm (1 frac34 in) diameter threaded rods to a steel loading beam
positioned 76 mm (3 in) on-center back from the end of the overhang section of the deck A 51
mm (2 in) thick and 152 mm (6 in) wide elastomeric bearing pad was placed between the steel
beam and the deck slab in order to reduce stress concentrations and provide more even loading of
the test specimen (Figure 7) The overall test setup is shown in Figure 8
Threaded rods Loading beam
Bearing pad Concrete deck
183 m
Figure 7 Test Setup Schematic
10
Figure 8 Overall Test Setup
11
4 AS-BUILT TEST
In order to establish a baseline for the effectiveness of the FRP repair the test specimen used was
isolated into separate sections as described in Section 31 and a portion of the concrete box girder
specimen was tested as-built without FRP rehabilitation The following section of the report
discusses the calculations experimental setup loading test observations and results from the
testing of this section of as-built reinforced concrete bridge deck
41 Demand Calculations
The combined dead weight of a typical sound wall and
traffic barrier used for bridges in California was
calculated from the Caltransrsquo concrete masonry
soundwall design on bridges as shown in Figure 9 [16]
Using this design with normal weight grout and
concrete the gravity load per unit length for the
soundwall and traffic barrier were determined to be
135 kNm (092 kipft) and 81 kNm (056 kipft)
respectively for a combined weight per unit length of
216 kNm (15 kipft) The tested section of overhang
was 1600 mm (5 ft 6 in) long therefore the total load
applied to the specimen from the soundwall and traffic
barrier is 362 kN (825 kip)
As mentioned previously the load was applied to the
structure by two hydraulic jacks such that each jack
applied half the total loading to the overhang In
equation form this can be expressed as
weightwall Figure 9 Standard Caltrans masonry weightwall _ per _ jack = (2)2 soundwall design [16]
12
where weightwall is the total load applied to the overhang due to the combined weight of the
soundwall and the traffic barrier This yields a load per hydraulic jack of approximately 18 kN
(4 kip) to represent the equivalent sound wall load which is corresponds to a distributed load of
107 kNm (074 kipft)
42 Capacity Calculations
The shear capacity of the slab was computed according to ACI 318-08 Section 113 using both
the general and the more detailed calculations [17] Note that the California Bridge Design
Specifications for reinforced concrete structures used by Caltrans were patterned after and are in
conformity with ACI Standard 318 [18] The general calculation for shear capacity of the slab
was given by the ACI 318-08 equation 11-3 as
Vc = 2 fc bwd (3)
where fc is the concrete compressive strength in ksi bw is the width of the concrete slab in
inches and d is the distance from the extreme compression fiber to the centroid of the tensile
reinforcement in inches This equation yields a total shear capacity of 236 kN (53 kip) for the
slab which translates to an applied force of 118 kN (265 kip) per hydraulic jack
The more detailed shear capacity equation is given by ACI 318-08 equation 11-5 as
Vud ⎞Vc = ⎛⎜⎜19 fc + 2500ρw ⎟⎟bwd (4)⎝ Mu ⎠
where fc is the concrete compressive strength in ksi ρw is the reinforcement ratio of the slab in
the direction perpendicular to traffic flow Vu and Mu are the factored moment and shear in the
slab at the edge of the stem respectively bw is the width of the concrete slab in inches and d is
the distance from the extreme compression fiber to the centroid of the tensile reinforcement in
inches This equation yields a slightly more conservative total shear capacity of 233 kN (524
kip) for the slab which translates to an applied force of 116 kN (262 kip) per hydraulic jack
The moment capacity of the slab was calculated as
13
⎛⎜⎝
a ⎞⎟⎠
M =As f d minus (5)n y 2
where As is the area of steel reinforcement in the direction perpendicular to traffic flow f y is the
yield strength of the slab steel d is the distance from the compression fiber to the centroid of the
tensile reinforcement and a is the depth of the equivalent rectangular compression stress block
This equation yields a total moment capacity of 970 kN-m (716 kip-ft)
The equivalent force applied through the loading beam can be obtained by dividing the moment
by the distance between the applied load and the edge of the stem also known as the moment
arm The equivalent applied force per hydraulic jack was 101 kN (23 kip) Since this capacity
value is lower than the computed shear capacity it is predicted that flexural damage will be
govern the performance of the slab
The moment capacity of the specimen was also found from the moment-curvature response
obtained by computer program (RESPONSE 2000) to be 1172 kN-m (856 kip-ft) This
corresponds to a maximum load per hydraulic jack of 122 kN (275 kip) [19] The moment
curvature response of the as-built reinforced concrete deck slab is shown below
140
120
100
0 50 100 150 200 250
Mom
ent
(kN
-m)
80
60
40
20
0
Curvature (10-3 radm)
Figure 10 Moment-curvature response for as-built specimen [19]
14
43 Instrumentation
The total instrumentation for this experiment consisted of 16 linear potentiometers and 2 load
cells One central row and two outer rows each with four linear potentiometers were used to
measure the vertical deflection of the deck slab The four linear potentiometers within each row
were positioned at the midspan of the adjacent cell above the adjacent stem in between the stem
and the loading beam and directly below the loading beam as shown in Figures 11(a) and (b)
Elastomeric Bearing Pad
Linear Potentiometers
1 2 3 4 A
B
M
76
CL
CL
2438 1524
610 279
152
838
1524
1676
1829
(a) Plan view of specimen (b) Section of deck slab with linear potentiometer details Figure 11 Position of linear potentiometers for measuring deflections of deck slab (Note not to
scale)
The deflection of the elastomeric bearing pad was measured using four linear potentiometers
with one linear potentiometer at each corner of the loading beam as shown in Figure 12
15
2438
152
CL
152
1524
1676
1829
CL
(a) Instrumentation detailing for bearing pad (b) Representative linear potentiometer
Figure 12 Position of linear potentiometers for measuring compression of bearing pad
44 Loading Protocol
In addition to the test setup described in Section 31 a 64 mm (2frac12 in) diameter hole was drilled
through the deck of the specimen at a distance 76 mm (3 in) by 76 mm (3 in) on center away
from the corner of the deck as shown in Figure 13 in order to accommodate the spacing
constraints imposed by the testing setup
Elastomeric Bearing Pad
Linear Potentiometers
1600 mm 76229 1829 mm
Threaded rods Loading beam
Bearing pad Concrete deck
Figure 13 Specific test setup schematic for as-built specimen
The overhang of the deck slab was tested by incrementally increasing the hydraulic pressure
supplied to the two hydraulic jacks which loaded the overhang through the test setup shown in
16
Figure 13 Adequate time was taken between loading levels to ensure that the hydraulic pressure
had stabilized and the pressure had equalized as much as possible between the two jacks The
load applied to the deck slab was monotonically increased following the loading sequence shown
in Table 1 The load was held briefly at each load level so that observations could be made at
each stage
Loading step
Load per hydraulic
jack
Equivalent uniform
distributed load Load level Notes
(kN) (kip) (kNm) (kipft) 1 24 5 300 21 --- Initial load 2 36 8 450 31 2x wall load ---3 48 11 600 41 --- ---4 60 13 750 51 --- ---5 72 16 900 62 4x wall load ---6 84 19 1050 72 --- 1st set of cracks observed 7 90 20 1125 77 5x wall load ---8 96 22 1200 82 --- ---9 102 23 1263 87 Calculated moment capacity 2nd set of cracks observed
10 114 26 1425 98 633x wall load Ultimate Capacity --- 116 26 1450 99 Calculated shear capacity ---
Table 1 Loading protocol for as-built test specimen
17
45 Experimental Results
The ultimate capacity of the slab was reached at an applied load of 114 kN (26 kips) per
hydraulic jack equivalent to a uniform distributed load of 1425 kNm (98 kipft) which is
633x the nominal wall load Note that the additional load carrying capacity of the deck slab
overhang beyond the dead load of a single sound barrier is necessary to resist lateral loading As
the loading of the edge of the slab was increased the top layer of transverse reinforcement above
the outer edge of the stem yielded followed by loss of aggregate interlock resulting in failure
The deflection of the middle of the slab directly under the loading beam when the system was
loaded to ultimate capacity was 636 mm (025 in)
As a baseline Figure 14 shows the specimen prior to testing The markings on the top of the
deck in this figure show preexisting hairline cracks in the deck
Figure 14 Deck slab prior to experimental testing
Cracking was first observed on the top side of the deck at the 84 kN (19 kip) load per jack and
were marked on the specimen in dark blue ink The thin cracking on the top of the deck surface
was discontinuous and approximately followed the two top longitudinal steel reinforcement bars
adjacent to the edge of the stem wall as shown in Figure 15
18
Figure 15 Initial craking of deck slab at 84kN (19 kip) per jack- top view of deck
Minor diagonal cracks along both the central and the exterior edge of the deck slab were also
observed at this load level as seen in Figure 16 Small diagonal cracks initiating on the top
surface of the deck observed at each end of the specimen are shown in Figures 16(a) and (b)
(a) Detail of central edge of slab (b) Detail of exterior edge of slab
Figure 16 Initial cracking of deck slab at 84kN (19 kip) per jack - side view of deck
Additional opening of small cracks was observed at the load level of 102 kN (23 kip) per jack
and these cracks were marked with red ink as shown in Figure 17 The cracks that followed the
two top longitudinal bars opened further and became continuous over the majority of the
specimen Additional cracks going across the width of the specimen formed on the top of the
slab as seen in Figure 17
19
Figure 17 Crack marking of deck slab at 102 kN (23 kip) per jack- top view of deck
When the load level of 114 kN (26 kip) per jack was reached a large diagonal crack opened and
quickly propagated which was clearly visible on the central edge of the slab as shown in Figure
18(a) This load level was determined to be the ultimate capacity of the overhang for resisting
vertical loads
(a) Central side of slab (b) Exterior side of slab
Figure 18 Cracking observed at ultimate capacity- side view of deck
The cracking progressed rapidly along the top surface of the deck as shown in Figure 19 and the
concrete adjacent to the loading beam settled several millimeters as seen in Figure 20
20
Figure 19 Cracking observed at ultimate capacity- top view deck
Figure 20 Detail of cracking at ultimate capacity in central section of deck near loading beam
After the loading of the specimen was completed all testing equipment and instrumentation was
fully removed and the observed cracks were marked in orange ink The orange diagonal cracks
on the top surface of the deck face toward the hole in the deck as shown in the upper left-hand
corner of Figure 21
Figure 21 Cracks observed on top of slab tested to ultimate capacity
The loose concrete was then removed in order to better observe the failure surfaces as shown in
Figure 22 and Figure 23 Increased damage was present on the central side of the deck as
compared to the exterior side
21
Figure 22 Top view of deck slab tested to ultimate capacity after removal of loose concrete
In Figure 23(b) the slight deformation in the rebar due to the yielding of the steel is observed It
is also noted that the concrete remained firmly attached beyond the longitudinal rebar
(a) Edge of deck prior to loose concrete removal (b) After removal
Figure 23 Detail of most severely damage section
The primary variables in defining the overall structural response of the bridge deck slab are the
load per hydraulic jack at which significant damage or failure occurred and the corresponding
center deflection of the slab directly below the actuator Additional instrumentation serves to
add supplementary data regarding the deformation of the specimen during testing As observed
in Figure 24 the deflection of the three linear potentiometers directly below the loading beam
indicate comparable deflections for lower loading levels and higher deflections with increasing
load at the central edge of the overhang which contains linear potentiometer B4
22
20
40
60
80
100
120
140 10
9
8
0 2 4 6 8 10 Deflection (mm)
A4
B4
M4
A4 B4M4
1st cracks observed
2nd cracks observed
Ultimate Capacity
Def
lect
ion
(mm
)
A4 M4 B4
A4
B4
M4
2nd cracks observed
1st cracks observed
Ultimate Capacity
Load
per
hyd
raul
ic ja
ck (k
N)
7
6
5
4
3
2
1
00 24 36 48 60 72 84 96 102 114
Load Level (kNhydraulic jack)
(a) Load versus deflection profiles (b) Comparison of linear potentiometers below loading beam
Figure 24 Comparisons of deflections at the edge of the deck slab overhang
At the load level of 84 kN (19 kips) per hydraulic jack where cracking in the deck was first
observed equivalent to a uniform distributed dead load of 105 kNm (72 kipft) or
approximately 5x the nominal wall load linear potentiometers A4 and M4 deflected similarly
while the linear potentiometer B4 exhibited a 13 mm (0051 in) or 37 greater deflection value
At the load level of 102 kN (23 kip) per hydraulic jack where the 2nd set of crack marking took
place equivalent to a uniform distributed dead load of 126 kNm (87 kipft) or nearly 6x the
nominal wall load the deflection at B4 was 20 mm (0078 in) or 39 greater than the other two
linear potentiometers The difference is due to levels of cracking The profiles along the center
of the specimen (Figure 26) and at both edges (Figures 25 and 27) shown below exhibit similar
deflection profiles and indicate that negligible vertical deformations occur in the deck beyond the
adjacent stem wall due to edge loading of the deck slab overhang
23
0 0 kN Location of linear potentiometers
24 kNDistance from edge (mm)
Def
lect
ion
(mm
)
2 60 kN
84 kN 4
102 kN
114 kN 6
8
76 279
610 1524
A1 A2 A3 A4AA
10
Figure 25 Deflection profile along the outer edge of specimen (Line A)
0 kNLocation of linear potentiometers 0 Distance from edge (mm) 24 kN
A1 A2 A3 A4 Linear Potentiometer Designation
M1 M2 M3 M4 Linear Potentiometer Designation
76 279
610 1524
M1 M2 M3 M4 MM
8
10
Figure 26 Deflection profile along center of specimen (Line M)
0
60 kN
84 kN
2
4 102 kN
6 114 kN
Def
lect
ion
(mm
)
B1 B2 B3 B4 Linear Potentiometer Designation
0 kN Location of linear potentiometers 24 kNDistance from edge (mm)
76 279
610 1524
B1 B2 B3 B4114 kNBB
10
Figure 27 Deflection profile along the central edge of specimen (Line B)
2 60 kN
4
84 kN
6 102 kN
8
Def
lect
ion
(mm
)
24
The deflection profile shown in Figure 28 shows comparable deflections along the overhang at a
distance midway to the adjacent stem wall Figure 29 illustrates comparable deflections directly
below the point of load application along the overhang for lower load levels with less symmetric
deformations observed for higher load levels after cracking was observed throughout the
specimen Through a comparison of these figures the results indicate a symmetric structural
response for load levels prior to the initial observation of cracking in the specimen and greater
deflections on one side at higher loading levels
0 0 kN 24 kN
Location of linear potentiometers Distance from edge (mm) 2 84 kN
60 kN
3 102 kN
838
152
1524
3
B3
M3
A3D
efle
ctio
n (m
m) 114 kN
4
6
8
10 B3 M3 A3
Linear Potentiometer Designation
Figure 28 Deflections midway along overhang (Line 3)
0 0 kN
24 kN Location of linear potentiometers
Distance from edge (mm) 2 60 kN 4
838
152
1524
4
B4
M4
A4
Def
lect
ion
(mm
)
84 kN 4 102 kN
114 kN 6
8
10 B4 M4 A4
Linear Potentiometer Designation
Figure 29 Deflections directly below loading beam (Line 4)
25
46 Comparison with Theory
The max moment found via moment curvature analysis of 1172 kN-m (856 kip-ft) was within
65 of the actual moment applied to the structure at the max loading of 114 kN (26 kip) per
hydraulic jack which corresponds to an applied moment of 1100 kN-m (810 kip-ft) The
moment capacity estimate of 970 kN-m (716 kip-ft) determined using the ACI 318-08
prescribed equation was off from the experimentally determined moment capacity by 118
26
5 REHABILITATED TEST
The following section presents NSM FRP strengthening design options for achieving the desired
capacity increase and describes the implementation testing and analysis of the chosen
rehabilitation design
51 Calculations for Potential CFRP NSM Strengthening Schemes
The increased moment demand on the test specimenrsquos deck slab due to the addition of the
soundwall is calculated and this value is used as the basis for determining the desired capacity
increase The corresponding total area of NSM CFRP needed to achieve the desired moment
capacity increase is calculated and design options for five different available CFRP
reinforcement products are presented
The dead weight of a typical sound wall used for bridges in California was calculated from the
Caltransrsquo concrete masonry soundwall design on bridges [20] Using this design with normal
weight concrete the gravity load per unit length for the soundwall was determined to be 135
kNm (092 kipft) Note that the weight of the traffic barrier is not included as part of the
increased moment demand calculation because it is assumed that the weight of the traffic barrier
was already accounted for in the original design of the deck slab overhang The tested section of
overhang was 1600 mm (5 ft 6 in) long therefore the total load applied to the specimen from the
soundwall is 226 kN (508 kip) The equivalent moment applied to the structure due to this dead
load can be obtained by multiplying the total load applied by the distance between the applied
load and the edge of the stem also known as the moment arm The equivalent additional
moment demand due to the soundwall was found to be 1091 kN-m (805 kip-ft)
A successful repair would strengthen the overhang to accommodate this increased moment
demand with a reasonable safety margin For initial calculation purposes a safety margin of 3
was deemed appropriate
M demand _ increase = M wall sdot3 (6)
27
This translates to an increase in moment demand of 327 kN-m (241 kipmiddotft) Therefore the
NSM flexural strengthening will be designed to increase the capacity of the overhang by at least
this value The experimentally determined moment capacity of the as-built reinforced concrete
deck slab overhang without FRP was found to be 110 kN-m (81 kip-ft) Therefore the new
moment capacity after strengthening should be at least 1427 kN-m (1051 kip-ft) which
corresponds to a minimum required moment capacity increase of 297 percent over the capacity
of the as-built specimen without FRP
The increased moment capacity due to FRP strengthening is equal to the sum of the contribution
from the tension steel (compression steel is ignored for this calculation) and the contribution
from the FRP reinforcement
⎛⎜⎝
⎞⎟⎠
⎛⎜⎝
⎞⎟⎠
a aψ f+
The definitions of the variables in the above equation are shown below
Steel properties
As = Total area of tension steel in slab overhang test specimen
fs = Experimentally determined yield strength of steel reinforcement
d = Distance to centroid of tensile steel reinforcement
a = Depth of concrete compression block assuming rectangular stress distribution
FRP properties
M As f d Af f dminus sdot sdot minus (8)= strengthened fe fn y 2 2_
Ψ f = Additional reduction factor recommended by ACI 4402R (Section 961) [12]
df = Distance from the compression fiber to the centroid of the FRP
ffe = Efmiddotεfe Effective stress in the FRP assuming elastic behavior
Ef = Experimentally determined modulus of elasticity of FRP
εfe = Effective strain in FRP reinforcement
By rearranging equation 8 an expression for the area of FRP reinforcement required in order to
achieve a specified moment capacity increased can be obtained
28
⎛ a ⎞M n _ strengthened minus As f y ⎜ d minus ⎟ ⎝ 2 ⎠Af _ required = (9)
⎛ a ⎞ψ sdot f sdot ⎜ d minus ⎟f fe f⎝ 2 ⎠
The required area of FRP obtained from this expression can be used to evaluate the feasibility of
different FRP strengthening options Note that the area of FRP required is the total area needed
for the specimen overhang and thus must be distributed along the width of the slab overhang
52 Options for Rehabilitation
The seven product options evaluated for this rehabilitation design were different sizes of SIKArsquos
pultruded carbon fiber CarboDur rods and strips as well as Hughes Brothersrsquo pultruded carbon
fiber Aslan 500 rectangular rods The physical characteristics of each option are provided in
Table 2 for reference
29
Product
Type
Source Product
Designation
Diameter Thickness Width Area Tensile
Modulus
mm in mm in mm in mm2 in2 GPa Msi
Rod SIKA frac14 in dia 635 025 127 005 155 225
Rod SIKA 38 in dia 953 0375 279 011 155 225
Strip SIKA S512 12 0047 50 197 60 0093 165 239
Strip SIKA S812 12 0047 80 315 96 0149 165 239
Strip SIKA S1012 12 0047 100 394 120 0186 165 239
Bar Hughes
Brothers
2 2 0079 16 063 312 0049 124 18
Bar Hughes
Brothers
3 45 0177 16 063 713 0110 124 18
Table 2 Physical properties of pultruded CFRP strengthening product options [212223]
30
The number of reinforcements required to attain the desired moment capacity increase was
calculated for each of the seven potential options using calculations described in the previous
section (Equation 9) and the results are shown in Table 3 For calculation of the effective stress
in the FRP εfe a strain of 065 was assumed based on design recommendations for FRP postshy
strengthening of reinforced concrete slabs [24 25] The tensile modulus for each of the different
FRP reinforcement options was obtained from manufacturer reported data Since the FRP
reinforcement type had not been selected yet the distance from the compression fiber to the
centroid of the FRP df was assumed to be the full depth of the slab Note that this assumption
will slightly overestimate the moment capacity contribution from the FRP because for NSMR
applications the reinforcement is located slightly below the surface of the structure Assuming
that the centroid of the FRP reinforcement is below the surface of the structure by a distance of
between 2 mm (0079 in) and 10 mm (0393 in) the calculations would have overestimated the
moment capacity increase due to the FRP reinforcement by between 1 and 6
Spacing requirements were also considered in the calculations performed for each FRP
strengthening option The maximum spacing recommendations provided by the manufacturer
[26] state that on center spacing should be limited to no more than the lesser of 02 times the
span length (L) or five times the slab thickness (h)
slim it = min(02L 5h) (10)
Note that the span for cantilever is taken as twice the distance to the support This spacing limit
yields a maximum recommended spacing of 203 mm (8 in) Table 3 below shows the number of
units needed as well as the theoretical moment capacity increase for each type of CFRP
reinforcement As observed in the Table 3 spacing limitations govern rather than actual strength
requirement limitations Since all seven of the design options are able to achieve the increased
capacity requirements other aspects such as cost and constructability are now used to select the
FRP reinforcement system
One notable difference between the installation of CFRP strips as opposed to rods is the required
depth of grooves cut into the deck The 64 mm (14 in) diameter rods require 127 mm (12 in)
31
deep slots and the 95 mm (38 in) rods require 159 mm (58 in) deep rods while the strips only
require a 4 mm (016 in) deep groove From a construction viewpoint strips as opposed to rods
are far easier to implement due to required groove depth Given that there is often less cover on
the top of a slab than would be required cutting deeper grooves is hazardous in that the cuts
could easily cut through existing steel reinforcing bars Thus having shallower grooves is
preferred in Europe based on extensive field use
The lower modulus of the CFRP tape of 124 GPa (180 Msi) versus that of the CFRP strips 165
GPa (239 Msi) resulted in appreciably greater material usage for comparable strengthening
schemes As a comparison the S512 CFRP strip has an estimated moment capacity increase of
81 whereas the 3 size CFRP tape has an estimated moment capacity increase of only 71
and requires an additional 19 of material above that used for the strip to achieve this increase
Based on guidelines material cost considerations the CarboDur strips were recommended for
use to Caltrans On receipt of approval from Caltrans to use this option experimental work was
initiated using the flat option Because the smallest size strip far exceeded the required moment
capacity the CarboDur S512 strips were selected which have a 50 mm (2 in) width The
spacing was set at 203 mm (8 in) on center for the width of the test specimen such that nine total
CFRP strips were used The bars were extended past the point of inflection to achieve a
necessary development length of 300 mm (118 in)
32
Previously tested as-built specimen without FRP
Current specimen with to be strengthened using NSM CFRP strips
CFRP strips spaced at 203 mm (8 in) o c
Ld Point of inflection
Figure 30 Plan view of deck illustrating chosen CFRP strengthening scheme
33
R
einf
orce
men
t ty
pe
Prod
uct
Cro
ss-
sect
iona
l Are
a
of u
nits
ne
eded
Spac
ing
wo
co
nsid
erin
gsp
acin
g lim
its
Spac
ing
used
Act
ual
of
uni
ts
Tot
al a
rea
ofFR
P us
ed
The
oret
ical
m
omen
t ca
paci
ty
Mom
ent
capa
cit y
incr
ease
(Rod
or s
trip)
(N
ame
and
size
) (m
m2 )
(in 2 )
(rou
nded
up
)
(rou
nded
tone
ares
t in)
(c
onsi
derin
g sp
acin
g lim
its )
(rou
nded
up
) (m
2 )(in
2 )m
(kN
-m)
(kip
-ft)
(mm
) (in
) (m
m)
(in)
Rod
1
4
diam
eter
32
0
05
7 25
4 10
10
2 4
9 22
6 0
45
140
7 10
37
28
Rod
3
8
diam
eter
71
0
11
4 43
2 17
20
3 8
9 63
9 0
99
191
8 14
15
74
Strip
S5
12-
50m
m
wid
th
60
009
3 4
432
17
203
8 9
540
084
18
24
134
5 66
Strip
S8
12-
80m
m
wid
th
96
014
9 3
559
22
203
8 9
865
134
23
32
172
0 11
2
Strip
S1
012-
10
0mm
w
idth
12
0 0
186
2 83
8 33
20
3 8
9 10
80
167
25
66
189
2 13
3
Tape
2
31
0
049
9 20
3 8
203
8 9
281
044
13
15
969
20
Tape
3
71
0
11
4 43
2 17
20
3 8
9 64
2 0
99
173
1 12
76
57
Table 3 Calculation table using different FRP strengthening options
34
53 Rehabilitation Construction
The following section details the implementation of the NSMR strengthening scheme chosen in
Section 52 Nine (9) rectangular groves spaced at 203 mm (8 in) oc were cut in the top deck of
the test specimen with dimensional tolerances of 70 mm - 76 mm (2 frac34 in - 3 in) for the width
and 6 mm - 13 mm (frac14 in to frac12 in) for depth The grooves were each 274 m (8 ft) long and the
cut grooves are shown in Figure 31
Figure 31 Grooves cut in deck for NSM strengthening
After the grooves were cut to the proper dimensions the surface was roughened to achieve the
minimum required concrete surface profile (CSP) of 3 as defined by the ICRI surface profile
guidelines [27]
The CarboDur S 512 carbon fiber laminate strips were cut to length and the top and bottom
surfaces were wiped clean using methyl ethyl ketone (MEK) to remove all residual carbon dust
from the surface prior to the installation of strain gages on the top surface of the strips An
additional cleaning with MEK was performed immediately prior to installation of the strips into
the test specimen to remove any remaining contaminates and surface oxidization A highshy
modulus high-strength structural epoxy paste known as SikaDur 30 was used for bonding the
CFRP strips to the concrete The structural properties of the CarboDur S 512 strips and SikaDur
30 resin system were experimentally determined through material characterizations performed at
the University of California San Diego within the authorsrsquo research group and these properties
are shown below from [28]
35
Tensile Properties (ASTM D-638)
SikaDur 30
Mean Standard Deviation 7 day Tensile Strength 2529 MPa (3671 ksi) 254 MPa (0369 ksi) Modulus of Elasticity 693 GPa (1006 Msi) 048 GPa (00697 Msi)
Table 4 Tensile properties of SikaDur 30 resin system [28]
Tensile Properties (ASTM D-3039)
CarboDur S 512
Mean Standard Deviation Ultimate Tensile Strength 2505 MPa (3636 ksi) 8285 MPa (120 ksi) Ultimate Tensile Modulus 1381 GPa (2005 Msi) 522 GPa (076 Msi)
Ultimate Tensile Strain 1580 0084
Table 5 Tensile properties of SIKA CarboDur S512 CFRP strips [28]
After the SikaDur 30 resin system was thoroughly mixed the neat resin was applied to each
groove as a primer using a spatula to form a uniform thickness of 16 mm (116 in) as shown in
Figure 32 A specialized applicator was also used to apply a precisely controlled thickness of
resin onto each of the carbon fiber strips and the strips were carefully placed in the grooves
Figure 32 Application of resin system used in grooves to bond CFRP strips to concrete
A rubber roller was then used to properly seat each strip using adequate pressure to force
SikaDur 30 gel out on both sides of the laminate so that the bond line between the concrete and
36
FRP strip does not exceed 3 mm (18 in) [29] Excess gel was carefully removed and the
installed strips are shown in Figure 33
Figure 33 CFRP strips installed
After the resin system had cured for 24 hours a low viscosity resin system which was used for
the wear surface applied to the top of the FRP strips was poured over the top of the strips up to
the level of the original concrete deck The top layer of resin was mixed with sand to allow for
improved thermal compatibility with the surrounding concrete and to provide a non-skid wear
surface for the top of the deck After the installation of the NSM CFRP strengthening scheme
was completed the instrumentation was installed and the specimen was ready for testing to
determine the effectiveness of the repair
In order to monitor the curing of the CarboDur 30 resin system used to attach the CFRP strips to
the deck slab small test samples were made using resin mixed for installation of the strips and
the samples were placed adjacent to the test specimen to ensure comparable curing conditions
These resin samples were tested daily for a period of seven days using both dynamic mechanical
thermal analysis (DMTA) and differential scanning calorimetry (DSC) techniques The results
obtained from these experiments regarding the glass transition temperature Tg of the resin
system are shown in Table 6 The trends from the glass transition temperature data over time
shown below indicate that the SikaDur 30 resin system achieved nearly full cure after
approximately 4-5 days
37
Time DMTA Tg results DSC Tg results degC degC
Day 1 5713 3750 Day 2 5915 3850 Day 3 --- ---Day 4 6439 4150 Day 5 6226 4225 Day 6 6426 4300 Day 7 6361 4300
Table 6 Tg progression of CarboDur 30 resin used in NSMR installation
54 Capacity Calculations
Following the implementation of the chosen NSM CFRP strip rehabilitation scheme theoretical
predictions for capacity were recalculated using the experimentally determined material
properties given in Table 6 along with an assumed CFRP strip embedment depth of 3 mm (18
in) and reduced FRP strain capacity of 065 as described in Section 51 The increased
moment capacity calculation due to FRP strengthening described in Section 51 yields a
theoretical moment capacity of 1673 kN-m (1234 kip-ft) which corresponds to a 52 increase
in moment capacity over the experimentally determined value for the as-built specimen The
moment curvature analysis performed on the FRP rehabilitated specimen yielded a moment
capacity of 1855 kN-m (1364 kip-ft) which corresponds to a 69 increase in load carrying
capacity over the as-built specimen
38
152
55 Instrumentation
The total instrumentation for this experiment consisted of 16 linear potentiometers 47 strain
gages and 2 load cells One central row and two outer rows each with four linear potentiometers
were used to measure the vertical deflection of the deck slab The four linear potentiometers
within each row were positioned at the midspan of the adjacent cell above the adjacent stem in
between the stem and the loading beam and directly below the loading beam as shown in
Figures 11(a) and (b)
2438
1 2 3 4
M
B
A
76
610 279CL
152
1524
838
Elastomeric Bearing Pad 1524
Linear Potentiometers CL
1676
(a) Plan view of specimen (b) Section of deck slab with linear potentiometer details
Figure 34 Position of linear potentiometers for measuring deflections of deck slab
The deflection of the elastomeric bearing pad was measured using four linear potentiometers
with one linear potentiometer at each corner of the loading beam using the same layout as the asshy
built specimen shown in Figure 12
All 47 strain gages were applied to the top side of the nine pultruded CFRP strips parallel to the
direction of the fibers as shown in Figure 33 The two strain gage layout patterns used on this
specimen illustrated in Figure 35 were applied to alternating CFRP strips throughout the width
of the specimen as shown in Figure 36
39
Pattern 1
1626 1168
737 483
76
22362
2057
G F E D C B A
Pattern 2
1168 483
2057
F D B
Figure 35 Strain gage patterns and designations
G F E D C B A
1
2 1
2 1
2 1 2 1
Pattern
Figure 36 Position of strain gages attached to CFRP strips
40
Figure 37 Completed installation of CFRP strips with full instrumentation setup
41
56 Loading Protocol
The overhang of the deck slab was loaded using the test setup shown in Figure 7 and described in
Section 31 by incrementally increasing the hydraulic pressure supplied to the two hydraulic
jacks Adequate time was taken between loading levels to ensure that the hydraulic pressure had
stabilized and the pressure had equalized as much as possible between the two jacks The load
applied to the deck slab was monotonically increased following the loading sequence shown in
Table 7 The load was held briefly at each load level so that observations could be made
Loading step
Load per hydraulic
jack
Equivalent uniform
distributed load Load Level Notes
(kN) (kip) (kNm) (kipft) 1 24 5 300 21 --- Initial load 2 36 8 450 31 2x wall load ---3 48 11 600 41 --- ---4 60 13 750 51 --- ---5 72 16 900 62 4x wall load ---
6 84 19 1050 72 1st set of cracks observed
for as-built specimen ---
7 90 20 1125 77 5x wall load ---
9 101 23 1263 87 Calcd moment capacity asshy
built specimen ---
10 114 26 1425 98 Ultimate capacity as-built
specimen --shy
11 116 26 1450 99 Calcd shear capacity asshy
built specimen 1st set of cracks observed
12 130 29 1625 111 ---13 136 31 1700 116 --- 2nd set of cracks observed 14 142 32 1775 122 ~8x wall load ---15 148 33 1850 127 --- ---16 160 36 2000 137 ~9x wall load 3rd set of cracks observed 17 166 37 2075 142 --- ---18 172 39 2150 147 --- ---19 178 40 2225 152 ~10x wall load ---20 184 41 2300 158 --- 4th set of cracks observed 21 190 43 2375 163 --- ---22 196 44 2450 168 ~11x wall load Ultimate Capacity
Table 7 Loading protocol used for FRP rehabilitated specimen
42
57 Experimental Results
The ultimate capacity of the FRP rehabilitated deck slab was reached at an applied load of 196
kN (44 kips) per hydraulic jack equivalent to a uniform distributed load of 245 kNm (168
kipft) which is 11 x the nominal soundwall load At this load level the deflection of the middle
of the slab under the loading beam was 873 mm (034 in) The maximum strain value achieved
in the CFRP strips at ultimate capacity was 3846 microstrains At the ultimate capacity of the
specimen debonding of the FRP from the concrete occurred due to a tensile failure of the
concrete cover layer located between the FRP and the top layer of rebar This loss of
compatibility within the section was quickly followed by the opening and propagation of a large
diagonal crack along the compression strut formed with the adjacent stem wall
Cracking was observed and marked on the specimen at the four load levels of 116 kN (26 kip)
136 kN (31 kip) 160 kN (36 kip) and 184 kN (41 kip) per hydraulic jack The extent of visible
cracking on the top and sides of the deck of the FRP rehabilitated specimen shown in Figure 38
and Figure 39 occurred at the load level of 184 kN (41 kip) per hydraulic jack which was over
twice the load at which comparable cracking was observed on the as-built specimen The
comparable initial cracking observed on the as-built specimen which was described in section
45 occurred at a load level of 84 kN (19 kip) per hydraulic jack and is shown in Figure 15 and
Figure 16 on page 19 The thin cracking on the top of the deck surface that occurred in the FRP
rehabilitated specimen observed at the load level of 184 kN (41 kip) per hydraulic jack was
discontinuous and approximately followed the top longitudinal steel reinforcement bars adjacent
to the edge of the stem wall as shown in Figure 38
43
Figure 38 Craking of deck slab at 184 kN (41 kip) per jack- top view of deck
Minor diagonal cracks along both the edges of the slab which initiated from the top surface of
the deck are shown in Figure 39
(a) Detail of central edge of slab (b) Detail of exterior edge of slab
Figure 39 Cracking of deck slab at 184 kN (41kip) per jack - side view of deck
When the load level of 196 kN (44 kips) per hydraulic jack was reached the ultimate tensile
strength of the top concrete cover layer was exceeded and the bond between the FRP and the
concrete was lost This damage was quickly followed by the opening and propagation of a large
diagonal crack along the compression strut formed with the adjacent stem wall shown in Figure
40 This load level was determined to be the ultimate capacity of the overhang for resisting
vertical loads
44
(a) Central side of slab (b) Exterior side of slab
Figure 40 Cracking observed at ultimate capacity- side view of deck
The top surface of the deck slab after failure of the specimen can be observed in Figure 41 and
the cracking due to the interfacial failure between the FRP strips and the concrete can be
observed in the in the upper left hand corner of Figure 41 adjacent to the loading beam
Figure 41 Cracking of deck slab at ultimate capacity- top view of deck
After the loading of the specimen was completed all testing equipment and instrumentation was
fully removed to allow for easier observation of the damage present on the specimen Figure 42
shows the top view of the deck at ultimate capacity Any loose concrete was removed in order
to better observe the failure surfaces however unlike the as-built specimen in which significant
loose concrete was removed after it was tested nearly all of the concrete remained attached to
the tested FRP rehabilitated specimen despite the interfacial failure that occurred between the
FRP and the concrete Note that the debonding of the CFRP strips from the concrete occurred
adjacent to where the tensile stresses on the top of the deck are maximum while the CFRP strips
remained attached for the majority of the of the slab overhang
45
Figure 42 Side view of tested FRP rehabilitated specimen after removal of loose concrete
As observed in Figure 43 the three linear potentiometers directly below the loading beam
maintained comparable deflections throughout the loading range applied to the test specimen At
the failure load for the specimen the deflections of these three linear potentiometers were within
10 of each other which corresponds to less than 1 mm (004 in) difference in deflection values
46
80
140
10220 Ultimate Capacity Ultimate Capacity B4200 9 4th cracks
observed 4th cracks observed 180 8
M43rd cracks 160 3rd cracks 7observed
Load
per
hyd
raul
ic ja
ck (k
N)
Def
lect
ion
(mm
) observed 2nd cracks observed B4
120 1st cracks M4
100 observed A4
A46 2nd cracks
5 observed 1st cracks 4 observed B4B4 3
M460 2M4 A440
20 A4 1
0 0
0 2 4 6 8 10 24 60 84 116 136 160 172 184 196 Deflection (mm) Load per hydralulic jack (kN)
(a) Load versus deflection profiles (b) Comparison of linear potentiometers below loading beam
Figure 43 Comparisons of deflections at the edge of the deck slab overhang
The profiles along the center of the specimen (Figure 45) and at both edges (Figure 44 and
Figure 46) shown below exhibit similar deflection profiles throughout the loading range
0 24 kN Location of linear potentiometers
Distance from edge (mm) 60 kN 2 84 kN
B3 B4B1 B2 BB
Def
lect
ion
(mm
)
116 kN 4
136 kN
160 kN 6
8 184 kN 76
279 610 196 kN 101524 B1 B2 B3 B4
Linear Potentiometer Designation
Figure 44 Deflection profile along the central edge of specimen (Line B)
47
Location of linear potentiometers 0 24 kN Distance from edge (mm)
279 610
1524
76
M1 M2 M3 M4
60 kN 2 84 kN
M1 M2 M3 M4 Linear Potentiometer Designation
MM
Def
lect
ion
(mm
) 116 kN 4
136 kN
160 kN 6
184 kN 8
196 kN
10
Figure 45 Deflection profile along center of specimen (Line M)
0Location of linear potentiometers 24 kN Distance from edge (mm)
60 kN 2
84 kN
A1 A2 A3 A4 Linear Potentiometer Designation
279 610
1524
76
A1 A2 A3 A4 AA
Def
lect
ion
(mm
)
116 kN
136 kN
6
4
160 kN
8 184 kN
196 kN 10
Figure 46 Deflection profile along the outer edge of specimen (Line A)
The deflection profiles shown in Figure 47 and Figure 48 also indicate comparable deflections
along the overhang at a distance midway to the adjacent stem wall and directly below the point
of load application respectively
48
0 24 kN 60 kN 84 kN Location of linear potentiometers 116 kN 2Distance from edge (mm)
136 kN 160 kN
A3 M3 B3 Linear Potentiometer Designation
Def
lect
ion
(mm
)
3 184 kN 4 196 kN
8
10
838
152
1524
3
A3
M3
B3
Figure 47 Deflections midway along overhang (Line 3)
6
0
2
4
6
8
10
Def
lect
ion
(mm
)
84 kN 60 kN 24 kN
196 kN
184 kN
116 kN
136 kN
160 kN
A4 M4 B4
Location of linear potentiometers Distance from edge (mm)
838
152
1524
4
4
A4
M4
B4
Linear Potentiometer Designation
Figure 48 Deflections directly below loading beam (Line 4)
The strains in the FRP strips are also examined throughout the NSM CFRP rehabilitated
specimen The strain profiles along the edges and the middle of the specimen are shown in
Figure 49 Figure 50 and Figure 51 respectively These strain profiles indicate that the
maximum strain in the CFRP strips occurs directly above the edge of the stem wall adjacent to
the deck slab overhang referred to with the designation ldquoline Brdquo At ultimate capacity the
maximum strain in the specimen of 3846 microstrains occurs in strain gage 4B which is located
in line B near the middle of the specimen overhang
49
4000
Location of strain gages 3500 (See Figure for detailed schematic)
196 kN 3000
Stra
ins (
mic
rost
rain
s) 184 kN 9G 9F 9E 9D 9C 9B 160 kN9 9 2500
2000
1500
1000 60 kN
500 24 kN 0
136 kN 116 kN
84 kN
(Note Vertical gridlines in figure are -500 positioned at a spacing of 3048 mm (1 ft) 9G 9F 9E 9D 9C 9B Strain Gage Designation
Figure 49 Strain profile along the central edge of specimen (Line 9)
4000 196 kN
3500 184 kN (See Figure for detailed schematic)
Location of strain gages
3000 160 kN136 kN
Stra
ins (
mic
rost
rain
s)
2500
2000
1500
1000 60 kN 500 24 kN
0 (Note Vertical gridlines in figure are
-500 positioned at a spacing of 3048 mm (1 ft) 5G 5F 5E 5D 5C 5B 5A Strain Gage Designation
Figure 50 Strain profile along the middle of specimen (Line 5)
4000 Location of strain gages
(See Figure for detailed schematic) 3500 196 kN
116 kN
5G 5F 5E 5D 5C 5B 5A 5 84 kN 5
Stra
ins (
mic
rost
rain
s) 3000
2500
2000
1500
1000
1 500 24 kN
184 kN
160 kN136 kN 116 kN
84 kN
60 kN 1G 1F 1E 1D 1C 1B 1A 1
0(Note Vertical gridlines in figure are positioned at a spacing of 3048 mm (1 ft))
-500 1G 1F 1E 1D 1C 1B 1A
Strain Gage Designation
Figure 51 Strain profile along the outer edge of specimen (Line 1)
50
The strains drop off sharply for distances further away from the end of the overhang with the
majority of the strain gages on the opposite side of the stem wall (line C) exhibiting less than a
third of the strain values shown in line B The sharp drop in strain values at distances away from
the adjacent stem wall and the insignificant strains within these regions indicate that the
significantly shorter lengths of CFRP strips could be used to optimize material usage and
improve constructability without affecting load transfer and the overall system response
The strains along line B the location where the maximum strains occur in the specimen is shown
in Figure 52 This figure indicates that the distribution of strains was even along the specimen
until the load level of 116 kN (26 kip) per jack was reached At this level cracking was first
observed on the specimen and higher loading levels showed comparable but slightly less uniform
strains along the specimen The average strain along line B in the specimen at ultimate capacity
was 3423 microstrains whereas the minimum and maximum strains along line B were 2943
microstrains and 3846 microstrains respectively
4000
Location of strain gages 3500(See Figure for detailed schematic)
1B 3B 4B 5B 6B 7B 8B 9B Strain Gage Designation
Stra
ins (
mic
rost
rain
s) 3000 196 kN B 184 kN
160 kN 2500
1B
4B 3B
5B
9B 8B 7B 6B
B
136 kN 2000 116 kN
1500 84 kN
1000 60 kN
500
24 kN 0
(Note Vertical gridlines in figure are positioned at a spacing of 3048 mm (1 ft))
Figure 52 Strains along the edge of the stem wall adjacent to the deck slab overhang (Line B)
Using the strain data throughout the specimen and following a procedure described by Siem et al
[24] the shear stress between the concrete and the CFRP strips were calculated using the
following equation
51
9
(ε minus ε )sdot E sdot tn+1 n L Lτ nn+1 = (11)(x minus x )n+1 n
Where (x minus x )= distance between two strain gages EL= the tensile elastic modulus of then+1 n
CFRP strip and tL = thickness of the CFRP strips For these calculations EL= 1381 GPa (2005
Msi) and tL = 12 mm (0047 in) were used for the CFRP strips The calculated shear stress
values within the adhesive are simply the mean value between two strain gages which ignore
localized stress peaks and gradients
Distance from west edge (m) 27 24 21 18 15 12 09 06 03 00
Location of strain gages 20 (See Figure for detailed schematic)
15
196 kN
116 kN 160 kN
9B9G 9F 9E 9D 9C
(Note Vertical gridlines in figure are positioned at a spacing of 3048 mm (1 ft)
9
Stre
ss (M
Pa) 10
05
00
-05
-10
-15
-20
Figure 53 Calculated shear stress within adhesive along the central edge of specimen (Line 9)
Distance from west edge(m) 27 24 21 18 15 12 09 06 03 00
Location of strain gages (See Figure for detailed schematic) 20
196 kN
116 kN
160 kN
5 00
(Note Vertical gridlines in figure are positioned at a spacing of 3048 mm (1 ft)
3B5G 5F 5E 5A5D 5C
Stre
ss (M
Pa)
15
10
05
-05
-10
-15
-20
Figure 54 Calculated shear stress within adhesive along the middle of specimen (Line 5)
52
5
Distance from west edge(m) 27 24 21 18 15 12 09 06 03 00
Location of strain gages 20 (See Figure for detailed schematic)
196 kN
116 kN 160 kN
Stre
ss (M
Pa) 15
10
05
00
-05 3
(Note Vertical gridlines in figure are positioned at a spacing of 3048 mm (1 ft)
3B3G 3F 3E 3D 3C 3A 3
-10
-15
-20
Figure 55 Calculated shear stress within adhesive along an interior CFRP strip (Line 3)
Distance from west edge (m) 27 24 21 18 15 12 09 06 03 00
Location of strain gages 20 (See Figure for detailed schematic)
-20
196 kN
116 kN 160 kN
Stre
ss (M
Pa)
15
10
05
00
-05
-10
-15
1G 1F 1E 1D 1B1C 1A 11
(Note Vertical gridlines in figure are positioned at a spacing of 3048 mm (1 ft))
1G 1F 1E 1D 1C 1B 1A Strain Gage Designation
Figure 56 Calculated shear stress within adhesive along the outer edge of specimen (Line 1)
53
After the testing of the NSM CFRP rehabilitated specimen was completed the overhang of the
specimen was cut off and carefully removed from the rest of the test specimen as shown in
Figure 57 to allow for further examination of this critical region
432 mm (17 in)
Figure 57 Location of cut for removal of FRP rehabilitated overhang from test specimen
One point of interest to examine on the removed overhang was the actual location of the CFRP
strip reinforcement within the section Figure 58 shows that the actual embedment depth of the
near surface mounted CFRP strips was approximately 6 mm (025
in) and the actual thickness of the SikaDur 30 resin layer used to
bond the CFRP strips to the concrete was also approximately 6 mm
(025 mm) An embedment depth of 6 mm (025 in) is reasonable
for NSM applications because it allows enough space for an
adequate top surface of resin which will serve as environmental
protection and the wear surface for the deck However the 6 mm
(025 mm) thickness of the SikaDur 30 bottom resin layer exceeded
the maximum manufacturer recommended value of 3 mm (18
inch) While the current system performed very well the use of an
overly thick resin layer could have had an negative effect on the
overall structural response of the system Figure 58 Detail showing actual location of reinforcement
Figure 59 shows the failure surface of an FRP strip which has been detached from the top
surface of the deck The center portion of the strip with the firmly attached concrete was the
region in which the interfacial failure in the concrete occurred while the outer sections of the
strip were neatly detached from the resin system due to the method of removal of the strip
54
Figure 59 Detail of failure surface of FRP strip
58 Comparison with Theory
The NSM CFRP rehabilitated specimen reached ultimate capacity under an applied load of 196
kN (44 kip) per hydraulic jack which is equivalent to an applied moment of 1892 kN-m (1392
kip-ft) This improved performance corresponds to a 72 increase in ultimate capacity over the
as-built specimen which failed under an applied load of 114 kN (26 kip) corresponding to an
applied moment of 1100 kN-m (810 kip-ft) The ACI 440-02 calculation for externally bonded
FRP reinforcement predicted a maximum moment capacity of 1660 kN-m (1224 kip-ft) which
corresponds to a 51 increase in load carrying capacity over the experimentally determined
capacity of the as-built specimen The moment curvature analysis predicted a maximum moment
capacity of 1855 kN-m (1364 kip-ft) which corresponds to a 69 increase in load carrying
capacity over the as-built specimen The theoretical predictions and experimental results were
within 12 using the ACI 440 approach and were in close agreement with only a 2 error
using the moment curvature analysis The larger disagreement with experimental data found
from the ACI 440 moment capacity increase equation likely exists because this calculation is a
more simplified approach that does not take into account the over strength of the steel
reinforcement
55
3rd cracks observed
1st cracks observed
200
220
59 Comparison with As-Built
The ultimate capacity of the near surface mounted CFRP strip rehabilitated slab was reached at
an applied load of 196 kN (44 kips) equivalent to a uniform distributed load of 245 kNm (168
kipft) which is 11x the nominal soundwall load This ultimate capacity is 78 greater than that
obtained by the as-built specimen which occurred at 114 kN (26 kips) per hydraulic jack
equivalent to a uniform distributed load of 1425 kNm (98 kipft) which is 633x the nominal
wall load The center deflections under the loading beam for both specimens over the complete
loading ranges applied are compared in Figure 60(a) and Figure 60(b) At the failure load level
of the as-built specimen the as-built specimen had a center deflection under the loading beam of
636 mm (025 in) whereas the FRP rehabilitated specimen deflected approximately half that of
the as-built specimen or 333 mm (013 in) At ultimate capacity of the FRP rehabilitated
specimen the center deflection under the loading beam was 873 mm (034 in) which indicates
the rehabilitated specimen exhibited a 318 increase in deformation capacity over the as-built
specimen
10
0 2 4 6 8 10
Ultimate Capacity
1st cracks observed
2nd cracks observed
4th cracks observed
As-built test
3rd cracks observed
2nd cracks observed 1st cracks observed
Ultimate Capacity
Rehabilitated test
Def
lect
ion
(mm
)
6
5
4
360
240 120
0 0
Deflection (mm) Load per hydralulic jack (kN)
As-built specimenRehabilitated specimen
Ultimate Capacity
Ultimate Capacity
24 36 48 60 72 84 96 102 114 136 160 184 196
9
180
Load
per
hyd
raul
ic ja
ck (k
N) 8
160 7 140
120
100
80
a) Load versus deflection profiles (b) Comparison of linear potentiometers below loading beam
Figure 60 Comparisons of middle center deflections of the deck slab overhang
In addition to increasing the overall load and deformation capacity of the system the near
surface mounted CFRP strips act to increase the stiffness and improve the stability of the system
56
The load versus deflection profile shown in Figure 60(a) shows the significantly increased
stiffness and more linear profile for the FRP rehabilitated specimen over the as-built specimen
The deflection profile comparison at the 114 kN (26 kips) per jack load level along the middle of
the two slabs is shown in Figure 61 This figure illustrates that for the same load level the
deflections within the FRP rehabilitated specimen are lower than the deflections of the as-built
specimen throughout the deck slab and not just at the point of load application
Location of linear potentiometers 0 Distance from edge (mm)
279 610
1524
76
M1 M2 M3 M4
2
4
M M
6
8
10
FRP rehabilited specimen at 114 kN per jack
As-built specimen at 114 kN per jack
M1 M2 M3 M4 Linear Potentiometer Designation
Figure 61 Comparison of deflection profiles along center of specimens (Line M)
The first set cracking observed on the as-built specimen occurred at the load level of 84 kN (19
kip) whereas the first set cracking observed on the FRP rehabilitated specimen occurred at 116
kN (26 kip) which is corresponds to a 38 greater load A comparison of the deflection profiles
along the center of the specimens at these loading levels shown in Figure 62 reveals nearly
identical deformations for the two specimens
57
10
10
M1
1524
279 610
76
M2 M3 M4
Location of linear potentiometers Distance from edge (mm)
FRP rehabilited specimen at 1st observed cracking
(116 kN per jack)
0
2 As-built specimen
at 1st observed cracking (84 kN per jack) 4
M
Def
lect
ion
(mm
)
M
6
8
M1 M2 M3 M4 Linear Potentiometer Designation
Figure 62 Comparison of center deflection profiles at 1st observed cracking loads (Line M)
The second set of cracking observed on the as-built specimen occurred at the load level of 101
kN (23 kip) whereas the second set of cracking observed on the FRP rehabilitated specimen
occurred at 136 kN (31 kip) which is corresponds to a 35 greater load The deflection profile
comparison at the load levels where the second set of cracking was observed in Figure 64 also
exhibits nearly identical deformations for the two specimens This indicates that while the FRP
reinforcement acts to stiffen the system and increase the load carrying capacity of the overhang
region the shape of the deflection response profile of the system is not modified significantly
with the addition of the CFRP strips
0FRP rehabilited specimen at 2nd observed cracking
(136 kN per jack)
As-built specimen at 2nd observed cracking
(101 kN per jack)
Location of linear potentiometers Distance from edge (mm)
279 610
1524
76
M M1 M2 M3 M4
2
4
Def
lect
ion
(mm
)
M
6
8
M1 M2 M3 M4 Linear Potentiometer Designation
Figure 63 Comparison of center deflection profiles at 2nd observed cracking loads (Line M)
58
Figure 64 shows the side by side top decks of the two specimens after testing has been completed
and all loose concrete on the top deck removed Details of the critical region of the as-built and
FRP rehabilitated top deck are shown in Figure 65 and Figure 66 respectively
Figure 64 Top view of deck slab tested to ultimate capacity after removal of loose concrete
59
For the as-built specimen extensive damage and spalling of the concrete on the top of the deck
slab was seen Yielding in the transverse steel reinforcement followed by loss of aggregate
interlock resulting in failure was observed
Figure 65 Detail of cracking observed at ultimate capacity- top view of as-built deck
For the FRP rehabilitated specimen negligible spalled concrete and loose concrete rubble was
detected A concrete splitting failure mode was observed in the FRP rehabilitated specimen
Figure 66 Detail of cracking observed at ultimate capacity- top view of FRP rehabilitated deck
60
6 SUMMARY OF RESULTS AND RECOMMENDATIONS FOR FUTURE RESEARCH
Experimental results from the testing of the rehabilitated specimen indicate that the NSMR
strengthening scheme was successful at achieving the desired load carrying capacity increase
The ultimate load carrying capacity of the FRP rehabilitated specimen was 196 kN (44 kips) per
hydraulic jack which was 78 higher that the ultimate load of the as- built specimen of 114 kN
(26 kips) per hydraulic jack This value well exceeded the desired load capacity increase of
297 above the experimentally determined capacity of the as-built specimen exhibited a very
stable structural response and increased the deformation capacity of the system The theoretical
moment capacity predictions for the as-built specimen were within 11 and 65 of the
experimentally determined value using ACI 318 and moment curvature analysis respectively
The theoretical moment capacity predictions for the FRP rehabilitated specimen were within
12 of the experimental value using the modified ACI 440-02 approach and were within 2
using moment curvature analysis
The NSM FRP rehabilitated specimen exhibits a variety of structural performance improvements
over the as-built specimen including increased ultimate load carrying capacity enhanced
deformation capacity and more stable overall structural performance Design options for the
near surface mounted CFRP strengthening schemes allow for great flexibility in terms of
tailoring the reinforcement parameters for specific applications With consideration of the
minimal disruption to traffic flow and ease of installation this system is a viable and very
attractive rehabilitation option for bridge deck slab overhangs
The purpose of Phase 1 was to conduct an experimental analysis of the use of NSM for purposes
of strengthening and to provide the basis for the planning of Phase 2 as detailed in the initial
proposal submitted to Caltrans Based on the extensive literature review already conducted
(although according to the project funding provided by Caltrans is to be completed and reported
on in Phase 2) and on the experimental results the following aspects are recommended for further
study in Phase 2
61
bull Complete review of the failure modes and mechanisms seen with use of barsrods as
compared to flat strips for purposes of documenting advantages of strips It is noted that
a very brief summary is given in the introductory portion of this report
bull Optimization of groove dimensions and spacing for NSM use through both analytical and
experimental study
bull Study of adhesive rheology and bond quality as well as durability
bull Study of minimum development length and effect of insertion into girder stems
bull Study of use for specific strengthening applications
bull Development of design guide for Caltrans and development of example comparing NSM
use to surface bonding
It is emphasized that the studies should be conducted on specimens of sufficient size since small
scale tests are likely to provide erroneous results due to effects of scale and configuration It is
recommended that these tests only be conducted after a review of advances in Europe and
Australia are completed and sufficient analytical work is completed on optimization of grove
dimensions and spacing Since the efficacy of the method is intrinsically related to the ability of
the adhesive to not only bond the reinforcement to the concrete substrate but to also enable
efficient stress transfer study also needs to be conducted on adhesive rheology performance
characteristics and cure It is recommended that this be based on the completed durability study
which should provide a base-line for further study Also since it is likely that the NSM will be
covered by asphalt the effect of heat due to asphalt on the adhesive and bond should also be
studied
62
7 REFERENCES
[1] VM Karbhari and L Zhao ldquoUse of composites for 21st century civil infrastructurerdquo
Computer Method Appl Mech Eng 185 pp 433ndash454 (2000)
[2] S Rizkalla T Hassan N Hassan ldquoDesign recommendations for the use of FRP for
strengthening of concrete structuresrdquo Prog Struct Engng Mater 5 pp 16ndash28 (2003)
[3] K K Ghosh ldquoAssessment of FRP composite strengthened reinforced concrete bridge
structures at the component and systems level through progressive damage and nonshy
destructive evaluation (NDE) [PhD dissertation] University of California San Diego
(2006)
[4] L De Lorenzis JG Teng ldquoNear-surface mounted FRP reinforcement An emerging
technique for strengthening structuresrdquo Composites Part B 38 pp 119-143 (2007)
[5] R Parretti A Nanni ldquoStrengthening of RC Members Using Near-Surface Mounted FRP
Composites Design Overviewrdquo Advances in Structural Engineering 7 5 pp 1-16 (2004)
[6] J R Yost S P Gross D W Dinehart and J J Mildenberg ldquoFlexural Behavior of
Concrete Beams Strengthened with Near-Surface-Mounted CFRP Stripsrdquo ACI Structural
Journal July-August pp 430-437(2007)
[7] L A DeLorenzis A Nanni and A L Tegila ldquoFlexural and Shear Strengthening of
Reinforced Concrete Structures with Near Surface Mounted FRP Barsrdquo Proceedings of the
3rd International Conference on Advanced Composite Materials in Bridges and Structures
Ottawa Canada Aug 15-18 pp 521-528 (2000)
[8] El-Hacha R and Rizkalla S 2004 ldquoNear-Surface-Mounted Fiber- Reinforced Polymer
Reinforcements for Flexural Strengthening of Concrete Structuresrdquo ACI Structural Journal
V 101 V 5 Sept-Oct pp 717-726
[9] R Parretti and A Nanni ldquoStrengthening of RC Members Using Near-Surface Mounted
FRP Composites Design Overviewrdquo Advances in Structural Engineering V 7 (5) (2004)
63
[10] E Bonaldo J A Oliveira de Barros and P B Lourenccedilo ldquoEfficient Strengthening
Technique to Increase the Flexural Resistance of Existing RC Slabsrdquo ASCE Journal of
Composites for Construction MarchApril pp149-159 (2008)
[11] The Concrete Society Design Guidance for Strengthening Concrete Structures using Fibre
Composite Materials Concrete Society Technical Report 55 2nd Edition (2004)
[12] ACI Committee 440 Guide for the Design and Construction of Externally Bonded FRP
Systems for Strengthening Concrete Structures ACI 4402 R-02 (2002)
[13] Canadian Standards Association Canadian Highway Bridge Design Code- Section 16
Fibre-Reinforced Structures (2006)
[14] AASHTO LRFD bridge design specifications 3rd Ed AASHTO Washington DC
(2004)
[15] A B Pridmore V M Karbhari ldquoEvaluation of Prefabricated FRP Structural Formwork
Bridge Deck Systemsrdquo SAMPE 53rd International Technical Conference (2008)
[16] Caltrans ldquoMemo to Designers 22-1 Soundwall Design Criteriardquo (2004)
[17] ACI 318-08 Building Code Requirements for Structural Concrete (2008)
[18] Caltrans Bridge Design Specifications Section 8- Reinforced Concrete (2003)
[19] Bentz E and Collins M P lsquolsquoRESPONSE-2000mdashReinforced Concrete Section al Analysis
using the Modified Compression Field Theoryrdquo Version 105 Toronto Canada (2000)
[20] Caltrans ldquoMemo to Designers 22-1 Soundwall Design Criteriardquo (2004)
[21] Sika Corporation Product Data Sheet for Sika CarboDur Rods- carbon fiber rods for
structural strengthening Edition 9 (2003)
[22] Sika Corporation Product Data Sheet for Sika CarboDur- Carbon fiber laminate for
structural strengthening Edition 722 (2005)
[23] Hughes Brothers Inc Product data sheet for Aslan 500- CFRP tape wwwhughesbroscom
(2002)
64
[24] W Seim Y Vasquez VM Karbhari and F Seible ldquoPost-Strengthening of Concrete
Slabs Full Scale Testing and Design Recommendationrdquo ASCE Journal of Structural
Engineering 129[6] pp 743-752 (2003)
[25] W Seim M Hormann VM Karbhari and F Seible External FRP Poststrengthening of
Scaled Concrete Slabs ASCE Journal of Composites in Construction 5[2] pp 67-75
(2001)
[26] Sika Europe- German Institute of Construction Technology 1998
[27] International Concrete Repair Institute ICRI Guideline No 037324 ldquoSelecting and
Specifying Concrete Surface Preparation for Sealers Coatings and Polymer Overlaysrdquo
(1997)
[28] S J Jin ldquoStatistical Characterization of Prefabricated FRP Composite Materials for
Rehabilitation of Concrete Structuresrdquo Master Thesis Department of Structural
Engineering University of California San Diego (2008)
[29] Sika Corporation ldquoCarboDur Installation Guiderdquo Sika construction documents
65

⎛⎜⎝
a ⎞⎟⎠
M =As f d minus (5)n y 2
where As is the area of steel reinforcement in the direction perpendicular to traffic flow f y is the
yield strength of the slab steel d is the distance from the compression fiber to the centroid of the
tensile reinforcement and a is the depth of the equivalent rectangular compression stress block
This equation yields a total moment capacity of 970 kN-m (716 kip-ft)
The equivalent force applied through the loading beam can be obtained by dividing the moment
by the distance between the applied load and the edge of the stem also known as the moment
arm The equivalent applied force per hydraulic jack was 101 kN (23 kip) Since this capacity
value is lower than the computed shear capacity it is predicted that flexural damage will be
govern the performance of the slab
The moment capacity of the specimen was also found from the moment-curvature response
obtained by computer program (RESPONSE 2000) to be 1172 kN-m (856 kip-ft) This
corresponds to a maximum load per hydraulic jack of 122 kN (275 kip) [19] The moment
curvature response of the as-built reinforced concrete deck slab is shown below
140
120
100
0 50 100 150 200 250
Mom
ent
(kN
-m)
80
60
40
20
0
Curvature (10-3 radm)
Figure 10 Moment-curvature response for as-built specimen [19]
14
43 Instrumentation
The total instrumentation for this experiment consisted of 16 linear potentiometers and 2 load
cells One central row and two outer rows each with four linear potentiometers were used to
measure the vertical deflection of the deck slab The four linear potentiometers within each row
were positioned at the midspan of the adjacent cell above the adjacent stem in between the stem
and the loading beam and directly below the loading beam as shown in Figures 11(a) and (b)
Elastomeric Bearing Pad
Linear Potentiometers
1 2 3 4 A
B
M
76
CL
CL
2438 1524
610 279
152
838
1524
1676
1829
(a) Plan view of specimen (b) Section of deck slab with linear potentiometer details Figure 11 Position of linear potentiometers for measuring deflections of deck slab (Note not to
scale)
The deflection of the elastomeric bearing pad was measured using four linear potentiometers
with one linear potentiometer at each corner of the loading beam as shown in Figure 12
15
2438
152
CL
152
1524
1676
1829
CL
(a) Instrumentation detailing for bearing pad (b) Representative linear potentiometer
Figure 12 Position of linear potentiometers for measuring compression of bearing pad
44 Loading Protocol
In addition to the test setup described in Section 31 a 64 mm (2frac12 in) diameter hole was drilled
through the deck of the specimen at a distance 76 mm (3 in) by 76 mm (3 in) on center away
from the corner of the deck as shown in Figure 13 in order to accommodate the spacing
constraints imposed by the testing setup
Elastomeric Bearing Pad
Linear Potentiometers
1600 mm 76229 1829 mm
Threaded rods Loading beam
Bearing pad Concrete deck
Figure 13 Specific test setup schematic for as-built specimen
The overhang of the deck slab was tested by incrementally increasing the hydraulic pressure
supplied to the two hydraulic jacks which loaded the overhang through the test setup shown in
16
Figure 13 Adequate time was taken between loading levels to ensure that the hydraulic pressure
had stabilized and the pressure had equalized as much as possible between the two jacks The
load applied to the deck slab was monotonically increased following the loading sequence shown
in Table 1 The load was held briefly at each load level so that observations could be made at
each stage
Loading step
Load per hydraulic
jack
Equivalent uniform
distributed load Load level Notes
(kN) (kip) (kNm) (kipft) 1 24 5 300 21 --- Initial load 2 36 8 450 31 2x wall load ---3 48 11 600 41 --- ---4 60 13 750 51 --- ---5 72 16 900 62 4x wall load ---6 84 19 1050 72 --- 1st set of cracks observed 7 90 20 1125 77 5x wall load ---8 96 22 1200 82 --- ---9 102 23 1263 87 Calculated moment capacity 2nd set of cracks observed
10 114 26 1425 98 633x wall load Ultimate Capacity --- 116 26 1450 99 Calculated shear capacity ---
Table 1 Loading protocol for as-built test specimen
17
45 Experimental Results
The ultimate capacity of the slab was reached at an applied load of 114 kN (26 kips) per
hydraulic jack equivalent to a uniform distributed load of 1425 kNm (98 kipft) which is
633x the nominal wall load Note that the additional load carrying capacity of the deck slab
overhang beyond the dead load of a single sound barrier is necessary to resist lateral loading As
the loading of the edge of the slab was increased the top layer of transverse reinforcement above
the outer edge of the stem yielded followed by loss of aggregate interlock resulting in failure
The deflection of the middle of the slab directly under the loading beam when the system was
loaded to ultimate capacity was 636 mm (025 in)
As a baseline Figure 14 shows the specimen prior to testing The markings on the top of the
deck in this figure show preexisting hairline cracks in the deck
Figure 14 Deck slab prior to experimental testing
Cracking was first observed on the top side of the deck at the 84 kN (19 kip) load per jack and
were marked on the specimen in dark blue ink The thin cracking on the top of the deck surface
was discontinuous and approximately followed the two top longitudinal steel reinforcement bars
adjacent to the edge of the stem wall as shown in Figure 15
18
Figure 15 Initial craking of deck slab at 84kN (19 kip) per jack- top view of deck
Minor diagonal cracks along both the central and the exterior edge of the deck slab were also
observed at this load level as seen in Figure 16 Small diagonal cracks initiating on the top
surface of the deck observed at each end of the specimen are shown in Figures 16(a) and (b)
(a) Detail of central edge of slab (b) Detail of exterior edge of slab
Figure 16 Initial cracking of deck slab at 84kN (19 kip) per jack - side view of deck
Additional opening of small cracks was observed at the load level of 102 kN (23 kip) per jack
and these cracks were marked with red ink as shown in Figure 17 The cracks that followed the
two top longitudinal bars opened further and became continuous over the majority of the
specimen Additional cracks going across the width of the specimen formed on the top of the
slab as seen in Figure 17
19
Figure 17 Crack marking of deck slab at 102 kN (23 kip) per jack- top view of deck
When the load level of 114 kN (26 kip) per jack was reached a large diagonal crack opened and
quickly propagated which was clearly visible on the central edge of the slab as shown in Figure
18(a) This load level was determined to be the ultimate capacity of the overhang for resisting
vertical loads
(a) Central side of slab (b) Exterior side of slab
Figure 18 Cracking observed at ultimate capacity- side view of deck
The cracking progressed rapidly along the top surface of the deck as shown in Figure 19 and the
concrete adjacent to the loading beam settled several millimeters as seen in Figure 20
20
Figure 19 Cracking observed at ultimate capacity- top view deck
Figure 20 Detail of cracking at ultimate capacity in central section of deck near loading beam
After the loading of the specimen was completed all testing equipment and instrumentation was
fully removed and the observed cracks were marked in orange ink The orange diagonal cracks
on the top surface of the deck face toward the hole in the deck as shown in the upper left-hand
corner of Figure 21
Figure 21 Cracks observed on top of slab tested to ultimate capacity
The loose concrete was then removed in order to better observe the failure surfaces as shown in
Figure 22 and Figure 23 Increased damage was present on the central side of the deck as
compared to the exterior side
21
Figure 22 Top view of deck slab tested to ultimate capacity after removal of loose concrete
In Figure 23(b) the slight deformation in the rebar due to the yielding of the steel is observed It
is also noted that the concrete remained firmly attached beyond the longitudinal rebar
(a) Edge of deck prior to loose concrete removal (b) After removal
Figure 23 Detail of most severely damage section
The primary variables in defining the overall structural response of the bridge deck slab are the
load per hydraulic jack at which significant damage or failure occurred and the corresponding
center deflection of the slab directly below the actuator Additional instrumentation serves to
add supplementary data regarding the deformation of the specimen during testing As observed
in Figure 24 the deflection of the three linear potentiometers directly below the loading beam
indicate comparable deflections for lower loading levels and higher deflections with increasing
load at the central edge of the overhang which contains linear potentiometer B4
22
20
40
60
80
100
120
140 10
9
8
0 2 4 6 8 10 Deflection (mm)
A4
B4
M4
A4 B4M4
1st cracks observed
2nd cracks observed
Ultimate Capacity
Def
lect
ion
(mm
)
A4 M4 B4
A4
B4
M4
2nd cracks observed
1st cracks observed
Ultimate Capacity
Load
per
hyd
raul
ic ja
ck (k
N)
7
6
5
4
3
2
1
00 24 36 48 60 72 84 96 102 114
Load Level (kNhydraulic jack)
(a) Load versus deflection profiles (b) Comparison of linear potentiometers below loading beam
Figure 24 Comparisons of deflections at the edge of the deck slab overhang
At the load level of 84 kN (19 kips) per hydraulic jack where cracking in the deck was first
observed equivalent to a uniform distributed dead load of 105 kNm (72 kipft) or
approximately 5x the nominal wall load linear potentiometers A4 and M4 deflected similarly
while the linear potentiometer B4 exhibited a 13 mm (0051 in) or 37 greater deflection value
At the load level of 102 kN (23 kip) per hydraulic jack where the 2nd set of crack marking took
place equivalent to a uniform distributed dead load of 126 kNm (87 kipft) or nearly 6x the
nominal wall load the deflection at B4 was 20 mm (0078 in) or 39 greater than the other two
linear potentiometers The difference is due to levels of cracking The profiles along the center
of the specimen (Figure 26) and at both edges (Figures 25 and 27) shown below exhibit similar
deflection profiles and indicate that negligible vertical deformations occur in the deck beyond the
adjacent stem wall due to edge loading of the deck slab overhang
23
0 0 kN Location of linear potentiometers
24 kNDistance from edge (mm)
Def
lect
ion
(mm
)
2 60 kN
84 kN 4
102 kN
114 kN 6
8
76 279
610 1524
A1 A2 A3 A4AA
10
Figure 25 Deflection profile along the outer edge of specimen (Line A)
0 kNLocation of linear potentiometers 0 Distance from edge (mm) 24 kN
A1 A2 A3 A4 Linear Potentiometer Designation
M1 M2 M3 M4 Linear Potentiometer Designation
76 279
610 1524
M1 M2 M3 M4 MM
8
10
Figure 26 Deflection profile along center of specimen (Line M)
0
60 kN
84 kN
2
4 102 kN
6 114 kN
Def
lect
ion
(mm
)
B1 B2 B3 B4 Linear Potentiometer Designation
0 kN Location of linear potentiometers 24 kNDistance from edge (mm)
76 279
610 1524
B1 B2 B3 B4114 kNBB
10
Figure 27 Deflection profile along the central edge of specimen (Line B)
2 60 kN
4
84 kN
6 102 kN
8
Def
lect
ion
(mm
)
24
The deflection profile shown in Figure 28 shows comparable deflections along the overhang at a
distance midway to the adjacent stem wall Figure 29 illustrates comparable deflections directly
below the point of load application along the overhang for lower load levels with less symmetric
deformations observed for higher load levels after cracking was observed throughout the
specimen Through a comparison of these figures the results indicate a symmetric structural
response for load levels prior to the initial observation of cracking in the specimen and greater
deflections on one side at higher loading levels
0 0 kN 24 kN
Location of linear potentiometers Distance from edge (mm) 2 84 kN
60 kN
3 102 kN
838
152
1524
3
B3
M3
A3D
efle
ctio
n (m
m) 114 kN
4
6
8
10 B3 M3 A3
Linear Potentiometer Designation
Figure 28 Deflections midway along overhang (Line 3)
0 0 kN
24 kN Location of linear potentiometers
Distance from edge (mm) 2 60 kN 4
838
152
1524
4
B4
M4
A4
Def
lect
ion
(mm
)
84 kN 4 102 kN
114 kN 6
8
10 B4 M4 A4
Linear Potentiometer Designation
Figure 29 Deflections directly below loading beam (Line 4)
25
46 Comparison with Theory
The max moment found via moment curvature analysis of 1172 kN-m (856 kip-ft) was within
65 of the actual moment applied to the structure at the max loading of 114 kN (26 kip) per
hydraulic jack which corresponds to an applied moment of 1100 kN-m (810 kip-ft) The
moment capacity estimate of 970 kN-m (716 kip-ft) determined using the ACI 318-08
prescribed equation was off from the experimentally determined moment capacity by 118
26
5 REHABILITATED TEST
The following section presents NSM FRP strengthening design options for achieving the desired
capacity increase and describes the implementation testing and analysis of the chosen
rehabilitation design
51 Calculations for Potential CFRP NSM Strengthening Schemes
The increased moment demand on the test specimenrsquos deck slab due to the addition of the
soundwall is calculated and this value is used as the basis for determining the desired capacity
increase The corresponding total area of NSM CFRP needed to achieve the desired moment
capacity increase is calculated and design options for five different available CFRP
reinforcement products are presented
The dead weight of a typical sound wall used for bridges in California was calculated from the
Caltransrsquo concrete masonry soundwall design on bridges [20] Using this design with normal
weight concrete the gravity load per unit length for the soundwall was determined to be 135
kNm (092 kipft) Note that the weight of the traffic barrier is not included as part of the
increased moment demand calculation because it is assumed that the weight of the traffic barrier
was already accounted for in the original design of the deck slab overhang The tested section of
overhang was 1600 mm (5 ft 6 in) long therefore the total load applied to the specimen from the
soundwall is 226 kN (508 kip) The equivalent moment applied to the structure due to this dead
load can be obtained by multiplying the total load applied by the distance between the applied
load and the edge of the stem also known as the moment arm The equivalent additional
moment demand due to the soundwall was found to be 1091 kN-m (805 kip-ft)
A successful repair would strengthen the overhang to accommodate this increased moment
demand with a reasonable safety margin For initial calculation purposes a safety margin of 3
was deemed appropriate
M demand _ increase = M wall sdot3 (6)
27
This translates to an increase in moment demand of 327 kN-m (241 kipmiddotft) Therefore the
NSM flexural strengthening will be designed to increase the capacity of the overhang by at least
this value The experimentally determined moment capacity of the as-built reinforced concrete
deck slab overhang without FRP was found to be 110 kN-m (81 kip-ft) Therefore the new
moment capacity after strengthening should be at least 1427 kN-m (1051 kip-ft) which
corresponds to a minimum required moment capacity increase of 297 percent over the capacity
of the as-built specimen without FRP
The increased moment capacity due to FRP strengthening is equal to the sum of the contribution
from the tension steel (compression steel is ignored for this calculation) and the contribution
from the FRP reinforcement
⎛⎜⎝
⎞⎟⎠
⎛⎜⎝
⎞⎟⎠
a aψ f+
The definitions of the variables in the above equation are shown below
Steel properties
As = Total area of tension steel in slab overhang test specimen
fs = Experimentally determined yield strength of steel reinforcement
d = Distance to centroid of tensile steel reinforcement
a = Depth of concrete compression block assuming rectangular stress distribution
FRP properties
M As f d Af f dminus sdot sdot minus (8)= strengthened fe fn y 2 2_
Ψ f = Additional reduction factor recommended by ACI 4402R (Section 961) [12]
df = Distance from the compression fiber to the centroid of the FRP
ffe = Efmiddotεfe Effective stress in the FRP assuming elastic behavior
Ef = Experimentally determined modulus of elasticity of FRP
εfe = Effective strain in FRP reinforcement
By rearranging equation 8 an expression for the area of FRP reinforcement required in order to
achieve a specified moment capacity increased can be obtained
28
⎛ a ⎞M n _ strengthened minus As f y ⎜ d minus ⎟ ⎝ 2 ⎠Af _ required = (9)
⎛ a ⎞ψ sdot f sdot ⎜ d minus ⎟f fe f⎝ 2 ⎠
The required area of FRP obtained from this expression can be used to evaluate the feasibility of
different FRP strengthening options Note that the area of FRP required is the total area needed
for the specimen overhang and thus must be distributed along the width of the slab overhang
52 Options for Rehabilitation
The seven product options evaluated for this rehabilitation design were different sizes of SIKArsquos
pultruded carbon fiber CarboDur rods and strips as well as Hughes Brothersrsquo pultruded carbon
fiber Aslan 500 rectangular rods The physical characteristics of each option are provided in
Table 2 for reference
29
Product
Type
Source Product
Designation
Diameter Thickness Width Area Tensile
Modulus
mm in mm in mm in mm2 in2 GPa Msi
Rod SIKA frac14 in dia 635 025 127 005 155 225
Rod SIKA 38 in dia 953 0375 279 011 155 225
Strip SIKA S512 12 0047 50 197 60 0093 165 239
Strip SIKA S812 12 0047 80 315 96 0149 165 239
Strip SIKA S1012 12 0047 100 394 120 0186 165 239
Bar Hughes
Brothers
2 2 0079 16 063 312 0049 124 18
Bar Hughes
Brothers
3 45 0177 16 063 713 0110 124 18
Table 2 Physical properties of pultruded CFRP strengthening product options [212223]
30
The number of reinforcements required to attain the desired moment capacity increase was
calculated for each of the seven potential options using calculations described in the previous
section (Equation 9) and the results are shown in Table 3 For calculation of the effective stress
in the FRP εfe a strain of 065 was assumed based on design recommendations for FRP postshy
strengthening of reinforced concrete slabs [24 25] The tensile modulus for each of the different
FRP reinforcement options was obtained from manufacturer reported data Since the FRP
reinforcement type had not been selected yet the distance from the compression fiber to the
centroid of the FRP df was assumed to be the full depth of the slab Note that this assumption
will slightly overestimate the moment capacity contribution from the FRP because for NSMR
applications the reinforcement is located slightly below the surface of the structure Assuming
that the centroid of the FRP reinforcement is below the surface of the structure by a distance of
between 2 mm (0079 in) and 10 mm (0393 in) the calculations would have overestimated the
moment capacity increase due to the FRP reinforcement by between 1 and 6
Spacing requirements were also considered in the calculations performed for each FRP
strengthening option The maximum spacing recommendations provided by the manufacturer
[26] state that on center spacing should be limited to no more than the lesser of 02 times the
span length (L) or five times the slab thickness (h)
slim it = min(02L 5h) (10)
Note that the span for cantilever is taken as twice the distance to the support This spacing limit
yields a maximum recommended spacing of 203 mm (8 in) Table 3 below shows the number of
units needed as well as the theoretical moment capacity increase for each type of CFRP
reinforcement As observed in the Table 3 spacing limitations govern rather than actual strength
requirement limitations Since all seven of the design options are able to achieve the increased
capacity requirements other aspects such as cost and constructability are now used to select the
FRP reinforcement system
One notable difference between the installation of CFRP strips as opposed to rods is the required
depth of grooves cut into the deck The 64 mm (14 in) diameter rods require 127 mm (12 in)
31
deep slots and the 95 mm (38 in) rods require 159 mm (58 in) deep rods while the strips only
require a 4 mm (016 in) deep groove From a construction viewpoint strips as opposed to rods
are far easier to implement due to required groove depth Given that there is often less cover on
the top of a slab than would be required cutting deeper grooves is hazardous in that the cuts
could easily cut through existing steel reinforcing bars Thus having shallower grooves is
preferred in Europe based on extensive field use
The lower modulus of the CFRP tape of 124 GPa (180 Msi) versus that of the CFRP strips 165
GPa (239 Msi) resulted in appreciably greater material usage for comparable strengthening
schemes As a comparison the S512 CFRP strip has an estimated moment capacity increase of
81 whereas the 3 size CFRP tape has an estimated moment capacity increase of only 71
and requires an additional 19 of material above that used for the strip to achieve this increase
Based on guidelines material cost considerations the CarboDur strips were recommended for
use to Caltrans On receipt of approval from Caltrans to use this option experimental work was
initiated using the flat option Because the smallest size strip far exceeded the required moment
capacity the CarboDur S512 strips were selected which have a 50 mm (2 in) width The
spacing was set at 203 mm (8 in) on center for the width of the test specimen such that nine total
CFRP strips were used The bars were extended past the point of inflection to achieve a
necessary development length of 300 mm (118 in)
32
Previously tested as-built specimen without FRP
Current specimen with to be strengthened using NSM CFRP strips
CFRP strips spaced at 203 mm (8 in) o c
Ld Point of inflection
Figure 30 Plan view of deck illustrating chosen CFRP strengthening scheme
33
R
einf
orce
men
t ty
pe
Prod
uct
Cro
ss-
sect
iona
l Are
a
of u
nits
ne
eded
Spac
ing
wo
co
nsid
erin
gsp
acin
g lim
its
Spac
ing
used
Act
ual
of
uni
ts
Tot
al a
rea
ofFR
P us
ed
The
oret
ical
m
omen
t ca
paci
ty
Mom
ent
capa
cit y
incr
ease
(Rod
or s
trip)
(N
ame
and
size
) (m
m2 )
(in 2 )
(rou
nded
up
)
(rou
nded
tone
ares
t in)
(c
onsi
derin
g sp
acin
g lim
its )
(rou
nded
up
) (m
2 )(in
2 )m
(kN
-m)
(kip
-ft)
(mm
) (in
) (m
m)
(in)
Rod
1
4
diam
eter
32
0
05
7 25
4 10
10
2 4
9 22
6 0
45
140
7 10
37
28
Rod
3
8
diam
eter
71
0
11
4 43
2 17
20
3 8
9 63
9 0
99
191
8 14
15
74
Strip
S5
12-
50m
m
wid
th
60
009
3 4
432
17
203
8 9
540
084
18
24
134
5 66
Strip
S8
12-
80m
m
wid
th
96
014
9 3
559
22
203
8 9
865
134
23
32
172
0 11
2
Strip
S1
012-
10
0mm
w
idth
12
0 0
186
2 83
8 33
20
3 8
9 10
80
167
25
66
189
2 13
3
Tape
2
31
0
049
9 20
3 8
203
8 9
281
044
13
15
969
20
Tape
3
71
0
11
4 43
2 17
20
3 8
9 64
2 0
99
173
1 12
76
57
Table 3 Calculation table using different FRP strengthening options
34
53 Rehabilitation Construction
The following section details the implementation of the NSMR strengthening scheme chosen in
Section 52 Nine (9) rectangular groves spaced at 203 mm (8 in) oc were cut in the top deck of
the test specimen with dimensional tolerances of 70 mm - 76 mm (2 frac34 in - 3 in) for the width
and 6 mm - 13 mm (frac14 in to frac12 in) for depth The grooves were each 274 m (8 ft) long and the
cut grooves are shown in Figure 31
Figure 31 Grooves cut in deck for NSM strengthening
After the grooves were cut to the proper dimensions the surface was roughened to achieve the
minimum required concrete surface profile (CSP) of 3 as defined by the ICRI surface profile
guidelines [27]
The CarboDur S 512 carbon fiber laminate strips were cut to length and the top and bottom
surfaces were wiped clean using methyl ethyl ketone (MEK) to remove all residual carbon dust
from the surface prior to the installation of strain gages on the top surface of the strips An
additional cleaning with MEK was performed immediately prior to installation of the strips into
the test specimen to remove any remaining contaminates and surface oxidization A highshy
modulus high-strength structural epoxy paste known as SikaDur 30 was used for bonding the
CFRP strips to the concrete The structural properties of the CarboDur S 512 strips and SikaDur
30 resin system were experimentally determined through material characterizations performed at
the University of California San Diego within the authorsrsquo research group and these properties
are shown below from [28]
35
Tensile Properties (ASTM D-638)
SikaDur 30
Mean Standard Deviation 7 day Tensile Strength 2529 MPa (3671 ksi) 254 MPa (0369 ksi) Modulus of Elasticity 693 GPa (1006 Msi) 048 GPa (00697 Msi)
Table 4 Tensile properties of SikaDur 30 resin system [28]
Tensile Properties (ASTM D-3039)
CarboDur S 512
Mean Standard Deviation Ultimate Tensile Strength 2505 MPa (3636 ksi) 8285 MPa (120 ksi) Ultimate Tensile Modulus 1381 GPa (2005 Msi) 522 GPa (076 Msi)
Ultimate Tensile Strain 1580 0084
Table 5 Tensile properties of SIKA CarboDur S512 CFRP strips [28]
After the SikaDur 30 resin system was thoroughly mixed the neat resin was applied to each
groove as a primer using a spatula to form a uniform thickness of 16 mm (116 in) as shown in
Figure 32 A specialized applicator was also used to apply a precisely controlled thickness of
resin onto each of the carbon fiber strips and the strips were carefully placed in the grooves
Figure 32 Application of resin system used in grooves to bond CFRP strips to concrete
A rubber roller was then used to properly seat each strip using adequate pressure to force
SikaDur 30 gel out on both sides of the laminate so that the bond line between the concrete and
36
FRP strip does not exceed 3 mm (18 in) [29] Excess gel was carefully removed and the
installed strips are shown in Figure 33
Figure 33 CFRP strips installed
After the resin system had cured for 24 hours a low viscosity resin system which was used for
the wear surface applied to the top of the FRP strips was poured over the top of the strips up to
the level of the original concrete deck The top layer of resin was mixed with sand to allow for
improved thermal compatibility with the surrounding concrete and to provide a non-skid wear
surface for the top of the deck After the installation of the NSM CFRP strengthening scheme
was completed the instrumentation was installed and the specimen was ready for testing to
determine the effectiveness of the repair
In order to monitor the curing of the CarboDur 30 resin system used to attach the CFRP strips to
the deck slab small test samples were made using resin mixed for installation of the strips and
the samples were placed adjacent to the test specimen to ensure comparable curing conditions
These resin samples were tested daily for a period of seven days using both dynamic mechanical
thermal analysis (DMTA) and differential scanning calorimetry (DSC) techniques The results
obtained from these experiments regarding the glass transition temperature Tg of the resin
system are shown in Table 6 The trends from the glass transition temperature data over time
shown below indicate that the SikaDur 30 resin system achieved nearly full cure after
approximately 4-5 days
37
Time DMTA Tg results DSC Tg results degC degC
Day 1 5713 3750 Day 2 5915 3850 Day 3 --- ---Day 4 6439 4150 Day 5 6226 4225 Day 6 6426 4300 Day 7 6361 4300
Table 6 Tg progression of CarboDur 30 resin used in NSMR installation
54 Capacity Calculations
Following the implementation of the chosen NSM CFRP strip rehabilitation scheme theoretical
predictions for capacity were recalculated using the experimentally determined material
properties given in Table 6 along with an assumed CFRP strip embedment depth of 3 mm (18
in) and reduced FRP strain capacity of 065 as described in Section 51 The increased
moment capacity calculation due to FRP strengthening described in Section 51 yields a
theoretical moment capacity of 1673 kN-m (1234 kip-ft) which corresponds to a 52 increase
in moment capacity over the experimentally determined value for the as-built specimen The
moment curvature analysis performed on the FRP rehabilitated specimen yielded a moment
capacity of 1855 kN-m (1364 kip-ft) which corresponds to a 69 increase in load carrying
capacity over the as-built specimen
38
152
55 Instrumentation
The total instrumentation for this experiment consisted of 16 linear potentiometers 47 strain
gages and 2 load cells One central row and two outer rows each with four linear potentiometers
were used to measure the vertical deflection of the deck slab The four linear potentiometers
within each row were positioned at the midspan of the adjacent cell above the adjacent stem in
between the stem and the loading beam and directly below the loading beam as shown in
Figures 11(a) and (b)
2438
1 2 3 4
M
B
A
76
610 279CL
152
1524
838
Elastomeric Bearing Pad 1524
Linear Potentiometers CL
1676
(a) Plan view of specimen (b) Section of deck slab with linear potentiometer details
Figure 34 Position of linear potentiometers for measuring deflections of deck slab
The deflection of the elastomeric bearing pad was measured using four linear potentiometers
with one linear potentiometer at each corner of the loading beam using the same layout as the asshy
built specimen shown in Figure 12
All 47 strain gages were applied to the top side of the nine pultruded CFRP strips parallel to the
direction of the fibers as shown in Figure 33 The two strain gage layout patterns used on this
specimen illustrated in Figure 35 were applied to alternating CFRP strips throughout the width
of the specimen as shown in Figure 36
39
Pattern 1
1626 1168
737 483
76
22362
2057
G F E D C B A
Pattern 2
1168 483
2057
F D B
Figure 35 Strain gage patterns and designations
G F E D C B A
1
2 1
2 1
2 1 2 1
Pattern
Figure 36 Position of strain gages attached to CFRP strips
40
Figure 37 Completed installation of CFRP strips with full instrumentation setup
41
56 Loading Protocol
The overhang of the deck slab was loaded using the test setup shown in Figure 7 and described in
Section 31 by incrementally increasing the hydraulic pressure supplied to the two hydraulic
jacks Adequate time was taken between loading levels to ensure that the hydraulic pressure had
stabilized and the pressure had equalized as much as possible between the two jacks The load
applied to the deck slab was monotonically increased following the loading sequence shown in
Table 7 The load was held briefly at each load level so that observations could be made
Loading step
Load per hydraulic
jack
Equivalent uniform
distributed load Load Level Notes
(kN) (kip) (kNm) (kipft) 1 24 5 300 21 --- Initial load 2 36 8 450 31 2x wall load ---3 48 11 600 41 --- ---4 60 13 750 51 --- ---5 72 16 900 62 4x wall load ---
6 84 19 1050 72 1st set of cracks observed
for as-built specimen ---
7 90 20 1125 77 5x wall load ---
9 101 23 1263 87 Calcd moment capacity asshy
built specimen ---
10 114 26 1425 98 Ultimate capacity as-built
specimen --shy
11 116 26 1450 99 Calcd shear capacity asshy
built specimen 1st set of cracks observed
12 130 29 1625 111 ---13 136 31 1700 116 --- 2nd set of cracks observed 14 142 32 1775 122 ~8x wall load ---15 148 33 1850 127 --- ---16 160 36 2000 137 ~9x wall load 3rd set of cracks observed 17 166 37 2075 142 --- ---18 172 39 2150 147 --- ---19 178 40 2225 152 ~10x wall load ---20 184 41 2300 158 --- 4th set of cracks observed 21 190 43 2375 163 --- ---22 196 44 2450 168 ~11x wall load Ultimate Capacity
Table 7 Loading protocol used for FRP rehabilitated specimen
42
57 Experimental Results
The ultimate capacity of the FRP rehabilitated deck slab was reached at an applied load of 196
kN (44 kips) per hydraulic jack equivalent to a uniform distributed load of 245 kNm (168
kipft) which is 11 x the nominal soundwall load At this load level the deflection of the middle
of the slab under the loading beam was 873 mm (034 in) The maximum strain value achieved
in the CFRP strips at ultimate capacity was 3846 microstrains At the ultimate capacity of the
specimen debonding of the FRP from the concrete occurred due to a tensile failure of the
concrete cover layer located between the FRP and the top layer of rebar This loss of
compatibility within the section was quickly followed by the opening and propagation of a large
diagonal crack along the compression strut formed with the adjacent stem wall
Cracking was observed and marked on the specimen at the four load levels of 116 kN (26 kip)
136 kN (31 kip) 160 kN (36 kip) and 184 kN (41 kip) per hydraulic jack The extent of visible
cracking on the top and sides of the deck of the FRP rehabilitated specimen shown in Figure 38
and Figure 39 occurred at the load level of 184 kN (41 kip) per hydraulic jack which was over
twice the load at which comparable cracking was observed on the as-built specimen The
comparable initial cracking observed on the as-built specimen which was described in section
45 occurred at a load level of 84 kN (19 kip) per hydraulic jack and is shown in Figure 15 and
Figure 16 on page 19 The thin cracking on the top of the deck surface that occurred in the FRP
rehabilitated specimen observed at the load level of 184 kN (41 kip) per hydraulic jack was
discontinuous and approximately followed the top longitudinal steel reinforcement bars adjacent
to the edge of the stem wall as shown in Figure 38
43
Figure 38 Craking of deck slab at 184 kN (41 kip) per jack- top view of deck
Minor diagonal cracks along both the edges of the slab which initiated from the top surface of
the deck are shown in Figure 39
(a) Detail of central edge of slab (b) Detail of exterior edge of slab
Figure 39 Cracking of deck slab at 184 kN (41kip) per jack - side view of deck
When the load level of 196 kN (44 kips) per hydraulic jack was reached the ultimate tensile
strength of the top concrete cover layer was exceeded and the bond between the FRP and the
concrete was lost This damage was quickly followed by the opening and propagation of a large
diagonal crack along the compression strut formed with the adjacent stem wall shown in Figure
40 This load level was determined to be the ultimate capacity of the overhang for resisting
vertical loads
44
(a) Central side of slab (b) Exterior side of slab
Figure 40 Cracking observed at ultimate capacity- side view of deck
The top surface of the deck slab after failure of the specimen can be observed in Figure 41 and
the cracking due to the interfacial failure between the FRP strips and the concrete can be
observed in the in the upper left hand corner of Figure 41 adjacent to the loading beam
Figure 41 Cracking of deck slab at ultimate capacity- top view of deck
After the loading of the specimen was completed all testing equipment and instrumentation was
fully removed to allow for easier observation of the damage present on the specimen Figure 42
shows the top view of the deck at ultimate capacity Any loose concrete was removed in order
to better observe the failure surfaces however unlike the as-built specimen in which significant
loose concrete was removed after it was tested nearly all of the concrete remained attached to
the tested FRP rehabilitated specimen despite the interfacial failure that occurred between the
FRP and the concrete Note that the debonding of the CFRP strips from the concrete occurred
adjacent to where the tensile stresses on the top of the deck are maximum while the CFRP strips
remained attached for the majority of the of the slab overhang
45
Figure 42 Side view of tested FRP rehabilitated specimen after removal of loose concrete
As observed in Figure 43 the three linear potentiometers directly below the loading beam
maintained comparable deflections throughout the loading range applied to the test specimen At
the failure load for the specimen the deflections of these three linear potentiometers were within
10 of each other which corresponds to less than 1 mm (004 in) difference in deflection values
46
80
140
10220 Ultimate Capacity Ultimate Capacity B4200 9 4th cracks
observed 4th cracks observed 180 8
M43rd cracks 160 3rd cracks 7observed
Load
per
hyd
raul
ic ja
ck (k
N)
Def
lect
ion
(mm
) observed 2nd cracks observed B4
120 1st cracks M4
100 observed A4
A46 2nd cracks
5 observed 1st cracks 4 observed B4B4 3
M460 2M4 A440
20 A4 1
0 0
0 2 4 6 8 10 24 60 84 116 136 160 172 184 196 Deflection (mm) Load per hydralulic jack (kN)
(a) Load versus deflection profiles (b) Comparison of linear potentiometers below loading beam
Figure 43 Comparisons of deflections at the edge of the deck slab overhang
The profiles along the center of the specimen (Figure 45) and at both edges (Figure 44 and
Figure 46) shown below exhibit similar deflection profiles throughout the loading range
0 24 kN Location of linear potentiometers
Distance from edge (mm) 60 kN 2 84 kN
B3 B4B1 B2 BB
Def
lect
ion
(mm
)
116 kN 4
136 kN
160 kN 6
8 184 kN 76
279 610 196 kN 101524 B1 B2 B3 B4
Linear Potentiometer Designation
Figure 44 Deflection profile along the central edge of specimen (Line B)
47
Location of linear potentiometers 0 24 kN Distance from edge (mm)
279 610
1524
76
M1 M2 M3 M4
60 kN 2 84 kN
M1 M2 M3 M4 Linear Potentiometer Designation
MM
Def
lect
ion
(mm
) 116 kN 4
136 kN
160 kN 6
184 kN 8
196 kN
10
Figure 45 Deflection profile along center of specimen (Line M)
0Location of linear potentiometers 24 kN Distance from edge (mm)
60 kN 2
84 kN
A1 A2 A3 A4 Linear Potentiometer Designation
279 610
1524
76
A1 A2 A3 A4 AA
Def
lect
ion
(mm
)
116 kN
136 kN
6
4
160 kN
8 184 kN
196 kN 10
Figure 46 Deflection profile along the outer edge of specimen (Line A)
The deflection profiles shown in Figure 47 and Figure 48 also indicate comparable deflections
along the overhang at a distance midway to the adjacent stem wall and directly below the point
of load application respectively
48
0 24 kN 60 kN 84 kN Location of linear potentiometers 116 kN 2Distance from edge (mm)
136 kN 160 kN
A3 M3 B3 Linear Potentiometer Designation
Def
lect
ion
(mm
)
3 184 kN 4 196 kN
8
10
838
152
1524
3
A3
M3
B3
Figure 47 Deflections midway along overhang (Line 3)
6
0
2
4
6
8
10
Def
lect
ion
(mm
)
84 kN 60 kN 24 kN
196 kN
184 kN
116 kN
136 kN
160 kN
A4 M4 B4
Location of linear potentiometers Distance from edge (mm)
838
152
1524
4
4
A4
M4
B4
Linear Potentiometer Designation
Figure 48 Deflections directly below loading beam (Line 4)
The strains in the FRP strips are also examined throughout the NSM CFRP rehabilitated
specimen The strain profiles along the edges and the middle of the specimen are shown in
Figure 49 Figure 50 and Figure 51 respectively These strain profiles indicate that the
maximum strain in the CFRP strips occurs directly above the edge of the stem wall adjacent to
the deck slab overhang referred to with the designation ldquoline Brdquo At ultimate capacity the
maximum strain in the specimen of 3846 microstrains occurs in strain gage 4B which is located
in line B near the middle of the specimen overhang
49
4000
Location of strain gages 3500 (See Figure for detailed schematic)
196 kN 3000
Stra
ins (
mic
rost
rain
s) 184 kN 9G 9F 9E 9D 9C 9B 160 kN9 9 2500
2000
1500
1000 60 kN
500 24 kN 0
136 kN 116 kN
84 kN
(Note Vertical gridlines in figure are -500 positioned at a spacing of 3048 mm (1 ft) 9G 9F 9E 9D 9C 9B Strain Gage Designation
Figure 49 Strain profile along the central edge of specimen (Line 9)
4000 196 kN
3500 184 kN (See Figure for detailed schematic)
Location of strain gages
3000 160 kN136 kN
Stra
ins (
mic
rost
rain
s)
2500
2000
1500
1000 60 kN 500 24 kN
0 (Note Vertical gridlines in figure are
-500 positioned at a spacing of 3048 mm (1 ft) 5G 5F 5E 5D 5C 5B 5A Strain Gage Designation
Figure 50 Strain profile along the middle of specimen (Line 5)
4000 Location of strain gages
(See Figure for detailed schematic) 3500 196 kN
116 kN
5G 5F 5E 5D 5C 5B 5A 5 84 kN 5
Stra
ins (
mic
rost
rain
s) 3000
2500
2000
1500
1000
1 500 24 kN
184 kN
160 kN136 kN 116 kN
84 kN
60 kN 1G 1F 1E 1D 1C 1B 1A 1
0(Note Vertical gridlines in figure are positioned at a spacing of 3048 mm (1 ft))
-500 1G 1F 1E 1D 1C 1B 1A
Strain Gage Designation
Figure 51 Strain profile along the outer edge of specimen (Line 1)
50
The strains drop off sharply for distances further away from the end of the overhang with the
majority of the strain gages on the opposite side of the stem wall (line C) exhibiting less than a
third of the strain values shown in line B The sharp drop in strain values at distances away from
the adjacent stem wall and the insignificant strains within these regions indicate that the
significantly shorter lengths of CFRP strips could be used to optimize material usage and
improve constructability without affecting load transfer and the overall system response
The strains along line B the location where the maximum strains occur in the specimen is shown
in Figure 52 This figure indicates that the distribution of strains was even along the specimen
until the load level of 116 kN (26 kip) per jack was reached At this level cracking was first
observed on the specimen and higher loading levels showed comparable but slightly less uniform
strains along the specimen The average strain along line B in the specimen at ultimate capacity
was 3423 microstrains whereas the minimum and maximum strains along line B were 2943
microstrains and 3846 microstrains respectively
4000
Location of strain gages 3500(See Figure for detailed schematic)
1B 3B 4B 5B 6B 7B 8B 9B Strain Gage Designation
Stra
ins (
mic
rost
rain
s) 3000 196 kN B 184 kN
160 kN 2500
1B
4B 3B
5B
9B 8B 7B 6B
B
136 kN 2000 116 kN
1500 84 kN
1000 60 kN
500
24 kN 0
(Note Vertical gridlines in figure are positioned at a spacing of 3048 mm (1 ft))
Figure 52 Strains along the edge of the stem wall adjacent to the deck slab overhang (Line B)
Using the strain data throughout the specimen and following a procedure described by Siem et al
[24] the shear stress between the concrete and the CFRP strips were calculated using the
following equation
51
9
(ε minus ε )sdot E sdot tn+1 n L Lτ nn+1 = (11)(x minus x )n+1 n
Where (x minus x )= distance between two strain gages EL= the tensile elastic modulus of then+1 n
CFRP strip and tL = thickness of the CFRP strips For these calculations EL= 1381 GPa (2005
Msi) and tL = 12 mm (0047 in) were used for the CFRP strips The calculated shear stress
values within the adhesive are simply the mean value between two strain gages which ignore
localized stress peaks and gradients
Distance from west edge (m) 27 24 21 18 15 12 09 06 03 00
Location of strain gages 20 (See Figure for detailed schematic)
15
196 kN
116 kN 160 kN
9B9G 9F 9E 9D 9C
(Note Vertical gridlines in figure are positioned at a spacing of 3048 mm (1 ft)
9
Stre
ss (M
Pa) 10
05
00
-05
-10
-15
-20
Figure 53 Calculated shear stress within adhesive along the central edge of specimen (Line 9)
Distance from west edge(m) 27 24 21 18 15 12 09 06 03 00
Location of strain gages (See Figure for detailed schematic) 20
196 kN
116 kN
160 kN
5 00
(Note Vertical gridlines in figure are positioned at a spacing of 3048 mm (1 ft)
3B5G 5F 5E 5A5D 5C
Stre
ss (M
Pa)
15
10
05
-05
-10
-15
-20
Figure 54 Calculated shear stress within adhesive along the middle of specimen (Line 5)
52
5
Distance from west edge(m) 27 24 21 18 15 12 09 06 03 00
Location of strain gages 20 (See Figure for detailed schematic)
196 kN
116 kN 160 kN
Stre
ss (M
Pa) 15
10
05
00
-05 3
(Note Vertical gridlines in figure are positioned at a spacing of 3048 mm (1 ft)
3B3G 3F 3E 3D 3C 3A 3
-10
-15
-20
Figure 55 Calculated shear stress within adhesive along an interior CFRP strip (Line 3)
Distance from west edge (m) 27 24 21 18 15 12 09 06 03 00
Location of strain gages 20 (See Figure for detailed schematic)
-20
196 kN
116 kN 160 kN
Stre
ss (M
Pa)
15
10
05
00
-05
-10
-15
1G 1F 1E 1D 1B1C 1A 11
(Note Vertical gridlines in figure are positioned at a spacing of 3048 mm (1 ft))
1G 1F 1E 1D 1C 1B 1A Strain Gage Designation
Figure 56 Calculated shear stress within adhesive along the outer edge of specimen (Line 1)
53
After the testing of the NSM CFRP rehabilitated specimen was completed the overhang of the
specimen was cut off and carefully removed from the rest of the test specimen as shown in
Figure 57 to allow for further examination of this critical region
432 mm (17 in)
Figure 57 Location of cut for removal of FRP rehabilitated overhang from test specimen
One point of interest to examine on the removed overhang was the actual location of the CFRP
strip reinforcement within the section Figure 58 shows that the actual embedment depth of the
near surface mounted CFRP strips was approximately 6 mm (025
in) and the actual thickness of the SikaDur 30 resin layer used to
bond the CFRP strips to the concrete was also approximately 6 mm
(025 mm) An embedment depth of 6 mm (025 in) is reasonable
for NSM applications because it allows enough space for an
adequate top surface of resin which will serve as environmental
protection and the wear surface for the deck However the 6 mm
(025 mm) thickness of the SikaDur 30 bottom resin layer exceeded
the maximum manufacturer recommended value of 3 mm (18
inch) While the current system performed very well the use of an
overly thick resin layer could have had an negative effect on the
overall structural response of the system Figure 58 Detail showing actual location of reinforcement
Figure 59 shows the failure surface of an FRP strip which has been detached from the top
surface of the deck The center portion of the strip with the firmly attached concrete was the
region in which the interfacial failure in the concrete occurred while the outer sections of the
strip were neatly detached from the resin system due to the method of removal of the strip
54
Figure 59 Detail of failure surface of FRP strip
58 Comparison with Theory
The NSM CFRP rehabilitated specimen reached ultimate capacity under an applied load of 196
kN (44 kip) per hydraulic jack which is equivalent to an applied moment of 1892 kN-m (1392
kip-ft) This improved performance corresponds to a 72 increase in ultimate capacity over the
as-built specimen which failed under an applied load of 114 kN (26 kip) corresponding to an
applied moment of 1100 kN-m (810 kip-ft) The ACI 440-02 calculation for externally bonded
FRP reinforcement predicted a maximum moment capacity of 1660 kN-m (1224 kip-ft) which
corresponds to a 51 increase in load carrying capacity over the experimentally determined
capacity of the as-built specimen The moment curvature analysis predicted a maximum moment
capacity of 1855 kN-m (1364 kip-ft) which corresponds to a 69 increase in load carrying
capacity over the as-built specimen The theoretical predictions and experimental results were
within 12 using the ACI 440 approach and were in close agreement with only a 2 error
using the moment curvature analysis The larger disagreement with experimental data found
from the ACI 440 moment capacity increase equation likely exists because this calculation is a
more simplified approach that does not take into account the over strength of the steel
reinforcement
55
3rd cracks observed
1st cracks observed
200
220
59 Comparison with As-Built
The ultimate capacity of the near surface mounted CFRP strip rehabilitated slab was reached at
an applied load of 196 kN (44 kips) equivalent to a uniform distributed load of 245 kNm (168
kipft) which is 11x the nominal soundwall load This ultimate capacity is 78 greater than that
obtained by the as-built specimen which occurred at 114 kN (26 kips) per hydraulic jack
equivalent to a uniform distributed load of 1425 kNm (98 kipft) which is 633x the nominal
wall load The center deflections under the loading beam for both specimens over the complete
loading ranges applied are compared in Figure 60(a) and Figure 60(b) At the failure load level
of the as-built specimen the as-built specimen had a center deflection under the loading beam of
636 mm (025 in) whereas the FRP rehabilitated specimen deflected approximately half that of
the as-built specimen or 333 mm (013 in) At ultimate capacity of the FRP rehabilitated
specimen the center deflection under the loading beam was 873 mm (034 in) which indicates
the rehabilitated specimen exhibited a 318 increase in deformation capacity over the as-built
specimen
10
0 2 4 6 8 10
Ultimate Capacity
1st cracks observed
2nd cracks observed
4th cracks observed
As-built test
3rd cracks observed
2nd cracks observed 1st cracks observed
Ultimate Capacity
Rehabilitated test
Def
lect
ion
(mm
)
6
5
4
360
240 120
0 0
Deflection (mm) Load per hydralulic jack (kN)
As-built specimenRehabilitated specimen
Ultimate Capacity
Ultimate Capacity
24 36 48 60 72 84 96 102 114 136 160 184 196
9
180
Load
per
hyd
raul
ic ja
ck (k
N) 8
160 7 140
120
100
80
a) Load versus deflection profiles (b) Comparison of linear potentiometers below loading beam
Figure 60 Comparisons of middle center deflections of the deck slab overhang
In addition to increasing the overall load and deformation capacity of the system the near
surface mounted CFRP strips act to increase the stiffness and improve the stability of the system
56
The load versus deflection profile shown in Figure 60(a) shows the significantly increased
stiffness and more linear profile for the FRP rehabilitated specimen over the as-built specimen
The deflection profile comparison at the 114 kN (26 kips) per jack load level along the middle of
the two slabs is shown in Figure 61 This figure illustrates that for the same load level the
deflections within the FRP rehabilitated specimen are lower than the deflections of the as-built
specimen throughout the deck slab and not just at the point of load application
Location of linear potentiometers 0 Distance from edge (mm)
279 610
1524
76
M1 M2 M3 M4
2
4
M M
6
8
10
FRP rehabilited specimen at 114 kN per jack
As-built specimen at 114 kN per jack
M1 M2 M3 M4 Linear Potentiometer Designation
Figure 61 Comparison of deflection profiles along center of specimens (Line M)
The first set cracking observed on the as-built specimen occurred at the load level of 84 kN (19
kip) whereas the first set cracking observed on the FRP rehabilitated specimen occurred at 116
kN (26 kip) which is corresponds to a 38 greater load A comparison of the deflection profiles
along the center of the specimens at these loading levels shown in Figure 62 reveals nearly
identical deformations for the two specimens
57
10
10
M1
1524
279 610
76
M2 M3 M4
Location of linear potentiometers Distance from edge (mm)
FRP rehabilited specimen at 1st observed cracking
(116 kN per jack)
0
2 As-built specimen
at 1st observed cracking (84 kN per jack) 4
M
Def
lect
ion
(mm
)
M
6
8
M1 M2 M3 M4 Linear Potentiometer Designation
Figure 62 Comparison of center deflection profiles at 1st observed cracking loads (Line M)
The second set of cracking observed on the as-built specimen occurred at the load level of 101
kN (23 kip) whereas the second set of cracking observed on the FRP rehabilitated specimen
occurred at 136 kN (31 kip) which is corresponds to a 35 greater load The deflection profile
comparison at the load levels where the second set of cracking was observed in Figure 64 also
exhibits nearly identical deformations for the two specimens This indicates that while the FRP
reinforcement acts to stiffen the system and increase the load carrying capacity of the overhang
region the shape of the deflection response profile of the system is not modified significantly
with the addition of the CFRP strips
0FRP rehabilited specimen at 2nd observed cracking
(136 kN per jack)
As-built specimen at 2nd observed cracking
(101 kN per jack)
Location of linear potentiometers Distance from edge (mm)
279 610
1524
76
M M1 M2 M3 M4
2
4
Def
lect
ion
(mm
)
M
6
8
M1 M2 M3 M4 Linear Potentiometer Designation
Figure 63 Comparison of center deflection profiles at 2nd observed cracking loads (Line M)
58
Figure 64 shows the side by side top decks of the two specimens after testing has been completed
and all loose concrete on the top deck removed Details of the critical region of the as-built and
FRP rehabilitated top deck are shown in Figure 65 and Figure 66 respectively
Figure 64 Top view of deck slab tested to ultimate capacity after removal of loose concrete
59
For the as-built specimen extensive damage and spalling of the concrete on the top of the deck
slab was seen Yielding in the transverse steel reinforcement followed by loss of aggregate
interlock resulting in failure was observed
Figure 65 Detail of cracking observed at ultimate capacity- top view of as-built deck
For the FRP rehabilitated specimen negligible spalled concrete and loose concrete rubble was
detected A concrete splitting failure mode was observed in the FRP rehabilitated specimen
Figure 66 Detail of cracking observed at ultimate capacity- top view of FRP rehabilitated deck
60
6 SUMMARY OF RESULTS AND RECOMMENDATIONS FOR FUTURE RESEARCH
Experimental results from the testing of the rehabilitated specimen indicate that the NSMR
strengthening scheme was successful at achieving the desired load carrying capacity increase
The ultimate load carrying capacity of the FRP rehabilitated specimen was 196 kN (44 kips) per
hydraulic jack which was 78 higher that the ultimate load of the as- built specimen of 114 kN
(26 kips) per hydraulic jack This value well exceeded the desired load capacity increase of
297 above the experimentally determined capacity of the as-built specimen exhibited a very
stable structural response and increased the deformation capacity of the system The theoretical
moment capacity predictions for the as-built specimen were within 11 and 65 of the
experimentally determined value using ACI 318 and moment curvature analysis respectively
The theoretical moment capacity predictions for the FRP rehabilitated specimen were within
12 of the experimental value using the modified ACI 440-02 approach and were within 2
using moment curvature analysis
The NSM FRP rehabilitated specimen exhibits a variety of structural performance improvements
over the as-built specimen including increased ultimate load carrying capacity enhanced
deformation capacity and more stable overall structural performance Design options for the
near surface mounted CFRP strengthening schemes allow for great flexibility in terms of
tailoring the reinforcement parameters for specific applications With consideration of the
minimal disruption to traffic flow and ease of installation this system is a viable and very
attractive rehabilitation option for bridge deck slab overhangs
The purpose of Phase 1 was to conduct an experimental analysis of the use of NSM for purposes
of strengthening and to provide the basis for the planning of Phase 2 as detailed in the initial
proposal submitted to Caltrans Based on the extensive literature review already conducted
(although according to the project funding provided by Caltrans is to be completed and reported
on in Phase 2) and on the experimental results the following aspects are recommended for further
study in Phase 2
61
bull Complete review of the failure modes and mechanisms seen with use of barsrods as
compared to flat strips for purposes of documenting advantages of strips It is noted that
a very brief summary is given in the introductory portion of this report
bull Optimization of groove dimensions and spacing for NSM use through both analytical and
experimental study
bull Study of adhesive rheology and bond quality as well as durability
bull Study of minimum development length and effect of insertion into girder stems
bull Study of use for specific strengthening applications
bull Development of design guide for Caltrans and development of example comparing NSM
use to surface bonding
It is emphasized that the studies should be conducted on specimens of sufficient size since small
scale tests are likely to provide erroneous results due to effects of scale and configuration It is
recommended that these tests only be conducted after a review of advances in Europe and
Australia are completed and sufficient analytical work is completed on optimization of grove
dimensions and spacing Since the efficacy of the method is intrinsically related to the ability of
the adhesive to not only bond the reinforcement to the concrete substrate but to also enable
efficient stress transfer study also needs to be conducted on adhesive rheology performance
characteristics and cure It is recommended that this be based on the completed durability study
which should provide a base-line for further study Also since it is likely that the NSM will be
covered by asphalt the effect of heat due to asphalt on the adhesive and bond should also be
studied
62
7 REFERENCES
[1] VM Karbhari and L Zhao ldquoUse of composites for 21st century civil infrastructurerdquo
Computer Method Appl Mech Eng 185 pp 433ndash454 (2000)
[2] S Rizkalla T Hassan N Hassan ldquoDesign recommendations for the use of FRP for
strengthening of concrete structuresrdquo Prog Struct Engng Mater 5 pp 16ndash28 (2003)
[3] K K Ghosh ldquoAssessment of FRP composite strengthened reinforced concrete bridge
structures at the component and systems level through progressive damage and nonshy
destructive evaluation (NDE) [PhD dissertation] University of California San Diego
(2006)
[4] L De Lorenzis JG Teng ldquoNear-surface mounted FRP reinforcement An emerging
technique for strengthening structuresrdquo Composites Part B 38 pp 119-143 (2007)
[5] R Parretti A Nanni ldquoStrengthening of RC Members Using Near-Surface Mounted FRP
Composites Design Overviewrdquo Advances in Structural Engineering 7 5 pp 1-16 (2004)
[6] J R Yost S P Gross D W Dinehart and J J Mildenberg ldquoFlexural Behavior of
Concrete Beams Strengthened with Near-Surface-Mounted CFRP Stripsrdquo ACI Structural
Journal July-August pp 430-437(2007)
[7] L A DeLorenzis A Nanni and A L Tegila ldquoFlexural and Shear Strengthening of
Reinforced Concrete Structures with Near Surface Mounted FRP Barsrdquo Proceedings of the
3rd International Conference on Advanced Composite Materials in Bridges and Structures
Ottawa Canada Aug 15-18 pp 521-528 (2000)
[8] El-Hacha R and Rizkalla S 2004 ldquoNear-Surface-Mounted Fiber- Reinforced Polymer
Reinforcements for Flexural Strengthening of Concrete Structuresrdquo ACI Structural Journal
V 101 V 5 Sept-Oct pp 717-726
[9] R Parretti and A Nanni ldquoStrengthening of RC Members Using Near-Surface Mounted
FRP Composites Design Overviewrdquo Advances in Structural Engineering V 7 (5) (2004)
63
[10] E Bonaldo J A Oliveira de Barros and P B Lourenccedilo ldquoEfficient Strengthening
Technique to Increase the Flexural Resistance of Existing RC Slabsrdquo ASCE Journal of
Composites for Construction MarchApril pp149-159 (2008)
[11] The Concrete Society Design Guidance for Strengthening Concrete Structures using Fibre
Composite Materials Concrete Society Technical Report 55 2nd Edition (2004)
[12] ACI Committee 440 Guide for the Design and Construction of Externally Bonded FRP
Systems for Strengthening Concrete Structures ACI 4402 R-02 (2002)
[13] Canadian Standards Association Canadian Highway Bridge Design Code- Section 16
Fibre-Reinforced Structures (2006)
[14] AASHTO LRFD bridge design specifications 3rd Ed AASHTO Washington DC
(2004)
[15] A B Pridmore V M Karbhari ldquoEvaluation of Prefabricated FRP Structural Formwork
Bridge Deck Systemsrdquo SAMPE 53rd International Technical Conference (2008)
[16] Caltrans ldquoMemo to Designers 22-1 Soundwall Design Criteriardquo (2004)
[17] ACI 318-08 Building Code Requirements for Structural Concrete (2008)
[18] Caltrans Bridge Design Specifications Section 8- Reinforced Concrete (2003)
[19] Bentz E and Collins M P lsquolsquoRESPONSE-2000mdashReinforced Concrete Section al Analysis
using the Modified Compression Field Theoryrdquo Version 105 Toronto Canada (2000)
[20] Caltrans ldquoMemo to Designers 22-1 Soundwall Design Criteriardquo (2004)
[21] Sika Corporation Product Data Sheet for Sika CarboDur Rods- carbon fiber rods for
structural strengthening Edition 9 (2003)
[22] Sika Corporation Product Data Sheet for Sika CarboDur- Carbon fiber laminate for
structural strengthening Edition 722 (2005)
[23] Hughes Brothers Inc Product data sheet for Aslan 500- CFRP tape wwwhughesbroscom
(2002)
64
[24] W Seim Y Vasquez VM Karbhari and F Seible ldquoPost-Strengthening of Concrete
Slabs Full Scale Testing and Design Recommendationrdquo ASCE Journal of Structural
Engineering 129[6] pp 743-752 (2003)
[25] W Seim M Hormann VM Karbhari and F Seible External FRP Poststrengthening of
Scaled Concrete Slabs ASCE Journal of Composites in Construction 5[2] pp 67-75
(2001)
[26] Sika Europe- German Institute of Construction Technology 1998
[27] International Concrete Repair Institute ICRI Guideline No 037324 ldquoSelecting and
Specifying Concrete Surface Preparation for Sealers Coatings and Polymer Overlaysrdquo
(1997)
[28] S J Jin ldquoStatistical Characterization of Prefabricated FRP Composite Materials for
Rehabilitation of Concrete Structuresrdquo Master Thesis Department of Structural
Engineering University of California San Diego (2008)
[29] Sika Corporation ldquoCarboDur Installation Guiderdquo Sika construction documents
65

2438
152
CL
152
1524
1676
1829
CL
(a) Instrumentation detailing for bearing pad (b) Representative linear potentiometer
Figure 12 Position of linear potentiometers for measuring compression of bearing pad
44 Loading Protocol
In addition to the test setup described in Section 31 a 64 mm (2frac12 in) diameter hole was drilled
through the deck of the specimen at a distance 76 mm (3 in) by 76 mm (3 in) on center away
from the corner of the deck as shown in Figure 13 in order to accommodate the spacing
constraints imposed by the testing setup
Elastomeric Bearing Pad
Linear Potentiometers
1600 mm 76229 1829 mm
Threaded rods Loading beam
Bearing pad Concrete deck
Figure 13 Specific test setup schematic for as-built specimen
The overhang of the deck slab was tested by incrementally increasing the hydraulic pressure
supplied to the two hydraulic jacks which loaded the overhang through the test setup shown in
16
Figure 13 Adequate time was taken between loading levels to ensure that the hydraulic pressure
had stabilized and the pressure had equalized as much as possible between the two jacks The
load applied to the deck slab was monotonically increased following the loading sequence shown
in Table 1 The load was held briefly at each load level so that observations could be made at
each stage
Loading step
Load per hydraulic
jack
Equivalent uniform
distributed load Load level Notes
(kN) (kip) (kNm) (kipft) 1 24 5 300 21 --- Initial load 2 36 8 450 31 2x wall load ---3 48 11 600 41 --- ---4 60 13 750 51 --- ---5 72 16 900 62 4x wall load ---6 84 19 1050 72 --- 1st set of cracks observed 7 90 20 1125 77 5x wall load ---8 96 22 1200 82 --- ---9 102 23 1263 87 Calculated moment capacity 2nd set of cracks observed
10 114 26 1425 98 633x wall load Ultimate Capacity --- 116 26 1450 99 Calculated shear capacity ---
Table 1 Loading protocol for as-built test specimen
17
45 Experimental Results
The ultimate capacity of the slab was reached at an applied load of 114 kN (26 kips) per
hydraulic jack equivalent to a uniform distributed load of 1425 kNm (98 kipft) which is
633x the nominal wall load Note that the additional load carrying capacity of the deck slab
overhang beyond the dead load of a single sound barrier is necessary to resist lateral loading As
the loading of the edge of the slab was increased the top layer of transverse reinforcement above
the outer edge of the stem yielded followed by loss of aggregate interlock resulting in failure
The deflection of the middle of the slab directly under the loading beam when the system was
loaded to ultimate capacity was 636 mm (025 in)
As a baseline Figure 14 shows the specimen prior to testing The markings on the top of the
deck in this figure show preexisting hairline cracks in the deck
Figure 14 Deck slab prior to experimental testing
Cracking was first observed on the top side of the deck at the 84 kN (19 kip) load per jack and
were marked on the specimen in dark blue ink The thin cracking on the top of the deck surface
was discontinuous and approximately followed the two top longitudinal steel reinforcement bars
adjacent to the edge of the stem wall as shown in Figure 15
18
Figure 15 Initial craking of deck slab at 84kN (19 kip) per jack- top view of deck
Minor diagonal cracks along both the central and the exterior edge of the deck slab were also
observed at this load level as seen in Figure 16 Small diagonal cracks initiating on the top
surface of the deck observed at each end of the specimen are shown in Figures 16(a) and (b)
(a) Detail of central edge of slab (b) Detail of exterior edge of slab
Figure 16 Initial cracking of deck slab at 84kN (19 kip) per jack - side view of deck
Additional opening of small cracks was observed at the load level of 102 kN (23 kip) per jack
and these cracks were marked with red ink as shown in Figure 17 The cracks that followed the
two top longitudinal bars opened further and became continuous over the majority of the
specimen Additional cracks going across the width of the specimen formed on the top of the
slab as seen in Figure 17
19
Figure 17 Crack marking of deck slab at 102 kN (23 kip) per jack- top view of deck
When the load level of 114 kN (26 kip) per jack was reached a large diagonal crack opened and
quickly propagated which was clearly visible on the central edge of the slab as shown in Figure
18(a) This load level was determined to be the ultimate capacity of the overhang for resisting
vertical loads
(a) Central side of slab (b) Exterior side of slab
Figure 18 Cracking observed at ultimate capacity- side view of deck
The cracking progressed rapidly along the top surface of the deck as shown in Figure 19 and the
concrete adjacent to the loading beam settled several millimeters as seen in Figure 20
20
Figure 19 Cracking observed at ultimate capacity- top view deck
Figure 20 Detail of cracking at ultimate capacity in central section of deck near loading beam
After the loading of the specimen was completed all testing equipment and instrumentation was
fully removed and the observed cracks were marked in orange ink The orange diagonal cracks
on the top surface of the deck face toward the hole in the deck as shown in the upper left-hand
corner of Figure 21
Figure 21 Cracks observed on top of slab tested to ultimate capacity
The loose concrete was then removed in order to better observe the failure surfaces as shown in
Figure 22 and Figure 23 Increased damage was present on the central side of the deck as
compared to the exterior side
21
Figure 22 Top view of deck slab tested to ultimate capacity after removal of loose concrete
In Figure 23(b) the slight deformation in the rebar due to the yielding of the steel is observed It
is also noted that the concrete remained firmly attached beyond the longitudinal rebar
(a) Edge of deck prior to loose concrete removal (b) After removal
Figure 23 Detail of most severely damage section
The primary variables in defining the overall structural response of the bridge deck slab are the
load per hydraulic jack at which significant damage or failure occurred and the corresponding
center deflection of the slab directly below the actuator Additional instrumentation serves to
add supplementary data regarding the deformation of the specimen during testing As observed
in Figure 24 the deflection of the three linear potentiometers directly below the loading beam
indicate comparable deflections for lower loading levels and higher deflections with increasing
load at the central edge of the overhang which contains linear potentiometer B4
22
20
40
60
80
100
120
140 10
9
8
0 2 4 6 8 10 Deflection (mm)
A4
B4
M4
A4 B4M4
1st cracks observed
2nd cracks observed
Ultimate Capacity
Def
lect
ion
(mm
)
A4 M4 B4
A4
B4
M4
2nd cracks observed
1st cracks observed
Ultimate Capacity
Load
per
hyd
raul
ic ja
ck (k
N)
7
6
5
4
3
2
1
00 24 36 48 60 72 84 96 102 114
Load Level (kNhydraulic jack)
(a) Load versus deflection profiles (b) Comparison of linear potentiometers below loading beam
Figure 24 Comparisons of deflections at the edge of the deck slab overhang
At the load level of 84 kN (19 kips) per hydraulic jack where cracking in the deck was first
observed equivalent to a uniform distributed dead load of 105 kNm (72 kipft) or
approximately 5x the nominal wall load linear potentiometers A4 and M4 deflected similarly
while the linear potentiometer B4 exhibited a 13 mm (0051 in) or 37 greater deflection value
At the load level of 102 kN (23 kip) per hydraulic jack where the 2nd set of crack marking took
place equivalent to a uniform distributed dead load of 126 kNm (87 kipft) or nearly 6x the
nominal wall load the deflection at B4 was 20 mm (0078 in) or 39 greater than the other two
linear potentiometers The difference is due to levels of cracking The profiles along the center
of the specimen (Figure 26) and at both edges (Figures 25 and 27) shown below exhibit similar
deflection profiles and indicate that negligible vertical deformations occur in the deck beyond the
adjacent stem wall due to edge loading of the deck slab overhang
23
0 0 kN Location of linear potentiometers
24 kNDistance from edge (mm)
Def
lect
ion
(mm
)
2 60 kN
84 kN 4
102 kN
114 kN 6
8
76 279
610 1524
A1 A2 A3 A4AA
10
Figure 25 Deflection profile along the outer edge of specimen (Line A)
0 kNLocation of linear potentiometers 0 Distance from edge (mm) 24 kN
A1 A2 A3 A4 Linear Potentiometer Designation
M1 M2 M3 M4 Linear Potentiometer Designation
76 279
610 1524
M1 M2 M3 M4 MM
8
10
Figure 26 Deflection profile along center of specimen (Line M)
0
60 kN
84 kN
2
4 102 kN
6 114 kN
Def
lect
ion
(mm
)
B1 B2 B3 B4 Linear Potentiometer Designation
0 kN Location of linear potentiometers 24 kNDistance from edge (mm)
76 279
610 1524
B1 B2 B3 B4114 kNBB
10
Figure 27 Deflection profile along the central edge of specimen (Line B)
2 60 kN
4
84 kN
6 102 kN
8
Def
lect
ion
(mm
)
24
The deflection profile shown in Figure 28 shows comparable deflections along the overhang at a
distance midway to the adjacent stem wall Figure 29 illustrates comparable deflections directly
below the point of load application along the overhang for lower load levels with less symmetric
deformations observed for higher load levels after cracking was observed throughout the
specimen Through a comparison of these figures the results indicate a symmetric structural
response for load levels prior to the initial observation of cracking in the specimen and greater
deflections on one side at higher loading levels
0 0 kN 24 kN
Location of linear potentiometers Distance from edge (mm) 2 84 kN
60 kN
3 102 kN
838
152
1524
3
B3
M3
A3D
efle
ctio
n (m
m) 114 kN
4
6
8
10 B3 M3 A3
Linear Potentiometer Designation
Figure 28 Deflections midway along overhang (Line 3)
0 0 kN
24 kN Location of linear potentiometers
Distance from edge (mm) 2 60 kN 4
838
152
1524
4
B4
M4
A4
Def
lect
ion
(mm
)
84 kN 4 102 kN
114 kN 6
8
10 B4 M4 A4
Linear Potentiometer Designation
Figure 29 Deflections directly below loading beam (Line 4)
25
46 Comparison with Theory
The max moment found via moment curvature analysis of 1172 kN-m (856 kip-ft) was within
65 of the actual moment applied to the structure at the max loading of 114 kN (26 kip) per
hydraulic jack which corresponds to an applied moment of 1100 kN-m (810 kip-ft) The
moment capacity estimate of 970 kN-m (716 kip-ft) determined using the ACI 318-08
prescribed equation was off from the experimentally determined moment capacity by 118
26
5 REHABILITATED TEST
The following section presents NSM FRP strengthening design options for achieving the desired
capacity increase and describes the implementation testing and analysis of the chosen
rehabilitation design
51 Calculations for Potential CFRP NSM Strengthening Schemes
The increased moment demand on the test specimenrsquos deck slab due to the addition of the
soundwall is calculated and this value is used as the basis for determining the desired capacity
increase The corresponding total area of NSM CFRP needed to achieve the desired moment
capacity increase is calculated and design options for five different available CFRP
reinforcement products are presented
The dead weight of a typical sound wall used for bridges in California was calculated from the
Caltransrsquo concrete masonry soundwall design on bridges [20] Using this design with normal
weight concrete the gravity load per unit length for the soundwall was determined to be 135
kNm (092 kipft) Note that the weight of the traffic barrier is not included as part of the
increased moment demand calculation because it is assumed that the weight of the traffic barrier
was already accounted for in the original design of the deck slab overhang The tested section of
overhang was 1600 mm (5 ft 6 in) long therefore the total load applied to the specimen from the
soundwall is 226 kN (508 kip) The equivalent moment applied to the structure due to this dead
load can be obtained by multiplying the total load applied by the distance between the applied
load and the edge of the stem also known as the moment arm The equivalent additional
moment demand due to the soundwall was found to be 1091 kN-m (805 kip-ft)
A successful repair would strengthen the overhang to accommodate this increased moment
demand with a reasonable safety margin For initial calculation purposes a safety margin of 3
was deemed appropriate
M demand _ increase = M wall sdot3 (6)
27
This translates to an increase in moment demand of 327 kN-m (241 kipmiddotft) Therefore the
NSM flexural strengthening will be designed to increase the capacity of the overhang by at least
this value The experimentally determined moment capacity of the as-built reinforced concrete
deck slab overhang without FRP was found to be 110 kN-m (81 kip-ft) Therefore the new
moment capacity after strengthening should be at least 1427 kN-m (1051 kip-ft) which
corresponds to a minimum required moment capacity increase of 297 percent over the capacity
of the as-built specimen without FRP
The increased moment capacity due to FRP strengthening is equal to the sum of the contribution
from the tension steel (compression steel is ignored for this calculation) and the contribution
from the FRP reinforcement
⎛⎜⎝
⎞⎟⎠
⎛⎜⎝
⎞⎟⎠
a aψ f+
The definitions of the variables in the above equation are shown below
Steel properties
As = Total area of tension steel in slab overhang test specimen
fs = Experimentally determined yield strength of steel reinforcement
d = Distance to centroid of tensile steel reinforcement
a = Depth of concrete compression block assuming rectangular stress distribution
FRP properties
M As f d Af f dminus sdot sdot minus (8)= strengthened fe fn y 2 2_
Ψ f = Additional reduction factor recommended by ACI 4402R (Section 961) [12]
df = Distance from the compression fiber to the centroid of the FRP
ffe = Efmiddotεfe Effective stress in the FRP assuming elastic behavior
Ef = Experimentally determined modulus of elasticity of FRP
εfe = Effective strain in FRP reinforcement
By rearranging equation 8 an expression for the area of FRP reinforcement required in order to
achieve a specified moment capacity increased can be obtained
28
⎛ a ⎞M n _ strengthened minus As f y ⎜ d minus ⎟ ⎝ 2 ⎠Af _ required = (9)
⎛ a ⎞ψ sdot f sdot ⎜ d minus ⎟f fe f⎝ 2 ⎠
The required area of FRP obtained from this expression can be used to evaluate the feasibility of
different FRP strengthening options Note that the area of FRP required is the total area needed
for the specimen overhang and thus must be distributed along the width of the slab overhang
52 Options for Rehabilitation
The seven product options evaluated for this rehabilitation design were different sizes of SIKArsquos
pultruded carbon fiber CarboDur rods and strips as well as Hughes Brothersrsquo pultruded carbon
fiber Aslan 500 rectangular rods The physical characteristics of each option are provided in
Table 2 for reference
29
Product
Type
Source Product
Designation
Diameter Thickness Width Area Tensile
Modulus
mm in mm in mm in mm2 in2 GPa Msi
Rod SIKA frac14 in dia 635 025 127 005 155 225
Rod SIKA 38 in dia 953 0375 279 011 155 225
Strip SIKA S512 12 0047 50 197 60 0093 165 239
Strip SIKA S812 12 0047 80 315 96 0149 165 239
Strip SIKA S1012 12 0047 100 394 120 0186 165 239
Bar Hughes
Brothers
2 2 0079 16 063 312 0049 124 18
Bar Hughes
Brothers
3 45 0177 16 063 713 0110 124 18
Table 2 Physical properties of pultruded CFRP strengthening product options [212223]
30
The number of reinforcements required to attain the desired moment capacity increase was
calculated for each of the seven potential options using calculations described in the previous
section (Equation 9) and the results are shown in Table 3 For calculation of the effective stress
in the FRP εfe a strain of 065 was assumed based on design recommendations for FRP postshy
strengthening of reinforced concrete slabs [24 25] The tensile modulus for each of the different
FRP reinforcement options was obtained from manufacturer reported data Since the FRP
reinforcement type had not been selected yet the distance from the compression fiber to the
centroid of the FRP df was assumed to be the full depth of the slab Note that this assumption
will slightly overestimate the moment capacity contribution from the FRP because for NSMR
applications the reinforcement is located slightly below the surface of the structure Assuming
that the centroid of the FRP reinforcement is below the surface of the structure by a distance of
between 2 mm (0079 in) and 10 mm (0393 in) the calculations would have overestimated the
moment capacity increase due to the FRP reinforcement by between 1 and 6
Spacing requirements were also considered in the calculations performed for each FRP
strengthening option The maximum spacing recommendations provided by the manufacturer
[26] state that on center spacing should be limited to no more than the lesser of 02 times the
span length (L) or five times the slab thickness (h)
slim it = min(02L 5h) (10)
Note that the span for cantilever is taken as twice the distance to the support This spacing limit
yields a maximum recommended spacing of 203 mm (8 in) Table 3 below shows the number of
units needed as well as the theoretical moment capacity increase for each type of CFRP
reinforcement As observed in the Table 3 spacing limitations govern rather than actual strength
requirement limitations Since all seven of the design options are able to achieve the increased
capacity requirements other aspects such as cost and constructability are now used to select the
FRP reinforcement system
One notable difference between the installation of CFRP strips as opposed to rods is the required
depth of grooves cut into the deck The 64 mm (14 in) diameter rods require 127 mm (12 in)
31
deep slots and the 95 mm (38 in) rods require 159 mm (58 in) deep rods while the strips only
require a 4 mm (016 in) deep groove From a construction viewpoint strips as opposed to rods
are far easier to implement due to required groove depth Given that there is often less cover on
the top of a slab than would be required cutting deeper grooves is hazardous in that the cuts
could easily cut through existing steel reinforcing bars Thus having shallower grooves is
preferred in Europe based on extensive field use
The lower modulus of the CFRP tape of 124 GPa (180 Msi) versus that of the CFRP strips 165
GPa (239 Msi) resulted in appreciably greater material usage for comparable strengthening
schemes As a comparison the S512 CFRP strip has an estimated moment capacity increase of
81 whereas the 3 size CFRP tape has an estimated moment capacity increase of only 71
and requires an additional 19 of material above that used for the strip to achieve this increase
Based on guidelines material cost considerations the CarboDur strips were recommended for
use to Caltrans On receipt of approval from Caltrans to use this option experimental work was
initiated using the flat option Because the smallest size strip far exceeded the required moment
capacity the CarboDur S512 strips were selected which have a 50 mm (2 in) width The
spacing was set at 203 mm (8 in) on center for the width of the test specimen such that nine total
CFRP strips were used The bars were extended past the point of inflection to achieve a
necessary development length of 300 mm (118 in)
32
Previously tested as-built specimen without FRP
Current specimen with to be strengthened using NSM CFRP strips
CFRP strips spaced at 203 mm (8 in) o c
Ld Point of inflection
Figure 30 Plan view of deck illustrating chosen CFRP strengthening scheme
33
R
einf
orce
men
t ty
pe
Prod
uct
Cro
ss-
sect
iona
l Are
a
of u
nits
ne
eded
Spac
ing
wo
co
nsid
erin
gsp
acin
g lim
its
Spac
ing
used
Act
ual
of
uni
ts
Tot
al a
rea
ofFR
P us
ed
The
oret
ical
m
omen
t ca
paci
ty
Mom
ent
capa
cit y
incr
ease
(Rod
or s
trip)
(N
ame
and
size
) (m
m2 )
(in 2 )
(rou
nded
up
)
(rou
nded
tone
ares
t in)
(c
onsi
derin
g sp
acin
g lim
its )
(rou
nded
up
) (m
2 )(in
2 )m
(kN
-m)
(kip
-ft)
(mm
) (in
) (m
m)
(in)
Rod
1
4
diam
eter
32
0
05
7 25
4 10
10
2 4
9 22
6 0
45
140
7 10
37
28
Rod
3
8
diam
eter
71
0
11
4 43
2 17
20
3 8
9 63
9 0
99
191
8 14
15
74
Strip
S5
12-
50m
m
wid
th
60
009
3 4
432
17
203
8 9
540
084
18
24
134
5 66
Strip
S8
12-
80m
m
wid
th
96
014
9 3
559
22
203
8 9
865
134
23
32
172
0 11
2
Strip
S1
012-
10
0mm
w
idth
12
0 0
186
2 83
8 33
20
3 8
9 10
80
167
25
66
189
2 13
3
Tape
2
31
0
049
9 20
3 8
203
8 9
281
044
13
15
969
20
Tape
3
71
0
11
4 43
2 17
20
3 8
9 64
2 0
99
173
1 12
76
57
Table 3 Calculation table using different FRP strengthening options
34
53 Rehabilitation Construction
The following section details the implementation of the NSMR strengthening scheme chosen in
Section 52 Nine (9) rectangular groves spaced at 203 mm (8 in) oc were cut in the top deck of
the test specimen with dimensional tolerances of 70 mm - 76 mm (2 frac34 in - 3 in) for the width
and 6 mm - 13 mm (frac14 in to frac12 in) for depth The grooves were each 274 m (8 ft) long and the
cut grooves are shown in Figure 31
Figure 31 Grooves cut in deck for NSM strengthening
After the grooves were cut to the proper dimensions the surface was roughened to achieve the
minimum required concrete surface profile (CSP) of 3 as defined by the ICRI surface profile
guidelines [27]
The CarboDur S 512 carbon fiber laminate strips were cut to length and the top and bottom
surfaces were wiped clean using methyl ethyl ketone (MEK) to remove all residual carbon dust
from the surface prior to the installation of strain gages on the top surface of the strips An
additional cleaning with MEK was performed immediately prior to installation of the strips into
the test specimen to remove any remaining contaminates and surface oxidization A highshy
modulus high-strength structural epoxy paste known as SikaDur 30 was used for bonding the
CFRP strips to the concrete The structural properties of the CarboDur S 512 strips and SikaDur
30 resin system were experimentally determined through material characterizations performed at
the University of California San Diego within the authorsrsquo research group and these properties
are shown below from [28]
35
Tensile Properties (ASTM D-638)
SikaDur 30
Mean Standard Deviation 7 day Tensile Strength 2529 MPa (3671 ksi) 254 MPa (0369 ksi) Modulus of Elasticity 693 GPa (1006 Msi) 048 GPa (00697 Msi)
Table 4 Tensile properties of SikaDur 30 resin system [28]
Tensile Properties (ASTM D-3039)
CarboDur S 512
Mean Standard Deviation Ultimate Tensile Strength 2505 MPa (3636 ksi) 8285 MPa (120 ksi) Ultimate Tensile Modulus 1381 GPa (2005 Msi) 522 GPa (076 Msi)
Ultimate Tensile Strain 1580 0084
Table 5 Tensile properties of SIKA CarboDur S512 CFRP strips [28]
After the SikaDur 30 resin system was thoroughly mixed the neat resin was applied to each
groove as a primer using a spatula to form a uniform thickness of 16 mm (116 in) as shown in
Figure 32 A specialized applicator was also used to apply a precisely controlled thickness of
resin onto each of the carbon fiber strips and the strips were carefully placed in the grooves
Figure 32 Application of resin system used in grooves to bond CFRP strips to concrete
A rubber roller was then used to properly seat each strip using adequate pressure to force
SikaDur 30 gel out on both sides of the laminate so that the bond line between the concrete and
36
FRP strip does not exceed 3 mm (18 in) [29] Excess gel was carefully removed and the
installed strips are shown in Figure 33
Figure 33 CFRP strips installed
After the resin system had cured for 24 hours a low viscosity resin system which was used for
the wear surface applied to the top of the FRP strips was poured over the top of the strips up to
the level of the original concrete deck The top layer of resin was mixed with sand to allow for
improved thermal compatibility with the surrounding concrete and to provide a non-skid wear
surface for the top of the deck After the installation of the NSM CFRP strengthening scheme
was completed the instrumentation was installed and the specimen was ready for testing to
determine the effectiveness of the repair
In order to monitor the curing of the CarboDur 30 resin system used to attach the CFRP strips to
the deck slab small test samples were made using resin mixed for installation of the strips and
the samples were placed adjacent to the test specimen to ensure comparable curing conditions
These resin samples were tested daily for a period of seven days using both dynamic mechanical
thermal analysis (DMTA) and differential scanning calorimetry (DSC) techniques The results
obtained from these experiments regarding the glass transition temperature Tg of the resin
system are shown in Table 6 The trends from the glass transition temperature data over time
shown below indicate that the SikaDur 30 resin system achieved nearly full cure after
approximately 4-5 days
37
Time DMTA Tg results DSC Tg results degC degC
Day 1 5713 3750 Day 2 5915 3850 Day 3 --- ---Day 4 6439 4150 Day 5 6226 4225 Day 6 6426 4300 Day 7 6361 4300
Table 6 Tg progression of CarboDur 30 resin used in NSMR installation
54 Capacity Calculations
Following the implementation of the chosen NSM CFRP strip rehabilitation scheme theoretical
predictions for capacity were recalculated using the experimentally determined material
properties given in Table 6 along with an assumed CFRP strip embedment depth of 3 mm (18
in) and reduced FRP strain capacity of 065 as described in Section 51 The increased
moment capacity calculation due to FRP strengthening described in Section 51 yields a
theoretical moment capacity of 1673 kN-m (1234 kip-ft) which corresponds to a 52 increase
in moment capacity over the experimentally determined value for the as-built specimen The
moment curvature analysis performed on the FRP rehabilitated specimen yielded a moment
capacity of 1855 kN-m (1364 kip-ft) which corresponds to a 69 increase in load carrying
capacity over the as-built specimen
38
152
55 Instrumentation
The total instrumentation for this experiment consisted of 16 linear potentiometers 47 strain
gages and 2 load cells One central row and two outer rows each with four linear potentiometers
were used to measure the vertical deflection of the deck slab The four linear potentiometers
within each row were positioned at the midspan of the adjacent cell above the adjacent stem in
between the stem and the loading beam and directly below the loading beam as shown in
Figures 11(a) and (b)
2438
1 2 3 4
M
B
A
76
610 279CL
152
1524
838
Elastomeric Bearing Pad 1524
Linear Potentiometers CL
1676
(a) Plan view of specimen (b) Section of deck slab with linear potentiometer details
Figure 34 Position of linear potentiometers for measuring deflections of deck slab
The deflection of the elastomeric bearing pad was measured using four linear potentiometers
with one linear potentiometer at each corner of the loading beam using the same layout as the asshy
built specimen shown in Figure 12
All 47 strain gages were applied to the top side of the nine pultruded CFRP strips parallel to the
direction of the fibers as shown in Figure 33 The two strain gage layout patterns used on this
specimen illustrated in Figure 35 were applied to alternating CFRP strips throughout the width
of the specimen as shown in Figure 36
39
Pattern 1
1626 1168
737 483
76
22362
2057
G F E D C B A
Pattern 2
1168 483
2057
F D B
Figure 35 Strain gage patterns and designations
G F E D C B A
1
2 1
2 1
2 1 2 1
Pattern
Figure 36 Position of strain gages attached to CFRP strips
40
Figure 37 Completed installation of CFRP strips with full instrumentation setup
41
56 Loading Protocol
The overhang of the deck slab was loaded using the test setup shown in Figure 7 and described in
Section 31 by incrementally increasing the hydraulic pressure supplied to the two hydraulic
jacks Adequate time was taken between loading levels to ensure that the hydraulic pressure had
stabilized and the pressure had equalized as much as possible between the two jacks The load
applied to the deck slab was monotonically increased following the loading sequence shown in
Table 7 The load was held briefly at each load level so that observations could be made
Loading step
Load per hydraulic
jack
Equivalent uniform
distributed load Load Level Notes
(kN) (kip) (kNm) (kipft) 1 24 5 300 21 --- Initial load 2 36 8 450 31 2x wall load ---3 48 11 600 41 --- ---4 60 13 750 51 --- ---5 72 16 900 62 4x wall load ---
6 84 19 1050 72 1st set of cracks observed
for as-built specimen ---
7 90 20 1125 77 5x wall load ---
9 101 23 1263 87 Calcd moment capacity asshy
built specimen ---
10 114 26 1425 98 Ultimate capacity as-built
specimen --shy
11 116 26 1450 99 Calcd shear capacity asshy
built specimen 1st set of cracks observed
12 130 29 1625 111 ---13 136 31 1700 116 --- 2nd set of cracks observed 14 142 32 1775 122 ~8x wall load ---15 148 33 1850 127 --- ---16 160 36 2000 137 ~9x wall load 3rd set of cracks observed 17 166 37 2075 142 --- ---18 172 39 2150 147 --- ---19 178 40 2225 152 ~10x wall load ---20 184 41 2300 158 --- 4th set of cracks observed 21 190 43 2375 163 --- ---22 196 44 2450 168 ~11x wall load Ultimate Capacity
Table 7 Loading protocol used for FRP rehabilitated specimen
42
57 Experimental Results
The ultimate capacity of the FRP rehabilitated deck slab was reached at an applied load of 196
kN (44 kips) per hydraulic jack equivalent to a uniform distributed load of 245 kNm (168
kipft) which is 11 x the nominal soundwall load At this load level the deflection of the middle
of the slab under the loading beam was 873 mm (034 in) The maximum strain value achieved
in the CFRP strips at ultimate capacity was 3846 microstrains At the ultimate capacity of the
specimen debonding of the FRP from the concrete occurred due to a tensile failure of the
concrete cover layer located between the FRP and the top layer of rebar This loss of
compatibility within the section was quickly followed by the opening and propagation of a large
diagonal crack along the compression strut formed with the adjacent stem wall
Cracking was observed and marked on the specimen at the four load levels of 116 kN (26 kip)
136 kN (31 kip) 160 kN (36 kip) and 184 kN (41 kip) per hydraulic jack The extent of visible
cracking on the top and sides of the deck of the FRP rehabilitated specimen shown in Figure 38
and Figure 39 occurred at the load level of 184 kN (41 kip) per hydraulic jack which was over
twice the load at which comparable cracking was observed on the as-built specimen The
comparable initial cracking observed on the as-built specimen which was described in section
45 occurred at a load level of 84 kN (19 kip) per hydraulic jack and is shown in Figure 15 and
Figure 16 on page 19 The thin cracking on the top of the deck surface that occurred in the FRP
rehabilitated specimen observed at the load level of 184 kN (41 kip) per hydraulic jack was
discontinuous and approximately followed the top longitudinal steel reinforcement bars adjacent
to the edge of the stem wall as shown in Figure 38
43
Figure 38 Craking of deck slab at 184 kN (41 kip) per jack- top view of deck
Minor diagonal cracks along both the edges of the slab which initiated from the top surface of
the deck are shown in Figure 39
(a) Detail of central edge of slab (b) Detail of exterior edge of slab
Figure 39 Cracking of deck slab at 184 kN (41kip) per jack - side view of deck
When the load level of 196 kN (44 kips) per hydraulic jack was reached the ultimate tensile
strength of the top concrete cover layer was exceeded and the bond between the FRP and the
concrete was lost This damage was quickly followed by the opening and propagation of a large
diagonal crack along the compression strut formed with the adjacent stem wall shown in Figure
40 This load level was determined to be the ultimate capacity of the overhang for resisting
vertical loads
44
(a) Central side of slab (b) Exterior side of slab
Figure 40 Cracking observed at ultimate capacity- side view of deck
The top surface of the deck slab after failure of the specimen can be observed in Figure 41 and
the cracking due to the interfacial failure between the FRP strips and the concrete can be
observed in the in the upper left hand corner of Figure 41 adjacent to the loading beam
Figure 41 Cracking of deck slab at ultimate capacity- top view of deck
After the loading of the specimen was completed all testing equipment and instrumentation was
fully removed to allow for easier observation of the damage present on the specimen Figure 42
shows the top view of the deck at ultimate capacity Any loose concrete was removed in order
to better observe the failure surfaces however unlike the as-built specimen in which significant
loose concrete was removed after it was tested nearly all of the concrete remained attached to
the tested FRP rehabilitated specimen despite the interfacial failure that occurred between the
FRP and the concrete Note that the debonding of the CFRP strips from the concrete occurred
adjacent to where the tensile stresses on the top of the deck are maximum while the CFRP strips
remained attached for the majority of the of the slab overhang
45
Figure 42 Side view of tested FRP rehabilitated specimen after removal of loose concrete
As observed in Figure 43 the three linear potentiometers directly below the loading beam
maintained comparable deflections throughout the loading range applied to the test specimen At
the failure load for the specimen the deflections of these three linear potentiometers were within
10 of each other which corresponds to less than 1 mm (004 in) difference in deflection values
46
80
140
10220 Ultimate Capacity Ultimate Capacity B4200 9 4th cracks
observed 4th cracks observed 180 8
M43rd cracks 160 3rd cracks 7observed
Load
per
hyd
raul
ic ja
ck (k
N)
Def
lect
ion
(mm
) observed 2nd cracks observed B4
120 1st cracks M4
100 observed A4
A46 2nd cracks
5 observed 1st cracks 4 observed B4B4 3
M460 2M4 A440
20 A4 1
0 0
0 2 4 6 8 10 24 60 84 116 136 160 172 184 196 Deflection (mm) Load per hydralulic jack (kN)
(a) Load versus deflection profiles (b) Comparison of linear potentiometers below loading beam
Figure 43 Comparisons of deflections at the edge of the deck slab overhang
The profiles along the center of the specimen (Figure 45) and at both edges (Figure 44 and
Figure 46) shown below exhibit similar deflection profiles throughout the loading range
0 24 kN Location of linear potentiometers
Distance from edge (mm) 60 kN 2 84 kN
B3 B4B1 B2 BB
Def
lect
ion
(mm
)
116 kN 4
136 kN
160 kN 6
8 184 kN 76
279 610 196 kN 101524 B1 B2 B3 B4
Linear Potentiometer Designation
Figure 44 Deflection profile along the central edge of specimen (Line B)
47
Location of linear potentiometers 0 24 kN Distance from edge (mm)
279 610
1524
76
M1 M2 M3 M4
60 kN 2 84 kN
M1 M2 M3 M4 Linear Potentiometer Designation
MM
Def
lect
ion
(mm
) 116 kN 4
136 kN
160 kN 6
184 kN 8
196 kN
10
Figure 45 Deflection profile along center of specimen (Line M)
0Location of linear potentiometers 24 kN Distance from edge (mm)
60 kN 2
84 kN
A1 A2 A3 A4 Linear Potentiometer Designation
279 610
1524
76
A1 A2 A3 A4 AA
Def
lect
ion
(mm
)
116 kN
136 kN
6
4
160 kN
8 184 kN
196 kN 10
Figure 46 Deflection profile along the outer edge of specimen (Line A)
The deflection profiles shown in Figure 47 and Figure 48 also indicate comparable deflections
along the overhang at a distance midway to the adjacent stem wall and directly below the point
of load application respectively
48
0 24 kN 60 kN 84 kN Location of linear potentiometers 116 kN 2Distance from edge (mm)
136 kN 160 kN
A3 M3 B3 Linear Potentiometer Designation
Def
lect
ion
(mm
)
3 184 kN 4 196 kN
8
10
838
152
1524
3
A3
M3
B3
Figure 47 Deflections midway along overhang (Line 3)
6
0
2
4
6
8
10
Def
lect
ion
(mm
)
84 kN 60 kN 24 kN
196 kN
184 kN
116 kN
136 kN
160 kN
A4 M4 B4
Location of linear potentiometers Distance from edge (mm)
838
152
1524
4
4
A4
M4
B4
Linear Potentiometer Designation
Figure 48 Deflections directly below loading beam (Line 4)
The strains in the FRP strips are also examined throughout the NSM CFRP rehabilitated
specimen The strain profiles along the edges and the middle of the specimen are shown in
Figure 49 Figure 50 and Figure 51 respectively These strain profiles indicate that the
maximum strain in the CFRP strips occurs directly above the edge of the stem wall adjacent to
the deck slab overhang referred to with the designation ldquoline Brdquo At ultimate capacity the
maximum strain in the specimen of 3846 microstrains occurs in strain gage 4B which is located
in line B near the middle of the specimen overhang
49
4000
Location of strain gages 3500 (See Figure for detailed schematic)
196 kN 3000
Stra
ins (
mic
rost
rain
s) 184 kN 9G 9F 9E 9D 9C 9B 160 kN9 9 2500
2000
1500
1000 60 kN
500 24 kN 0
136 kN 116 kN
84 kN
(Note Vertical gridlines in figure are -500 positioned at a spacing of 3048 mm (1 ft) 9G 9F 9E 9D 9C 9B Strain Gage Designation
Figure 49 Strain profile along the central edge of specimen (Line 9)
4000 196 kN
3500 184 kN (See Figure for detailed schematic)
Location of strain gages
3000 160 kN136 kN
Stra
ins (
mic
rost
rain
s)
2500
2000
1500
1000 60 kN 500 24 kN
0 (Note Vertical gridlines in figure are
-500 positioned at a spacing of 3048 mm (1 ft) 5G 5F 5E 5D 5C 5B 5A Strain Gage Designation
Figure 50 Strain profile along the middle of specimen (Line 5)
4000 Location of strain gages
(See Figure for detailed schematic) 3500 196 kN
116 kN
5G 5F 5E 5D 5C 5B 5A 5 84 kN 5
Stra
ins (
mic
rost
rain
s) 3000
2500
2000
1500
1000
1 500 24 kN
184 kN
160 kN136 kN 116 kN
84 kN
60 kN 1G 1F 1E 1D 1C 1B 1A 1
0(Note Vertical gridlines in figure are positioned at a spacing of 3048 mm (1 ft))
-500 1G 1F 1E 1D 1C 1B 1A
Strain Gage Designation
Figure 51 Strain profile along the outer edge of specimen (Line 1)
50
The strains drop off sharply for distances further away from the end of the overhang with the
majority of the strain gages on the opposite side of the stem wall (line C) exhibiting less than a
third of the strain values shown in line B The sharp drop in strain values at distances away from
the adjacent stem wall and the insignificant strains within these regions indicate that the
significantly shorter lengths of CFRP strips could be used to optimize material usage and
improve constructability without affecting load transfer and the overall system response
The strains along line B the location where the maximum strains occur in the specimen is shown
in Figure 52 This figure indicates that the distribution of strains was even along the specimen
until the load level of 116 kN (26 kip) per jack was reached At this level cracking was first
observed on the specimen and higher loading levels showed comparable but slightly less uniform
strains along the specimen The average strain along line B in the specimen at ultimate capacity
was 3423 microstrains whereas the minimum and maximum strains along line B were 2943
microstrains and 3846 microstrains respectively
4000
Location of strain gages 3500(See Figure for detailed schematic)
1B 3B 4B 5B 6B 7B 8B 9B Strain Gage Designation
Stra
ins (
mic
rost
rain
s) 3000 196 kN B 184 kN
160 kN 2500
1B
4B 3B
5B
9B 8B 7B 6B
B
136 kN 2000 116 kN
1500 84 kN
1000 60 kN
500
24 kN 0
(Note Vertical gridlines in figure are positioned at a spacing of 3048 mm (1 ft))
Figure 52 Strains along the edge of the stem wall adjacent to the deck slab overhang (Line B)
Using the strain data throughout the specimen and following a procedure described by Siem et al
[24] the shear stress between the concrete and the CFRP strips were calculated using the
following equation
51
9
(ε minus ε )sdot E sdot tn+1 n L Lτ nn+1 = (11)(x minus x )n+1 n
Where (x minus x )= distance between two strain gages EL= the tensile elastic modulus of then+1 n
CFRP strip and tL = thickness of the CFRP strips For these calculations EL= 1381 GPa (2005
Msi) and tL = 12 mm (0047 in) were used for the CFRP strips The calculated shear stress
values within the adhesive are simply the mean value between two strain gages which ignore
localized stress peaks and gradients
Distance from west edge (m) 27 24 21 18 15 12 09 06 03 00
Location of strain gages 20 (See Figure for detailed schematic)
15
196 kN
116 kN 160 kN
9B9G 9F 9E 9D 9C
(Note Vertical gridlines in figure are positioned at a spacing of 3048 mm (1 ft)
9
Stre
ss (M
Pa) 10
05
00
-05
-10
-15
-20
Figure 53 Calculated shear stress within adhesive along the central edge of specimen (Line 9)
Distance from west edge(m) 27 24 21 18 15 12 09 06 03 00
Location of strain gages (See Figure for detailed schematic) 20
196 kN
116 kN
160 kN
5 00
(Note Vertical gridlines in figure are positioned at a spacing of 3048 mm (1 ft)
3B5G 5F 5E 5A5D 5C
Stre
ss (M
Pa)
15
10
05
-05
-10
-15
-20
Figure 54 Calculated shear stress within adhesive along the middle of specimen (Line 5)
52
5
Distance from west edge(m) 27 24 21 18 15 12 09 06 03 00
Location of strain gages 20 (See Figure for detailed schematic)
196 kN
116 kN 160 kN
Stre
ss (M
Pa) 15
10
05
00
-05 3
(Note Vertical gridlines in figure are positioned at a spacing of 3048 mm (1 ft)
3B3G 3F 3E 3D 3C 3A 3
-10
-15
-20
Figure 55 Calculated shear stress within adhesive along an interior CFRP strip (Line 3)
Distance from west edge (m) 27 24 21 18 15 12 09 06 03 00
Location of strain gages 20 (See Figure for detailed schematic)
-20
196 kN
116 kN 160 kN
Stre
ss (M
Pa)
15
10
05
00
-05
-10
-15
1G 1F 1E 1D 1B1C 1A 11
(Note Vertical gridlines in figure are positioned at a spacing of 3048 mm (1 ft))
1G 1F 1E 1D 1C 1B 1A Strain Gage Designation
Figure 56 Calculated shear stress within adhesive along the outer edge of specimen (Line 1)
53
After the testing of the NSM CFRP rehabilitated specimen was completed the overhang of the
specimen was cut off and carefully removed from the rest of the test specimen as shown in
Figure 57 to allow for further examination of this critical region
432 mm (17 in)
Figure 57 Location of cut for removal of FRP rehabilitated overhang from test specimen
One point of interest to examine on the removed overhang was the actual location of the CFRP
strip reinforcement within the section Figure 58 shows that the actual embedment depth of the
near surface mounted CFRP strips was approximately 6 mm (025
in) and the actual thickness of the SikaDur 30 resin layer used to
bond the CFRP strips to the concrete was also approximately 6 mm
(025 mm) An embedment depth of 6 mm (025 in) is reasonable
for NSM applications because it allows enough space for an
adequate top surface of resin which will serve as environmental
protection and the wear surface for the deck However the 6 mm
(025 mm) thickness of the SikaDur 30 bottom resin layer exceeded
the maximum manufacturer recommended value of 3 mm (18
inch) While the current system performed very well the use of an
overly thick resin layer could have had an negative effect on the
overall structural response of the system Figure 58 Detail showing actual location of reinforcement
Figure 59 shows the failure surface of an FRP strip which has been detached from the top
surface of the deck The center portion of the strip with the firmly attached concrete was the
region in which the interfacial failure in the concrete occurred while the outer sections of the
strip were neatly detached from the resin system due to the method of removal of the strip
54
Figure 59 Detail of failure surface of FRP strip
58 Comparison with Theory
The NSM CFRP rehabilitated specimen reached ultimate capacity under an applied load of 196
kN (44 kip) per hydraulic jack which is equivalent to an applied moment of 1892 kN-m (1392
kip-ft) This improved performance corresponds to a 72 increase in ultimate capacity over the
as-built specimen which failed under an applied load of 114 kN (26 kip) corresponding to an
applied moment of 1100 kN-m (810 kip-ft) The ACI 440-02 calculation for externally bonded
FRP reinforcement predicted a maximum moment capacity of 1660 kN-m (1224 kip-ft) which
corresponds to a 51 increase in load carrying capacity over the experimentally determined
capacity of the as-built specimen The moment curvature analysis predicted a maximum moment
capacity of 1855 kN-m (1364 kip-ft) which corresponds to a 69 increase in load carrying
capacity over the as-built specimen The theoretical predictions and experimental results were
within 12 using the ACI 440 approach and were in close agreement with only a 2 error
using the moment curvature analysis The larger disagreement with experimental data found
from the ACI 440 moment capacity increase equation likely exists because this calculation is a
more simplified approach that does not take into account the over strength of the steel
reinforcement
55
3rd cracks observed
1st cracks observed
200
220
59 Comparison with As-Built
The ultimate capacity of the near surface mounted CFRP strip rehabilitated slab was reached at
an applied load of 196 kN (44 kips) equivalent to a uniform distributed load of 245 kNm (168
kipft) which is 11x the nominal soundwall load This ultimate capacity is 78 greater than that
obtained by the as-built specimen which occurred at 114 kN (26 kips) per hydraulic jack
equivalent to a uniform distributed load of 1425 kNm (98 kipft) which is 633x the nominal
wall load The center deflections under the loading beam for both specimens over the complete
loading ranges applied are compared in Figure 60(a) and Figure 60(b) At the failure load level
of the as-built specimen the as-built specimen had a center deflection under the loading beam of
636 mm (025 in) whereas the FRP rehabilitated specimen deflected approximately half that of
the as-built specimen or 333 mm (013 in) At ultimate capacity of the FRP rehabilitated
specimen the center deflection under the loading beam was 873 mm (034 in) which indicates
the rehabilitated specimen exhibited a 318 increase in deformation capacity over the as-built
specimen
10
0 2 4 6 8 10
Ultimate Capacity
1st cracks observed
2nd cracks observed
4th cracks observed
As-built test
3rd cracks observed
2nd cracks observed 1st cracks observed
Ultimate Capacity
Rehabilitated test
Def
lect
ion
(mm
)
6
5
4
360
240 120
0 0
Deflection (mm) Load per hydralulic jack (kN)
As-built specimenRehabilitated specimen
Ultimate Capacity
Ultimate Capacity
24 36 48 60 72 84 96 102 114 136 160 184 196
9
180
Load
per
hyd
raul
ic ja
ck (k
N) 8
160 7 140
120
100
80
a) Load versus deflection profiles (b) Comparison of linear potentiometers below loading beam
Figure 60 Comparisons of middle center deflections of the deck slab overhang
In addition to increasing the overall load and deformation capacity of the system the near
surface mounted CFRP strips act to increase the stiffness and improve the stability of the system
56
The load versus deflection profile shown in Figure 60(a) shows the significantly increased
stiffness and more linear profile for the FRP rehabilitated specimen over the as-built specimen
The deflection profile comparison at the 114 kN (26 kips) per jack load level along the middle of
the two slabs is shown in Figure 61 This figure illustrates that for the same load level the
deflections within the FRP rehabilitated specimen are lower than the deflections of the as-built
specimen throughout the deck slab and not just at the point of load application
Location of linear potentiometers 0 Distance from edge (mm)
279 610
1524
76
M1 M2 M3 M4
2
4
M M
6
8
10
FRP rehabilited specimen at 114 kN per jack
As-built specimen at 114 kN per jack
M1 M2 M3 M4 Linear Potentiometer Designation
Figure 61 Comparison of deflection profiles along center of specimens (Line M)
The first set cracking observed on the as-built specimen occurred at the load level of 84 kN (19
kip) whereas the first set cracking observed on the FRP rehabilitated specimen occurred at 116
kN (26 kip) which is corresponds to a 38 greater load A comparison of the deflection profiles
along the center of the specimens at these loading levels shown in Figure 62 reveals nearly
identical deformations for the two specimens
57
10
10
M1
1524
279 610
76
M2 M3 M4
Location of linear potentiometers Distance from edge (mm)
FRP rehabilited specimen at 1st observed cracking
(116 kN per jack)
0
2 As-built specimen
at 1st observed cracking (84 kN per jack) 4
M
Def
lect
ion
(mm
)
M
6
8
M1 M2 M3 M4 Linear Potentiometer Designation
Figure 62 Comparison of center deflection profiles at 1st observed cracking loads (Line M)
The second set of cracking observed on the as-built specimen occurred at the load level of 101
kN (23 kip) whereas the second set of cracking observed on the FRP rehabilitated specimen
occurred at 136 kN (31 kip) which is corresponds to a 35 greater load The deflection profile
comparison at the load levels where the second set of cracking was observed in Figure 64 also
exhibits nearly identical deformations for the two specimens This indicates that while the FRP
reinforcement acts to stiffen the system and increase the load carrying capacity of the overhang
region the shape of the deflection response profile of the system is not modified significantly
with the addition of the CFRP strips
0FRP rehabilited specimen at 2nd observed cracking
(136 kN per jack)
As-built specimen at 2nd observed cracking
(101 kN per jack)
Location of linear potentiometers Distance from edge (mm)
279 610
1524
76
M M1 M2 M3 M4
2
4
Def
lect
ion
(mm
)
M
6
8
M1 M2 M3 M4 Linear Potentiometer Designation
Figure 63 Comparison of center deflection profiles at 2nd observed cracking loads (Line M)
58
Figure 64 shows the side by side top decks of the two specimens after testing has been completed
and all loose concrete on the top deck removed Details of the critical region of the as-built and
FRP rehabilitated top deck are shown in Figure 65 and Figure 66 respectively
Figure 64 Top view of deck slab tested to ultimate capacity after removal of loose concrete
59
For the as-built specimen extensive damage and spalling of the concrete on the top of the deck
slab was seen Yielding in the transverse steel reinforcement followed by loss of aggregate
interlock resulting in failure was observed
Figure 65 Detail of cracking observed at ultimate capacity- top view of as-built deck
For the FRP rehabilitated specimen negligible spalled concrete and loose concrete rubble was
detected A concrete splitting failure mode was observed in the FRP rehabilitated specimen
Figure 66 Detail of cracking observed at ultimate capacity- top view of FRP rehabilitated deck
60
6 SUMMARY OF RESULTS AND RECOMMENDATIONS FOR FUTURE RESEARCH
Experimental results from the testing of the rehabilitated specimen indicate that the NSMR
strengthening scheme was successful at achieving the desired load carrying capacity increase
The ultimate load carrying capacity of the FRP rehabilitated specimen was 196 kN (44 kips) per
hydraulic jack which was 78 higher that the ultimate load of the as- built specimen of 114 kN
(26 kips) per hydraulic jack This value well exceeded the desired load capacity increase of
297 above the experimentally determined capacity of the as-built specimen exhibited a very
stable structural response and increased the deformation capacity of the system The theoretical
moment capacity predictions for the as-built specimen were within 11 and 65 of the
experimentally determined value using ACI 318 and moment curvature analysis respectively
The theoretical moment capacity predictions for the FRP rehabilitated specimen were within
12 of the experimental value using the modified ACI 440-02 approach and were within 2
using moment curvature analysis
The NSM FRP rehabilitated specimen exhibits a variety of structural performance improvements
over the as-built specimen including increased ultimate load carrying capacity enhanced
deformation capacity and more stable overall structural performance Design options for the
near surface mounted CFRP strengthening schemes allow for great flexibility in terms of
tailoring the reinforcement parameters for specific applications With consideration of the
minimal disruption to traffic flow and ease of installation this system is a viable and very
attractive rehabilitation option for bridge deck slab overhangs
The purpose of Phase 1 was to conduct an experimental analysis of the use of NSM for purposes
of strengthening and to provide the basis for the planning of Phase 2 as detailed in the initial
proposal submitted to Caltrans Based on the extensive literature review already conducted
(although according to the project funding provided by Caltrans is to be completed and reported
on in Phase 2) and on the experimental results the following aspects are recommended for further
study in Phase 2
61
bull Complete review of the failure modes and mechanisms seen with use of barsrods as
compared to flat strips for purposes of documenting advantages of strips It is noted that
a very brief summary is given in the introductory portion of this report
bull Optimization of groove dimensions and spacing for NSM use through both analytical and
experimental study
bull Study of adhesive rheology and bond quality as well as durability
bull Study of minimum development length and effect of insertion into girder stems
bull Study of use for specific strengthening applications
bull Development of design guide for Caltrans and development of example comparing NSM
use to surface bonding
It is emphasized that the studies should be conducted on specimens of sufficient size since small
scale tests are likely to provide erroneous results due to effects of scale and configuration It is
recommended that these tests only be conducted after a review of advances in Europe and
Australia are completed and sufficient analytical work is completed on optimization of grove
dimensions and spacing Since the efficacy of the method is intrinsically related to the ability of
the adhesive to not only bond the reinforcement to the concrete substrate but to also enable
efficient stress transfer study also needs to be conducted on adhesive rheology performance
characteristics and cure It is recommended that this be based on the completed durability study
which should provide a base-line for further study Also since it is likely that the NSM will be
covered by asphalt the effect of heat due to asphalt on the adhesive and bond should also be
studied
62
7 REFERENCES
[1] VM Karbhari and L Zhao ldquoUse of composites for 21st century civil infrastructurerdquo
Computer Method Appl Mech Eng 185 pp 433ndash454 (2000)
[2] S Rizkalla T Hassan N Hassan ldquoDesign recommendations for the use of FRP for
strengthening of concrete structuresrdquo Prog Struct Engng Mater 5 pp 16ndash28 (2003)
[3] K K Ghosh ldquoAssessment of FRP composite strengthened reinforced concrete bridge
structures at the component and systems level through progressive damage and nonshy
destructive evaluation (NDE) [PhD dissertation] University of California San Diego
(2006)
[4] L De Lorenzis JG Teng ldquoNear-surface mounted FRP reinforcement An emerging
technique for strengthening structuresrdquo Composites Part B 38 pp 119-143 (2007)
[5] R Parretti A Nanni ldquoStrengthening of RC Members Using Near-Surface Mounted FRP
Composites Design Overviewrdquo Advances in Structural Engineering 7 5 pp 1-16 (2004)
[6] J R Yost S P Gross D W Dinehart and J J Mildenberg ldquoFlexural Behavior of
Concrete Beams Strengthened with Near-Surface-Mounted CFRP Stripsrdquo ACI Structural
Journal July-August pp 430-437(2007)
[7] L A DeLorenzis A Nanni and A L Tegila ldquoFlexural and Shear Strengthening of
Reinforced Concrete Structures with Near Surface Mounted FRP Barsrdquo Proceedings of the
3rd International Conference on Advanced Composite Materials in Bridges and Structures
Ottawa Canada Aug 15-18 pp 521-528 (2000)
[8] El-Hacha R and Rizkalla S 2004 ldquoNear-Surface-Mounted Fiber- Reinforced Polymer
Reinforcements for Flexural Strengthening of Concrete Structuresrdquo ACI Structural Journal
V 101 V 5 Sept-Oct pp 717-726
[9] R Parretti and A Nanni ldquoStrengthening of RC Members Using Near-Surface Mounted
FRP Composites Design Overviewrdquo Advances in Structural Engineering V 7 (5) (2004)
63
[10] E Bonaldo J A Oliveira de Barros and P B Lourenccedilo ldquoEfficient Strengthening
Technique to Increase the Flexural Resistance of Existing RC Slabsrdquo ASCE Journal of
Composites for Construction MarchApril pp149-159 (2008)
[11] The Concrete Society Design Guidance for Strengthening Concrete Structures using Fibre
Composite Materials Concrete Society Technical Report 55 2nd Edition (2004)
[12] ACI Committee 440 Guide for the Design and Construction of Externally Bonded FRP
Systems for Strengthening Concrete Structures ACI 4402 R-02 (2002)
[13] Canadian Standards Association Canadian Highway Bridge Design Code- Section 16
Fibre-Reinforced Structures (2006)
[14] AASHTO LRFD bridge design specifications 3rd Ed AASHTO Washington DC
(2004)
[15] A B Pridmore V M Karbhari ldquoEvaluation of Prefabricated FRP Structural Formwork
Bridge Deck Systemsrdquo SAMPE 53rd International Technical Conference (2008)
[16] Caltrans ldquoMemo to Designers 22-1 Soundwall Design Criteriardquo (2004)
[17] ACI 318-08 Building Code Requirements for Structural Concrete (2008)
[18] Caltrans Bridge Design Specifications Section 8- Reinforced Concrete (2003)
[19] Bentz E and Collins M P lsquolsquoRESPONSE-2000mdashReinforced Concrete Section al Analysis
using the Modified Compression Field Theoryrdquo Version 105 Toronto Canada (2000)
[20] Caltrans ldquoMemo to Designers 22-1 Soundwall Design Criteriardquo (2004)
[21] Sika Corporation Product Data Sheet for Sika CarboDur Rods- carbon fiber rods for
structural strengthening Edition 9 (2003)
[22] Sika Corporation Product Data Sheet for Sika CarboDur- Carbon fiber laminate for
structural strengthening Edition 722 (2005)
[23] Hughes Brothers Inc Product data sheet for Aslan 500- CFRP tape wwwhughesbroscom
(2002)
64
[24] W Seim Y Vasquez VM Karbhari and F Seible ldquoPost-Strengthening of Concrete
Slabs Full Scale Testing and Design Recommendationrdquo ASCE Journal of Structural
Engineering 129[6] pp 743-752 (2003)
[25] W Seim M Hormann VM Karbhari and F Seible External FRP Poststrengthening of
Scaled Concrete Slabs ASCE Journal of Composites in Construction 5[2] pp 67-75
(2001)
[26] Sika Europe- German Institute of Construction Technology 1998
[27] International Concrete Repair Institute ICRI Guideline No 037324 ldquoSelecting and
Specifying Concrete Surface Preparation for Sealers Coatings and Polymer Overlaysrdquo
(1997)
[28] S J Jin ldquoStatistical Characterization of Prefabricated FRP Composite Materials for
Rehabilitation of Concrete Structuresrdquo Master Thesis Department of Structural
Engineering University of California San Diego (2008)
[29] Sika Corporation ldquoCarboDur Installation Guiderdquo Sika construction documents
65
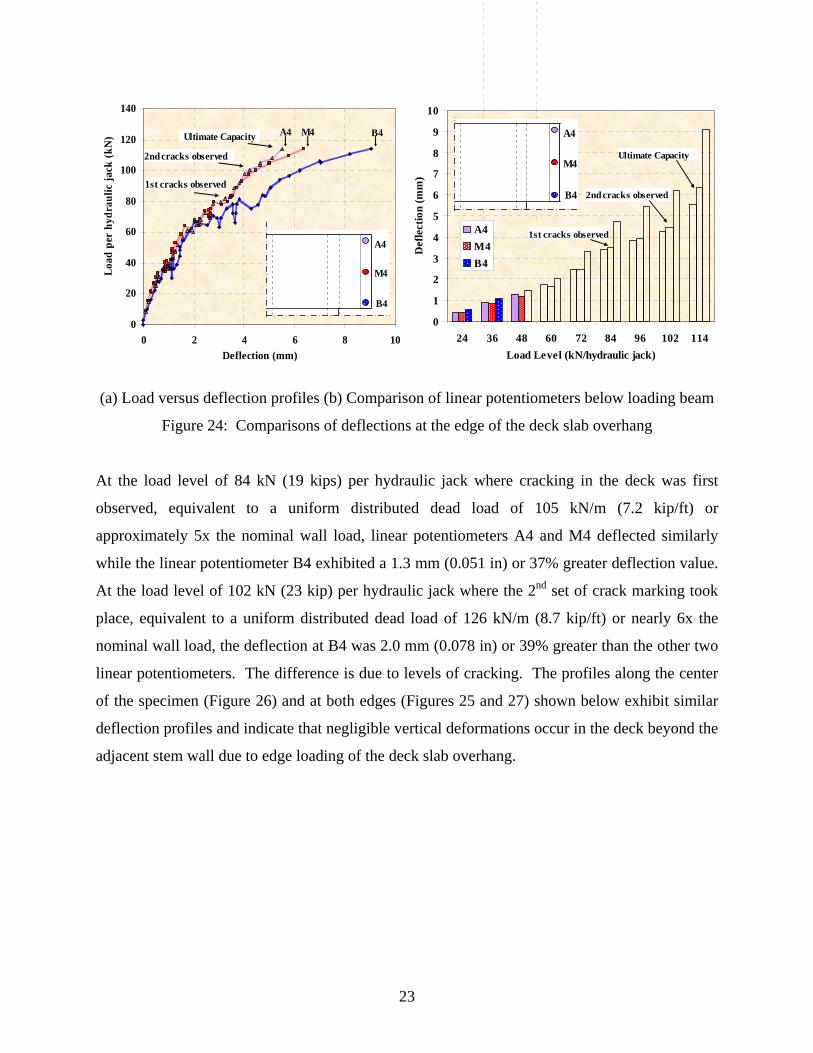
20
40
60
80
100
120
140 10
9
8
0 2 4 6 8 10 Deflection (mm)
A4
B4
M4
A4 B4M4
1st cracks observed
2nd cracks observed
Ultimate Capacity
Def
lect
ion
(mm
)
A4 M4 B4
A4
B4
M4
2nd cracks observed
1st cracks observed
Ultimate Capacity
Load
per
hyd
raul
ic ja
ck (k
N)
7
6
5
4
3
2
1
00 24 36 48 60 72 84 96 102 114
Load Level (kNhydraulic jack)
(a) Load versus deflection profiles (b) Comparison of linear potentiometers below loading beam
Figure 24 Comparisons of deflections at the edge of the deck slab overhang
At the load level of 84 kN (19 kips) per hydraulic jack where cracking in the deck was first
observed equivalent to a uniform distributed dead load of 105 kNm (72 kipft) or
approximately 5x the nominal wall load linear potentiometers A4 and M4 deflected similarly
while the linear potentiometer B4 exhibited a 13 mm (0051 in) or 37 greater deflection value
At the load level of 102 kN (23 kip) per hydraulic jack where the 2nd set of crack marking took
place equivalent to a uniform distributed dead load of 126 kNm (87 kipft) or nearly 6x the
nominal wall load the deflection at B4 was 20 mm (0078 in) or 39 greater than the other two
linear potentiometers The difference is due to levels of cracking The profiles along the center
of the specimen (Figure 26) and at both edges (Figures 25 and 27) shown below exhibit similar
deflection profiles and indicate that negligible vertical deformations occur in the deck beyond the
adjacent stem wall due to edge loading of the deck slab overhang
23
0 0 kN Location of linear potentiometers
24 kNDistance from edge (mm)
Def
lect
ion
(mm
)
2 60 kN
84 kN 4
102 kN
114 kN 6
8
76 279
610 1524
A1 A2 A3 A4AA
10
Figure 25 Deflection profile along the outer edge of specimen (Line A)
0 kNLocation of linear potentiometers 0 Distance from edge (mm) 24 kN
A1 A2 A3 A4 Linear Potentiometer Designation
M1 M2 M3 M4 Linear Potentiometer Designation
76 279
610 1524
M1 M2 M3 M4 MM
8
10
Figure 26 Deflection profile along center of specimen (Line M)
0
60 kN
84 kN
2
4 102 kN
6 114 kN
Def
lect
ion
(mm
)
B1 B2 B3 B4 Linear Potentiometer Designation
0 kN Location of linear potentiometers 24 kNDistance from edge (mm)
76 279
610 1524
B1 B2 B3 B4114 kNBB
10
Figure 27 Deflection profile along the central edge of specimen (Line B)
2 60 kN
4
84 kN
6 102 kN
8
Def
lect
ion
(mm
)
24
The deflection profile shown in Figure 28 shows comparable deflections along the overhang at a
distance midway to the adjacent stem wall Figure 29 illustrates comparable deflections directly
below the point of load application along the overhang for lower load levels with less symmetric
deformations observed for higher load levels after cracking was observed throughout the
specimen Through a comparison of these figures the results indicate a symmetric structural
response for load levels prior to the initial observation of cracking in the specimen and greater
deflections on one side at higher loading levels
0 0 kN 24 kN
Location of linear potentiometers Distance from edge (mm) 2 84 kN
60 kN
3 102 kN
838
152
1524
3
B3
M3
A3D
efle
ctio
n (m
m) 114 kN
4
6
8
10 B3 M3 A3
Linear Potentiometer Designation
Figure 28 Deflections midway along overhang (Line 3)
0 0 kN
24 kN Location of linear potentiometers
Distance from edge (mm) 2 60 kN 4
838
152
1524
4
B4
M4
A4
Def
lect
ion
(mm
)
84 kN 4 102 kN
114 kN 6
8
10 B4 M4 A4
Linear Potentiometer Designation
Figure 29 Deflections directly below loading beam (Line 4)
25
46 Comparison with Theory
The max moment found via moment curvature analysis of 1172 kN-m (856 kip-ft) was within
65 of the actual moment applied to the structure at the max loading of 114 kN (26 kip) per
hydraulic jack which corresponds to an applied moment of 1100 kN-m (810 kip-ft) The
moment capacity estimate of 970 kN-m (716 kip-ft) determined using the ACI 318-08
prescribed equation was off from the experimentally determined moment capacity by 118
26
5 REHABILITATED TEST
The following section presents NSM FRP strengthening design options for achieving the desired
capacity increase and describes the implementation testing and analysis of the chosen
rehabilitation design
51 Calculations for Potential CFRP NSM Strengthening Schemes
The increased moment demand on the test specimenrsquos deck slab due to the addition of the
soundwall is calculated and this value is used as the basis for determining the desired capacity
increase The corresponding total area of NSM CFRP needed to achieve the desired moment
capacity increase is calculated and design options for five different available CFRP
reinforcement products are presented
The dead weight of a typical sound wall used for bridges in California was calculated from the
Caltransrsquo concrete masonry soundwall design on bridges [20] Using this design with normal
weight concrete the gravity load per unit length for the soundwall was determined to be 135
kNm (092 kipft) Note that the weight of the traffic barrier is not included as part of the
increased moment demand calculation because it is assumed that the weight of the traffic barrier
was already accounted for in the original design of the deck slab overhang The tested section of
overhang was 1600 mm (5 ft 6 in) long therefore the total load applied to the specimen from the
soundwall is 226 kN (508 kip) The equivalent moment applied to the structure due to this dead
load can be obtained by multiplying the total load applied by the distance between the applied
load and the edge of the stem also known as the moment arm The equivalent additional
moment demand due to the soundwall was found to be 1091 kN-m (805 kip-ft)
A successful repair would strengthen the overhang to accommodate this increased moment
demand with a reasonable safety margin For initial calculation purposes a safety margin of 3
was deemed appropriate
M demand _ increase = M wall sdot3 (6)
27
This translates to an increase in moment demand of 327 kN-m (241 kipmiddotft) Therefore the
NSM flexural strengthening will be designed to increase the capacity of the overhang by at least
this value The experimentally determined moment capacity of the as-built reinforced concrete
deck slab overhang without FRP was found to be 110 kN-m (81 kip-ft) Therefore the new
moment capacity after strengthening should be at least 1427 kN-m (1051 kip-ft) which
corresponds to a minimum required moment capacity increase of 297 percent over the capacity
of the as-built specimen without FRP
The increased moment capacity due to FRP strengthening is equal to the sum of the contribution
from the tension steel (compression steel is ignored for this calculation) and the contribution
from the FRP reinforcement
⎛⎜⎝
⎞⎟⎠
⎛⎜⎝
⎞⎟⎠
a aψ f+
The definitions of the variables in the above equation are shown below
Steel properties
As = Total area of tension steel in slab overhang test specimen
fs = Experimentally determined yield strength of steel reinforcement
d = Distance to centroid of tensile steel reinforcement
a = Depth of concrete compression block assuming rectangular stress distribution
FRP properties
M As f d Af f dminus sdot sdot minus (8)= strengthened fe fn y 2 2_
Ψ f = Additional reduction factor recommended by ACI 4402R (Section 961) [12]
df = Distance from the compression fiber to the centroid of the FRP
ffe = Efmiddotεfe Effective stress in the FRP assuming elastic behavior
Ef = Experimentally determined modulus of elasticity of FRP
εfe = Effective strain in FRP reinforcement
By rearranging equation 8 an expression for the area of FRP reinforcement required in order to
achieve a specified moment capacity increased can be obtained
28
⎛ a ⎞M n _ strengthened minus As f y ⎜ d minus ⎟ ⎝ 2 ⎠Af _ required = (9)
⎛ a ⎞ψ sdot f sdot ⎜ d minus ⎟f fe f⎝ 2 ⎠
The required area of FRP obtained from this expression can be used to evaluate the feasibility of
different FRP strengthening options Note that the area of FRP required is the total area needed
for the specimen overhang and thus must be distributed along the width of the slab overhang
52 Options for Rehabilitation
The seven product options evaluated for this rehabilitation design were different sizes of SIKArsquos
pultruded carbon fiber CarboDur rods and strips as well as Hughes Brothersrsquo pultruded carbon
fiber Aslan 500 rectangular rods The physical characteristics of each option are provided in
Table 2 for reference
29
Product
Type
Source Product
Designation
Diameter Thickness Width Area Tensile
Modulus
mm in mm in mm in mm2 in2 GPa Msi
Rod SIKA frac14 in dia 635 025 127 005 155 225
Rod SIKA 38 in dia 953 0375 279 011 155 225
Strip SIKA S512 12 0047 50 197 60 0093 165 239
Strip SIKA S812 12 0047 80 315 96 0149 165 239
Strip SIKA S1012 12 0047 100 394 120 0186 165 239
Bar Hughes
Brothers
2 2 0079 16 063 312 0049 124 18
Bar Hughes
Brothers
3 45 0177 16 063 713 0110 124 18
Table 2 Physical properties of pultruded CFRP strengthening product options [212223]
30
The number of reinforcements required to attain the desired moment capacity increase was
calculated for each of the seven potential options using calculations described in the previous
section (Equation 9) and the results are shown in Table 3 For calculation of the effective stress
in the FRP εfe a strain of 065 was assumed based on design recommendations for FRP postshy
strengthening of reinforced concrete slabs [24 25] The tensile modulus for each of the different
FRP reinforcement options was obtained from manufacturer reported data Since the FRP
reinforcement type had not been selected yet the distance from the compression fiber to the
centroid of the FRP df was assumed to be the full depth of the slab Note that this assumption
will slightly overestimate the moment capacity contribution from the FRP because for NSMR
applications the reinforcement is located slightly below the surface of the structure Assuming
that the centroid of the FRP reinforcement is below the surface of the structure by a distance of
between 2 mm (0079 in) and 10 mm (0393 in) the calculations would have overestimated the
moment capacity increase due to the FRP reinforcement by between 1 and 6
Spacing requirements were also considered in the calculations performed for each FRP
strengthening option The maximum spacing recommendations provided by the manufacturer
[26] state that on center spacing should be limited to no more than the lesser of 02 times the
span length (L) or five times the slab thickness (h)
slim it = min(02L 5h) (10)
Note that the span for cantilever is taken as twice the distance to the support This spacing limit
yields a maximum recommended spacing of 203 mm (8 in) Table 3 below shows the number of
units needed as well as the theoretical moment capacity increase for each type of CFRP
reinforcement As observed in the Table 3 spacing limitations govern rather than actual strength
requirement limitations Since all seven of the design options are able to achieve the increased
capacity requirements other aspects such as cost and constructability are now used to select the
FRP reinforcement system
One notable difference between the installation of CFRP strips as opposed to rods is the required
depth of grooves cut into the deck The 64 mm (14 in) diameter rods require 127 mm (12 in)
31
deep slots and the 95 mm (38 in) rods require 159 mm (58 in) deep rods while the strips only
require a 4 mm (016 in) deep groove From a construction viewpoint strips as opposed to rods
are far easier to implement due to required groove depth Given that there is often less cover on
the top of a slab than would be required cutting deeper grooves is hazardous in that the cuts
could easily cut through existing steel reinforcing bars Thus having shallower grooves is
preferred in Europe based on extensive field use
The lower modulus of the CFRP tape of 124 GPa (180 Msi) versus that of the CFRP strips 165
GPa (239 Msi) resulted in appreciably greater material usage for comparable strengthening
schemes As a comparison the S512 CFRP strip has an estimated moment capacity increase of
81 whereas the 3 size CFRP tape has an estimated moment capacity increase of only 71
and requires an additional 19 of material above that used for the strip to achieve this increase
Based on guidelines material cost considerations the CarboDur strips were recommended for
use to Caltrans On receipt of approval from Caltrans to use this option experimental work was
initiated using the flat option Because the smallest size strip far exceeded the required moment
capacity the CarboDur S512 strips were selected which have a 50 mm (2 in) width The
spacing was set at 203 mm (8 in) on center for the width of the test specimen such that nine total
CFRP strips were used The bars were extended past the point of inflection to achieve a
necessary development length of 300 mm (118 in)
32
Previously tested as-built specimen without FRP
Current specimen with to be strengthened using NSM CFRP strips
CFRP strips spaced at 203 mm (8 in) o c
Ld Point of inflection
Figure 30 Plan view of deck illustrating chosen CFRP strengthening scheme
33
R
einf
orce
men
t ty
pe
Prod
uct
Cro
ss-
sect
iona
l Are
a
of u
nits
ne
eded
Spac
ing
wo
co
nsid
erin
gsp
acin
g lim
its
Spac
ing
used
Act
ual
of
uni
ts
Tot
al a
rea
ofFR
P us
ed
The
oret
ical
m
omen
t ca
paci
ty
Mom
ent
capa
cit y
incr
ease
(Rod
or s
trip)
(N
ame
and
size
) (m
m2 )
(in 2 )
(rou
nded
up
)
(rou
nded
tone
ares
t in)
(c
onsi
derin
g sp
acin
g lim
its )
(rou
nded
up
) (m
2 )(in
2 )m
(kN
-m)
(kip
-ft)
(mm
) (in
) (m
m)
(in)
Rod
1
4
diam
eter
32
0
05
7 25
4 10
10
2 4
9 22
6 0
45
140
7 10
37
28
Rod
3
8
diam
eter
71
0
11
4 43
2 17
20
3 8
9 63
9 0
99
191
8 14
15
74
Strip
S5
12-
50m
m
wid
th
60
009
3 4
432
17
203
8 9
540
084
18
24
134
5 66
Strip
S8
12-
80m
m
wid
th
96
014
9 3
559
22
203
8 9
865
134
23
32
172
0 11
2
Strip
S1
012-
10
0mm
w
idth
12
0 0
186
2 83
8 33
20
3 8
9 10
80
167
25
66
189
2 13
3
Tape
2
31
0
049
9 20
3 8
203
8 9
281
044
13
15
969
20
Tape
3
71
0
11
4 43
2 17
20
3 8
9 64
2 0
99
173
1 12
76
57
Table 3 Calculation table using different FRP strengthening options
34
53 Rehabilitation Construction
The following section details the implementation of the NSMR strengthening scheme chosen in
Section 52 Nine (9) rectangular groves spaced at 203 mm (8 in) oc were cut in the top deck of
the test specimen with dimensional tolerances of 70 mm - 76 mm (2 frac34 in - 3 in) for the width
and 6 mm - 13 mm (frac14 in to frac12 in) for depth The grooves were each 274 m (8 ft) long and the
cut grooves are shown in Figure 31
Figure 31 Grooves cut in deck for NSM strengthening
After the grooves were cut to the proper dimensions the surface was roughened to achieve the
minimum required concrete surface profile (CSP) of 3 as defined by the ICRI surface profile
guidelines [27]
The CarboDur S 512 carbon fiber laminate strips were cut to length and the top and bottom
surfaces were wiped clean using methyl ethyl ketone (MEK) to remove all residual carbon dust
from the surface prior to the installation of strain gages on the top surface of the strips An
additional cleaning with MEK was performed immediately prior to installation of the strips into
the test specimen to remove any remaining contaminates and surface oxidization A highshy
modulus high-strength structural epoxy paste known as SikaDur 30 was used for bonding the
CFRP strips to the concrete The structural properties of the CarboDur S 512 strips and SikaDur
30 resin system were experimentally determined through material characterizations performed at
the University of California San Diego within the authorsrsquo research group and these properties
are shown below from [28]
35
Tensile Properties (ASTM D-638)
SikaDur 30
Mean Standard Deviation 7 day Tensile Strength 2529 MPa (3671 ksi) 254 MPa (0369 ksi) Modulus of Elasticity 693 GPa (1006 Msi) 048 GPa (00697 Msi)
Table 4 Tensile properties of SikaDur 30 resin system [28]
Tensile Properties (ASTM D-3039)
CarboDur S 512
Mean Standard Deviation Ultimate Tensile Strength 2505 MPa (3636 ksi) 8285 MPa (120 ksi) Ultimate Tensile Modulus 1381 GPa (2005 Msi) 522 GPa (076 Msi)
Ultimate Tensile Strain 1580 0084
Table 5 Tensile properties of SIKA CarboDur S512 CFRP strips [28]
After the SikaDur 30 resin system was thoroughly mixed the neat resin was applied to each
groove as a primer using a spatula to form a uniform thickness of 16 mm (116 in) as shown in
Figure 32 A specialized applicator was also used to apply a precisely controlled thickness of
resin onto each of the carbon fiber strips and the strips were carefully placed in the grooves
Figure 32 Application of resin system used in grooves to bond CFRP strips to concrete
A rubber roller was then used to properly seat each strip using adequate pressure to force
SikaDur 30 gel out on both sides of the laminate so that the bond line between the concrete and
36
FRP strip does not exceed 3 mm (18 in) [29] Excess gel was carefully removed and the
installed strips are shown in Figure 33
Figure 33 CFRP strips installed
After the resin system had cured for 24 hours a low viscosity resin system which was used for
the wear surface applied to the top of the FRP strips was poured over the top of the strips up to
the level of the original concrete deck The top layer of resin was mixed with sand to allow for
improved thermal compatibility with the surrounding concrete and to provide a non-skid wear
surface for the top of the deck After the installation of the NSM CFRP strengthening scheme
was completed the instrumentation was installed and the specimen was ready for testing to
determine the effectiveness of the repair
In order to monitor the curing of the CarboDur 30 resin system used to attach the CFRP strips to
the deck slab small test samples were made using resin mixed for installation of the strips and
the samples were placed adjacent to the test specimen to ensure comparable curing conditions
These resin samples were tested daily for a period of seven days using both dynamic mechanical
thermal analysis (DMTA) and differential scanning calorimetry (DSC) techniques The results
obtained from these experiments regarding the glass transition temperature Tg of the resin
system are shown in Table 6 The trends from the glass transition temperature data over time
shown below indicate that the SikaDur 30 resin system achieved nearly full cure after
approximately 4-5 days
37
Time DMTA Tg results DSC Tg results degC degC
Day 1 5713 3750 Day 2 5915 3850 Day 3 --- ---Day 4 6439 4150 Day 5 6226 4225 Day 6 6426 4300 Day 7 6361 4300
Table 6 Tg progression of CarboDur 30 resin used in NSMR installation
54 Capacity Calculations
Following the implementation of the chosen NSM CFRP strip rehabilitation scheme theoretical
predictions for capacity were recalculated using the experimentally determined material
properties given in Table 6 along with an assumed CFRP strip embedment depth of 3 mm (18
in) and reduced FRP strain capacity of 065 as described in Section 51 The increased
moment capacity calculation due to FRP strengthening described in Section 51 yields a
theoretical moment capacity of 1673 kN-m (1234 kip-ft) which corresponds to a 52 increase
in moment capacity over the experimentally determined value for the as-built specimen The
moment curvature analysis performed on the FRP rehabilitated specimen yielded a moment
capacity of 1855 kN-m (1364 kip-ft) which corresponds to a 69 increase in load carrying
capacity over the as-built specimen
38
152
55 Instrumentation
The total instrumentation for this experiment consisted of 16 linear potentiometers 47 strain
gages and 2 load cells One central row and two outer rows each with four linear potentiometers
were used to measure the vertical deflection of the deck slab The four linear potentiometers
within each row were positioned at the midspan of the adjacent cell above the adjacent stem in
between the stem and the loading beam and directly below the loading beam as shown in
Figures 11(a) and (b)
2438
1 2 3 4
M
B
A
76
610 279CL
152
1524
838
Elastomeric Bearing Pad 1524
Linear Potentiometers CL
1676
(a) Plan view of specimen (b) Section of deck slab with linear potentiometer details
Figure 34 Position of linear potentiometers for measuring deflections of deck slab
The deflection of the elastomeric bearing pad was measured using four linear potentiometers
with one linear potentiometer at each corner of the loading beam using the same layout as the asshy
built specimen shown in Figure 12
All 47 strain gages were applied to the top side of the nine pultruded CFRP strips parallel to the
direction of the fibers as shown in Figure 33 The two strain gage layout patterns used on this
specimen illustrated in Figure 35 were applied to alternating CFRP strips throughout the width
of the specimen as shown in Figure 36
39
Pattern 1
1626 1168
737 483
76
22362
2057
G F E D C B A
Pattern 2
1168 483
2057
F D B
Figure 35 Strain gage patterns and designations
G F E D C B A
1
2 1
2 1
2 1 2 1
Pattern
Figure 36 Position of strain gages attached to CFRP strips
40
Figure 37 Completed installation of CFRP strips with full instrumentation setup
41
56 Loading Protocol
The overhang of the deck slab was loaded using the test setup shown in Figure 7 and described in
Section 31 by incrementally increasing the hydraulic pressure supplied to the two hydraulic
jacks Adequate time was taken between loading levels to ensure that the hydraulic pressure had
stabilized and the pressure had equalized as much as possible between the two jacks The load
applied to the deck slab was monotonically increased following the loading sequence shown in
Table 7 The load was held briefly at each load level so that observations could be made
Loading step
Load per hydraulic
jack
Equivalent uniform
distributed load Load Level Notes
(kN) (kip) (kNm) (kipft) 1 24 5 300 21 --- Initial load 2 36 8 450 31 2x wall load ---3 48 11 600 41 --- ---4 60 13 750 51 --- ---5 72 16 900 62 4x wall load ---
6 84 19 1050 72 1st set of cracks observed
for as-built specimen ---
7 90 20 1125 77 5x wall load ---
9 101 23 1263 87 Calcd moment capacity asshy
built specimen ---
10 114 26 1425 98 Ultimate capacity as-built
specimen --shy
11 116 26 1450 99 Calcd shear capacity asshy
built specimen 1st set of cracks observed
12 130 29 1625 111 ---13 136 31 1700 116 --- 2nd set of cracks observed 14 142 32 1775 122 ~8x wall load ---15 148 33 1850 127 --- ---16 160 36 2000 137 ~9x wall load 3rd set of cracks observed 17 166 37 2075 142 --- ---18 172 39 2150 147 --- ---19 178 40 2225 152 ~10x wall load ---20 184 41 2300 158 --- 4th set of cracks observed 21 190 43 2375 163 --- ---22 196 44 2450 168 ~11x wall load Ultimate Capacity
Table 7 Loading protocol used for FRP rehabilitated specimen
42
57 Experimental Results
The ultimate capacity of the FRP rehabilitated deck slab was reached at an applied load of 196
kN (44 kips) per hydraulic jack equivalent to a uniform distributed load of 245 kNm (168
kipft) which is 11 x the nominal soundwall load At this load level the deflection of the middle
of the slab under the loading beam was 873 mm (034 in) The maximum strain value achieved
in the CFRP strips at ultimate capacity was 3846 microstrains At the ultimate capacity of the
specimen debonding of the FRP from the concrete occurred due to a tensile failure of the
concrete cover layer located between the FRP and the top layer of rebar This loss of
compatibility within the section was quickly followed by the opening and propagation of a large
diagonal crack along the compression strut formed with the adjacent stem wall
Cracking was observed and marked on the specimen at the four load levels of 116 kN (26 kip)
136 kN (31 kip) 160 kN (36 kip) and 184 kN (41 kip) per hydraulic jack The extent of visible
cracking on the top and sides of the deck of the FRP rehabilitated specimen shown in Figure 38
and Figure 39 occurred at the load level of 184 kN (41 kip) per hydraulic jack which was over
twice the load at which comparable cracking was observed on the as-built specimen The
comparable initial cracking observed on the as-built specimen which was described in section
45 occurred at a load level of 84 kN (19 kip) per hydraulic jack and is shown in Figure 15 and
Figure 16 on page 19 The thin cracking on the top of the deck surface that occurred in the FRP
rehabilitated specimen observed at the load level of 184 kN (41 kip) per hydraulic jack was
discontinuous and approximately followed the top longitudinal steel reinforcement bars adjacent
to the edge of the stem wall as shown in Figure 38
43
Figure 38 Craking of deck slab at 184 kN (41 kip) per jack- top view of deck
Minor diagonal cracks along both the edges of the slab which initiated from the top surface of
the deck are shown in Figure 39
(a) Detail of central edge of slab (b) Detail of exterior edge of slab
Figure 39 Cracking of deck slab at 184 kN (41kip) per jack - side view of deck
When the load level of 196 kN (44 kips) per hydraulic jack was reached the ultimate tensile
strength of the top concrete cover layer was exceeded and the bond between the FRP and the
concrete was lost This damage was quickly followed by the opening and propagation of a large
diagonal crack along the compression strut formed with the adjacent stem wall shown in Figure
40 This load level was determined to be the ultimate capacity of the overhang for resisting
vertical loads
44
(a) Central side of slab (b) Exterior side of slab
Figure 40 Cracking observed at ultimate capacity- side view of deck
The top surface of the deck slab after failure of the specimen can be observed in Figure 41 and
the cracking due to the interfacial failure between the FRP strips and the concrete can be
observed in the in the upper left hand corner of Figure 41 adjacent to the loading beam
Figure 41 Cracking of deck slab at ultimate capacity- top view of deck
After the loading of the specimen was completed all testing equipment and instrumentation was
fully removed to allow for easier observation of the damage present on the specimen Figure 42
shows the top view of the deck at ultimate capacity Any loose concrete was removed in order
to better observe the failure surfaces however unlike the as-built specimen in which significant
loose concrete was removed after it was tested nearly all of the concrete remained attached to
the tested FRP rehabilitated specimen despite the interfacial failure that occurred between the
FRP and the concrete Note that the debonding of the CFRP strips from the concrete occurred
adjacent to where the tensile stresses on the top of the deck are maximum while the CFRP strips
remained attached for the majority of the of the slab overhang
45
Figure 42 Side view of tested FRP rehabilitated specimen after removal of loose concrete
As observed in Figure 43 the three linear potentiometers directly below the loading beam
maintained comparable deflections throughout the loading range applied to the test specimen At
the failure load for the specimen the deflections of these three linear potentiometers were within
10 of each other which corresponds to less than 1 mm (004 in) difference in deflection values
46
80
140
10220 Ultimate Capacity Ultimate Capacity B4200 9 4th cracks
observed 4th cracks observed 180 8
M43rd cracks 160 3rd cracks 7observed
Load
per
hyd
raul
ic ja
ck (k
N)
Def
lect
ion
(mm
) observed 2nd cracks observed B4
120 1st cracks M4
100 observed A4
A46 2nd cracks
5 observed 1st cracks 4 observed B4B4 3
M460 2M4 A440
20 A4 1
0 0
0 2 4 6 8 10 24 60 84 116 136 160 172 184 196 Deflection (mm) Load per hydralulic jack (kN)
(a) Load versus deflection profiles (b) Comparison of linear potentiometers below loading beam
Figure 43 Comparisons of deflections at the edge of the deck slab overhang
The profiles along the center of the specimen (Figure 45) and at both edges (Figure 44 and
Figure 46) shown below exhibit similar deflection profiles throughout the loading range
0 24 kN Location of linear potentiometers
Distance from edge (mm) 60 kN 2 84 kN
B3 B4B1 B2 BB
Def
lect
ion
(mm
)
116 kN 4
136 kN
160 kN 6
8 184 kN 76
279 610 196 kN 101524 B1 B2 B3 B4
Linear Potentiometer Designation
Figure 44 Deflection profile along the central edge of specimen (Line B)
47
Location of linear potentiometers 0 24 kN Distance from edge (mm)
279 610
1524
76
M1 M2 M3 M4
60 kN 2 84 kN
M1 M2 M3 M4 Linear Potentiometer Designation
MM
Def
lect
ion
(mm
) 116 kN 4
136 kN
160 kN 6
184 kN 8
196 kN
10
Figure 45 Deflection profile along center of specimen (Line M)
0Location of linear potentiometers 24 kN Distance from edge (mm)
60 kN 2
84 kN
A1 A2 A3 A4 Linear Potentiometer Designation
279 610
1524
76
A1 A2 A3 A4 AA
Def
lect
ion
(mm
)
116 kN
136 kN
6
4
160 kN
8 184 kN
196 kN 10
Figure 46 Deflection profile along the outer edge of specimen (Line A)
The deflection profiles shown in Figure 47 and Figure 48 also indicate comparable deflections
along the overhang at a distance midway to the adjacent stem wall and directly below the point
of load application respectively
48
0 24 kN 60 kN 84 kN Location of linear potentiometers 116 kN 2Distance from edge (mm)
136 kN 160 kN
A3 M3 B3 Linear Potentiometer Designation
Def
lect
ion
(mm
)
3 184 kN 4 196 kN
8
10
838
152
1524
3
A3
M3
B3
Figure 47 Deflections midway along overhang (Line 3)
6
0
2
4
6
8
10
Def
lect
ion
(mm
)
84 kN 60 kN 24 kN
196 kN
184 kN
116 kN
136 kN
160 kN
A4 M4 B4
Location of linear potentiometers Distance from edge (mm)
838
152
1524
4
4
A4
M4
B4
Linear Potentiometer Designation
Figure 48 Deflections directly below loading beam (Line 4)
The strains in the FRP strips are also examined throughout the NSM CFRP rehabilitated
specimen The strain profiles along the edges and the middle of the specimen are shown in
Figure 49 Figure 50 and Figure 51 respectively These strain profiles indicate that the
maximum strain in the CFRP strips occurs directly above the edge of the stem wall adjacent to
the deck slab overhang referred to with the designation ldquoline Brdquo At ultimate capacity the
maximum strain in the specimen of 3846 microstrains occurs in strain gage 4B which is located
in line B near the middle of the specimen overhang
49
4000
Location of strain gages 3500 (See Figure for detailed schematic)
196 kN 3000
Stra
ins (
mic
rost
rain
s) 184 kN 9G 9F 9E 9D 9C 9B 160 kN9 9 2500
2000
1500
1000 60 kN
500 24 kN 0
136 kN 116 kN
84 kN
(Note Vertical gridlines in figure are -500 positioned at a spacing of 3048 mm (1 ft) 9G 9F 9E 9D 9C 9B Strain Gage Designation
Figure 49 Strain profile along the central edge of specimen (Line 9)
4000 196 kN
3500 184 kN (See Figure for detailed schematic)
Location of strain gages
3000 160 kN136 kN
Stra
ins (
mic
rost
rain
s)
2500
2000
1500
1000 60 kN 500 24 kN
0 (Note Vertical gridlines in figure are
-500 positioned at a spacing of 3048 mm (1 ft) 5G 5F 5E 5D 5C 5B 5A Strain Gage Designation
Figure 50 Strain profile along the middle of specimen (Line 5)
4000 Location of strain gages
(See Figure for detailed schematic) 3500 196 kN
116 kN
5G 5F 5E 5D 5C 5B 5A 5 84 kN 5
Stra
ins (
mic
rost
rain
s) 3000
2500
2000
1500
1000
1 500 24 kN
184 kN
160 kN136 kN 116 kN
84 kN
60 kN 1G 1F 1E 1D 1C 1B 1A 1
0(Note Vertical gridlines in figure are positioned at a spacing of 3048 mm (1 ft))
-500 1G 1F 1E 1D 1C 1B 1A
Strain Gage Designation
Figure 51 Strain profile along the outer edge of specimen (Line 1)
50
The strains drop off sharply for distances further away from the end of the overhang with the
majority of the strain gages on the opposite side of the stem wall (line C) exhibiting less than a
third of the strain values shown in line B The sharp drop in strain values at distances away from
the adjacent stem wall and the insignificant strains within these regions indicate that the
significantly shorter lengths of CFRP strips could be used to optimize material usage and
improve constructability without affecting load transfer and the overall system response
The strains along line B the location where the maximum strains occur in the specimen is shown
in Figure 52 This figure indicates that the distribution of strains was even along the specimen
until the load level of 116 kN (26 kip) per jack was reached At this level cracking was first
observed on the specimen and higher loading levels showed comparable but slightly less uniform
strains along the specimen The average strain along line B in the specimen at ultimate capacity
was 3423 microstrains whereas the minimum and maximum strains along line B were 2943
microstrains and 3846 microstrains respectively
4000
Location of strain gages 3500(See Figure for detailed schematic)
1B 3B 4B 5B 6B 7B 8B 9B Strain Gage Designation
Stra
ins (
mic
rost
rain
s) 3000 196 kN B 184 kN
160 kN 2500
1B
4B 3B
5B
9B 8B 7B 6B
B
136 kN 2000 116 kN
1500 84 kN
1000 60 kN
500
24 kN 0
(Note Vertical gridlines in figure are positioned at a spacing of 3048 mm (1 ft))
Figure 52 Strains along the edge of the stem wall adjacent to the deck slab overhang (Line B)
Using the strain data throughout the specimen and following a procedure described by Siem et al
[24] the shear stress between the concrete and the CFRP strips were calculated using the
following equation
51
9
(ε minus ε )sdot E sdot tn+1 n L Lτ nn+1 = (11)(x minus x )n+1 n
Where (x minus x )= distance between two strain gages EL= the tensile elastic modulus of then+1 n
CFRP strip and tL = thickness of the CFRP strips For these calculations EL= 1381 GPa (2005
Msi) and tL = 12 mm (0047 in) were used for the CFRP strips The calculated shear stress
values within the adhesive are simply the mean value between two strain gages which ignore
localized stress peaks and gradients
Distance from west edge (m) 27 24 21 18 15 12 09 06 03 00
Location of strain gages 20 (See Figure for detailed schematic)
15
196 kN
116 kN 160 kN
9B9G 9F 9E 9D 9C
(Note Vertical gridlines in figure are positioned at a spacing of 3048 mm (1 ft)
9
Stre
ss (M
Pa) 10
05
00
-05
-10
-15
-20
Figure 53 Calculated shear stress within adhesive along the central edge of specimen (Line 9)
Distance from west edge(m) 27 24 21 18 15 12 09 06 03 00
Location of strain gages (See Figure for detailed schematic) 20
196 kN
116 kN
160 kN
5 00
(Note Vertical gridlines in figure are positioned at a spacing of 3048 mm (1 ft)
3B5G 5F 5E 5A5D 5C
Stre
ss (M
Pa)
15
10
05
-05
-10
-15
-20
Figure 54 Calculated shear stress within adhesive along the middle of specimen (Line 5)
52
5
Distance from west edge(m) 27 24 21 18 15 12 09 06 03 00
Location of strain gages 20 (See Figure for detailed schematic)
196 kN
116 kN 160 kN
Stre
ss (M
Pa) 15
10
05
00
-05 3
(Note Vertical gridlines in figure are positioned at a spacing of 3048 mm (1 ft)
3B3G 3F 3E 3D 3C 3A 3
-10
-15
-20
Figure 55 Calculated shear stress within adhesive along an interior CFRP strip (Line 3)
Distance from west edge (m) 27 24 21 18 15 12 09 06 03 00
Location of strain gages 20 (See Figure for detailed schematic)
-20
196 kN
116 kN 160 kN
Stre
ss (M
Pa)
15
10
05
00
-05
-10
-15
1G 1F 1E 1D 1B1C 1A 11
(Note Vertical gridlines in figure are positioned at a spacing of 3048 mm (1 ft))
1G 1F 1E 1D 1C 1B 1A Strain Gage Designation
Figure 56 Calculated shear stress within adhesive along the outer edge of specimen (Line 1)
53
After the testing of the NSM CFRP rehabilitated specimen was completed the overhang of the
specimen was cut off and carefully removed from the rest of the test specimen as shown in
Figure 57 to allow for further examination of this critical region
432 mm (17 in)
Figure 57 Location of cut for removal of FRP rehabilitated overhang from test specimen
One point of interest to examine on the removed overhang was the actual location of the CFRP
strip reinforcement within the section Figure 58 shows that the actual embedment depth of the
near surface mounted CFRP strips was approximately 6 mm (025
in) and the actual thickness of the SikaDur 30 resin layer used to
bond the CFRP strips to the concrete was also approximately 6 mm
(025 mm) An embedment depth of 6 mm (025 in) is reasonable
for NSM applications because it allows enough space for an
adequate top surface of resin which will serve as environmental
protection and the wear surface for the deck However the 6 mm
(025 mm) thickness of the SikaDur 30 bottom resin layer exceeded
the maximum manufacturer recommended value of 3 mm (18
inch) While the current system performed very well the use of an
overly thick resin layer could have had an negative effect on the
overall structural response of the system Figure 58 Detail showing actual location of reinforcement
Figure 59 shows the failure surface of an FRP strip which has been detached from the top
surface of the deck The center portion of the strip with the firmly attached concrete was the
region in which the interfacial failure in the concrete occurred while the outer sections of the
strip were neatly detached from the resin system due to the method of removal of the strip
54
Figure 59 Detail of failure surface of FRP strip
58 Comparison with Theory
The NSM CFRP rehabilitated specimen reached ultimate capacity under an applied load of 196
kN (44 kip) per hydraulic jack which is equivalent to an applied moment of 1892 kN-m (1392
kip-ft) This improved performance corresponds to a 72 increase in ultimate capacity over the
as-built specimen which failed under an applied load of 114 kN (26 kip) corresponding to an
applied moment of 1100 kN-m (810 kip-ft) The ACI 440-02 calculation for externally bonded
FRP reinforcement predicted a maximum moment capacity of 1660 kN-m (1224 kip-ft) which
corresponds to a 51 increase in load carrying capacity over the experimentally determined
capacity of the as-built specimen The moment curvature analysis predicted a maximum moment
capacity of 1855 kN-m (1364 kip-ft) which corresponds to a 69 increase in load carrying
capacity over the as-built specimen The theoretical predictions and experimental results were
within 12 using the ACI 440 approach and were in close agreement with only a 2 error
using the moment curvature analysis The larger disagreement with experimental data found
from the ACI 440 moment capacity increase equation likely exists because this calculation is a
more simplified approach that does not take into account the over strength of the steel
reinforcement
55
3rd cracks observed
1st cracks observed
200
220
59 Comparison with As-Built
The ultimate capacity of the near surface mounted CFRP strip rehabilitated slab was reached at
an applied load of 196 kN (44 kips) equivalent to a uniform distributed load of 245 kNm (168
kipft) which is 11x the nominal soundwall load This ultimate capacity is 78 greater than that
obtained by the as-built specimen which occurred at 114 kN (26 kips) per hydraulic jack
equivalent to a uniform distributed load of 1425 kNm (98 kipft) which is 633x the nominal
wall load The center deflections under the loading beam for both specimens over the complete
loading ranges applied are compared in Figure 60(a) and Figure 60(b) At the failure load level
of the as-built specimen the as-built specimen had a center deflection under the loading beam of
636 mm (025 in) whereas the FRP rehabilitated specimen deflected approximately half that of
the as-built specimen or 333 mm (013 in) At ultimate capacity of the FRP rehabilitated
specimen the center deflection under the loading beam was 873 mm (034 in) which indicates
the rehabilitated specimen exhibited a 318 increase in deformation capacity over the as-built
specimen
10
0 2 4 6 8 10
Ultimate Capacity
1st cracks observed
2nd cracks observed
4th cracks observed
As-built test
3rd cracks observed
2nd cracks observed 1st cracks observed
Ultimate Capacity
Rehabilitated test
Def
lect
ion
(mm
)
6
5
4
360
240 120
0 0
Deflection (mm) Load per hydralulic jack (kN)
As-built specimenRehabilitated specimen
Ultimate Capacity
Ultimate Capacity
24 36 48 60 72 84 96 102 114 136 160 184 196
9
180
Load
per
hyd
raul
ic ja
ck (k
N) 8
160 7 140
120
100
80
a) Load versus deflection profiles (b) Comparison of linear potentiometers below loading beam
Figure 60 Comparisons of middle center deflections of the deck slab overhang
In addition to increasing the overall load and deformation capacity of the system the near
surface mounted CFRP strips act to increase the stiffness and improve the stability of the system
56
The load versus deflection profile shown in Figure 60(a) shows the significantly increased
stiffness and more linear profile for the FRP rehabilitated specimen over the as-built specimen
The deflection profile comparison at the 114 kN (26 kips) per jack load level along the middle of
the two slabs is shown in Figure 61 This figure illustrates that for the same load level the
deflections within the FRP rehabilitated specimen are lower than the deflections of the as-built
specimen throughout the deck slab and not just at the point of load application
Location of linear potentiometers 0 Distance from edge (mm)
279 610
1524
76
M1 M2 M3 M4
2
4
M M
6
8
10
FRP rehabilited specimen at 114 kN per jack
As-built specimen at 114 kN per jack
M1 M2 M3 M4 Linear Potentiometer Designation
Figure 61 Comparison of deflection profiles along center of specimens (Line M)
The first set cracking observed on the as-built specimen occurred at the load level of 84 kN (19
kip) whereas the first set cracking observed on the FRP rehabilitated specimen occurred at 116
kN (26 kip) which is corresponds to a 38 greater load A comparison of the deflection profiles
along the center of the specimens at these loading levels shown in Figure 62 reveals nearly
identical deformations for the two specimens
57
10
10
M1
1524
279 610
76
M2 M3 M4
Location of linear potentiometers Distance from edge (mm)
FRP rehabilited specimen at 1st observed cracking
(116 kN per jack)
0
2 As-built specimen
at 1st observed cracking (84 kN per jack) 4
M
Def
lect
ion
(mm
)
M
6
8
M1 M2 M3 M4 Linear Potentiometer Designation
Figure 62 Comparison of center deflection profiles at 1st observed cracking loads (Line M)
The second set of cracking observed on the as-built specimen occurred at the load level of 101
kN (23 kip) whereas the second set of cracking observed on the FRP rehabilitated specimen
occurred at 136 kN (31 kip) which is corresponds to a 35 greater load The deflection profile
comparison at the load levels where the second set of cracking was observed in Figure 64 also
exhibits nearly identical deformations for the two specimens This indicates that while the FRP
reinforcement acts to stiffen the system and increase the load carrying capacity of the overhang
region the shape of the deflection response profile of the system is not modified significantly
with the addition of the CFRP strips
0FRP rehabilited specimen at 2nd observed cracking
(136 kN per jack)
As-built specimen at 2nd observed cracking
(101 kN per jack)
Location of linear potentiometers Distance from edge (mm)
279 610
1524
76
M M1 M2 M3 M4
2
4
Def
lect
ion
(mm
)
M
6
8
M1 M2 M3 M4 Linear Potentiometer Designation
Figure 63 Comparison of center deflection profiles at 2nd observed cracking loads (Line M)
58
Figure 64 shows the side by side top decks of the two specimens after testing has been completed
and all loose concrete on the top deck removed Details of the critical region of the as-built and
FRP rehabilitated top deck are shown in Figure 65 and Figure 66 respectively
Figure 64 Top view of deck slab tested to ultimate capacity after removal of loose concrete
59
For the as-built specimen extensive damage and spalling of the concrete on the top of the deck
slab was seen Yielding in the transverse steel reinforcement followed by loss of aggregate
interlock resulting in failure was observed
Figure 65 Detail of cracking observed at ultimate capacity- top view of as-built deck
For the FRP rehabilitated specimen negligible spalled concrete and loose concrete rubble was
detected A concrete splitting failure mode was observed in the FRP rehabilitated specimen
Figure 66 Detail of cracking observed at ultimate capacity- top view of FRP rehabilitated deck
60
6 SUMMARY OF RESULTS AND RECOMMENDATIONS FOR FUTURE RESEARCH
Experimental results from the testing of the rehabilitated specimen indicate that the NSMR
strengthening scheme was successful at achieving the desired load carrying capacity increase
The ultimate load carrying capacity of the FRP rehabilitated specimen was 196 kN (44 kips) per
hydraulic jack which was 78 higher that the ultimate load of the as- built specimen of 114 kN
(26 kips) per hydraulic jack This value well exceeded the desired load capacity increase of
297 above the experimentally determined capacity of the as-built specimen exhibited a very
stable structural response and increased the deformation capacity of the system The theoretical
moment capacity predictions for the as-built specimen were within 11 and 65 of the
experimentally determined value using ACI 318 and moment curvature analysis respectively
The theoretical moment capacity predictions for the FRP rehabilitated specimen were within
12 of the experimental value using the modified ACI 440-02 approach and were within 2
using moment curvature analysis
The NSM FRP rehabilitated specimen exhibits a variety of structural performance improvements
over the as-built specimen including increased ultimate load carrying capacity enhanced
deformation capacity and more stable overall structural performance Design options for the
near surface mounted CFRP strengthening schemes allow for great flexibility in terms of
tailoring the reinforcement parameters for specific applications With consideration of the
minimal disruption to traffic flow and ease of installation this system is a viable and very
attractive rehabilitation option for bridge deck slab overhangs
The purpose of Phase 1 was to conduct an experimental analysis of the use of NSM for purposes
of strengthening and to provide the basis for the planning of Phase 2 as detailed in the initial
proposal submitted to Caltrans Based on the extensive literature review already conducted
(although according to the project funding provided by Caltrans is to be completed and reported
on in Phase 2) and on the experimental results the following aspects are recommended for further
study in Phase 2
61
bull Complete review of the failure modes and mechanisms seen with use of barsrods as
compared to flat strips for purposes of documenting advantages of strips It is noted that
a very brief summary is given in the introductory portion of this report
bull Optimization of groove dimensions and spacing for NSM use through both analytical and
experimental study
bull Study of adhesive rheology and bond quality as well as durability
bull Study of minimum development length and effect of insertion into girder stems
bull Study of use for specific strengthening applications
bull Development of design guide for Caltrans and development of example comparing NSM
use to surface bonding
It is emphasized that the studies should be conducted on specimens of sufficient size since small
scale tests are likely to provide erroneous results due to effects of scale and configuration It is
recommended that these tests only be conducted after a review of advances in Europe and
Australia are completed and sufficient analytical work is completed on optimization of grove
dimensions and spacing Since the efficacy of the method is intrinsically related to the ability of
the adhesive to not only bond the reinforcement to the concrete substrate but to also enable
efficient stress transfer study also needs to be conducted on adhesive rheology performance
characteristics and cure It is recommended that this be based on the completed durability study
which should provide a base-line for further study Also since it is likely that the NSM will be
covered by asphalt the effect of heat due to asphalt on the adhesive and bond should also be
studied
62
7 REFERENCES
[1] VM Karbhari and L Zhao ldquoUse of composites for 21st century civil infrastructurerdquo
Computer Method Appl Mech Eng 185 pp 433ndash454 (2000)
[2] S Rizkalla T Hassan N Hassan ldquoDesign recommendations for the use of FRP for
strengthening of concrete structuresrdquo Prog Struct Engng Mater 5 pp 16ndash28 (2003)
[3] K K Ghosh ldquoAssessment of FRP composite strengthened reinforced concrete bridge
structures at the component and systems level through progressive damage and nonshy
destructive evaluation (NDE) [PhD dissertation] University of California San Diego
(2006)
[4] L De Lorenzis JG Teng ldquoNear-surface mounted FRP reinforcement An emerging
technique for strengthening structuresrdquo Composites Part B 38 pp 119-143 (2007)
[5] R Parretti A Nanni ldquoStrengthening of RC Members Using Near-Surface Mounted FRP
Composites Design Overviewrdquo Advances in Structural Engineering 7 5 pp 1-16 (2004)
[6] J R Yost S P Gross D W Dinehart and J J Mildenberg ldquoFlexural Behavior of
Concrete Beams Strengthened with Near-Surface-Mounted CFRP Stripsrdquo ACI Structural
Journal July-August pp 430-437(2007)
[7] L A DeLorenzis A Nanni and A L Tegila ldquoFlexural and Shear Strengthening of
Reinforced Concrete Structures with Near Surface Mounted FRP Barsrdquo Proceedings of the
3rd International Conference on Advanced Composite Materials in Bridges and Structures
Ottawa Canada Aug 15-18 pp 521-528 (2000)
[8] El-Hacha R and Rizkalla S 2004 ldquoNear-Surface-Mounted Fiber- Reinforced Polymer
Reinforcements for Flexural Strengthening of Concrete Structuresrdquo ACI Structural Journal
V 101 V 5 Sept-Oct pp 717-726
[9] R Parretti and A Nanni ldquoStrengthening of RC Members Using Near-Surface Mounted
FRP Composites Design Overviewrdquo Advances in Structural Engineering V 7 (5) (2004)
63
[10] E Bonaldo J A Oliveira de Barros and P B Lourenccedilo ldquoEfficient Strengthening
Technique to Increase the Flexural Resistance of Existing RC Slabsrdquo ASCE Journal of
Composites for Construction MarchApril pp149-159 (2008)
[11] The Concrete Society Design Guidance for Strengthening Concrete Structures using Fibre
Composite Materials Concrete Society Technical Report 55 2nd Edition (2004)
[12] ACI Committee 440 Guide for the Design and Construction of Externally Bonded FRP
Systems for Strengthening Concrete Structures ACI 4402 R-02 (2002)
[13] Canadian Standards Association Canadian Highway Bridge Design Code- Section 16
Fibre-Reinforced Structures (2006)
[14] AASHTO LRFD bridge design specifications 3rd Ed AASHTO Washington DC
(2004)
[15] A B Pridmore V M Karbhari ldquoEvaluation of Prefabricated FRP Structural Formwork
Bridge Deck Systemsrdquo SAMPE 53rd International Technical Conference (2008)
[16] Caltrans ldquoMemo to Designers 22-1 Soundwall Design Criteriardquo (2004)
[17] ACI 318-08 Building Code Requirements for Structural Concrete (2008)
[18] Caltrans Bridge Design Specifications Section 8- Reinforced Concrete (2003)
[19] Bentz E and Collins M P lsquolsquoRESPONSE-2000mdashReinforced Concrete Section al Analysis
using the Modified Compression Field Theoryrdquo Version 105 Toronto Canada (2000)
[20] Caltrans ldquoMemo to Designers 22-1 Soundwall Design Criteriardquo (2004)
[21] Sika Corporation Product Data Sheet for Sika CarboDur Rods- carbon fiber rods for
structural strengthening Edition 9 (2003)
[22] Sika Corporation Product Data Sheet for Sika CarboDur- Carbon fiber laminate for
structural strengthening Edition 722 (2005)
[23] Hughes Brothers Inc Product data sheet for Aslan 500- CFRP tape wwwhughesbroscom
(2002)
64
[24] W Seim Y Vasquez VM Karbhari and F Seible ldquoPost-Strengthening of Concrete
Slabs Full Scale Testing and Design Recommendationrdquo ASCE Journal of Structural
Engineering 129[6] pp 743-752 (2003)
[25] W Seim M Hormann VM Karbhari and F Seible External FRP Poststrengthening of
Scaled Concrete Slabs ASCE Journal of Composites in Construction 5[2] pp 67-75
(2001)
[26] Sika Europe- German Institute of Construction Technology 1998
[27] International Concrete Repair Institute ICRI Guideline No 037324 ldquoSelecting and
Specifying Concrete Surface Preparation for Sealers Coatings and Polymer Overlaysrdquo
(1997)
[28] S J Jin ldquoStatistical Characterization of Prefabricated FRP Composite Materials for
Rehabilitation of Concrete Structuresrdquo Master Thesis Department of Structural
Engineering University of California San Diego (2008)
[29] Sika Corporation ldquoCarboDur Installation Guiderdquo Sika construction documents
65
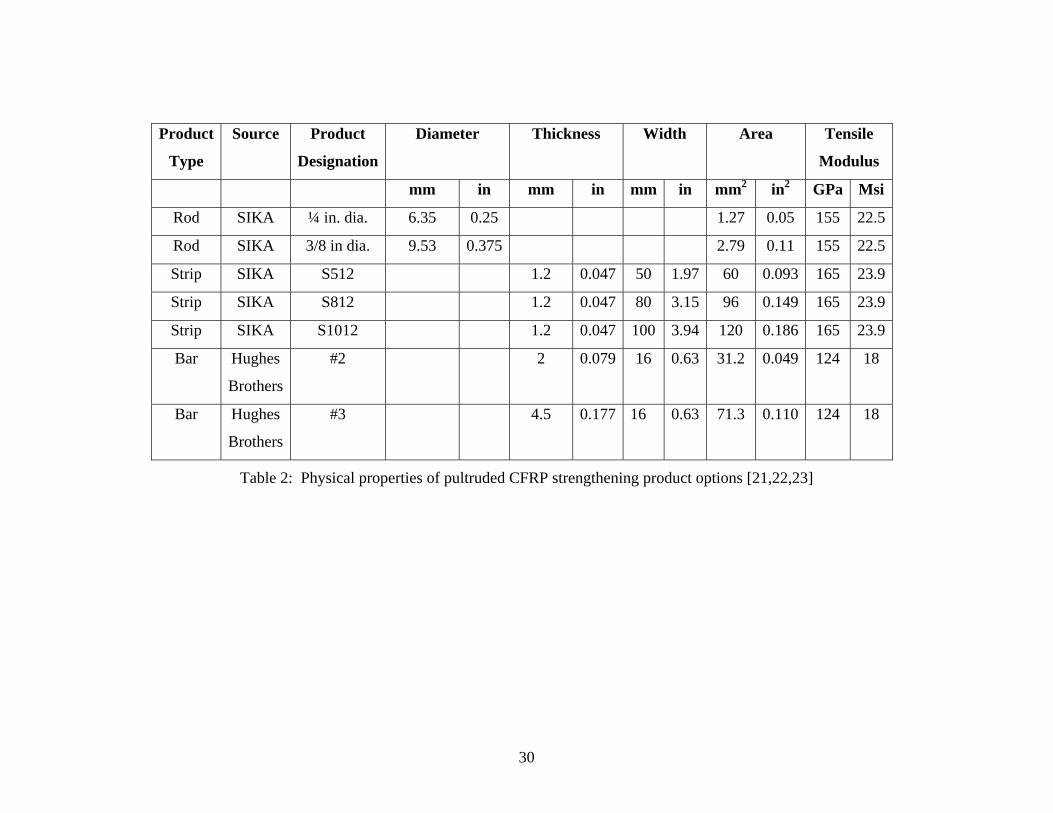

152
55 Instrumentation
The total instrumentation for this experiment consisted of 16 linear potentiometers 47 strain
gages and 2 load cells One central row and two outer rows each with four linear potentiometers
were used to measure the vertical deflection of the deck slab The four linear potentiometers
within each row were positioned at the midspan of the adjacent cell above the adjacent stem in
between the stem and the loading beam and directly below the loading beam as shown in
Figures 11(a) and (b)
2438
1 2 3 4
M
B
A
76
610 279CL
152
1524
838
Elastomeric Bearing Pad 1524
Linear Potentiometers CL
1676
(a) Plan view of specimen (b) Section of deck slab with linear potentiometer details
Figure 34 Position of linear potentiometers for measuring deflections of deck slab
The deflection of the elastomeric bearing pad was measured using four linear potentiometers
with one linear potentiometer at each corner of the loading beam using the same layout as the asshy
built specimen shown in Figure 12
All 47 strain gages were applied to the top side of the nine pultruded CFRP strips parallel to the
direction of the fibers as shown in Figure 33 The two strain gage layout patterns used on this
specimen illustrated in Figure 35 were applied to alternating CFRP strips throughout the width
of the specimen as shown in Figure 36
39
Pattern 1
1626 1168
737 483
76
22362
2057
G F E D C B A
Pattern 2
1168 483
2057
F D B
Figure 35 Strain gage patterns and designations
G F E D C B A
1
2 1
2 1
2 1 2 1
Pattern
Figure 36 Position of strain gages attached to CFRP strips
40
Figure 37 Completed installation of CFRP strips with full instrumentation setup
41
56 Loading Protocol
The overhang of the deck slab was loaded using the test setup shown in Figure 7 and described in
Section 31 by incrementally increasing the hydraulic pressure supplied to the two hydraulic
jacks Adequate time was taken between loading levels to ensure that the hydraulic pressure had
stabilized and the pressure had equalized as much as possible between the two jacks The load
applied to the deck slab was monotonically increased following the loading sequence shown in
Table 7 The load was held briefly at each load level so that observations could be made
Loading step
Load per hydraulic
jack
Equivalent uniform
distributed load Load Level Notes
(kN) (kip) (kNm) (kipft) 1 24 5 300 21 --- Initial load 2 36 8 450 31 2x wall load ---3 48 11 600 41 --- ---4 60 13 750 51 --- ---5 72 16 900 62 4x wall load ---
6 84 19 1050 72 1st set of cracks observed
for as-built specimen ---
7 90 20 1125 77 5x wall load ---
9 101 23 1263 87 Calcd moment capacity asshy
built specimen ---
10 114 26 1425 98 Ultimate capacity as-built
specimen --shy
11 116 26 1450 99 Calcd shear capacity asshy
built specimen 1st set of cracks observed
12 130 29 1625 111 ---13 136 31 1700 116 --- 2nd set of cracks observed 14 142 32 1775 122 ~8x wall load ---15 148 33 1850 127 --- ---16 160 36 2000 137 ~9x wall load 3rd set of cracks observed 17 166 37 2075 142 --- ---18 172 39 2150 147 --- ---19 178 40 2225 152 ~10x wall load ---20 184 41 2300 158 --- 4th set of cracks observed 21 190 43 2375 163 --- ---22 196 44 2450 168 ~11x wall load Ultimate Capacity
Table 7 Loading protocol used for FRP rehabilitated specimen
42
57 Experimental Results
The ultimate capacity of the FRP rehabilitated deck slab was reached at an applied load of 196
kN (44 kips) per hydraulic jack equivalent to a uniform distributed load of 245 kNm (168
kipft) which is 11 x the nominal soundwall load At this load level the deflection of the middle
of the slab under the loading beam was 873 mm (034 in) The maximum strain value achieved
in the CFRP strips at ultimate capacity was 3846 microstrains At the ultimate capacity of the
specimen debonding of the FRP from the concrete occurred due to a tensile failure of the
concrete cover layer located between the FRP and the top layer of rebar This loss of
compatibility within the section was quickly followed by the opening and propagation of a large
diagonal crack along the compression strut formed with the adjacent stem wall
Cracking was observed and marked on the specimen at the four load levels of 116 kN (26 kip)
136 kN (31 kip) 160 kN (36 kip) and 184 kN (41 kip) per hydraulic jack The extent of visible
cracking on the top and sides of the deck of the FRP rehabilitated specimen shown in Figure 38
and Figure 39 occurred at the load level of 184 kN (41 kip) per hydraulic jack which was over
twice the load at which comparable cracking was observed on the as-built specimen The
comparable initial cracking observed on the as-built specimen which was described in section
45 occurred at a load level of 84 kN (19 kip) per hydraulic jack and is shown in Figure 15 and
Figure 16 on page 19 The thin cracking on the top of the deck surface that occurred in the FRP
rehabilitated specimen observed at the load level of 184 kN (41 kip) per hydraulic jack was
discontinuous and approximately followed the top longitudinal steel reinforcement bars adjacent
to the edge of the stem wall as shown in Figure 38
43
Figure 38 Craking of deck slab at 184 kN (41 kip) per jack- top view of deck
Minor diagonal cracks along both the edges of the slab which initiated from the top surface of
the deck are shown in Figure 39
(a) Detail of central edge of slab (b) Detail of exterior edge of slab
Figure 39 Cracking of deck slab at 184 kN (41kip) per jack - side view of deck
When the load level of 196 kN (44 kips) per hydraulic jack was reached the ultimate tensile
strength of the top concrete cover layer was exceeded and the bond between the FRP and the
concrete was lost This damage was quickly followed by the opening and propagation of a large
diagonal crack along the compression strut formed with the adjacent stem wall shown in Figure
40 This load level was determined to be the ultimate capacity of the overhang for resisting
vertical loads
44
(a) Central side of slab (b) Exterior side of slab
Figure 40 Cracking observed at ultimate capacity- side view of deck
The top surface of the deck slab after failure of the specimen can be observed in Figure 41 and
the cracking due to the interfacial failure between the FRP strips and the concrete can be
observed in the in the upper left hand corner of Figure 41 adjacent to the loading beam
Figure 41 Cracking of deck slab at ultimate capacity- top view of deck
After the loading of the specimen was completed all testing equipment and instrumentation was
fully removed to allow for easier observation of the damage present on the specimen Figure 42
shows the top view of the deck at ultimate capacity Any loose concrete was removed in order
to better observe the failure surfaces however unlike the as-built specimen in which significant
loose concrete was removed after it was tested nearly all of the concrete remained attached to
the tested FRP rehabilitated specimen despite the interfacial failure that occurred between the
FRP and the concrete Note that the debonding of the CFRP strips from the concrete occurred
adjacent to where the tensile stresses on the top of the deck are maximum while the CFRP strips
remained attached for the majority of the of the slab overhang
45
Figure 42 Side view of tested FRP rehabilitated specimen after removal of loose concrete
As observed in Figure 43 the three linear potentiometers directly below the loading beam
maintained comparable deflections throughout the loading range applied to the test specimen At
the failure load for the specimen the deflections of these three linear potentiometers were within
10 of each other which corresponds to less than 1 mm (004 in) difference in deflection values
46
80
140
10220 Ultimate Capacity Ultimate Capacity B4200 9 4th cracks
observed 4th cracks observed 180 8
M43rd cracks 160 3rd cracks 7observed
Load
per
hyd
raul
ic ja
ck (k
N)
Def
lect
ion
(mm
) observed 2nd cracks observed B4
120 1st cracks M4
100 observed A4
A46 2nd cracks
5 observed 1st cracks 4 observed B4B4 3
M460 2M4 A440
20 A4 1
0 0
0 2 4 6 8 10 24 60 84 116 136 160 172 184 196 Deflection (mm) Load per hydralulic jack (kN)
(a) Load versus deflection profiles (b) Comparison of linear potentiometers below loading beam
Figure 43 Comparisons of deflections at the edge of the deck slab overhang
The profiles along the center of the specimen (Figure 45) and at both edges (Figure 44 and
Figure 46) shown below exhibit similar deflection profiles throughout the loading range
0 24 kN Location of linear potentiometers
Distance from edge (mm) 60 kN 2 84 kN
B3 B4B1 B2 BB
Def
lect
ion
(mm
)
116 kN 4
136 kN
160 kN 6
8 184 kN 76
279 610 196 kN 101524 B1 B2 B3 B4
Linear Potentiometer Designation
Figure 44 Deflection profile along the central edge of specimen (Line B)
47
Location of linear potentiometers 0 24 kN Distance from edge (mm)
279 610
1524
76
M1 M2 M3 M4
60 kN 2 84 kN
M1 M2 M3 M4 Linear Potentiometer Designation
MM
Def
lect
ion
(mm
) 116 kN 4
136 kN
160 kN 6
184 kN 8
196 kN
10
Figure 45 Deflection profile along center of specimen (Line M)
0Location of linear potentiometers 24 kN Distance from edge (mm)
60 kN 2
84 kN
A1 A2 A3 A4 Linear Potentiometer Designation
279 610
1524
76
A1 A2 A3 A4 AA
Def
lect
ion
(mm
)
116 kN
136 kN
6
4
160 kN
8 184 kN
196 kN 10
Figure 46 Deflection profile along the outer edge of specimen (Line A)
The deflection profiles shown in Figure 47 and Figure 48 also indicate comparable deflections
along the overhang at a distance midway to the adjacent stem wall and directly below the point
of load application respectively
48
0 24 kN 60 kN 84 kN Location of linear potentiometers 116 kN 2Distance from edge (mm)
136 kN 160 kN
A3 M3 B3 Linear Potentiometer Designation
Def
lect
ion
(mm
)
3 184 kN 4 196 kN
8
10
838
152
1524
3
A3
M3
B3
Figure 47 Deflections midway along overhang (Line 3)
6
0
2
4
6
8
10
Def
lect
ion
(mm
)
84 kN 60 kN 24 kN
196 kN
184 kN
116 kN
136 kN
160 kN
A4 M4 B4
Location of linear potentiometers Distance from edge (mm)
838
152
1524
4
4
A4
M4
B4
Linear Potentiometer Designation
Figure 48 Deflections directly below loading beam (Line 4)
The strains in the FRP strips are also examined throughout the NSM CFRP rehabilitated
specimen The strain profiles along the edges and the middle of the specimen are shown in
Figure 49 Figure 50 and Figure 51 respectively These strain profiles indicate that the
maximum strain in the CFRP strips occurs directly above the edge of the stem wall adjacent to
the deck slab overhang referred to with the designation ldquoline Brdquo At ultimate capacity the
maximum strain in the specimen of 3846 microstrains occurs in strain gage 4B which is located
in line B near the middle of the specimen overhang
49
4000
Location of strain gages 3500 (See Figure for detailed schematic)
196 kN 3000
Stra
ins (
mic
rost
rain
s) 184 kN 9G 9F 9E 9D 9C 9B 160 kN9 9 2500
2000
1500
1000 60 kN
500 24 kN 0
136 kN 116 kN
84 kN
(Note Vertical gridlines in figure are -500 positioned at a spacing of 3048 mm (1 ft) 9G 9F 9E 9D 9C 9B Strain Gage Designation
Figure 49 Strain profile along the central edge of specimen (Line 9)
4000 196 kN
3500 184 kN (See Figure for detailed schematic)
Location of strain gages
3000 160 kN136 kN
Stra
ins (
mic
rost
rain
s)
2500
2000
1500
1000 60 kN 500 24 kN
0 (Note Vertical gridlines in figure are
-500 positioned at a spacing of 3048 mm (1 ft) 5G 5F 5E 5D 5C 5B 5A Strain Gage Designation
Figure 50 Strain profile along the middle of specimen (Line 5)
4000 Location of strain gages
(See Figure for detailed schematic) 3500 196 kN
116 kN
5G 5F 5E 5D 5C 5B 5A 5 84 kN 5
Stra
ins (
mic
rost
rain
s) 3000
2500
2000
1500
1000
1 500 24 kN
184 kN
160 kN136 kN 116 kN
84 kN
60 kN 1G 1F 1E 1D 1C 1B 1A 1
0(Note Vertical gridlines in figure are positioned at a spacing of 3048 mm (1 ft))
-500 1G 1F 1E 1D 1C 1B 1A
Strain Gage Designation
Figure 51 Strain profile along the outer edge of specimen (Line 1)
50
The strains drop off sharply for distances further away from the end of the overhang with the
majority of the strain gages on the opposite side of the stem wall (line C) exhibiting less than a
third of the strain values shown in line B The sharp drop in strain values at distances away from
the adjacent stem wall and the insignificant strains within these regions indicate that the
significantly shorter lengths of CFRP strips could be used to optimize material usage and
improve constructability without affecting load transfer and the overall system response
The strains along line B the location where the maximum strains occur in the specimen is shown
in Figure 52 This figure indicates that the distribution of strains was even along the specimen
until the load level of 116 kN (26 kip) per jack was reached At this level cracking was first
observed on the specimen and higher loading levels showed comparable but slightly less uniform
strains along the specimen The average strain along line B in the specimen at ultimate capacity
was 3423 microstrains whereas the minimum and maximum strains along line B were 2943
microstrains and 3846 microstrains respectively
4000
Location of strain gages 3500(See Figure for detailed schematic)
1B 3B 4B 5B 6B 7B 8B 9B Strain Gage Designation
Stra
ins (
mic
rost
rain
s) 3000 196 kN B 184 kN
160 kN 2500
1B
4B 3B
5B
9B 8B 7B 6B
B
136 kN 2000 116 kN
1500 84 kN
1000 60 kN
500
24 kN 0
(Note Vertical gridlines in figure are positioned at a spacing of 3048 mm (1 ft))
Figure 52 Strains along the edge of the stem wall adjacent to the deck slab overhang (Line B)
Using the strain data throughout the specimen and following a procedure described by Siem et al
[24] the shear stress between the concrete and the CFRP strips were calculated using the
following equation
51
9
(ε minus ε )sdot E sdot tn+1 n L Lτ nn+1 = (11)(x minus x )n+1 n
Where (x minus x )= distance between two strain gages EL= the tensile elastic modulus of then+1 n
CFRP strip and tL = thickness of the CFRP strips For these calculations EL= 1381 GPa (2005
Msi) and tL = 12 mm (0047 in) were used for the CFRP strips The calculated shear stress
values within the adhesive are simply the mean value between two strain gages which ignore
localized stress peaks and gradients
Distance from west edge (m) 27 24 21 18 15 12 09 06 03 00
Location of strain gages 20 (See Figure for detailed schematic)
15
196 kN
116 kN 160 kN
9B9G 9F 9E 9D 9C
(Note Vertical gridlines in figure are positioned at a spacing of 3048 mm (1 ft)
9
Stre
ss (M
Pa) 10
05
00
-05
-10
-15
-20
Figure 53 Calculated shear stress within adhesive along the central edge of specimen (Line 9)
Distance from west edge(m) 27 24 21 18 15 12 09 06 03 00
Location of strain gages (See Figure for detailed schematic) 20
196 kN
116 kN
160 kN
5 00
(Note Vertical gridlines in figure are positioned at a spacing of 3048 mm (1 ft)
3B5G 5F 5E 5A5D 5C
Stre
ss (M
Pa)
15
10
05
-05
-10
-15
-20
Figure 54 Calculated shear stress within adhesive along the middle of specimen (Line 5)
52
5
Distance from west edge(m) 27 24 21 18 15 12 09 06 03 00
Location of strain gages 20 (See Figure for detailed schematic)
196 kN
116 kN 160 kN
Stre
ss (M
Pa) 15
10
05
00
-05 3
(Note Vertical gridlines in figure are positioned at a spacing of 3048 mm (1 ft)
3B3G 3F 3E 3D 3C 3A 3
-10
-15
-20
Figure 55 Calculated shear stress within adhesive along an interior CFRP strip (Line 3)
Distance from west edge (m) 27 24 21 18 15 12 09 06 03 00
Location of strain gages 20 (See Figure for detailed schematic)
-20
196 kN
116 kN 160 kN
Stre
ss (M
Pa)
15
10
05
00
-05
-10
-15
1G 1F 1E 1D 1B1C 1A 11
(Note Vertical gridlines in figure are positioned at a spacing of 3048 mm (1 ft))
1G 1F 1E 1D 1C 1B 1A Strain Gage Designation
Figure 56 Calculated shear stress within adhesive along the outer edge of specimen (Line 1)
53
After the testing of the NSM CFRP rehabilitated specimen was completed the overhang of the
specimen was cut off and carefully removed from the rest of the test specimen as shown in
Figure 57 to allow for further examination of this critical region
432 mm (17 in)
Figure 57 Location of cut for removal of FRP rehabilitated overhang from test specimen
One point of interest to examine on the removed overhang was the actual location of the CFRP
strip reinforcement within the section Figure 58 shows that the actual embedment depth of the
near surface mounted CFRP strips was approximately 6 mm (025
in) and the actual thickness of the SikaDur 30 resin layer used to
bond the CFRP strips to the concrete was also approximately 6 mm
(025 mm) An embedment depth of 6 mm (025 in) is reasonable
for NSM applications because it allows enough space for an
adequate top surface of resin which will serve as environmental
protection and the wear surface for the deck However the 6 mm
(025 mm) thickness of the SikaDur 30 bottom resin layer exceeded
the maximum manufacturer recommended value of 3 mm (18
inch) While the current system performed very well the use of an
overly thick resin layer could have had an negative effect on the
overall structural response of the system Figure 58 Detail showing actual location of reinforcement
Figure 59 shows the failure surface of an FRP strip which has been detached from the top
surface of the deck The center portion of the strip with the firmly attached concrete was the
region in which the interfacial failure in the concrete occurred while the outer sections of the
strip were neatly detached from the resin system due to the method of removal of the strip
54
Figure 59 Detail of failure surface of FRP strip
58 Comparison with Theory
The NSM CFRP rehabilitated specimen reached ultimate capacity under an applied load of 196
kN (44 kip) per hydraulic jack which is equivalent to an applied moment of 1892 kN-m (1392
kip-ft) This improved performance corresponds to a 72 increase in ultimate capacity over the
as-built specimen which failed under an applied load of 114 kN (26 kip) corresponding to an
applied moment of 1100 kN-m (810 kip-ft) The ACI 440-02 calculation for externally bonded
FRP reinforcement predicted a maximum moment capacity of 1660 kN-m (1224 kip-ft) which
corresponds to a 51 increase in load carrying capacity over the experimentally determined
capacity of the as-built specimen The moment curvature analysis predicted a maximum moment
capacity of 1855 kN-m (1364 kip-ft) which corresponds to a 69 increase in load carrying
capacity over the as-built specimen The theoretical predictions and experimental results were
within 12 using the ACI 440 approach and were in close agreement with only a 2 error
using the moment curvature analysis The larger disagreement with experimental data found
from the ACI 440 moment capacity increase equation likely exists because this calculation is a
more simplified approach that does not take into account the over strength of the steel
reinforcement
55
3rd cracks observed
1st cracks observed
200
220
59 Comparison with As-Built
The ultimate capacity of the near surface mounted CFRP strip rehabilitated slab was reached at
an applied load of 196 kN (44 kips) equivalent to a uniform distributed load of 245 kNm (168
kipft) which is 11x the nominal soundwall load This ultimate capacity is 78 greater than that
obtained by the as-built specimen which occurred at 114 kN (26 kips) per hydraulic jack
equivalent to a uniform distributed load of 1425 kNm (98 kipft) which is 633x the nominal
wall load The center deflections under the loading beam for both specimens over the complete
loading ranges applied are compared in Figure 60(a) and Figure 60(b) At the failure load level
of the as-built specimen the as-built specimen had a center deflection under the loading beam of
636 mm (025 in) whereas the FRP rehabilitated specimen deflected approximately half that of
the as-built specimen or 333 mm (013 in) At ultimate capacity of the FRP rehabilitated
specimen the center deflection under the loading beam was 873 mm (034 in) which indicates
the rehabilitated specimen exhibited a 318 increase in deformation capacity over the as-built
specimen
10
0 2 4 6 8 10
Ultimate Capacity
1st cracks observed
2nd cracks observed
4th cracks observed
As-built test
3rd cracks observed
2nd cracks observed 1st cracks observed
Ultimate Capacity
Rehabilitated test
Def
lect
ion
(mm
)
6
5
4
360
240 120
0 0
Deflection (mm) Load per hydralulic jack (kN)
As-built specimenRehabilitated specimen
Ultimate Capacity
Ultimate Capacity
24 36 48 60 72 84 96 102 114 136 160 184 196
9
180
Load
per
hyd
raul
ic ja
ck (k
N) 8
160 7 140
120
100
80
a) Load versus deflection profiles (b) Comparison of linear potentiometers below loading beam
Figure 60 Comparisons of middle center deflections of the deck slab overhang
In addition to increasing the overall load and deformation capacity of the system the near
surface mounted CFRP strips act to increase the stiffness and improve the stability of the system
56
The load versus deflection profile shown in Figure 60(a) shows the significantly increased
stiffness and more linear profile for the FRP rehabilitated specimen over the as-built specimen
The deflection profile comparison at the 114 kN (26 kips) per jack load level along the middle of
the two slabs is shown in Figure 61 This figure illustrates that for the same load level the
deflections within the FRP rehabilitated specimen are lower than the deflections of the as-built
specimen throughout the deck slab and not just at the point of load application
Location of linear potentiometers 0 Distance from edge (mm)
279 610
1524
76
M1 M2 M3 M4
2
4
M M
6
8
10
FRP rehabilited specimen at 114 kN per jack
As-built specimen at 114 kN per jack
M1 M2 M3 M4 Linear Potentiometer Designation
Figure 61 Comparison of deflection profiles along center of specimens (Line M)
The first set cracking observed on the as-built specimen occurred at the load level of 84 kN (19
kip) whereas the first set cracking observed on the FRP rehabilitated specimen occurred at 116
kN (26 kip) which is corresponds to a 38 greater load A comparison of the deflection profiles
along the center of the specimens at these loading levels shown in Figure 62 reveals nearly
identical deformations for the two specimens
57
10
10
M1
1524
279 610
76
M2 M3 M4
Location of linear potentiometers Distance from edge (mm)
FRP rehabilited specimen at 1st observed cracking
(116 kN per jack)
0
2 As-built specimen
at 1st observed cracking (84 kN per jack) 4
M
Def
lect
ion
(mm
)
M
6
8
M1 M2 M3 M4 Linear Potentiometer Designation
Figure 62 Comparison of center deflection profiles at 1st observed cracking loads (Line M)
The second set of cracking observed on the as-built specimen occurred at the load level of 101
kN (23 kip) whereas the second set of cracking observed on the FRP rehabilitated specimen
occurred at 136 kN (31 kip) which is corresponds to a 35 greater load The deflection profile
comparison at the load levels where the second set of cracking was observed in Figure 64 also
exhibits nearly identical deformations for the two specimens This indicates that while the FRP
reinforcement acts to stiffen the system and increase the load carrying capacity of the overhang
region the shape of the deflection response profile of the system is not modified significantly
with the addition of the CFRP strips
0FRP rehabilited specimen at 2nd observed cracking
(136 kN per jack)
As-built specimen at 2nd observed cracking
(101 kN per jack)
Location of linear potentiometers Distance from edge (mm)
279 610
1524
76
M M1 M2 M3 M4
2
4
Def
lect
ion
(mm
)
M
6
8
M1 M2 M3 M4 Linear Potentiometer Designation
Figure 63 Comparison of center deflection profiles at 2nd observed cracking loads (Line M)
58
Figure 64 shows the side by side top decks of the two specimens after testing has been completed
and all loose concrete on the top deck removed Details of the critical region of the as-built and
FRP rehabilitated top deck are shown in Figure 65 and Figure 66 respectively
Figure 64 Top view of deck slab tested to ultimate capacity after removal of loose concrete
59
For the as-built specimen extensive damage and spalling of the concrete on the top of the deck
slab was seen Yielding in the transverse steel reinforcement followed by loss of aggregate
interlock resulting in failure was observed
Figure 65 Detail of cracking observed at ultimate capacity- top view of as-built deck
For the FRP rehabilitated specimen negligible spalled concrete and loose concrete rubble was
detected A concrete splitting failure mode was observed in the FRP rehabilitated specimen
Figure 66 Detail of cracking observed at ultimate capacity- top view of FRP rehabilitated deck
60
6 SUMMARY OF RESULTS AND RECOMMENDATIONS FOR FUTURE RESEARCH
Experimental results from the testing of the rehabilitated specimen indicate that the NSMR
strengthening scheme was successful at achieving the desired load carrying capacity increase
The ultimate load carrying capacity of the FRP rehabilitated specimen was 196 kN (44 kips) per
hydraulic jack which was 78 higher that the ultimate load of the as- built specimen of 114 kN
(26 kips) per hydraulic jack This value well exceeded the desired load capacity increase of
297 above the experimentally determined capacity of the as-built specimen exhibited a very
stable structural response and increased the deformation capacity of the system The theoretical
moment capacity predictions for the as-built specimen were within 11 and 65 of the
experimentally determined value using ACI 318 and moment curvature analysis respectively
The theoretical moment capacity predictions for the FRP rehabilitated specimen were within
12 of the experimental value using the modified ACI 440-02 approach and were within 2
using moment curvature analysis
The NSM FRP rehabilitated specimen exhibits a variety of structural performance improvements
over the as-built specimen including increased ultimate load carrying capacity enhanced
deformation capacity and more stable overall structural performance Design options for the
near surface mounted CFRP strengthening schemes allow for great flexibility in terms of
tailoring the reinforcement parameters for specific applications With consideration of the
minimal disruption to traffic flow and ease of installation this system is a viable and very
attractive rehabilitation option for bridge deck slab overhangs
The purpose of Phase 1 was to conduct an experimental analysis of the use of NSM for purposes
of strengthening and to provide the basis for the planning of Phase 2 as detailed in the initial
proposal submitted to Caltrans Based on the extensive literature review already conducted
(although according to the project funding provided by Caltrans is to be completed and reported
on in Phase 2) and on the experimental results the following aspects are recommended for further
study in Phase 2
61
bull Complete review of the failure modes and mechanisms seen with use of barsrods as
compared to flat strips for purposes of documenting advantages of strips It is noted that
a very brief summary is given in the introductory portion of this report
bull Optimization of groove dimensions and spacing for NSM use through both analytical and
experimental study
bull Study of adhesive rheology and bond quality as well as durability
bull Study of minimum development length and effect of insertion into girder stems
bull Study of use for specific strengthening applications
bull Development of design guide for Caltrans and development of example comparing NSM
use to surface bonding
It is emphasized that the studies should be conducted on specimens of sufficient size since small
scale tests are likely to provide erroneous results due to effects of scale and configuration It is
recommended that these tests only be conducted after a review of advances in Europe and
Australia are completed and sufficient analytical work is completed on optimization of grove
dimensions and spacing Since the efficacy of the method is intrinsically related to the ability of
the adhesive to not only bond the reinforcement to the concrete substrate but to also enable
efficient stress transfer study also needs to be conducted on adhesive rheology performance
characteristics and cure It is recommended that this be based on the completed durability study
which should provide a base-line for further study Also since it is likely that the NSM will be
covered by asphalt the effect of heat due to asphalt on the adhesive and bond should also be
studied
62
7 REFERENCES
[1] VM Karbhari and L Zhao ldquoUse of composites for 21st century civil infrastructurerdquo
Computer Method Appl Mech Eng 185 pp 433ndash454 (2000)
[2] S Rizkalla T Hassan N Hassan ldquoDesign recommendations for the use of FRP for
strengthening of concrete structuresrdquo Prog Struct Engng Mater 5 pp 16ndash28 (2003)
[3] K K Ghosh ldquoAssessment of FRP composite strengthened reinforced concrete bridge
structures at the component and systems level through progressive damage and nonshy
destructive evaluation (NDE) [PhD dissertation] University of California San Diego
(2006)
[4] L De Lorenzis JG Teng ldquoNear-surface mounted FRP reinforcement An emerging
technique for strengthening structuresrdquo Composites Part B 38 pp 119-143 (2007)
[5] R Parretti A Nanni ldquoStrengthening of RC Members Using Near-Surface Mounted FRP
Composites Design Overviewrdquo Advances in Structural Engineering 7 5 pp 1-16 (2004)
[6] J R Yost S P Gross D W Dinehart and J J Mildenberg ldquoFlexural Behavior of
Concrete Beams Strengthened with Near-Surface-Mounted CFRP Stripsrdquo ACI Structural
Journal July-August pp 430-437(2007)
[7] L A DeLorenzis A Nanni and A L Tegila ldquoFlexural and Shear Strengthening of
Reinforced Concrete Structures with Near Surface Mounted FRP Barsrdquo Proceedings of the
3rd International Conference on Advanced Composite Materials in Bridges and Structures
Ottawa Canada Aug 15-18 pp 521-528 (2000)
[8] El-Hacha R and Rizkalla S 2004 ldquoNear-Surface-Mounted Fiber- Reinforced Polymer
Reinforcements for Flexural Strengthening of Concrete Structuresrdquo ACI Structural Journal
V 101 V 5 Sept-Oct pp 717-726
[9] R Parretti and A Nanni ldquoStrengthening of RC Members Using Near-Surface Mounted
FRP Composites Design Overviewrdquo Advances in Structural Engineering V 7 (5) (2004)
63
[10] E Bonaldo J A Oliveira de Barros and P B Lourenccedilo ldquoEfficient Strengthening
Technique to Increase the Flexural Resistance of Existing RC Slabsrdquo ASCE Journal of
Composites for Construction MarchApril pp149-159 (2008)
[11] The Concrete Society Design Guidance for Strengthening Concrete Structures using Fibre
Composite Materials Concrete Society Technical Report 55 2nd Edition (2004)
[12] ACI Committee 440 Guide for the Design and Construction of Externally Bonded FRP
Systems for Strengthening Concrete Structures ACI 4402 R-02 (2002)
[13] Canadian Standards Association Canadian Highway Bridge Design Code- Section 16
Fibre-Reinforced Structures (2006)
[14] AASHTO LRFD bridge design specifications 3rd Ed AASHTO Washington DC
(2004)
[15] A B Pridmore V M Karbhari ldquoEvaluation of Prefabricated FRP Structural Formwork
Bridge Deck Systemsrdquo SAMPE 53rd International Technical Conference (2008)
[16] Caltrans ldquoMemo to Designers 22-1 Soundwall Design Criteriardquo (2004)
[17] ACI 318-08 Building Code Requirements for Structural Concrete (2008)
[18] Caltrans Bridge Design Specifications Section 8- Reinforced Concrete (2003)
[19] Bentz E and Collins M P lsquolsquoRESPONSE-2000mdashReinforced Concrete Section al Analysis
using the Modified Compression Field Theoryrdquo Version 105 Toronto Canada (2000)
[20] Caltrans ldquoMemo to Designers 22-1 Soundwall Design Criteriardquo (2004)
[21] Sika Corporation Product Data Sheet for Sika CarboDur Rods- carbon fiber rods for
structural strengthening Edition 9 (2003)
[22] Sika Corporation Product Data Sheet for Sika CarboDur- Carbon fiber laminate for
structural strengthening Edition 722 (2005)
[23] Hughes Brothers Inc Product data sheet for Aslan 500- CFRP tape wwwhughesbroscom
(2002)
64
[24] W Seim Y Vasquez VM Karbhari and F Seible ldquoPost-Strengthening of Concrete
Slabs Full Scale Testing and Design Recommendationrdquo ASCE Journal of Structural
Engineering 129[6] pp 743-752 (2003)
[25] W Seim M Hormann VM Karbhari and F Seible External FRP Poststrengthening of
Scaled Concrete Slabs ASCE Journal of Composites in Construction 5[2] pp 67-75
(2001)
[26] Sika Europe- German Institute of Construction Technology 1998
[27] International Concrete Repair Institute ICRI Guideline No 037324 ldquoSelecting and
Specifying Concrete Surface Preparation for Sealers Coatings and Polymer Overlaysrdquo
(1997)
[28] S J Jin ldquoStatistical Characterization of Prefabricated FRP Composite Materials for
Rehabilitation of Concrete Structuresrdquo Master Thesis Department of Structural
Engineering University of California San Diego (2008)
[29] Sika Corporation ldquoCarboDur Installation Guiderdquo Sika construction documents
65
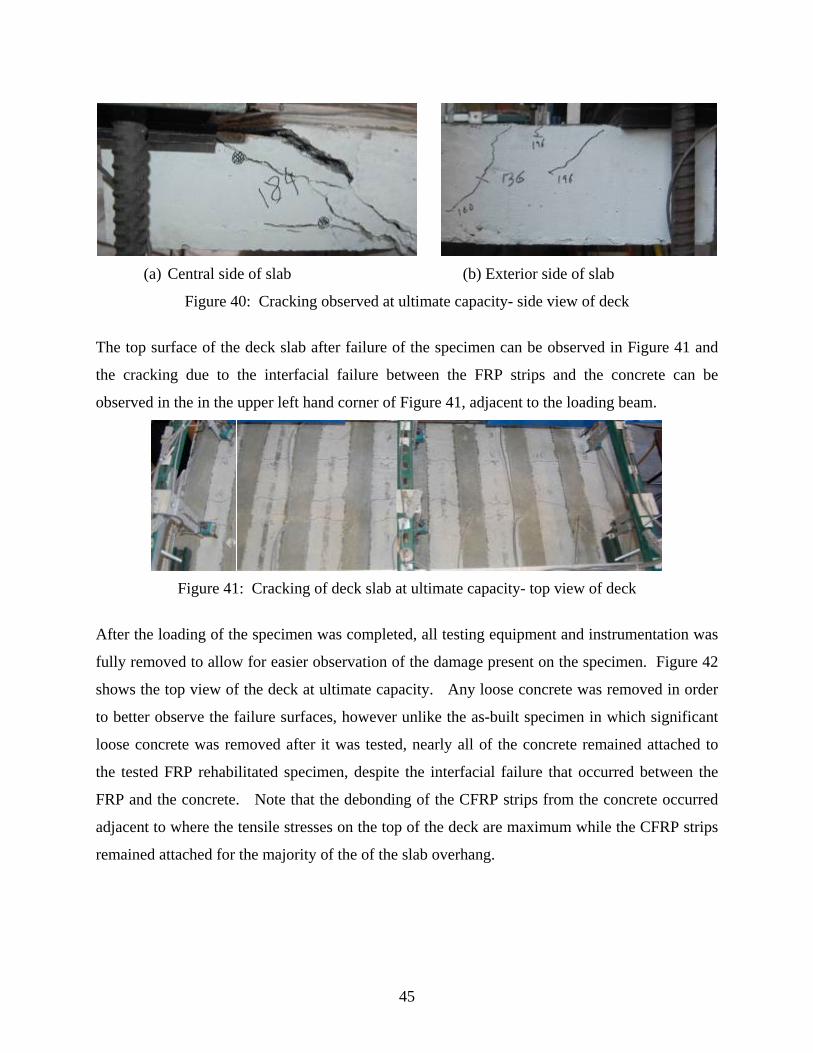

80
140
10220 Ultimate Capacity Ultimate Capacity B4200 9 4th cracks
observed 4th cracks observed 180 8
M43rd cracks 160 3rd cracks 7observed
Load
per
hyd
raul
ic ja
ck (k
N)
Def
lect
ion
(mm
) observed 2nd cracks observed B4
120 1st cracks M4
100 observed A4
A46 2nd cracks
5 observed 1st cracks 4 observed B4B4 3
M460 2M4 A440
20 A4 1
0 0
0 2 4 6 8 10 24 60 84 116 136 160 172 184 196 Deflection (mm) Load per hydralulic jack (kN)
(a) Load versus deflection profiles (b) Comparison of linear potentiometers below loading beam
Figure 43 Comparisons of deflections at the edge of the deck slab overhang
The profiles along the center of the specimen (Figure 45) and at both edges (Figure 44 and
Figure 46) shown below exhibit similar deflection profiles throughout the loading range
0 24 kN Location of linear potentiometers
Distance from edge (mm) 60 kN 2 84 kN
B3 B4B1 B2 BB
Def
lect
ion
(mm
)
116 kN 4
136 kN
160 kN 6
8 184 kN 76
279 610 196 kN 101524 B1 B2 B3 B4
Linear Potentiometer Designation
Figure 44 Deflection profile along the central edge of specimen (Line B)
47
Location of linear potentiometers 0 24 kN Distance from edge (mm)
279 610
1524
76
M1 M2 M3 M4
60 kN 2 84 kN
M1 M2 M3 M4 Linear Potentiometer Designation
MM
Def
lect
ion
(mm
) 116 kN 4
136 kN
160 kN 6
184 kN 8
196 kN
10
Figure 45 Deflection profile along center of specimen (Line M)
0Location of linear potentiometers 24 kN Distance from edge (mm)
60 kN 2
84 kN
A1 A2 A3 A4 Linear Potentiometer Designation
279 610
1524
76
A1 A2 A3 A4 AA
Def
lect
ion
(mm
)
116 kN
136 kN
6
4
160 kN
8 184 kN
196 kN 10
Figure 46 Deflection profile along the outer edge of specimen (Line A)
The deflection profiles shown in Figure 47 and Figure 48 also indicate comparable deflections
along the overhang at a distance midway to the adjacent stem wall and directly below the point
of load application respectively
48
0 24 kN 60 kN 84 kN Location of linear potentiometers 116 kN 2Distance from edge (mm)
136 kN 160 kN
A3 M3 B3 Linear Potentiometer Designation
Def
lect
ion
(mm
)
3 184 kN 4 196 kN
8
10
838
152
1524
3
A3
M3
B3
Figure 47 Deflections midway along overhang (Line 3)
6
0
2
4
6
8
10
Def
lect
ion
(mm
)
84 kN 60 kN 24 kN
196 kN
184 kN
116 kN
136 kN
160 kN
A4 M4 B4
Location of linear potentiometers Distance from edge (mm)
838
152
1524
4
4
A4
M4
B4
Linear Potentiometer Designation
Figure 48 Deflections directly below loading beam (Line 4)
The strains in the FRP strips are also examined throughout the NSM CFRP rehabilitated
specimen The strain profiles along the edges and the middle of the specimen are shown in
Figure 49 Figure 50 and Figure 51 respectively These strain profiles indicate that the
maximum strain in the CFRP strips occurs directly above the edge of the stem wall adjacent to
the deck slab overhang referred to with the designation ldquoline Brdquo At ultimate capacity the
maximum strain in the specimen of 3846 microstrains occurs in strain gage 4B which is located
in line B near the middle of the specimen overhang
49
4000
Location of strain gages 3500 (See Figure for detailed schematic)
196 kN 3000
Stra
ins (
mic
rost
rain
s) 184 kN 9G 9F 9E 9D 9C 9B 160 kN9 9 2500
2000
1500
1000 60 kN
500 24 kN 0
136 kN 116 kN
84 kN
(Note Vertical gridlines in figure are -500 positioned at a spacing of 3048 mm (1 ft) 9G 9F 9E 9D 9C 9B Strain Gage Designation
Figure 49 Strain profile along the central edge of specimen (Line 9)
4000 196 kN
3500 184 kN (See Figure for detailed schematic)
Location of strain gages
3000 160 kN136 kN
Stra
ins (
mic
rost
rain
s)
2500
2000
1500
1000 60 kN 500 24 kN
0 (Note Vertical gridlines in figure are
-500 positioned at a spacing of 3048 mm (1 ft) 5G 5F 5E 5D 5C 5B 5A Strain Gage Designation
Figure 50 Strain profile along the middle of specimen (Line 5)
4000 Location of strain gages
(See Figure for detailed schematic) 3500 196 kN
116 kN
5G 5F 5E 5D 5C 5B 5A 5 84 kN 5
Stra
ins (
mic
rost
rain
s) 3000
2500
2000
1500
1000
1 500 24 kN
184 kN
160 kN136 kN 116 kN
84 kN
60 kN 1G 1F 1E 1D 1C 1B 1A 1
0(Note Vertical gridlines in figure are positioned at a spacing of 3048 mm (1 ft))
-500 1G 1F 1E 1D 1C 1B 1A
Strain Gage Designation
Figure 51 Strain profile along the outer edge of specimen (Line 1)
50
The strains drop off sharply for distances further away from the end of the overhang with the
majority of the strain gages on the opposite side of the stem wall (line C) exhibiting less than a
third of the strain values shown in line B The sharp drop in strain values at distances away from
the adjacent stem wall and the insignificant strains within these regions indicate that the
significantly shorter lengths of CFRP strips could be used to optimize material usage and
improve constructability without affecting load transfer and the overall system response
The strains along line B the location where the maximum strains occur in the specimen is shown
in Figure 52 This figure indicates that the distribution of strains was even along the specimen
until the load level of 116 kN (26 kip) per jack was reached At this level cracking was first
observed on the specimen and higher loading levels showed comparable but slightly less uniform
strains along the specimen The average strain along line B in the specimen at ultimate capacity
was 3423 microstrains whereas the minimum and maximum strains along line B were 2943
microstrains and 3846 microstrains respectively
4000
Location of strain gages 3500(See Figure for detailed schematic)
1B 3B 4B 5B 6B 7B 8B 9B Strain Gage Designation
Stra
ins (
mic
rost
rain
s) 3000 196 kN B 184 kN
160 kN 2500
1B
4B 3B
5B
9B 8B 7B 6B
B
136 kN 2000 116 kN
1500 84 kN
1000 60 kN
500
24 kN 0
(Note Vertical gridlines in figure are positioned at a spacing of 3048 mm (1 ft))
Figure 52 Strains along the edge of the stem wall adjacent to the deck slab overhang (Line B)
Using the strain data throughout the specimen and following a procedure described by Siem et al
[24] the shear stress between the concrete and the CFRP strips were calculated using the
following equation
51
9
(ε minus ε )sdot E sdot tn+1 n L Lτ nn+1 = (11)(x minus x )n+1 n
Where (x minus x )= distance between two strain gages EL= the tensile elastic modulus of then+1 n
CFRP strip and tL = thickness of the CFRP strips For these calculations EL= 1381 GPa (2005
Msi) and tL = 12 mm (0047 in) were used for the CFRP strips The calculated shear stress
values within the adhesive are simply the mean value between two strain gages which ignore
localized stress peaks and gradients
Distance from west edge (m) 27 24 21 18 15 12 09 06 03 00
Location of strain gages 20 (See Figure for detailed schematic)
15
196 kN
116 kN 160 kN
9B9G 9F 9E 9D 9C
(Note Vertical gridlines in figure are positioned at a spacing of 3048 mm (1 ft)
9
Stre
ss (M
Pa) 10
05
00
-05
-10
-15
-20
Figure 53 Calculated shear stress within adhesive along the central edge of specimen (Line 9)
Distance from west edge(m) 27 24 21 18 15 12 09 06 03 00
Location of strain gages (See Figure for detailed schematic) 20
196 kN
116 kN
160 kN
5 00
(Note Vertical gridlines in figure are positioned at a spacing of 3048 mm (1 ft)
3B5G 5F 5E 5A5D 5C
Stre
ss (M
Pa)
15
10
05
-05
-10
-15
-20
Figure 54 Calculated shear stress within adhesive along the middle of specimen (Line 5)
52
5
Distance from west edge(m) 27 24 21 18 15 12 09 06 03 00
Location of strain gages 20 (See Figure for detailed schematic)
196 kN
116 kN 160 kN
Stre
ss (M
Pa) 15
10
05
00
-05 3
(Note Vertical gridlines in figure are positioned at a spacing of 3048 mm (1 ft)
3B3G 3F 3E 3D 3C 3A 3
-10
-15
-20
Figure 55 Calculated shear stress within adhesive along an interior CFRP strip (Line 3)
Distance from west edge (m) 27 24 21 18 15 12 09 06 03 00
Location of strain gages 20 (See Figure for detailed schematic)
-20
196 kN
116 kN 160 kN
Stre
ss (M
Pa)
15
10
05
00
-05
-10
-15
1G 1F 1E 1D 1B1C 1A 11
(Note Vertical gridlines in figure are positioned at a spacing of 3048 mm (1 ft))
1G 1F 1E 1D 1C 1B 1A Strain Gage Designation
Figure 56 Calculated shear stress within adhesive along the outer edge of specimen (Line 1)
53
After the testing of the NSM CFRP rehabilitated specimen was completed the overhang of the
specimen was cut off and carefully removed from the rest of the test specimen as shown in
Figure 57 to allow for further examination of this critical region
432 mm (17 in)
Figure 57 Location of cut for removal of FRP rehabilitated overhang from test specimen
One point of interest to examine on the removed overhang was the actual location of the CFRP
strip reinforcement within the section Figure 58 shows that the actual embedment depth of the
near surface mounted CFRP strips was approximately 6 mm (025
in) and the actual thickness of the SikaDur 30 resin layer used to
bond the CFRP strips to the concrete was also approximately 6 mm
(025 mm) An embedment depth of 6 mm (025 in) is reasonable
for NSM applications because it allows enough space for an
adequate top surface of resin which will serve as environmental
protection and the wear surface for the deck However the 6 mm
(025 mm) thickness of the SikaDur 30 bottom resin layer exceeded
the maximum manufacturer recommended value of 3 mm (18
inch) While the current system performed very well the use of an
overly thick resin layer could have had an negative effect on the
overall structural response of the system Figure 58 Detail showing actual location of reinforcement
Figure 59 shows the failure surface of an FRP strip which has been detached from the top
surface of the deck The center portion of the strip with the firmly attached concrete was the
region in which the interfacial failure in the concrete occurred while the outer sections of the
strip were neatly detached from the resin system due to the method of removal of the strip
54
Figure 59 Detail of failure surface of FRP strip
58 Comparison with Theory
The NSM CFRP rehabilitated specimen reached ultimate capacity under an applied load of 196
kN (44 kip) per hydraulic jack which is equivalent to an applied moment of 1892 kN-m (1392
kip-ft) This improved performance corresponds to a 72 increase in ultimate capacity over the
as-built specimen which failed under an applied load of 114 kN (26 kip) corresponding to an
applied moment of 1100 kN-m (810 kip-ft) The ACI 440-02 calculation for externally bonded
FRP reinforcement predicted a maximum moment capacity of 1660 kN-m (1224 kip-ft) which
corresponds to a 51 increase in load carrying capacity over the experimentally determined
capacity of the as-built specimen The moment curvature analysis predicted a maximum moment
capacity of 1855 kN-m (1364 kip-ft) which corresponds to a 69 increase in load carrying
capacity over the as-built specimen The theoretical predictions and experimental results were
within 12 using the ACI 440 approach and were in close agreement with only a 2 error
using the moment curvature analysis The larger disagreement with experimental data found
from the ACI 440 moment capacity increase equation likely exists because this calculation is a
more simplified approach that does not take into account the over strength of the steel
reinforcement
55
3rd cracks observed
1st cracks observed
200
220
59 Comparison with As-Built
The ultimate capacity of the near surface mounted CFRP strip rehabilitated slab was reached at
an applied load of 196 kN (44 kips) equivalent to a uniform distributed load of 245 kNm (168
kipft) which is 11x the nominal soundwall load This ultimate capacity is 78 greater than that
obtained by the as-built specimen which occurred at 114 kN (26 kips) per hydraulic jack
equivalent to a uniform distributed load of 1425 kNm (98 kipft) which is 633x the nominal
wall load The center deflections under the loading beam for both specimens over the complete
loading ranges applied are compared in Figure 60(a) and Figure 60(b) At the failure load level
of the as-built specimen the as-built specimen had a center deflection under the loading beam of
636 mm (025 in) whereas the FRP rehabilitated specimen deflected approximately half that of
the as-built specimen or 333 mm (013 in) At ultimate capacity of the FRP rehabilitated
specimen the center deflection under the loading beam was 873 mm (034 in) which indicates
the rehabilitated specimen exhibited a 318 increase in deformation capacity over the as-built
specimen
10
0 2 4 6 8 10
Ultimate Capacity
1st cracks observed
2nd cracks observed
4th cracks observed
As-built test
3rd cracks observed
2nd cracks observed 1st cracks observed
Ultimate Capacity
Rehabilitated test
Def
lect
ion
(mm
)
6
5
4
360
240 120
0 0
Deflection (mm) Load per hydralulic jack (kN)
As-built specimenRehabilitated specimen
Ultimate Capacity
Ultimate Capacity
24 36 48 60 72 84 96 102 114 136 160 184 196
9
180
Load
per
hyd
raul
ic ja
ck (k
N) 8
160 7 140
120
100
80
a) Load versus deflection profiles (b) Comparison of linear potentiometers below loading beam
Figure 60 Comparisons of middle center deflections of the deck slab overhang
In addition to increasing the overall load and deformation capacity of the system the near
surface mounted CFRP strips act to increase the stiffness and improve the stability of the system
56
The load versus deflection profile shown in Figure 60(a) shows the significantly increased
stiffness and more linear profile for the FRP rehabilitated specimen over the as-built specimen
The deflection profile comparison at the 114 kN (26 kips) per jack load level along the middle of
the two slabs is shown in Figure 61 This figure illustrates that for the same load level the
deflections within the FRP rehabilitated specimen are lower than the deflections of the as-built
specimen throughout the deck slab and not just at the point of load application
Location of linear potentiometers 0 Distance from edge (mm)
279 610
1524
76
M1 M2 M3 M4
2
4
M M
6
8
10
FRP rehabilited specimen at 114 kN per jack
As-built specimen at 114 kN per jack
M1 M2 M3 M4 Linear Potentiometer Designation
Figure 61 Comparison of deflection profiles along center of specimens (Line M)
The first set cracking observed on the as-built specimen occurred at the load level of 84 kN (19
kip) whereas the first set cracking observed on the FRP rehabilitated specimen occurred at 116
kN (26 kip) which is corresponds to a 38 greater load A comparison of the deflection profiles
along the center of the specimens at these loading levels shown in Figure 62 reveals nearly
identical deformations for the two specimens
57
10
10
M1
1524
279 610
76
M2 M3 M4
Location of linear potentiometers Distance from edge (mm)
FRP rehabilited specimen at 1st observed cracking
(116 kN per jack)
0
2 As-built specimen
at 1st observed cracking (84 kN per jack) 4
M
Def
lect
ion
(mm
)
M
6
8
M1 M2 M3 M4 Linear Potentiometer Designation
Figure 62 Comparison of center deflection profiles at 1st observed cracking loads (Line M)
The second set of cracking observed on the as-built specimen occurred at the load level of 101
kN (23 kip) whereas the second set of cracking observed on the FRP rehabilitated specimen
occurred at 136 kN (31 kip) which is corresponds to a 35 greater load The deflection profile
comparison at the load levels where the second set of cracking was observed in Figure 64 also
exhibits nearly identical deformations for the two specimens This indicates that while the FRP
reinforcement acts to stiffen the system and increase the load carrying capacity of the overhang
region the shape of the deflection response profile of the system is not modified significantly
with the addition of the CFRP strips
0FRP rehabilited specimen at 2nd observed cracking
(136 kN per jack)
As-built specimen at 2nd observed cracking
(101 kN per jack)
Location of linear potentiometers Distance from edge (mm)
279 610
1524
76
M M1 M2 M3 M4
2
4
Def
lect
ion
(mm
)
M
6
8
M1 M2 M3 M4 Linear Potentiometer Designation
Figure 63 Comparison of center deflection profiles at 2nd observed cracking loads (Line M)
58
Figure 64 shows the side by side top decks of the two specimens after testing has been completed
and all loose concrete on the top deck removed Details of the critical region of the as-built and
FRP rehabilitated top deck are shown in Figure 65 and Figure 66 respectively
Figure 64 Top view of deck slab tested to ultimate capacity after removal of loose concrete
59
For the as-built specimen extensive damage and spalling of the concrete on the top of the deck
slab was seen Yielding in the transverse steel reinforcement followed by loss of aggregate
interlock resulting in failure was observed
Figure 65 Detail of cracking observed at ultimate capacity- top view of as-built deck
For the FRP rehabilitated specimen negligible spalled concrete and loose concrete rubble was
detected A concrete splitting failure mode was observed in the FRP rehabilitated specimen
Figure 66 Detail of cracking observed at ultimate capacity- top view of FRP rehabilitated deck
60
6 SUMMARY OF RESULTS AND RECOMMENDATIONS FOR FUTURE RESEARCH
Experimental results from the testing of the rehabilitated specimen indicate that the NSMR
strengthening scheme was successful at achieving the desired load carrying capacity increase
The ultimate load carrying capacity of the FRP rehabilitated specimen was 196 kN (44 kips) per
hydraulic jack which was 78 higher that the ultimate load of the as- built specimen of 114 kN
(26 kips) per hydraulic jack This value well exceeded the desired load capacity increase of
297 above the experimentally determined capacity of the as-built specimen exhibited a very
stable structural response and increased the deformation capacity of the system The theoretical
moment capacity predictions for the as-built specimen were within 11 and 65 of the
experimentally determined value using ACI 318 and moment curvature analysis respectively
The theoretical moment capacity predictions for the FRP rehabilitated specimen were within
12 of the experimental value using the modified ACI 440-02 approach and were within 2
using moment curvature analysis
The NSM FRP rehabilitated specimen exhibits a variety of structural performance improvements
over the as-built specimen including increased ultimate load carrying capacity enhanced
deformation capacity and more stable overall structural performance Design options for the
near surface mounted CFRP strengthening schemes allow for great flexibility in terms of
tailoring the reinforcement parameters for specific applications With consideration of the
minimal disruption to traffic flow and ease of installation this system is a viable and very
attractive rehabilitation option for bridge deck slab overhangs
The purpose of Phase 1 was to conduct an experimental analysis of the use of NSM for purposes
of strengthening and to provide the basis for the planning of Phase 2 as detailed in the initial
proposal submitted to Caltrans Based on the extensive literature review already conducted
(although according to the project funding provided by Caltrans is to be completed and reported
on in Phase 2) and on the experimental results the following aspects are recommended for further
study in Phase 2
61
bull Complete review of the failure modes and mechanisms seen with use of barsrods as
compared to flat strips for purposes of documenting advantages of strips It is noted that
a very brief summary is given in the introductory portion of this report
bull Optimization of groove dimensions and spacing for NSM use through both analytical and
experimental study
bull Study of adhesive rheology and bond quality as well as durability
bull Study of minimum development length and effect of insertion into girder stems
bull Study of use for specific strengthening applications
bull Development of design guide for Caltrans and development of example comparing NSM
use to surface bonding
It is emphasized that the studies should be conducted on specimens of sufficient size since small
scale tests are likely to provide erroneous results due to effects of scale and configuration It is
recommended that these tests only be conducted after a review of advances in Europe and
Australia are completed and sufficient analytical work is completed on optimization of grove
dimensions and spacing Since the efficacy of the method is intrinsically related to the ability of
the adhesive to not only bond the reinforcement to the concrete substrate but to also enable
efficient stress transfer study also needs to be conducted on adhesive rheology performance
characteristics and cure It is recommended that this be based on the completed durability study
which should provide a base-line for further study Also since it is likely that the NSM will be
covered by asphalt the effect of heat due to asphalt on the adhesive and bond should also be
studied
62
7 REFERENCES
[1] VM Karbhari and L Zhao ldquoUse of composites for 21st century civil infrastructurerdquo
Computer Method Appl Mech Eng 185 pp 433ndash454 (2000)
[2] S Rizkalla T Hassan N Hassan ldquoDesign recommendations for the use of FRP for
strengthening of concrete structuresrdquo Prog Struct Engng Mater 5 pp 16ndash28 (2003)
[3] K K Ghosh ldquoAssessment of FRP composite strengthened reinforced concrete bridge
structures at the component and systems level through progressive damage and nonshy
destructive evaluation (NDE) [PhD dissertation] University of California San Diego
(2006)
[4] L De Lorenzis JG Teng ldquoNear-surface mounted FRP reinforcement An emerging
technique for strengthening structuresrdquo Composites Part B 38 pp 119-143 (2007)
[5] R Parretti A Nanni ldquoStrengthening of RC Members Using Near-Surface Mounted FRP
Composites Design Overviewrdquo Advances in Structural Engineering 7 5 pp 1-16 (2004)
[6] J R Yost S P Gross D W Dinehart and J J Mildenberg ldquoFlexural Behavior of
Concrete Beams Strengthened with Near-Surface-Mounted CFRP Stripsrdquo ACI Structural
Journal July-August pp 430-437(2007)
[7] L A DeLorenzis A Nanni and A L Tegila ldquoFlexural and Shear Strengthening of
Reinforced Concrete Structures with Near Surface Mounted FRP Barsrdquo Proceedings of the
3rd International Conference on Advanced Composite Materials in Bridges and Structures
Ottawa Canada Aug 15-18 pp 521-528 (2000)
[8] El-Hacha R and Rizkalla S 2004 ldquoNear-Surface-Mounted Fiber- Reinforced Polymer
Reinforcements for Flexural Strengthening of Concrete Structuresrdquo ACI Structural Journal
V 101 V 5 Sept-Oct pp 717-726
[9] R Parretti and A Nanni ldquoStrengthening of RC Members Using Near-Surface Mounted
FRP Composites Design Overviewrdquo Advances in Structural Engineering V 7 (5) (2004)
63
[10] E Bonaldo J A Oliveira de Barros and P B Lourenccedilo ldquoEfficient Strengthening
Technique to Increase the Flexural Resistance of Existing RC Slabsrdquo ASCE Journal of
Composites for Construction MarchApril pp149-159 (2008)
[11] The Concrete Society Design Guidance for Strengthening Concrete Structures using Fibre
Composite Materials Concrete Society Technical Report 55 2nd Edition (2004)
[12] ACI Committee 440 Guide for the Design and Construction of Externally Bonded FRP
Systems for Strengthening Concrete Structures ACI 4402 R-02 (2002)
[13] Canadian Standards Association Canadian Highway Bridge Design Code- Section 16
Fibre-Reinforced Structures (2006)
[14] AASHTO LRFD bridge design specifications 3rd Ed AASHTO Washington DC
(2004)
[15] A B Pridmore V M Karbhari ldquoEvaluation of Prefabricated FRP Structural Formwork
Bridge Deck Systemsrdquo SAMPE 53rd International Technical Conference (2008)
[16] Caltrans ldquoMemo to Designers 22-1 Soundwall Design Criteriardquo (2004)
[17] ACI 318-08 Building Code Requirements for Structural Concrete (2008)
[18] Caltrans Bridge Design Specifications Section 8- Reinforced Concrete (2003)
[19] Bentz E and Collins M P lsquolsquoRESPONSE-2000mdashReinforced Concrete Section al Analysis
using the Modified Compression Field Theoryrdquo Version 105 Toronto Canada (2000)
[20] Caltrans ldquoMemo to Designers 22-1 Soundwall Design Criteriardquo (2004)
[21] Sika Corporation Product Data Sheet for Sika CarboDur Rods- carbon fiber rods for
structural strengthening Edition 9 (2003)
[22] Sika Corporation Product Data Sheet for Sika CarboDur- Carbon fiber laminate for
structural strengthening Edition 722 (2005)
[23] Hughes Brothers Inc Product data sheet for Aslan 500- CFRP tape wwwhughesbroscom
(2002)
64
[24] W Seim Y Vasquez VM Karbhari and F Seible ldquoPost-Strengthening of Concrete
Slabs Full Scale Testing and Design Recommendationrdquo ASCE Journal of Structural
Engineering 129[6] pp 743-752 (2003)
[25] W Seim M Hormann VM Karbhari and F Seible External FRP Poststrengthening of
Scaled Concrete Slabs ASCE Journal of Composites in Construction 5[2] pp 67-75
(2001)
[26] Sika Europe- German Institute of Construction Technology 1998
[27] International Concrete Repair Institute ICRI Guideline No 037324 ldquoSelecting and
Specifying Concrete Surface Preparation for Sealers Coatings and Polymer Overlaysrdquo
(1997)
[28] S J Jin ldquoStatistical Characterization of Prefabricated FRP Composite Materials for
Rehabilitation of Concrete Structuresrdquo Master Thesis Department of Structural
Engineering University of California San Diego (2008)
[29] Sika Corporation ldquoCarboDur Installation Guiderdquo Sika construction documents
65
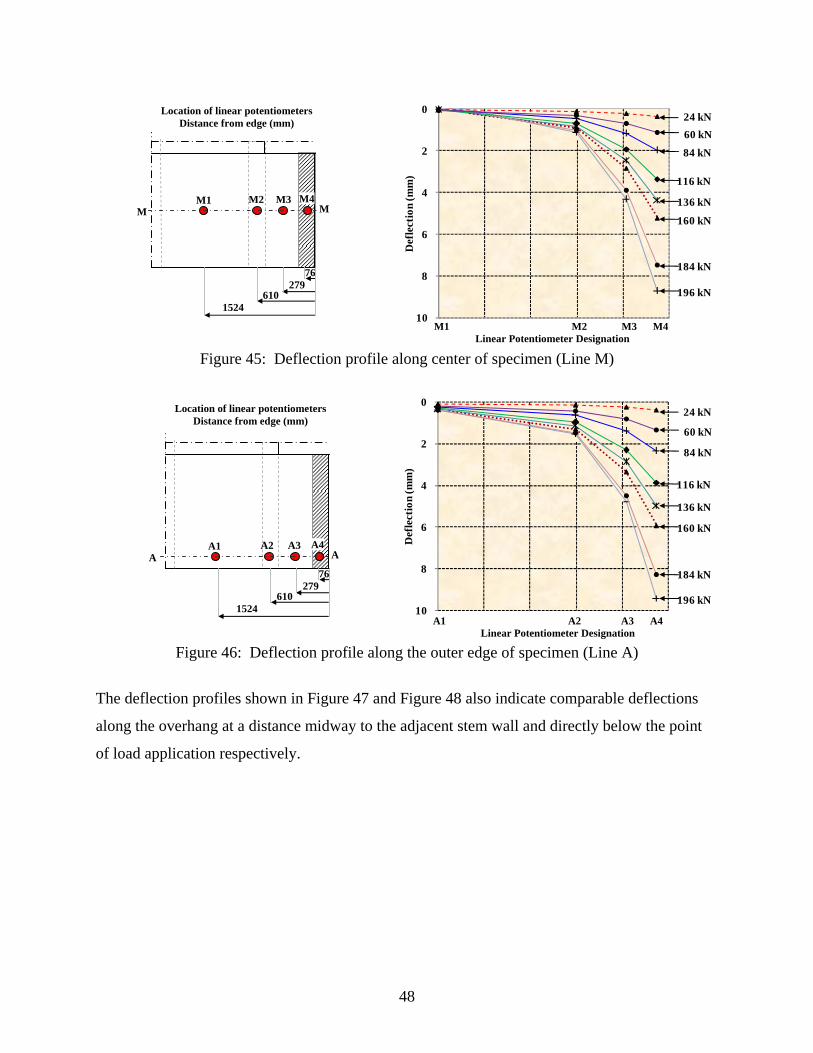

4000
Location of strain gages 3500 (See Figure for detailed schematic)
196 kN 3000
Stra
ins (
mic
rost
rain
s) 184 kN 9G 9F 9E 9D 9C 9B 160 kN9 9 2500
2000
1500
1000 60 kN
500 24 kN 0
136 kN 116 kN
84 kN
(Note Vertical gridlines in figure are -500 positioned at a spacing of 3048 mm (1 ft) 9G 9F 9E 9D 9C 9B Strain Gage Designation
Figure 49 Strain profile along the central edge of specimen (Line 9)
4000 196 kN
3500 184 kN (See Figure for detailed schematic)
Location of strain gages
3000 160 kN136 kN
Stra
ins (
mic
rost
rain
s)
2500
2000
1500
1000 60 kN 500 24 kN
0 (Note Vertical gridlines in figure are
-500 positioned at a spacing of 3048 mm (1 ft) 5G 5F 5E 5D 5C 5B 5A Strain Gage Designation
Figure 50 Strain profile along the middle of specimen (Line 5)
4000 Location of strain gages
(See Figure for detailed schematic) 3500 196 kN
116 kN
5G 5F 5E 5D 5C 5B 5A 5 84 kN 5
Stra
ins (
mic
rost
rain
s) 3000
2500
2000
1500
1000
1 500 24 kN
184 kN
160 kN136 kN 116 kN
84 kN
60 kN 1G 1F 1E 1D 1C 1B 1A 1
0(Note Vertical gridlines in figure are positioned at a spacing of 3048 mm (1 ft))
-500 1G 1F 1E 1D 1C 1B 1A
Strain Gage Designation
Figure 51 Strain profile along the outer edge of specimen (Line 1)
50
The strains drop off sharply for distances further away from the end of the overhang with the
majority of the strain gages on the opposite side of the stem wall (line C) exhibiting less than a
third of the strain values shown in line B The sharp drop in strain values at distances away from
the adjacent stem wall and the insignificant strains within these regions indicate that the
significantly shorter lengths of CFRP strips could be used to optimize material usage and
improve constructability without affecting load transfer and the overall system response
The strains along line B the location where the maximum strains occur in the specimen is shown
in Figure 52 This figure indicates that the distribution of strains was even along the specimen
until the load level of 116 kN (26 kip) per jack was reached At this level cracking was first
observed on the specimen and higher loading levels showed comparable but slightly less uniform
strains along the specimen The average strain along line B in the specimen at ultimate capacity
was 3423 microstrains whereas the minimum and maximum strains along line B were 2943
microstrains and 3846 microstrains respectively
4000
Location of strain gages 3500(See Figure for detailed schematic)
1B 3B 4B 5B 6B 7B 8B 9B Strain Gage Designation
Stra
ins (
mic
rost
rain
s) 3000 196 kN B 184 kN
160 kN 2500
1B
4B 3B
5B
9B 8B 7B 6B
B
136 kN 2000 116 kN
1500 84 kN
1000 60 kN
500
24 kN 0
(Note Vertical gridlines in figure are positioned at a spacing of 3048 mm (1 ft))
Figure 52 Strains along the edge of the stem wall adjacent to the deck slab overhang (Line B)
Using the strain data throughout the specimen and following a procedure described by Siem et al
[24] the shear stress between the concrete and the CFRP strips were calculated using the
following equation
51
9
(ε minus ε )sdot E sdot tn+1 n L Lτ nn+1 = (11)(x minus x )n+1 n
Where (x minus x )= distance between two strain gages EL= the tensile elastic modulus of then+1 n
CFRP strip and tL = thickness of the CFRP strips For these calculations EL= 1381 GPa (2005
Msi) and tL = 12 mm (0047 in) were used for the CFRP strips The calculated shear stress
values within the adhesive are simply the mean value between two strain gages which ignore
localized stress peaks and gradients
Distance from west edge (m) 27 24 21 18 15 12 09 06 03 00
Location of strain gages 20 (See Figure for detailed schematic)
15
196 kN
116 kN 160 kN
9B9G 9F 9E 9D 9C
(Note Vertical gridlines in figure are positioned at a spacing of 3048 mm (1 ft)
9
Stre
ss (M
Pa) 10
05
00
-05
-10
-15
-20
Figure 53 Calculated shear stress within adhesive along the central edge of specimen (Line 9)
Distance from west edge(m) 27 24 21 18 15 12 09 06 03 00
Location of strain gages (See Figure for detailed schematic) 20
196 kN
116 kN
160 kN
5 00
(Note Vertical gridlines in figure are positioned at a spacing of 3048 mm (1 ft)
3B5G 5F 5E 5A5D 5C
Stre
ss (M
Pa)
15
10
05
-05
-10
-15
-20
Figure 54 Calculated shear stress within adhesive along the middle of specimen (Line 5)
52
5
Distance from west edge(m) 27 24 21 18 15 12 09 06 03 00
Location of strain gages 20 (See Figure for detailed schematic)
196 kN
116 kN 160 kN
Stre
ss (M
Pa) 15
10
05
00
-05 3
(Note Vertical gridlines in figure are positioned at a spacing of 3048 mm (1 ft)
3B3G 3F 3E 3D 3C 3A 3
-10
-15
-20
Figure 55 Calculated shear stress within adhesive along an interior CFRP strip (Line 3)
Distance from west edge (m) 27 24 21 18 15 12 09 06 03 00
Location of strain gages 20 (See Figure for detailed schematic)
-20
196 kN
116 kN 160 kN
Stre
ss (M
Pa)
15
10
05
00
-05
-10
-15
1G 1F 1E 1D 1B1C 1A 11
(Note Vertical gridlines in figure are positioned at a spacing of 3048 mm (1 ft))
1G 1F 1E 1D 1C 1B 1A Strain Gage Designation
Figure 56 Calculated shear stress within adhesive along the outer edge of specimen (Line 1)
53
After the testing of the NSM CFRP rehabilitated specimen was completed the overhang of the
specimen was cut off and carefully removed from the rest of the test specimen as shown in
Figure 57 to allow for further examination of this critical region
432 mm (17 in)
Figure 57 Location of cut for removal of FRP rehabilitated overhang from test specimen
One point of interest to examine on the removed overhang was the actual location of the CFRP
strip reinforcement within the section Figure 58 shows that the actual embedment depth of the
near surface mounted CFRP strips was approximately 6 mm (025
in) and the actual thickness of the SikaDur 30 resin layer used to
bond the CFRP strips to the concrete was also approximately 6 mm
(025 mm) An embedment depth of 6 mm (025 in) is reasonable
for NSM applications because it allows enough space for an
adequate top surface of resin which will serve as environmental
protection and the wear surface for the deck However the 6 mm
(025 mm) thickness of the SikaDur 30 bottom resin layer exceeded
the maximum manufacturer recommended value of 3 mm (18
inch) While the current system performed very well the use of an
overly thick resin layer could have had an negative effect on the
overall structural response of the system Figure 58 Detail showing actual location of reinforcement
Figure 59 shows the failure surface of an FRP strip which has been detached from the top
surface of the deck The center portion of the strip with the firmly attached concrete was the
region in which the interfacial failure in the concrete occurred while the outer sections of the
strip were neatly detached from the resin system due to the method of removal of the strip
54
Figure 59 Detail of failure surface of FRP strip
58 Comparison with Theory
The NSM CFRP rehabilitated specimen reached ultimate capacity under an applied load of 196
kN (44 kip) per hydraulic jack which is equivalent to an applied moment of 1892 kN-m (1392
kip-ft) This improved performance corresponds to a 72 increase in ultimate capacity over the
as-built specimen which failed under an applied load of 114 kN (26 kip) corresponding to an
applied moment of 1100 kN-m (810 kip-ft) The ACI 440-02 calculation for externally bonded
FRP reinforcement predicted a maximum moment capacity of 1660 kN-m (1224 kip-ft) which
corresponds to a 51 increase in load carrying capacity over the experimentally determined
capacity of the as-built specimen The moment curvature analysis predicted a maximum moment
capacity of 1855 kN-m (1364 kip-ft) which corresponds to a 69 increase in load carrying
capacity over the as-built specimen The theoretical predictions and experimental results were
within 12 using the ACI 440 approach and were in close agreement with only a 2 error
using the moment curvature analysis The larger disagreement with experimental data found
from the ACI 440 moment capacity increase equation likely exists because this calculation is a
more simplified approach that does not take into account the over strength of the steel
reinforcement
55
3rd cracks observed
1st cracks observed
200
220
59 Comparison with As-Built
The ultimate capacity of the near surface mounted CFRP strip rehabilitated slab was reached at
an applied load of 196 kN (44 kips) equivalent to a uniform distributed load of 245 kNm (168
kipft) which is 11x the nominal soundwall load This ultimate capacity is 78 greater than that
obtained by the as-built specimen which occurred at 114 kN (26 kips) per hydraulic jack
equivalent to a uniform distributed load of 1425 kNm (98 kipft) which is 633x the nominal
wall load The center deflections under the loading beam for both specimens over the complete
loading ranges applied are compared in Figure 60(a) and Figure 60(b) At the failure load level
of the as-built specimen the as-built specimen had a center deflection under the loading beam of
636 mm (025 in) whereas the FRP rehabilitated specimen deflected approximately half that of
the as-built specimen or 333 mm (013 in) At ultimate capacity of the FRP rehabilitated
specimen the center deflection under the loading beam was 873 mm (034 in) which indicates
the rehabilitated specimen exhibited a 318 increase in deformation capacity over the as-built
specimen
10
0 2 4 6 8 10
Ultimate Capacity
1st cracks observed
2nd cracks observed
4th cracks observed
As-built test
3rd cracks observed
2nd cracks observed 1st cracks observed
Ultimate Capacity
Rehabilitated test
Def
lect
ion
(mm
)
6
5
4
360
240 120
0 0
Deflection (mm) Load per hydralulic jack (kN)
As-built specimenRehabilitated specimen
Ultimate Capacity
Ultimate Capacity
24 36 48 60 72 84 96 102 114 136 160 184 196
9
180
Load
per
hyd
raul
ic ja
ck (k
N) 8
160 7 140
120
100
80
a) Load versus deflection profiles (b) Comparison of linear potentiometers below loading beam
Figure 60 Comparisons of middle center deflections of the deck slab overhang
In addition to increasing the overall load and deformation capacity of the system the near
surface mounted CFRP strips act to increase the stiffness and improve the stability of the system
56
The load versus deflection profile shown in Figure 60(a) shows the significantly increased
stiffness and more linear profile for the FRP rehabilitated specimen over the as-built specimen
The deflection profile comparison at the 114 kN (26 kips) per jack load level along the middle of
the two slabs is shown in Figure 61 This figure illustrates that for the same load level the
deflections within the FRP rehabilitated specimen are lower than the deflections of the as-built
specimen throughout the deck slab and not just at the point of load application
Location of linear potentiometers 0 Distance from edge (mm)
279 610
1524
76
M1 M2 M3 M4
2
4
M M
6
8
10
FRP rehabilited specimen at 114 kN per jack
As-built specimen at 114 kN per jack
M1 M2 M3 M4 Linear Potentiometer Designation
Figure 61 Comparison of deflection profiles along center of specimens (Line M)
The first set cracking observed on the as-built specimen occurred at the load level of 84 kN (19
kip) whereas the first set cracking observed on the FRP rehabilitated specimen occurred at 116
kN (26 kip) which is corresponds to a 38 greater load A comparison of the deflection profiles
along the center of the specimens at these loading levels shown in Figure 62 reveals nearly
identical deformations for the two specimens
57
10
10
M1
1524
279 610
76
M2 M3 M4
Location of linear potentiometers Distance from edge (mm)
FRP rehabilited specimen at 1st observed cracking
(116 kN per jack)
0
2 As-built specimen
at 1st observed cracking (84 kN per jack) 4
M
Def
lect
ion
(mm
)
M
6
8
M1 M2 M3 M4 Linear Potentiometer Designation
Figure 62 Comparison of center deflection profiles at 1st observed cracking loads (Line M)
The second set of cracking observed on the as-built specimen occurred at the load level of 101
kN (23 kip) whereas the second set of cracking observed on the FRP rehabilitated specimen
occurred at 136 kN (31 kip) which is corresponds to a 35 greater load The deflection profile
comparison at the load levels where the second set of cracking was observed in Figure 64 also
exhibits nearly identical deformations for the two specimens This indicates that while the FRP
reinforcement acts to stiffen the system and increase the load carrying capacity of the overhang
region the shape of the deflection response profile of the system is not modified significantly
with the addition of the CFRP strips
0FRP rehabilited specimen at 2nd observed cracking
(136 kN per jack)
As-built specimen at 2nd observed cracking
(101 kN per jack)
Location of linear potentiometers Distance from edge (mm)
279 610
1524
76
M M1 M2 M3 M4
2
4
Def
lect
ion
(mm
)
M
6
8
M1 M2 M3 M4 Linear Potentiometer Designation
Figure 63 Comparison of center deflection profiles at 2nd observed cracking loads (Line M)
58
Figure 64 shows the side by side top decks of the two specimens after testing has been completed
and all loose concrete on the top deck removed Details of the critical region of the as-built and
FRP rehabilitated top deck are shown in Figure 65 and Figure 66 respectively
Figure 64 Top view of deck slab tested to ultimate capacity after removal of loose concrete
59
For the as-built specimen extensive damage and spalling of the concrete on the top of the deck
slab was seen Yielding in the transverse steel reinforcement followed by loss of aggregate
interlock resulting in failure was observed
Figure 65 Detail of cracking observed at ultimate capacity- top view of as-built deck
For the FRP rehabilitated specimen negligible spalled concrete and loose concrete rubble was
detected A concrete splitting failure mode was observed in the FRP rehabilitated specimen
Figure 66 Detail of cracking observed at ultimate capacity- top view of FRP rehabilitated deck
60
6 SUMMARY OF RESULTS AND RECOMMENDATIONS FOR FUTURE RESEARCH
Experimental results from the testing of the rehabilitated specimen indicate that the NSMR
strengthening scheme was successful at achieving the desired load carrying capacity increase
The ultimate load carrying capacity of the FRP rehabilitated specimen was 196 kN (44 kips) per
hydraulic jack which was 78 higher that the ultimate load of the as- built specimen of 114 kN
(26 kips) per hydraulic jack This value well exceeded the desired load capacity increase of
297 above the experimentally determined capacity of the as-built specimen exhibited a very
stable structural response and increased the deformation capacity of the system The theoretical
moment capacity predictions for the as-built specimen were within 11 and 65 of the
experimentally determined value using ACI 318 and moment curvature analysis respectively
The theoretical moment capacity predictions for the FRP rehabilitated specimen were within
12 of the experimental value using the modified ACI 440-02 approach and were within 2
using moment curvature analysis
The NSM FRP rehabilitated specimen exhibits a variety of structural performance improvements
over the as-built specimen including increased ultimate load carrying capacity enhanced
deformation capacity and more stable overall structural performance Design options for the
near surface mounted CFRP strengthening schemes allow for great flexibility in terms of
tailoring the reinforcement parameters for specific applications With consideration of the
minimal disruption to traffic flow and ease of installation this system is a viable and very
attractive rehabilitation option for bridge deck slab overhangs
The purpose of Phase 1 was to conduct an experimental analysis of the use of NSM for purposes
of strengthening and to provide the basis for the planning of Phase 2 as detailed in the initial
proposal submitted to Caltrans Based on the extensive literature review already conducted
(although according to the project funding provided by Caltrans is to be completed and reported
on in Phase 2) and on the experimental results the following aspects are recommended for further
study in Phase 2
61
bull Complete review of the failure modes and mechanisms seen with use of barsrods as
compared to flat strips for purposes of documenting advantages of strips It is noted that
a very brief summary is given in the introductory portion of this report
bull Optimization of groove dimensions and spacing for NSM use through both analytical and
experimental study
bull Study of adhesive rheology and bond quality as well as durability
bull Study of minimum development length and effect of insertion into girder stems
bull Study of use for specific strengthening applications
bull Development of design guide for Caltrans and development of example comparing NSM
use to surface bonding
It is emphasized that the studies should be conducted on specimens of sufficient size since small
scale tests are likely to provide erroneous results due to effects of scale and configuration It is
recommended that these tests only be conducted after a review of advances in Europe and
Australia are completed and sufficient analytical work is completed on optimization of grove
dimensions and spacing Since the efficacy of the method is intrinsically related to the ability of
the adhesive to not only bond the reinforcement to the concrete substrate but to also enable
efficient stress transfer study also needs to be conducted on adhesive rheology performance
characteristics and cure It is recommended that this be based on the completed durability study
which should provide a base-line for further study Also since it is likely that the NSM will be
covered by asphalt the effect of heat due to asphalt on the adhesive and bond should also be
studied
62
7 REFERENCES
[1] VM Karbhari and L Zhao ldquoUse of composites for 21st century civil infrastructurerdquo
Computer Method Appl Mech Eng 185 pp 433ndash454 (2000)
[2] S Rizkalla T Hassan N Hassan ldquoDesign recommendations for the use of FRP for
strengthening of concrete structuresrdquo Prog Struct Engng Mater 5 pp 16ndash28 (2003)
[3] K K Ghosh ldquoAssessment of FRP composite strengthened reinforced concrete bridge
structures at the component and systems level through progressive damage and nonshy
destructive evaluation (NDE) [PhD dissertation] University of California San Diego
(2006)
[4] L De Lorenzis JG Teng ldquoNear-surface mounted FRP reinforcement An emerging
technique for strengthening structuresrdquo Composites Part B 38 pp 119-143 (2007)
[5] R Parretti A Nanni ldquoStrengthening of RC Members Using Near-Surface Mounted FRP
Composites Design Overviewrdquo Advances in Structural Engineering 7 5 pp 1-16 (2004)
[6] J R Yost S P Gross D W Dinehart and J J Mildenberg ldquoFlexural Behavior of
Concrete Beams Strengthened with Near-Surface-Mounted CFRP Stripsrdquo ACI Structural
Journal July-August pp 430-437(2007)
[7] L A DeLorenzis A Nanni and A L Tegila ldquoFlexural and Shear Strengthening of
Reinforced Concrete Structures with Near Surface Mounted FRP Barsrdquo Proceedings of the
3rd International Conference on Advanced Composite Materials in Bridges and Structures
Ottawa Canada Aug 15-18 pp 521-528 (2000)
[8] El-Hacha R and Rizkalla S 2004 ldquoNear-Surface-Mounted Fiber- Reinforced Polymer
Reinforcements for Flexural Strengthening of Concrete Structuresrdquo ACI Structural Journal
V 101 V 5 Sept-Oct pp 717-726
[9] R Parretti and A Nanni ldquoStrengthening of RC Members Using Near-Surface Mounted
FRP Composites Design Overviewrdquo Advances in Structural Engineering V 7 (5) (2004)
63
[10] E Bonaldo J A Oliveira de Barros and P B Lourenccedilo ldquoEfficient Strengthening
Technique to Increase the Flexural Resistance of Existing RC Slabsrdquo ASCE Journal of
Composites for Construction MarchApril pp149-159 (2008)
[11] The Concrete Society Design Guidance for Strengthening Concrete Structures using Fibre
Composite Materials Concrete Society Technical Report 55 2nd Edition (2004)
[12] ACI Committee 440 Guide for the Design and Construction of Externally Bonded FRP
Systems for Strengthening Concrete Structures ACI 4402 R-02 (2002)
[13] Canadian Standards Association Canadian Highway Bridge Design Code- Section 16
Fibre-Reinforced Structures (2006)
[14] AASHTO LRFD bridge design specifications 3rd Ed AASHTO Washington DC
(2004)
[15] A B Pridmore V M Karbhari ldquoEvaluation of Prefabricated FRP Structural Formwork
Bridge Deck Systemsrdquo SAMPE 53rd International Technical Conference (2008)
[16] Caltrans ldquoMemo to Designers 22-1 Soundwall Design Criteriardquo (2004)
[17] ACI 318-08 Building Code Requirements for Structural Concrete (2008)
[18] Caltrans Bridge Design Specifications Section 8- Reinforced Concrete (2003)
[19] Bentz E and Collins M P lsquolsquoRESPONSE-2000mdashReinforced Concrete Section al Analysis
using the Modified Compression Field Theoryrdquo Version 105 Toronto Canada (2000)
[20] Caltrans ldquoMemo to Designers 22-1 Soundwall Design Criteriardquo (2004)
[21] Sika Corporation Product Data Sheet for Sika CarboDur Rods- carbon fiber rods for
structural strengthening Edition 9 (2003)
[22] Sika Corporation Product Data Sheet for Sika CarboDur- Carbon fiber laminate for
structural strengthening Edition 722 (2005)
[23] Hughes Brothers Inc Product data sheet for Aslan 500- CFRP tape wwwhughesbroscom
(2002)
64
[24] W Seim Y Vasquez VM Karbhari and F Seible ldquoPost-Strengthening of Concrete
Slabs Full Scale Testing and Design Recommendationrdquo ASCE Journal of Structural
Engineering 129[6] pp 743-752 (2003)
[25] W Seim M Hormann VM Karbhari and F Seible External FRP Poststrengthening of
Scaled Concrete Slabs ASCE Journal of Composites in Construction 5[2] pp 67-75
(2001)
[26] Sika Europe- German Institute of Construction Technology 1998
[27] International Concrete Repair Institute ICRI Guideline No 037324 ldquoSelecting and
Specifying Concrete Surface Preparation for Sealers Coatings and Polymer Overlaysrdquo
(1997)
[28] S J Jin ldquoStatistical Characterization of Prefabricated FRP Composite Materials for
Rehabilitation of Concrete Structuresrdquo Master Thesis Department of Structural
Engineering University of California San Diego (2008)
[29] Sika Corporation ldquoCarboDur Installation Guiderdquo Sika construction documents
65

9
(ε minus ε )sdot E sdot tn+1 n L Lτ nn+1 = (11)(x minus x )n+1 n
Where (x minus x )= distance between two strain gages EL= the tensile elastic modulus of then+1 n
CFRP strip and tL = thickness of the CFRP strips For these calculations EL= 1381 GPa (2005
Msi) and tL = 12 mm (0047 in) were used for the CFRP strips The calculated shear stress
values within the adhesive are simply the mean value between two strain gages which ignore
localized stress peaks and gradients
Distance from west edge (m) 27 24 21 18 15 12 09 06 03 00
Location of strain gages 20 (See Figure for detailed schematic)
15
196 kN
116 kN 160 kN
9B9G 9F 9E 9D 9C
(Note Vertical gridlines in figure are positioned at a spacing of 3048 mm (1 ft)
9
Stre
ss (M
Pa) 10
05
00
-05
-10
-15
-20
Figure 53 Calculated shear stress within adhesive along the central edge of specimen (Line 9)
Distance from west edge(m) 27 24 21 18 15 12 09 06 03 00
Location of strain gages (See Figure for detailed schematic) 20
196 kN
116 kN
160 kN
5 00
(Note Vertical gridlines in figure are positioned at a spacing of 3048 mm (1 ft)
3B5G 5F 5E 5A5D 5C
Stre
ss (M
Pa)
15
10
05
-05
-10
-15
-20
Figure 54 Calculated shear stress within adhesive along the middle of specimen (Line 5)
52
5
Distance from west edge(m) 27 24 21 18 15 12 09 06 03 00
Location of strain gages 20 (See Figure for detailed schematic)
196 kN
116 kN 160 kN
Stre
ss (M
Pa) 15
10
05
00
-05 3
(Note Vertical gridlines in figure are positioned at a spacing of 3048 mm (1 ft)
3B3G 3F 3E 3D 3C 3A 3
-10
-15
-20
Figure 55 Calculated shear stress within adhesive along an interior CFRP strip (Line 3)
Distance from west edge (m) 27 24 21 18 15 12 09 06 03 00
Location of strain gages 20 (See Figure for detailed schematic)
-20
196 kN
116 kN 160 kN
Stre
ss (M
Pa)
15
10
05
00
-05
-10
-15
1G 1F 1E 1D 1B1C 1A 11
(Note Vertical gridlines in figure are positioned at a spacing of 3048 mm (1 ft))
1G 1F 1E 1D 1C 1B 1A Strain Gage Designation
Figure 56 Calculated shear stress within adhesive along the outer edge of specimen (Line 1)
53
After the testing of the NSM CFRP rehabilitated specimen was completed the overhang of the
specimen was cut off and carefully removed from the rest of the test specimen as shown in
Figure 57 to allow for further examination of this critical region
432 mm (17 in)
Figure 57 Location of cut for removal of FRP rehabilitated overhang from test specimen
One point of interest to examine on the removed overhang was the actual location of the CFRP
strip reinforcement within the section Figure 58 shows that the actual embedment depth of the
near surface mounted CFRP strips was approximately 6 mm (025
in) and the actual thickness of the SikaDur 30 resin layer used to
bond the CFRP strips to the concrete was also approximately 6 mm
(025 mm) An embedment depth of 6 mm (025 in) is reasonable
for NSM applications because it allows enough space for an
adequate top surface of resin which will serve as environmental
protection and the wear surface for the deck However the 6 mm
(025 mm) thickness of the SikaDur 30 bottom resin layer exceeded
the maximum manufacturer recommended value of 3 mm (18
inch) While the current system performed very well the use of an
overly thick resin layer could have had an negative effect on the
overall structural response of the system Figure 58 Detail showing actual location of reinforcement
Figure 59 shows the failure surface of an FRP strip which has been detached from the top
surface of the deck The center portion of the strip with the firmly attached concrete was the
region in which the interfacial failure in the concrete occurred while the outer sections of the
strip were neatly detached from the resin system due to the method of removal of the strip
54
Figure 59 Detail of failure surface of FRP strip
58 Comparison with Theory
The NSM CFRP rehabilitated specimen reached ultimate capacity under an applied load of 196
kN (44 kip) per hydraulic jack which is equivalent to an applied moment of 1892 kN-m (1392
kip-ft) This improved performance corresponds to a 72 increase in ultimate capacity over the
as-built specimen which failed under an applied load of 114 kN (26 kip) corresponding to an
applied moment of 1100 kN-m (810 kip-ft) The ACI 440-02 calculation for externally bonded
FRP reinforcement predicted a maximum moment capacity of 1660 kN-m (1224 kip-ft) which
corresponds to a 51 increase in load carrying capacity over the experimentally determined
capacity of the as-built specimen The moment curvature analysis predicted a maximum moment
capacity of 1855 kN-m (1364 kip-ft) which corresponds to a 69 increase in load carrying
capacity over the as-built specimen The theoretical predictions and experimental results were
within 12 using the ACI 440 approach and were in close agreement with only a 2 error
using the moment curvature analysis The larger disagreement with experimental data found
from the ACI 440 moment capacity increase equation likely exists because this calculation is a
more simplified approach that does not take into account the over strength of the steel
reinforcement
55
3rd cracks observed
1st cracks observed
200
220
59 Comparison with As-Built
The ultimate capacity of the near surface mounted CFRP strip rehabilitated slab was reached at
an applied load of 196 kN (44 kips) equivalent to a uniform distributed load of 245 kNm (168
kipft) which is 11x the nominal soundwall load This ultimate capacity is 78 greater than that
obtained by the as-built specimen which occurred at 114 kN (26 kips) per hydraulic jack
equivalent to a uniform distributed load of 1425 kNm (98 kipft) which is 633x the nominal
wall load The center deflections under the loading beam for both specimens over the complete
loading ranges applied are compared in Figure 60(a) and Figure 60(b) At the failure load level
of the as-built specimen the as-built specimen had a center deflection under the loading beam of
636 mm (025 in) whereas the FRP rehabilitated specimen deflected approximately half that of
the as-built specimen or 333 mm (013 in) At ultimate capacity of the FRP rehabilitated
specimen the center deflection under the loading beam was 873 mm (034 in) which indicates
the rehabilitated specimen exhibited a 318 increase in deformation capacity over the as-built
specimen
10
0 2 4 6 8 10
Ultimate Capacity
1st cracks observed
2nd cracks observed
4th cracks observed
As-built test
3rd cracks observed
2nd cracks observed 1st cracks observed
Ultimate Capacity
Rehabilitated test
Def
lect
ion
(mm
)
6
5
4
360
240 120
0 0
Deflection (mm) Load per hydralulic jack (kN)
As-built specimenRehabilitated specimen
Ultimate Capacity
Ultimate Capacity
24 36 48 60 72 84 96 102 114 136 160 184 196
9
180
Load
per
hyd
raul
ic ja
ck (k
N) 8
160 7 140
120
100
80
a) Load versus deflection profiles (b) Comparison of linear potentiometers below loading beam
Figure 60 Comparisons of middle center deflections of the deck slab overhang
In addition to increasing the overall load and deformation capacity of the system the near
surface mounted CFRP strips act to increase the stiffness and improve the stability of the system
56
The load versus deflection profile shown in Figure 60(a) shows the significantly increased
stiffness and more linear profile for the FRP rehabilitated specimen over the as-built specimen
The deflection profile comparison at the 114 kN (26 kips) per jack load level along the middle of
the two slabs is shown in Figure 61 This figure illustrates that for the same load level the
deflections within the FRP rehabilitated specimen are lower than the deflections of the as-built
specimen throughout the deck slab and not just at the point of load application
Location of linear potentiometers 0 Distance from edge (mm)
279 610
1524
76
M1 M2 M3 M4
2
4
M M
6
8
10
FRP rehabilited specimen at 114 kN per jack
As-built specimen at 114 kN per jack
M1 M2 M3 M4 Linear Potentiometer Designation
Figure 61 Comparison of deflection profiles along center of specimens (Line M)
The first set cracking observed on the as-built specimen occurred at the load level of 84 kN (19
kip) whereas the first set cracking observed on the FRP rehabilitated specimen occurred at 116
kN (26 kip) which is corresponds to a 38 greater load A comparison of the deflection profiles
along the center of the specimens at these loading levels shown in Figure 62 reveals nearly
identical deformations for the two specimens
57
10
10
M1
1524
279 610
76
M2 M3 M4
Location of linear potentiometers Distance from edge (mm)
FRP rehabilited specimen at 1st observed cracking
(116 kN per jack)
0
2 As-built specimen
at 1st observed cracking (84 kN per jack) 4
M
Def
lect
ion
(mm
)
M
6
8
M1 M2 M3 M4 Linear Potentiometer Designation
Figure 62 Comparison of center deflection profiles at 1st observed cracking loads (Line M)
The second set of cracking observed on the as-built specimen occurred at the load level of 101
kN (23 kip) whereas the second set of cracking observed on the FRP rehabilitated specimen
occurred at 136 kN (31 kip) which is corresponds to a 35 greater load The deflection profile
comparison at the load levels where the second set of cracking was observed in Figure 64 also
exhibits nearly identical deformations for the two specimens This indicates that while the FRP
reinforcement acts to stiffen the system and increase the load carrying capacity of the overhang
region the shape of the deflection response profile of the system is not modified significantly
with the addition of the CFRP strips
0FRP rehabilited specimen at 2nd observed cracking
(136 kN per jack)
As-built specimen at 2nd observed cracking
(101 kN per jack)
Location of linear potentiometers Distance from edge (mm)
279 610
1524
76
M M1 M2 M3 M4
2
4
Def
lect
ion
(mm
)
M
6
8
M1 M2 M3 M4 Linear Potentiometer Designation
Figure 63 Comparison of center deflection profiles at 2nd observed cracking loads (Line M)
58
Figure 64 shows the side by side top decks of the two specimens after testing has been completed
and all loose concrete on the top deck removed Details of the critical region of the as-built and
FRP rehabilitated top deck are shown in Figure 65 and Figure 66 respectively
Figure 64 Top view of deck slab tested to ultimate capacity after removal of loose concrete
59
For the as-built specimen extensive damage and spalling of the concrete on the top of the deck
slab was seen Yielding in the transverse steel reinforcement followed by loss of aggregate
interlock resulting in failure was observed
Figure 65 Detail of cracking observed at ultimate capacity- top view of as-built deck
For the FRP rehabilitated specimen negligible spalled concrete and loose concrete rubble was
detected A concrete splitting failure mode was observed in the FRP rehabilitated specimen
Figure 66 Detail of cracking observed at ultimate capacity- top view of FRP rehabilitated deck
60
6 SUMMARY OF RESULTS AND RECOMMENDATIONS FOR FUTURE RESEARCH
Experimental results from the testing of the rehabilitated specimen indicate that the NSMR
strengthening scheme was successful at achieving the desired load carrying capacity increase
The ultimate load carrying capacity of the FRP rehabilitated specimen was 196 kN (44 kips) per
hydraulic jack which was 78 higher that the ultimate load of the as- built specimen of 114 kN
(26 kips) per hydraulic jack This value well exceeded the desired load capacity increase of
297 above the experimentally determined capacity of the as-built specimen exhibited a very
stable structural response and increased the deformation capacity of the system The theoretical
moment capacity predictions for the as-built specimen were within 11 and 65 of the
experimentally determined value using ACI 318 and moment curvature analysis respectively
The theoretical moment capacity predictions for the FRP rehabilitated specimen were within
12 of the experimental value using the modified ACI 440-02 approach and were within 2
using moment curvature analysis
The NSM FRP rehabilitated specimen exhibits a variety of structural performance improvements
over the as-built specimen including increased ultimate load carrying capacity enhanced
deformation capacity and more stable overall structural performance Design options for the
near surface mounted CFRP strengthening schemes allow for great flexibility in terms of
tailoring the reinforcement parameters for specific applications With consideration of the
minimal disruption to traffic flow and ease of installation this system is a viable and very
attractive rehabilitation option for bridge deck slab overhangs
The purpose of Phase 1 was to conduct an experimental analysis of the use of NSM for purposes
of strengthening and to provide the basis for the planning of Phase 2 as detailed in the initial
proposal submitted to Caltrans Based on the extensive literature review already conducted
(although according to the project funding provided by Caltrans is to be completed and reported
on in Phase 2) and on the experimental results the following aspects are recommended for further
study in Phase 2
61
bull Complete review of the failure modes and mechanisms seen with use of barsrods as
compared to flat strips for purposes of documenting advantages of strips It is noted that
a very brief summary is given in the introductory portion of this report
bull Optimization of groove dimensions and spacing for NSM use through both analytical and
experimental study
bull Study of adhesive rheology and bond quality as well as durability
bull Study of minimum development length and effect of insertion into girder stems
bull Study of use for specific strengthening applications
bull Development of design guide for Caltrans and development of example comparing NSM
use to surface bonding
It is emphasized that the studies should be conducted on specimens of sufficient size since small
scale tests are likely to provide erroneous results due to effects of scale and configuration It is
recommended that these tests only be conducted after a review of advances in Europe and
Australia are completed and sufficient analytical work is completed on optimization of grove
dimensions and spacing Since the efficacy of the method is intrinsically related to the ability of
the adhesive to not only bond the reinforcement to the concrete substrate but to also enable
efficient stress transfer study also needs to be conducted on adhesive rheology performance
characteristics and cure It is recommended that this be based on the completed durability study
which should provide a base-line for further study Also since it is likely that the NSM will be
covered by asphalt the effect of heat due to asphalt on the adhesive and bond should also be
studied
62
7 REFERENCES
[1] VM Karbhari and L Zhao ldquoUse of composites for 21st century civil infrastructurerdquo
Computer Method Appl Mech Eng 185 pp 433ndash454 (2000)
[2] S Rizkalla T Hassan N Hassan ldquoDesign recommendations for the use of FRP for
strengthening of concrete structuresrdquo Prog Struct Engng Mater 5 pp 16ndash28 (2003)
[3] K K Ghosh ldquoAssessment of FRP composite strengthened reinforced concrete bridge
structures at the component and systems level through progressive damage and nonshy
destructive evaluation (NDE) [PhD dissertation] University of California San Diego
(2006)
[4] L De Lorenzis JG Teng ldquoNear-surface mounted FRP reinforcement An emerging
technique for strengthening structuresrdquo Composites Part B 38 pp 119-143 (2007)
[5] R Parretti A Nanni ldquoStrengthening of RC Members Using Near-Surface Mounted FRP
Composites Design Overviewrdquo Advances in Structural Engineering 7 5 pp 1-16 (2004)
[6] J R Yost S P Gross D W Dinehart and J J Mildenberg ldquoFlexural Behavior of
Concrete Beams Strengthened with Near-Surface-Mounted CFRP Stripsrdquo ACI Structural
Journal July-August pp 430-437(2007)
[7] L A DeLorenzis A Nanni and A L Tegila ldquoFlexural and Shear Strengthening of
Reinforced Concrete Structures with Near Surface Mounted FRP Barsrdquo Proceedings of the
3rd International Conference on Advanced Composite Materials in Bridges and Structures
Ottawa Canada Aug 15-18 pp 521-528 (2000)
[8] El-Hacha R and Rizkalla S 2004 ldquoNear-Surface-Mounted Fiber- Reinforced Polymer
Reinforcements for Flexural Strengthening of Concrete Structuresrdquo ACI Structural Journal
V 101 V 5 Sept-Oct pp 717-726
[9] R Parretti and A Nanni ldquoStrengthening of RC Members Using Near-Surface Mounted
FRP Composites Design Overviewrdquo Advances in Structural Engineering V 7 (5) (2004)
63
[10] E Bonaldo J A Oliveira de Barros and P B Lourenccedilo ldquoEfficient Strengthening
Technique to Increase the Flexural Resistance of Existing RC Slabsrdquo ASCE Journal of
Composites for Construction MarchApril pp149-159 (2008)
[11] The Concrete Society Design Guidance for Strengthening Concrete Structures using Fibre
Composite Materials Concrete Society Technical Report 55 2nd Edition (2004)
[12] ACI Committee 440 Guide for the Design and Construction of Externally Bonded FRP
Systems for Strengthening Concrete Structures ACI 4402 R-02 (2002)
[13] Canadian Standards Association Canadian Highway Bridge Design Code- Section 16
Fibre-Reinforced Structures (2006)
[14] AASHTO LRFD bridge design specifications 3rd Ed AASHTO Washington DC
(2004)
[15] A B Pridmore V M Karbhari ldquoEvaluation of Prefabricated FRP Structural Formwork
Bridge Deck Systemsrdquo SAMPE 53rd International Technical Conference (2008)
[16] Caltrans ldquoMemo to Designers 22-1 Soundwall Design Criteriardquo (2004)
[17] ACI 318-08 Building Code Requirements for Structural Concrete (2008)
[18] Caltrans Bridge Design Specifications Section 8- Reinforced Concrete (2003)
[19] Bentz E and Collins M P lsquolsquoRESPONSE-2000mdashReinforced Concrete Section al Analysis
using the Modified Compression Field Theoryrdquo Version 105 Toronto Canada (2000)
[20] Caltrans ldquoMemo to Designers 22-1 Soundwall Design Criteriardquo (2004)
[21] Sika Corporation Product Data Sheet for Sika CarboDur Rods- carbon fiber rods for
structural strengthening Edition 9 (2003)
[22] Sika Corporation Product Data Sheet for Sika CarboDur- Carbon fiber laminate for
structural strengthening Edition 722 (2005)
[23] Hughes Brothers Inc Product data sheet for Aslan 500- CFRP tape wwwhughesbroscom
(2002)
64
[24] W Seim Y Vasquez VM Karbhari and F Seible ldquoPost-Strengthening of Concrete
Slabs Full Scale Testing and Design Recommendationrdquo ASCE Journal of Structural
Engineering 129[6] pp 743-752 (2003)
[25] W Seim M Hormann VM Karbhari and F Seible External FRP Poststrengthening of
Scaled Concrete Slabs ASCE Journal of Composites in Construction 5[2] pp 67-75
(2001)
[26] Sika Europe- German Institute of Construction Technology 1998
[27] International Concrete Repair Institute ICRI Guideline No 037324 ldquoSelecting and
Specifying Concrete Surface Preparation for Sealers Coatings and Polymer Overlaysrdquo
(1997)
[28] S J Jin ldquoStatistical Characterization of Prefabricated FRP Composite Materials for
Rehabilitation of Concrete Structuresrdquo Master Thesis Department of Structural
Engineering University of California San Diego (2008)
[29] Sika Corporation ldquoCarboDur Installation Guiderdquo Sika construction documents
65

3rd cracks observed
1st cracks observed
200
220
59 Comparison with As-Built
The ultimate capacity of the near surface mounted CFRP strip rehabilitated slab was reached at
an applied load of 196 kN (44 kips) equivalent to a uniform distributed load of 245 kNm (168
kipft) which is 11x the nominal soundwall load This ultimate capacity is 78 greater than that
obtained by the as-built specimen which occurred at 114 kN (26 kips) per hydraulic jack
equivalent to a uniform distributed load of 1425 kNm (98 kipft) which is 633x the nominal
wall load The center deflections under the loading beam for both specimens over the complete
loading ranges applied are compared in Figure 60(a) and Figure 60(b) At the failure load level
of the as-built specimen the as-built specimen had a center deflection under the loading beam of
636 mm (025 in) whereas the FRP rehabilitated specimen deflected approximately half that of
the as-built specimen or 333 mm (013 in) At ultimate capacity of the FRP rehabilitated
specimen the center deflection under the loading beam was 873 mm (034 in) which indicates
the rehabilitated specimen exhibited a 318 increase in deformation capacity over the as-built
specimen
10
0 2 4 6 8 10
Ultimate Capacity
1st cracks observed
2nd cracks observed
4th cracks observed
As-built test
3rd cracks observed
2nd cracks observed 1st cracks observed
Ultimate Capacity
Rehabilitated test
Def
lect
ion
(mm
)
6
5
4
360
240 120
0 0
Deflection (mm) Load per hydralulic jack (kN)
As-built specimenRehabilitated specimen
Ultimate Capacity
Ultimate Capacity
24 36 48 60 72 84 96 102 114 136 160 184 196
9
180
Load
per
hyd
raul
ic ja
ck (k
N) 8
160 7 140
120
100
80
a) Load versus deflection profiles (b) Comparison of linear potentiometers below loading beam
Figure 60 Comparisons of middle center deflections of the deck slab overhang
In addition to increasing the overall load and deformation capacity of the system the near
surface mounted CFRP strips act to increase the stiffness and improve the stability of the system
56
The load versus deflection profile shown in Figure 60(a) shows the significantly increased
stiffness and more linear profile for the FRP rehabilitated specimen over the as-built specimen
The deflection profile comparison at the 114 kN (26 kips) per jack load level along the middle of
the two slabs is shown in Figure 61 This figure illustrates that for the same load level the
deflections within the FRP rehabilitated specimen are lower than the deflections of the as-built
specimen throughout the deck slab and not just at the point of load application
Location of linear potentiometers 0 Distance from edge (mm)
279 610
1524
76
M1 M2 M3 M4
2
4
M M
6
8
10
FRP rehabilited specimen at 114 kN per jack
As-built specimen at 114 kN per jack
M1 M2 M3 M4 Linear Potentiometer Designation
Figure 61 Comparison of deflection profiles along center of specimens (Line M)
The first set cracking observed on the as-built specimen occurred at the load level of 84 kN (19
kip) whereas the first set cracking observed on the FRP rehabilitated specimen occurred at 116
kN (26 kip) which is corresponds to a 38 greater load A comparison of the deflection profiles
along the center of the specimens at these loading levels shown in Figure 62 reveals nearly
identical deformations for the two specimens
57
10
10
M1
1524
279 610
76
M2 M3 M4
Location of linear potentiometers Distance from edge (mm)
FRP rehabilited specimen at 1st observed cracking
(116 kN per jack)
0
2 As-built specimen
at 1st observed cracking (84 kN per jack) 4
M
Def
lect
ion
(mm
)
M
6
8
M1 M2 M3 M4 Linear Potentiometer Designation
Figure 62 Comparison of center deflection profiles at 1st observed cracking loads (Line M)
The second set of cracking observed on the as-built specimen occurred at the load level of 101
kN (23 kip) whereas the second set of cracking observed on the FRP rehabilitated specimen
occurred at 136 kN (31 kip) which is corresponds to a 35 greater load The deflection profile
comparison at the load levels where the second set of cracking was observed in Figure 64 also
exhibits nearly identical deformations for the two specimens This indicates that while the FRP
reinforcement acts to stiffen the system and increase the load carrying capacity of the overhang
region the shape of the deflection response profile of the system is not modified significantly
with the addition of the CFRP strips
0FRP rehabilited specimen at 2nd observed cracking
(136 kN per jack)
As-built specimen at 2nd observed cracking
(101 kN per jack)
Location of linear potentiometers Distance from edge (mm)
279 610
1524
76
M M1 M2 M3 M4
2
4
Def
lect
ion
(mm
)
M
6
8
M1 M2 M3 M4 Linear Potentiometer Designation
Figure 63 Comparison of center deflection profiles at 2nd observed cracking loads (Line M)
58
Figure 64 shows the side by side top decks of the two specimens after testing has been completed
and all loose concrete on the top deck removed Details of the critical region of the as-built and
FRP rehabilitated top deck are shown in Figure 65 and Figure 66 respectively
Figure 64 Top view of deck slab tested to ultimate capacity after removal of loose concrete
59
For the as-built specimen extensive damage and spalling of the concrete on the top of the deck
slab was seen Yielding in the transverse steel reinforcement followed by loss of aggregate
interlock resulting in failure was observed
Figure 65 Detail of cracking observed at ultimate capacity- top view of as-built deck
For the FRP rehabilitated specimen negligible spalled concrete and loose concrete rubble was
detected A concrete splitting failure mode was observed in the FRP rehabilitated specimen
Figure 66 Detail of cracking observed at ultimate capacity- top view of FRP rehabilitated deck
60
6 SUMMARY OF RESULTS AND RECOMMENDATIONS FOR FUTURE RESEARCH
Experimental results from the testing of the rehabilitated specimen indicate that the NSMR
strengthening scheme was successful at achieving the desired load carrying capacity increase
The ultimate load carrying capacity of the FRP rehabilitated specimen was 196 kN (44 kips) per
hydraulic jack which was 78 higher that the ultimate load of the as- built specimen of 114 kN
(26 kips) per hydraulic jack This value well exceeded the desired load capacity increase of
297 above the experimentally determined capacity of the as-built specimen exhibited a very
stable structural response and increased the deformation capacity of the system The theoretical
moment capacity predictions for the as-built specimen were within 11 and 65 of the
experimentally determined value using ACI 318 and moment curvature analysis respectively
The theoretical moment capacity predictions for the FRP rehabilitated specimen were within
12 of the experimental value using the modified ACI 440-02 approach and were within 2
using moment curvature analysis
The NSM FRP rehabilitated specimen exhibits a variety of structural performance improvements
over the as-built specimen including increased ultimate load carrying capacity enhanced
deformation capacity and more stable overall structural performance Design options for the
near surface mounted CFRP strengthening schemes allow for great flexibility in terms of
tailoring the reinforcement parameters for specific applications With consideration of the
minimal disruption to traffic flow and ease of installation this system is a viable and very
attractive rehabilitation option for bridge deck slab overhangs
The purpose of Phase 1 was to conduct an experimental analysis of the use of NSM for purposes
of strengthening and to provide the basis for the planning of Phase 2 as detailed in the initial
proposal submitted to Caltrans Based on the extensive literature review already conducted
(although according to the project funding provided by Caltrans is to be completed and reported
on in Phase 2) and on the experimental results the following aspects are recommended for further
study in Phase 2
61
bull Complete review of the failure modes and mechanisms seen with use of barsrods as
compared to flat strips for purposes of documenting advantages of strips It is noted that
a very brief summary is given in the introductory portion of this report
bull Optimization of groove dimensions and spacing for NSM use through both analytical and
experimental study
bull Study of adhesive rheology and bond quality as well as durability
bull Study of minimum development length and effect of insertion into girder stems
bull Study of use for specific strengthening applications
bull Development of design guide for Caltrans and development of example comparing NSM
use to surface bonding
It is emphasized that the studies should be conducted on specimens of sufficient size since small
scale tests are likely to provide erroneous results due to effects of scale and configuration It is
recommended that these tests only be conducted after a review of advances in Europe and
Australia are completed and sufficient analytical work is completed on optimization of grove
dimensions and spacing Since the efficacy of the method is intrinsically related to the ability of
the adhesive to not only bond the reinforcement to the concrete substrate but to also enable
efficient stress transfer study also needs to be conducted on adhesive rheology performance
characteristics and cure It is recommended that this be based on the completed durability study
which should provide a base-line for further study Also since it is likely that the NSM will be
covered by asphalt the effect of heat due to asphalt on the adhesive and bond should also be
studied
62
7 REFERENCES
[1] VM Karbhari and L Zhao ldquoUse of composites for 21st century civil infrastructurerdquo
Computer Method Appl Mech Eng 185 pp 433ndash454 (2000)
[2] S Rizkalla T Hassan N Hassan ldquoDesign recommendations for the use of FRP for
strengthening of concrete structuresrdquo Prog Struct Engng Mater 5 pp 16ndash28 (2003)
[3] K K Ghosh ldquoAssessment of FRP composite strengthened reinforced concrete bridge
structures at the component and systems level through progressive damage and nonshy
destructive evaluation (NDE) [PhD dissertation] University of California San Diego
(2006)
[4] L De Lorenzis JG Teng ldquoNear-surface mounted FRP reinforcement An emerging
technique for strengthening structuresrdquo Composites Part B 38 pp 119-143 (2007)
[5] R Parretti A Nanni ldquoStrengthening of RC Members Using Near-Surface Mounted FRP
Composites Design Overviewrdquo Advances in Structural Engineering 7 5 pp 1-16 (2004)
[6] J R Yost S P Gross D W Dinehart and J J Mildenberg ldquoFlexural Behavior of
Concrete Beams Strengthened with Near-Surface-Mounted CFRP Stripsrdquo ACI Structural
Journal July-August pp 430-437(2007)
[7] L A DeLorenzis A Nanni and A L Tegila ldquoFlexural and Shear Strengthening of
Reinforced Concrete Structures with Near Surface Mounted FRP Barsrdquo Proceedings of the
3rd International Conference on Advanced Composite Materials in Bridges and Structures
Ottawa Canada Aug 15-18 pp 521-528 (2000)
[8] El-Hacha R and Rizkalla S 2004 ldquoNear-Surface-Mounted Fiber- Reinforced Polymer
Reinforcements for Flexural Strengthening of Concrete Structuresrdquo ACI Structural Journal
V 101 V 5 Sept-Oct pp 717-726
[9] R Parretti and A Nanni ldquoStrengthening of RC Members Using Near-Surface Mounted
FRP Composites Design Overviewrdquo Advances in Structural Engineering V 7 (5) (2004)
63
[10] E Bonaldo J A Oliveira de Barros and P B Lourenccedilo ldquoEfficient Strengthening
Technique to Increase the Flexural Resistance of Existing RC Slabsrdquo ASCE Journal of
Composites for Construction MarchApril pp149-159 (2008)
[11] The Concrete Society Design Guidance for Strengthening Concrete Structures using Fibre
Composite Materials Concrete Society Technical Report 55 2nd Edition (2004)
[12] ACI Committee 440 Guide for the Design and Construction of Externally Bonded FRP
Systems for Strengthening Concrete Structures ACI 4402 R-02 (2002)
[13] Canadian Standards Association Canadian Highway Bridge Design Code- Section 16
Fibre-Reinforced Structures (2006)
[14] AASHTO LRFD bridge design specifications 3rd Ed AASHTO Washington DC
(2004)
[15] A B Pridmore V M Karbhari ldquoEvaluation of Prefabricated FRP Structural Formwork
Bridge Deck Systemsrdquo SAMPE 53rd International Technical Conference (2008)
[16] Caltrans ldquoMemo to Designers 22-1 Soundwall Design Criteriardquo (2004)
[17] ACI 318-08 Building Code Requirements for Structural Concrete (2008)
[18] Caltrans Bridge Design Specifications Section 8- Reinforced Concrete (2003)
[19] Bentz E and Collins M P lsquolsquoRESPONSE-2000mdashReinforced Concrete Section al Analysis
using the Modified Compression Field Theoryrdquo Version 105 Toronto Canada (2000)
[20] Caltrans ldquoMemo to Designers 22-1 Soundwall Design Criteriardquo (2004)
[21] Sika Corporation Product Data Sheet for Sika CarboDur Rods- carbon fiber rods for
structural strengthening Edition 9 (2003)
[22] Sika Corporation Product Data Sheet for Sika CarboDur- Carbon fiber laminate for
structural strengthening Edition 722 (2005)
[23] Hughes Brothers Inc Product data sheet for Aslan 500- CFRP tape wwwhughesbroscom
(2002)
64
[24] W Seim Y Vasquez VM Karbhari and F Seible ldquoPost-Strengthening of Concrete
Slabs Full Scale Testing and Design Recommendationrdquo ASCE Journal of Structural
Engineering 129[6] pp 743-752 (2003)
[25] W Seim M Hormann VM Karbhari and F Seible External FRP Poststrengthening of
Scaled Concrete Slabs ASCE Journal of Composites in Construction 5[2] pp 67-75
(2001)
[26] Sika Europe- German Institute of Construction Technology 1998
[27] International Concrete Repair Institute ICRI Guideline No 037324 ldquoSelecting and
Specifying Concrete Surface Preparation for Sealers Coatings and Polymer Overlaysrdquo
(1997)
[28] S J Jin ldquoStatistical Characterization of Prefabricated FRP Composite Materials for
Rehabilitation of Concrete Structuresrdquo Master Thesis Department of Structural
Engineering University of California San Diego (2008)
[29] Sika Corporation ldquoCarboDur Installation Guiderdquo Sika construction documents
65
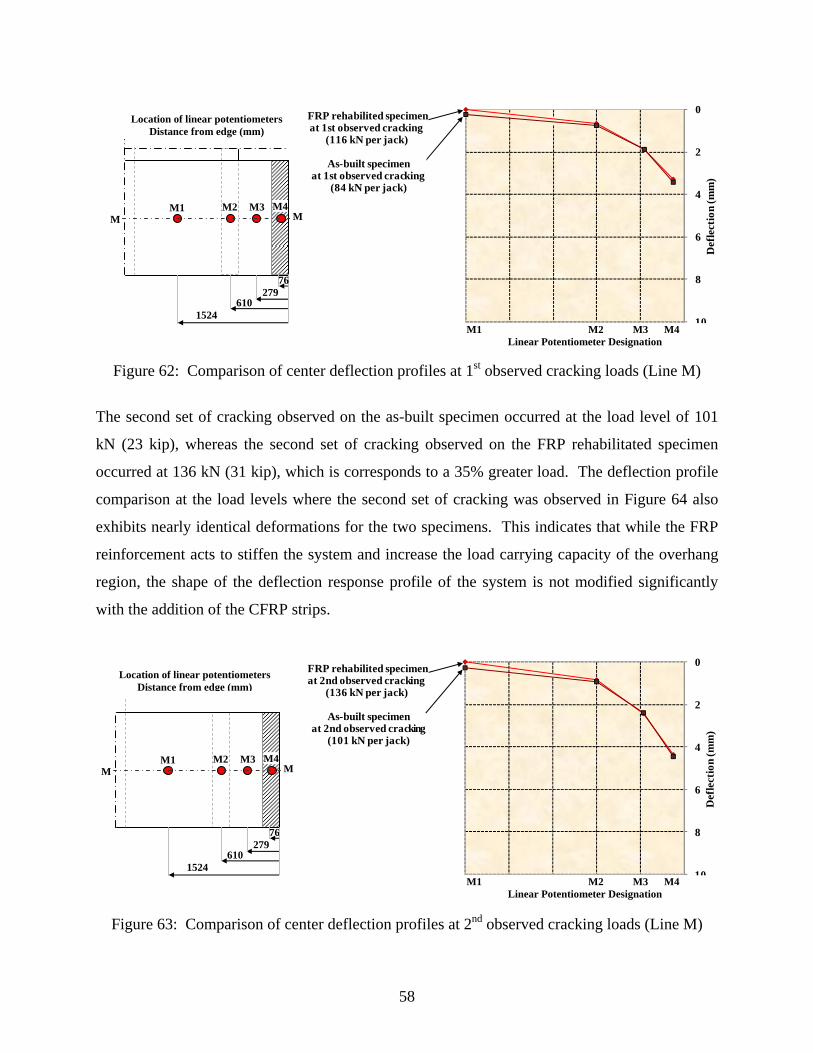
10
10
M1
1524
279 610
76
M2 M3 M4
Location of linear potentiometers Distance from edge (mm)
FRP rehabilited specimen at 1st observed cracking
(116 kN per jack)
0
2 As-built specimen
at 1st observed cracking (84 kN per jack) 4
M
Def
lect
ion
(mm
)
M
6
8
M1 M2 M3 M4 Linear Potentiometer Designation
Figure 62 Comparison of center deflection profiles at 1st observed cracking loads (Line M)
The second set of cracking observed on the as-built specimen occurred at the load level of 101
kN (23 kip) whereas the second set of cracking observed on the FRP rehabilitated specimen
occurred at 136 kN (31 kip) which is corresponds to a 35 greater load The deflection profile
comparison at the load levels where the second set of cracking was observed in Figure 64 also
exhibits nearly identical deformations for the two specimens This indicates that while the FRP
reinforcement acts to stiffen the system and increase the load carrying capacity of the overhang
region the shape of the deflection response profile of the system is not modified significantly
with the addition of the CFRP strips
0FRP rehabilited specimen at 2nd observed cracking
(136 kN per jack)
As-built specimen at 2nd observed cracking
(101 kN per jack)
Location of linear potentiometers Distance from edge (mm)
279 610
1524
76
M M1 M2 M3 M4
2
4
Def
lect
ion
(mm
)
M
6
8
M1 M2 M3 M4 Linear Potentiometer Designation
Figure 63 Comparison of center deflection profiles at 2nd observed cracking loads (Line M)
58
Figure 64 shows the side by side top decks of the two specimens after testing has been completed
and all loose concrete on the top deck removed Details of the critical region of the as-built and
FRP rehabilitated top deck are shown in Figure 65 and Figure 66 respectively
Figure 64 Top view of deck slab tested to ultimate capacity after removal of loose concrete
59
For the as-built specimen extensive damage and spalling of the concrete on the top of the deck
slab was seen Yielding in the transverse steel reinforcement followed by loss of aggregate
interlock resulting in failure was observed
Figure 65 Detail of cracking observed at ultimate capacity- top view of as-built deck
For the FRP rehabilitated specimen negligible spalled concrete and loose concrete rubble was
detected A concrete splitting failure mode was observed in the FRP rehabilitated specimen
Figure 66 Detail of cracking observed at ultimate capacity- top view of FRP rehabilitated deck
60
6 SUMMARY OF RESULTS AND RECOMMENDATIONS FOR FUTURE RESEARCH
Experimental results from the testing of the rehabilitated specimen indicate that the NSMR
strengthening scheme was successful at achieving the desired load carrying capacity increase
The ultimate load carrying capacity of the FRP rehabilitated specimen was 196 kN (44 kips) per
hydraulic jack which was 78 higher that the ultimate load of the as- built specimen of 114 kN
(26 kips) per hydraulic jack This value well exceeded the desired load capacity increase of
297 above the experimentally determined capacity of the as-built specimen exhibited a very
stable structural response and increased the deformation capacity of the system The theoretical
moment capacity predictions for the as-built specimen were within 11 and 65 of the
experimentally determined value using ACI 318 and moment curvature analysis respectively
The theoretical moment capacity predictions for the FRP rehabilitated specimen were within
12 of the experimental value using the modified ACI 440-02 approach and were within 2
using moment curvature analysis
The NSM FRP rehabilitated specimen exhibits a variety of structural performance improvements
over the as-built specimen including increased ultimate load carrying capacity enhanced
deformation capacity and more stable overall structural performance Design options for the
near surface mounted CFRP strengthening schemes allow for great flexibility in terms of
tailoring the reinforcement parameters for specific applications With consideration of the
minimal disruption to traffic flow and ease of installation this system is a viable and very
attractive rehabilitation option for bridge deck slab overhangs
The purpose of Phase 1 was to conduct an experimental analysis of the use of NSM for purposes
of strengthening and to provide the basis for the planning of Phase 2 as detailed in the initial
proposal submitted to Caltrans Based on the extensive literature review already conducted
(although according to the project funding provided by Caltrans is to be completed and reported
on in Phase 2) and on the experimental results the following aspects are recommended for further
study in Phase 2
61
bull Complete review of the failure modes and mechanisms seen with use of barsrods as
compared to flat strips for purposes of documenting advantages of strips It is noted that
a very brief summary is given in the introductory portion of this report
bull Optimization of groove dimensions and spacing for NSM use through both analytical and
experimental study
bull Study of adhesive rheology and bond quality as well as durability
bull Study of minimum development length and effect of insertion into girder stems
bull Study of use for specific strengthening applications
bull Development of design guide for Caltrans and development of example comparing NSM
use to surface bonding
It is emphasized that the studies should be conducted on specimens of sufficient size since small
scale tests are likely to provide erroneous results due to effects of scale and configuration It is
recommended that these tests only be conducted after a review of advances in Europe and
Australia are completed and sufficient analytical work is completed on optimization of grove
dimensions and spacing Since the efficacy of the method is intrinsically related to the ability of
the adhesive to not only bond the reinforcement to the concrete substrate but to also enable
efficient stress transfer study also needs to be conducted on adhesive rheology performance
characteristics and cure It is recommended that this be based on the completed durability study
which should provide a base-line for further study Also since it is likely that the NSM will be
covered by asphalt the effect of heat due to asphalt on the adhesive and bond should also be
studied
62
7 REFERENCES
[1] VM Karbhari and L Zhao ldquoUse of composites for 21st century civil infrastructurerdquo
Computer Method Appl Mech Eng 185 pp 433ndash454 (2000)
[2] S Rizkalla T Hassan N Hassan ldquoDesign recommendations for the use of FRP for
strengthening of concrete structuresrdquo Prog Struct Engng Mater 5 pp 16ndash28 (2003)
[3] K K Ghosh ldquoAssessment of FRP composite strengthened reinforced concrete bridge
structures at the component and systems level through progressive damage and nonshy
destructive evaluation (NDE) [PhD dissertation] University of California San Diego
(2006)
[4] L De Lorenzis JG Teng ldquoNear-surface mounted FRP reinforcement An emerging
technique for strengthening structuresrdquo Composites Part B 38 pp 119-143 (2007)
[5] R Parretti A Nanni ldquoStrengthening of RC Members Using Near-Surface Mounted FRP
Composites Design Overviewrdquo Advances in Structural Engineering 7 5 pp 1-16 (2004)
[6] J R Yost S P Gross D W Dinehart and J J Mildenberg ldquoFlexural Behavior of
Concrete Beams Strengthened with Near-Surface-Mounted CFRP Stripsrdquo ACI Structural
Journal July-August pp 430-437(2007)
[7] L A DeLorenzis A Nanni and A L Tegila ldquoFlexural and Shear Strengthening of
Reinforced Concrete Structures with Near Surface Mounted FRP Barsrdquo Proceedings of the
3rd International Conference on Advanced Composite Materials in Bridges and Structures
Ottawa Canada Aug 15-18 pp 521-528 (2000)
[8] El-Hacha R and Rizkalla S 2004 ldquoNear-Surface-Mounted Fiber- Reinforced Polymer
Reinforcements for Flexural Strengthening of Concrete Structuresrdquo ACI Structural Journal
V 101 V 5 Sept-Oct pp 717-726
[9] R Parretti and A Nanni ldquoStrengthening of RC Members Using Near-Surface Mounted
FRP Composites Design Overviewrdquo Advances in Structural Engineering V 7 (5) (2004)
63
[10] E Bonaldo J A Oliveira de Barros and P B Lourenccedilo ldquoEfficient Strengthening
Technique to Increase the Flexural Resistance of Existing RC Slabsrdquo ASCE Journal of
Composites for Construction MarchApril pp149-159 (2008)
[11] The Concrete Society Design Guidance for Strengthening Concrete Structures using Fibre
Composite Materials Concrete Society Technical Report 55 2nd Edition (2004)
[12] ACI Committee 440 Guide for the Design and Construction of Externally Bonded FRP
Systems for Strengthening Concrete Structures ACI 4402 R-02 (2002)
[13] Canadian Standards Association Canadian Highway Bridge Design Code- Section 16
Fibre-Reinforced Structures (2006)
[14] AASHTO LRFD bridge design specifications 3rd Ed AASHTO Washington DC
(2004)
[15] A B Pridmore V M Karbhari ldquoEvaluation of Prefabricated FRP Structural Formwork
Bridge Deck Systemsrdquo SAMPE 53rd International Technical Conference (2008)
[16] Caltrans ldquoMemo to Designers 22-1 Soundwall Design Criteriardquo (2004)
[17] ACI 318-08 Building Code Requirements for Structural Concrete (2008)
[18] Caltrans Bridge Design Specifications Section 8- Reinforced Concrete (2003)
[19] Bentz E and Collins M P lsquolsquoRESPONSE-2000mdashReinforced Concrete Section al Analysis
using the Modified Compression Field Theoryrdquo Version 105 Toronto Canada (2000)
[20] Caltrans ldquoMemo to Designers 22-1 Soundwall Design Criteriardquo (2004)
[21] Sika Corporation Product Data Sheet for Sika CarboDur Rods- carbon fiber rods for
structural strengthening Edition 9 (2003)
[22] Sika Corporation Product Data Sheet for Sika CarboDur- Carbon fiber laminate for
structural strengthening Edition 722 (2005)
[23] Hughes Brothers Inc Product data sheet for Aslan 500- CFRP tape wwwhughesbroscom
(2002)
64
[24] W Seim Y Vasquez VM Karbhari and F Seible ldquoPost-Strengthening of Concrete
Slabs Full Scale Testing and Design Recommendationrdquo ASCE Journal of Structural
Engineering 129[6] pp 743-752 (2003)
[25] W Seim M Hormann VM Karbhari and F Seible External FRP Poststrengthening of
Scaled Concrete Slabs ASCE Journal of Composites in Construction 5[2] pp 67-75
(2001)
[26] Sika Europe- German Institute of Construction Technology 1998
[27] International Concrete Repair Institute ICRI Guideline No 037324 ldquoSelecting and
Specifying Concrete Surface Preparation for Sealers Coatings and Polymer Overlaysrdquo
(1997)
[28] S J Jin ldquoStatistical Characterization of Prefabricated FRP Composite Materials for
Rehabilitation of Concrete Structuresrdquo Master Thesis Department of Structural
Engineering University of California San Diego (2008)
[29] Sika Corporation ldquoCarboDur Installation Guiderdquo Sika construction documents
65