Embed Size (px)
Citation preview
Structural Performance of Prefabricated Straw Bale Panels
Christopher Gross
A thesis submitted for the degree of Master of Philosophy
University of Bath
Department of Architecture and Civil Engineering
July 2009
COPYRIGHT Attention is drawn to the fact that copyright of this thesis rests with its author. A copy of
this thesis has been supplied on condition that anyone who consults it is understood to
recognise that its copyright rests with the author and they must not copy it or use
material from it except as permitted by law or with the consent of the author.
This thesis may be made available for consultation within
the University Library and may be photocopied or lent to other libraries
for the purposes of consultation.
Abstract
The public and construction industry professionals are becoming increasingly aware of
the environmental damage buildings can cause. As a result the use of more
sustainable and environmentally friendly building materials and techniques is
increasing. Straw bale construction is one such technique. ModCell panels are an
innovative way of using straw bales in a prefabricated wall system. As ModCell panels
are prefabricated the normal risks associated with straw bale construction (fire, straw
getting wet during construction, unfamiliar material) are removed from the building site.
The panels consist of a timber frame, braced with steel rods, in-filled with straw bales
and the surfaces are then rendered with a lime render. To date ModCell panels have
been used for cladding on framed buildings. However, they are now being developed
for low rise domestic load-bearing applications and in order to achieve this sufficient
racking shear resistance is required. Previous testing has shown that the corner joints
in the panel’s timber frame are a weak point.
This first aim of this thesis is to improve the racking shear resistance of ModCell panels
through a series of experimental laboratory based tests so that they can be used for
load-bearing applications. This thesis also aims to develop a computer model of load-
bearing ModCell panels in order to further understand their structural behaviour and
assist with future design and development. Different designs of frame corner joints
were tested in order to find the most suitable type of joint. Screw connected joints
proved to be the strongest and were twice as stiff as the other joint designs tested. Full
scale panel racking shear tests were undertaken to assess the overall performance of
the panels when using the screw connected joints and establish if they are suitable for
load-bearing construction. Both solid panels and panels with window openings were
tested. Two types of bracing were used in the test panels, either corner bracing or
cross bracing. The corner braced panels were over twice as stiff as panels tested
during a previous research project. The corner braced panels were also stiffer than the
cross braced panels at the serviceability deflection limit of the panels height/500, and
was sufficiently stiff to resist the required in plane loading under serviceability
conditions.
The computer model was developed alongside the structural testing. The model was
developed using the Robot Millennium software package and modelled all elements of
the panels apart from the straw. It was verified against the laboratory test results and
i

found to be accurate within the serviceability deflection limit of height/500. Once
material failure occurred in the actual panels the model’s accuracy was reduced as it
does not include material failure criteria. The model was then used to undertake a
parametric analysis. From this analysis it was found that all the elements modelled
have an effect on the stiffness of ModCell panels. Changing the render thickness was
found to make the greatest difference on the overall stiffness of the panels. Gusset
plate and glued and screwed joint designs were also modelled to find their effect on
panel stiffness. From all of the results of this analysis an improved panel was designed
and when modelled was 20% stiffer than the original panel.
ii
Acknowledgements
Prof. Pete Walker For continued guidance and supervision
Lecturer in the Department of throughout this investigation.
Architecture and Civil Engineering
Carbon Connections For providing funding for this research
Integral Structural Design For providing funding for this research and
detailed structural drawings of the test panels
White Design For providing funding for this research and
detailed drawings of the test panels
Agrifibre Technologies For providing funding for this research and for
construction of the test panels
Eurban Construction For providing funding for this research and
providing the timber used for the test panels and
joints
Dr. Katharine Beadle For assistance in construction of test panels
Mr Merl Cunliffe For rendering the test panels
Professional plasterer
Mr Graham Mott For assistance in ordering materials and for use
Technical Manager of the laboratories.
Mr William Bazeley, Mr Neil Price, For assistance in setting up test equipment and
Mr Brian Purnell, Miss Sophie help throughout testing in the structures
Hayward laboratory.
Laboratories technicians
iii
Table of Contents
Structural Performance of Prefabricated Straw Bale Panels............................................i
Abstract ............................................................................................................................ i
Acknowledgements ........................................................................................................ iii
Table of Contents ...........................................................................................................iv
List of Figures ................................................................................................................. vi
List of Tables .................................................................................................................. ix
1 Introduction ......................................................................................................... 1
1.1 Background ............................................................................................... 1
1.2 Brief history of straw bale construction ..................................................... 1
1.3 Straw bale construction in the UK ............................................................. 3
1.4 ModCell straw bale panels........................................................................ 5
1.5 Aims and objectives .................................................................................. 8
1.6 Layout of thesis......................................................................................... 9
2 Literature Review.............................................................................................. 10
2.1 Introduction ............................................................................................. 10
2.2 Material review........................................................................................ 10
2.3 Load carrying capacity of Straw bale walls ............................................. 14
2.4 Racking shear resistance of straw bale walls ......................................... 15
2.5 Conclusions ............................................................................................ 17
3 Laboratory Testing............................................................................................ 19
3.1 Introduction ............................................................................................. 19
3.2 Characteristics of materials ..................................................................... 19
3.3 Lime render testing ................................................................................. 20
3.4 Joint testing............................................................................................. 23
3.5 Full scale racking shear testing............................................................... 25
3.6 Vertical compression testing ................................................................... 27
3.7 Straw bale Characterisation.................................................................... 28
4 Material and Component Properties ................................................................. 30
4.1 Properties of Render ............................................................................... 30
4.2 Performance of Joints in Combined Shear and Tension ........................ 35
4.3 Rotational stiffness testing ...................................................................... 49
4.4 Conclusions ............................................................................................ 51
5 Racking Shear Tests on Panels ....................................................................... 53
5.1 Introduction ............................................................................................. 53
iv
5.2 Grand Designs Panels ............................................................................ 53
5.3 Laboratory Prepared Panel Tests ........................................................... 68
5.4 Vertical Compression Testing................................................................. 81
6 Computer Modelling of Racking Shear ............................................................. 88
6.1 Introduction ............................................................................................. 88
6.2 The design of the computer Model ......................................................... 88
6.3 Validation of the computer model ........................................................... 92
6.4 Parametric Analysis ................................................................................ 94
6.5 ModCell building at Bath....................................................................... 108
6.6 Future use of the model ........................................................................ 111
6.7 Conclusions .......................................................................................... 112
7 Conclusions and Recommendations .............................................................. 113
7.1 Conclusions .......................................................................................... 113
7.2 Recommendations for Further Work ..................................................... 115
References ................................................................................................................. 117
v
List of Figures
Figure 1.1 Nebraska style straw bale house dating from 1905 (Wanek 2003)............... 2
Figure 1.2 Straw bale house in USA dating from 1995 (Steen and Steen 2000) ........... 3
Figure 1.3 Centre for Alternative Technology Theatre ................................................... 3
Figure 1.4 Genesis Project Straw Pavilion (SCAT 2007) ............................................... 4
Figure 1.5 York EcoDepot .............................................................................................. 5
Figure 1.6 Build up of ModCell panel ............................................................................. 6
Figure 1.7 University of West of England ....................................................................... 7
Figure 1.8 Knowle West Media Centre, Bristol............................................................... 7
Figure 1.9 “The House That Kevin Built” ........................................................................ 8
Figure 2.1 Bale orientation (adapted from Vardy & MacDougall 2004) ........................ 12
Figure 3.1 Render prism flexural test set up (BS EN 1015-11:1999) ........................... 21
Figure 3.2 Render prism compression test set up........................................................ 22
Figure 3.3 Vertical pull out test set up .......................................................................... 24
Figure 3.4 Rotation stiffness test set up ....................................................................... 25
Figure 3.5 Two bale panel racking test set up.............................................................. 26
Figure 3.6 Three bale panel racking test set up ........................................................... 26
Figure 3.7 Load application during racking testing....................................................... 27
Figure 3.8 Vertical compression rig with ModCell panel............................................... 28
Figure 3.9 Balemaster probe........................................................................................ 29
Figure 4.1 Lime render strength ................................................................................... 32
Figure 4.2 Carbonation of 7 day render specimen ....................................................... 33
Figure 4.3 Carbonation of 14 day render specimen ..................................................... 34
Figure 4.4 Carbonation of 28 day render specimen ..................................................... 34
Figure 4.5 Carbonation of 91 day render specimen ..................................................... 34
Figure 4.6 Carbonation of 182 day render specimen ................................................... 35
Figure 4.7 Details of joint types .................................................................................... 36
Figure 4.8 Screw edge distances ................................................................................. 37
Figure 4.9 Vertical pull out test results ......................................................................... 38
Figure 4.10 Typical behaviour of joints in vertical pull out tests ................................... 38
Figure 4.11 Screws pulling through during testing ....................................................... 40
Figure 4.12 Screwed joint showing splitting of the timber following testing.................. 40
Figure 4.13 Deformed stainless steel dowel following testing ...................................... 41
Figure 4.14 Timber splitting during testing (Dowel connected joint)............................. 41
Figure 4.15 Timber failure during testing (Dovetail joint).............................................. 42
vi
Figure 4.16 Joint testing in Dartec 2000 kN loading frame........................................... 43
Figure 5.16 Top corner joint from two bale Grand Designs panel showing signs of water
Figure 5.17 Two bale Grand Designs panel showing signs of water ingress along line of
Figure 4.17 Results for joints with screws in either shear or tension............................ 44
Figure 4.18 Tested joint showing tension screw pull through....................................... 45
Figure 4.19 Tested joint showing timber splitting ......................................................... 45
Figure 4.20 Screw pull through testing......................................................................... 47
Figure 4.21 Average results from screw pull through testing ....................................... 47
Figure 4.22 Screw layout for rotational stiffness testing ............................................... 49
Figure 4.23 Screw edge distances ............................................................................... 49
Figure 4.24 Joint in opening showing splitting of timber............................................... 50
Figure 4.25 Joint in closing showing screw head pull through ..................................... 50
Figure 4.26 Joint testing results - Rotation ................................................................... 51
Figure 5.1 Grand Designs two bale panel .................................................................... 54
Figure 5.2 Grand Designs three bale panel ................................................................. 54
Figure 5.3 Gap between render and timber.................................................................. 56
Figure 5.4 Water staining ............................................................................................. 56
Figure 5.5 Crack in render............................................................................................ 57
Figure 5.6 Hole in render.............................................................................................. 57
Figure 5.7 Grass growing from panel ........................................................................... 57
Figure 5.8 Cracks in render.......................................................................................... 57
Figure 5.9 Loading cycle on Grand Designs panels..................................................... 59
Figure 5.10 Grand Designs panels racking shear results............................................. 60
Figure 5.11 Two bale Grand Designs panel following testing ...................................... 63
Figure 5.12 Three bale Grand Designs panel following testing.................................... 63
Figure 5.13 Two bale Grand Designs panel during moisture and render survey ......... 64
Figure 5.14 Two bale Grand Designs panel moisture readings (%H2O) ...................... 65
Figure 5.15 Three bale Grand Designs panel moisture readings (%H2O).................... 65
ingress .................................................................................................................. 66
reinforcement........................................................................................................ 67
Figure 5.18 Two bale corner brace panel..................................................................... 70
Figure 5.19 Two bale cross brace panel ...................................................................... 70
Figure 5.20 Three bale corner brace panel .................................................................. 71
Figure 5.21 Three bale cross brace panel.................................................................... 71
Figure 5.22 Typical loading and unloading cycles........................................................ 72
Figure 5.23 Gaps opening between timber and render ................................................ 73
Figure 5.24 Diagonal crack in render ........................................................................... 73
vii
Figure 5.25 Further racking shear test results.............................................................. 74
Figure 5.26 Deformed panel shapes ............................................................................ 76
Figure 5.27 Two bale corner braced panel after testing ............................................... 77
Figure 5.28 Two bale cross braced panel after testing................................................. 77
Figure 5.29 Three bale corner braced panel after testing ............................................ 78
Figure 5.30 Three bale cross braced panel after testing .............................................. 78
Figure 5.31 ModCell panel used in vertical compression testing ................................. 82
Figure 5.32 Results from Vertical compression testing ................................................ 82
Figure 5.33 Render sliding over drip detail................................................................... 83
Figure 5.34 Render curving under load........................................................................ 84
Figure 5.35 Failed render surface after testing............................................................. 84
Figure 5.36 Render investigation locations side one.................................................... 85
Figure 5.37 Render investigation locations side two .................................................... 86
Figure 6.1 Basic two dimensional model in Robot........................................................ 89
Figure 6.2 Robot model rotation joint stiffness data ..................................................... 91
Figure 6.3 Robot model vertical joint stiffness data...................................................... 91
Figure 6.4 Validation of Computer models against laboratory test results ................... 93
Figure 6.5 Results when frame thickness changed...................................................... 95
Figure 6.6 Results when render thickness changed..................................................... 97
Figure 6.7 Results when reinforcement layout changed .............................................. 98
Figure 6.8 Results when bracing changed ................................................................. 100
Figure 6.9 Results when joints changed..................................................................... 101
Figure 6.10 Joints tested by Richards (2009), Washer head screw (top), glued (middle),
gusset plate (bottom).......................................................................................... 103
Figure 6.11 Results from testing by Richards (2009) ................................................. 104
Figure 6.12 Results from testing by Richards (2009) ................................................. 104
Figure 6.13 Glued joint opening stiffness profile ........................................................ 105
Figure 6.14 Results from simulations using Richards (2009) data ............................. 106
Figure 6.15 Results from model for improved panel design....................................... 108
Figure 6.16 Ground floor plan of ModCell building at Bath......................................... 109
Figure 6.17 West elevation of ModCell building at Bath............................................. 109
Figure 6.18 ModCell building model elevation............................................................ 110
Figure 6.19 ModCell building three dimensional model.............................................. 110
viii
List of Tables
Table 2.1 Production of cereal crops in UK in 2008 (Defra 2009) ................................ 11
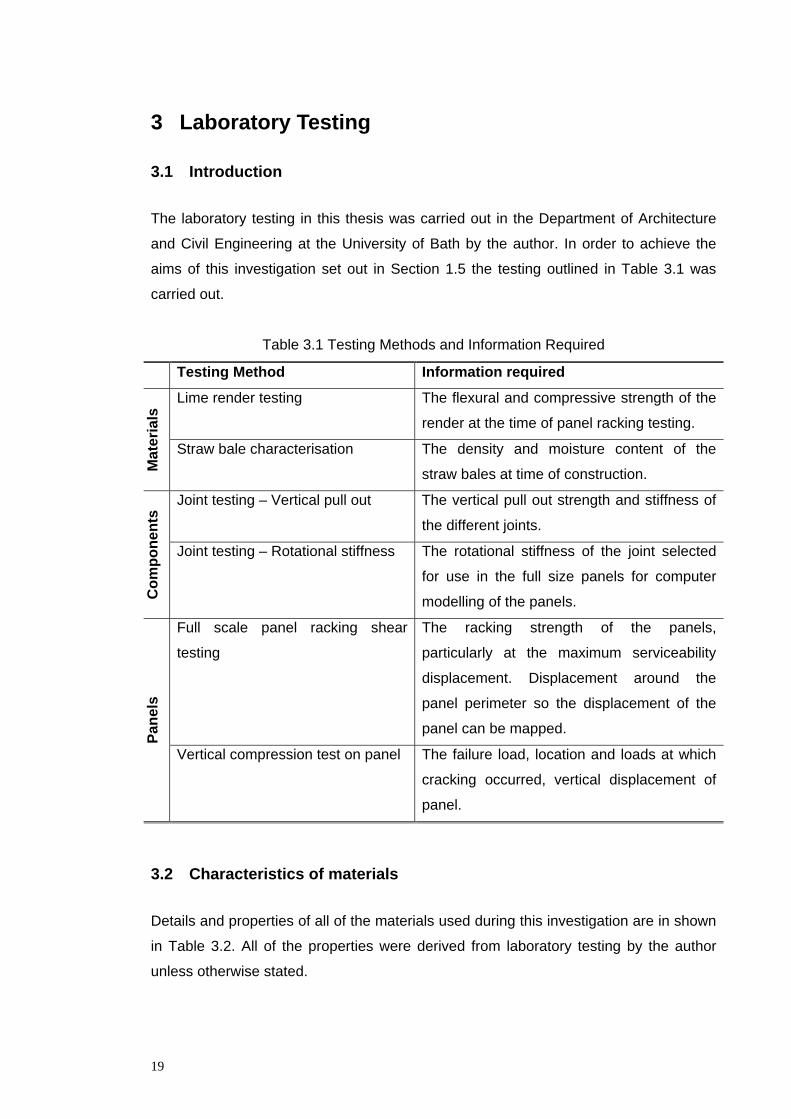
Table 3.1 Testing Methods and Information Required ................................................. 19
Table 3.2 Material Properties ....................................................................................... 20
Table 3.3 Survey of Bales used in construction of panels............................................ 29
Table 4.1 Long term lime render test specimens details and results ........................... 31
Table 4.2 Joint connection details ................................................................................ 36
Table 4.3 Results from joint testing .............................................................................. 39
Table 4.4 Maximum load on a single screw ................................................................. 46
Table 5.1 Arrival Moisture survey – 3 Bale Panel......................................................... 57
Table 5.2 Arrival Moisture survey – 2 Bale Panel......................................................... 58
Table 5.3 Lime render specimen test results................................................................ 62
Table 5.4 Results summary for all panels tested.......................................................... 79
Table 5.5 Render specimen test results ....................................................................... 80
.............................................................................................................................. 85
Table 5.6 Vertical compression panel render thickness and moisture content – side one
Table 5.7 Vertical compression panel render thickness– side two............................... 86
Table 6.1 Computer model construction....................................................................... 90
Table 6.2 Load at h/500 and stiffness with different frame thicknesses ....................... 96
Table 6.3 Load at h/500 and stiffness with different render thicknesses...................... 96
Table 6.4 Load at h/500 and stiffness with different numbers of reinforcing bars ........ 99
Table 6.5 Load at h/500 and stiffness with and without bracing................................. 100
Table 6.6 Load at h/500 and stiffness with different joints.......................................... 101
Table 6.7 Load at h/500 and stiffness with Richards (2009) joints ............................. 105
Table 6.8 Deflection and stiffness results from ModCell building model .................... 111
ix
1 Introduction
1.1 Background
In England and Wales the construction industry produces 109 million tonnes of waste
annually. It is estimated that 13% of this waste is new material that is never used on
site (Defra 2007). Approximately 50% of the UK’s CO2 emissions are from construction
and the running of buildings (Dti 2004) and 5% of global CO2 emissions are from
cement production alone (Morton 2008).
Over recent years the construction industry and the general public have become
increasingly aware of this environmental pollution. As a result the Dti (2004) published
guidance on sustainable construction with its key themes being to design for minimum
waste and minimum energy use. Many sustainable building materials satisfy both of
these themes and this combined with clients and designers desire to use them is
increasing their popularity. Straw bale construction is one such material, and its use
within the United Kingdom is slowly increasing.
1.2 Brief history of straw bale construction
Straw has been used for thousands of years as a building material. Traditionally straw
was mixed with clays in earth construction techniques such as wattle and daub, cob
and adobe in order to reinforce the earth (King 2006). During the late 1800s baling
machines were invented in the USA which allowed farmers to store their straw more
easily. At the same time communities were starting to populate and farm areas of
Nebraska. Conventional building materials were in very short supply within these new
communities so farmers started to use the bales produced from their crops to build
houses. These buildings had load-bearing straw bale walls which were then rendered
both inside and out. This type of straw bale construction has since become known as
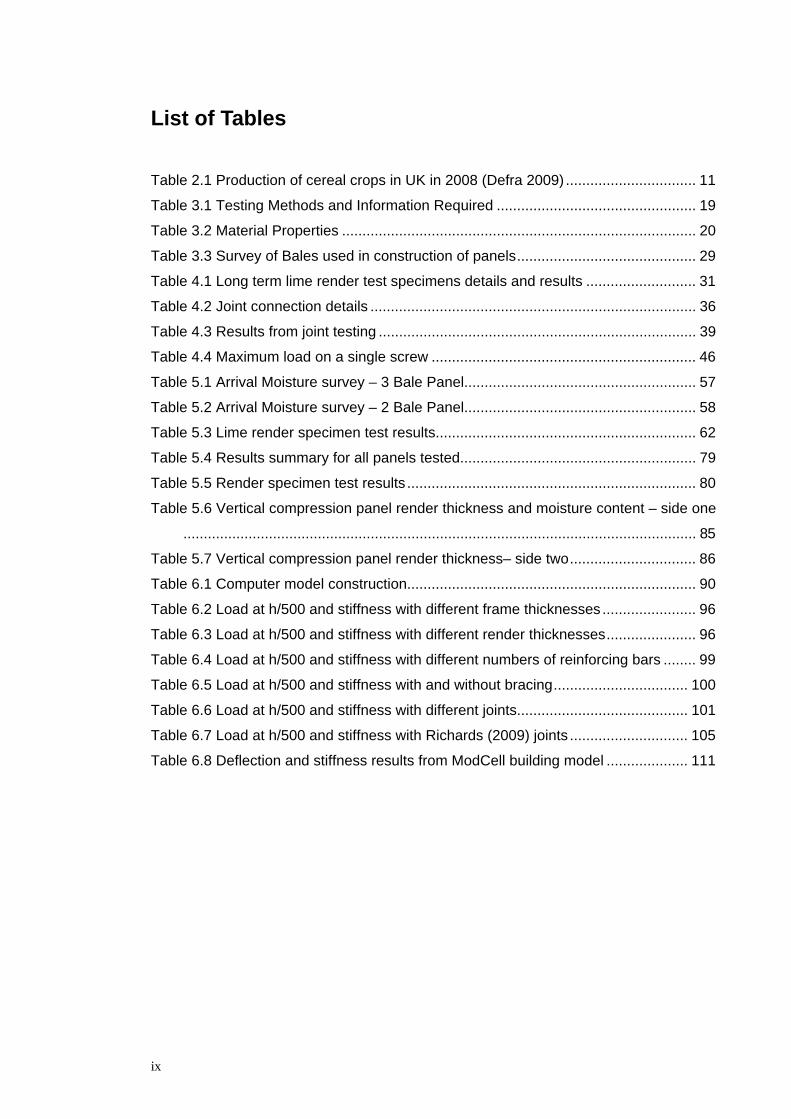
Nebraskan style and some of these buildings survive to this day (Jones 2002). Figure
1.1 shows one such building that was constructed in 1905 and is still occupied to this
day (Wanek 2003). This technique of building slowly died out once other building
materials become more widely available. There was a revival of this building technique
in the USA in the 1980s when some people started to become concerned with the
impact on the environment construction materials and housing were having (King
2006).
1
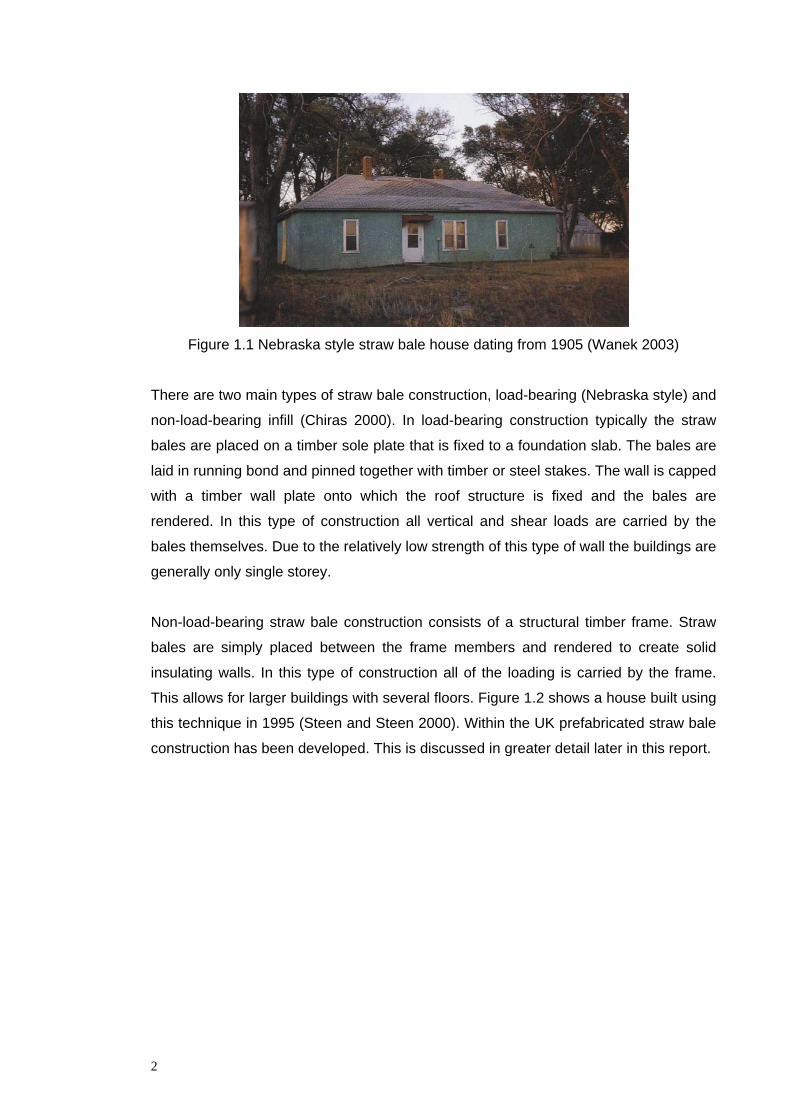
Figure 1.1 Nebraska style straw bale house dating from 1905 (Wanek 2003)
There are two main types of straw bale construction, load-bearing (Nebraska style) and
non-load-bearing infill (Chiras 2000). In load-bearing construction typically the straw
bales are placed on a timber sole plate that is fixed to a foundation slab. The bales are
laid in running bond and pinned together with timber or steel stakes. The wall is capped
with a timber wall plate onto which the roof structure is fixed and the bales are
rendered. In this type of construction all vertical and shear loads are carried by the
bales themselves. Due to the relatively low strength of this type of wall the buildings are
generally only single storey.
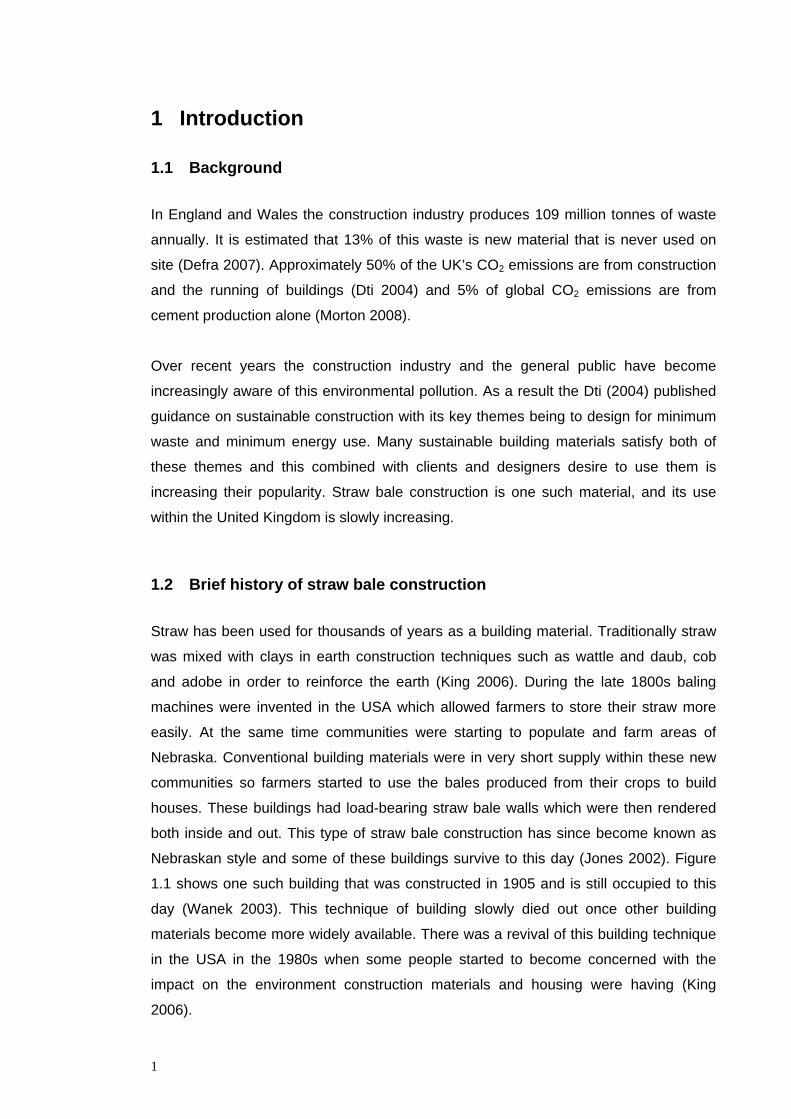
Non-load-bearing straw bale construction consists of a structural timber frame. Straw
bales are simply placed between the frame members and rendered to create solid
insulating walls. In this type of construction all of the loading is carried by the frame.
This allows for larger buildings with several floors. Figure 1.2 shows a house built using
this technique in 1995 (Steen and Steen 2000). Within the UK prefabricated straw bale
construction has been developed. This is discussed in greater detail later in this report.
2
Figure 1.2 Straw bale house in USA dating from 1995 (Steen and Steen 2000)
1.3 Straw bale construction in the UK
The first straw building in the UK was built in 1994. Most straw bale buildings built in
the UK have been one off projects built by individuals who have an interest in building
with straw. This trend is reflected in the fact that between 1994 and 2002 only about 70
straw bale buildings were constructed in the UK (Jones 2002).
There have been several notable straw bale buildings constructed in the UK. One of
these is the Centre for Alternative Technology (CAT) theatre (Figure 1.3). The building
was constructed in 1999 using a larch frame with straw bale infill walls. Both faces of
the straw were plastered using a 50 mm thick lime plaster (Anonymous 2007).
Figure 1.3 Centre for Alternative Technology Theatre
3
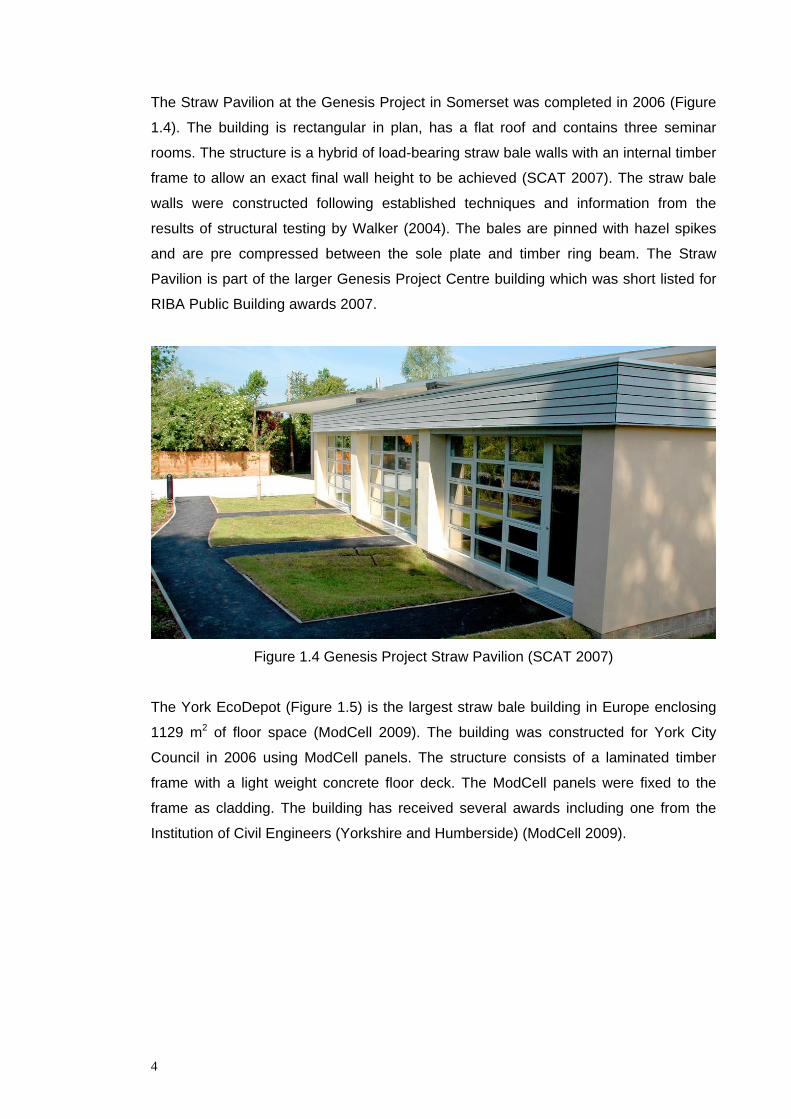
The Straw Pavilion at the Genesis Project in Somerset was completed in 2006 (Figure
1.4). The building is rectangular in plan, has a flat roof and contains three seminar
rooms. The structure is a hybrid of load-bearing straw bale walls with an internal timber
frame to allow an exact final wall height to be achieved (SCAT 2007). The straw bale
walls were constructed following established techniques and information from the
results of structural testing by Walker (2004). The bales are pinned with hazel spikes
and are pre compressed between the sole plate and timber ring beam. The Straw
Pavilion is part of the larger Genesis Project Centre building which was short listed for
RIBA Public Building awards 2007.
Figure 1.4 Genesis Project Straw Pavilion (SCAT 2007)
The York EcoDepot (Figure 1.5) is the largest straw bale building in Europe enclosing
1129 m2 of floor space (ModCell 2009). The building was constructed for York City
Council in 2006 using ModCell panels. The structure consists of a laminated timber
frame with a light weight concrete floor deck. The ModCell panels were fixed to the
frame as cladding. The building has received several awards including one from the
Institution of Civil Engineers (Yorkshire and Humberside) (ModCell 2009).
4
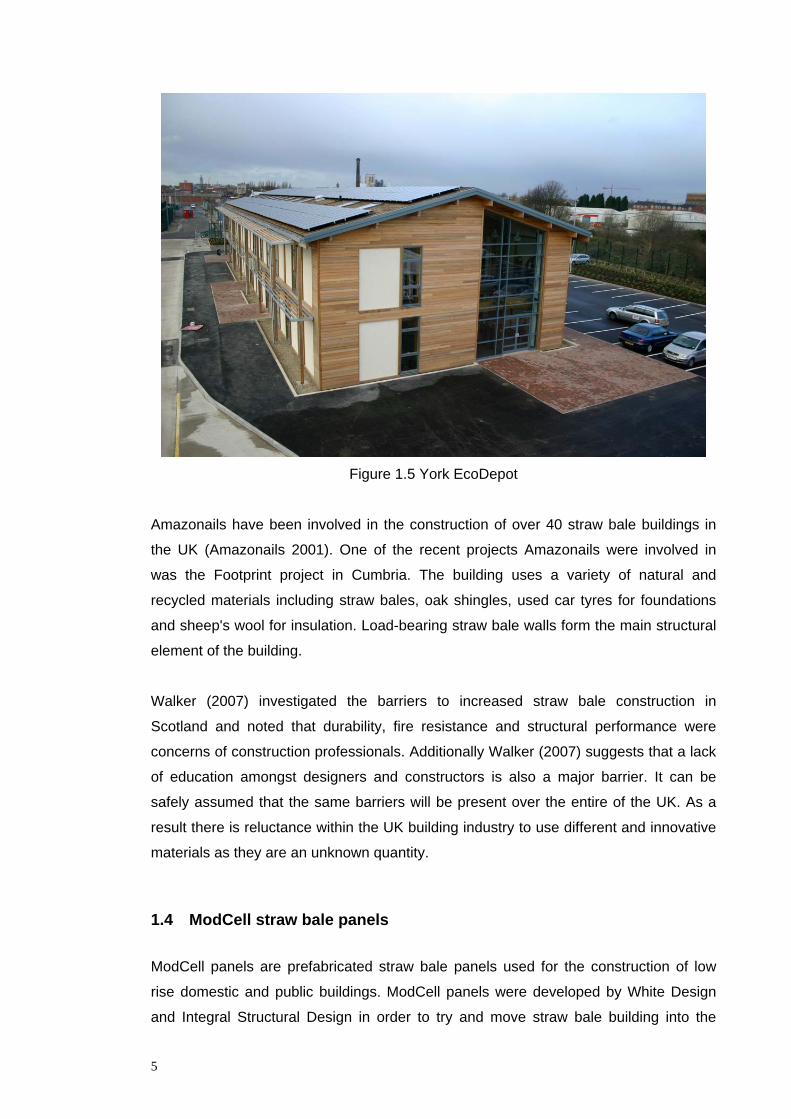
Figure 1.5 York EcoDepot
Amazonails have been involved in the construction of over 40 straw bale buildings in
the UK (Amazonails 2001). One of the recent projects Amazonails were involved in
was the Footprint project in Cumbria. The building uses a variety of natural and
recycled materials including straw bales, oak shingles, used car tyres for foundations
and sheep's wool for insulation. Load-bearing straw bale walls form the main structural
element of the building.
Walker (2007) investigated the barriers to increased straw bale construction in
Scotland and noted that durability, fire resistance and structural performance were
concerns of construction professionals. Additionally Walker (2007) suggests that a lack
of education amongst designers and constructors is also a major barrier. It can be
safely assumed that the same barriers will be present over the entire of the UK. As a
result there is reluctance within the UK building industry to use different and innovative
materials as they are an unknown quantity.
1.4 ModCell straw bale panels
ModCell panels are prefabricated straw bale panels used for the construction of low
rise domestic and public buildings. ModCell panels were developed by White Design
and Integral Structural Design in order to try and move straw bale building into the
5
mainstream construction sector and make straw bale construction more easily
accessible to designers, clients and constructors. The key idea behind ModCell panels
is that they are prefabricated off site in a local ‘flying factory’ and then transported to
site and constructed into a building. This removes the presence of straw bales onsite
and the associated problems (storage, weather protection, fire risk).
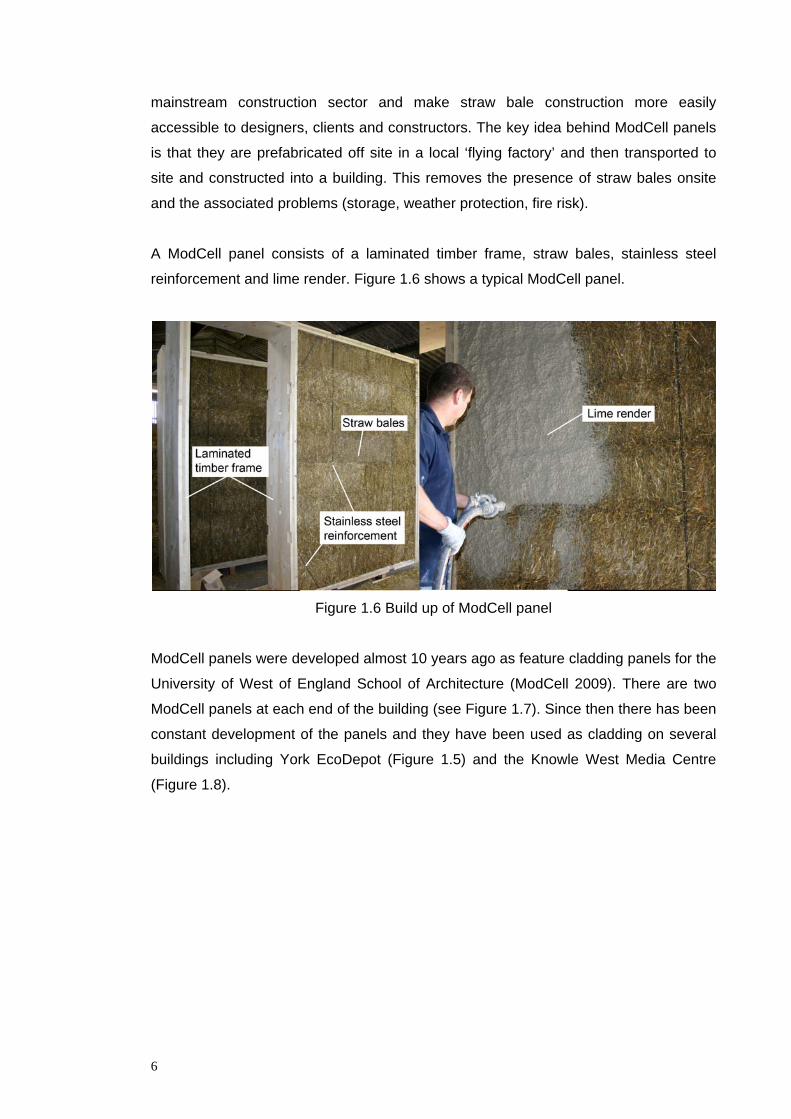
A ModCell panel consists of a laminated timber frame, straw bales, stainless steel
reinforcement and lime render. Figure 1.6 shows a typical ModCell panel.
Figure 1.6 Build up of ModCell panel
ModCell panels were developed almost 10 years ago as feature cladding panels for the
University of West of England School of Architecture (ModCell 2009). There are two
ModCell panels at each end of the building (see Figure 1.7). Since then there has been
constant development of the panels and they have been used as cladding on several
buildings including York EcoDepot (Figure 1.5) and the Knowle West Media Centre
(Figure 1.8).
6
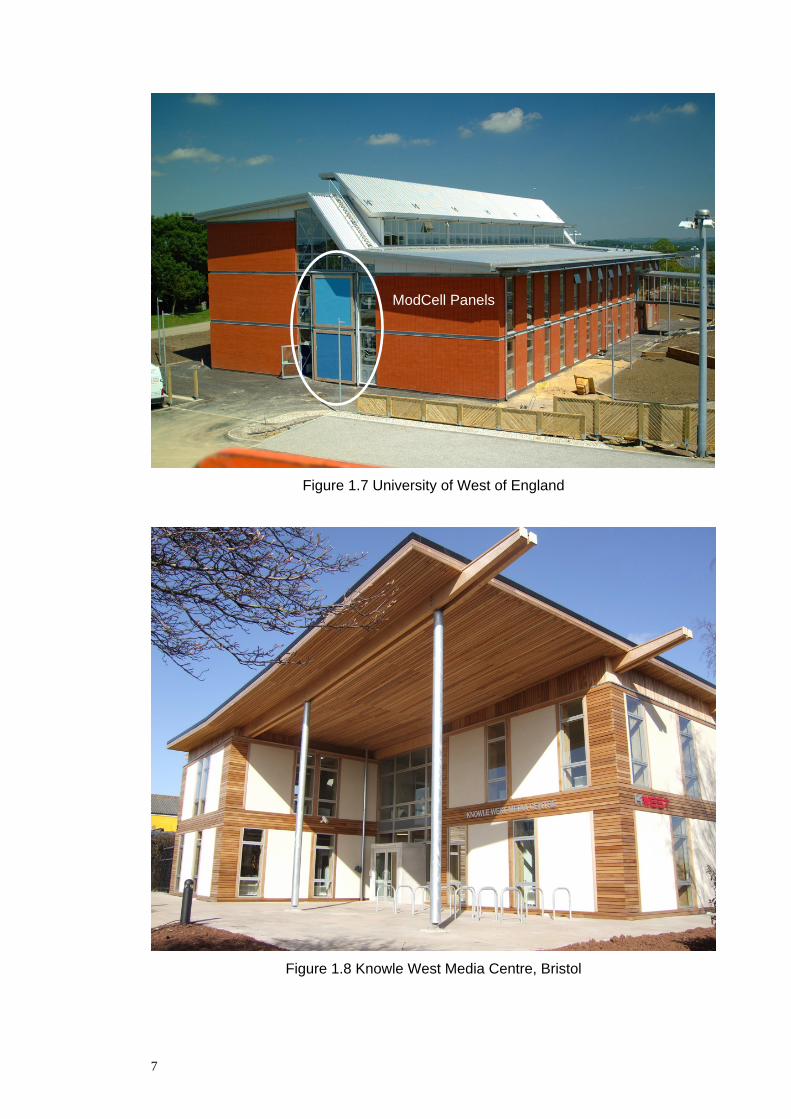
ModCell Panels
Figure 1.7 University of West of England
Figure 1.8 Knowle West Media Centre, Bristol
7
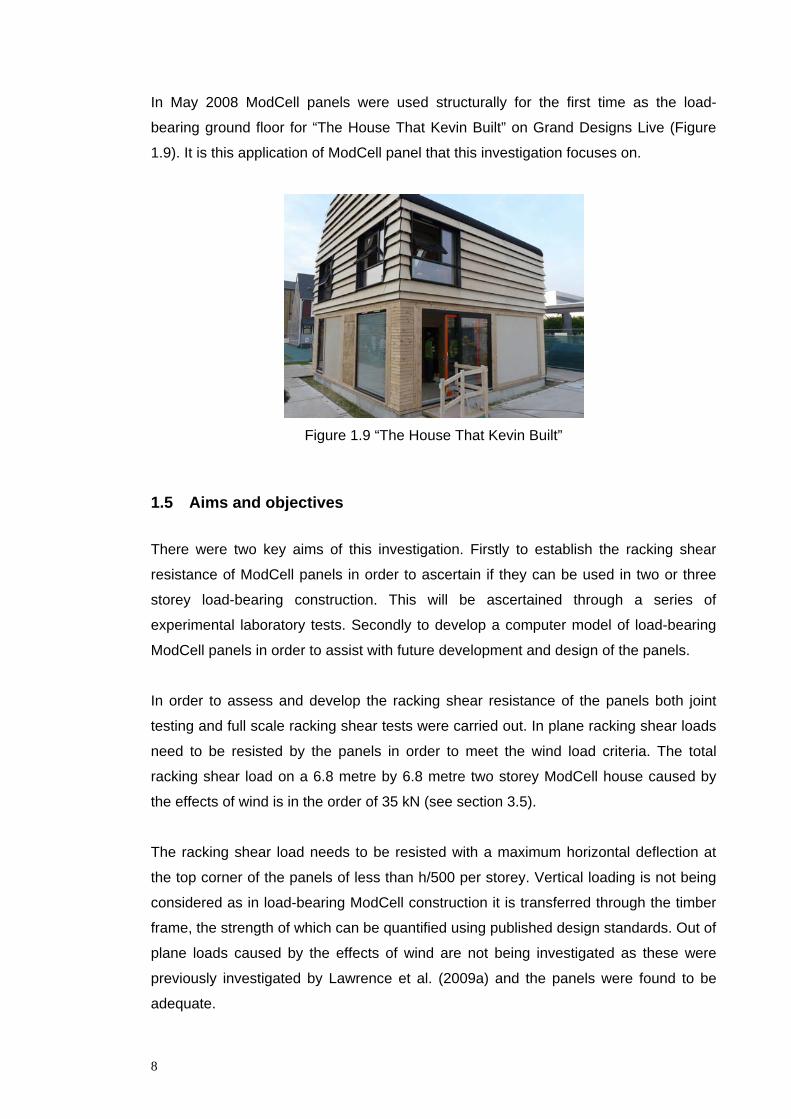
In May 2008 ModCell panels were used structurally for the first time as the load-
bearing ground floor for “The House That Kevin Built” on Grand Designs Live (Figure
1.9). It is this application of ModCell panel that this investigation focuses on.
Figure 1.9 “The House That Kevin Built”
1.5 Aims and objectives
There were two key aims of this investigation. Firstly to establish the racking shear
resistance of ModCell panels in order to ascertain if they can be used in two or three
storey load-bearing construction. This will be ascertained through a series of
experimental laboratory tests. Secondly to develop a computer model of load-bearing
ModCell panels in order to assist with future development and design of the panels.
In order to assess and develop the racking shear resistance of the panels both joint
testing and full scale racking shear tests were carried out. In plane racking shear loads
need to be resisted by the panels in order to meet the wind load criteria. The total
racking shear load on a 6.8 metre by 6.8 metre two storey ModCell house caused by
the effects of wind is in the order of 35 kN (see section 3.5).
The racking shear load needs to be resisted with a maximum horizontal deflection at
the top corner of the panels of less than h/500 per storey. Vertical loading is not being
considered as in load-bearing ModCell construction it is transferred through the timber
frame, the strength of which can be quantified using published design standards. Out of
plane loads caused by the effects of wind are not being investigated as these were
previously investigated by Lawrence et al. (2009a) and the panels were found to be
adequate.
8
A computer model of load-bearing ModCell panels was developed alongside the
laboratory testing and the results from the racking shear tests used validate it. This
model was developed to further the understanding of the structural behaviour of
ModCell panels and to aid in the future development and design of the panels.
1.6 Layout of thesis
This thesis reviews the significant testing that has been carried out to date on the load
capacity of straw bales, the racking shear resistance of straw bale walls and the testing
specific to ModCell panels. This thesis then outlines the laboratory testing carried out to
assess the structural performance of the panels and presents discussion and analysis
of the results. This thesis also discusses the development of the computer model, its
validation, use in further understanding the panels and the modelling of a future load-
bearing ModCell buildings.
9
2 Literature Review
2.1 Introduction
This section of the thesis reviews significant structural testing carried out on straw bale
walls. Straw bale buildings are generally constructed following the same techniques as
used by the first users of straw bales in the 1800s. This is an acceptable way of
building, but it does not necessarily use the materials as efficiently as possible or to
their full potential. In order to exploit them to their full potential structural testing needs
to be undertaken on the materials used as well as full size wall assemblies. In the case
of ModCell panels a standardised system is being developed. Often straw bale designs
undergo structural testing prior to construction in order to satisfy Building Control. A
standardised system will remove the need for this.
In the following chapter the straw and render used for the construction of ModCell
panels will be reviewed. The load carrying capacity of individual straw bales is
reviewed as the individual strength of straw bales is likely to affect the overall strength
of straw bale walls. Finally significant laboratory tests on the racking shear resistance
of straw bale walls are reviewed as this is the structural aspect of ModCell panels this
thesis is focusing on. As the modern use of straw bale construction is still in its infancy
there has only been a limited amount of research into the structural performance of
straw bale walls. Much of this work has been undertaken as undergraduate and
postgraduate research and has not been published in peer review publications. As a
result it is difficult to obtain copies of some research or assess their reliability. For this
reason the literature review in this chapter is concise, but it does cover the most
significant structural testing undertaken.
2.2 Material review
2.2.1 Straw
Straw is a widespread agricultural by product. It is the stalk that supports the head of
grain crops during growth. When harvested the head and stalk are separated, with the
head often being used in food production and the stalk or straw is a major by product of
this process (Cripps et al. 2004). Table 2.1 shows the amount of cereal crops grown
10
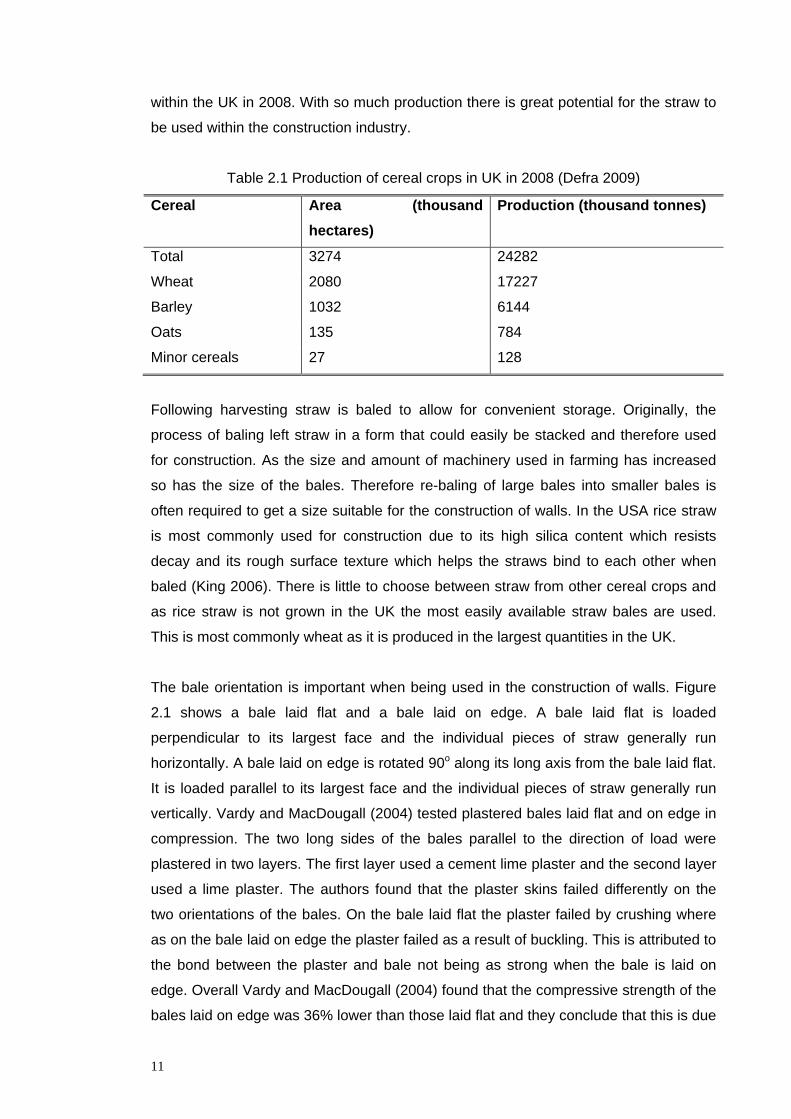
within the UK in 2008. With so much production there is great potential for the straw to
be used within the construction industry.
Table 2.1 Production of cereal crops in UK in 2008 (Defra 2009)
Cereal Area (thousand Production (thousand tonnes) hectares)
Total 3274 24282
Wheat 2080 17227
Barley 1032 6144
Oats 135 784
Minor cereals 27 128
Following harvesting straw is baled to allow for convenient storage. Originally, the
process of baling left straw in a form that could easily be stacked and therefore used
for construction. As the size and amount of machinery used in farming has increased
so has the size of the bales. Therefore re-baling of large bales into smaller bales is
often required to get a size suitable for the construction of walls. In the USA rice straw
is most commonly used for construction due to its high silica content which resists
decay and its rough surface texture which helps the straws bind to each other when
baled (King 2006). There is little to choose between straw from other cereal crops and
as rice straw is not grown in the UK the most easily available straw bales are used.
This is most commonly wheat as it is produced in the largest quantities in the UK.
The bale orientation is important when being used in the construction of walls. Figure
2.1 shows a bale laid flat and a bale laid on edge. A bale laid flat is loaded
perpendicular to its largest face and the individual pieces of straw generally run
horizontally. A bale laid on edge is rotated 90o along its long axis from the bale laid flat.
It is loaded parallel to its largest face and the individual pieces of straw generally run
vertically. Vardy and MacDougall (2004) tested plastered bales laid flat and on edge in
compression. The two long sides of the bales parallel to the direction of load were
plastered in two layers. The first layer used a cement lime plaster and the second layer
used a lime plaster. The authors found that the plaster skins failed differently on the
two orientations of the bales. On the bale laid flat the plaster failed by crushing where
as on the bale laid on edge the plaster failed as a result of buckling. This is attributed to
the bond between the plaster and bale not being as strong when the bale is laid on
edge. Overall Vardy and MacDougall (2004) found that the compressive strength of the
bales laid on edge was 36% lower than those laid flat and they conclude that this is due
11
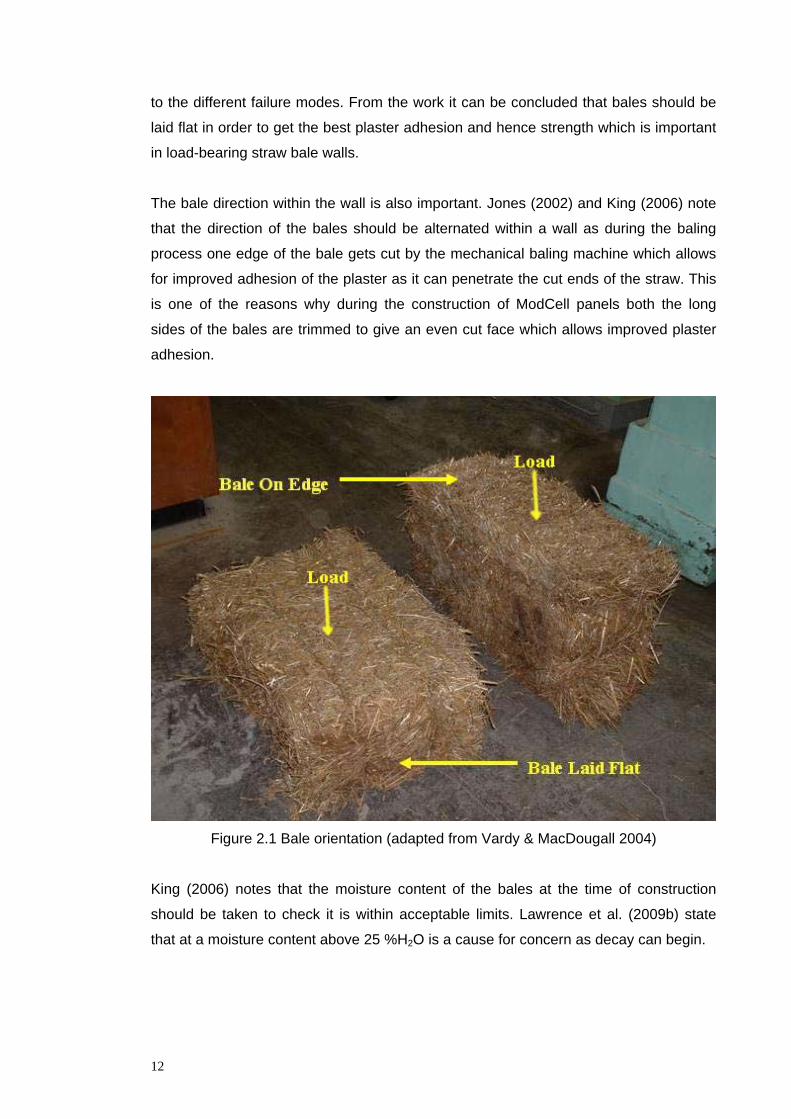
to the different failure modes. From the work it can be concluded that bales should be
laid flat in order to get the best plaster adhesion and hence strength which is important
in load-bearing straw bale walls.
The bale direction within the wall is also important. Jones (2002) and King (2006) note
that the direction of the bales should be alternated within a wall as during the baling
process one edge of the bale gets cut by the mechanical baling machine which allows
for improved adhesion of the plaster as it can penetrate the cut ends of the straw. This
is one of the reasons why during the construction of ModCell panels both the long
sides of the bales are trimmed to give an even cut face which allows improved plaster
adhesion.
Figure 2.1 Bale orientation (adapted from Vardy & MacDougall 2004)
King (2006) notes that the moisture content of the bales at the time of construction
should be taken to check it is within acceptable limits. Lawrence et al. (2009b) state
that at a moisture content above 25 %H2O is a cause for concern as decay can begin.
12
2.2.2 Render
The render on straw bale buildings plays a crucial role in preserving the straw,
protecting it from the weather, fire, pests and accidental damage, while remaining
vapour permeable (King 2006). The render must be vapour permeable to allow the
straw to release moisture and return to equilibrium when moisture does penetrate the
render.
Both Jones (2002) and King (2006) suggest that reinforcement mesh can be used
within the rendered surface in order to increase its strength. Much research has been
carried out on walls with normal render and with reinforced render. Ash et al. (2003)
found that load-bearing straw bale walls with unreinforced render failed at lower loads
than those that were reinforced. But it was noted that this was related to the way the
reinforcement helped to fix the render to the head plate at the top of the wall and not a
failure in the render surface as a whole. There is no research that suggests that
reinforcing plaster reduces the strength of straw bales walls.
The thickness of render required is a balance between that required for strength,
longevity of the straw and the cost. Generally the thicker the render, the higher the load
that can be carried and the greater the protection offered from the weather. But render
is an expensive part of the walls and therefore the thicker it is the higher the cost.
ModCell panels use 30 mm thick render as this has been found, through testing carried
out by The University of Bath, to provide adequate protection from the weather.
There are three main groups of render that can be used on straw bale walls. These are
earth, lime and cement based renders. Lime and cement are often combined to give a
render with the best properties from each. The lime provides flexibility and vapour
permeability while the cement provides fast developing strength. Faine and Zhang
(2002) compared the load-bearing capacity of earth plastered and cement plastered
straw bale walls. They constructed two straw bale walls; one two storey wall with
internal steel bar pinning, mesh reinforcement and cement render and; one single
storey wall with 3% pre-compression and earth render. The single storey wall did not
contain pinning or mesh. With a 40kN working load applied the cement rendered wall
deflected an average of 5mm and the earth rendered wall deflected an average of 8mm
showing that the cement rendered wall is stiffer. The authors note that the earth
rendered wall displayed more visible signs of weakness with severe cracking and
spalling of the render. The authors also noted that the earth render was much easier to
apply and that chicken wire was not required to cover the bales prior to rendering.
13
Render can be applied to straw bale walls either traditionally by hand or by using a
render spraying machine. Spraying the render is much faster and appears to give
better penetration of the render into the straw. However no testing has been under
taken to prove increased adhesion.
2.3 Load carrying capacity of Straw bale walls
The load carrying capacity of straw bale walls is determined by several factors. These
are:
• Bale density
• Render strength and thickness
• Render reinforcement
• Other reinforcing within the wall
• Head and sole plate details
With all of the above working compositely, straw bale walls exhibit complex behaviour
when loaded. The structural model of a straw bale wall is often simplified down to a
sandwich panel arrangement with two stressed skins with a soft insulating core (Carrick
and Glassford 1998).
Zhang (2002) tested plastered and un-plastered individual bales laid flat and on edge
and applied loads to only the straw and to the straw and render together in order to
investigate the path of the load. During testing of the straw bales Zhang (2002) found
that initially upon loading the bales compressed by 3 to 4% of their original height. It is
common practice to pre-compress straw bales walls prior to plastering to avoid this
settlement the first time the wall is loaded (King 2006). The straw bales in ModCell
panels are pre-compressed by a load of roughly 2.5 kN/m which is equivalent to an
average settlement of about 1.5%. This is less than the initial settlement noted by
Zhang, but the bales in ModCell panels do not bear any direct vertical load and
therefore settlement is not as critical.
Walker (2004) tested straw bale walls in vertical compression. The wall panels were
2.25 m high by 0.99 m wide with the bale direction alternating as recommended by
Jones (2002) and hazel spikes to pin the bales together. Five different specimens were
tested, one standard/control specimen, one without hazel spikes, one using half bales
in every other course, one that was pre-compressed and one that was lime rendered.
14
The lime rendered wall carried a maximum load of 41.1 kN (41.5 kN/m) with a
settlement of 55 mm. This was over 50 times stiffer than the un-rendered wall
specimen. The pre-compressed wall panel had roughly half the settlement of the
standard wall panel at maximum load. This research has shown that render is key to
improving the stiffness and strength of straw bale walls under vertical loading and
again that pre-compression reduces deflections under load.
Vardy (2009) developed a theoretical model to predict the compressive strength of
straw bale walls and compared the results with results from laboratory based
experiments. The author adapted a stress strain model for concrete for use with lime-
cement render. The model was verified against cylinders of the lime-cement render.
The model uses the render strength and thickness to predict the strength of the straw
bale walls, with any compressive resistance from the straw being ignored. In total 18
wall specimens were constructed and tested in order to verify the results of the model.
Three straw bale walls 0.99m high and three straw bale walls 2.32m high were pre-
compressed by an unspecified amount and rendered with lime-cement render in three
layers. The render was not allowed to cure between layers. The specimens were tested
seven days after rendering. They were loaded with a concentric vertical compressive
load. Vardy (2009) found that the model over predicted the strength of the 0.99m high
walls by an average of 14% and under predicted the strength of the 2.31m high walls
by an average of 10%. However, overall it was found that the model was 99%
accurate. Vardy (2009) also tested walls with eccentric loads and achieved similar
comparisons with the model. This is the first piece of work of its kind where a model
has been developed to predict the behaviour of straw bale walls. It has shown that it is
possible to accurately predict their behaviour based on a simple model of the render.
2.4 Racking shear resistance of straw bale walls
Carrick and Glassford (1998) tested straw bale walls subject to vertical and in plane
racking loading. The test walls were constructed using rice straw bales and were 3.6
metres wide by 2.7 metres tall with a pre-compression of 125 mm. The wall panels
were rendered with a 30 mm thick sand and cement render reinforced with chicken
wire. A 10 kN (2.78 kN/m) racking load was applied to two different wall specimens and
horizontal displacements of 2.3 mm and 2.4 mm were recorded. Additionally the walls
were loaded in vertical compression to failure. Ultimate loads of 21.4 kN/m with 4.5 mm
deflection and 20.6 kN/m with an unknown deflection were recorded. The investigation
by Carrick and Glassford (1998) is interesting as they applied both vertical and racking
15
loads at the same time, which is likely to be the situation in a load-bearing straw bale
building. Unfortunately they did not test the walls with the vertical and racking loads
applied independently from each other, so a comparison between combined and
individual performances is not possible. They did however load one of the wall panels
before rendering and concluded that the render skins provide most of the wall’s
strength, but the straw is also important as it prevents the render membrane buckling.
Nichols and Rapp (2000) tested a single 2.3 m high load-bearing straw bale wall with
horizontal in plane loading three times over a period of two weeks. The wall was two
bales wide by six bales high, covered in reinforcing mesh and plastered with two layers
of plaster. The authors do not give details about the type of plaster. The first test was
carried out 14 days after the final coat of plaster had been applied. Cracks formed in
the plaster at a load of 98 kN and a displacement of 12.9mm (height/180). The second
test was carried out two days later and the wall was not repaired between tests. The
third test was carried out a further seven days later and again the wall was not
repaired. During the third test at a displacement of 12.9 mm again a load of 98 kN was
sustained. Nichols and Rapp (2000) comment that these results are very encouraging
in terms of the durability of straw bale walls when multiple significant loads are applied,
as may be the case in an earthquake scenario.
Ash et al. (2003) agree with Carrick and Glassford (1998) that render is key to
improving shear resistance of straw bale walls. They investigated in plane cyclic
loading of straw bale walls and tested six walls measuring 2.44 metres square. Three
were earth rendered and three were cement rendered with three different types of
reinforcement used with each render. The walls were two bales wide and were stacked
using running bond. In the most heavily reinforced wall the bales were pinned to the
sole plate using threaded bar. On four of the walls cross ties were inserted to tie the
two render skins together in an attempt to prevent buckling of the render surface. An in
plane horizontal load was applied to the top of the walls. The authors found that of the
earth rendered walls there was a 25% increase in load at all displacements between
the walls with the lightest and heaviest reinforcement. The cement rendered walls
showed a similar pattern, however the difference between the lightest and heaviest
reinforcement was over 100%. All of the cement rendered walls had a higher racking
shear resistance than the earth rendered walls. Comparing all of the results the authors
found that by changing the render type and the reinforcement in the render the racking
shear resistance of the walls could be increased by almost six times. This work found a
greater difference in performance of earth and cement renders than Faine and Zhang
16
(2002) found. Since the render has a large effect on the stiffness of straw bale walls,
changing the type of render is likely to also have a significant effect on the overall
stiffness of straw bale walls.
At the University of Bath Lawrence et al. (2009a) investigated the racking shear
resistance of ModCell panels, but still limited to a cladding application. Tests were
carried out on corner joints to investigate the resistance offered to racking shear. This
work found that even with corner bracing the joints were not sufficient alone to resist
the required racking forces. Lawrence et al. (2009a) then confirmed this by testing a
two metre by two metre ModCell timber frame, timber frame with the straw bales and
finally a fully rendered panel. The rendered panel was 3.5 times stiffer than the straw
filled panel. Racking shear load resistance tests were then performed on full size
ModCell panels measuring 3.08 metres wide, by 3.34 metres high, by 0.48 metres
thick. Panels reinforced with steel bracing as well as unreinforced panels were tested.
Cracks developed in the render of the reinforced panel at 1.25 times the load in the
unreinforced panels and failure occurred at nearly three times the load. It was observed
that load capacity and lateral stiffness of the frame is significantly influenced by the
joint and reinforcement details. In addition Lawrence et al. (2009a) also observed that
the render is a key contributor to the shear resistance of the panels. This observation is
in keeping with other straw bale building techniques. Mesh reinforcement was not used
in any of the render, but Lawrence et al. (2009a) point out that the vertical reinforcing
bars have the same effect by adding some tensile strength to the render.
2.5 Conclusions
From this literature review it can be concluded that the straw and render in straw bale
walls are key to structural strength. The importance of mesh reinforcement in the
render is less clear as Ash et al. (2003) concluded that reinforcement improved the
strength of straw bale walls where as Lawrence et al. (2009a) did not use mesh in any
of their testing and yet still gain favourable results. Straw bale walls require the straw
and the render to work compositely in order that maximum strength is achieved. Vardy
and MacDougall (2004) found that render did not adhere to bales laid on edge as well
as it did to bale laid flat. During testing the compressive strength of the bales laid on
edge was 36% lower than those laid flat. They commented that some of the loss in
strength was due to the render becoming separate from the straw at lower loads.
17
From the review of vertical compression testing it can be concluded that the following
improve the strength and stiffness of straw bale walls;
• adding render
• pinning the bales together
• confining the render between timber sole and head plates
• using high density bales
• pre-compressing prior to rendering.
These are all currently considered to be good practice when constructing in straw bale
and are all already implemented in the design of ModCell panels.
Zhang (2002) commented that initial displacements of 3 to 4% were observed when the
bales were loaded. Faine and Zhang (2002), Walker (2004), Carrick and Glassford
(1998) and Lawrence et al. (2009a) all pre-compressed some or all of their wall panels
prior to rendering to prevent this and improve the stiffness of the walls. Walker (2004)
tested both pre-compressed and un-compressed walls and found that the settlement
under vertical load was reduced by 50% when the bales had been pre-compressed. As
previously mentioned the bales in ModCell panels are pre-compressed by roughly
1.5% to reduce the risk of settlement once they are completed.
Finally as with the vertical strength, the racking strength of straw bale walls is largely
affected by the render and its detailing. All of the research into in plane load resistance
concluded that the contribution of the render is key to the strength and stiffness.
Specifically looking at ModCell panels Lawrence et al. (2009a) showed that once
render was added to a panel its stiffness increased by 3.5 times. However Lawrence et
al. (2009a) comment that it is all elements in the panel working in composite that give
the panel its racking shear resistance.
18
3 Laboratory Testing
3.1 Introduction
The laboratory testing in this thesis was carried out in the Department of Architecture
and Civil Engineering at the University of Bath by the author. In order to achieve the
aims of this investigation set out in Section 1.5 the testing outlined in Table 3.1 was
carried out.
Table 3.1 Testing Methods and Information Required
Testing Method Information required
Mat
eria
ls Lime render testing The flexural and compressive strength of the
render at the time of panel racking testing.
Straw bale characterisation The density and moisture content of the
straw bales at time of construction.
Com
pone
nts
Joint testing – Vertical pull out
Joint testing – Rotational stiffness
The vertical pull out strength and stiffness of
the different joints.
The rotational stiffness of the joint selected
for use in the full size panels for computer
modelling of the panels.
Pane
ls
Full scale panel racking shear
testing
Vertical compression test on panel
The racking strength of the panels,
particularly at the maximum serviceability
displacement. Displacement around the
panel perimeter so the displacement of the
panel can be mapped.
The failure load, location and loads at which
cracking occurred, vertical displacement of
panel.
3.2 Characteristics of materials
Details and properties of all of the materials used during this investigation are in shown
in Table 3.2. All of the properties were derived from laboratory testing by the author
unless otherwise stated.
19
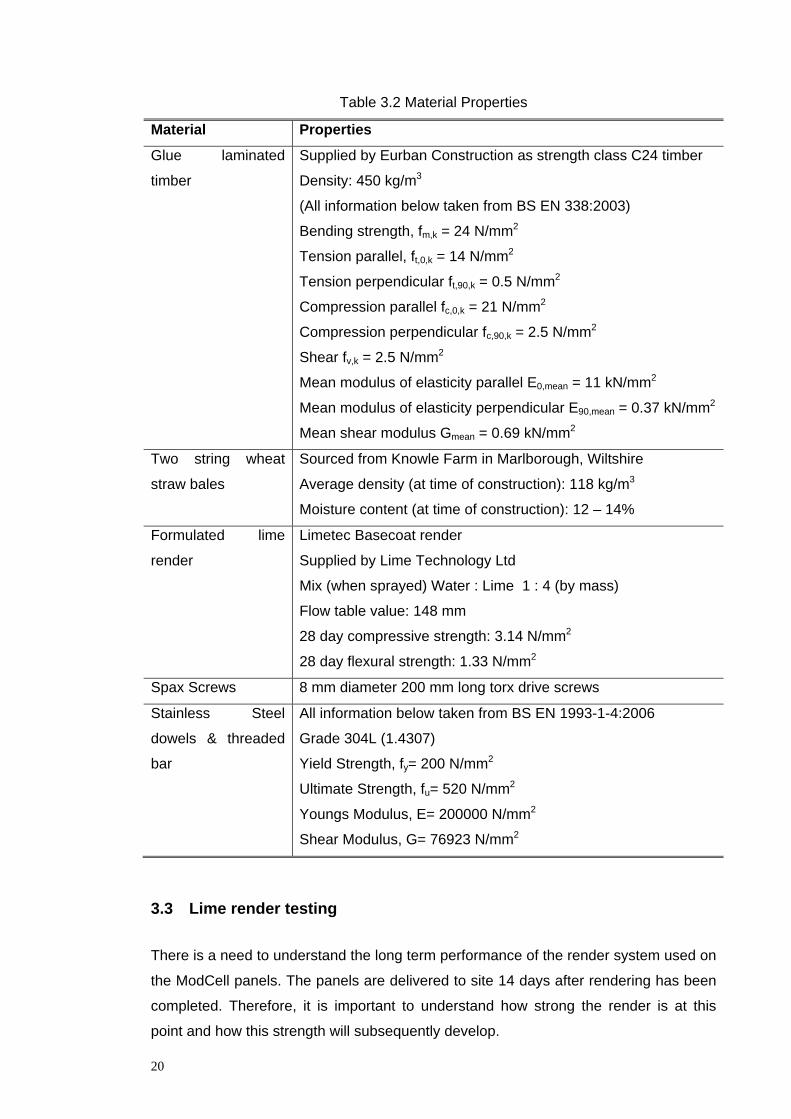
Table 3.2 Material Properties
Material
Glue laminated
timber
Two string
straw bales
wheat
Formulated
render
lime
Spax Screws 8 mm diameter 200 mm long torx drive screws
Stainless Steel All information below taken from BS EN 1993-1-4:2006
dowels & threaded
bar
Grade 304L (1.4307)
Yield Strength, fy= 200 N/mm2
Ultimate Strength, fu= 520 N/mm2
Youngs Modulus, E= 200000 N/mm2
Shear Modulus, G= 76923 N/mm2
Properties
Supplied by Eurban Construction as strength class C24 timber
Density: 450 kg/m3
(All information below taken from BS EN 338:2003)
Bending strength, fm,k = 24 N/mm2
Tension parallel, ft,0,k = 14 N/mm2
Tension perpendicular ft,90,k = 0.5 N/mm2
Compression parallel fc,0,k = 21 N/mm2
Compression perpendicular fc,90,k = 2.5 N/mm2
Shear fv,k = 2.5 N/mm2
Mean modulus of elasticity parallel E0,mean = 11 kN/mm2
Mean modulus of elasticity perpendicular E90,mean = 0.37 kN/mm2
Mean shear modulus Gmean = 0.69 kN/mm2
Sourced from Knowle Farm in Marlborough, Wiltshire
Average density (at time of construction): 118 kg/m3
Moisture content (at time of construction): 12 – 14%
Limetec Basecoat render
Supplied by Lime Technology Ltd
Mix (when sprayed) Water : Lime 1 : 4 (by mass)
Flow table value: 148 mm
28 day compressive strength: 3.14 N/mm2
28 day flexural strength: 1.33 N/mm2
3.3 Lime render testing
There is a need to understand the long term performance of the render system used on
the ModCell panels. The panels are delivered to site 14 days after rendering has been
completed. Therefore, it is important to understand how strong the render is at this
point and how this strength will subsequently develop.
20
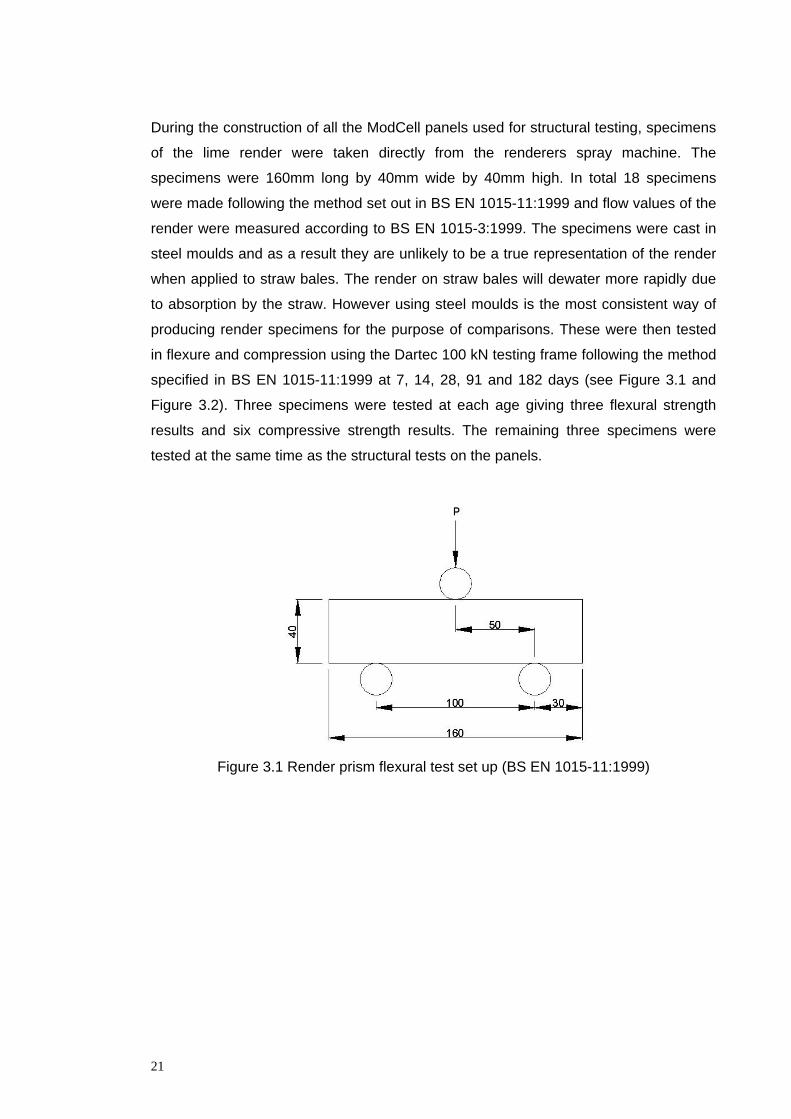
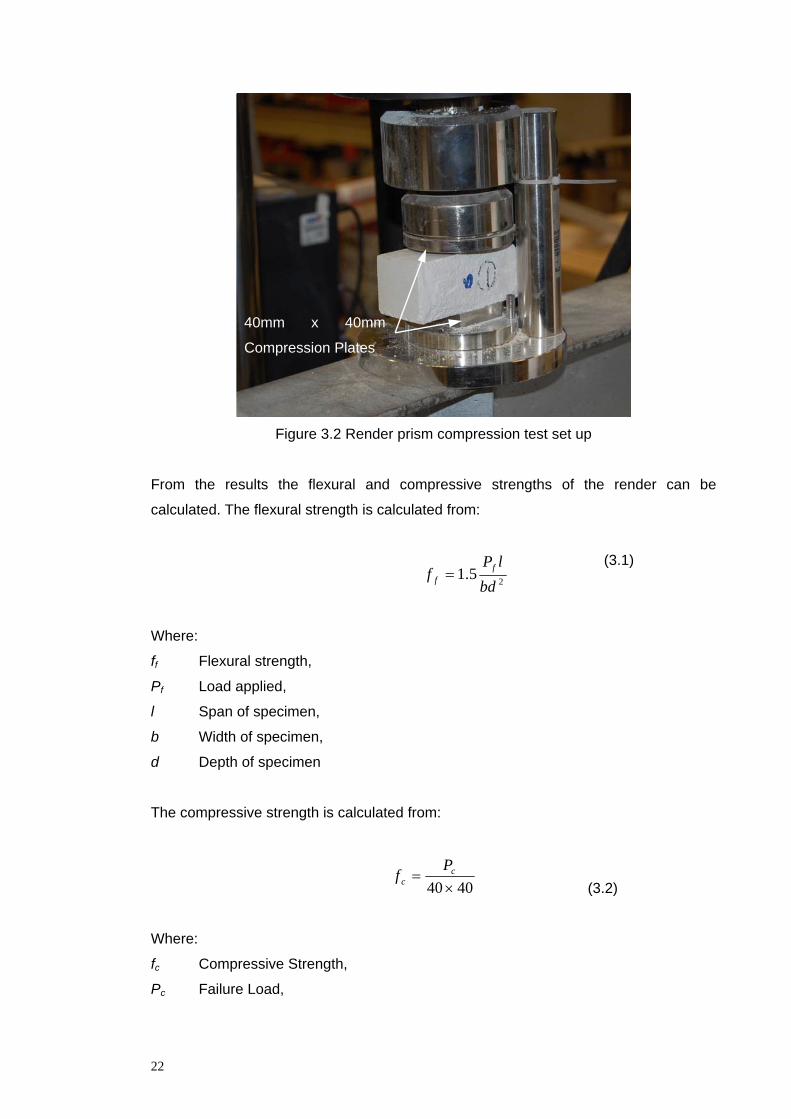
During the construction of all the ModCell panels used for structural testing, specimens
of the lime render were taken directly from the renderers spray machine. The
specimens were 160mm long by 40mm wide by 40mm high. In total 18 specimens
were made following the method set out in BS EN 1015-11:1999 and flow values of the
render were measured according to BS EN 1015-3:1999. The specimens were cast in
steel moulds and as a result they are unlikely to be a true representation of the render
when applied to straw bales. The render on straw bales will dewater more rapidly due
to absorption by the straw. However using steel moulds is the most consistent way of
producing render specimens for the purpose of comparisons. These were then tested
in flexure and compression using the Dartec 100 kN testing frame following the method
specified in BS EN 1015-11:1999 at 7, 14, 28, 91 and 182 days (see Figure 3.1 and
Figure 3.2). Three specimens were tested at each age giving three flexural strength
results and six compressive strength results. The remaining three specimens were
tested at the same time as the structural tests on the panels.
Figure 3.1 Render prism flexural test set up (BS EN 1015-11:1999)
21
l
40mm x 40mm
Compression Plates
Figure 3.2 Render prism compression test set up
From the results the flexural and compressive strengths of the render can be
calculated. The flexural strength is calculated from:
f f = 1.5 Pf l
2
(3.1)
bd
Where:
ff Flexural strength,
Pf Load applied,
Span of specimen,
b Width of specimen,
d Depth of specimen
The compressive strength is calculated from:
Pf = c
c 40 × 40 (3.2)
Where:
fc Compressive Strength,
Pc Failure Load,
22
3.4 Joint testing
Joint testing was undertaken as previous research on ModCell panels (Lawrence et al.
2009a) had shown that the joints were a limiting factor in both the stiffness of ModCell
panels and also the overall strength. When the horizontal in plane load is applied
during full scale racking tests the top element of the timber frame has a tendency to
move upwards. This puts a vertical load through the joints. In the previous work by
Lawrence et al. (2009a) the joints failed by pulling apart vertically. Therefore it was
decided that a series of joints should be tested in this manner to determine the most
suitable to use in ModCell panels.
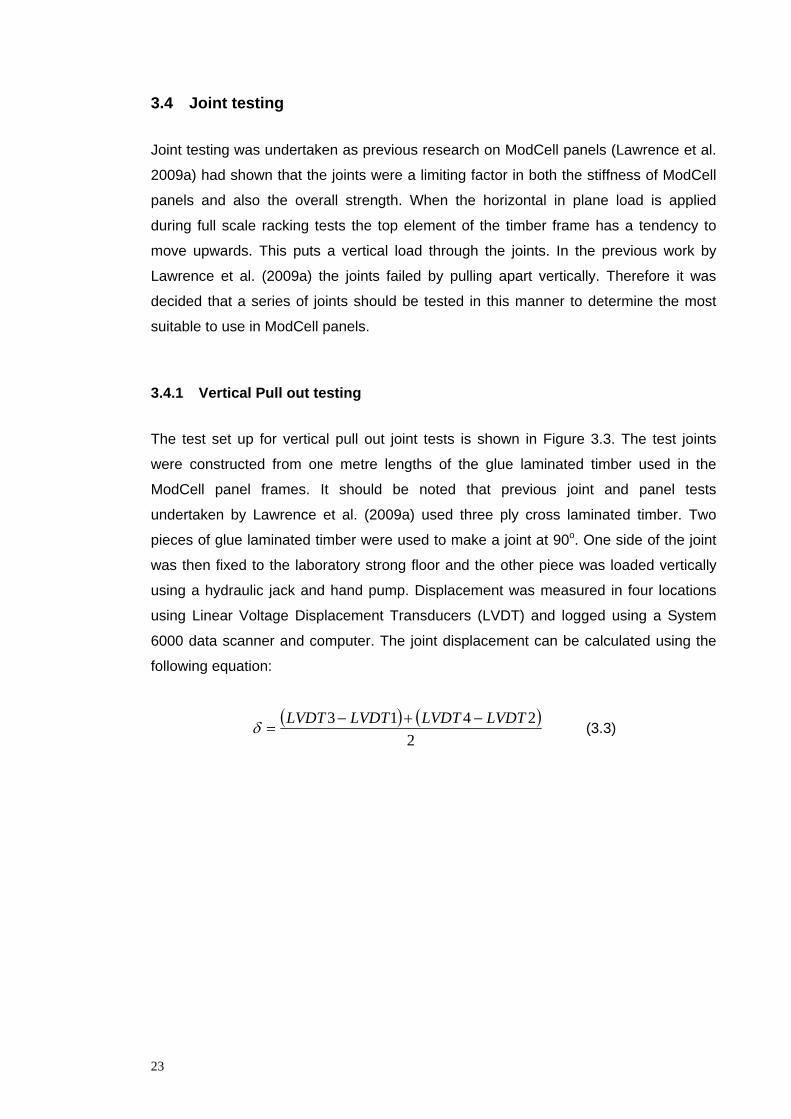
3.4.1 Vertical Pull out testing
The test set up for vertical pull out joint tests is shown in Figure 3.3. The test joints
were constructed from one metre lengths of the glue laminated timber used in the
ModCell panel frames. It should be noted that previous joint and panel tests
undertaken by Lawrence et al. (2009a) used three ply cross laminated timber. Two
pieces of glue laminated timber were used to make a joint at 90o. One side of the joint
was then fixed to the laboratory strong floor and the other piece was loaded vertically
using a hydraulic jack and hand pump. Displacement was measured in four locations
using Linear Voltage Displacement Transducers (LVDT) and logged using a System
6000 data scanner and computer. The joint displacement can be calculated using the
following equation:
(LVDT3 − LVDT1)+ (LVDT 4 − LVDT 2)δ = (3.3)2
23
Figure 3.3 Vertical pull out test set up
3.4.2 Rotational Stiffness
The rotational stiffness of the joints was required for the development of a theoretical
computer model of ModCell panels. Rotational joint tests were performed by opening
and closing test joints from a 90o starting position. Both opening and closing tests were
performed as the stiffness may be different in each case and during racking shear
loading of the panels two joints open and two joints close. The test set up is shown in
Figure 3.4. The same size specimens were used as for the vertical pull out joint testing
described in Section 3.4.1 of this report. The horizontal section of the joint was fixed to
the laboratory floor to prevent sliding. The vertical section was loaded horizontally
using a hydraulic jack and hand pump. Displacements were measured using LVDT and
the load was measured using a load cell. The data was recorded on the System 6000
data scanner and computer. Any slip of the specimen across the floor is measured with
LVDT 3. This is then subtracted from the displacement recorded on LVDT 1 and LVDT
2 to give the correct displacement.
24
Figure 3.4 Rotation stiffness test set up
3.5 Full scale racking shear testing
Full size racking shear tests are designed to replicate the in plane loading conditions
ModCell panels may be subject to in a building. Wind is the primary cause of in-plane
loading; for a 6.8 metre by 6.8 metre house constructed from ModCell panels the total
design wind load is in the order of 35 kN. This was calculated following the method set
out in BS 6399-2 and the following parameters were assumed:
• Basic wind speed = 21m/s
• Site altitude 180m above sea level
• Located in the countryside
• 40km upwind from the sea
• South west wind direction
The set up for the tests are shown in Figure 3.5, Figure 3.6 and Figure 3.7. The
ModCell panel is fixed to the laboratory floor to prevent sliding or uplift. A horizontal
load is applied to the top element of the frame at the corner of the panel using a
hydraulic jack and hand pump. Displacements are measured using LVDTs at set
locations around the panel and the load was measured using a load cell. The data was
recorded on a System 6000 data scanner and computer. A vertical surcharge load was
not applied to the panels during testing as all vertical loads are transferred through the
25
upright elements of the timber frame. While a surcharge load may affect the racking
shear resistance, it is felt that this affect is small because vertical loads pass through
the vertical frame elements and therefore can be ignored during this investigation.
Figure 3.5 Two bale panel racking test set up
Figure 3.6 Three bale panel racking test set up
26
Figure 3.7 Load application during racking testing
3.6 Vertical compression testing
Vertical compression testing was carried out in order to assess the level of vertical load
that could safely be placed on top of ModCell panels. One can assess the level of load
the top element of the timber frame can safely carry by means of a simple calculation,
but working out the amount of load the straw and render can carry is more complex.
This needs to be established as when the timber is loaded it will deflect and as a result
load the straw and render. Under this loading the render cannot crack, fail or deform
excessively.
The test set up is shown in Figure 3.8. An existing 1.9m by 1.2m wide ModCell panel
was used for this test. The panel had been used for exposure testing and had been
exposed to the weather for a year prior to the vertical compression test. The timber
frame was constructed from three ply cross laminated timber. The top element of the
timber frame was cut at its joints to allow it to move freely downward when loaded
without any interference from the sides of the timber frame. The sides of the frame are
constrained to stop them rotating outward when load is applied to the top of the panel.
A vertical load is applied to the top element of the frame via a spreader beam using a
hydraulic jack and hand pump. The displacement of the top of the panel was measured
at its four corners using LVDT and the load was measured using a load cell. The data
was recorded on a System 6000 data scanner and computer.
27
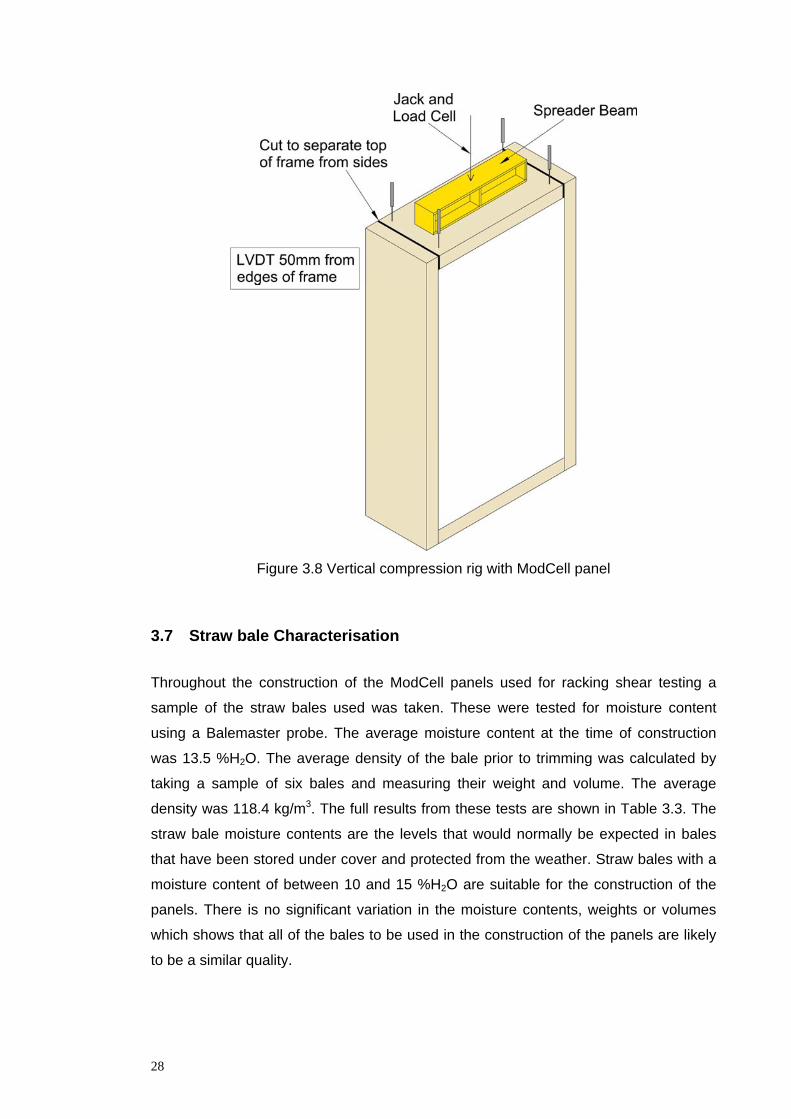
Figure 3.8 Vertical compression rig with ModCell panel
3.7 Straw bale Characterisation
Throughout the construction of the ModCell panels used for racking shear testing a
sample of the straw bales used was taken. These were tested for moisture content
using a Balemaster probe. The average moisture content at the time of construction
was 13.5 %H2O. The average density of the bale prior to trimming was calculated by
taking a sample of six bales and measuring their weight and volume. The average
density was 118.4 kg/m3. The full results from these tests are shown in Table 3.3. The
straw bale moisture contents are the levels that would normally be expected in bales
that have been stored under cover and protected from the weather. Straw bales with a
moisture content of between 10 and 15 %H2O are suitable for the construction of the
panels. There is no significant variation in the moisture contents, weights or volumes
which shows that all of the bales to be used in the construction of the panels are likely
to be a similar quality.
28
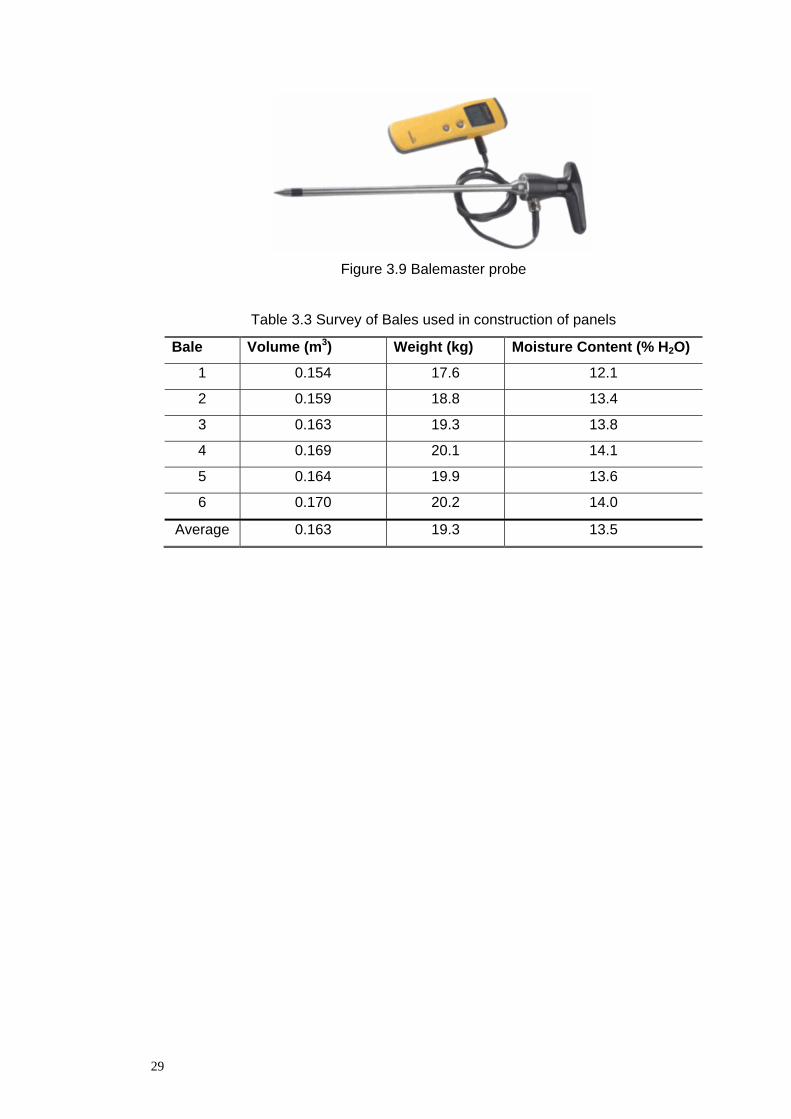
Figure 3.9 Balemaster probe
Table 3.3 Survey of Bales used in construction of panels
Bale Volume (m3) Weight (kg) Moisture Content (% H2O)
1 0.154 17.6 12.1
2 0.159 18.8 13.4
3 0.163 19.3 13.8
4 0.169 20.1 14.1
5 0.164 19.9 13.6
6 0.170 20.2 14.0
Average 0.163 19.3 13.5
29
4 Material and Component Properties
4.1 Properties of Render
Render specimens were tested in both flexure and compression at 7, 14, 28, 91, and
182 days. All of the specimens were made from the same sample of render taken
directly from the renderer’s spraying machine. At the time of making the specimens a
flow table value of 148 mm was recorded in accordance with BS EN 1015-3:1999.
Details of the specimens tested are shown in Table 4.1. All of the flexural strength tests
were carried out at a constant displacement rate of 0.3 mm/min. This displacement rate
ensured failure between 30 and 90 seconds as set out in BS EN 1015-11:1999. The
compressive strength tests were carried out with a constant displacement rate of 0.5
mm/min.
The flexural and compressive results for all the specimens tested are shown in Table
4.1. From the results both the flexural and compressive average strengths were
calculated for each specimen age. These are displayed in Figure 4.1 where age is
plotted against strength. The coefficient of variation for each age was also calculated
and is shown in Table 4.1.
30
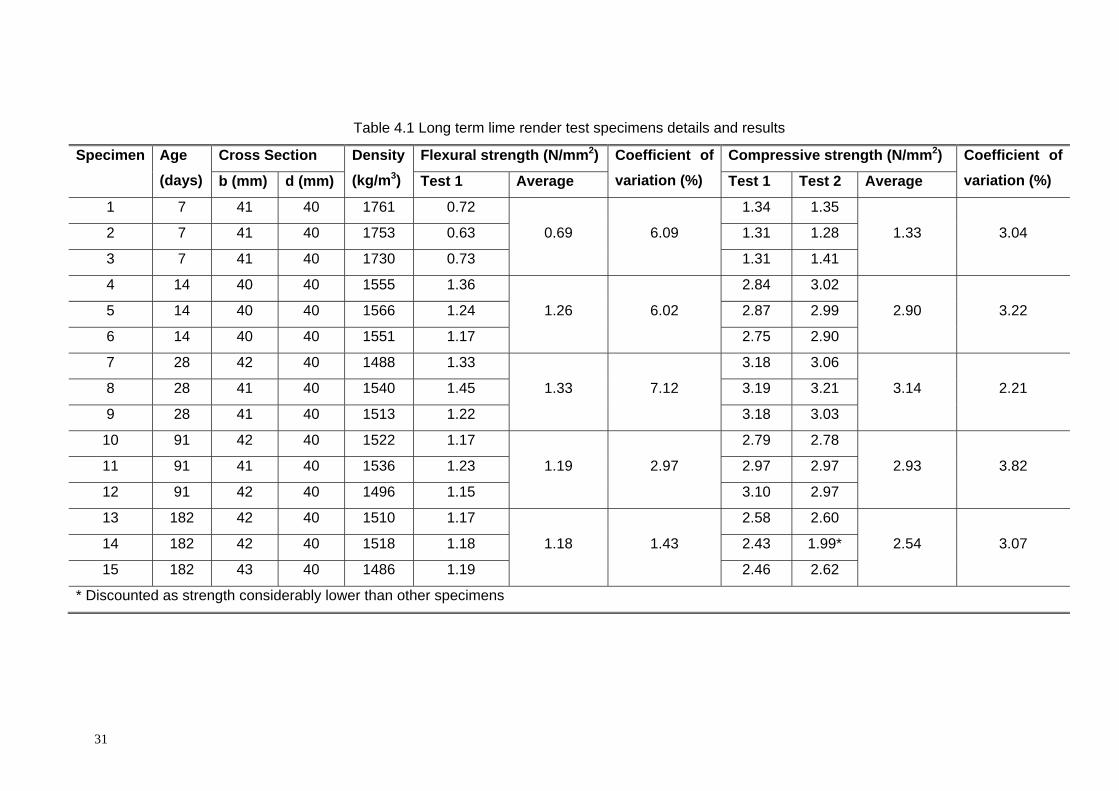
Table 4.1 Long term lime render test specimens details and results
Specimen Age Cross Section Density Flexural strength (N/mm2) Coefficient of Compressive strength (N/mm2) Coefficient of variation (%) (days) b (mm) d (mm) (kg/m3) Test 1 Average variation (%) Test 1 Test 2 Average
1 7 41 40 1761 0.72 1.34 1.35
1.33 3.042 7 41 40 1753 0.63 0.69 6.09 1.31 1.28
3 7 41 40 1730 0.73 1.31 1.41
4 14 40 40 1555 1.36 2.84 3.02
2.90 3.225 14 40 40 1566 1.24 1.26 6.02 2.87 2.99
6 14 40 40 1551 1.17 2.75 2.90
7 28 42 40 1488 1.33 3.18 3.06
3.14 2.218 28 41 40 1540 1.45 1.33 7.12 3.19 3.21
9 28 41 40 1513 1.22 3.18 3.03
10 91 42 40 1522 1.17 2.79 2.78
2.93 3.8211 91 41 40 1536 1.23 1.19 2.97 2.97 2.97
12 91 42 40 1496 1.15 3.10 2.97
13 182 42 40 1510 1.17 2.58 2.60
2.54 3.0714 182 42 40 1518 1.18 1.18 1.43 2.43 1.99*
15 182 43 40 1486 1.19 2.46 2.62
* Discounted as strength considerably lower than other specimens
31
Figure 4.1 Lime render strength
.
In both flexure and compression at seven days the render has roughly 50% of its final
strength (Figure 4.1). This is a very quick strength gain. In comparison a 1:1.5 NHL 3.5
mortar has 7% of its final compressive strength and 13% of its final flexural strength at
seven days (Allen et al. 2003). At 14 days the render has gained both its full flexural
and compressive strength. This is important as the completed panels are generally
transported to site 14 days after rendering has taken place. These results have
confirmed that there is little benefit in leaving the panels to cure for longer than 14 days
before transportation. The results also indicate that the Limetec Basecoat render
system being used is particularly suitable for this application as it gains strength very
quickly when compared to traditional lime renders. The fast gains in strength are due to
the cementitious constituents in the formulated render mix.
Both the flexural and compressive results show a drop-off in strength after 28 days. For
the flexural strength this drop-off levels at around 91 days whilst the compressive
strength drop-off appears to continue (Figure 4.1). The drop off in strength both in
32
flexure and compression is currently unexplained and requires further investigation.
One possible for it could be the development of micro cracks as the render is slowly
curing which will cause weaknesses when tested. The specimens were cured in their
moulds under sealed polythene for seven days and before being de-moulded and
transferred to a conditioning room with a constant temperature of 21oC and relative
humidity of 65%. As long as the renders strength levels off to acceptable values the
drop off in strength is not a problem.
Figure 4.1 shows error bars as a standard deviation percentage for all the specimens
tested. Generally as the age of the specimens increases the error reduces. This shows
that they may initially be curing at slightly different rates, which could be due to the
position the specimens were within the moulds or the conditioning room. The
specimens closest to the sides of the polythene may have cured more rapidly due to
leakage of air around the edges.
As the age of the render increased the amount of carbonation also increased. This was
tested following flexural testing. The freshly broken surface of the render was sprayed
with phenolphthalein solution. Figure 4.2 to Figure 4.6 show the amount of carbonation
for each specimen age. Note the solution turns pink on areas that have not carbonated.
At seven days there was no carbonation as the specimens were removed from their
moulds at five days and kept in sealed plastic bags until seven days and hence they
were not exposed to the air. At 182 days the render specimens are almost fully
carbonated with only a faint pink area in the centre. These results indicate that the 30
mm thick render on ModCell panels would take roughly 150 days to fully carbonate.
Figure 4.2 Carbonation of 7 day render specimen
33
Figure 4.3 Carbonation of 14 day render specimen
Figure 4.4 Carbonation of 28 day render specimen
Figure 4.5 Carbonation of 91 day render specimen
34
Figure 4.6 Carbonation of 182 day render specimen
4.2 Performance of Joints in Combined Shear and Tension
Joint testing was carried out for the reasons described in Section 3.4 of this report. All
of the specimens were constructed and tested in the Structures Laboratory at the
University of Bath by the author. The results of these tests are presented and
discussed in the following sections of this report.
4.2.1 Joint Details
Three different designs of joint were subjected to vertical pull out test in order to
determine which was the most suitable for use in ModCell panels. The three types of
joint tested were: screw connected; dowel connected; and dovetailed. Details of these
joints are shown in Figure 4.7, Figure 4.8 and Table 4.2. The one metre lengths of
timber used to construct the joints were double ended to allow them to be used for two
different joint tests. There were four complete specimens for each type of joint, so a
maximum of eight tests could be undertaken for each type of joint. The screw
connected joint was tested with eight screws being loaded axially and four screws
being loaded in shear.
35
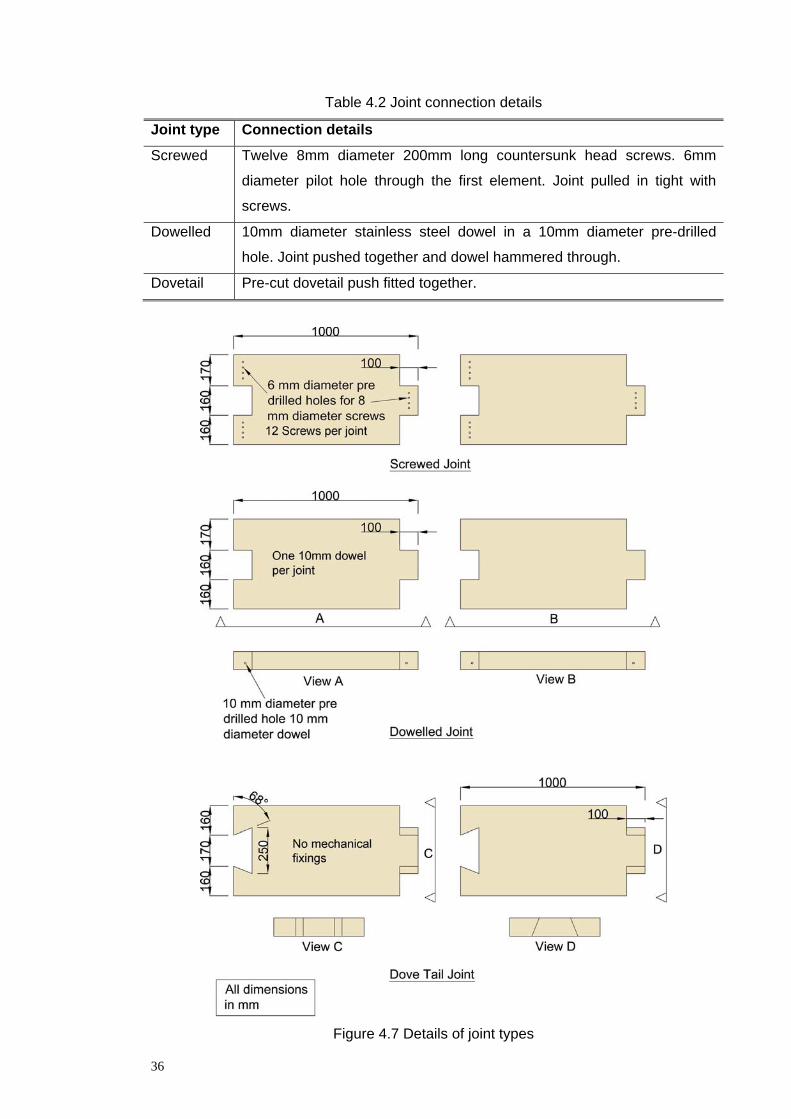
Table 4.2 Joint connection details
Joint type Connection details
Screwed Twelve 8mm diameter 200mm long countersunk head screws. 6mm
diameter pilot hole through the first element. Joint pulled in tight with
screws.
Dowelled
Dovetail
10mm diameter stainless steel dowel in a 10mm diameter pre-drilled
hole. Joint pushed together and dowel hammered through.
Pre-cut dovetail push fitted together.
Figure 4.7 Details of joint types
36
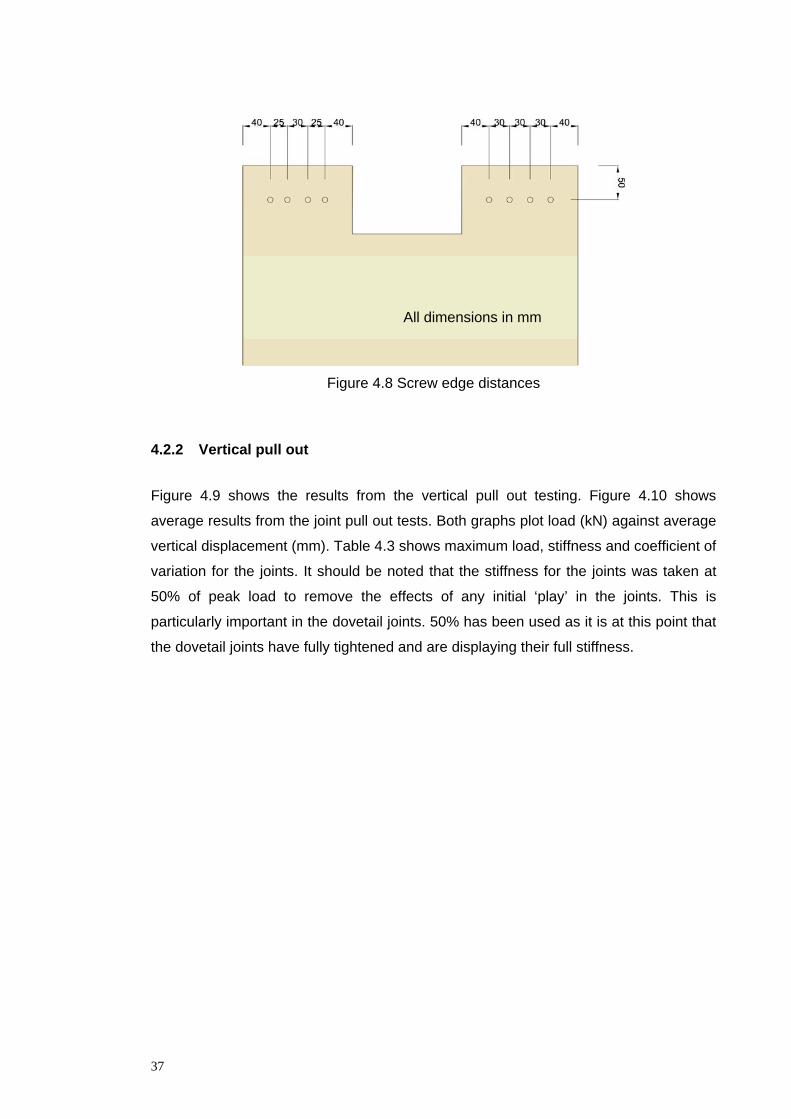
All dimensions in mm
Figure 4.8 Screw edge distances
4.2.2 Vertical pull out
Figure 4.9 shows the results from the vertical pull out testing. Figure 4.10 shows
average results from the joint pull out tests. Both graphs plot load (kN) against average
vertical displacement (mm). Table 4.3 shows maximum load, stiffness and coefficient of
variation for the joints. It should be noted that the stiffness for the joints was taken at
50% of peak load to remove the effects of any initial ‘play’ in the joints. This is
particularly important in the dovetail joints. 50% has been used as it is at this point that
the dovetail joints have fully tightened and are displaying their full stiffness.
37
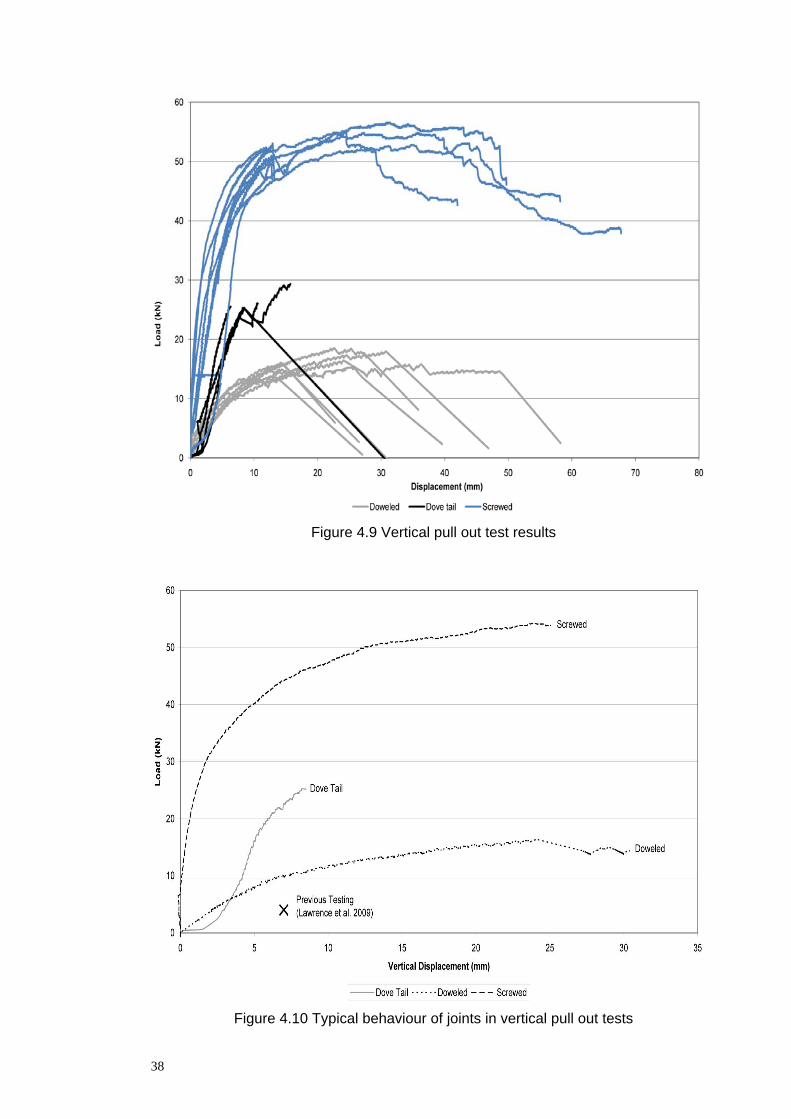
Figure 4.9 Vertical pull out test results
Figure 4.10 Typical behaviour of joints in vertical pull out tests
38
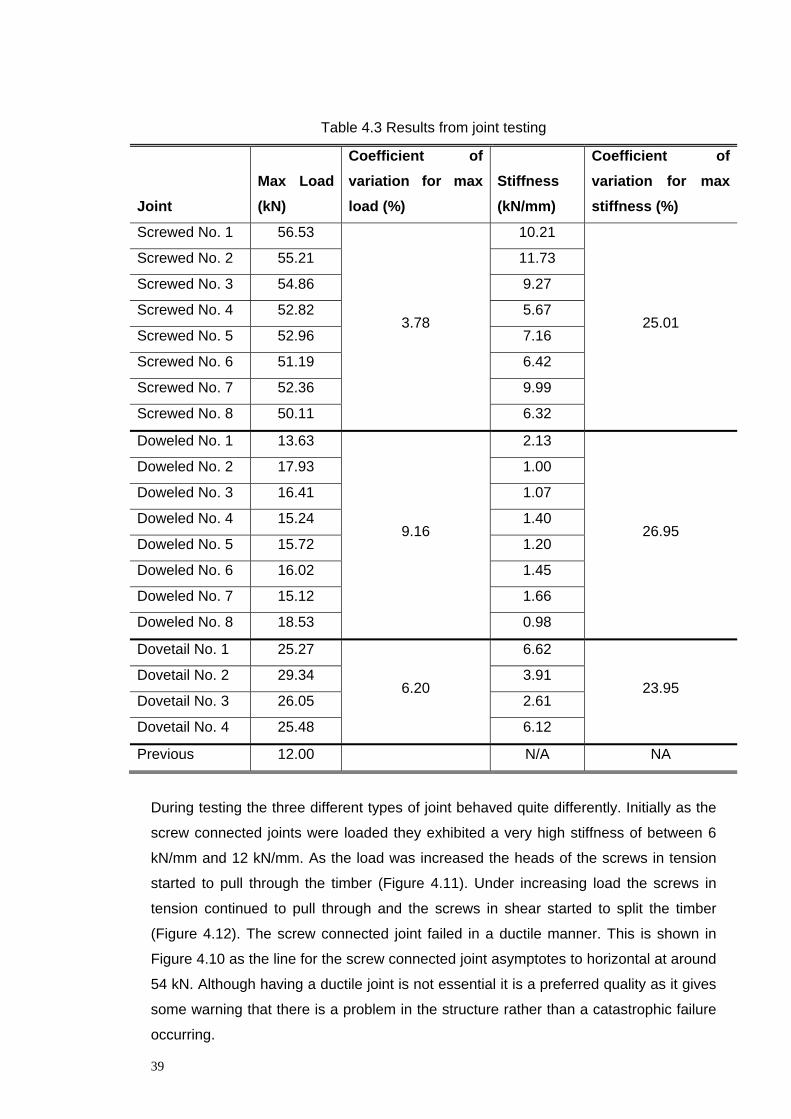
Table 4.3 Results from joint testing
Joint Max Load (kN)
Coefficient of variation for max load (%)
Stiffness (kN/mm)
Coefficient of variation for max stiffness (%)
Screwed No. 1 56.53 10.21
25.01
Screwed No. 2 55.21 11.73
Screwed No. 3 54.86 9.27
Screwed No. 4 52.82 3.78
5.67
Screwed No. 5 52.96 7.16
Screwed No. 6 51.19 6.42
Screwed No. 7 52.36 9.99
Screwed No. 8 50.11 6.32
Doweled No. 1 13.63 2.13
26.95
Doweled No. 2 17.93 1.00
Doweled No. 3 16.41 1.07
Doweled No. 4 15.24 9.16
1.40
Doweled No. 5 15.72 1.20
Doweled No. 6 16.02 1.45
Doweled No. 7 15.12 1.66
Doweled No. 8 18.53 0.98
Dovetail No. 1 25.27 6.62
23.95 Dovetail No. 2 29.34
6.20 3.91
Dovetail No. 3 26.05 2.61
Dovetail No. 4 25.48 6.12
Previous 12.00 N/A NA
During testing the three different types of joint behaved quite differently. Initially as the
screw connected joints were loaded they exhibited a very high stiffness of between 6
kN/mm and 12 kN/mm. As the load was increased the heads of the screws in tension
started to pull through the timber (Figure 4.11). Under increasing load the screws in
tension continued to pull through and the screws in shear started to split the timber
(Figure 4.12). The screw connected joint failed in a ductile manner. This is shown in
Figure 4.10 as the line for the screw connected joint asymptotes to horizontal at around
54 kN. Although having a ductile joint is not essential it is a preferred quality as it gives
some warning that there is a problem in the structure rather than a catastrophic failure
occurring.
39
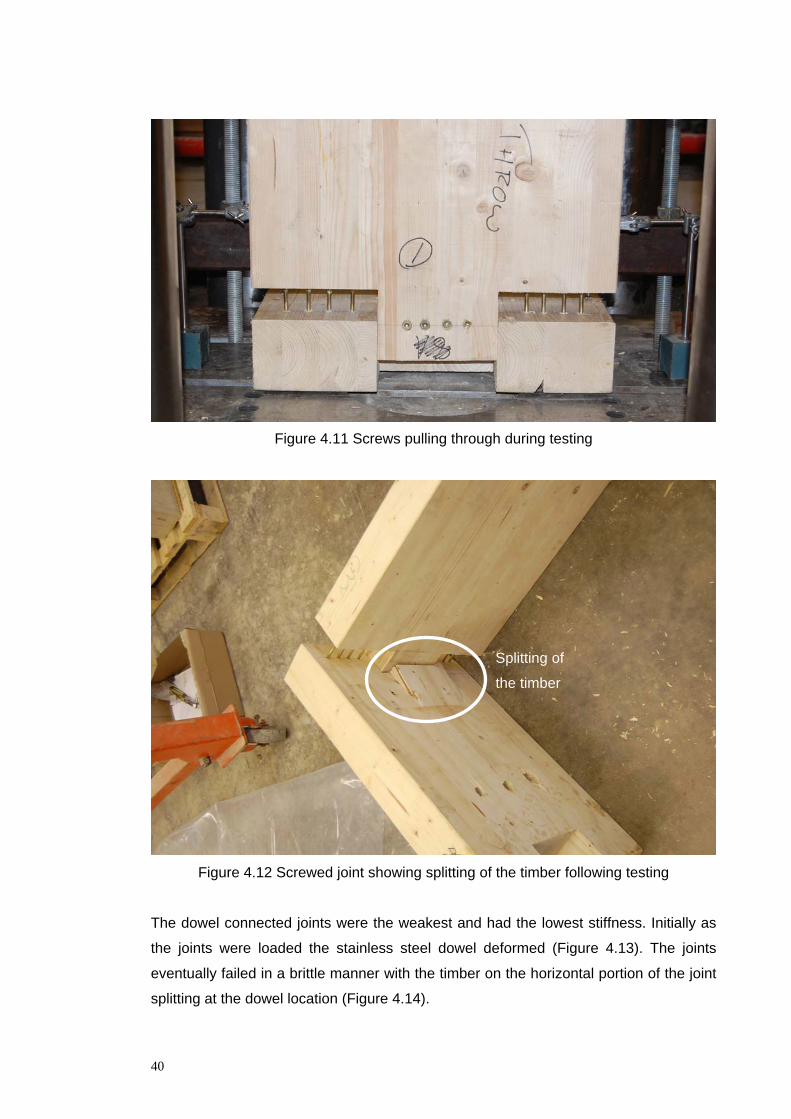
Figure 4.11 Screws pulling through during testing
Splitting of
the timber
Figure 4.12 Screwed joint showing splitting of the timber following testing
The dowel connected joints were the weakest and had the lowest stiffness. Initially as
the joints were loaded the stainless steel dowel deformed (Figure 4.13). The joints
eventually failed in a brittle manner with the timber on the horizontal portion of the joint
splitting at the dowel location (Figure 4.14).
40
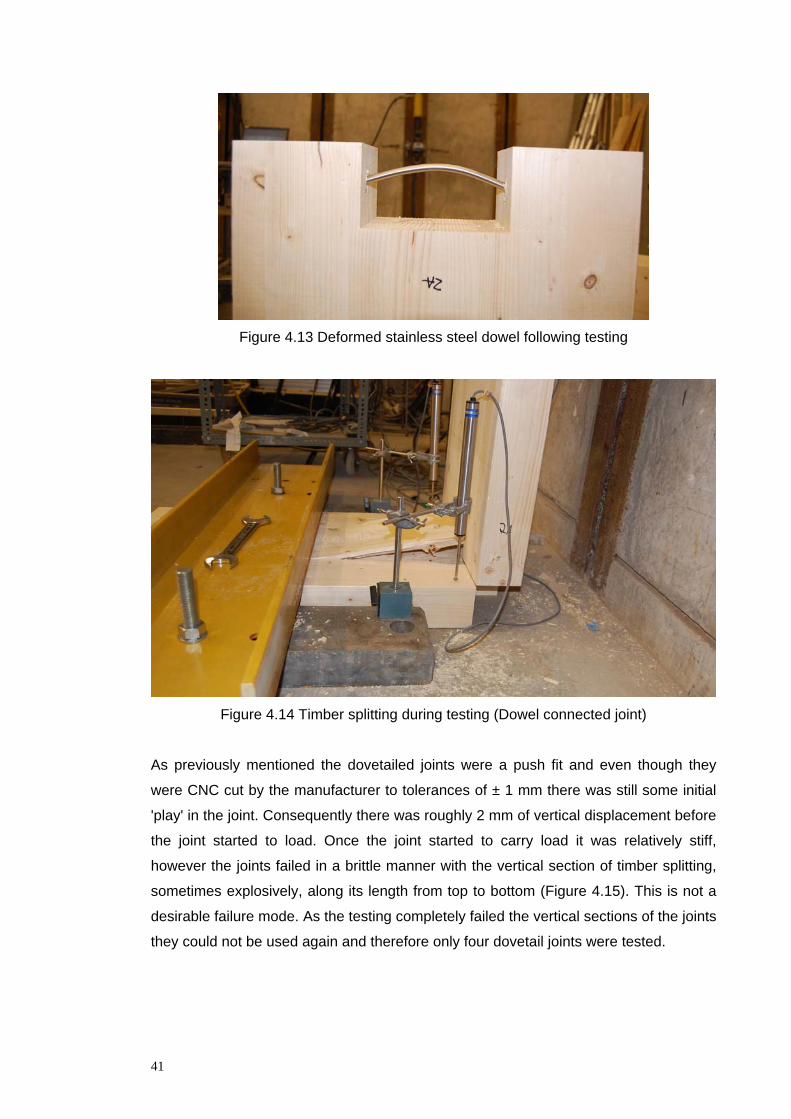
Figure 4.13 Deformed stainless steel dowel following testing
Figure 4.14 Timber splitting during testing (Dowel connected joint)
As previously mentioned the dovetailed joints were a push fit and even though they
were CNC cut by the manufacturer to tolerances of ± 1 mm there was still some initial
'play' in the joint. Consequently there was roughly 2 mm of vertical displacement before
the joint started to load. Once the joint started to carry load it was relatively stiff,
however the joints failed in a brittle manner with the vertical section of timber splitting,
sometimes explosively, along its length from top to bottom (Figure 4.15). This is not a
desirable failure mode. As the testing completely failed the vertical sections of the joints
they could not be used again and therefore only four dovetail joints were tested.
41
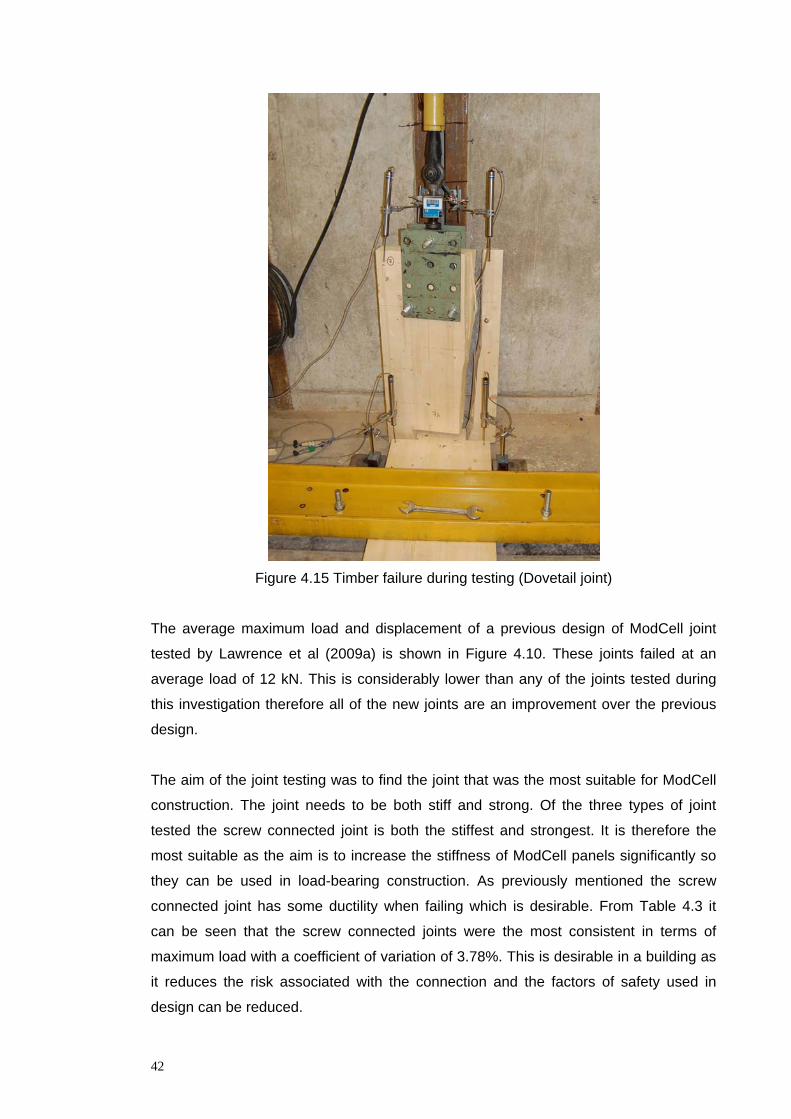
Figure 4.15 Timber failure during testing (Dovetail joint)
The average maximum load and displacement of a previous design of ModCell joint
tested by Lawrence et al (2009a) is shown in Figure 4.10. These joints failed at an
average load of 12 kN. This is considerably lower than any of the joints tested during
this investigation therefore all of the new joints are an improvement over the previous
design.
The aim of the joint testing was to find the joint that was the most suitable for ModCell
construction. The joint needs to be both stiff and strong. Of the three types of joint
tested the screw connected joint is both the stiffest and strongest. It is therefore the
most suitable as the aim is to increase the stiffness of ModCell panels significantly so
they can be used in load-bearing construction. As previously mentioned the screw
connected joint has some ductility when failing which is desirable. From Table 4.3 it
can be seen that the screw connected joints were the most consistent in terms of
maximum load with a coefficient of variation of 3.78%. This is desirable in a building as
it reduces the risk associated with the connection and the factors of safety used in
design can be reduced.
42
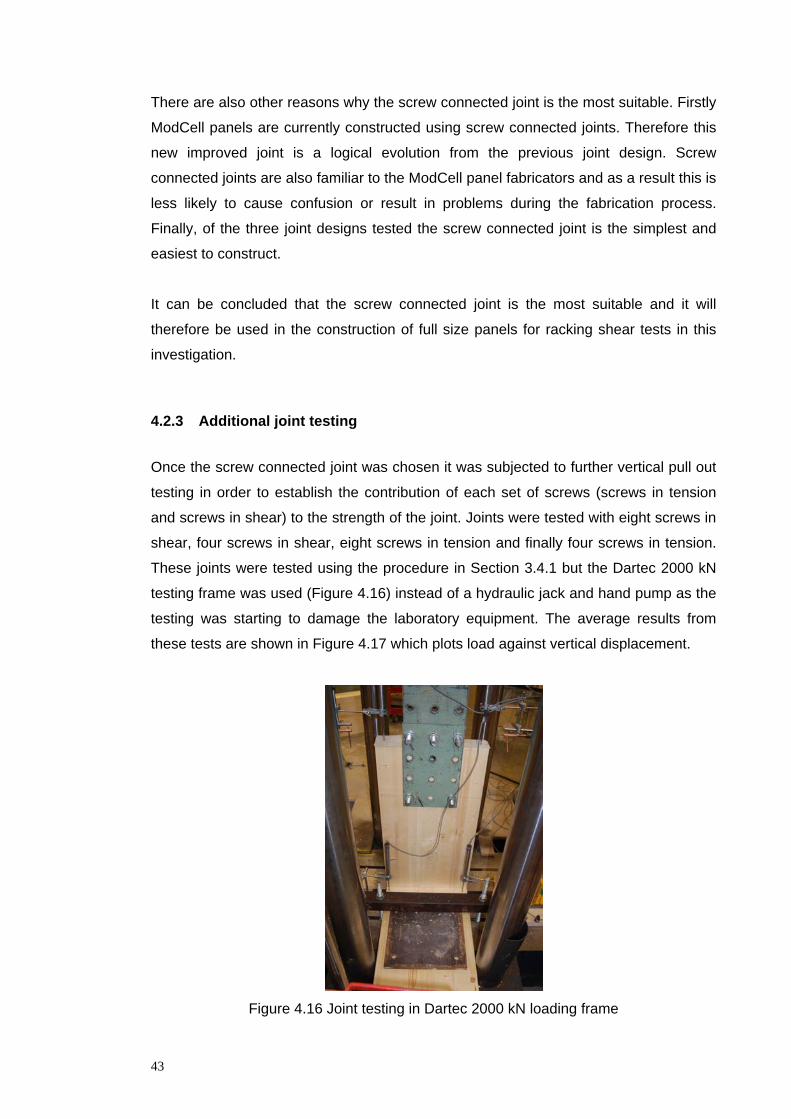
There are also other reasons why the screw connected joint is the most suitable. Firstly
ModCell panels are currently constructed using screw connected joints. Therefore this
new improved joint is a logical evolution from the previous joint design. Screw
connected joints are also familiar to the ModCell panel fabricators and as a result this is
less likely to cause confusion or result in problems during the fabrication process.
Finally, of the three joint designs tested the screw connected joint is the simplest and
easiest to construct.
It can be concluded that the screw connected joint is the most suitable and it will
therefore be used in the construction of full size panels for racking shear tests in this
investigation.
4.2.3 Additional joint testing
Once the screw connected joint was chosen it was subjected to further vertical pull out
testing in order to establish the contribution of each set of screws (screws in tension
and screws in shear) to the strength of the joint. Joints were tested with eight screws in
shear, four screws in shear, eight screws in tension and finally four screws in tension.
These joints were tested using the procedure in Section 3.4.1 but the Dartec 2000 kN
testing frame was used (Figure 4.16) instead of a hydraulic jack and hand pump as the
testing was starting to damage the laboratory equipment. The average results from
these tests are shown in Figure 4.17 which plots load against vertical displacement.
Figure 4.16 Joint testing in Dartec 2000 kN loading frame
43
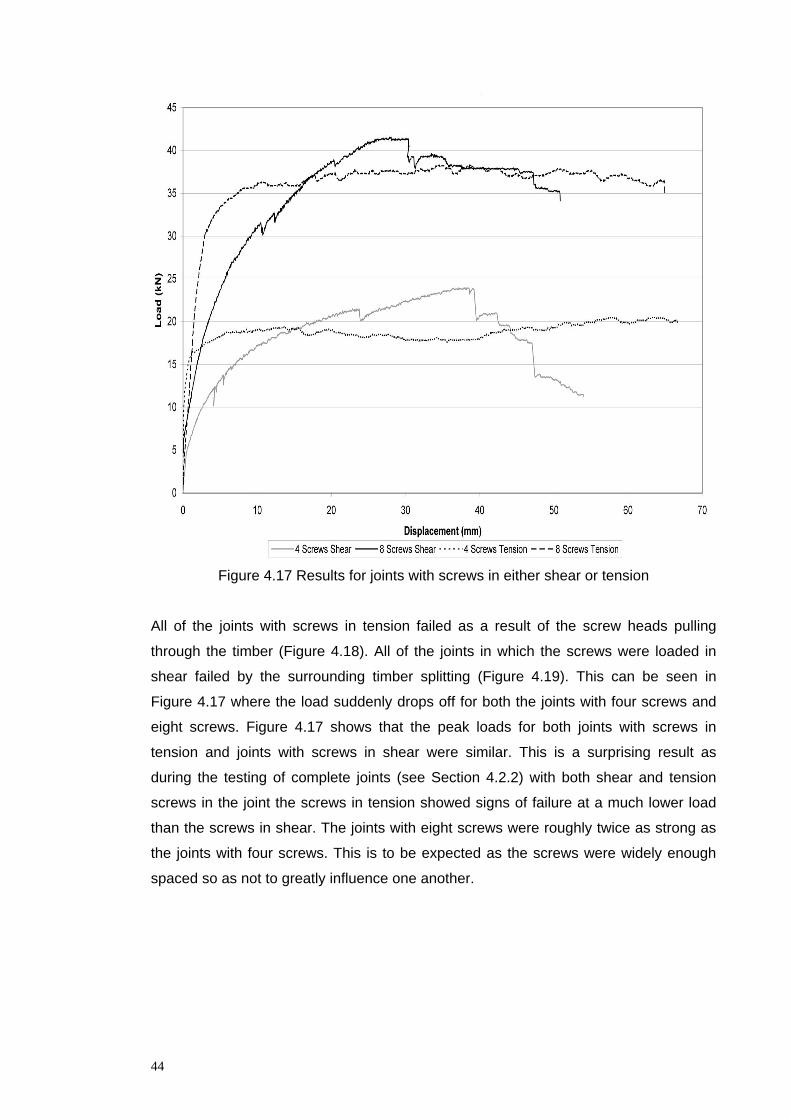
Figure 4.17 Results for joints with screws in either shear or tension
All of the joints with screws in tension failed as a result of the screw heads pulling
through the timber (Figure 4.18). All of the joints in which the screws were loaded in
shear failed by the surrounding timber splitting (Figure 4.19). This can be seen in
Figure 4.17 where the load suddenly drops off for both the joints with four screws and
eight screws. Figure 4.17 shows that the peak loads for both joints with screws in
tension and joints with screws in shear were similar. This is a surprising result as
during the testing of complete joints (see Section 4.2.2) with both shear and tension
screws in the joint the screws in tension showed signs of failure at a much lower load
than the screws in shear. The joints with eight screws were roughly twice as strong as
the joints with four screws. This is to be expected as the screws were widely enough
spaced so as not to greatly influence one another.
44
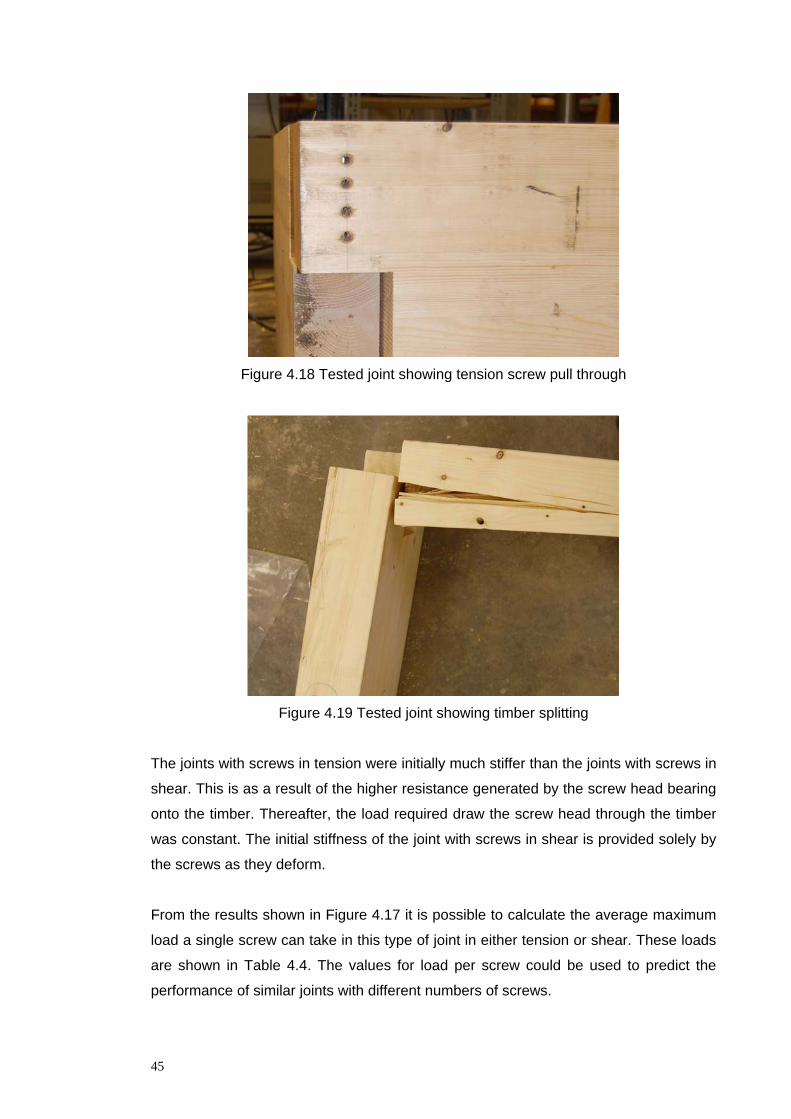
Figure 4.18 Tested joint showing tension screw pull through
Figure 4.19 Tested joint showing timber splitting
The joints with screws in tension were initially much stiffer than the joints with screws in
shear. This is as a result of the higher resistance generated by the screw head bearing
onto the timber. Thereafter, the load required draw the screw head through the timber
was constant. The initial stiffness of the joint with screws in shear is provided solely by
the screws as they deform.
From the results shown in Figure 4.17 it is possible to calculate the average maximum
load a single screw can take in this type of joint in either tension or shear. These loads
are shown in Table 4.4. The values for load per screw could be used to predict the
performance of similar joints with different numbers of screws.
45
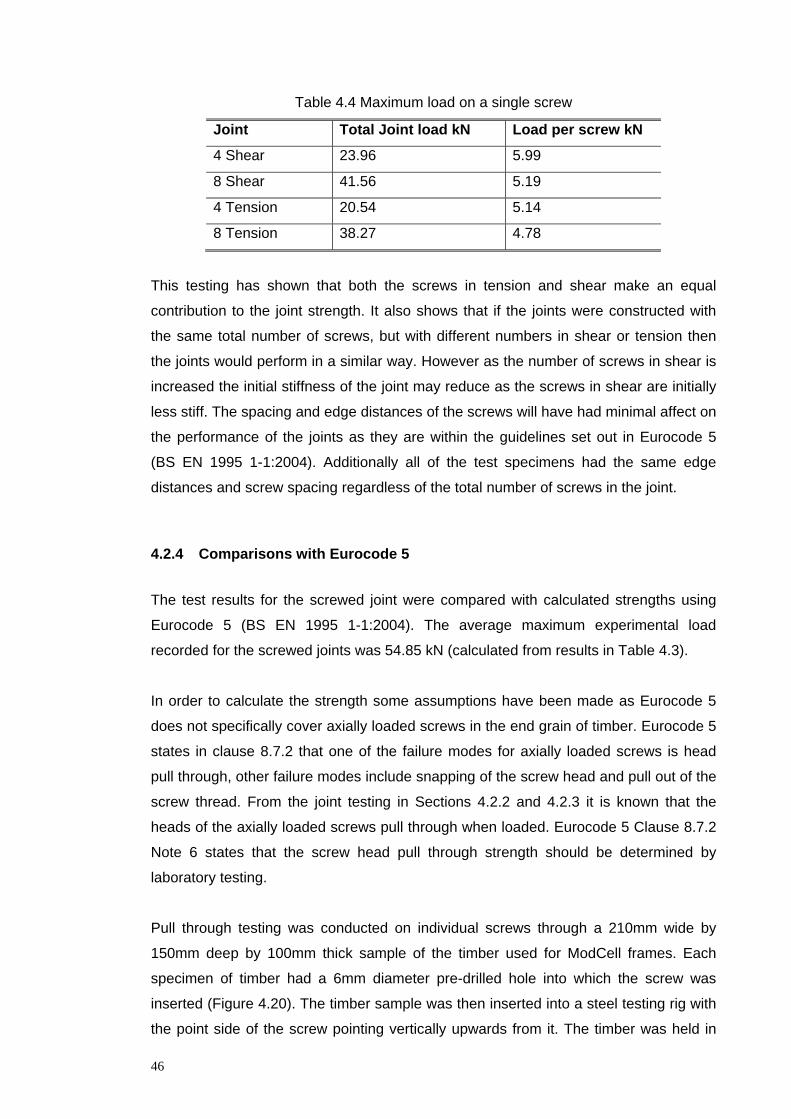
Table 4.4 Maximum load on a single screw
Joint Total Joint load kN Load per screw kN
4 Shear 23.96 5.99
8 Shear 41.56 5.19
4 Tension 20.54 5.14
8 Tension 38.27 4.78
This testing has shown that both the screws in tension and shear make an equal
contribution to the joint strength. It also shows that if the joints were constructed with
the same total number of screws, but with different numbers in shear or tension then
the joints would perform in a similar way. However as the number of screws in shear is
increased the initial stiffness of the joint may reduce as the screws in shear are initially
less stiff. The spacing and edge distances of the screws will have had minimal affect on
the performance of the joints as they are within the guidelines set out in Eurocode 5
(BS EN 1995 1-1:2004). Additionally all of the test specimens had the same edge
distances and screw spacing regardless of the total number of screws in the joint.
4.2.4 Comparisons with Eurocode 5
The test results for the screwed joint were compared with calculated strengths using
Eurocode 5 (BS EN 1995 1-1:2004). The average maximum experimental load
recorded for the screwed joints was 54.85 kN (calculated from results in Table 4.3).
In order to calculate the strength some assumptions have been made as Eurocode 5
does not specifically cover axially loaded screws in the end grain of timber. Eurocode 5
states in clause 8.7.2 that one of the failure modes for axially loaded screws is head
pull through, other failure modes include snapping of the screw head and pull out of the
screw thread. From the joint testing in Sections 4.2.2 and 4.2.3 it is known that the
heads of the axially loaded screws pull through when loaded. Eurocode 5 Clause 8.7.2
Note 6 states that the screw head pull through strength should be determined by
laboratory testing.
Pull through testing was conducted on individual screws through a 210mm wide by
150mm deep by 100mm thick sample of the timber used for ModCell frames. Each
specimen of timber had a 6mm diameter pre-drilled hole into which the screw was
inserted (Figure 4.20). The timber sample was then inserted into a steel testing rig with
the point side of the screw pointing vertically upwards from it. The timber was held in
46
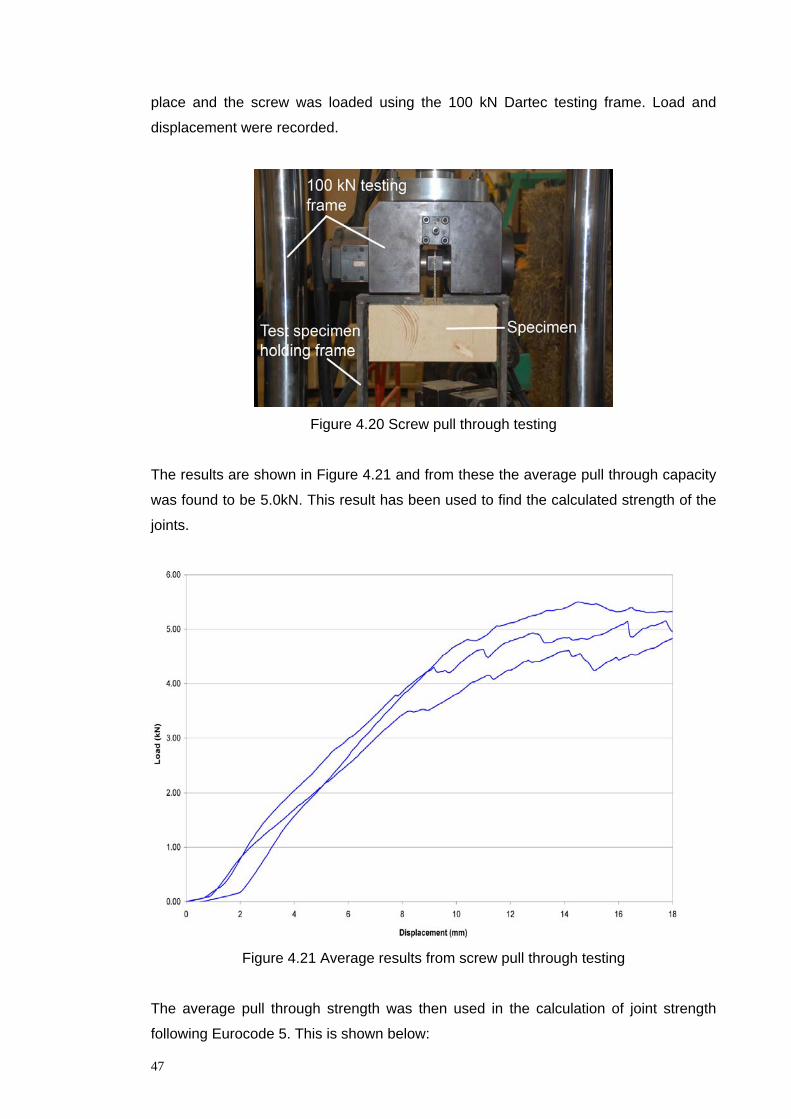
place and the screw was loaded using the 100 kN Dartec testing frame. Load and
displacement were recorded.
Figure 4.20 Screw pull through testing
The results are shown in Figure 4.21 and from these the average pull through capacity
was found to be 5.0kN. This result has been used to find the calculated strength of the
joints.
Figure 4.21 Average results from screw pull through testing
The average pull through strength was then used in the calculation of joint strength
following Eurocode 5. This is shown below:
47
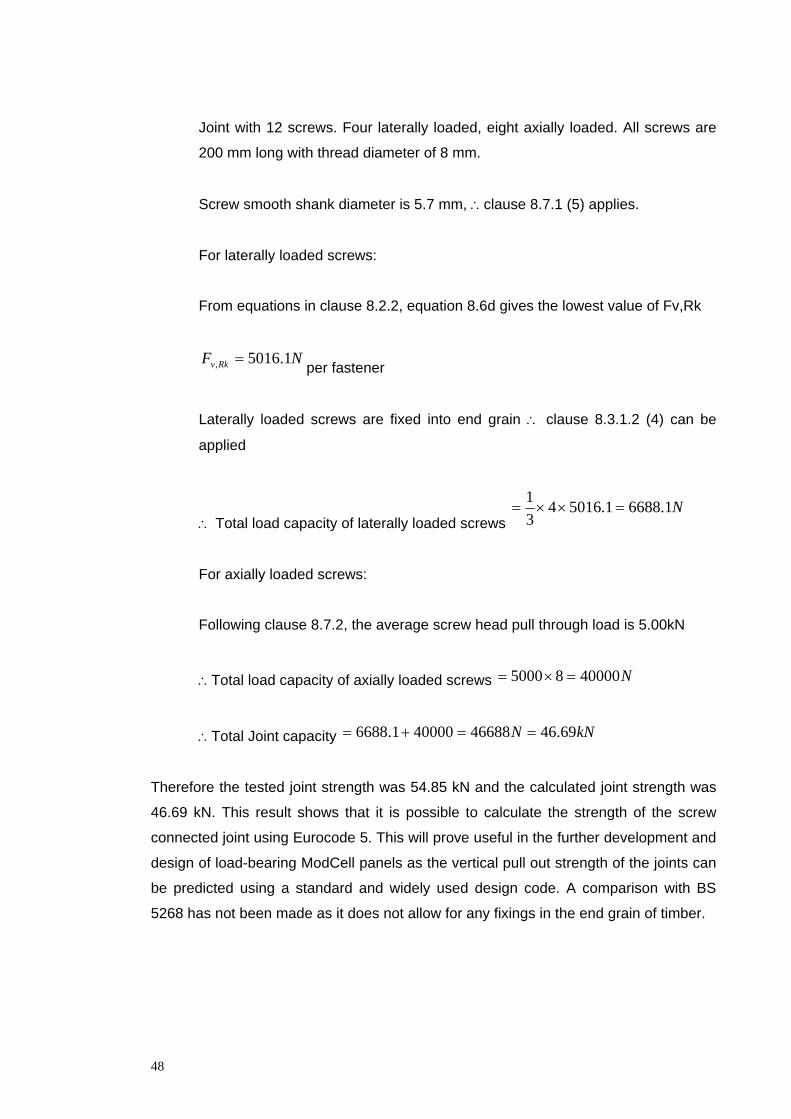
Joint with 12 screws. Four laterally loaded, eight axially loaded. All screws are
200 mm long with thread diameter of 8 mm.
Screw smooth shank diameter is 5.7 mm, ∴clause 8.7.1 (5) applies.
For laterally loaded screws:
From equations in clause 8.2.2, equation 8.6d gives the lowest value of Fv,Rk
Fv,Rk = 5016.1N per fastener
Laterally loaded screws are fixed into end grain ∴ clause 8.3.1.2 (4) can be
applied
1 = × 4 × 5016.1 = 6688.1N
∴ Total load capacity of laterally loaded screws 3
For axially loaded screws:
Following clause 8.7.2, the average screw head pull through load is 5.00kN
∴Total load capacity of axially loaded screws = 5000 × 8 = 40000N
∴Total Joint capacity = 6688.1+ 40000 = 46688N = 46.69kN
Therefore the tested joint strength was 54.85 kN and the calculated joint strength was
46.69 kN. This result shows that it is possible to calculate the strength of the screw
connected joint using Eurocode 5. This will prove useful in the further development and
design of load-bearing ModCell panels as the vertical pull out strength of the joints can
be predicted using a standard and widely used design code. A comparison with BS
5268 has not been made as it does not allow for any fixings in the end grain of timber.
48
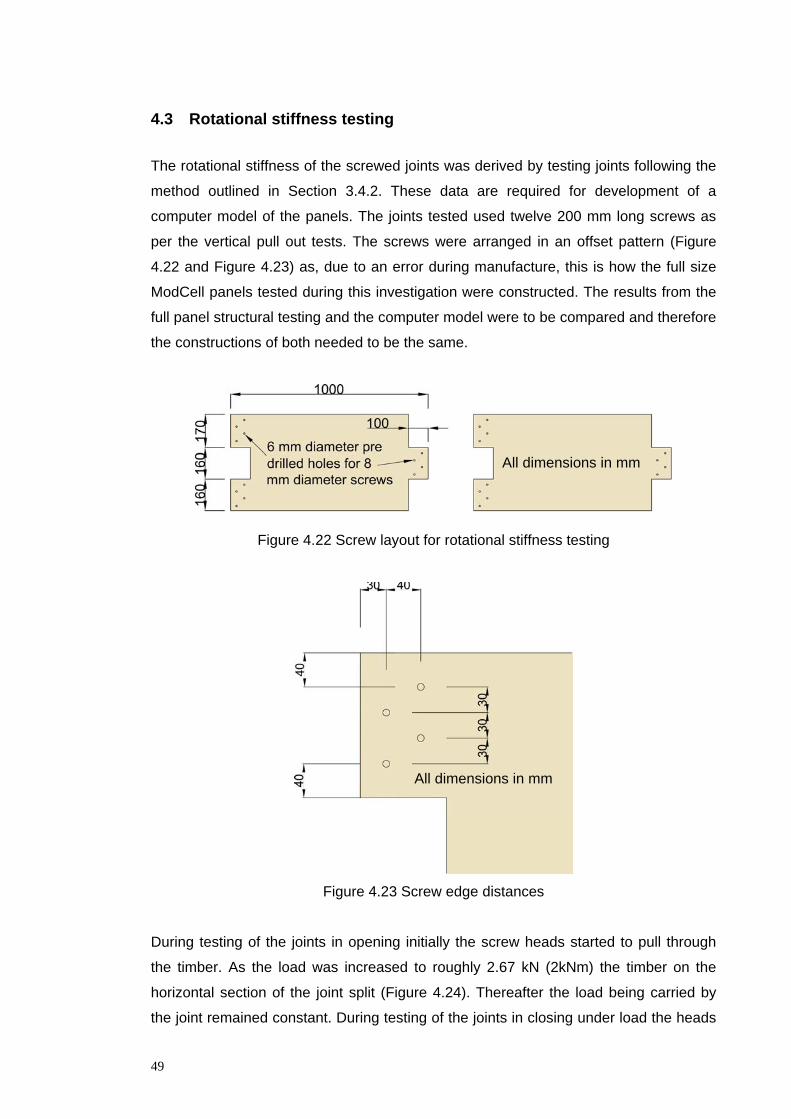
4.3 Rotational stiffness testing
The rotational stiffness of the screwed joints was derived by testing joints following the
method outlined in Section 3.4.2. These data are required for development of a
computer model of the panels. The joints tested used twelve 200 mm long screws as
per the vertical pull out tests. The screws were arranged in an offset pattern (Figure
4.22 and Figure 4.23) as, due to an error during manufacture, this is how the full size
ModCell panels tested during this investigation were constructed. The results from the
full panel structural testing and the computer model were to be compared and therefore
the constructions of both needed to be the same.
All dimensions in mm
Figure 4.22 Screw layout for rotational stiffness testing
All dimensions in mm
Figure 4.23 Screw edge distances
During testing of the joints in opening initially the screw heads started to pull through
the timber. As the load was increased to roughly 2.67 kN (2kNm) the timber on the
horizontal section of the joint split (Figure 4.24). Thereafter the load being carried by
the joint remained constant. During testing of the joints in closing under load the heads
49
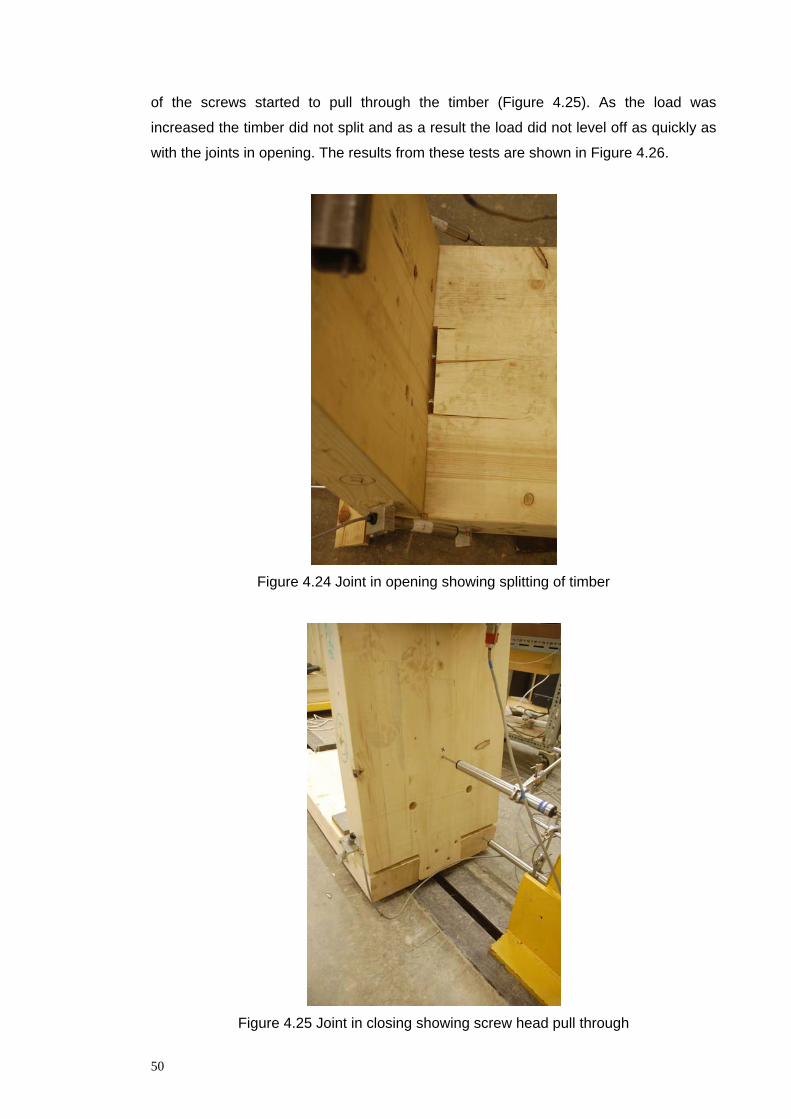
of the screws started to pull through the timber (Figure 4.25). As the load was
increased the timber did not split and as a result the load did not level off as quickly as
with the joints in opening. The results from these tests are shown in Figure 4.26.
Figure 4.24 Joint in opening showing splitting of timber
Figure 4.25 Joint in closing showing screw head pull through
50
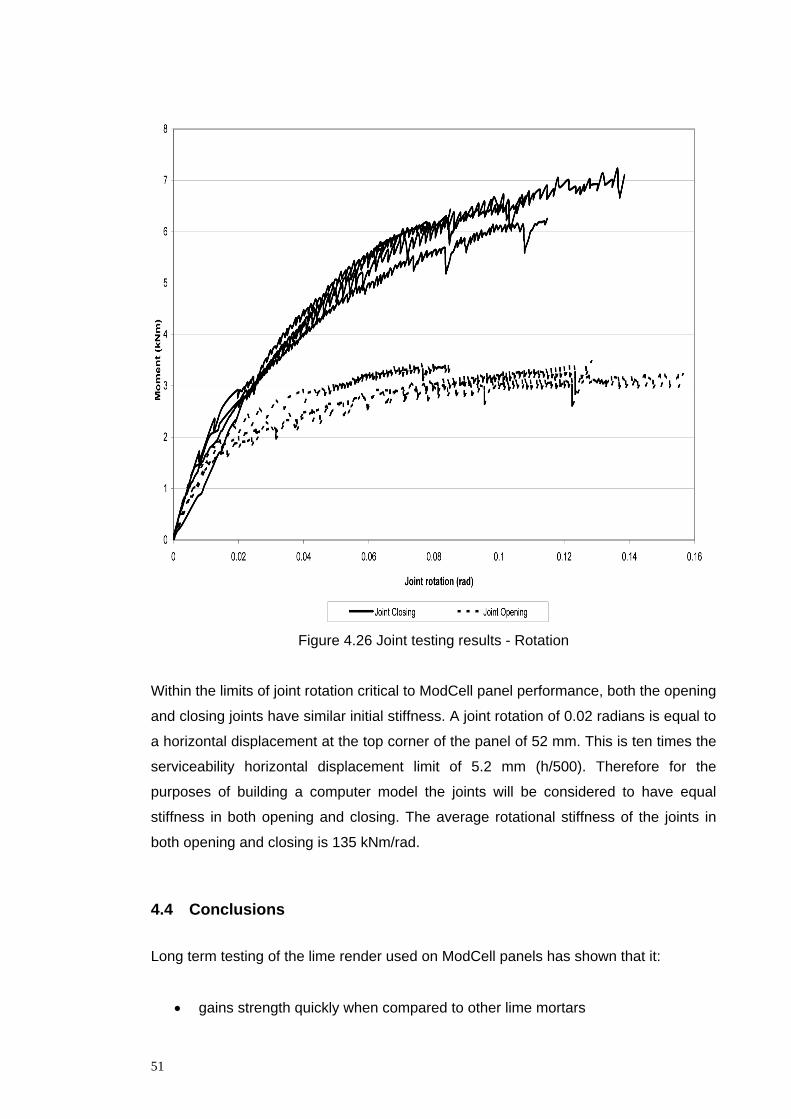
Figure 4.26 Joint testing results - Rotation
Within the limits of joint rotation critical to ModCell panel performance, both the opening
and closing joints have similar initial stiffness. A joint rotation of 0.02 radians is equal to
a horizontal displacement at the top corner of the panel of 52 mm. This is ten times the
serviceability horizontal displacement limit of 5.2 mm (h/500). Therefore for the
purposes of building a computer model the joints will be considered to have equal
stiffness in both opening and closing. The average rotational stiffness of the joints in
both opening and closing is 135 kNm/rad.
4.4 Conclusions
Long term testing of the lime render used on ModCell panels has shown that it:
• gains strength quickly when compared to other lime mortars
51
• the strength reduces after 28 days and the flexural strength levels off at 91 days
but the compressive strength continues to drop
• the strength drops may be due to micro cracks and further investigation is
required.
From the first set of joint tests, the following conclusions have been drawn about the
screw connected joint:
• Strongest
• Stiffest
• Easiest to construct
The further testing on joints with screws in only one direction (either in tension or
shear) has shown that both sets of screws make an equal contribution to the strength
of the joints. It has also been shown that EC5 can be used to correctly calculate the
design strengths of this type of joint which will help greatly in the design of ModCell
panels.
Finally the rotational stiffness of the screw connected joint used ModCell panels for full
scale racking shear testing has been shown to be 135 kNm/rad. These tests have also
shown that within the limits of joint rotation critical to the performance of ModCell
panels the stiffness of the joints in both opening and closing is the same.
52
5 Racking Shear Tests on Panels
5.1 Introduction
During racking shear testing two sets of panels were tested. Initially two panels from
Grand Designs Live were tested. Following this four laboratory built panels were tested.
This chapter examines both of these set of tests.
5.2 Grand Designs Panels
Two ModCell panels from “The House That Kevin Built” (part of the Grand Designs Live
project at Excel in May 2008) were tested in racking shear. The house was the first
time that load-bearing ModCell panels had been used. The panels were constructed in
a temporary factory close to the house site by Agrifibre Technologies before being
delivered to site. The house was constructed between 4th May 2008 and 9th May 2008
using ModCell for the ground floor with other building technologies making up the rest
of the house. Once completed, the house remained onsite for a week before being
dismantled and put into storage. Following this two of the panels were delivered to The
University of Bath Structures Laboratory on 2nd July 2008, the details of which are
shown in Figure 5.1 and Figure 5.2.
The panels were constructed from 100 mm thick glue laminated timber with 3 part
finger joints at each corner screwed together with 200 mm long 8 mm diameter screws.
The vertical steel was 10 mm diameter with the corner braces 12 mm diameter. Details
of the panels are shown in Figure 5.1 and Figure 5.2.
53
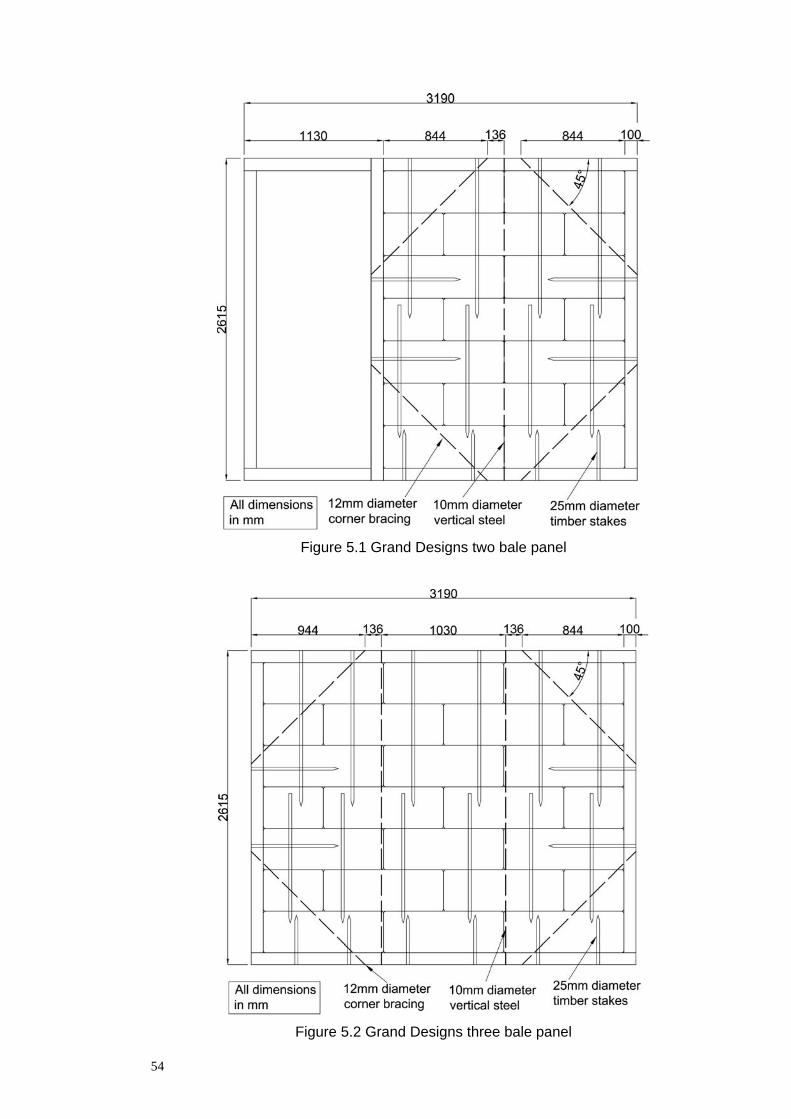
Figure 5.1 Grand Designs two bale panel
Figure 5.2 Grand Designs three bale panel
54
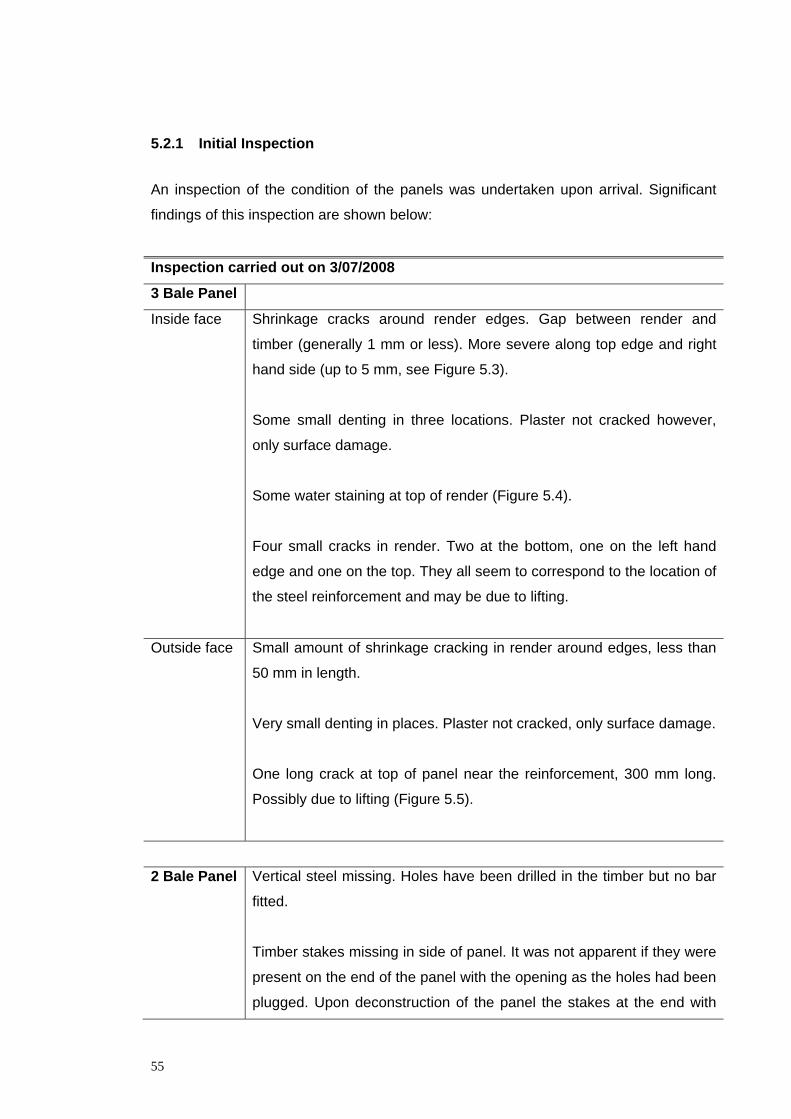
5.2.1 Initial Inspection
An inspection of the condition of the panels was undertaken upon arrival. Significant
findings of this inspection are shown below:
Inspection carried out on 3/07/2008
3 Bale Panel
Inside face
Outside face
Shrinkage cracks around render edges. Gap between render and
timber (generally 1 mm or less). More severe along top edge and right
hand side (up to 5 mm, see Figure 5.3).
Some small denting in three locations. Plaster not cracked however,
only surface damage.
Some water staining at top of render (Figure 5.4).
Four small cracks in render. Two at the bottom, one on the left hand
edge and one on the top. They all seem to correspond to the location of
the steel reinforcement and may be due to lifting.
Small amount of shrinkage cracking in render around edges, less than
50 mm in length.
Very small denting in places. Plaster not cracked, only surface damage.
One long crack at top of panel near the reinforcement, 300 mm long.
Possibly due to lifting (Figure 5.5).
Vertical steel missing. Holes have been drilled in the timber but no bar
fitted.
2 Bale Panel
Timber stakes missing in side of panel. It was not apparent if they were
present on the end of the panel with the opening as the holes had been
plugged. Upon deconstruction of the panel the stakes at the end with
55
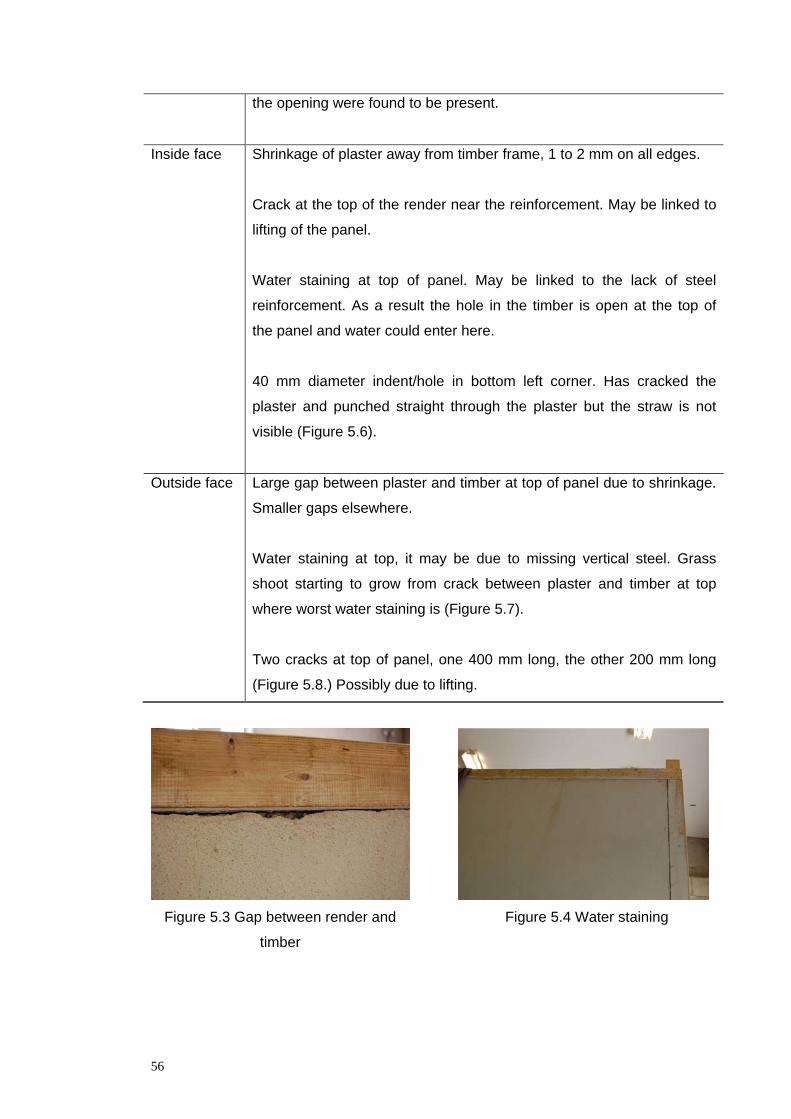
Inside face
Outside face
the opening were found to be present.
Shrinkage of plaster away from timber frame, 1 to 2 mm on all edges.
Crack at the top of the render near the reinforcement. May be linked to
lifting of the panel.
Water staining at top of panel. May be linked to the lack of steel
reinforcement. As a result the hole in the timber is open at the top of
the panel and water could enter here.
40 mm diameter indent/hole in bottom left corner. Has cracked the
plaster and punched straight through the plaster but the straw is not
visible (Figure 5.6).
Large gap between plaster and timber at top of panel due to shrinkage.
Smaller gaps elsewhere.
Water staining at top, it may be due to missing vertical steel. Grass
shoot starting to grow from crack between plaster and timber at top
where worst water staining is (Figure 5.7).
Two cracks at top of panel, one 400 mm long, the other 200 mm long
(Figure 5.8.) Possibly due to lifting.
Figure 5.3 Gap between render and Figure 5.4 Water staining
timber
56
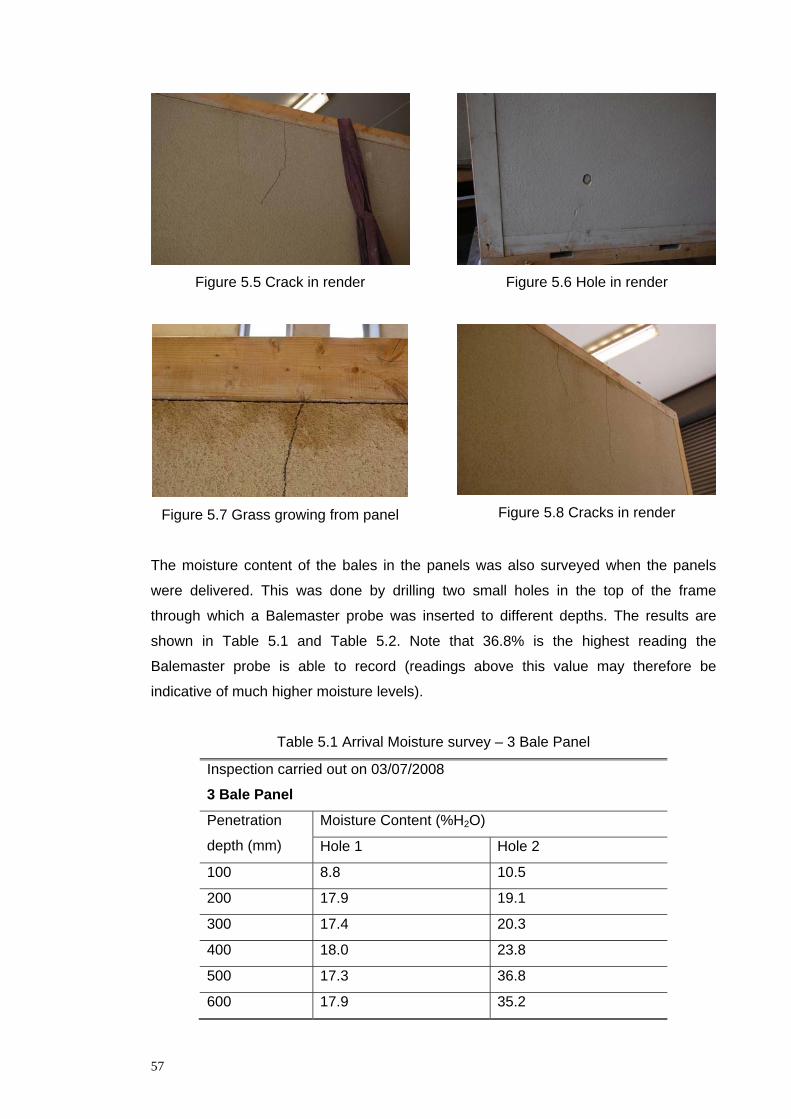
Figure 5.5 Crack in render Figure 5.6 Hole in render
Figure 5.7 Grass growing from panel Figure 5.8 Cracks in render
The moisture content of the bales in the panels was also surveyed when the panels
were delivered. This was done by drilling two small holes in the top of the frame
through which a Balemaster probe was inserted to different depths. The results are
shown in Table 5.1 and Table 5.2. Note that 36.8% is the highest reading the
Balemaster probe is able to record (readings above this value may therefore be
indicative of much higher moisture levels).
Table 5.1 Arrival Moisture survey – 3 Bale Panel
Inspection carried out on 03/07/2008
3 Bale Panel
Penetration Moisture Content (%H2O)
depth (mm) Hole 1 Hole 2
100 8.8 10.5
200 17.9 19.1
300 17.4 20.3
400 18.0 23.8
500 17.3 36.8
600 17.9 35.2
57
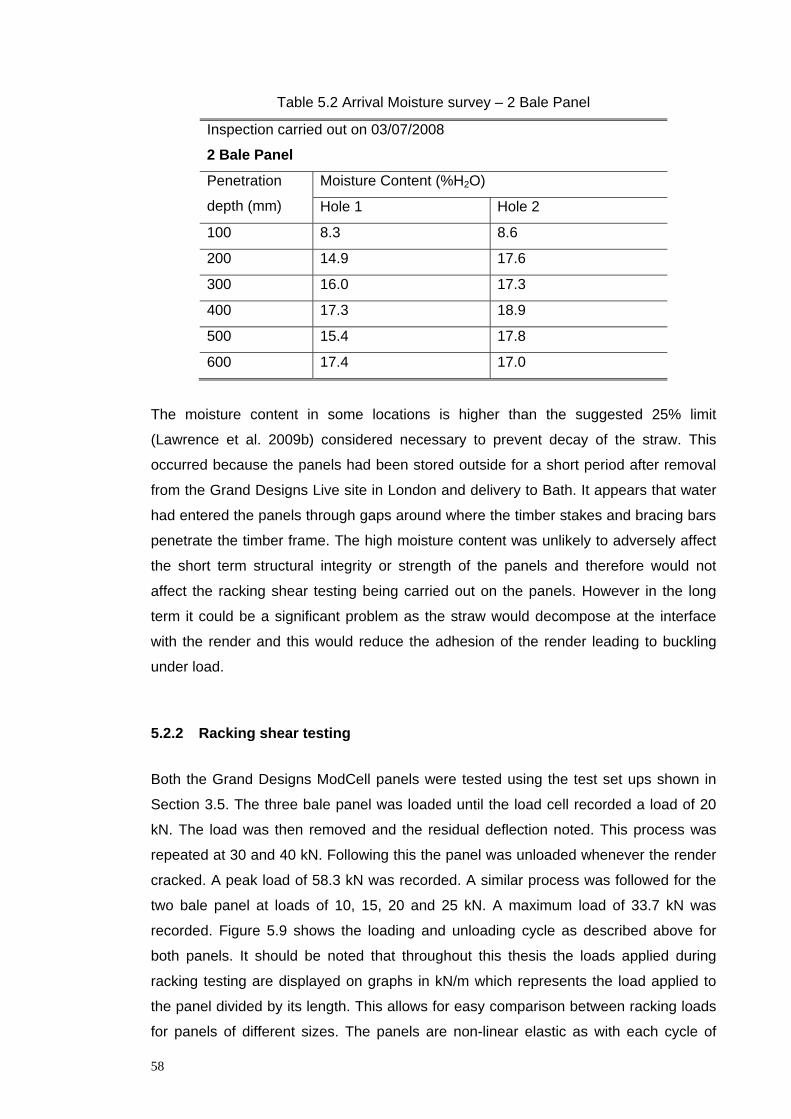
Table 5.2 Arrival Moisture survey – 2 Bale Panel
Inspection carried out on 03/07/2008
2 Bale Panel
Penetration Moisture Content (%H2O)
depth (mm) Hole 1 Hole 2
100 8.3 8.6
200 14.9 17.6
300 16.0 17.3
400 17.3 18.9
500 15.4 17.8
600 17.4 17.0
The moisture content in some locations is higher than the suggested 25% limit
(Lawrence et al. 2009b) considered necessary to prevent decay of the straw. This
occurred because the panels had been stored outside for a short period after removal
from the Grand Designs Live site in London and delivery to Bath. It appears that water
had entered the panels through gaps around where the timber stakes and bracing bars
penetrate the timber frame. The high moisture content was unlikely to adversely affect
the short term structural integrity or strength of the panels and therefore would not
affect the racking shear testing being carried out on the panels. However in the long
term it could be a significant problem as the straw would decompose at the interface
with the render and this would reduce the adhesion of the render leading to buckling
under load.
5.2.2 Racking shear testing
Both the Grand Designs ModCell panels were tested using the test set ups shown in
Section 3.5. The three bale panel was loaded until the load cell recorded a load of 20
kN. The load was then removed and the residual deflection noted. This process was
repeated at 30 and 40 kN. Following this the panel was unloaded whenever the render
cracked. A peak load of 58.3 kN was recorded. A similar process was followed for the
two bale panel at loads of 10, 15, 20 and 25 kN. A maximum load of 33.7 kN was
recorded. Figure 5.9 shows the loading and unloading cycle as described above for
both panels. It should be noted that throughout this thesis the loads applied during
racking testing are displayed on graphs in kN/m which represents the load applied to
the panel divided by its length. This allows for easy comparison between racking loads
for panels of different sizes. The panels are non-linear elastic as with each cycle of
58
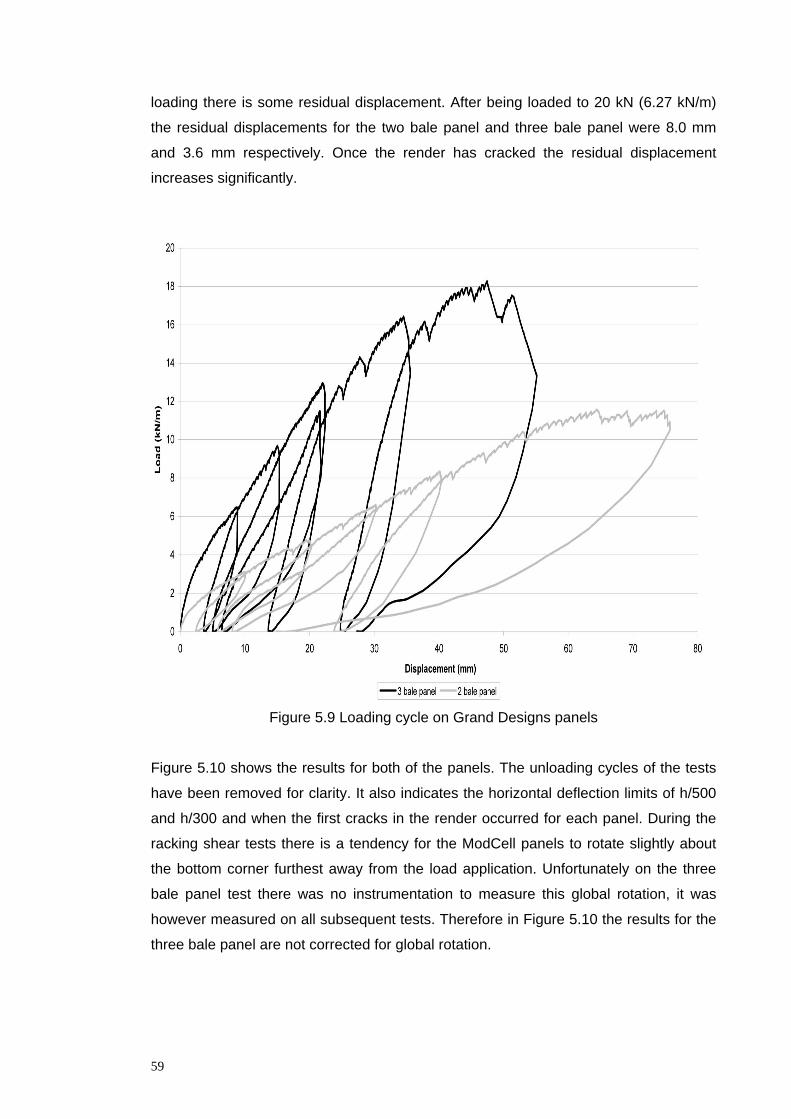
loading there is some residual displacement. After being loaded to 20 kN (6.27 kN/m)
the residual displacements for the two bale panel and three bale panel were 8.0 mm
and 3.6 mm respectively. Once the render has cracked the residual displacement
increases significantly.
Figure 5.9 Loading cycle on Grand Designs panels
Figure 5.10 shows the results for both of the panels. The unloading cycles of the tests
have been removed for clarity. It also indicates the horizontal deflection limits of h/500
and h/300 and when the first cracks in the render occurred for each panel. During the
racking shear tests there is a tendency for the ModCell panels to rotate slightly about
the bottom corner furthest away from the load application. Unfortunately on the three
bale panel test there was no instrumentation to measure this global rotation, it was
however measured on all subsequent tests. Therefore in Figure 5.10 the results for the
three bale panel are not corrected for global rotation.
59
Figure 5.10 Grand Designs panels racking shear results
The results clearly show that the three bale panel is significantly stiffer than the two
bale panel. At h/500 the three bale panel is carrying a load of 4.76 kN/m and the two
bale panel is carrying 2.41 kN/m, which is roughly half the three bale panels load.
There are several possible reasons why the two bale panel is less stiff. One reason for
the lower stiffness of the two bale panel may be the arrangement of steel
reinforcement. As shown in Figure 5.1 the two bale panel only has one vertical
reinforcing bar in each face whereas the three bale panel has two. When the panels
are loaded the load is applied to the end of the top element of the frame. As the load is
transferred from the top element into the side of the frame nearest the jack there is a
tendency for the side and the top of the frame to lift. The vertical reinforcement helps to
resist this. Therefore with fewer reinforcing bars to resist this force the effects will be
larger. Additionally the two bale panel only has two-thirds the area of render that the
three bale panel. Whilst the panels are loaded in racking shear the top and the bottom
of the frame move closer together and the sides rotate about their bases. This puts the
render into shear eventually resulting in tension cracks. Therefore the panel with a
smaller area of render will be able to carry a lower load.
60
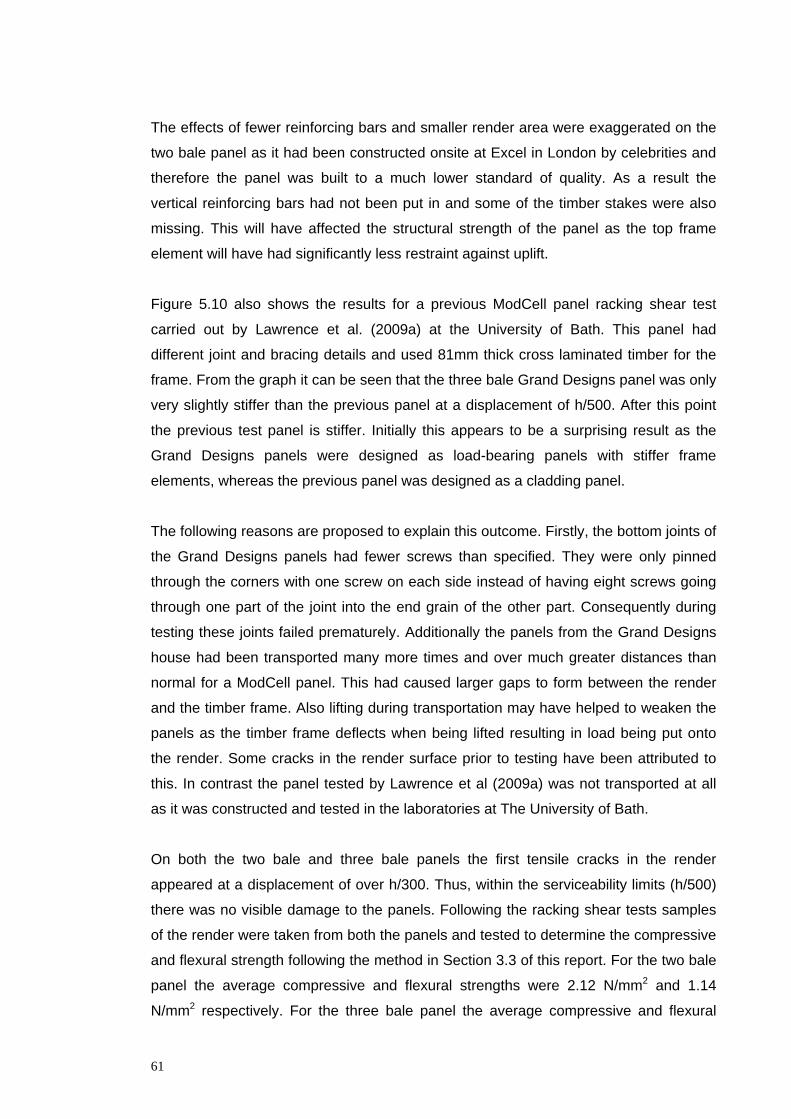
The effects of fewer reinforcing bars and smaller render area were exaggerated on the
two bale panel as it had been constructed onsite at Excel in London by celebrities and
therefore the panel was built to a much lower standard of quality. As a result the
vertical reinforcing bars had not been put in and some of the timber stakes were also
missing. This will have affected the structural strength of the panel as the top frame
element will have had significantly less restraint against uplift.
Figure 5.10 also shows the results for a previous ModCell panel racking shear test
carried out by Lawrence et al. (2009a) at the University of Bath. This panel had
different joint and bracing details and used 81mm thick cross laminated timber for the
frame. From the graph it can be seen that the three bale Grand Designs panel was only
very slightly stiffer than the previous panel at a displacement of h/500. After this point
the previous test panel is stiffer. Initially this appears to be a surprising result as the
Grand Designs panels were designed as load-bearing panels with stiffer frame
elements, whereas the previous panel was designed as a cladding panel.
The following reasons are proposed to explain this outcome. Firstly, the bottom joints of
the Grand Designs panels had fewer screws than specified. They were only pinned
through the corners with one screw on each side instead of having eight screws going
through one part of the joint into the end grain of the other part. Consequently during
testing these joints failed prematurely. Additionally the panels from the Grand Designs
house had been transported many more times and over much greater distances than
normal for a ModCell panel. This had caused larger gaps to form between the render
and the timber frame. Also lifting during transportation may have helped to weaken the
panels as the timber frame deflects when being lifted resulting in load being put onto
the render. Some cracks in the render surface prior to testing have been attributed to
this. In contrast the panel tested by Lawrence et al (2009a) was not transported at all
as it was constructed and tested in the laboratories at The University of Bath.
On both the two bale and three bale panels the first tensile cracks in the render
appeared at a displacement of over h/300. Thus, within the serviceability limits (h/500)
there was no visible damage to the panels. Following the racking shear tests samples
of the render were taken from both the panels and tested to determine the compressive
and flexural strength following the method in Section 3.3 of this report. For the two bale
panel the average compressive and flexural strengths were 2.12 N/mm2 and 1.14
N/mm2 respectively. For the three bale panel the average compressive and flexural
61
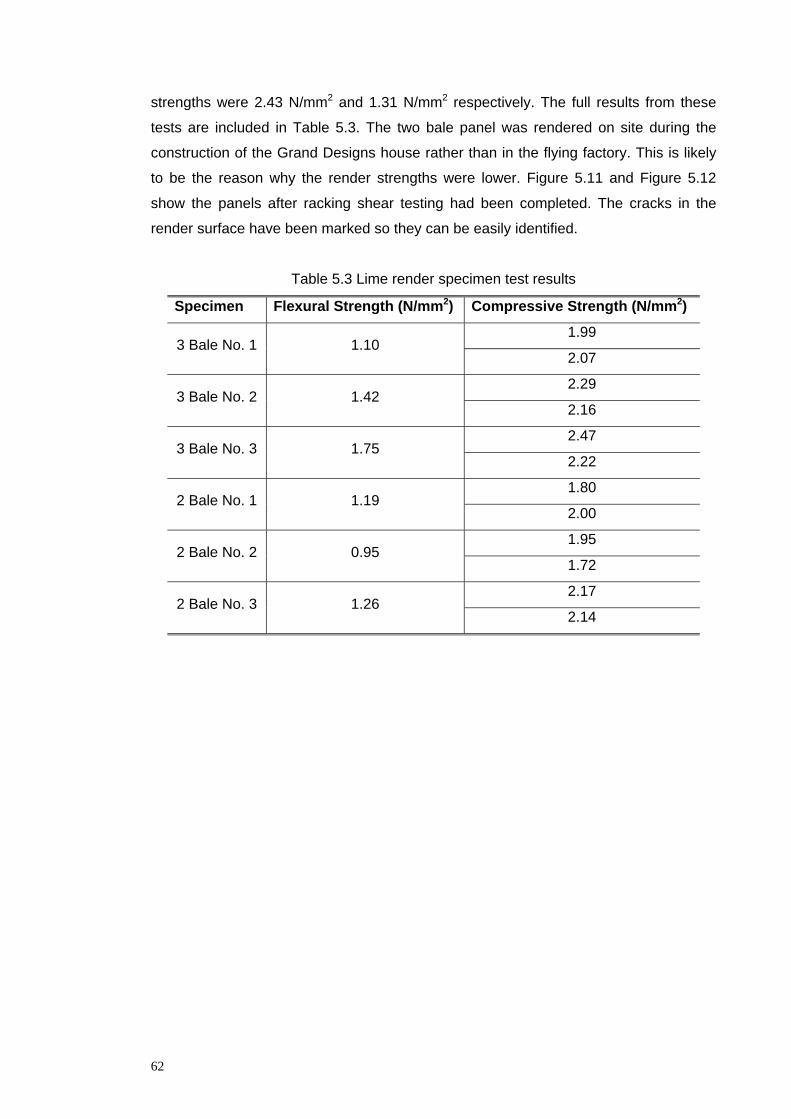
strengths were 2.43 N/mm2 and 1.31 N/mm2 respectively. The full results from these
tests are included in Table 5.3. The two bale panel was rendered on site during the
construction of the Grand Designs house rather than in the flying factory. This is likely
to be the reason why the render strengths were lower. Figure 5.11 and Figure 5.12
show the panels after racking shear testing had been completed. The cracks in the
render surface have been marked so they can be easily identified.
Table 5.3 Lime render specimen test results
Specimen Flexural Strength (N/mm2) Compressive Strength (N/mm2)
3 Bale No. 1 1.10 1.99
2.07
3 Bale No. 2 1.42 2.29
2.16
3 Bale No. 3 1.75 2.47
2.22
2 Bale No. 1 1.19 1.80
2.00
2 Bale No. 2 0.95 1.95
1.72
2 Bale No. 3 1.26 2.17
2.14
62
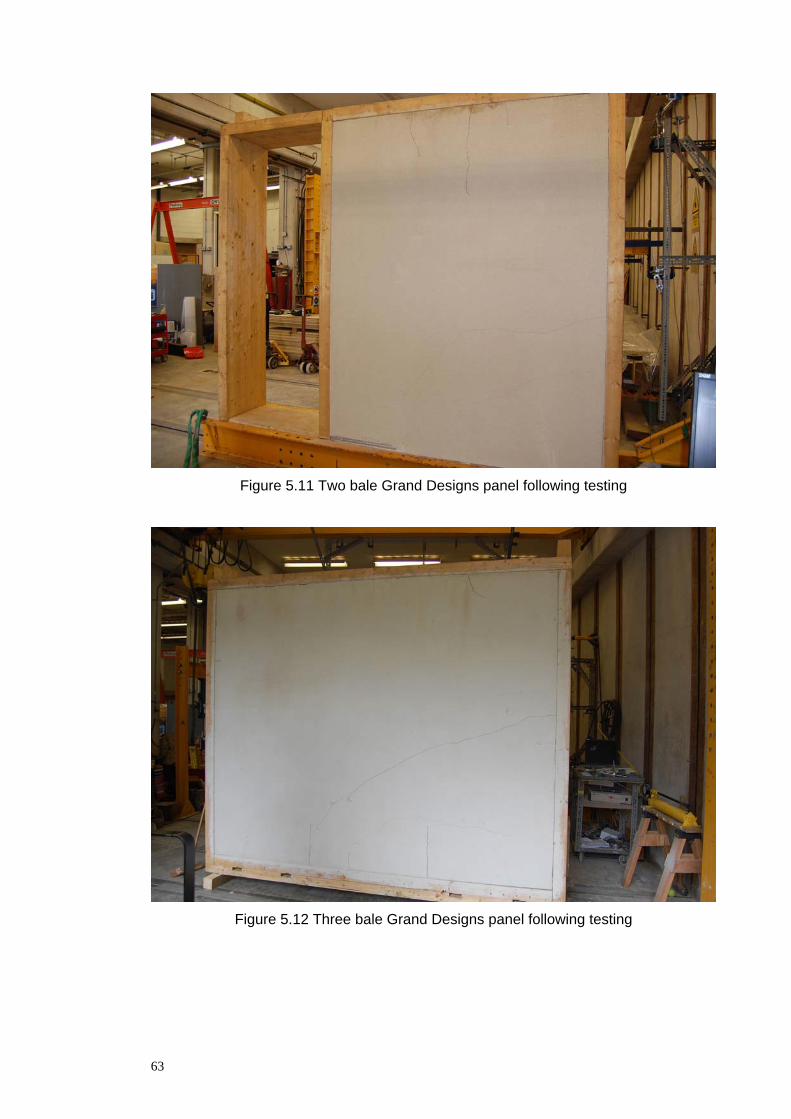
Figure 5.11 Two bale Grand Designs panel following testing
Figure 5.12 Three bale Grand Designs panel following testing
63
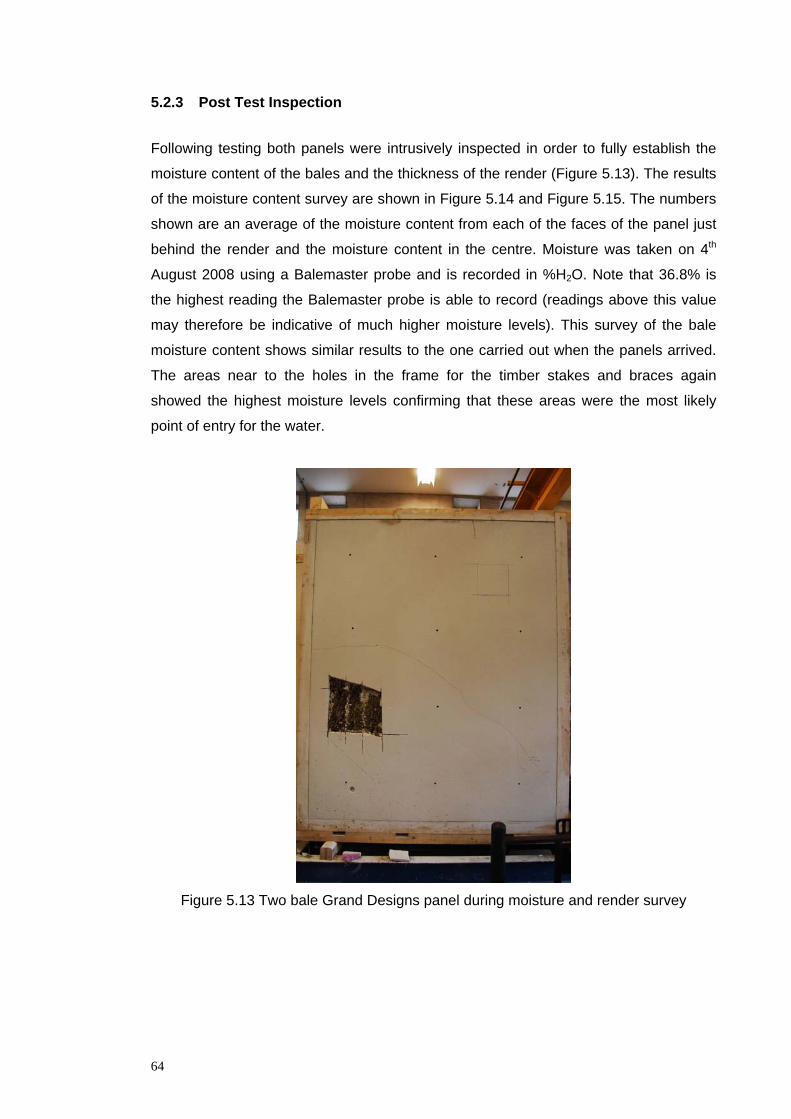
5.2.3 Post Test Inspection
Following testing both panels were intrusively inspected in order to fully establish the
moisture content of the bales and the thickness of the render (Figure 5.13). The results
of the moisture content survey are shown in Figure 5.14 and Figure 5.15. The numbers
shown are an average of the moisture content from each of the faces of the panel just
behind the render and the moisture content in the centre. Moisture was taken on 4th
August 2008 using a Balemaster probe and is recorded in %H2O. Note that 36.8% is
the highest reading the Balemaster probe is able to record (readings above this value
may therefore be indicative of much higher moisture levels). This survey of the bale
moisture content shows similar results to the one carried out when the panels arrived.
The areas near to the holes in the frame for the timber stakes and braces again
showed the highest moisture levels confirming that these areas were the most likely
point of entry for the water.
Figure 5.13 Two bale Grand Designs panel during moisture and render survey
64
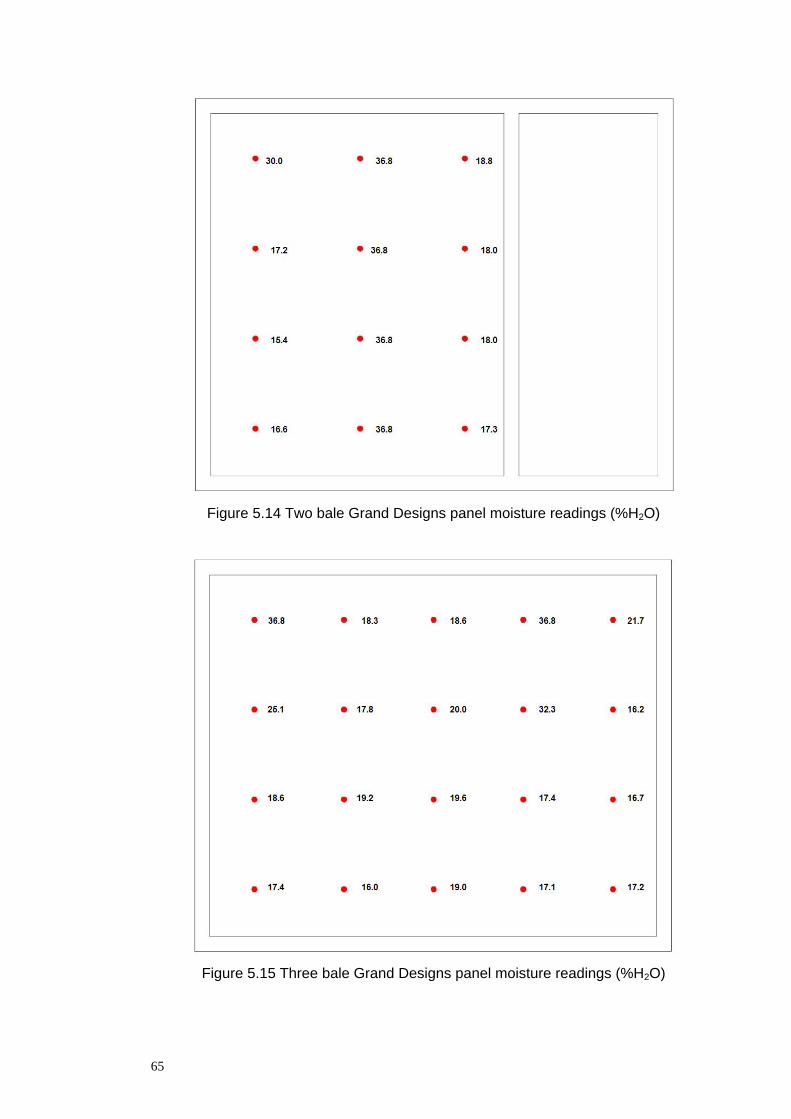
Figure 5.14 Two bale Grand Designs panel moisture readings (%H2O)
Figure 5.15 Three bale Grand Designs panel moisture readings (%H2O)
65
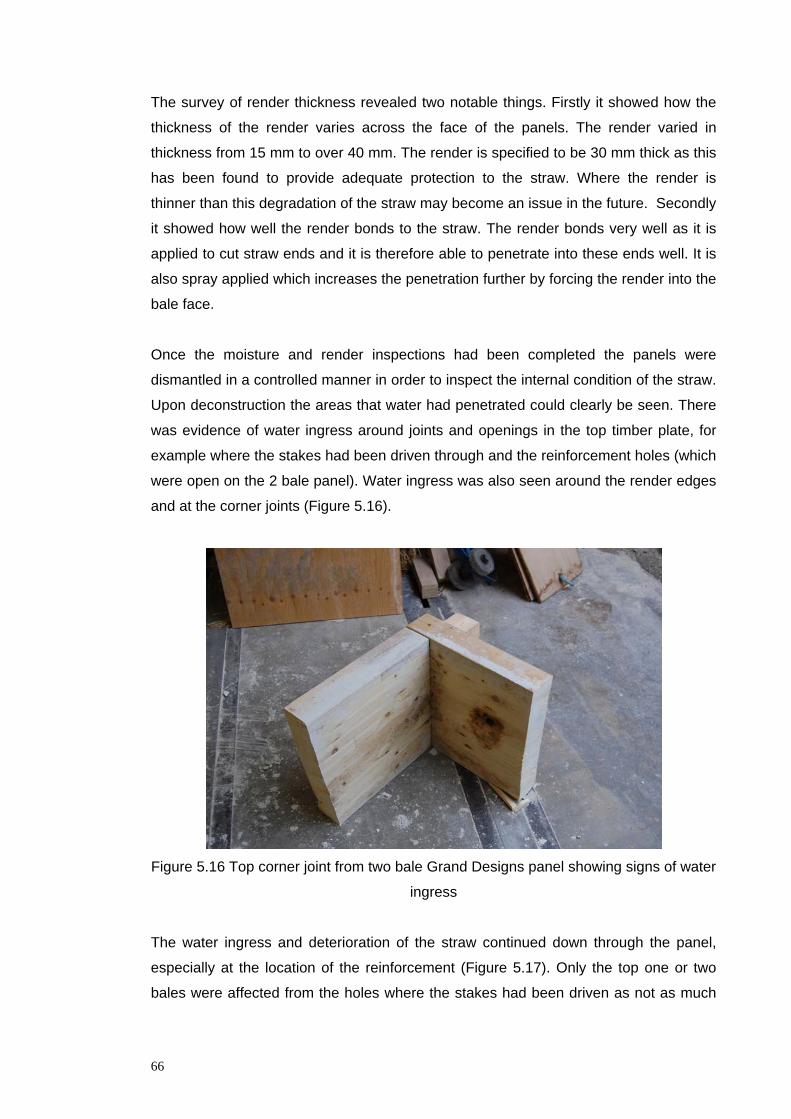
The survey of render thickness revealed two notable things. Firstly it showed how the
thickness of the render varies across the face of the panels. The render varied in
thickness from 15 mm to over 40 mm. The render is specified to be 30 mm thick as this
has been found to provide adequate protection to the straw. Where the render is
thinner than this degradation of the straw may become an issue in the future. Secondly
it showed how well the render bonds to the straw. The render bonds very well as it is
applied to cut straw ends and it is therefore able to penetrate into these ends well. It is
also spray applied which increases the penetration further by forcing the render into the
bale face.
Once the moisture and render inspections had been completed the panels were
dismantled in a controlled manner in order to inspect the internal condition of the straw.
Upon deconstruction the areas that water had penetrated could clearly be seen. There
was evidence of water ingress around joints and openings in the top timber plate, for
example where the stakes had been driven through and the reinforcement holes (which
were open on the 2 bale panel). Water ingress was also seen around the render edges
and at the corner joints (Figure 5.16).
Figure 5.16 Top corner joint from two bale Grand Designs panel showing signs of water
ingress
The water ingress and deterioration of the straw continued down through the panel,
especially at the location of the reinforcement (Figure 5.17). Only the top one or two
bales were affected from the holes where the stakes had been driven as not as much
66
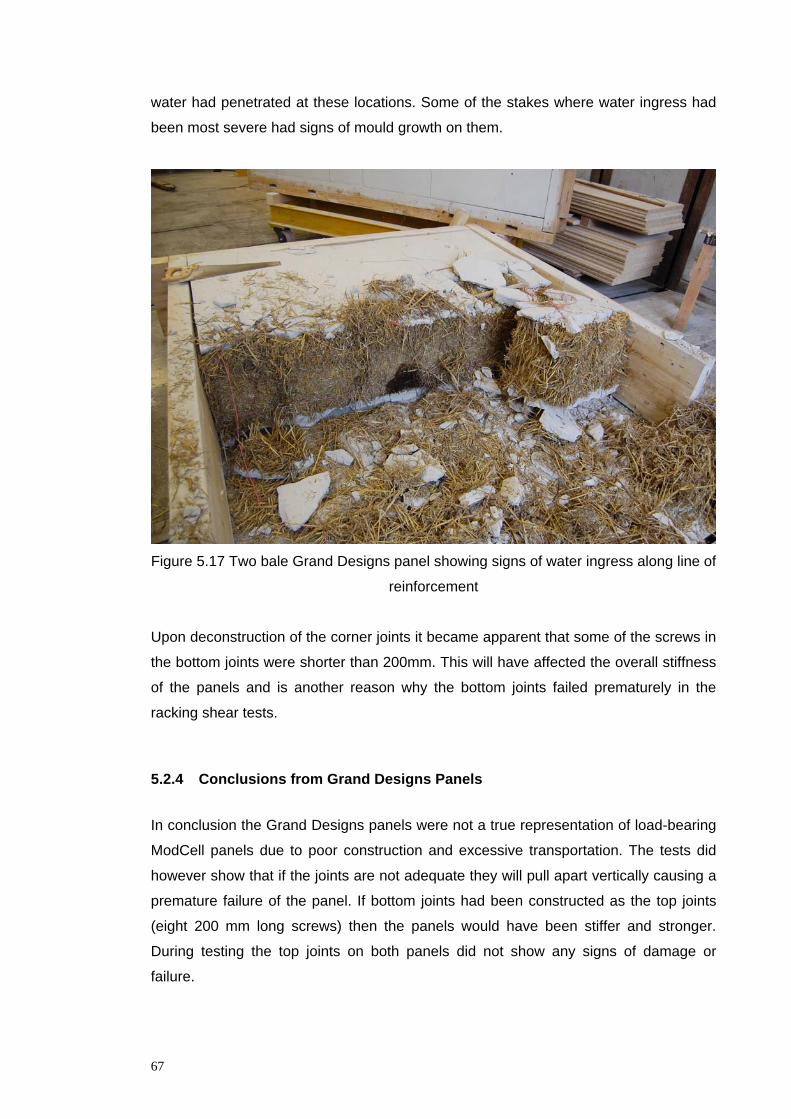
water had penetrated at these locations. Some of the stakes where water ingress had
been most severe had signs of mould growth on them.
Figure 5.17 Two bale Grand Designs panel showing signs of water ingress along line of
reinforcement
Upon deconstruction of the corner joints it became apparent that some of the screws in
the bottom joints were shorter than 200mm. This will have affected the overall stiffness
of the panels and is another reason why the bottom joints failed prematurely in the
racking shear tests.
5.2.4 Conclusions from Grand Designs Panels
In conclusion the Grand Designs panels were not a true representation of load-bearing
ModCell panels due to poor construction and excessive transportation. The tests did
however show that if the joints are not adequate they will pull apart vertically causing a
premature failure of the panel. If bottom joints had been constructed as the top joints
(eight 200 mm long screws) then the panels would have been stiffer and stronger.
During testing the top joints on both panels did not show any signs of damage or
failure.
67
These tests have shown that the racking shear resistance of two bale panels is less
than that of three bale panels. It is the first time that a two bale panel has been tested
and therefore further testing of two bale panels will be necessary in order to determine
if this is an anomaly due to the poor construction and missing reinforcement. The effect
of a window or door within the opening in the two bale panel should be considered,
however its strength should not be relied upon.
The moisture surveys and deconstruction of the panels have highlighted the problems
that water ingress can cause. Water ingress during construction, transportation or
storage of the panels could cause major problems throughout the life of the building.
The evidence found during the post test inspections shows the short term damage a
small amount of water can cause. If the straw close to the render surface decays then
the render will no long be securely attached to the straw. This could adversely affect
the strength and stiffness of the panels as the render makes a large contribution to this
and is restrained from buckling by the straw. Therefore making sure the panels are
properly covered at all times before the building is water tight is important.
Overall these panels have provided some useful results and highlighted some
problems, but they did not show the full potential of load-bearing ModCell panels.
5.3 Laboratory Prepared Panel Tests
The Grand Designs panels were not a true representation of load-bearing ModCell
panels and therefore another series of full size racking shear tests were carried out.
Also the Grand Designs panels were constructed prior to the joint testing and therefore
the conclusions from this were not implemented in their design. Further testing will
allow for this and also allow for the true performance of load-bearing panels to be
shown. The panels were constructed by the ModCell team in the structures laboratory
at the University of Bath where they remained until they were tested. The Limetec
Basecoat render was spray applied in two layers with 48 hours between each
application. Once the full build up of render had been applied the panels were left for
14 days before testing. The panels were tested using the set ups shown in Figure 3.5
and Figure 3.6 for the two bale and three bale panels respectively.
68
5.3.1 Panel design
The design of the panels was informed by the results of the joint and panel tests
discussed previously. Four panels were tested, two, three bale panels and two, two
bale panels. Corner bracing was used in one two bale panel and one three bale panel,
the two panels had cross braces. The corner braces were increased in angle from 45o
to 51o. The use of cross bracing has several disadvantages. Cross bracing requires
reinforcing bars over 3 meters in length which are not readily available and are
therefore more costly. It also requires thicker render as the bracing and vertical bars
cross. Therefore the render has to be thicker in order to maintain the minimum render
cover over the reinforcing bars. However if the required structural stiffness for load-
bearing construction could only be achieved through using a cross brace, it is
preferable to do this than not to be able to provide load-bearing panels at all. Therefore
it was felt that it was important to investigate if cross bracing the panels gave any
significant structural advantage. Theoretically cross bracing a frame of any kind is the
most efficient way of preventing horizontal displacements. All of the panels also had
vertical reinforcement apart from the two bale cross brace panel. If vertical
reinforcement had been used in this panel then three reinforcing bars would have
crossed at the same point. In order to provide the minimum render cover to the
reinforcement the render would have had to be 40% thicker than on the three bale
cross brace panel. This is an inefficient use of material and would also add significant
amount to the cost of the panel. Details of all the panels are shown in Figure 5.18 to
Figure 5.21.
69
Figure 5.18 Two bale corner brace panel
Figure 5.19 Two bale cross brace panel
70
Figure 5.20 Three bale corner brace panel
Figure 5.21 Three bale cross brace panel
71
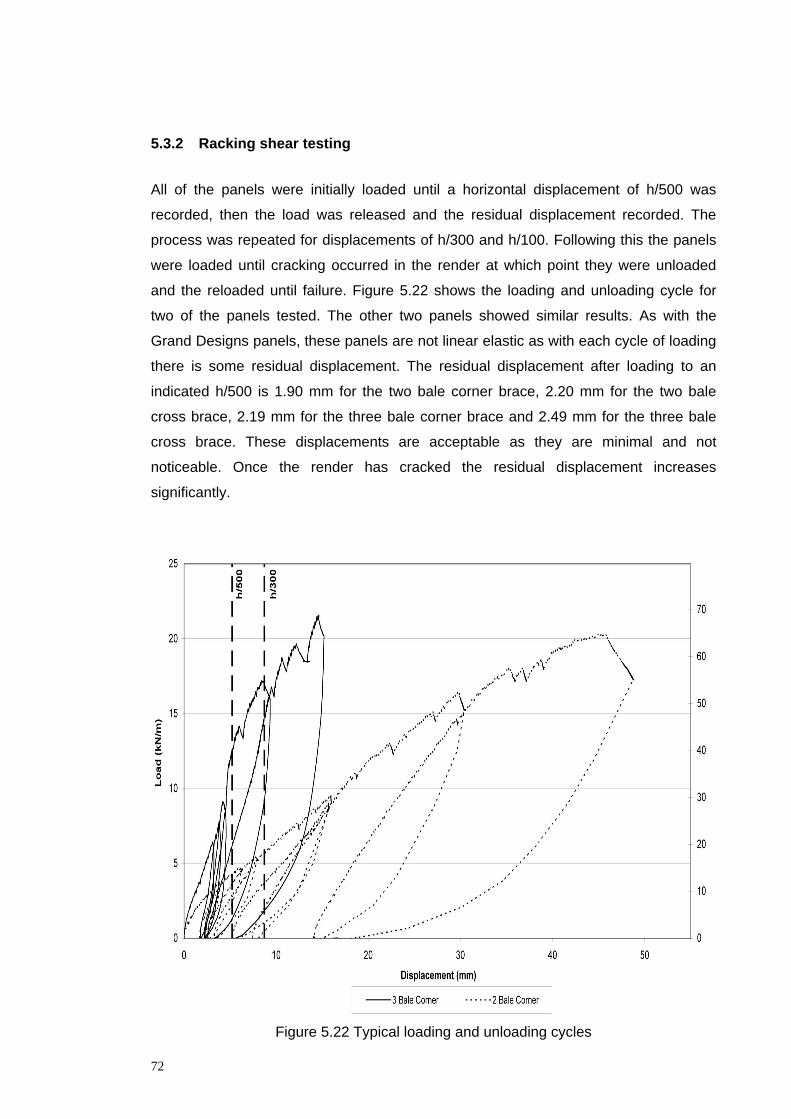
5.3.2 Racking shear testing
All of the panels were initially loaded until a horizontal displacement of h/500 was
recorded, then the load was released and the residual displacement recorded. The
process was repeated for displacements of h/300 and h/100. Following this the panels
were loaded until cracking occurred in the render at which point they were unloaded
and the reloaded until failure. Figure 5.22 shows the loading and unloading cycle for
two of the panels tested. The other two panels showed similar results. As with the
Grand Designs panels, these panels are not linear elastic as with each cycle of loading
there is some residual displacement. The residual displacement after loading to an
indicated h/500 is 1.90 mm for the two bale corner brace, 2.20 mm for the two bale
cross brace, 2.19 mm for the three bale corner brace and 2.49 mm for the three bale
cross brace. These displacements are acceptable as they are minimal and not
noticeable. Once the render has cracked the residual displacement increases
significantly.
Figure 5.22 Typical loading and unloading cycles
72
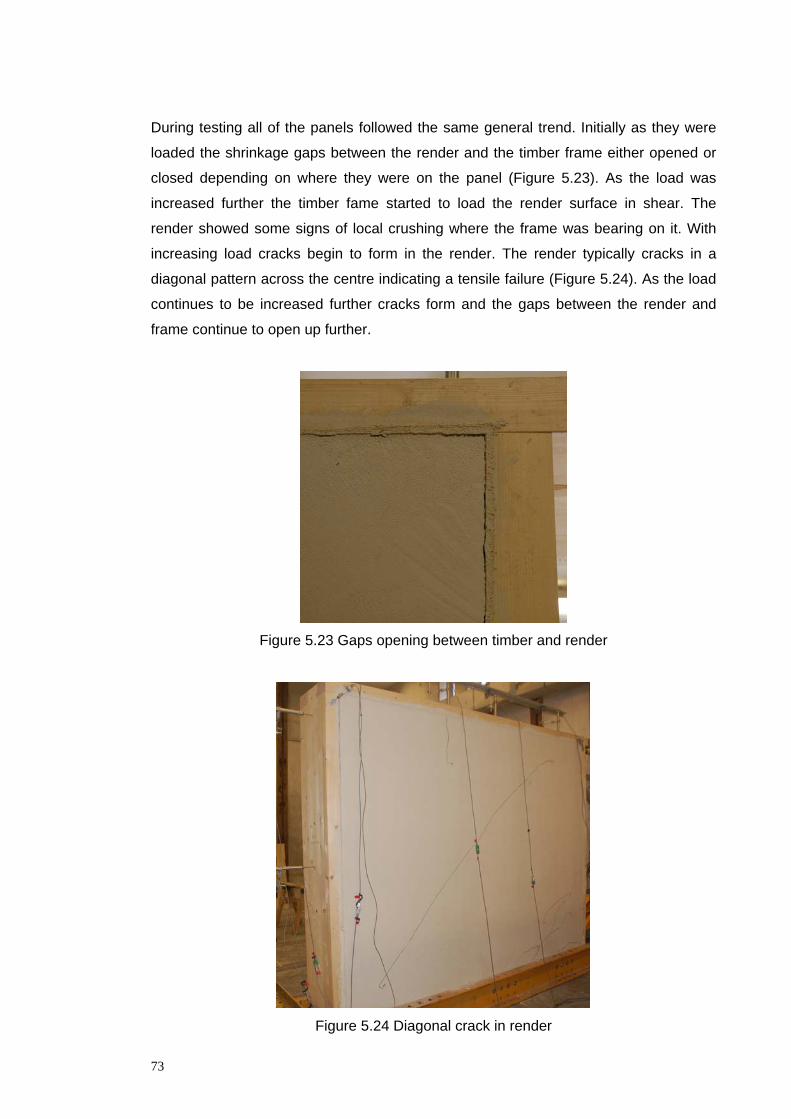
During testing all of the panels followed the same general trend. Initially as they were
loaded the shrinkage gaps between the render and the timber frame either opened or
closed depending on where they were on the panel (Figure 5.23). As the load was
increased further the timber fame started to load the render surface in shear. The
render showed some signs of local crushing where the frame was bearing on it. With
increasing load cracks begin to form in the render. The render typically cracks in a
diagonal pattern across the centre indicating a tensile failure (Figure 5.24). As the load
continues to be increased further cracks form and the gaps between the render and
frame continue to open up further.
Figure 5.23 Gaps opening between timber and render
Figure 5.24 Diagonal crack in render
73
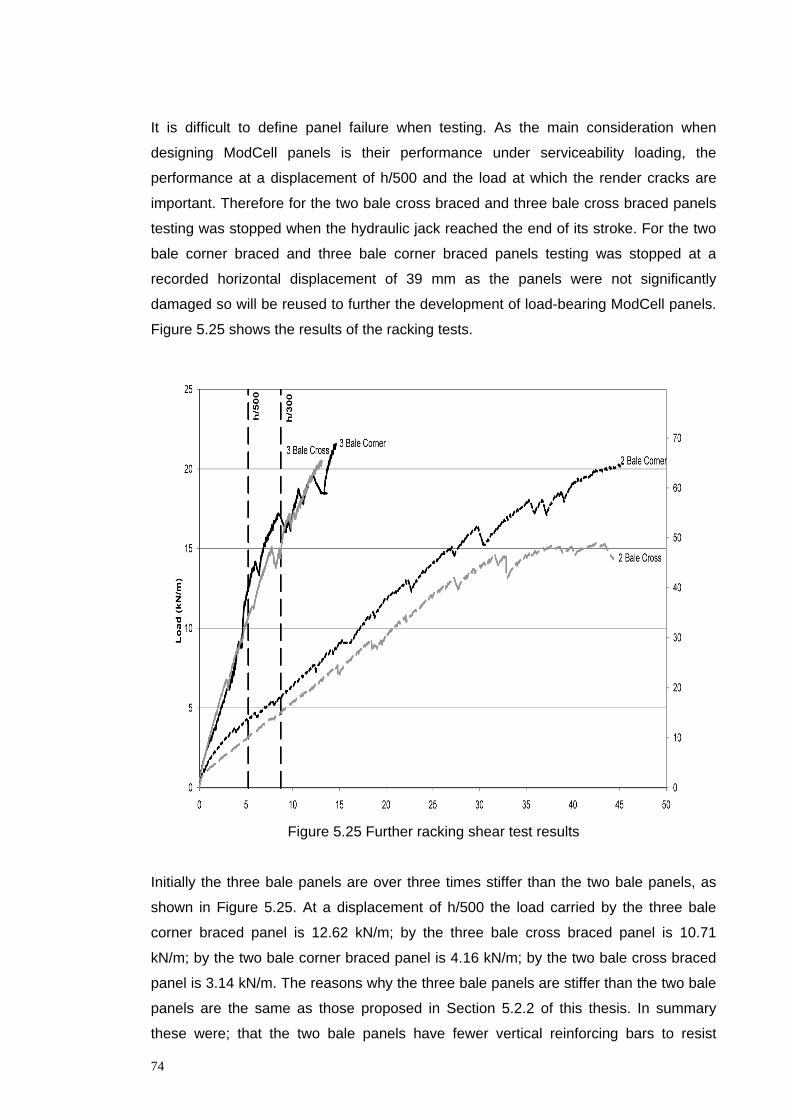
It is difficult to define panel failure when testing. As the main consideration when
designing ModCell panels is their performance under serviceability loading, the
performance at a displacement of h/500 and the load at which the render cracks are
important. Therefore for the two bale cross braced and three bale cross braced panels
testing was stopped when the hydraulic jack reached the end of its stroke. For the two
bale corner braced and three bale corner braced panels testing was stopped at a
recorded horizontal displacement of 39 mm as the panels were not significantly
damaged so will be reused to further the development of load-bearing ModCell panels.
Figure 5.25 shows the results of the racking tests.
Figure 5.25 Further racking shear test results
Initially the three bale panels are over three times stiffer than the two bale panels, as
shown in Figure 5.25. At a displacement of h/500 the load carried by the three bale
corner braced panel is 12.62 kN/m; by the three bale cross braced panel is 10.71
kN/m; by the two bale corner braced panel is 4.16 kN/m; by the two bale cross braced
panel is 3.14 kN/m. The reasons why the three bale panels are stiffer than the two bale
panels are the same as those proposed in Section 5.2.2 of this thesis. In summary
these were; that the two bale panels have fewer vertical reinforcing bars to resist
74
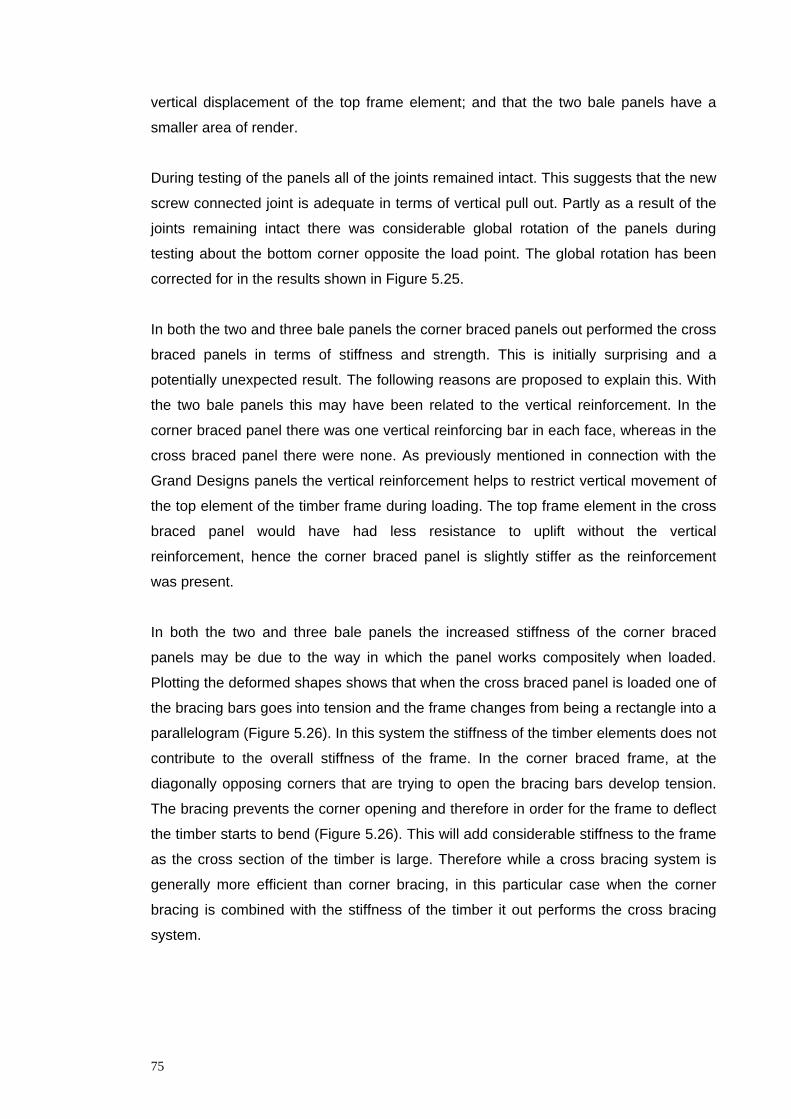
vertical displacement of the top frame element; and that the two bale panels have a
smaller area of render.
During testing of the panels all of the joints remained intact. This suggests that the new
screw connected joint is adequate in terms of vertical pull out. Partly as a result of the
joints remaining intact there was considerable global rotation of the panels during
testing about the bottom corner opposite the load point. The global rotation has been
corrected for in the results shown in Figure 5.25.
In both the two and three bale panels the corner braced panels out performed the cross
braced panels in terms of stiffness and strength. This is initially surprising and a
potentially unexpected result. The following reasons are proposed to explain this. With
the two bale panels this may have been related to the vertical reinforcement. In the
corner braced panel there was one vertical reinforcing bar in each face, whereas in the
cross braced panel there were none. As previously mentioned in connection with the
Grand Designs panels the vertical reinforcement helps to restrict vertical movement of
the top element of the timber frame during loading. The top frame element in the cross
braced panel would have had less resistance to uplift without the vertical
reinforcement, hence the corner braced panel is slightly stiffer as the reinforcement
was present.
In both the two and three bale panels the increased stiffness of the corner braced
panels may be due to the way in which the panel works compositely when loaded.
Plotting the deformed shapes shows that when the cross braced panel is loaded one of
the bracing bars goes into tension and the frame changes from being a rectangle into a
parallelogram (Figure 5.26). In this system the stiffness of the timber elements does not
contribute to the overall stiffness of the frame. In the corner braced frame, at the
diagonally opposing corners that are trying to open the bracing bars develop tension.
The bracing prevents the corner opening and therefore in order for the frame to deflect
the timber starts to bend (Figure 5.26). This will add considerable stiffness to the frame
as the cross section of the timber is large. Therefore while a cross bracing system is
generally more efficient than corner bracing, in this particular case when the corner
bracing is combined with the stiffness of the timber it out performs the cross bracing
system.
75
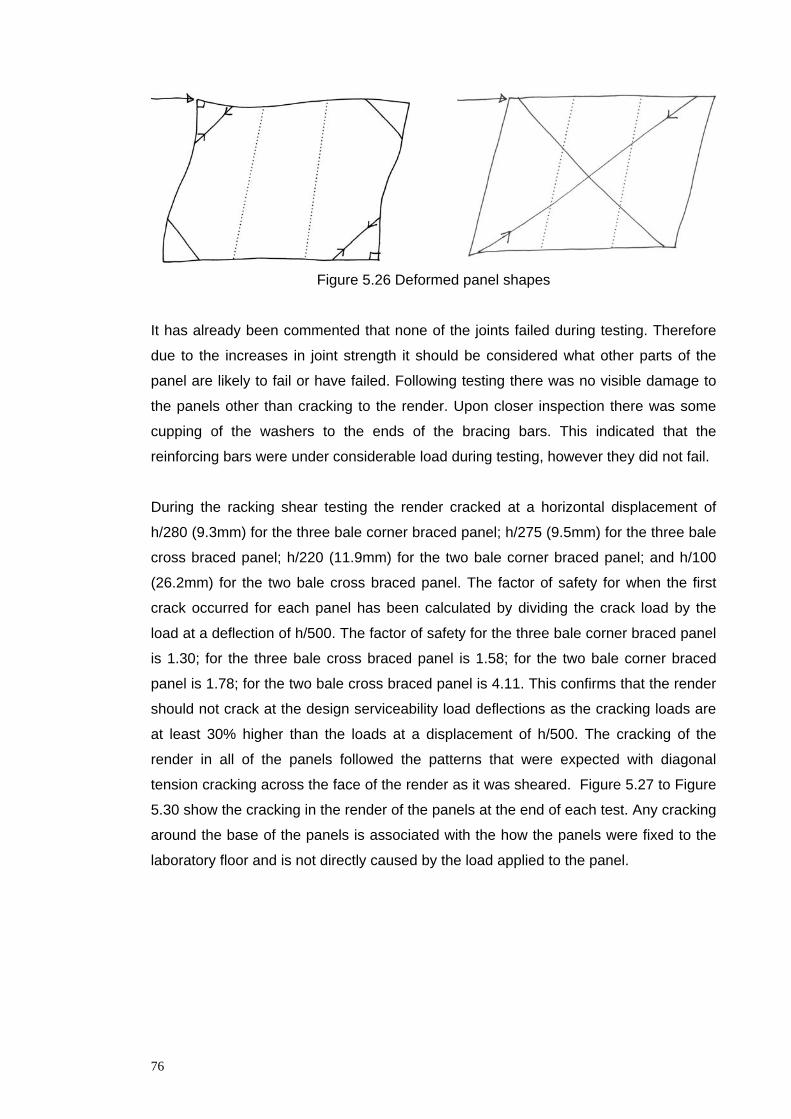
Figure 5.26 Deformed panel shapes
It has already been commented that none of the joints failed during testing. Therefore
due to the increases in joint strength it should be considered what other parts of the
panel are likely to fail or have failed. Following testing there was no visible damage to
the panels other than cracking to the render. Upon closer inspection there was some
cupping of the washers to the ends of the bracing bars. This indicated that the
reinforcing bars were under considerable load during testing, however they did not fail.
During the racking shear testing the render cracked at a horizontal displacement of
h/280 (9.3mm) for the three bale corner braced panel; h/275 (9.5mm) for the three bale
cross braced panel; h/220 (11.9mm) for the two bale corner braced panel; and h/100
(26.2mm) for the two bale cross braced panel. The factor of safety for when the first
crack occurred for each panel has been calculated by dividing the crack load by the
load at a deflection of h/500. The factor of safety for the three bale corner braced panel
is 1.30; for the three bale cross braced panel is 1.58; for the two bale corner braced
panel is 1.78; for the two bale cross braced panel is 4.11. This confirms that the render
should not crack at the design serviceability load deflections as the cracking loads are
at least 30% higher than the loads at a displacement of h/500. The cracking of the
render in all of the panels followed the patterns that were expected with diagonal
tension cracking across the face of the render as it was sheared. Figure 5.27 to Figure
5.30 show the cracking in the render of the panels at the end of each test. Any cracking
around the base of the panels is associated with the how the panels were fixed to the
laboratory floor and is not directly caused by the load applied to the panel.
76
Figure 5.27 Two bale corner braced panel after testing
Figure 5.28 Two bale cross braced panel after testing
77
Figure 5.29 Three bale corner braced panel after testing
Figure 5.30 Three bale cross braced panel after testing
Table 5.4 shows a summary of the performance of all of the panels tested during this
investigation and the performance of one previous panel.
78
Table 5.4 Results summary for all panels tested
Panel Load at
h/500 (kN/m)
Stiffness at
h/500
(kN/mm)
Render cracking
Load (kN/m) Displacement
Three Bale Corner 12.62 7.70 16.50 h/280
Three Bale Cross 10.71 6.53 16.90 h/275
Grand Designs Three
Bale*
4.76 2.90 9.22 h/150
Two Bale Corner 4.16 2.54 7.39 h/220
Two Bale Cross 3.14 1.92 12.92 h/100
Grand Designs Two
Bale
2.41 1.47 4.24 h/175
Previous Panel*
(Lawrence et al. 2009a)
5.24 3.20 N/A N/A
*Panels not corrected for global rotation
From the results shown in Table 5.4 it can be seen that the three bale corner braced
panel is the stiffest and strongest under at the serviceability deflection limit of h/500. It
is also over twice as stiff as the previous panel. The improvement in racking shear
stiffness is as a result of several elements that have been revised on the ModCell
panels since the work by Lawrence et al. (2009a). Firstly the timber frame has been
increased in thickness to 100 mm in order to increase its stiffness and vertical load
carrying capacity. Secondly the frame joints have been revised following the results
gained from testing carried out during this investigation.
During construction of the panels samples of the render were taken. These were then
tested at the same time as the panel to find the compressive and flexural strengths
following the method outlined in Section 3.3 of this report. The four panels were tested
over 3 days, as were the render specimens. The average flexural and compressive
strengths of the render were 1.21 N/mm2 and 2.85 N/mm2 respectively. The details of
the specimens tested and the results from these tests are shown Table 5.5.
79
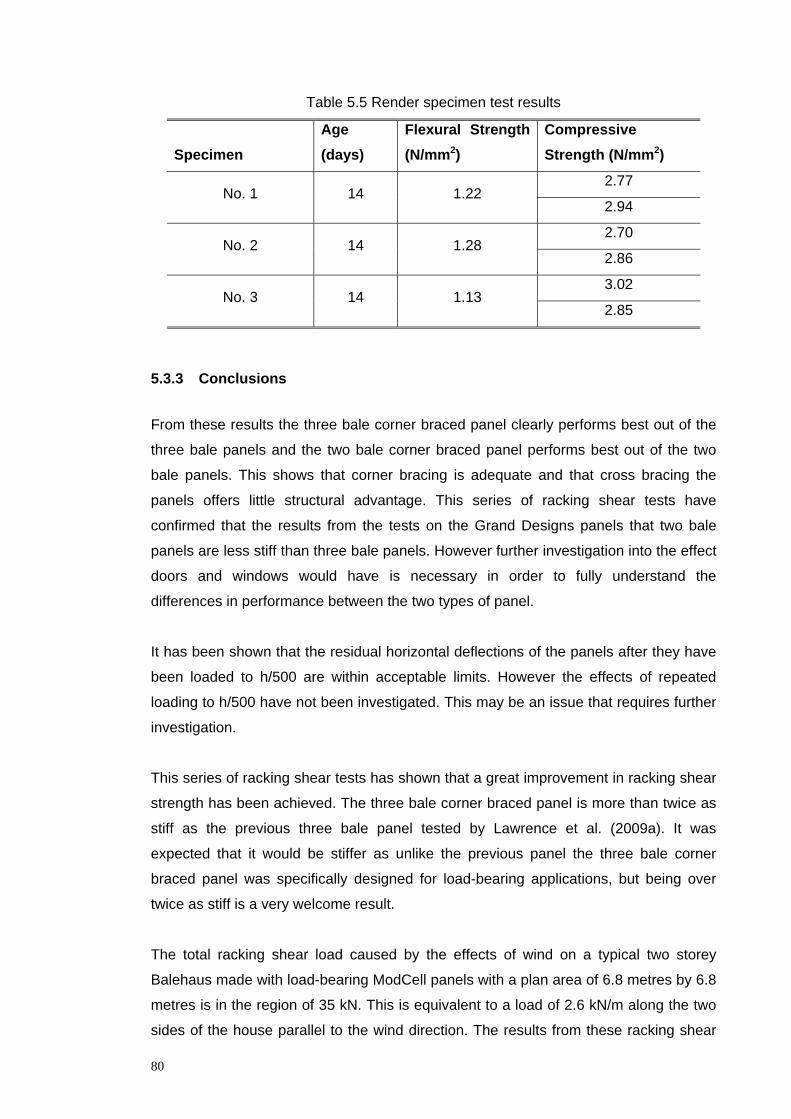
Table 5.5 Render specimen test results
Specimen Age (days)
Flexural Strength (N/mm2)
Compressive Strength (N/mm2)
No. 1 14 1.22 2.77
2.94
No. 2 14 1.28 2.70
2.86
No. 3 14 1.13 3.02
2.85
5.3.3 Conclusions
From these results the three bale corner braced panel clearly performs best out of the
three bale panels and the two bale corner braced panel performs best out of the two
bale panels. This shows that corner bracing is adequate and that cross bracing the
panels offers little structural advantage. This series of racking shear tests have
confirmed that the results from the tests on the Grand Designs panels that two bale
panels are less stiff than three bale panels. However further investigation into the effect
doors and windows would have is necessary in order to fully understand the
differences in performance between the two types of panel.
It has been shown that the residual horizontal deflections of the panels after they have
been loaded to h/500 are within acceptable limits. However the effects of repeated
loading to h/500 have not been investigated. This may be an issue that requires further
investigation.
This series of racking shear tests has shown that a great improvement in racking shear
strength has been achieved. The three bale corner braced panel is more than twice as
stiff as the previous three bale panel tested by Lawrence et al. (2009a). It was
expected that it would be stiffer as unlike the previous panel the three bale corner
braced panel was specifically designed for load-bearing applications, but being over
twice as stiff is a very welcome result.
The total racking shear load caused by the effects of wind on a typical two storey
Balehaus made with load-bearing ModCell panels with a plan area of 6.8 metres by 6.8
metres is in the region of 35 kN. This is equivalent to a load of 2.6 kN/m along the two
sides of the house parallel to the wind direction. The results from these racking shear
80
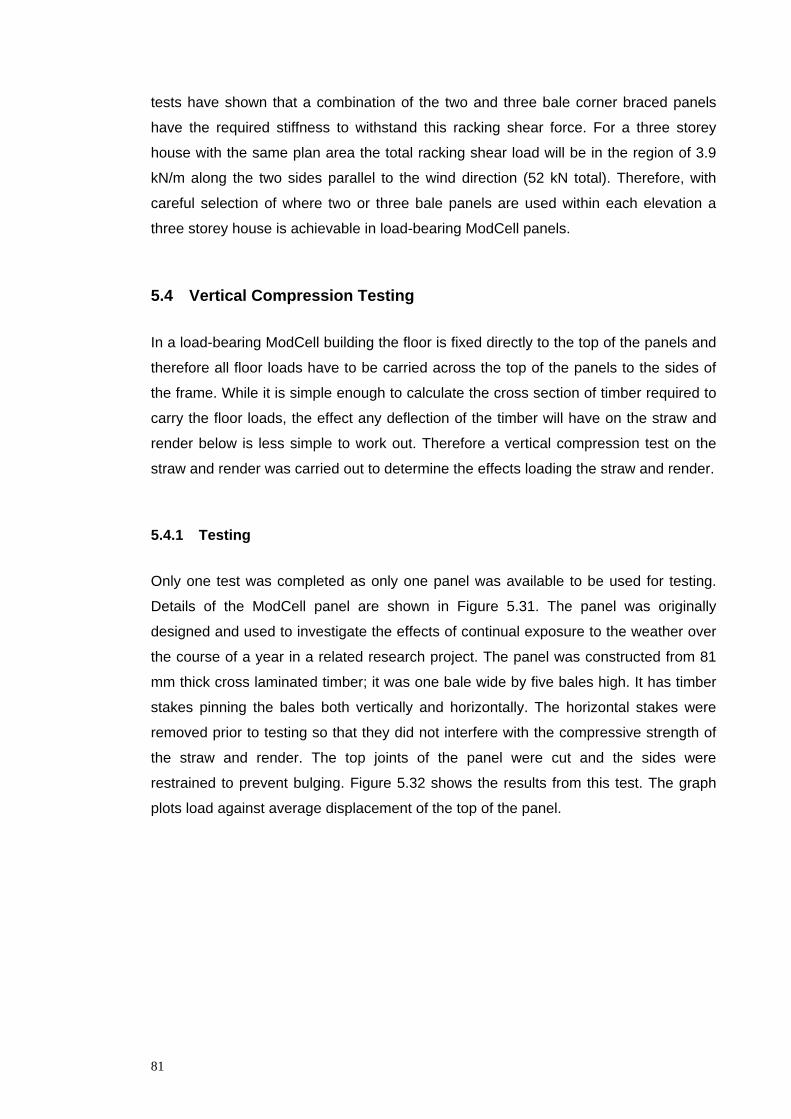
tests have shown that a combination of the two and three bale corner braced panels
have the required stiffness to withstand this racking shear force. For a three storey
house with the same plan area the total racking shear load will be in the region of 3.9
kN/m along the two sides parallel to the wind direction (52 kN total). Therefore, with
careful selection of where two or three bale panels are used within each elevation a
three storey house is achievable in load-bearing ModCell panels.
5.4 Vertical Compression Testing
In a load-bearing ModCell building the floor is fixed directly to the top of the panels and
therefore all floor loads have to be carried across the top of the panels to the sides of
the frame. While it is simple enough to calculate the cross section of timber required to
carry the floor loads, the effect any deflection of the timber will have on the straw and
render below is less simple to work out. Therefore a vertical compression test on the
straw and render was carried out to determine the effects loading the straw and render.
5.4.1 Testing
Only one test was completed as only one panel was available to be used for testing.
Details of the ModCell panel are shown in Figure 5.31. The panel was originally
designed and used to investigate the effects of continual exposure to the weather over
the course of a year in a related research project. The panel was constructed from 81
mm thick cross laminated timber; it was one bale wide by five bales high. It has timber
stakes pinning the bales both vertically and horizontally. The horizontal stakes were
removed prior to testing so that they did not interfere with the compressive strength of
the straw and render. The top joints of the panel were cut and the sides were
restrained to prevent bulging. Figure 5.32 shows the results from this test. The graph
plots load against average displacement of the top of the panel.
81
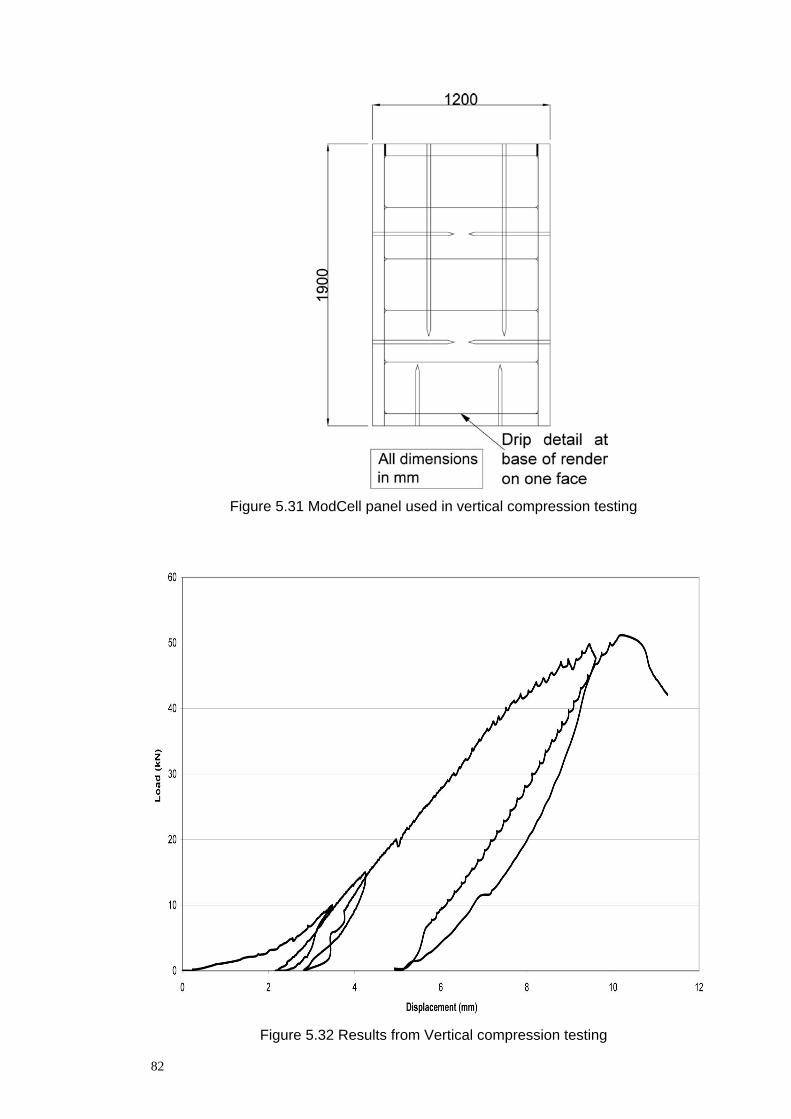
Figure 5.31 ModCell panel used in vertical compression testing
Figure 5.32 Results from Vertical compression testing
82
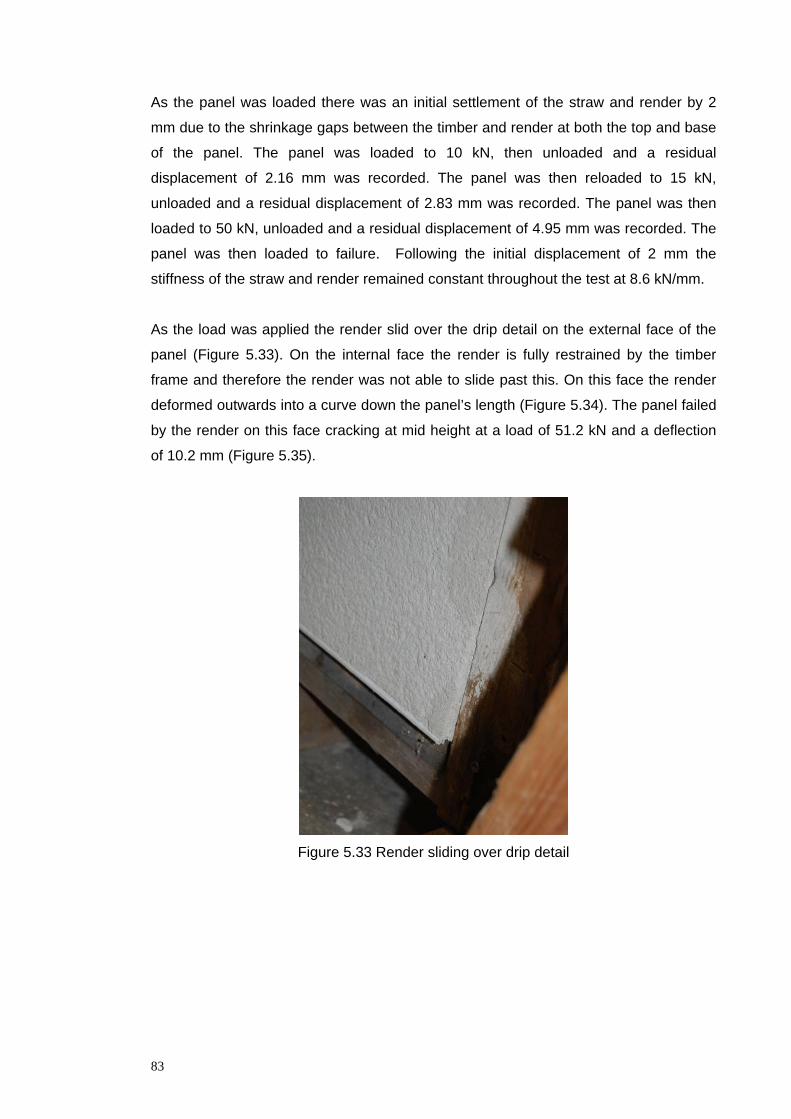
As the panel was loaded there was an initial settlement of the straw and render by 2
mm due to the shrinkage gaps between the timber and render at both the top and base
of the panel. The panel was loaded to 10 kN, then unloaded and a residual
displacement of 2.16 mm was recorded. The panel was then reloaded to 15 kN,
unloaded and a residual displacement of 2.83 mm was recorded. The panel was then
loaded to 50 kN, unloaded and a residual displacement of 4.95 mm was recorded. The
panel was then loaded to failure. Following the initial displacement of 2 mm the
stiffness of the straw and render remained constant throughout the test at 8.6 kN/mm.
As the load was applied the render slid over the drip detail on the external face of the
panel (Figure 5.33). On the internal face the render is fully restrained by the timber
frame and therefore the render was not able to slide past this. On this face the render
deformed outwards into a curve down the panel’s length (Figure 5.34). The panel failed
by the render on this face cracking at mid height at a load of 51.2 kN and a deflection
of 10.2 mm (Figure 5.35).
Figure 5.33 Render sliding over drip detail
83
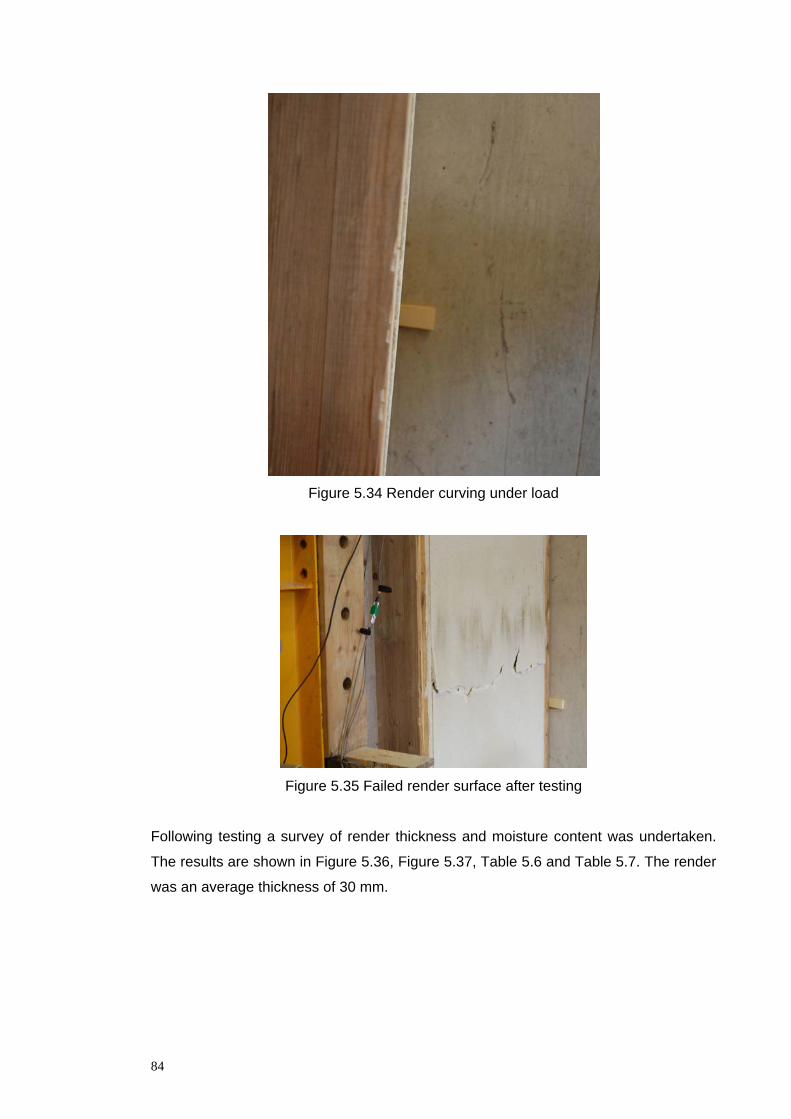
Figure 5.34 Render curving under load
Figure 5.35 Failed render surface after testing
Following testing a survey of render thickness and moisture content was undertaken.
The results are shown in Figure 5.36, Figure 5.37, Table 5.6 and Table 5.7. The render
was an average thickness of 30 mm.
84
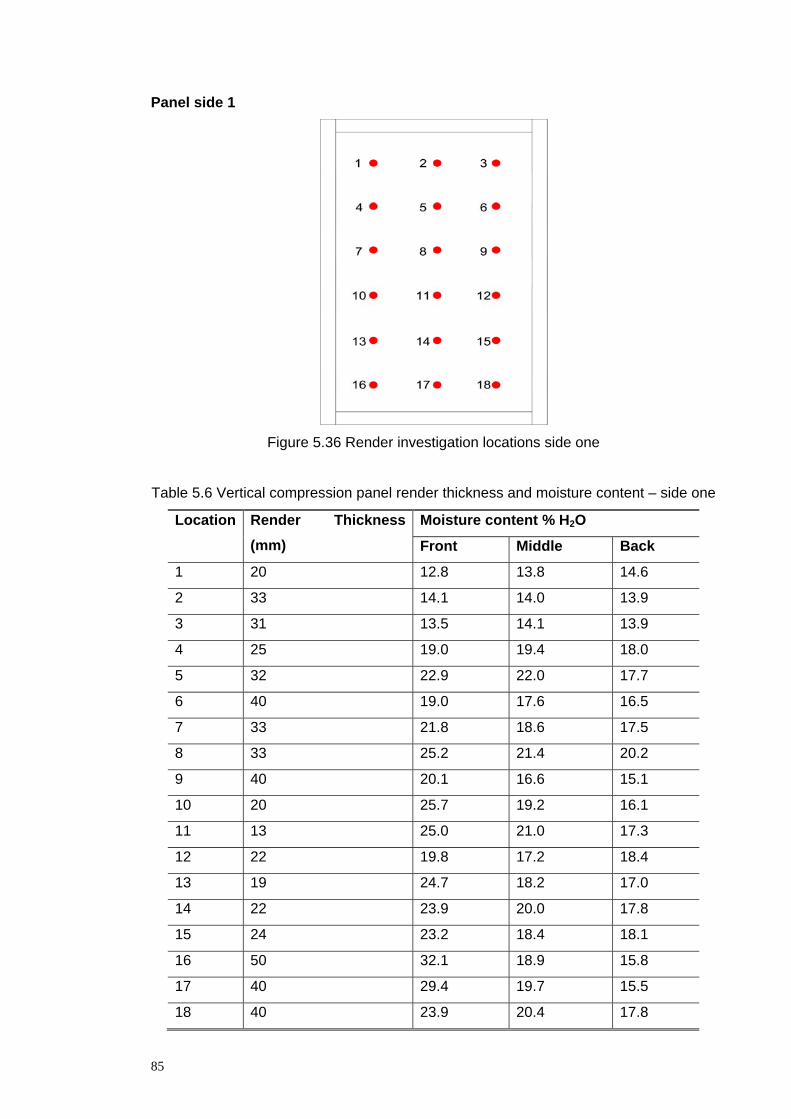
Panel side 1
Figure 5.36 Render investigation locations side one
Table 5.6 Vertical compression panel render thickness and moisture content – side one
Location Render Thickness Moisture content % H2O (mm) Front Middle Back
1 20 12.8 13.8 14.6
2 33 14.1 14.0 13.9
3 31 13.5 14.1 13.9
4 25 19.0 19.4 18.0
5 32 22.9 22.0 17.7
6 40 19.0 17.6 16.5
7 33 21.8 18.6 17.5
8 33 25.2 21.4 20.2
9 40 20.1 16.6 15.1
10 20 25.7 19.2 16.1
11 13 25.0 21.0 17.3
12 22 19.8 17.2 18.4
13 19 24.7 18.2 17.0
14 22 23.9 20.0 17.8
15 24 23.2 18.4 18.1
16 50 32.1 18.9 15.8
17 40 29.4 19.7 15.5
18 40 23.9 20.4 17.8
85
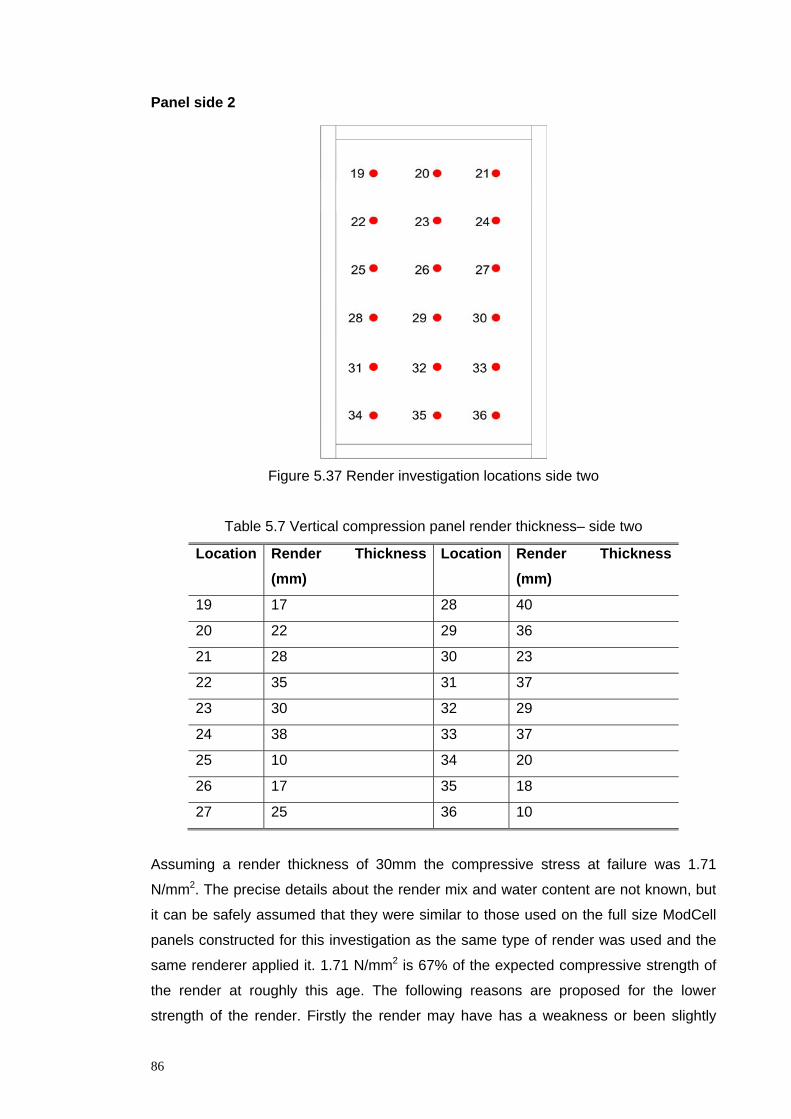
Panel side 2
Figure 5.37 Render investigation locations side two
Table 5.7 Vertical compression panel render thickness– side two
Location Render Thickness (mm)
Location Render Thickness (mm)
19 17 28 40
20 22 29 36
21 28 30 23
22 35 31 37
23 30 32 29
24 38 33 37
25 10 34 20
26 17 35 18
27 25 36 10
Assuming a render thickness of 30mm the compressive stress at failure was 1.71
N/mm2. The precise details about the render mix and water content are not known, but
it can be safely assumed that they were similar to those used on the full size ModCell
panels constructed for this investigation as the same type of render was used and the
same renderer applied it. 1.71 N/mm2 is 67% of the expected compressive strength of
the render at roughly this age. The following reasons are proposed for the lower
strength of the render. Firstly the render may have has a weakness or been slightly
86
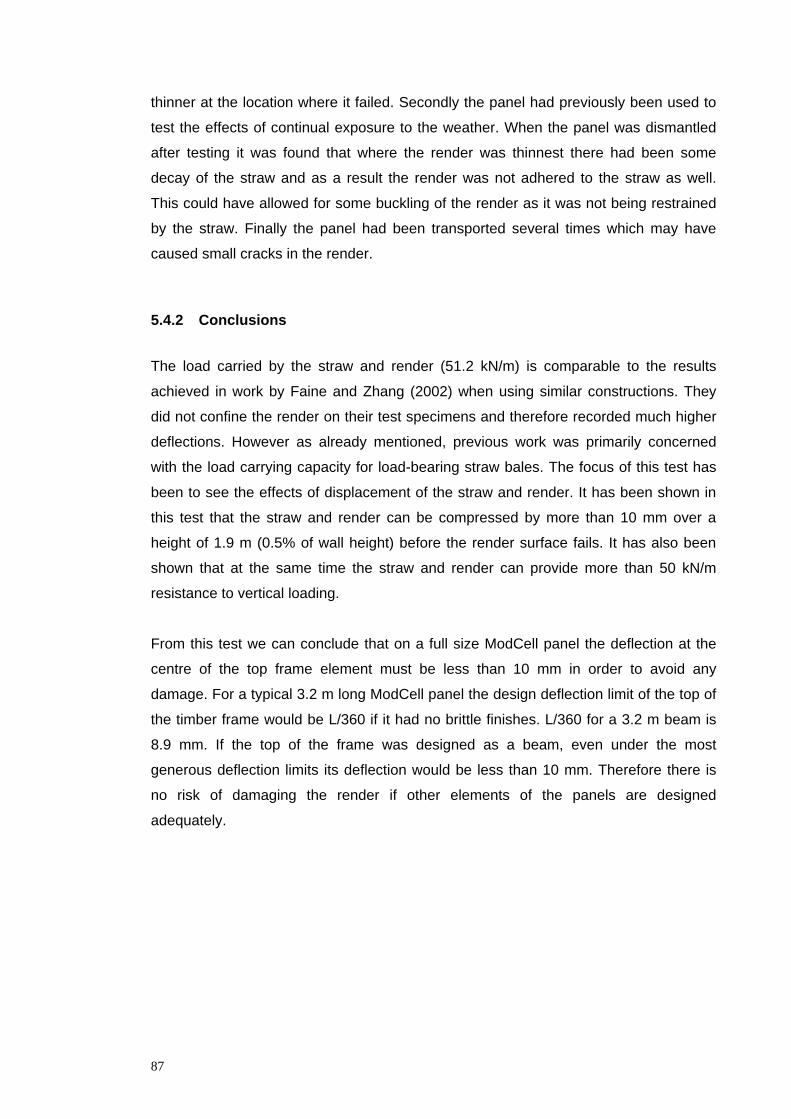
thinner at the location where it failed. Secondly the panel had previously been used to
test the effects of continual exposure to the weather. When the panel was dismantled
after testing it was found that where the render was thinnest there had been some
decay of the straw and as a result the render was not adhered to the straw as well.
This could have allowed for some buckling of the render as it was not being restrained
by the straw. Finally the panel had been transported several times which may have
caused small cracks in the render.
5.4.2 Conclusions
The load carried by the straw and render (51.2 kN/m) is comparable to the results
achieved in work by Faine and Zhang (2002) when using similar constructions. They
did not confine the render on their test specimens and therefore recorded much higher
deflections. However as already mentioned, previous work was primarily concerned
with the load carrying capacity for load-bearing straw bales. The focus of this test has
been to see the effects of displacement of the straw and render. It has been shown in
this test that the straw and render can be compressed by more than 10 mm over a
height of 1.9 m (0.5% of wall height) before the render surface fails. It has also been
shown that at the same time the straw and render can provide more than 50 kN/m
resistance to vertical loading.
From this test we can conclude that on a full size ModCell panel the deflection at the
centre of the top frame element must be less than 10 mm in order to avoid any
damage. For a typical 3.2 m long ModCell panel the design deflection limit of the top of
the timber frame would be L/360 if it had no brittle finishes. L/360 for a 3.2 m beam is
8.9 mm. If the top of the frame was designed as a beam, even under the most
generous deflection limits its deflection would be less than 10 mm. Therefore there is
no risk of damaging the render if other elements of the panels are designed
adequately.
87
6 Computer Modelling of Racking Shear
6.1 Introduction
A computer model to predict the racking shear performance of the ModCell panels was
developed during this investigation. It is hoped that the model will allow for design
changes to be made and tested very easily and at minimal cost. If these changes
produce promising results in the model then full scale testing may be considered. It is
also hoped that the model will allow greater understanding of how ModCell panels
behave structurally when being loaded. The modelling and analysis was carried out
using Robot Millennium v 17.5.0.1764 (2004).
6.2 The design of the computer Model
The computer model was initially designed in two dimensions to allow ease of
modelling and quick development. As only in plane loads are being considered a two
dimensional model is perfectly adequate. Additionally three dimensional structures can
easily be created from two dimensional panels, so the capabilities of the model are not
restricted by starting off in two dimensions.
The two dimensional model of a single panel consists of the frame, render, bracing and
reinforcement. The frame was modelled using simple bar elements. The corner joints in
the frame have rotational stiffness and vertical stiffness derived from the laboratory
testing which differ in opening and closing. Between the frame and the render there are
elements with very low stiffness that represent the shrinkage gap between the render
and timber frame on the real panels. The vertical reinforcement bars were modelled
using simple bar elements. These were pin jointed at each end to the timber frame.
The corer bracing was modelled in the same way. The render surface was modelled
using a finite element membrane between the elements with low stiffness that
represent the shrinkage gap. When the frame is loaded these elements will deflect and
the render membrane will start to bear onto the timber frame. The finite element render
membrane runs over the reinforcing bars and corner braces. No attempt was made to
separate it from these elements.
88
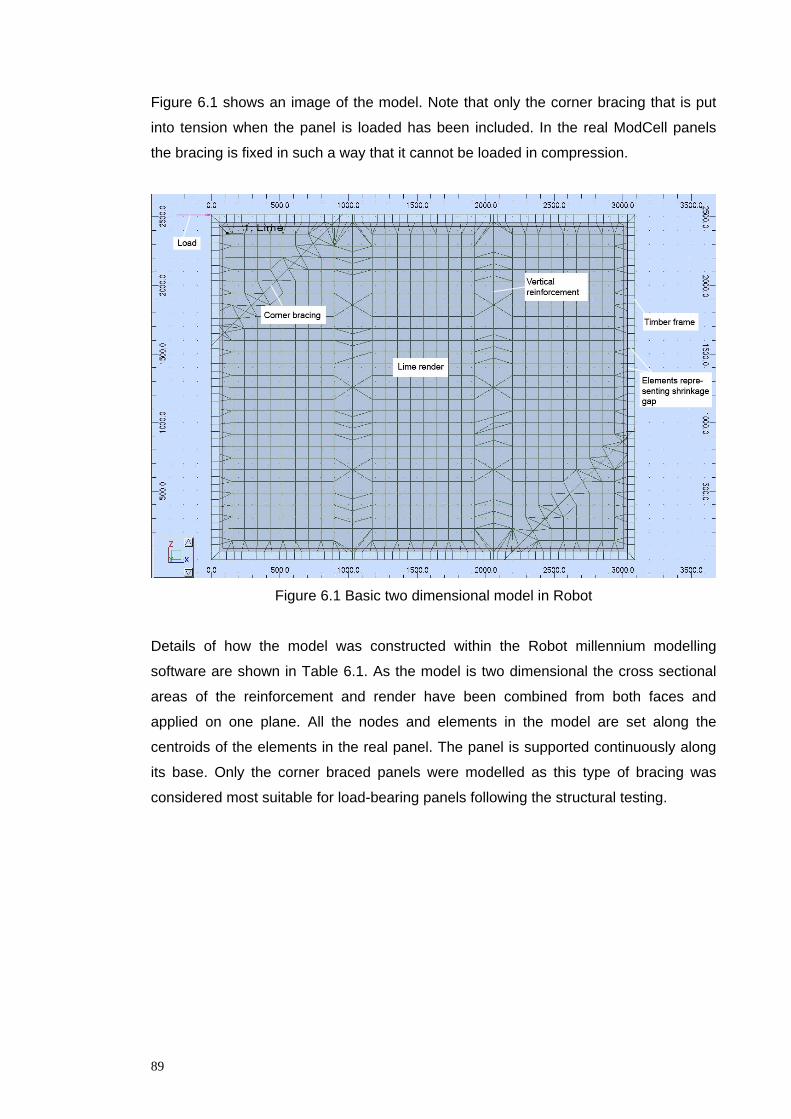
Figure 6.1 shows an image of the model. Note that only the corner bracing that is put
into tension when the panel is loaded has been included. In the real ModCell panels
the bracing is fixed in such a way that it cannot be loaded in compression.
Figure 6.1 Basic two dimensional model in Robot
Details of how the model was constructed within the Robot millennium modelling
software are shown in Table 6.1. As the model is two dimensional the cross sectional
areas of the reinforcement and render have been combined from both faces and
applied on one plane. All the nodes and elements in the model are set along the
centroids of the elements in the real panel. The panel is supported continuously along
its base. Only the corner braced panels were modelled as this type of bracing was
considered most suitable for load-bearing panels following the structural testing.
89
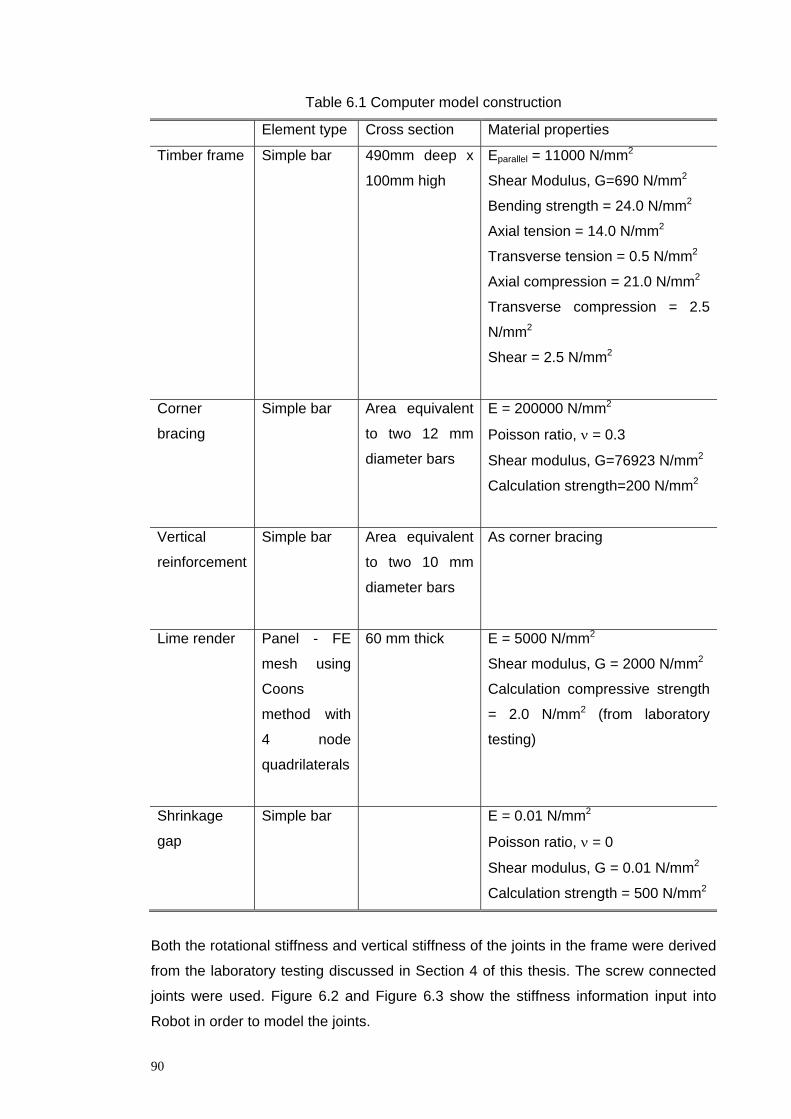
Table 6.1 Computer model construction
Element type Cross section Material properties
Timber frame Simple bar 490mm deep x
100mm high
Eparallel = 11000 N/mm2
Shear Modulus, G=690 N/mm2
Bending strength = 24.0 N/mm2
Axial tension = 14.0 N/mm2
Transverse tension = 0.5 N/mm2
Axial compression = 21.0 N/mm2
Transverse compression = 2.5
N/mm2
Shear = 2.5 N/mm2
Corner
bracing
Simple bar Area equivalent
to two 12 mm
diameter bars
E = 200000 N/mm2
Poisson ratio, ν = 0.3
Shear modulus, G=76923 N/mm2
Calculation strength=200 N/mm2
Vertical
reinforcement
Simple bar Area equivalent
to two 10 mm
diameter bars
As corner bracing
Lime render Panel - FE
mesh using
Coons
method with
4 node
quadrilaterals
60 mm thick E = 5000 N/mm2
Shear modulus, G = 2000 N/mm2
Calculation compressive strength
= 2.0 N/mm2 (from laboratory
testing)
Shrinkage
gap
Simple bar E = 0.01 N/mm2
Poisson ratio, ν = 0
Shear modulus, G = 0.01 N/mm2
Calculation strength = 500 N/mm2
Both the rotational stiffness and vertical stiffness of the joints in the frame were derived
from the laboratory testing discussed in Section 4 of this thesis. The screw connected
joints were used. Figure 6.2 and Figure 6.3 show the stiffness information input into
Robot in order to model the joints.
90
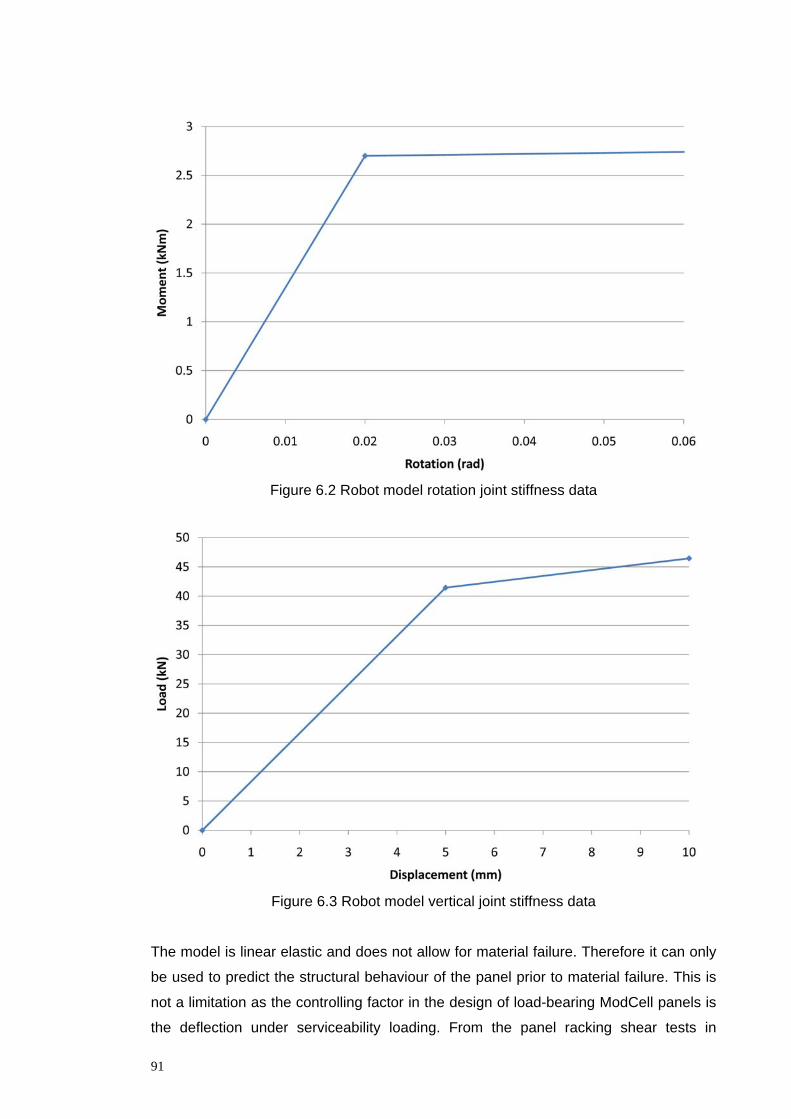
Figure 6.2 Robot model rotation joint stiffness data
Figure 6.3 Robot model vertical joint stiffness data
The model is linear elastic and does not allow for material failure. Therefore it can only
be used to predict the structural behaviour of the panel prior to material failure. This is
not a limitation as the controlling factor in the design of load-bearing ModCell panels is
the deflection under serviceability loading. From the panel racking shear tests in
91
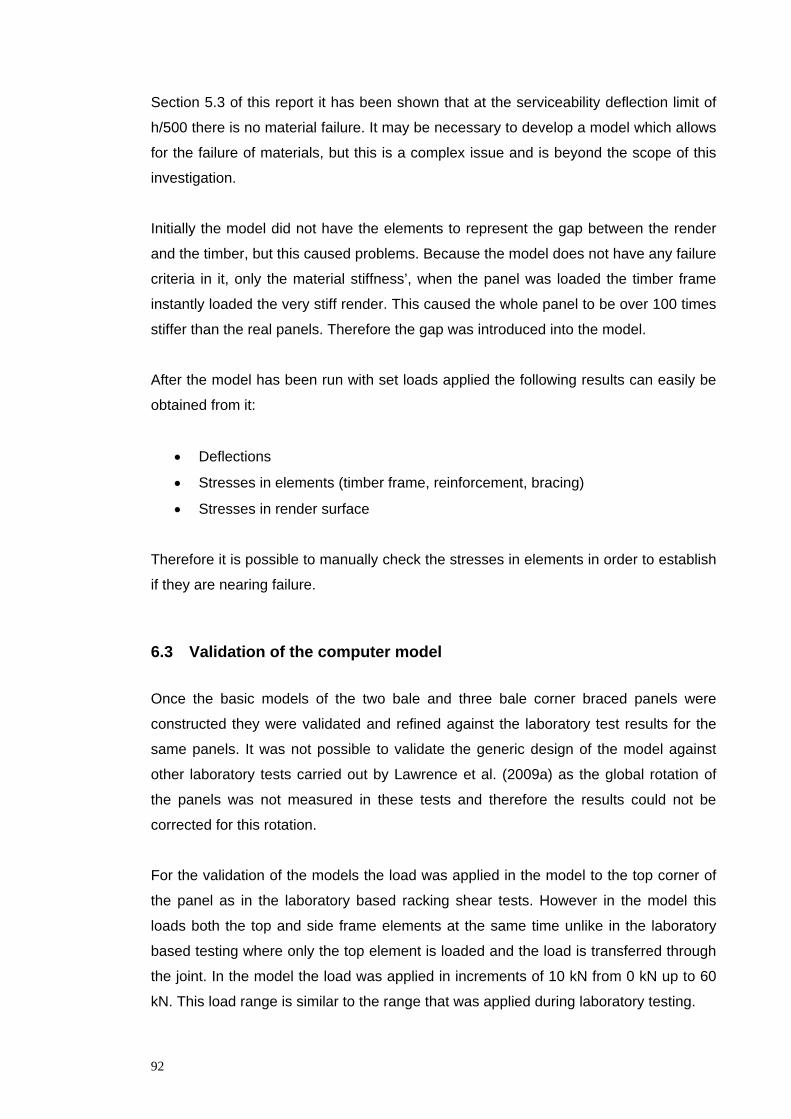
Section 5.3 of this report it has been shown that at the serviceability deflection limit of
h/500 there is no material failure. It may be necessary to develop a model which allows
for the failure of materials, but this is a complex issue and is beyond the scope of this
investigation.
Initially the model did not have the elements to represent the gap between the render
and the timber, but this caused problems. Because the model does not have any failure
criteria in it, only the material stiffness’, when the panel was loaded the timber frame
instantly loaded the very stiff render. This caused the whole panel to be over 100 times
stiffer than the real panels. Therefore the gap was introduced into the model.
After the model has been run with set loads applied the following results can easily be
obtained from it:
• Deflections
• Stresses in elements (timber frame, reinforcement, bracing)
• Stresses in render surface
Therefore it is possible to manually check the stresses in elements in order to establish
if they are nearing failure.
6.3 Validation of the computer model
Once the basic models of the two bale and three bale corner braced panels were
constructed they were validated and refined against the laboratory test results for the
same panels. It was not possible to validate the generic design of the model against
other laboratory tests carried out by Lawrence et al. (2009a) as the global rotation of
the panels was not measured in these tests and therefore the results could not be
corrected for this rotation.
For the validation of the models the load was applied in the model to the top corner of
the panel as in the laboratory based racking shear tests. However in the model this
loads both the top and side frame elements at the same time unlike in the laboratory
based testing where only the top element is loaded and the load is transferred through
the joint. In the model the load was applied in increments of 10 kN from 0 kN up to 60
kN. This load range is similar to the range that was applied during laboratory testing.
92
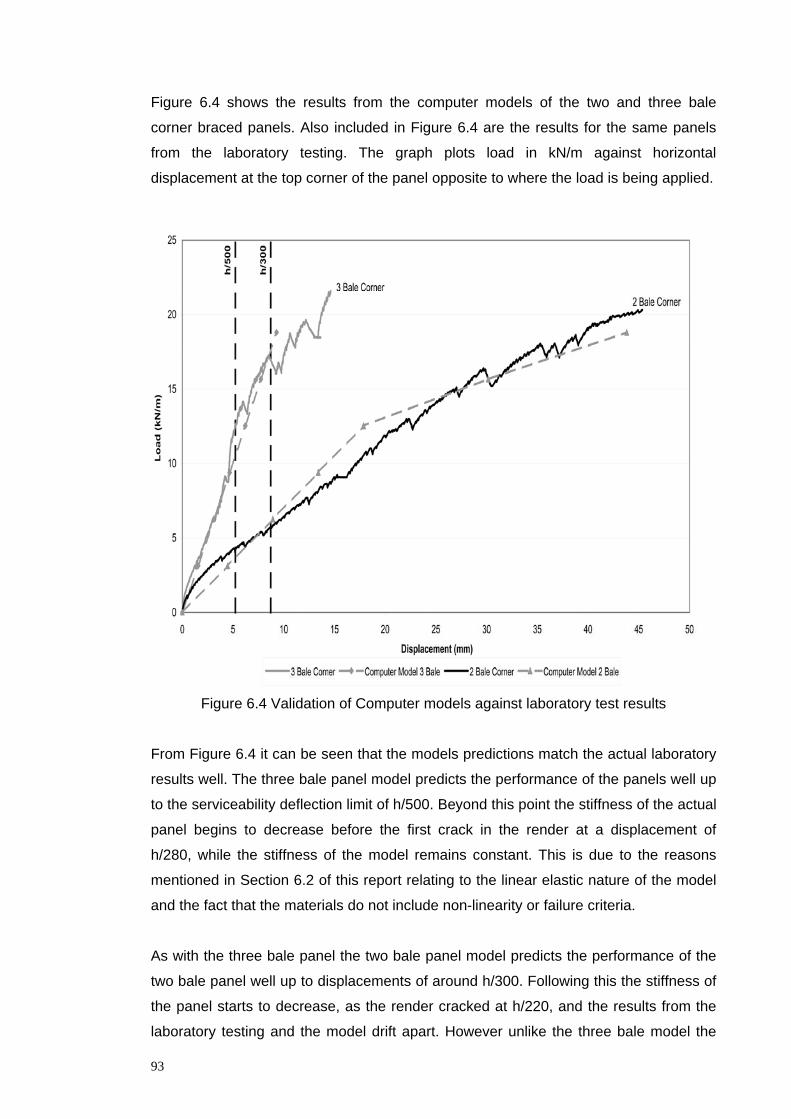
Figure 6.4 shows the results from the computer models of the two and three bale
corner braced panels. Also included in Figure 6.4 are the results for the same panels
from the laboratory testing. The graph plots load in kN/m against horizontal
displacement at the top corner of the panel opposite to where the load is being applied.
Figure 6.4 Validation of Computer models against laboratory test results
From Figure 6.4 it can be seen that the models predictions match the actual laboratory
results well. The three bale panel model predicts the performance of the panels well up
to the serviceability deflection limit of h/500. Beyond this point the stiffness of the actual
panel begins to decrease before the first crack in the render at a displacement of
h/280, while the stiffness of the model remains constant. This is due to the reasons
mentioned in Section 6.2 of this report relating to the linear elastic nature of the model
and the fact that the materials do not include non-linearity or failure criteria.
As with the three bale panel the two bale panel model predicts the performance of the
two bale panel well up to displacements of around h/300. Following this the stiffness of
the panel starts to decrease, as the render cracked at h/220, and the results from the
laboratory testing and the model drift apart. However unlike the three bale model the
93
two bale model predicts a change in stiffness at a load of 12.5 kN/m. There is also
another very slight change in stiffness at a load of 15.7 kN/m. These changes in
stiffness are due to the bilinear rotational and vertical stiffness’ of the joints in the
model. Because of this the model predicts the performance of the two bale panel well
over the entire load range, slightly over predicting its strength at around 8 to 12 kN/m
and under predicting at the end of the load range.
The three bale model did not exhibit these changes in stiffness as the panel is much
stiffer overall and therefore the joints do not reach the required rotation of 0.02 radians
for the stiffness to change (see Figure 6.2). However in the actual panels it is not only
the change joint stiffness that causes the changes in stiffness of the whole panel. This
is largely due to the render crushing and cracking. Therefore even though the two bale
model appears to predict the performance well across the entire load range it is in fact
doing this solely based on the changing joint stiffness.
Within the serviceability displacement range both models are sufficiently accurate and
therefore very useful to this investigation and the future development of load-bearing
ModCell panels. It would have been preferable to validate the models against further
laboratory tests, but that was not possible within the remit of this investigation. Further
laboratory tests will be under taken in the continuing development of ModCell panels,
so it may be possible to utilise the results from those to further validate the models
following the conclusion of this investigation.
6.4 Parametric Analysis
A parametric analysis was carried out on the three bale panel model in order to see the
effects on the structural performance when certain elements were changed. During this
the following were changed and analysed one at a time:
• frame thickness
• render thickness
• layout of vertical reinforcement
• layout of bracing
• fixity of the joints
94
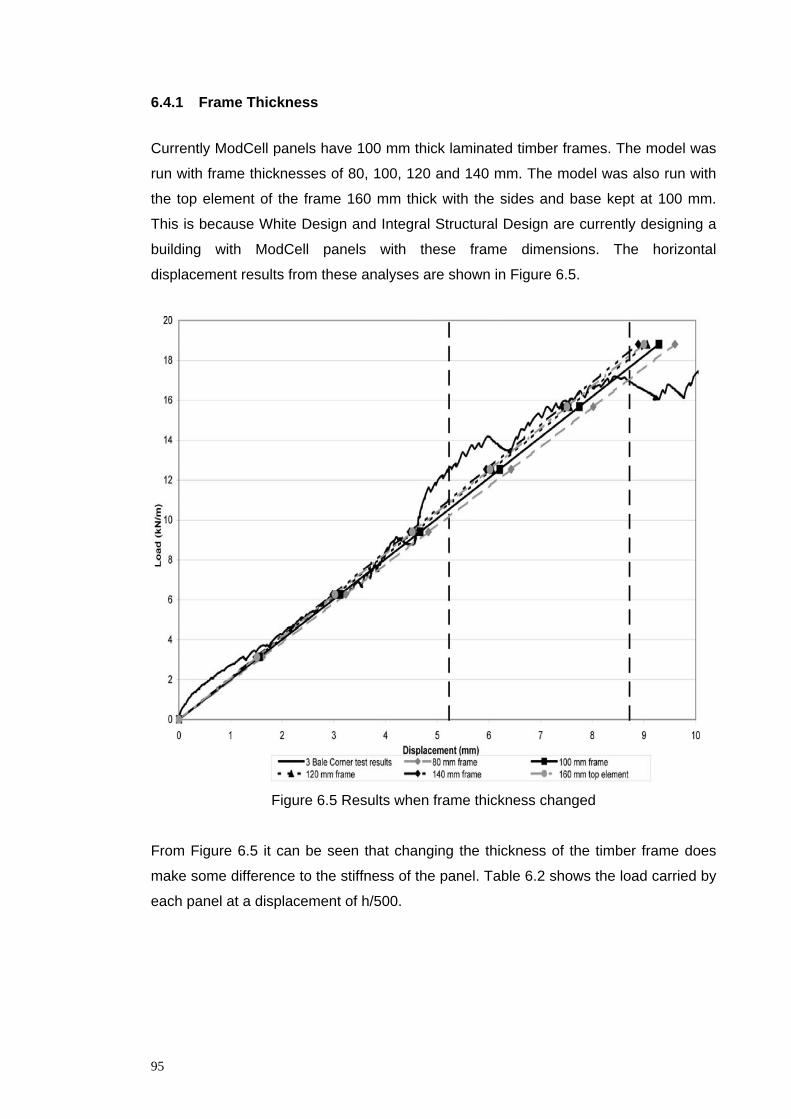
6.4.1 Frame Thickness
Currently ModCell panels have 100 mm thick laminated timber frames. The model was
run with frame thicknesses of 80, 100, 120 and 140 mm. The model was also run with
the top element of the frame 160 mm thick with the sides and base kept at 100 mm.
This is because White Design and Integral Structural Design are currently designing a
building with ModCell panels with these frame dimensions. The horizontal
displacement results from these analyses are shown in Figure 6.5.
Figure 6.5 Results when frame thickness changed
From Figure 6.5 it can be seen that changing the thickness of the timber frame does
make some difference to the stiffness of the panel. Table 6.2 shows the load carried by
each panel at a displacement of h/500.
95
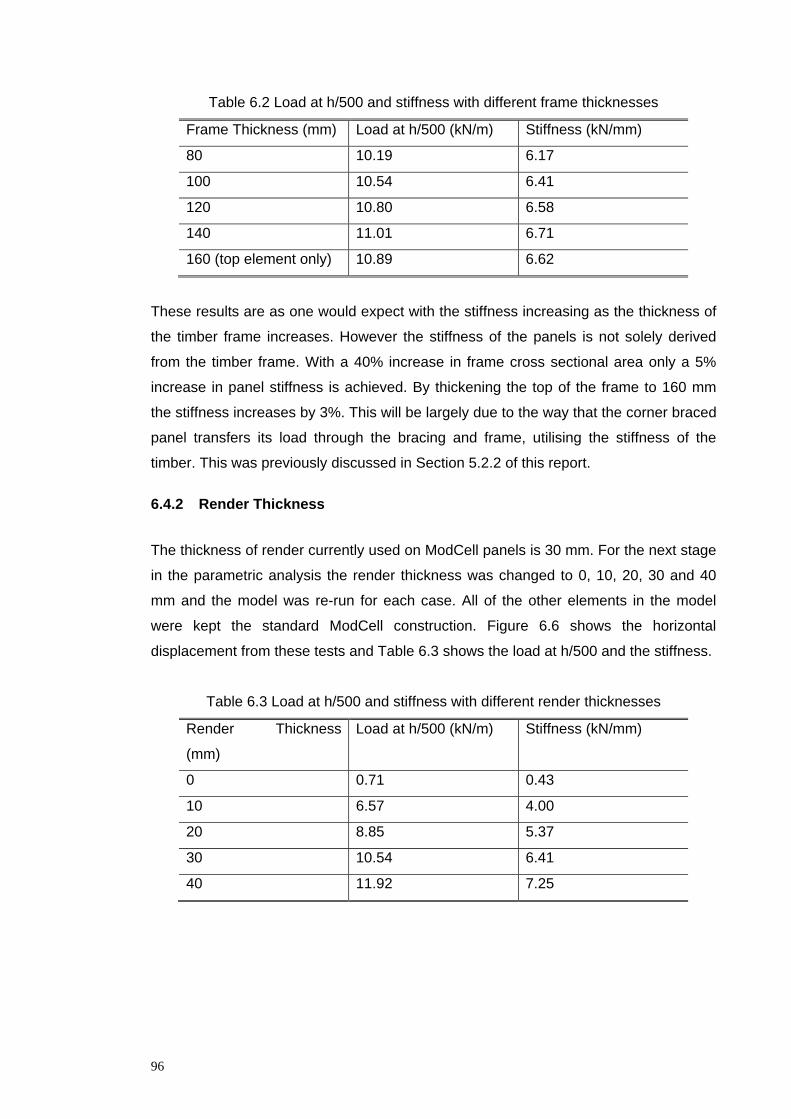
Table 6.2 Load at h/500 and stiffness with different frame thicknesses
Frame Thickness (mm) Load at h/500 (kN/m) Stiffness (kN/mm)
80 10.19 6.17
100 10.54 6.41
120 10.80 6.58
140 11.01 6.71
160 (top element only) 10.89 6.62
These results are as one would expect with the stiffness increasing as the thickness of
the timber frame increases. However the stiffness of the panels is not solely derived
from the timber frame. With a 40% increase in frame cross sectional area only a 5%
increase in panel stiffness is achieved. By thickening the top of the frame to 160 mm
the stiffness increases by 3%. This will be largely due to the way that the corner braced
panel transfers its load through the bracing and frame, utilising the stiffness of the
timber. This was previously discussed in Section 5.2.2 of this report.
6.4.2 Render Thickness
The thickness of render currently used on ModCell panels is 30 mm. For the next stage
in the parametric analysis the render thickness was changed to 0, 10, 20, 30 and 40
mm and the model was re-run for each case. All of the other elements in the model
were kept the standard ModCell construction. Figure 6.6 shows the horizontal
displacement from these tests and Table 6.3 shows the load at h/500 and the stiffness.
Table 6.3 Load at h/500 and stiffness with different render thicknesses
Render Thickness
(mm)
Load at h/500 (kN/m) Stiffness (kN/mm)
0 0.71 0.43
10 6.57 4.00
20 8.85 5.37
30 10.54 6.41
40 11.92 7.25
96
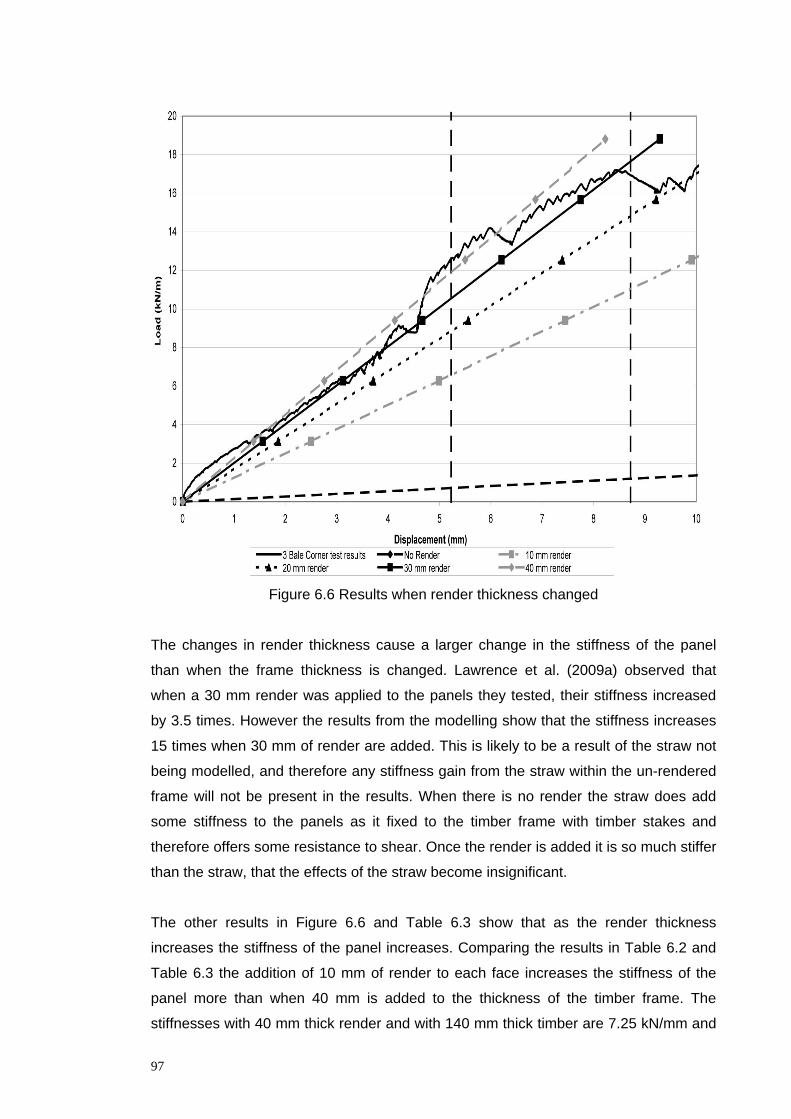
Figure 6.6 Results when render thickness changed
The changes in render thickness cause a larger change in the stiffness of the panel
than when the frame thickness is changed. Lawrence et al. (2009a) observed that
when a 30 mm render was applied to the panels they tested, their stiffness increased
by 3.5 times. However the results from the modelling show that the stiffness increases
15 times when 30 mm of render are added. This is likely to be a result of the straw not
being modelled, and therefore any stiffness gain from the straw within the un-rendered
frame will not be present in the results. When there is no render the straw does add
some stiffness to the panels as it fixed to the timber frame with timber stakes and
therefore offers some resistance to shear. Once the render is added it is so much stiffer
than the straw, that the effects of the straw become insignificant.
The other results in Figure 6.6 and Table 6.3 show that as the render thickness
increases the stiffness of the panel increases. Comparing the results in Table 6.2 and
Table 6.3 the addition of 10 mm of render to each face increases the stiffness of the
panel more than when 40 mm is added to the thickness of the timber frame. The
stiffnesses with 40 mm thick render and with 140 mm thick timber are 7.25 kN/mm and
97
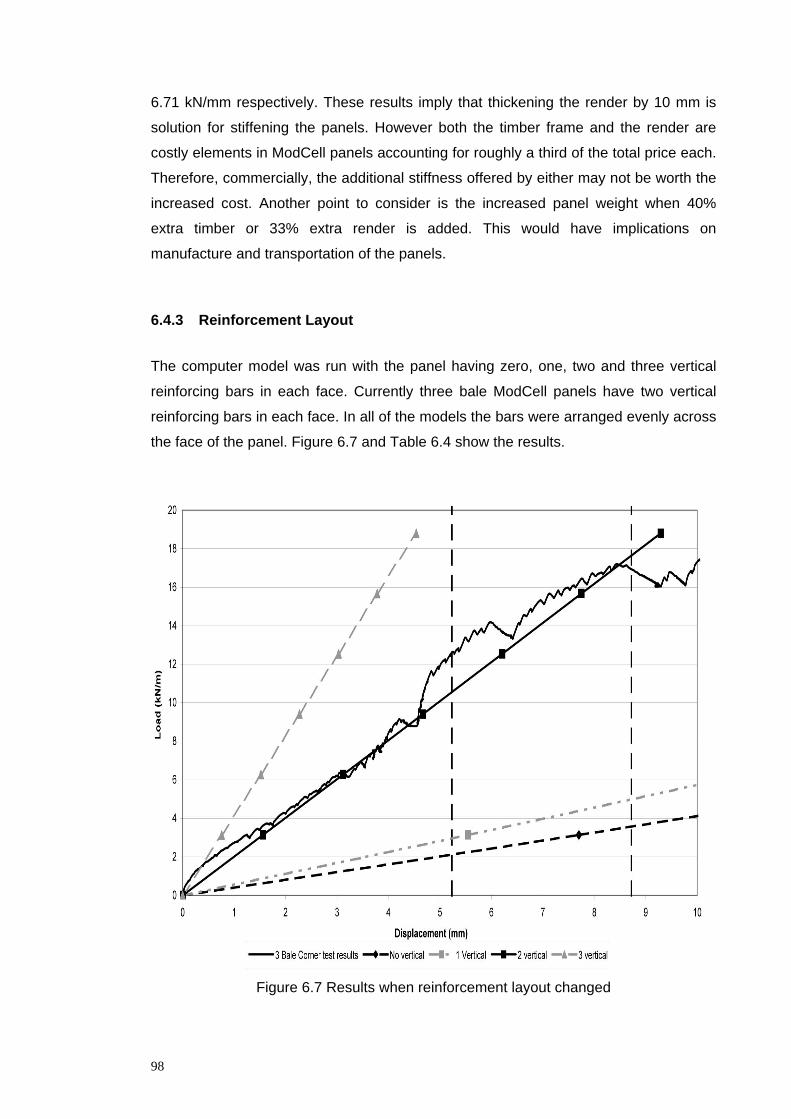
6.71 kN/mm respectively. These results imply that thickening the render by 10 mm is
solution for stiffening the panels. However both the timber frame and the render are
costly elements in ModCell panels accounting for roughly a third of the total price each.
Therefore, commercially, the additional stiffness offered by either may not be worth the
increased cost. Another point to consider is the increased panel weight when 40%
extra timber or 33% extra render is added. This would have implications on
manufacture and transportation of the panels.
6.4.3 Reinforcement Layout
The computer model was run with the panel having zero, one, two and three vertical
reinforcing bars in each face. Currently three bale ModCell panels have two vertical
reinforcing bars in each face. In all of the models the bars were arranged evenly across
the face of the panel. Figure 6.7 and Table 6.4 show the results.
Figure 6.7 Results when reinforcement layout changed
98
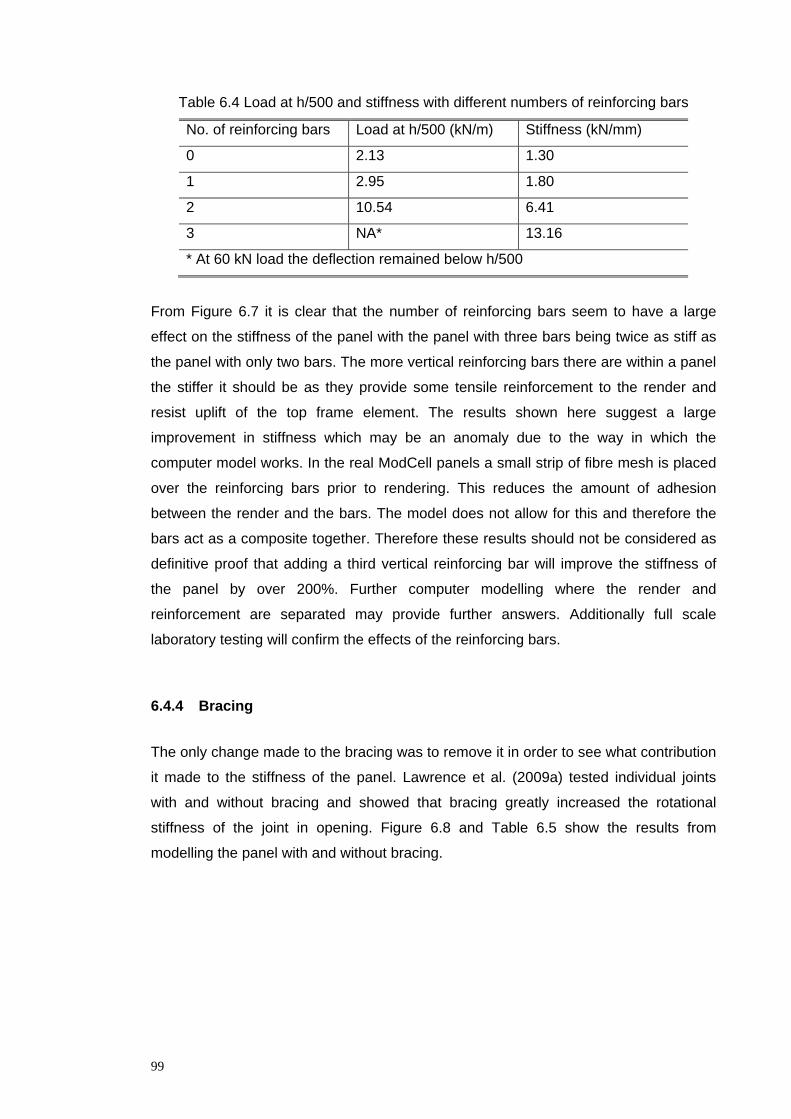
Table 6.4 Load at h/500 and stiffness with different numbers of reinforcing bars
No. of reinforcing bars Load at h/500 (kN/m) Stiffness (kN/mm)
0 2.13 1.30
1 2.95 1.80
2 10.54 6.41
3 NA* 13.16
* At 60 kN load the deflection remained below h/500
From Figure 6.7 it is clear that the number of reinforcing bars seem to have a large
effect on the stiffness of the panel with the panel with three bars being twice as stiff as
the panel with only two bars. The more vertical reinforcing bars there are within a panel
the stiffer it should be as they provide some tensile reinforcement to the render and
resist uplift of the top frame element. The results shown here suggest a large
improvement in stiffness which may be an anomaly due to the way in which the
computer model works. In the real ModCell panels a small strip of fibre mesh is placed
over the reinforcing bars prior to rendering. This reduces the amount of adhesion
between the render and the bars. The model does not allow for this and therefore the
bars act as a composite together. Therefore these results should not be considered as
definitive proof that adding a third vertical reinforcing bar will improve the stiffness of
the panel by over 200%. Further computer modelling where the render and
reinforcement are separated may provide further answers. Additionally full scale
laboratory testing will confirm the effects of the reinforcing bars.
6.4.4 Bracing
The only change made to the bracing was to remove it in order to see what contribution
it made to the stiffness of the panel. Lawrence et al. (2009a) tested individual joints
with and without bracing and showed that bracing greatly increased the rotational
stiffness of the joint in opening. Figure 6.8 and Table 6.5 show the results from
modelling the panel with and without bracing.
99
Figure 6.8 Results when bracing changed
Table 6.5 Load at h/500 and stiffness with and without bracing
Bracing Load at h/500 (kN/m) Stiffness (kN/mm)
With bracing 10.54 6.41
Without bracing 6.11 3.73
From these results it can be seen that the panel with bracing is stiffer, as one would
expect. As previously mentioned Lawrence et al. (2009a) observed that bracing
increased the stiffness of the joints they tested significantly. The effects of this can be
seen here in these results with the braced panels having nearly twice the stiffness of
the panel without bracing. Therefore corner bracing should be used in all load-bearing
ModCell panels as it increases the stiffness at minimal cost and effort.
100
6.4.5 Joints
The three bale panel was modelled with fully fixed joints, pinned joints and ‘normal’
joints (joints with the stiffness’s detailed in Section 6.2 of this report). While it is almost
impossible to construct fully fixed joints and purely pinned joints, therefore meaning
they would never be used on a real panel, it is interesting to see their affect on the
stiffness of the panel. Figure 6.9 and Table 6.6 show the results from this modelling.
Figure 6.9 Results when joints changed
Table 6.6 Load at h/500 and stiffness with different joints
Joint Load at h/500 (kN/m) Stiffness (kN/mm)
Fixed 16.04 9.80
Pinned 10.39 6.29
‘Normal’ 10.54 6.41
Figure 6.9 and Table 6.6 show that fixed joints increase the stiffness of the panel by
roughly 50%. This is a greater increase in stiffness than when the frame and the render
101
were increased in thickness. The pinned joint only reduced the stiffness of the frame by
a very small amount when compared to the actual joints. This is because the pinned
joint is pinned both rotationally and vertically. Therefore while it has no rotational
stiffness it does have infinite vertical stiffness. The actual joint is semi-rigid and has
some rotational stiffness and some vertical stiffness. As a result the pinned joint is
rotating more under load than the normal joint, but it is not pulling apart vertically and
therefore the results for both panels are very similar.
6.4.6 Further investigation of Joints
Richards (2009) investigated the rotational stiffness of ModCell panel joints as part of a
final year undergraduate dissertation project. Three joint types were tested; a screw
connected joint using washer head screws; a glued joint using standard head screws
with glue between the joining surfaces; and a gusset plate joint using standard head
screws and triangular plywood gusset plates across the joint. Details of the joints are
shown in Figure 6.10. The joints were tested using the same method set out in Section
3.4.2 of this report. The results from the testing undertaken by Richards (2009) are
shown in Figure 6.11 and Figure 6.12.
Richards (2009) comments that the gusset plate joints are considerably stiffer than the
screw connected joints, but that failure is brittle and is likely to cause premature failure
of the render when the gusset plate buckles. Also noted is the fact that the other joints
have an ultimate strength limit between 5-6 kN in opening and 2-3 kN in closing, but
that the glued joints are initially stiffer than the screw connected joints.
The stiffness data from the glued and gusset plate joint tests was used in the three bale
panel computer model to assess the effects the different joint designs might have on
the overall performance of the panel. As none of the joints were tested in vertical pull
out the vertical stiffness of the joints in the model were kept as per the ‘normal’ joint
(see Figure 6.3). The stiffness profiles for the glued and gusset plate joints used for
modelling are shown in Figure 6.13.
102
Figure 6.10 Joints tested by Richards (2009), Washer head screw (top), glued (middle),
gusset plate (bottom)
103
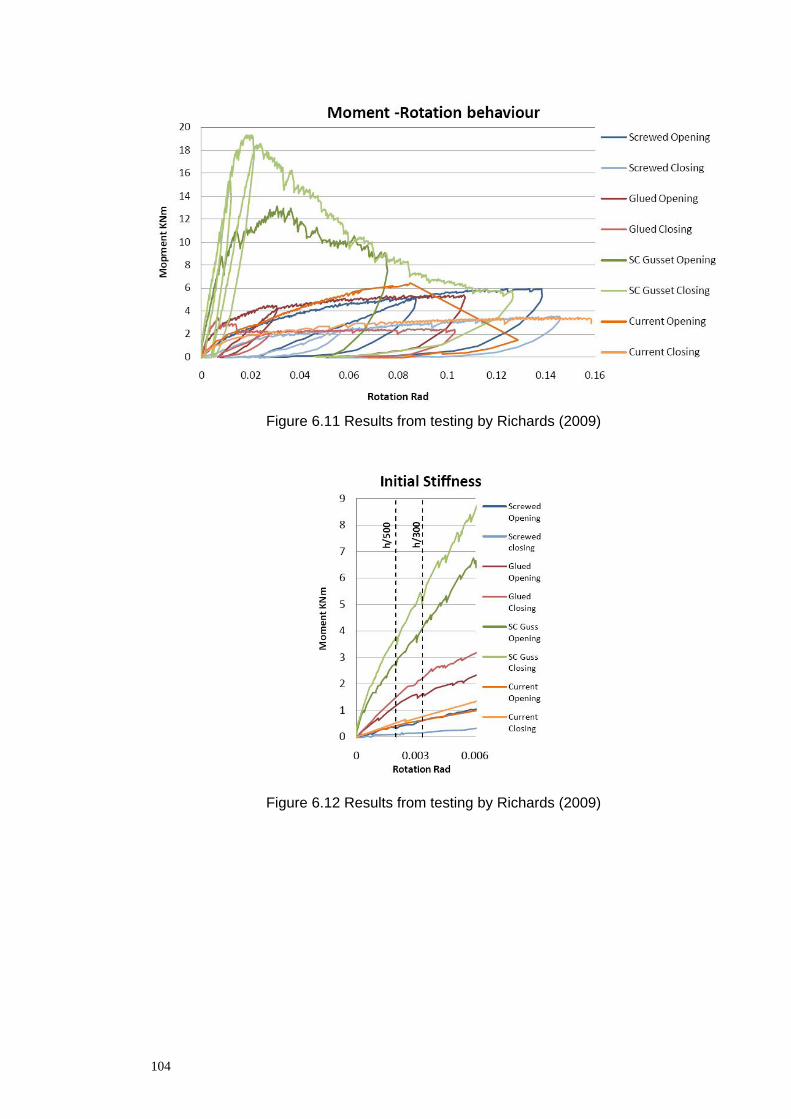
Figure 6.11 Results from testing by Richards (2009)
Figure 6.12 Results from testing by Richards (2009)
104
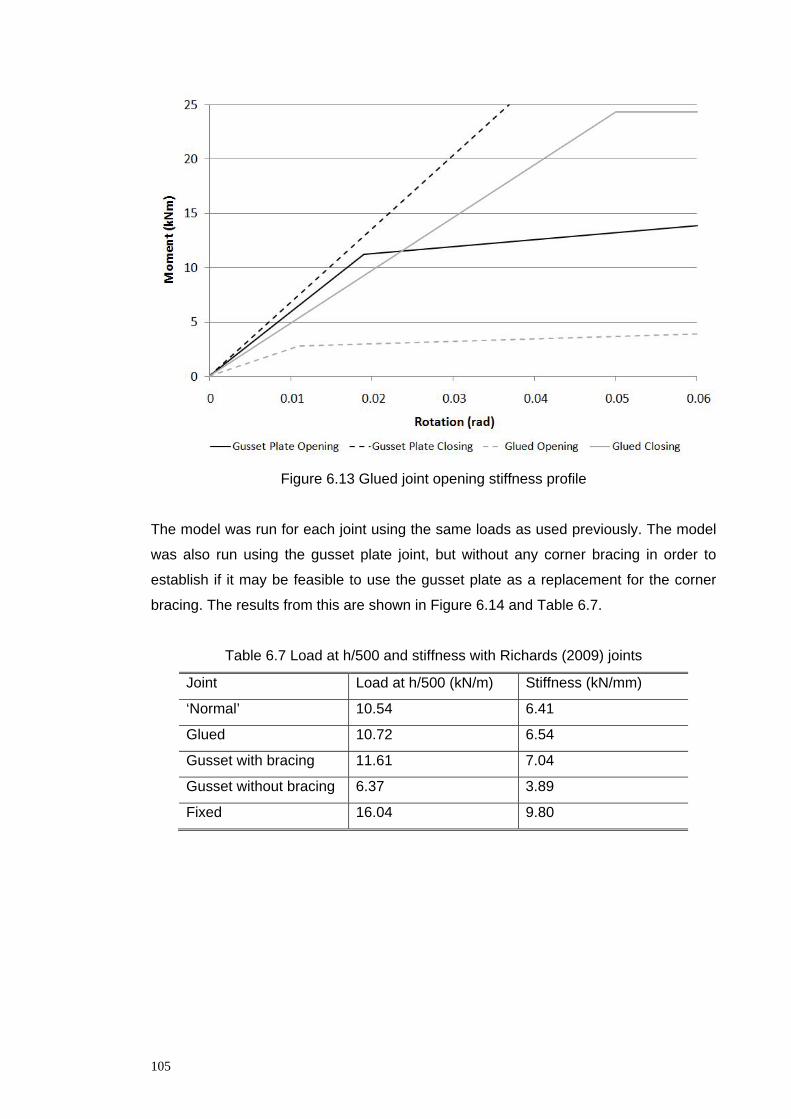
Figure 6.13 Glued joint opening stiffness profile
The model was run for each joint using the same loads as used previously. The model
was also run using the gusset plate joint, but without any corner bracing in order to
establish if it may be feasible to use the gusset plate as a replacement for the corner
bracing. The results from this are shown in Figure 6.14 and Table 6.7.
Table 6.7 Load at h/500 and stiffness with Richards (2009) joints
Joint Load at h/500 (kN/m) Stiffness (kN/mm)
‘Normal’ 10.54 6.41
Glued 10.72 6.54
Gusset with bracing 11.61 7.04
Gusset without bracing 6.37 3.89
Fixed 16.04 9.80
105
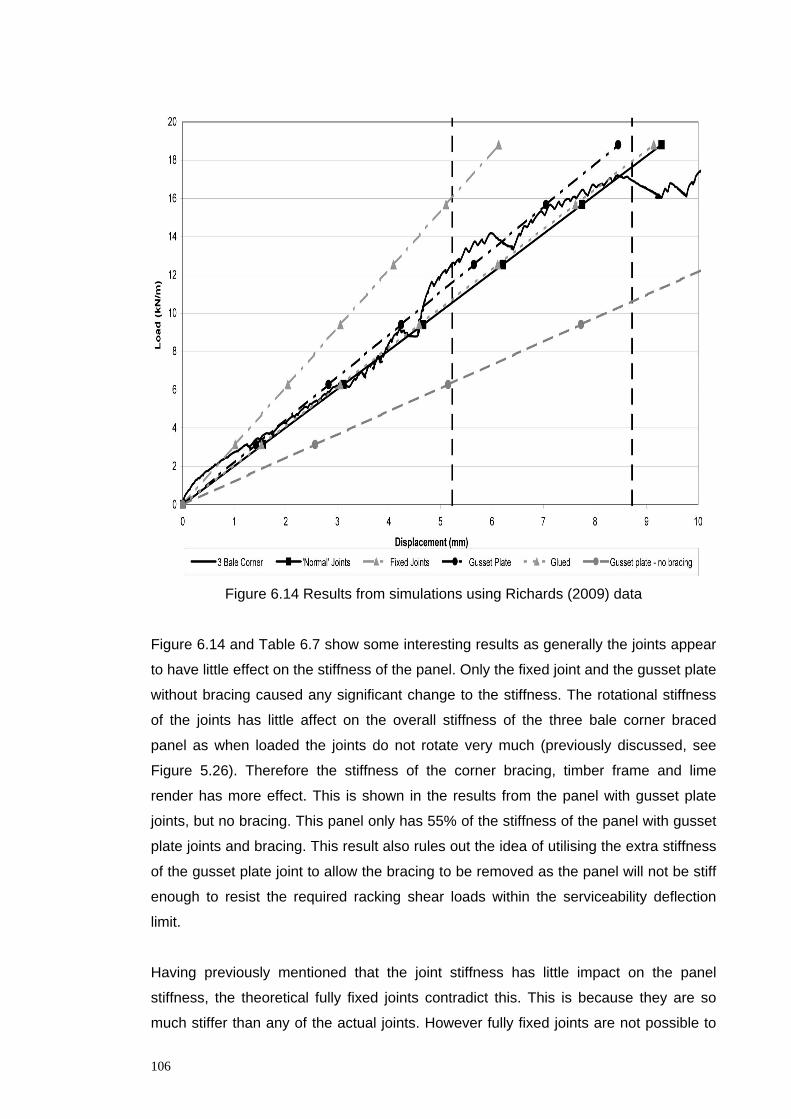
Figure 6.14 Results from simulations using Richards (2009) data
Figure 6.14 and Table 6.7 show some interesting results as generally the joints appear
to have little effect on the stiffness of the panel. Only the fixed joint and the gusset plate
without bracing caused any significant change to the stiffness. The rotational stiffness
of the joints has little affect on the overall stiffness of the three bale corner braced
panel as when loaded the joints do not rotate very much (previously discussed, see
Figure 5.26). Therefore the stiffness of the corner bracing, timber frame and lime
render has more effect. This is shown in the results from the panel with gusset plate
joints, but no bracing. This panel only has 55% of the stiffness of the panel with gusset
plate joints and bracing. This result also rules out the idea of utilising the extra stiffness
of the gusset plate joint to allow the bracing to be removed as the panel will not be stiff
enough to resist the required racking shear loads within the serviceability deflection
limit.
Having previously mentioned that the joint stiffness has little impact on the panel
stiffness, the theoretical fully fixed joints contradict this. This is because they are so
much stiffer than any of the actual joints. However fully fixed joints are not possible to
106
design or construct in reality when using timber with screw fixings and therefore should
not be considered for use on load-bearing ModCell panels.
6.4.7 Summary of Parametric Analysis
From the parametric analysis it can be concluded that increasing the frame thickness
or the render thickness increases the stiffness of the ModCell panel. The influence of
the vertical reinforcement is slightly less clear as the increase in stiffness when using
three reinforcing bars appears to have been exaggerated. However, it can reasonably
be suggested that using three bars instead of two would increase the stiffness of the
panel as the extra bar will further reinforce the render and increase the resistance to
uplift of the top of the frame. The corner bracing adds greatly to the stiffness of the
panel, but the corner joints do not.
From the results of this analysis a panel has been designed that incorporates the most
suitable elements from the parametric analysis to create a stronger panel. Details of
the panel design are below:
• 100 mm thick frame with 160 mm thick top
• 40 mm thick render
• Two vertical reinforcing bars
• Corner bracing
• Gusset plate joints
The majority of the frame has been kept at 100 mm as increasing this adds a lot of
extra material to the panel. The top of the frame has been increased to 160 mm as this
is a newly developed detail for ModCell panels and allows the first floor to be supported
directly from the top of the panels. As shown in the analysis above it also adds some
stiffness to the panel. The render thickness has been increase to 40 mm as this alone
increases the stiffness by 13%. Two vertical reinforcing bars have been used as the
results from this analysis were dubious; therefore they have been disregarded for this
exercise. The corner bracing has been maintained as it adds significantly to the
stiffness of the panels. Finally a gusset plate joint has been used as it increases the
stiffness of the panels by nearly 10%. This panel was modelled Robot and the analysis
run. The results are shown in Figure 6.15 along with the test results for the actual three
bale corner braced panel and the model results for the same panel.
107
Figure 6.15 Results from model for improved panel design
The improved panel is 20% stiffer than the normal ModCell panel and it is able to resist
over 2 kN/m additional load at the serviceability displacement limit of h/500. This is the
type of application the Robot computer model has been developed for. It has shown
favourable results for this panel design, and therefore it might now be considered for
full scale laboratory testing. This however is beyond the scope of this investigation.
6.5 ModCell building at Bath
A full scale test building is being planned as part of a current ModCell research project
at the University of Bath. At the time of writing the building is still being built. The
building has been modelled using the Robot model previously discussed as it is a good
opportunity to investigate how the model predicts the performance of entire wall panels
and whole buildings in three dimensions. It is also a good opportunity to investigate
how joining panels together affects their racking stiffness. The ground floor plan and an
elevation for the proposed building are shown in Figure 6.16 and Figure 6.17.
108
Figure 6.16 Ground floor plan of ModCell building at Bath
Figure 6.17 West elevation of ModCell building at Bath
Initially one elevation of the building was modelled and then from this the whole
building has been modelled in three dimensions. The models are shown in Figure 6.18
and Figure 6.19. In a ModCell building the panels are joined together using plywood
strips screwed across the joint between the panels. This provides an almost continuous
connection along the panel edges. Therefore in the model the panels have been
modelled fully fixed together. The three dimensional model is simplified as it does not
include the first floor structure, but it is hoped it will be a good basis for future use of the
model as a development tool.
109
Figure 6.18 ModCell building model elevation
Figure 6.19 ModCell building three dimensional model
The elevation and the three dimensional model were loaded with the serviceability
wind. For a building of this size the total wind load is in the order of 35kN. In the
building this load will be carried by the two walls parallel to the direction of the wind.
Therefore for the elevation the loading was halved to 17.5 kN applied as two loads of
8.75 kN, one at first floor level and one at roof level. For the three dimensional model
the same load was applied to two walls parallel to one another bringing the total load
up to 35 kN. The models were run and the results are shown in Table 6.8. Average
deflections are shown for both first floor level and for roof level.
110
Table 6.8 Deflection and stiffness results from ModCell building model
Model
Average deflection at serviceability load
(mm)
First Floor Roof
Elevation 2.18 4.61
3D loaded in x direction 1.94 3.52
3D loaded in y direction 1.92 4.04
The serviceability deflection limits of h/500 for the first floor and the roof are 5.23 mm
and 10.46 mm respectively. From Table 6.8 all of the deflections are well within these
limits. The difference in the deflections in the x and y directions on the three
dimensional model are due to different layouts of panels on each elevation. In the three
dimensional model only the panels themselves were modelled. In the planned building,
and also within other ModCell buildings, there are floors and internal walls which can
be designed as shear walls. For example the shear walls can be constructed from solid
timber or rammed earth and the effects on the buildings structural performance using
these two materials will vary. However, all internal shear walls will stiffen the building
and therefore the results displayed here are likely to be un-conservative.
The construction and then running of these models shows it is possible to develop the
basic two dimensional model into more complex elevations and entire buildings. Ideally
these results would be verified against testing of the actual structures. Unfortunately
due to the scale this was not feasible during this investigation.
6.6 Future use of the model
The computer models have been developed in order to further understand load-bearing
ModCell panels, but also to allow further development of ModCell panels. It is hoped
that the model will be used by ModCell in their own development programme and also
by future researchers working within the University of Bath who may potentially want to
develop the model further as well as the panels. It is hoped that the model will allow for
fast and more cost effective research and development as ideas can be trialled using
the model and then if they produce promising results more costly laboratory testing can
be undertaken.
111
6.7 Conclusions
Computer models of the two and three bale corner braced panels have been
developed and successfully validated against laboratory test results for the same
panels and therefore it can be said that the models are a success. However further
validation against future laboratory testing would be useful in allowing further
refinement of the models.
Parametric analysis has been carried out on the three bale panel model. This has
shown that increasing the frame thickness or render thickness increases the stiffness
of the panel. It has also shown that the corner joints have little effect on the stiffness of
the panel, but that corner bracing does significantly enhance it. The parametric analysis
has not shown the true effect of the vertical reinforcement on panel stiffness due to the
way that the model was designed.
The models have proved useful in showing the potential increase in panel stiffness
when the joints, render thickness and the thickness of the top of the frame are
changed. The modelling of this panel design has shown the potential for a 20%
increase in stiffness. Further investigation of this in the laboratory may now be
considered, but it is beyond the scope of this investigation.
The modelling of both a wall elevation and entire three dimensional model of a future
ModCell building has shown that the basic two dimensional model can be adapted and
used to create more complex models.
112

7 Conclusions and Recommendations
7.1 Conclusions
Overall this research into the structural performance of load-bearing ModCell panels
has been successful and provided some valuable results. The structural testing has
proven the potential for ModCell panels to be used in load-bearing construction.
Computer modelling has been carried out for the first time and has improved the
understanding of how the panels behave structurally.
Before this investigation load-bearing ModCell panels had only been used once in a
temporary building. Through this investigation it has been shown that it is possible for
ModCell panels to be used in up to three storey load-bearing structures.
This investigation has built on the work by Lawrence et al. (2009a) where it was
observed that the joints did not provide sufficient resistance alone to racking shear
forces and that corner bracing greatly increased their stiffness. The parametric analysis
of the computer model in this investigation has built on these findings by examining the
effects of these and other elements of the panels to the overall stiffness of the panels.
Long term testing of the lime render strength has raised some interesting questions
which currently remain unanswered. This is the first time long term testing has been
carried out with this render and has shown the strength peaks at 28 days. Following
this the strength drops off. The reasons for this are not yet fully understood and should
be investigated further.
Joint testing had allowed the development of a suitable corner joint that does not fail
during racking shear tests. The testing of other types of joint has proven that screw
connected joints are the most suitable. Further testing on the screw connected joints
has shown that both the screws in shear and in tension have an equal role in providing
strength in the joint. This investigation has also shown that the screw connected joint
strength can be calculated using Eurocode 5 by comparison of calculated and test
derived strengths. Additionally the rotational stiffness of the screw connected joint has
been found which has allowed the development of a computer model.
The panels from the Grand Designs Live house showed that transportation should be
kept to a minimum in order to avoid excessive damage to the render. Testing of the
113
panels showed how important build quality is to the structural strength of ModCell
panels which is particularly important if they are to be used in load-bearing
construction. The controlled demolition of the panels following testing showed the
extent of water ingress into the straw and the damage this had caused. The damage
occurred in a short space of time and therefore it is vital that ModCell panels are kept
dry and covered before installation into a building.
Racking shear testing of four further ModCell panels has proven that the joints are now
adequate and do not fail during racking shear. These tests also showed that using
cross bracing does not offer any structural advantage over corner bracing. From the
results of these racking shear tests alone the ModCell panels tested are stiff enough to
be used in load-bearing construction at two and three storeys. These tests should
however be repeated in order to verify the results.
The vertical compression test showed that the straw and render is strong enough to
withstand loads of over 50 kN/m and vertical displacements of over 10 mm. This has
proven that some deflection of the top element of the frames will be acceptable when
loaded by a floor and therefore it is not necessary to use extra beams above the panels
to support the floor. Additionally the results are comparable with those of Faine and
Zhang (2002).
Developing a computer model of ModCell panels has already proven useful in
determining the potential effect of changing the joint stiffness. It is hoped that the model
will be developed further in the future and that it will allow a better understanding of
how ModCell panels behave structurally.
A computer model of load-bearing ModCell panels has been developed and verified
against the laboratory test results for the two and three bale corner braced panels. The
model is accurate within the linear elastic ranges of the panels only as it does not allow
for material failure. It is hoped that the model will aid future development of ModCell
panels. This investigation has also shown that these basic two and three bale models
can easily be compiled into entire elevations or buildings made from ModCell panels in
order that analysis can take place in three dimensions.
Parametric analysis using the computer model of the three bale computer corner
braced panel has shown the effects on structural performance of changing certain
elements within the panel. It has shown that all elements within the panels have an
114
effect on the stiffness of the panels, but that some have more effect than others.
Interestingly it has shown, with the use of some work by Richards (2009), that the
rotational stiffness of the joints has very little effect on overall panel stiffness. It has
also been shown that by combining several changes the stiffness of the panel can be
increased by 20%.
This investigation set out with the aims of improving the ModCell panels so that they
could be used in two or three storey load-bearing construction and developing an
accurate computer model that could predict their structural performance. Both of these
aims have been achieved and have also raised some new questions that need to be
answered. However, the future of load-bearing ModCell panels looks promising.
7.2 Recommendations for Further Work
All laboratory testing and investigation tends to answer many questions, but also raise
many other questions and this investigation has been no exception. While full size
racking shear testing has been completed on four panels, they were all of different
designs. Therefore further testing on identical panels is recommended in order to fully
verify the results. More test results will also help in further validating and refining the
computer models.
The panels that have been tested have all been designed as load-bearing panels. They
have not been tested for vertical load as it is known from design calculations following
Eurocode 5 that they are sufficient. However the effect of vertical load on the racking
performance has not been considered. This should be considered in further testing
work as in a building there will always be some vertical load applied to the top of the
panels. The effects of this upon racking shear resistance are unknown. It will reduce
the uplift of the top element of the frame and therefore could reduce the displacements
under racking loads, but additionally once the panel begins to rack there will be an
eccentric vertical load which will have a tendency to increase the horizontal
displacements.
Only single panels have been tested to date. Within a building the panels will be
connected to their neighbours. This may have an effect on the stiffness of the panels
and is therefore something that should be considered during further work. Other
elements that are present in completed buildings and were not considered during
testing are the first and second floors and internal walls. In current ModCell building
115
design these are both solid timber panels and hence may offer considerable stiffness.
This should be considered during further work.
Dynamic testing could also be considered during further work. Often the loadings
structures are put under during their use are short term and dynamic. The racking
shear loads applied to panels during this investigation are representative of wind
loading which is very short term due to the sudden gusts of the wind. The effects of
sudden loading and unloading should be investigated as if the deflections of the
structure are too large then the occupants will feel the structure swaying which is
undesirable and can be very disconcerting.
There are a couple of pieces of further work that could be undertaken on the computer
models, although it is hoped that these will generally be used to further the
development of the panels. Firstly they could be developed to include render failure.
Even though the behaviour of the panels post render failure is not the most critical
criteria in their design it would allow for investigation of this. Secondly the three
dimensional model of the ModCell building could be further developed to include a first
floor and internal walls. This would allow the effects of these to be further investigated.
Finally the effects of long term exposure of ModCell panels should be considered
during future research. The Grand Designs panels tested during this thesis had been
exposed to the weather when unprotected and had straw moisture contents above 25
% H2O. Such high moisture contents are not likely to affect the short term strength of
ModCell panels, however in the long term the straw will begin to decompose which will
affect the bond with the render. The effects of long term exposure and its
consequences should be investigated and measures put in place to minimise the
potential for the panels to be subjected to the weather before they are installed in a
building.
116
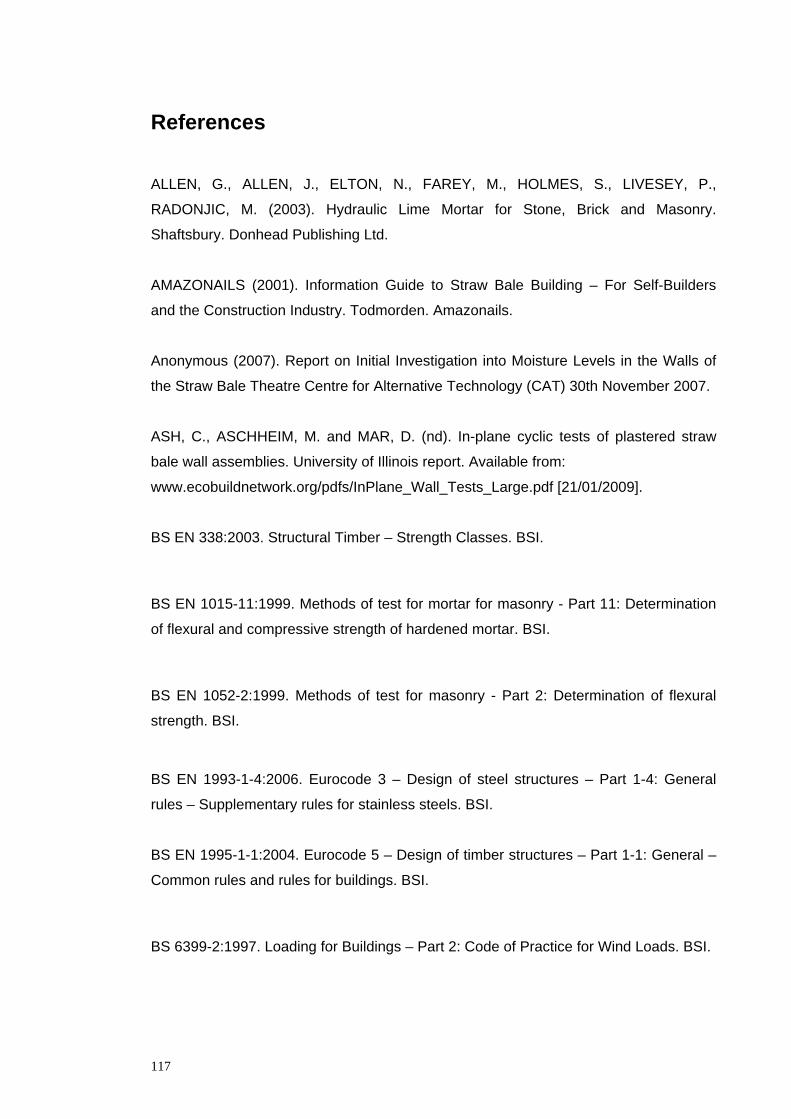
References
ALLEN, G., ALLEN, J., ELTON, N., FAREY, M., HOLMES, S., LIVESEY, P.,
RADONJIC, M. (2003). Hydraulic Lime Mortar for Stone, Brick and Masonry.
Shaftsbury. Donhead Publishing Ltd.
AMAZONAILS (2001). Information Guide to Straw Bale Building – For Self-Builders
and the Construction Industry. Todmorden. Amazonails.
Anonymous (2007). Report on Initial Investigation into Moisture Levels in the Walls of
the Straw Bale Theatre Centre for Alternative Technology (CAT) 30th November 2007.
ASH, C., ASCHHEIM, M. and MAR, D. (nd). In-plane cyclic tests of plastered straw
bale wall assemblies. University of Illinois report. Available from:
www.ecobuildnetwork.org/pdfs/InPlane_Wall_Tests_Large.pdf [21/01/2009].
BS EN 338:2003. Structural Timber – Strength Classes. BSI.
BS EN 1015-11:1999. Methods of test for mortar for masonry - Part 11: Determination
of flexural and compressive strength of hardened mortar. BSI.
BS EN 1052-2:1999. Methods of test for masonry - Part 2: Determination of flexural
strength. BSI.
BS EN 1993-1-4:2006. Eurocode 3 – Design of steel structures – Part 1-4: General
rules – Supplementary rules for stainless steels. BSI.
BS EN 1995-1-1:2004. Eurocode 5 – Design of timber structures – Part 1-1: General –
Common rules and rules for buildings. BSI.
BS 6399-2:1997. Loading for Buildings – Part 2: Code of Practice for Wind Loads. BSI.
117
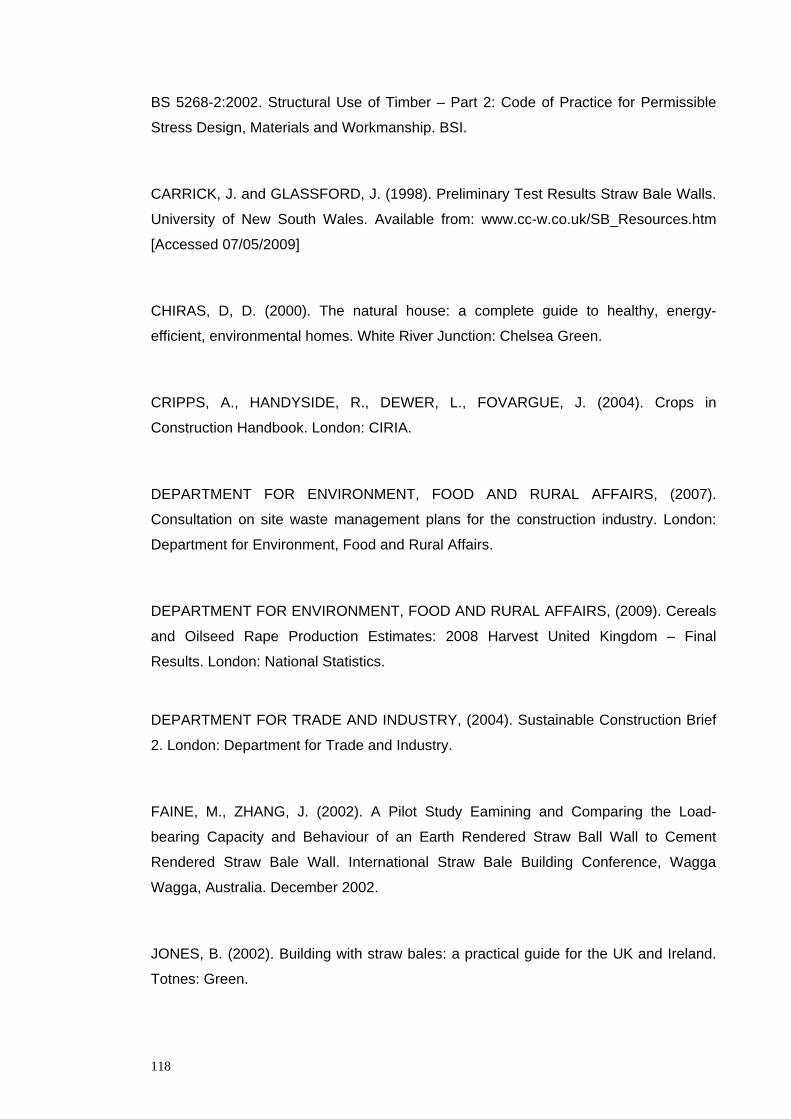
BS 5268-2:2002. Structural Use of Timber – Part 2: Code of Practice for Permissible
Stress Design, Materials and Workmanship. BSI.
CARRICK, J. and GLASSFORD, J. (1998). Preliminary Test Results Straw Bale Walls.
University of New South Wales. Available from: www.cc-w.co.uk/SB_Resources.htm
[Accessed 07/05/2009]
CHIRAS, D, D. (2000). The natural house: a complete guide to healthy, energy-
efficient, environmental homes. White River Junction: Chelsea Green.
CRIPPS, A., HANDYSIDE, R., DEWER, L., FOVARGUE, J. (2004). Crops in
Construction Handbook. London: CIRIA.
DEPARTMENT FOR ENVIRONMENT, FOOD AND RURAL AFFAIRS, (2007).
Consultation on site waste management plans for the construction industry. London:
Department for Environment, Food and Rural Affairs.
DEPARTMENT FOR ENVIRONMENT, FOOD AND RURAL AFFAIRS, (2009). Cereals
and Oilseed Rape Production Estimates: 2008 Harvest United Kingdom – Final
Results. London: National Statistics.
DEPARTMENT FOR TRADE AND INDUSTRY, (2004). Sustainable Construction Brief
2. London: Department for Trade and Industry.
FAINE, M., ZHANG, J. (2002). A Pilot Study Eamining and Comparing the Load-
bearing Capacity and Behaviour of an Earth Rendered Straw Ball Wall to Cement
Rendered Straw Bale Wall. International Straw Bale Building Conference, Wagga
Wagga, Australia. December 2002.
JONES, B. (2002). Building with straw bales: a practical guide for the UK and Ireland.
Totnes: Green.
118
KING, B. (2003). Load-bearing Straw Bale Construction. Ecological building network.
Available from: www.ecobuildnetwork.org/pdfs/Load-Bearing_SB_Const.pdf [Accessed
23/04/2009].
KING, B. (2006). Design of straw bale buildings: the state of the art. San Rafael,
California: Green Building Press.
LAWRENCE, M., DRINKWATER, L., HEATH, A. and WALKER, P. (2009a). Racking
Shear Load Resistance of Pre-fabricated Straw Bale Panels. Accepted for publication
in ICE Journal of Construction Materials. Thomas Telford, London.
LAWRENCE, M., HEATH, A. and WALKER, P. (2009b). Monitoring of Moisture
Content of Straw Bale Walls. In: R. J. HOWLETT, ed. International Conference on
Sustainability in Energy and Buildings, Brighton, UK, April 2009. Springer. Pp. 132 –
143.
MODCELL (2009). ModCell projects. Available from: www.modcell.co.uk/page/projects
[Accessed 27/05/2009]
MORTON, T. (2008). Earth Masonry Design and Construction Guidelines. Watford:
BRE
NICHOLS, J., AND RAPP, S. (2000). Straw Bale Shear Wall Lateral Load Test.
California Polytechnic State University. San Luis Obispo
RICHARDS, A. (2009). Corner Joints for Straw Bale Panels. Final year MEng
dissertation. University of Bath.
Robot Millennium v 17.5.0.1764 (2004). Autodesk Inc., www.robobat.com/n/en/262
[Accessed 19/03/2009].
119
SCAT (2007). The Straw Pavilion – Technical Sheet. Somerset College of Arts and
Technology. Available from: www.genesisproject.com/resources/technical-download
sheets.html [Accessed 15/06/2009]
STEEN, A., STEEN, B. (2000). The beauty of straw bale homes. White River Junction:
Chelsea Green.
VARDY, S. and MACDOUGALL, C. (2004). Compressive Testing and Analysis of
Plastered Straw Bales. Queen’s University. Available from: www.cc
w.co.uk/SB_Resources.htm [Accessed 07/05/2009]
VARDY, S. (2009). Structural Behaviour of Plastered Straw Bale Assemblies Under
Concentric and Eccentric Loading. A Thesis submitted for the degree of Doctor of
Philosophy, Queen’s University, Ontario, Canada.
WALKER, G. (2007). Barrier to Straw Bale Construction in Scotland. Dissertation
submitted towards BSc Building Surveying. Glasgow Caledonian University.
WALKER, P. (2004). Compression Load Testing straw Bale Walls. University of Bath.
Available from: www.cc-w.co.uk/SB_Resources.htm [Accessed 07/05/2009]
WANEK, C. (2003). The New Straw Bale Home. Salt Lake City: Gibbs Smith.
WHEELER, A., RIDLEY, D., BOOTHBY, T. (2004). The Effects of Plastered Skin
Confinement on the Performance of Straw Bale Wall Systems. Available from: www.cc
w.co.uk/SB_Resources.htm [Accessed 07/05/2009]
ZHANG, J.( 2002). Load carrying characteristics of a single straw bale under
compression. International Straw Bale Building Conference, Wagga Wagga, Australia.
December 2002.
120