Embed Size (px)
Citation preview
STRUCTURAL PERFORMANCE OF EARTH BLOCKSSTABILIZED WITH RICE HUSK ASH AND CEMENT
RONOH VICTOR
MASTER OF SCIENCE IN CIVIL ENGINEERING
(Construction Engineering and Management Option)
PAN AFRICAN UNIVERSITY
INSTITUTE OF BASIC SCIENCES, TECHNOLOGY AND
INNOVATION
2014
i
STRUCTURAL PERFORMANCE OF EARTH BLOCKSSTABILIZED WITH RICE HUSK ASH AND CEMENT
RONOH VICTOR
CE300-0004/12
A thesis submitted to Pan African University, Institute for Basic Sciences
Technology and Innovation in partial fulfillment of the requirement for the
Engineering degree of Master of Science in Civil Engineering
(Construction Engineering and Management Option)
PAN AFRICAN UNIVERSITY
INSTITUTE OF BASIC SCIENCES, TECHNOLOGY AND
INNOVATION
2014
ii
Declaration
This thesis is my original work and has not been submitted to any other university for
examination.
Signature ................................................................... Date ...........................................
Ronoh Victor
CE300-0004/12
This thesis research has been submitted for examination with our approval as the
University Supervisors.
Signature ................................................................... Date ...........................................
Dr. Kiptanui J.A. Too
JKUAT, Kenya.
Signature ................................................................... Date ...........................................
Prof. James Wambua Kaluli
JKUAT, Kenya.
iii
Acknowledgment
First and foremost, I would like to thank the Almighty God for all the blessings and
free gift of life, knowledge and understanding He has given unto me all through the
research period till this far.
Secondly, my fervent thanks go to my supervisors Dr. Kiptanui J.A.Too and Prof.
Wambua Kaluli for their valuable guidance, suggestions, constant support,
encouragement and positive criticism that assisted me in making the best of my
research work. Thanks to all JKUAT Civil Engineering staff in the Soil Mechanics
and Structures/Materials laboratories for their essential technical advice and
suggestions towards the challenges throughout the research period, encouragement
and guidance during the blocks testing.
Special thanks go to PAUISTI and African Union (AU) at large for offering me the
chance to come and undertake my masters’ degree and for their financial support all
through my studies and during my research period.
I am grateful to my family members; my mum, dad, brothers and sisters for being
with me in the hard time that was needed to complete this thesis and their great
encouragement.
Finally, I express my heartfelt thanks to all my classmates in Civil Engineering
(Construction Engineering and Management Option) and the whole of PAUISTI
student fraternity, whose friendship, cooperation, and suggestions have helped me to
complete this thesis work.

iv
Dedication
I proudly dedicate this piece of work to my hardworking and loving parents who
labored tirelessly and denied themselves a lot of leisure to educate me. Mum and Dad,
I keep hearing the echo of your voices giving me pieces of advice wherever I go.
Thanks a lot and may the Almighty God bless you abundantly.
v
Abstract
The conventional techniques of soil stabilization are becoming expensive day by day
due to the rising cost of the stabilizing agents like, cement, lime, etc. The cost of
stabilization and environmental hazards may be minimized by replacing a good
proportion of stabilizing agent using the supplementary cementitious materials. Rice
husks are among the waste material that must be managed in rice production areas.
This study investigated the structural performance of Rice Husk Ash (RHA) as partial
replacement of cement to stabilize clay for the production of compressed earth
blocks. Black cotton soil collected from a construction site was used in this study.
Particle size distribution of the soil together with its Atterberg limits as well as its
compaction characteristics were established according to British standard procedures
(BS 1377-1990: Part 2 & 4). Stabilized soil specimens were prepared and tested for
unconfined compressive strength, in accordance with BS 1924-2: 1990 Section 4.
The soil sample used was classified as A-7-5 in the AASHTO classification system.
While increasing cement content resulted in decreased liquid limit, plasticity index
and linear shrinkage; the same resulted in increased plastic limit, maximum dry
density (MDD), and optimum moisture content (OMC). The cement stabilized clay
blocks had an average compressive strength ranging from 0.3 MPa for 0% cement to
1.1 MPa for 12% cement at 7 days of curing; and 0.8 for 0% cement to 3.1MPa for
12% cement after 28 days of curing. This study established that to achieve a
minimum strength of 2.5 MPa for soil blocks the soil should be stabilized with at least
8% cement. Replacement of cement with RHA led to a decrease in MDD, an increase
vi
in OMC and a decrease in mean compressive strength of the blocks. The 28 day
compressive strength for blocks stabilized with 5% cement and 7.5% RHA was
2.6MPa which was higher than the Kenyan Bureau of Standards requirements (2.5
MPa). It was not possible to measure water absorption of soil blocks after soaking for
24 hours. This is because blocks stabilized with 8% cement alone crumbled after 12
hours while the blocks stabilized with 5% cement and 7.5% RHA crumbled six hours
after being immersed in water. These results suggest that stabilized earth blocks
should only be used in an environment which is not exposed to water.
vii
Table of contents
Declaration.................................................................................................................... ii
Acknowledgment ......................................................................................................... iii
Dedication .................................................................................................................... iv
Abstract ..........................................................................................................................v
List of tables...................................................................................................................x
List of figures............................................................................................................... xi
List of appendices ....................................................................................................... xii
CHAPTER ONE: INTRODUCTION............................................................................1
1.1 Background .................................................................................................... 1
1.2 Lowering cost of construction........................................................................ 2
1.2.1 Need for alternative construction methods and materials. ...................... 2
1.2.2 Soil availability ....................................................................................... 3
1.2.3 Cement stabilization................................................................................ 3
1.3 Problem statement .......................................................................................... 4
1.4 Research questions ......................................................................................... 5
1.5 Objectives....................................................................................................... 5
1.5.1 Overall objective ..................................................................................... 5
1.5.2 Specific objectives; ................................................................................. 5
1.6 Study justification .......................................................................................... 6
viii
1.7 Scope and limitations of the study ................................................................. 7
2 CHAPTER TWO: LITERATURE REVIEW.........................................................8
2.1 Introduction .................................................................................................... 8
2.2 Rice husk ash................................................................................................ 10
2.2.1 Properties of rice husk ash (RHA) ........................................................ 10
2.2.2 Behaviour of RHA ................................................................................ 13
2.3 Black cotton soil........................................................................................... 13
2.3.1 Normal range of properties of black cotton soils.................................. 15
2.3.2 Clay in construction: The challenge ..................................................... 16
2.4 RHA utilization in past research studies ...................................................... 17
2.5 Research gap ................................................................................................ 22
3 CHAPTER THREE: MATERIALS AND METHODS .......................................25
3.1 Acquisition and processing of stabilizers..................................................... 25
3.2 Preparation of experimental soil .................................................................. 25
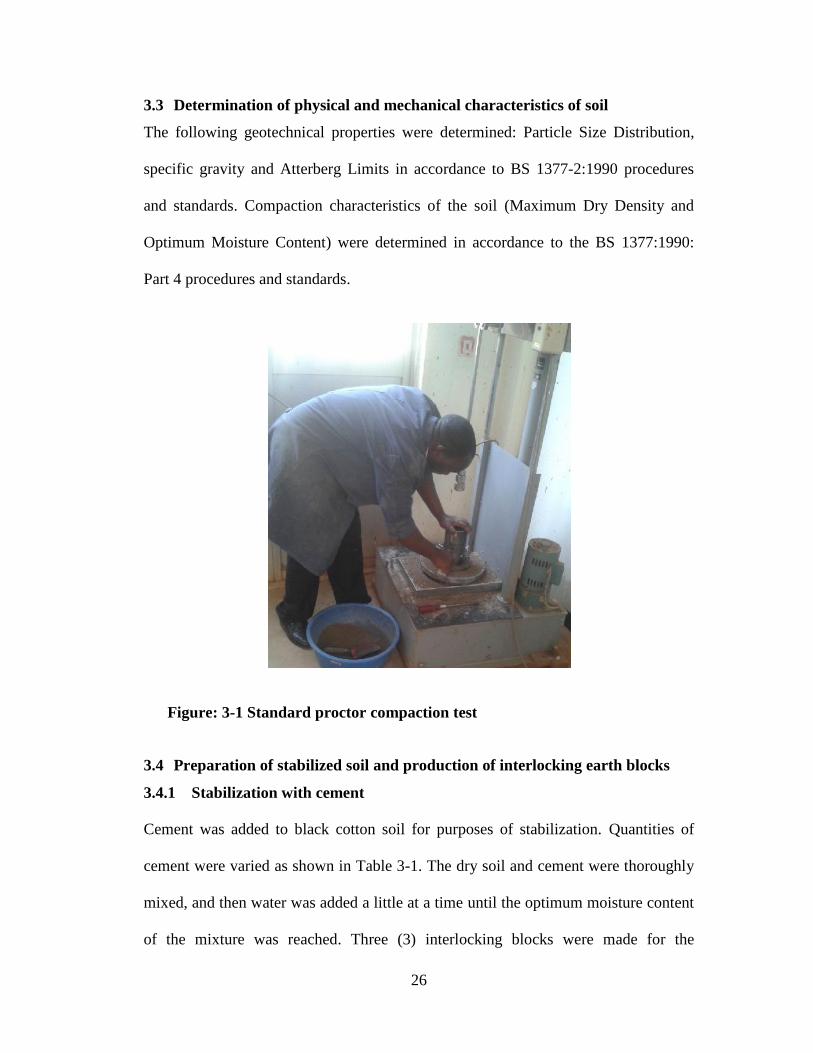
3.3 Determination of physical and mechanical characteristics of soil ............... 26
3.4 Preparation of stabilized soil and production of interlocking earth blocks.. 26
3.4.1 Stabilization with cement...................................................................... 26
3.4.2 Stabilization with rice husk ash (RHA) and cement ............................. 28
3.5 Compressive strength and water absorption of interlocking earth blocks ... 29
3.5.1 Dry compressive strength test of interlocking earth blocks.................. 29
3.5.2 Water absorption of interlocking earth blocks...................................... 31
3.6 Unconfined compressive strength for the experimental soil ........................ 32
3.7 Linear shrinkage test for the interlocking blocks ......................................... 34
3.8 Cost analysis................................................................................................. 34
ix
4 CHAPTER FOUR: RESULTS, ANALYSIS AND DISCUSSION.....................35
4.1 Physical properties of the soil sample .......................................................... 35
4.1.1 Particle size distribution........................................................................ 35
4.1.2 Specific gravity ..................................................................................... 36
4.1.3 Atterberg limits ..................................................................................... 37
4.1.4 Maximum dry density – moisture content relationship ........................ 39
4.2 Mechanical properties of the soil sample..................................................... 42
4.2.1 Unconfined compressive strength......................................................... 42
4.2.2 Compressive strength of cement stabilized blocks ............................... 44
4.3 Introduction of rice husk ash into the mix proportion.................................. 47
4.3.1 Chemical composition of RHA............................................................. 47
4.3.2 Compaction of soil stabilized with cement and RHA........................... 48
4.3.3 Compressive strength analysis for Cement and RHA stabilized blocks51
4.3.4 Wet compressive strength and water absorption tests .......................... 55
4.3.5 Linear shrinkage of the interlocking blocks.......................................... 56
4.4 Cost analysis................................................................................................. 58
5 CHAPTER FIVE: CONCLUSIONS AND RECOMMENDATIONS.................61
5.1 Conclusions .................................................................................................. 61
5.2 Recommendation.......................................................................................... 62
REFERENCES ............................................................................................................63
APPENDICES .............................................................................................................70
x
List of tablesTable 2-1: Physical properties of RHA....................................................................... 11
Table 2-2: Chemical composition of RHA from Mwea and Ahero............................ 12
Table 2-3 Normal range of properties of black cotton soils ....................................... 15
Table 2-4 Normal range of chemical properties of black cotton soils ...................... 15
Table 3-1: Mix proportions for cement....................................................................... 27
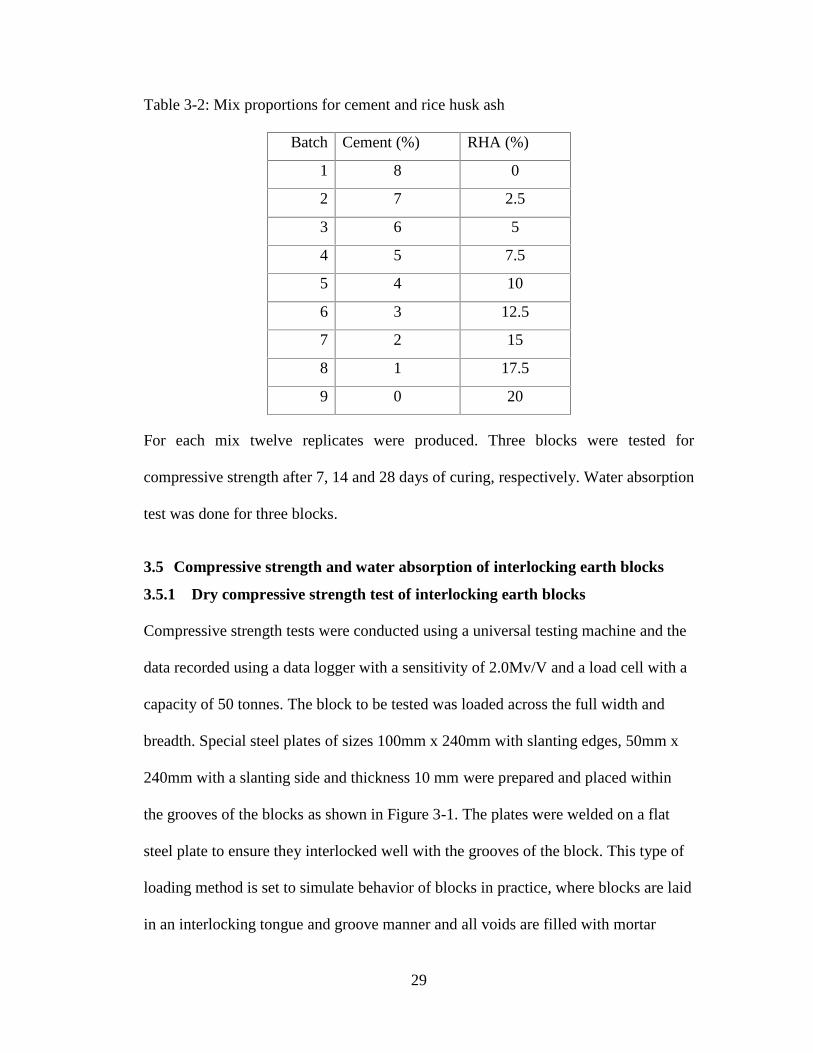
Table 3-2: Mix proportions for cement and rice husk ash .......................................... 29
Table 4-1 Specific gravity for the black cotton soil.................................................... 37
Table 4-2 Atterberg limit test results of soil samples ................................................. 38
Table 4-3 Compaction Tests analysis ......................................................................... 40
Table 4-4 Interlocking blocks compressive strength test results ................................ 44
Table 4-5: Chemical composition of rice husk ash..................................................... 47
Table 4-6 Mean compressive strength for cement and RHA stabilized soil blocks ... 52
Table 4-7: Water absorption test results ..................................................................... 55
Table 4-8: Linear shrinkage test results ...................................................................... 57
Table 4-9: Costs incurred in production of stabilized clay earth blocks..................... 59
Table 4-10: Cost analysis of produced stabilized clay earth blocks ........................... 59
xi
List of figuresFigure: 3-1 Standard proctor compaction test............................................................. 26
Figure: 3-2 Batching, mixing and blocks production ................................................. 27
Figure: 3-3 Blocks curing in a shade and later covered with polythene ..................... 28
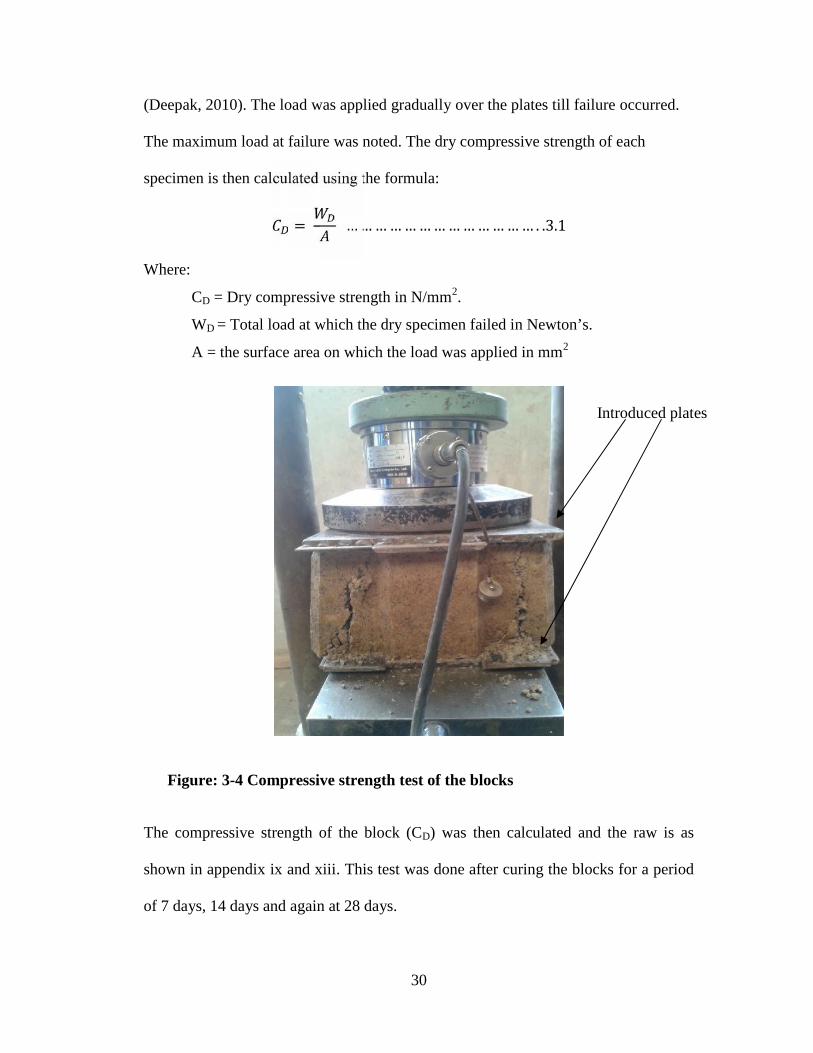
Figure: 3-4 Compressive strength test of the blocks................................................... 30
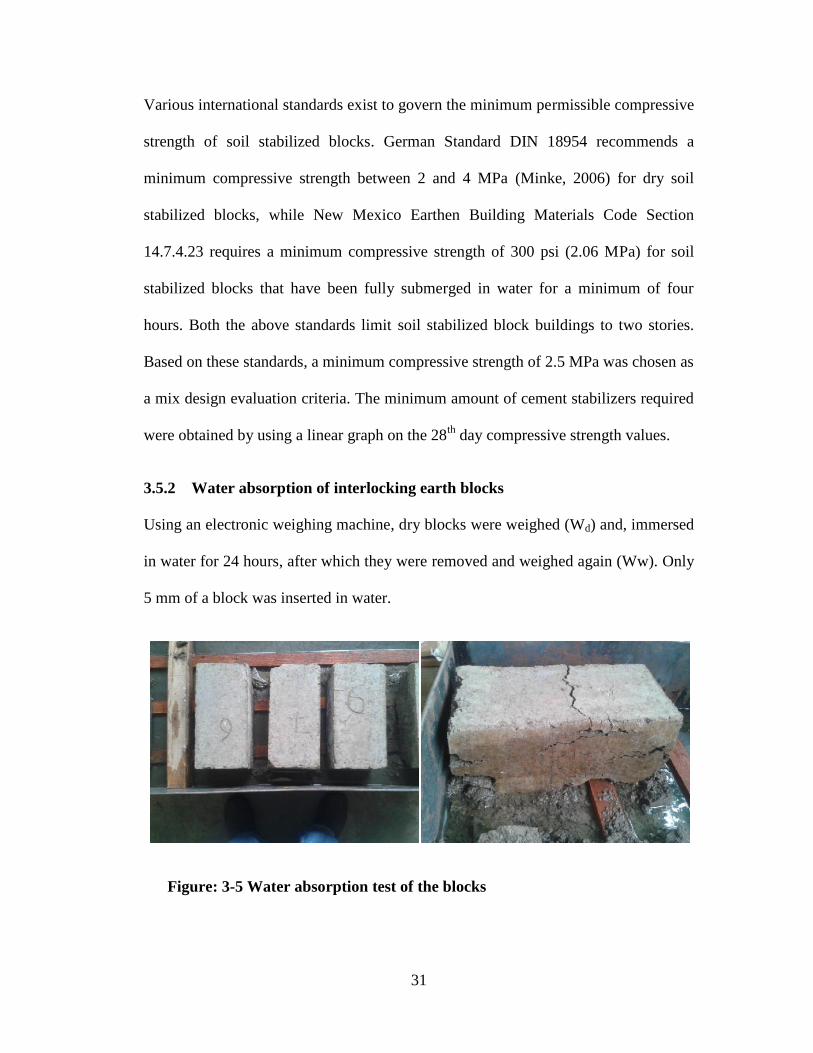
Figure: 3-5 Water absorption test of the blocks.......................................................... 31
Figure 3-6 Unconfined Compressive strength test...................................................... 33
Figure 4-1 Particle size distribution of the soil sample............................................... 36
Figure 4-2 Effect of cement content on Atterberg limits............................................ 38
Figure 4-3 Variation of dry density with moisture content........................................ 40
Figure 4-4 Effects of cement content on the Dry Density ......................................... 41
Figure 4-5 Effects of cement on the moisture content ............................................... 41
Figure 4-6 Effect of cement content on unconfined compressive strength ................ 43
Figure 4-7 Compressive strength development for interlocking blocks ..................... 45
Figure 4-8 Effects of cement content on the compressive strength ............................ 46
Figure 4-9 Variation of MDD with OMC for cement and RHA stabilized soil ......... 48
Figure 4-10 Effects of cement and RHA content on the MDD of soil ....................... 49
Figure 4-11 Effects of cement and RHA content on the OMC of soil ....................... 50
Figure 4-12: Effects of cement and RHA content on the compressive strength......... 52
Figure 4-13 Strength development of cement and RHA stabilized blocks................. 53
Figure 4-14 Linear shrinkage of interlocking blocks.................................................. 58
xii
List of appendices
Appendix I: Particle size distribution - Wet sieving................................................... 70
Appendix II: Particle density/Specific gravity............................................................ 70
Appendix III: Atterberg Limits of a soil ..................................................................... 71
Appendix IV: Compaction Test Soil with 0% Cement............................................... 71
Appendix V: Compaction Test Soil with 6% Cement ................................................ 72
Appendix VI: Compaction Test Soil with 8% Cement............................................... 72
Appendix VII: Compaction Test Soil with 10% Cement .......................................... 73
Appendix VIII: Compaction Test Soil with 12% Cement ......................................... 73
Appendix IX: Interlocking Blocks Compressive Strength ........................................ 74
Appendix X: Raw data of Unconfined Compression test ........................................... 76
Appendix XI: Results of Unconfined Compression test............................................. 89
Appendix XII: Compaction test analysis for soil stabilized with cement and RHA . 89
Appendix XIII: MDD and OMC for soil, cement and rice husk ash mix................... 90
Appendix XIV: Compressive strength for cement and RHA stabilized soil blocks... 90
1
CHAPTER ONE: INTRODUCTION
1.1 Background
The Kenyan population is experiencing a steady growth rate as shown by population
census undertaken in 2009. Unfortunately, this growth is not commensurate with the
growth in the housing sector. Statistics has it that Kenya has not been able to meet the
ever rising housing demand with a short fall currently standing at over 150,000 units
annually (KNBS, 2009). One key reason for housing inadequacy is the increase in
population and the relatively high cost of permanent building materials (K’Akumu,
2004). Many people still languish in poverty without appropriate shelter which has
led to the growing need for housing affecting all major towns in Kenya. This has been
evidenced by the growing slums in the urban areas. In addition, the rural population is
slowly facing housing problems and the country is in need of sustainable housing to
cater for the constitutional right of every citizen.
Various factors have contributed to the inability to realize this objective of provision
of decent and sustainable housing (K’Akumu, 2004). Firstly, the resources used for
construction of housing in Kenya are becoming scarce by the day and the
construction of new buildings consume huge quantities of materials, such as paving
block, bricks, tiles, cement, aggregates. Most construction work still utilizes stones
from quarries that have become more expensive due to the high demand. Over
exploitation of the quarries has also raised environmental concerns leading to the
closure and regulation of this mining activity.
2
1.2 Lowering cost of construction
The cost of construction materials such as cement, steel and timber has increased
significantly (Uche and Ahmed, 2013). The use of earth and by-products from
manufacturing processes presents a better option in lowering the cost of construction
(Nasly and Yassin, 2009). Soils are variable and complex materials, whose properties
can be modified to improve their performance in building construction through the
addition of various stabilizers. The use of rice husk ash in the production of stabilized
earth blocks present an alternative given the readily availability of rice husks in
various rice processing factories in the country. The relative ease of manufacturing of
the construction material is expected to reduce the cost of housing which may speed
up the process of raising housing units. The main aim of this research study was to
replace the relatively expensive cement with rice husk ash, as a stabilizer of
interlocking earth blocks, which is a renewable resource in nature compared to the
use of non-renewable cement as a stabilizer.
1.2.1 Need for alternative construction methods and materials.
The use of alternative cheaper materials as stabilizers would greatly enhance the
production of affordable blocks with the desired properties. Presently cement and
lime are used for soil stabilization which are relatively expensive options (Sanewu,
2013). There is thus the need for alternative binders that will reduce the cost of
production and consequently the cost of construction works. The use of binders from
by-products may be particularly advantageous, as the materials do not require
'mining', quarrying and processing as is the case with many of the conventional
building materials. Rice husk ash is an agro-based product which may be used as a
3
substitute of cement without sacrificing the strength and durability. The main aim of
this research study was to investigate the performance of soil bricks stabilized using
rice husk ash (RHA) and cement.
1.2.2 Soil availability
Soil is an earth material and it is readily available for construction purposes but due to
its weakness, it requires great improvement of its properties before use. In the
construction industry, clay soils have proved to be an engineer’s nightmare because
of their difficult in handling especially when they get wet. Walls made from mud
swell and crack when exposed to alternate wet and dry weather (Narasihma et al,
2014). These are some of the factors that have made clay soil to be classified among
the least suitable materials for construction. Consequently, large quantities of clay are
dumped from construction sites annually while they could be utilized in construction
through stabilization.
1.2.3 Cement stabilization
Cement has been used as an effective stabilizer for most types of soils, including clay
soils. The main drawback of cement stabilization of clay soils has been the
comparatively larger quantities of cement required. Rigassi (1985) found that about 5-
6% cement was required when stabilizing other soils compared to 10-20% required
for clay soils, thus raising the cost of stabilization of clay soils with cement.
According to Walker (1995), compressed stabilized earth blocks creates 22kg of
carbon dioxide per ton (CO2/ton) compared to concrete blocks with 143kg of CO2 per
ton, fired clay bricks with 200kg of CO2 per ton and aerated concrete blocks is 280-
375kg of CO2 per ton during production. Ordinary Portland cement (OPC) is not only
4
expensive but environmentally unfriendly during manufacture. Production of one ton
of OPC leads to the consumption of 1.5 tons of quarry material, energy consumption
of 5.6 gigajoules per ton and an emission of nearly 0.9 tons of CO2 representing 5 %
of total anthropogenic CO2 emission (Seco et al., 2012). Thus, there is need for
environmentally friendly material to be developed to replace cement.
Rice husk ash is a pozzollanic material and is potentially useful in soil stabilization
(Fattah et al., 2013). The pozzolanic material is readily available as an agricultural
waste from various rice mills present in the country. The addition of pozzolans to
cement or their use together with lime allow for the partial substitution or in certain
applications full substitution of cement (Seco, et al., 2012). This has led to a reduction
in the rice husk waste, energy consumption, emissions of CO2 in cement production,
production costs and improved engineering properties of stabilized clay soils.
1.3 Problem statement
The country’s wide housing shortage has stimulated research for appropriate, easy,
fast and cost-effective new ways of wall construction. Among many technologies
found promising is mortar-less technology using interlocking stabilized earth blocks.
Rice husk and clay from construction sites are wastes which may be utilized in the
production of stabilized interlocking earth blocks which may lower construction costs
and act as a way of waste disposal.
To solve the problem of inadequate housing and waste management, new
construction materials must be considered and determined if they can provide a
cheaper alternative to conventional building materials. Natural resources are being
5
consumed at an increasing rate and it is important to consider alternative materials
and processes for the production of building materials from these natural resources.
This study considers the use of a black cotton soil as waste from construction sites
and rice husks a by-product of rice milling as potential construction materials.
1.4 Research questions
1. Can black cotton soil produce good quality stabilized earth blocks?
2. What is the minimum percentage of cement necessary for stabilizing black
cotton soils for the production of earth blocks meeting required standard
strength for building construction works?
3. Will the produced stabilized earth blocks be able to resist deteriorating
environmental factors and how does the cost of earth blocks stabilized with
rice husk ash and cement compare with the cost of cement stabilized earth
blocks?
1.5 Objectives
1.5.1 Overall objective
The main objective of this study was to investigate the structural performance of rice
husk ash and cement stabilized interlocking earth blocks for low cost housing in
Kenya.
1.5.2 Specific objectives;
1. To establish the physical and mechanical properties of black cotton soil as a
raw material for the production of stabilized earth blocks.
2. To determine the minimum percentage of cement necessary for stabilizing
black cotton soils for the production of stable, cost effective earth blocks.
6
3. To determine the optimum amount of rice husk ash required to replace cement
in production of affordable, stabilized earth blocks and assess the water
absorption rate of the blocks under optimum strength conditions.
1.6 Study justification
The Universal Declaration of Human Rights of (UN, 1948) recognizes the right to
adequate housing as an important component of the right to adequate living standards.
Improvement of housing for the Kenyan population is a major concern to the
Government that has been influenced by the fact that the improvement in housing
stock is a strategically important social and economic investment. In addition,
sustainable solid waste management enhances maintenance of a healthy, aesthetic,
and ecologically sound environment. Most people either dump waste in open spaces
or burn it, creating water and air pollution. Waste management involves waste
collection, sorting, storage, recycling and disposal (Kaluli et al, 2011).
Ordinary Portland cement (OPC), the most commonly utilized and widespread binder
produced in Kenya and the world, is becoming increasingly unaffordable for low-cost
housing applications. The challenge of the need for a landfill for rice husk and clay
soil disposal, air pollution through burning of bricks, overexploitation of fertile soil,
high cost of transporting the unwanted clay material from the construction site to the
dumping site and the need for sustainable low cost buildings to house people justify
the need for more research to be focused on the structural performance of rice husk
ash and cement stabilized interlocking earth blocks. The interlocking blocks do not
require burning thus saving on wood fuel, no mortar is required to be laid during
bricklaying work thus the process of building walls is faster and requires less skilled
7
labor as the blocks are laid dry and lock into place. The interlocking earth blocks are
environmental friendly as the materials used do not produce hazardous waste and
emissions during their production.
1.7 Scope and limitations of the study
The research covered only the technical and economic analysis of cement and rice
husk ash stabilized compressed clay soil blocks. The soil sample used was excavated
from a construction site in Juja, Kiambu County. Rice husk ash was obtained from
Mwea Tebere scheme millers which were burnt in uncontrolled temperatures.
The research was limited to getting soil sample from a single site, because of time and
budget constraints. The husks also were burnt in uncontrolled temperature thus the
quality of ash which had a lot of unburnt husks and carbon. Therefore this research
study relied on the soil from Juja and the rice husk ash from Mwea Tebere scheme.
8
2 CHAPTER TWO: LITERATURE REVIEW2.1 Introduction
According to K’Akumu (2004), Kenyan government has done little in keeping
information pertaining to the state of the housing market. This has made it impossible
for private investors to effectively address the growing demand for housing in the
country. The statistical records which have aided in the improvement of housing in
most developed nations are essential for Kenya to match up in her housing sector
(K’Akumu, 2004).
Kenya has continued to develop infrastructural policy as a result of the institutional
reforms brought about by the new constitution (Rabar and Wambu, 2010). For
instance, the Kenya Vision 2030 provides a policy blueprint of the country’s
economic status by the year 2030. This may lead to the adoption of alternative
materials for the construction of sustainable housing. However, much needs to be
done to fight corruption as it poses the greatest impediment in the realization of this
vision as it compromises the efficiency, effectiveness and the reach in service
delivery. Watchdog groups such as Transparency International continue to rank
Kenya poorly in dealing with corruption (Rabar and Wambu, 2010).
The materials utilized for soil stabilization such as lime and cement are industrially
manufactured and they therefore keep construction costs higher. The practice of soil
stabilization has enabled strengthening and increased durability of earth blocks.
Increasing material costs in the construction industry has resulted in the need to find
alternative construction materials. According to Nasly and Yassin (2009), the use of
9
these alternative construction materials has the potential to lower construction costs
as it will speed up the process of raising housing units.
Some of the materials already in use are the kiln fired bricks which are inexpensive as
the raw material is dug from the ground near the construction site. Energy used to fire
the bricks comes from firewood that may be collected near the construction site. The
blocks are formed in a wooden or metal mold after which they are laid out to dry and
later stacked in a kiln for firing (Parry, 1979). The firing increases the bonding
strength between the particles (Stulz & Mukerji, 1993). The finished blocks are
mostly irregular and thus the quantity of mortar required between the blocks and their
dimensional inaccuracies make the building appear unattractive increasing the cost of
construction in terms of cement usage.
Compressed and stabilized soil blocks have become a common choice when
compared to the kiln fired bricks. This is because of their high wet compressive
strength as the stabilization and procedure of compaction removes voids in the
finished block. The increase in density results in higher compressive strength and a
reduction of potential ingress of moisture in the block (Norton, 1997). In addition,
cement and lime have been introduced as chemical stabilizers in binding the particles
together. However, these additives are expensive.
Sanewu (2013) studied the use of animal dung and municipal solid waste ash
(MSWA) as alternative stabilizer for clay blocks and reported that addition of 2%
municipal solid waste ash and 5% animal dung ash gave the blocks the highest
compressive strength after 28 days. For the unstabilized blocks, the compressive
10
strength was higher after 7 days and decreased after 28 days. He concluded that the
increase in strength for the 2% MSWA stabilized blocks was due to the pozollanic
ash reaction.
2.2 Rice husk ash
2.2.1 Properties of rice husk ash (RHA)
Rice husk ash (RHA) is potentially useful in soil stabilization (Fattah et al., 2013).
The pozzolanic material is readily available as an agricultural waste from various rice
mills present in the country.
RHA is a very fine material. The average particle size of rice-husk ash ranges from 5
to 10μm (Hisham et al 2012). The production of RHA involves burning of the rice
husk under controlled temperature. This leads to the production of ash that is
approximately 17%-25% of the rice husk’s weight (Fattah et al., 2013). The silica
contained in RHA is in amorphous form meaning it can readily react with the
Ca(OH)2 that is liberated during hardening of cement to form a cementatious
compound (Oyetola and Abdullahi, 2006).
Rice husk ash is a pozzolan, which contains as much as 80-85% silica that is highly
reactive, depending on the temperature of incineration (Kishore et al, 2011).
Pozzolanas are defined as siliceous and aluminous materials which in themselves
possess little or no cementing property, but will in a finely dispersed form in the
presence of water chemically react with calcium hydroxide at ordinary temperature to
form compounds possessing cementing properties. When water is added to a mixture
with pozzolanic material, the resulting product which acts as cement in some
instances provides a stronger bond than cement alone (Nick, 2009).
11
The characteristics of the ash are dependent on the components, temperature and time
of burning (Nick, 2009). During the burning process, the carbon content is burnt off
and all that remains is the silica content. The silica must be kept at a non-crystalline
state in order to produce an ash with high pozzolanic activity. It has been tested and
found that the ideal temperature for producing such results is between 600 °C and 700
°C (Nick, 2009).
If the rice husk is burnt at too high temperatures or for too long, the silica content
becomes a crystalline structure. If the rice husk is burnt at too low temperature or for
too short a period of time the rice husk ash will contain too large amounts of un-burnt
carbon. Carbon does not possess pozzolanic properties, thus it does not take part in
the strength development process. It acts more or less as filler (Nick, 2009).
The chemical composition for pozollanas as stipulated (ASTM C618, 2003) should be
met by rice husk ash chemical properties. The combined proportion of silicon dioxide
(SiO2), aluminium oxide (A12O3) and iron oxide (Fe2O3) in the ash should be not be
less than 70%, and loss of ignition (LOI) should not exceed 12% as stipulated in
ASTM requirement (Hisham et al, 2012).
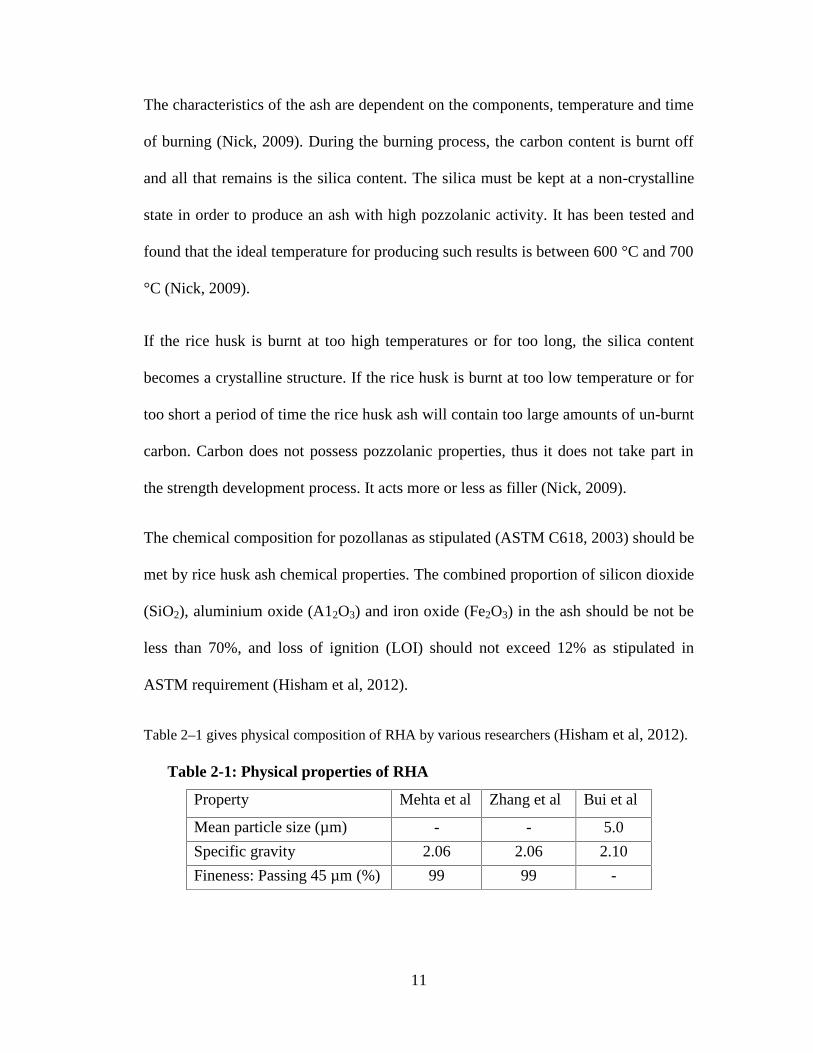
Table 2–1 gives physical composition of RHA by various researchers (Hisham et al, 2012).
Table 2-1: Physical properties of RHA
Property Mehta et al
(1992).
Zhang et al
(1996)
Bui et al
(2005)Mean particle size (µm) - - 5.0
Specific gravity 2.06 2.06 2.10
Fineness: Passing 45 µm (%) 99 99 -
12
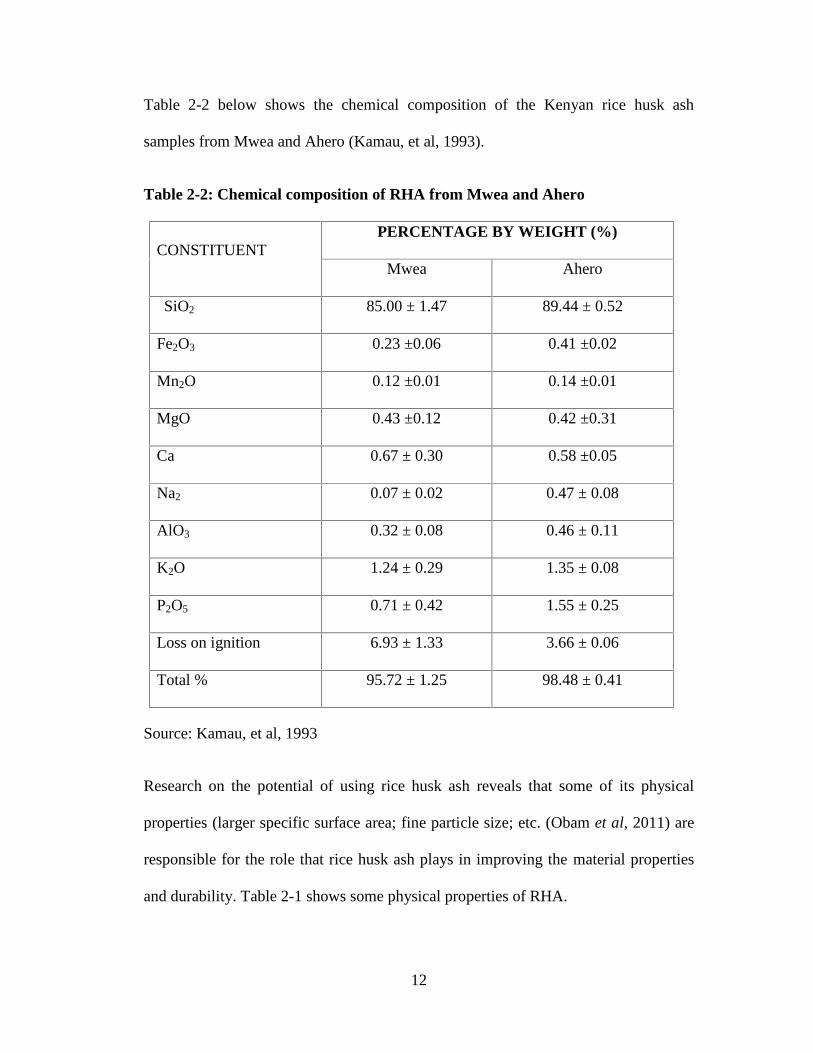
Table 2-2 below shows the chemical composition of the Kenyan rice husk ash
samples from Mwea and Ahero (Kamau, et al, 1993).
Table 2-2: Chemical composition of RHA from Mwea and Ahero
CONSTITUENTPERCENTAGE BY WEIGHT (%)
Mwea Ahero
SiO2 85.00 ± 1.47 89.44 ± 0.52
Fe2O3 0.23 ±0.06 0.41 ±0.02
Mn2O 0.12 ±0.01 0.14 ±0.01
MgO 0.43 ±0.12 0.42 ±0.31
Ca 0.67 ± 0.30 0.58 ±0.05
Na2 0.07 ± 0.02 0.47 ± 0.08
AlO3 0.32 ± 0.08 0.46 ± 0.11
K2O 1.24 ± 0.29 1.35 ± 0.08
P2O5 0.71 ± 0.42 1.55 ± 0.25
Loss on ignition 6.93 ± 1.33 3.66 ± 0.06
Total % 95.72 ± 1.25 98.48 ± 0.41
Source: Kamau, et al, 1993
Research on the potential of using rice husk ash reveals that some of its physical
properties (larger specific surface area; fine particle size; etc. (Obam et al, 2011) are
responsible for the role that rice husk ash plays in improving the material properties
and durability. Table 2-1 shows some physical properties of RHA.
13
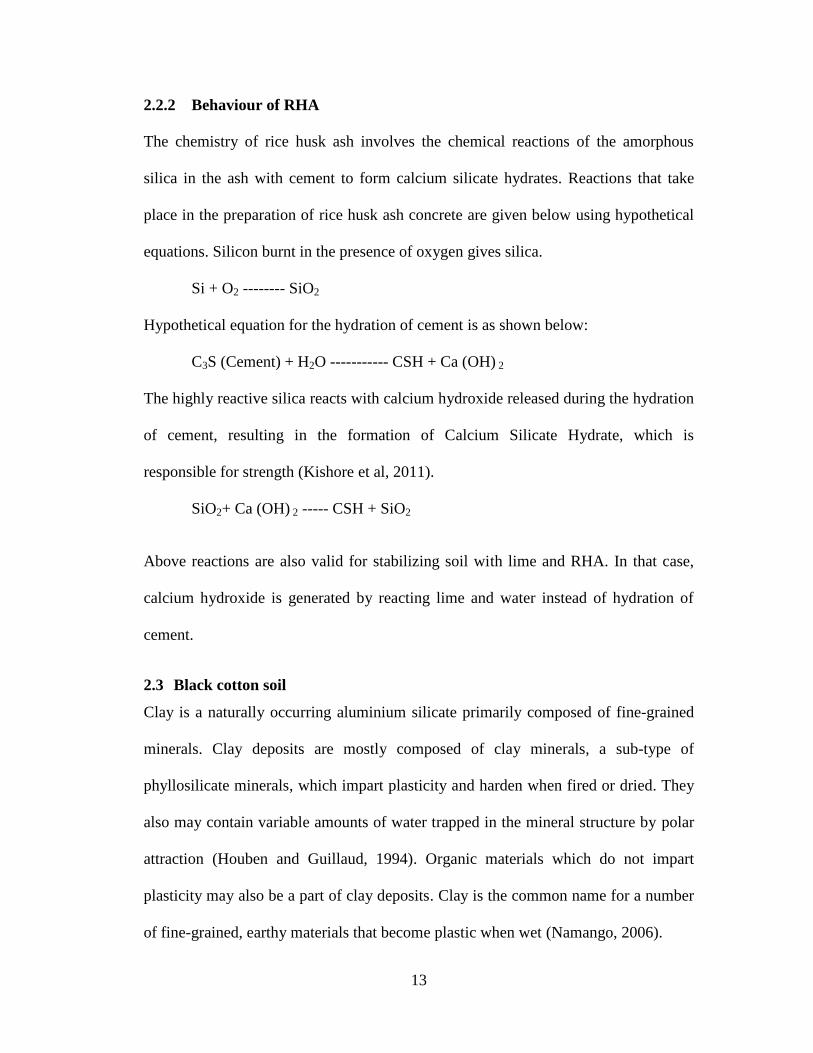
2.2.2 Behaviour of RHA
The chemistry of rice husk ash involves the chemical reactions of the amorphous
silica in the ash with cement to form calcium silicate hydrates. Reactions that take
place in the preparation of rice husk ash concrete are given below using hypothetical
equations. Silicon burnt in the presence of oxygen gives silica.
Si + O2 -------- SiO2
Hypothetical equation for the hydration of cement is as shown below:
C3S (Cement) + H2O ----------- CSH + Ca (OH) 2
The highly reactive silica reacts with calcium hydroxide released during the hydration
of cement, resulting in the formation of Calcium Silicate Hydrate, which is
responsible for strength (Kishore et al, 2011).
SiO2+ Ca (OH) 2 ----- CSH + SiO2
Above reactions are also valid for stabilizing soil with lime and RHA. In that case,
calcium hydroxide is generated by reacting lime and water instead of hydration of
cement.
2.3 Black cotton soil
Clay is a naturally occurring aluminium silicate primarily composed of fine-grained
minerals. Clay deposits are mostly composed of clay minerals, a sub-type of
phyllosilicate minerals, which impart plasticity and harden when fired or dried. They
also may contain variable amounts of water trapped in the mineral structure by polar
attraction (Houben and Guillaud, 1994). Organic materials which do not impart
plasticity may also be a part of clay deposits. Clay is the common name for a number
of fine-grained, earthy materials that become plastic when wet (Namango, 2006).
14
Clay soils have been classified into 3 basic types (Namango, 2006):
Kaolinite - This is a type of clay that has very stable minerals and is among
the last formed in the weathering process. It exhibits very little physio-
chemical activity compared to other clay minerals, because of a comparatively
large grain size and low surface charge.
Illite – This exhibits intermediate physio-chemical activity. Their inter-layer
potassium ions form a weak ionic bond with the oxygen ions in the silica
sheets. A deficiency of potassium results in greater unsatisfied valence charge
and correspondingly greater activity. Occurrence of Illite is common in clay
minerals.
Montmorillonite - These are the most troublesome when abundant water is
present and are the most claylike (active) of the clay minerals.
Montmorillonites are very unstable chemically and are among the initially
formed products of chemical weathering of parent rocks. They derive
principally from volcanic parent materials in a moist environment. Black
cotton soil falls in to this category of clays.
General properties of clay minerals include plasticity when mixed with water in
certain proportions, shrinkage under firing and air drying, fineness of grain, high
cohesion, and capacity of the surface to take decoration. Depending on the content of
the soil, clay can appear in various colours, from a dull gray to a deep orange-red
(Katti, 1979).
15
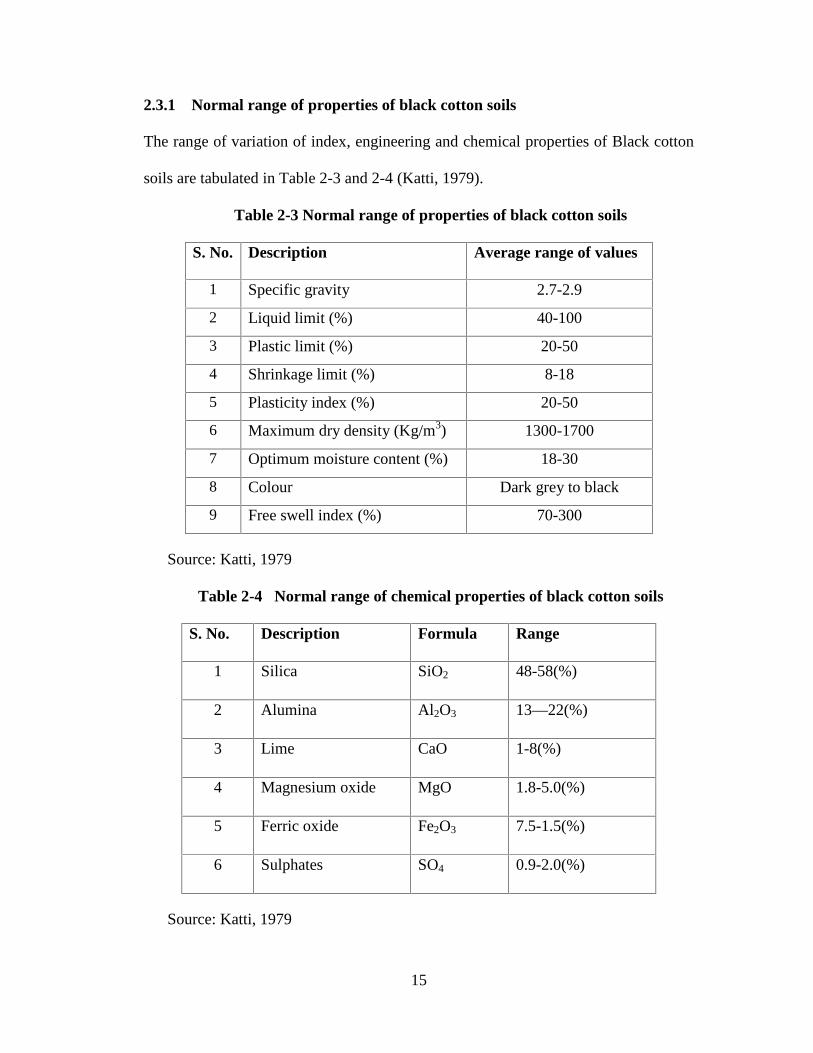
2.3.1 Normal range of properties of black cotton soils
The range of variation of index, engineering and chemical properties of Black cotton
soils are tabulated in Table 2-3 and 2-4 (Katti, 1979).
Table 2-3 Normal range of properties of black cotton soils
S. No. Description Average range of values
1 Specific gravity 2.7-2.9
2 Liquid limit (%) 40-100
3 Plastic limit (%) 20-50
4 Shrinkage limit (%) 8-18
5 Plasticity index (%) 20-50
6 Maximum dry density (Kg/m3) 1300-1700
7 Optimum moisture content (%) 18-30
8 Colour Dark grey to black
9 Free swell index (%) 70-300
Source: Katti, 1979
Table 2-4 Normal range of chemical properties of black cotton soils
S. No. Description Formula Range
1 Silica SiO2 48-58(%)
2 Alumina Al2O3 13—22(%)
3 Lime CaO 1-8(%)
4 Magnesium oxide MgO 1.8-5.0(%)
5 Ferric oxide Fe2O3 7.5-1.5(%)
6 Sulphates SO4 0.9-2.0(%)
Source: Katti, 1979
16
2.3.2 Clay in construction: The challenge
Clay is one of the oldest building materials on earth, among other ancient naturally-
occurring geologic materials such as stone and organic materials like wood. Between
one-half and two-thirds of the world's population in traditional societies as well as
developed countries still lives or works in a building made with clay as an essential
part of its load-bearing structure (Namango, 2006). Also a primary ingredient in many
natural building techniques, clay is used to create adobe, cob, cordwood and rammed
earth structures.
Clays exhibit generally undesirable engineering properties (Brooks, 2009). The main
problem associated with clay as a construction material is its shrink-swell property.
Due to the physical and chemical properties of some clay, large swelling occurs when
water is absorbed. Conversely, when the water dries up, these clays contract or
shrinks (Narasihma et al, 2014). This poses a serious challenge in construction.
Depending upon the supply of moisture in the ground, shrink-swell soils will
experience changes in volume of up to thirty percent or more. Foundation soils which
are expansive will “heave” and can cause lifting of a building or other structure
during periods of high moisture (Koteswara et al. 2011). Conversely during periods
of falling soil moisture, expansive soil will “collapse” and can result in building
settlement. Either way, damage can be extensive.
According to Namango, (2006), when clay soils are used to make earth blocks for
construction of walls, the alternate expansion and contraction of the soil accelerates
the wearing out of the walls resulting in a shorter life span. This occurs through
17
surface cracking of walls and their consequent erosion, which may eventually lead to
structural failures. Movement often causes the crumbling of surface coatings.
The magnitude of the challenge associated with clay varies with climate and the use
to which the clay soil has been put, but light weight buildings generally tend to be
more prone to damage (Houben and Guillaud, 1994). Some common preventative
measures that may be used to minimize damage related to clay construction include:
Extending the foundations to greater depth.
Use of extra reinforcing steel to foundations and slabs.
Drainage of the surface and/or subsurface water
Pre-moisturizing of the soils prior to construction
Providing non-expansive material
Treatment of the soils with additives such as lime, fly-ash and other chemicals
2.4 RHA utilization in past research studies
Muntohar (2002) reported that there is a potential use of silica waste, resulting from
burnt rice husk, as a pozzolanic material. He studied the utilization of ashes produced
from uncontrolled rice husk burnt in Yogyakarta (Indonesia). Atterberg limits,
compaction, compressive strength and bearing capacity tests were carried out
individually or in a combination in which the rice husk ash (RHA) content varied
from 7.5, 10, and 12.5 percent, and lime content from 2, 4, 6, and 10 percent (by the
dry weight of soil). He found that lime – rice husk ash decreased the swell of
expansive soil and improved its strength and bearing capacity.
18
Mtallib and Bankole (2011) carried out experimental study on lime stabilized lateritic
soils using rice husk ash as admixture. The index property tests classified the soils as
A-7-6 under the AASHTO soil classification scheme. Index and geotechnical
properties tests conducted on the soil containing lime and rice husk ash combinations
showed significant improvement in properties. The Atterberg limits were significantly
altered with lime and rice husk ash combination; the plasticity of the soils were
significantly reduced from 18.10 to 6.70 for soil sample A and 26.6 to 5.92 for soil
sample B at 6 % lime and 12.5% RHA combination. In terms of compaction
characteristics, addition of lime and rice husk ash decreased the maximum dry density
and increased the optimum moisture content. At 8% lime and 12.5% RHA, the values
of MDD for soil samples A and B were 1.27 and 1.22 Mg/m3 respectively. The
California bearing ratio values peaked at 50% unsoaked values for 8 % lime and 10 %
RHA combinations for soil sample A while that of soil sample B was 30% at 6% lime
and 12.5% RHA combinations. They found that the material is deemed inadequate
for use as a road pavement base or sub-base.
Koteswara et al. (2011) used rice husk ash, lime and gypsum as additives to
expansive soil which resulted in considerable improvement in the strength
characteristics of the expansive soil. It was found that rice husk ash could potentially
stabilize the expansive soil solely or mixed with lime and gypsum. The utilization of
industrial wastes like RHA, lime and gypsum is an alternative to reduce the
construction cost of roads particularly in the rural areas. It was observed that the
liquid limit of the expansive soil decreased by 22% with the addition of 20% RHA
and 5% lime. It was noticed that the free swell index of the expansive soil had been
19
reduced by 88% with the addition of 20% RHA and 5% lime. The unconfined
compressive strength of the expansive soil had been increased by 548% with addition
of 20% RHA and 5% lime and 3% gypsum after 28 days curing. The research also
found out that rice husk ash had the potential to stabilize soil on its own.
Shah et al (2013) studied the use of rice husk ash as a stabilizer in rammed earth. The
proctor tests results indicated that with the increase in RHA percentage there was an
increase in the optimum moisture content (OMC) from 9.84% to 19 % and reduction
in the maximum dry density (MDD). The compressive strength values decreased with
increase in percentages of rice husk ash addition and having its maximum strength at
5% RHA.
Sabat et al (2011) studied the effect of marble dust on strength and durability of rice
husk ash stabilized expansive soil and found that the optimum percentage of rice husk
ash was 10% based on unconfined compressive strength and marble dust was added.
The soaked California Bearing Ratio (CBR) tests and unconfined compressive
strength test of the RHA stabilized expansive soil increased up to 20% addition of
marble dust. They also noted that further addition of marble dust had negative effects
on these properties. The durability test showed that the addition of marble dust made
the rice husk ash stabilized expansive soil durable. They concluded that for best
stabilization effect the optimum proportion of soil: rice husk ash: marble dust was 70:
10: 20.
Sarkar et al (2012) studied the effects of rice husk ash (RHA) on the geotechnical
properties of cohesive soil in stabilized forms specifically strength, workability,
20
compaction and compressibility characteristics. They carried out laboratory tests for
different percentages of RHA content and original soil samples. They found that the
soil could be made lighter in weight which led to decrease in dry density and increase
in moisture content and reduced free swelling and compressibility due to the addition
of RHA with the soil. Besides that the unconfined compressive strength and shear
strength of soil can be optimized with the addition of 10% RHA content.
Obam et al (2011) studied the engineering properties of clay-rice husk ash
composites. They carried out laboratory experimental procedures to determine the
specific gravity of the clay, plasticity index, strength, shrinkage, cracks, and weight of
natural clay mixed with rice husk ash (RHA). Results showed that the average
specific gravity of the clay was 2.65; shrinkage, plasticity, and cracking of the clay
were improved in the composites. However, the compressive strength of clay was not
improved by the addition of RHA.
Eberemu (2011) conducted one dimensional laboratory consolidation tests on
compacted lateritic soils treated with up to 16% rice-husk ash (RHA) to assess its
consolidation properties. Specimens were prepared at three different moulding water
contents (2% dry of optimum, optimum moisture content (18%) and 2% wet of
optimum) and compacted using the British Standard Light compactive effort. Pre-
consolidation pressure increased with RHA content; it also decreased before
increasing with increased moulding water content. Reductions in compression index
(Cc) and swell index (Cs) with increased RHA content were recorded. Cc and Cs
generally decreased before increasing with increased moulding water content. The
coefficient of volume compressibility (Mv) decreased and later increased with higher
21
RHA content; they were also affected by the soil particle state with increasing
pressure. The co-efficient of consolidation (CV) showed no observable trend with
increased RHA content but generally increased with higher consolidation pressure on
the dry and wet side of optimum compacted states.
Jain and Puri (2013) conducted one-dimensional consolidation tests to study the
effect of addition of various percentages of rice husk ash on compressibility
characteristics of highly plastic clay soil. It was observed that due to the addition of
rice husk ash to the parent clay, compression index (Cc) decreased significantly with
increase in percentage of rice husk ash, hence decreasing consolidation settlement of
parent material. It was also observed that the time required for achieving a given
degree of consolidation decreased with increase in the percentage of rice husk ash at a
particular effective stress. In general, it was observed that rice husk ash effectively
increased one-dimensional stiffness and therefore, reduced settlement.
Narasihma et al (2014) conducted compressibility behaviour of black cotton soil
admixed with lime and rice-husk ash and found that optimum moisture content
increased as the percentage of lime or RHA or lime and RHA increased. Maximum
dry unit weight decreased as the percentage of lime or RHA or lime and RHA
increases. 1:1 mix ratio is more effective than all other ratios investigated indicating
extra pre-consolidation effect to the soil and economical among all the other ratios in
reducing compression index. Compression index and swelling index of the soil
decreased as the percentage of admixture increased while coefficient of stability
increased. Coefficient of consolidation decreases as the consolidation pressure
increases and as the percentage admixture increases. Hence the compressibility
22
characteristics of black cotton soils could be improved to a great extent by stabilizing
either with lime or lime and rise-husk ash in combination in 1:1 proportion. They also
concluded that the secondary additive rice-husk ash not only brought down the cost of
stabilization but also appeared to be a successful solution for improving the
engineering properties of black cotton soils .Thus economy in stabilization can be
achieved.
However, from the reviewed literature (Shah et al, 2013, Muntohar, 2002, Mtallib
and Bankole, 2011, Koteswara et al., 2011, Sarkar et al, 2012), the previous works
with RHA have shown that it has promising potentials of improving the engineering
properties of soils for sub-grade and walling purposes. Thus, this work focused on
investigating the performance of compressed interlocking soil blocks stabilized using
uncontrolled burnt rice husk ash (RHA) and cement.
2.5 Research gap
This research was being carried out with the concern of reducing energy usage and the
consequent CO2 emissions arising from firing clay bricks in kilns and during cement
production which has a direct effect on climate change (CERAM, 2009). Fired clay
bricks requires cutting down of trees to be used in burning them. This causes
increased deforestation and can lead to drought which may expose homes and
occupants to greater risks unless this is reduced. The fact that rice husk ash soil
stabilized earth blocks (unfired clay bricks) are unburned and can be manufactured
onsite and used without any transport cost, makes them a cheap material with very
low embodied energy. In today's climate where energy prices and environmental
awareness of the general public is on the increase, research on stabilized earth blocks
23
is considered to be a significant contribution to knowledge. Their use is a cost
effective opportunity for locals to have better houses while reducing deforestation.
From the reviewed literature, existing research studies on compressed interlocking
blocks using black cotton soil for building applications are relatively few when
compared to the volume of research completed on clay fired brick development. From
the reviewed existing literature, it is realized that there are still some particular
drawbacks such as high manufacturing costs, high product costs, the use of large
proportion of cement in stabilizing the soil and mortar for joining the soil blocks. In
general, from all the stabilization techniques there have been no reported cases of
compressed interlocking blocks technology i.e. production of unfired clay bricks with
black cotton soil and rice husk ash as a main stabilizing agent. Consequently it can be
acknowledged that the current research work is a new idea of incorporating activated
rice husk ash waste material in soil stabilization.
On the other hand, from the reviewed literature, the utilization of rice husk ash, an
agricultural by-product, is ingrained as a binder in many concrete applications in
other countries like India and UK. It has been utilized for soil stabilization in
highways and other foundation layers, where it has been claimed to provide enhanced
durability, improve the engineering properties, control the volume stability, and
increase the resistance to erosion, weathering and traffic loading.
Rice husk ash has extremely low energy usage and CO2 emission when compared
with cement and this make it a good material which can be utilized to partially
replace cement thus reducing the environmental effects and save energy in cement
24
production. The local availability of rice husks in some rice producing counties in
Kenya means that the rice husk ash utilization in this research work is in line with the
current sustainability guidelines for new material development in Kenya and in the
world at large.
This research was hoped to contribute to existing knowledge on compressed earth
blocks produced with black cotton soil, by utilizing the promising cementitious
properties of rice husk ash to improve the black cotton soil in terms of strength and
durability and also produce cost effective materials for construction walls thus
providing decent and low-cost housing.
25
3 CHAPTER THREE: MATERIALS AND METHODS
3.1 Acquisition and processing of stabilizers
Rice husk is an agricultural residue from the rice milling process. Rice husks used in
the preparation of rice husk ash used in the experimental study were obtained from
Mwea Tebere rice scheme millers. The ash was sieved through 0.6mm sieve to
remove unburnt particles and then finally sieved through 150µm sieve to get the fine
ash used.
Cement used was ordinary Portland cement (OPC) (Kenya Bureau of Standards KS-
02:l976) from Bamburi cement factory. OPC was selected because it has a unique
and superior binding capacity, and also, it is widely available in most parts of the
country and the world at large. Lime is inexpensive, but care must be taken to protect
workers from breathing in lime dust (Kerali, 2000).
3.2 Preparation of experimental soil
Black cotton soil was collected from a construction site within Jomo Kenyatta
University of Agriculture and Technology. To obtain a soil sample, about 200 mm of
the top soil layer was removed and then the sample was scooped. This was done to
avoid excessive organic matter from the top soil layer. The collected sample was then
air dried. Due to the nature of soil which contains various sizes of grain from very
fine dust up to pieces that are still too large for use in block making, the oversized
material was ground and others removed by sieving using a 5 mm sieve manually in
accordance to the procedure outlined in BS 1377-1:1990.
26
3.3 Determination of physical and mechanical characteristics of soil
The following geotechnical properties were determined: Particle Size Distribution,
specific gravity and Atterberg Limits in accordance to BS 1377-2:1990 procedures
and standards. Compaction characteristics of the soil (Maximum Dry Density and
Optimum Moisture Content) were determined in accordance to the BS 1377:1990:
Part 4 procedures and standards.
Figure: 3-1 Standard proctor compaction test
3.4 Preparation of stabilized soil and production of interlocking earth blocks
3.4.1 Stabilization with cement
Cement was added to black cotton soil for purposes of stabilization. Quantities of
cement were varied as shown in Table 3-1. The dry soil and cement were thoroughly
mixed, and then water was added a little at a time until the optimum moisture content
of the mixture was reached. Three (3) interlocking blocks were made for the
27
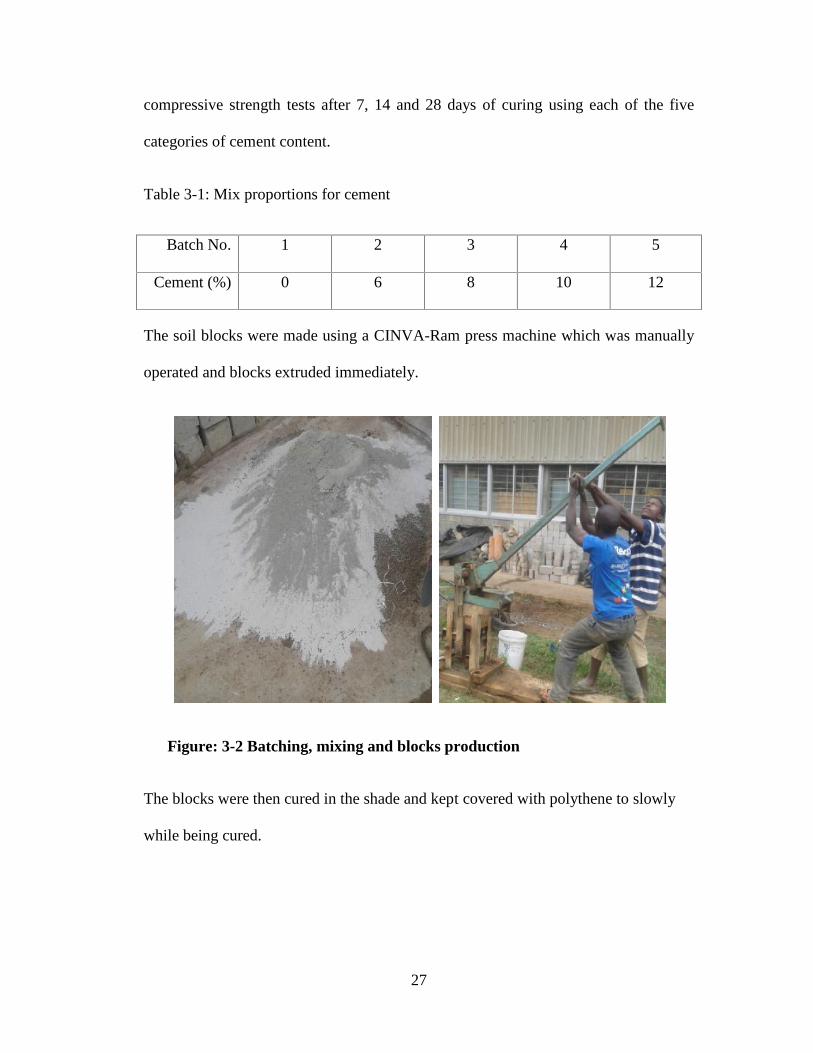
compressive strength tests after 7, 14 and 28 days of curing using each of the five
categories of cement content.
Table 3-1: Mix proportions for cement
Batch No. 1 2 3 4 5
Cement (%) 0 6 8 10 12
The soil blocks were made using a CINVA-Ram press machine which was manually
operated and blocks extruded immediately.
Figure: 3-2 Batching, mixing and blocks production
The blocks were then cured in the shade and kept covered with polythene to slowly
while being cured.
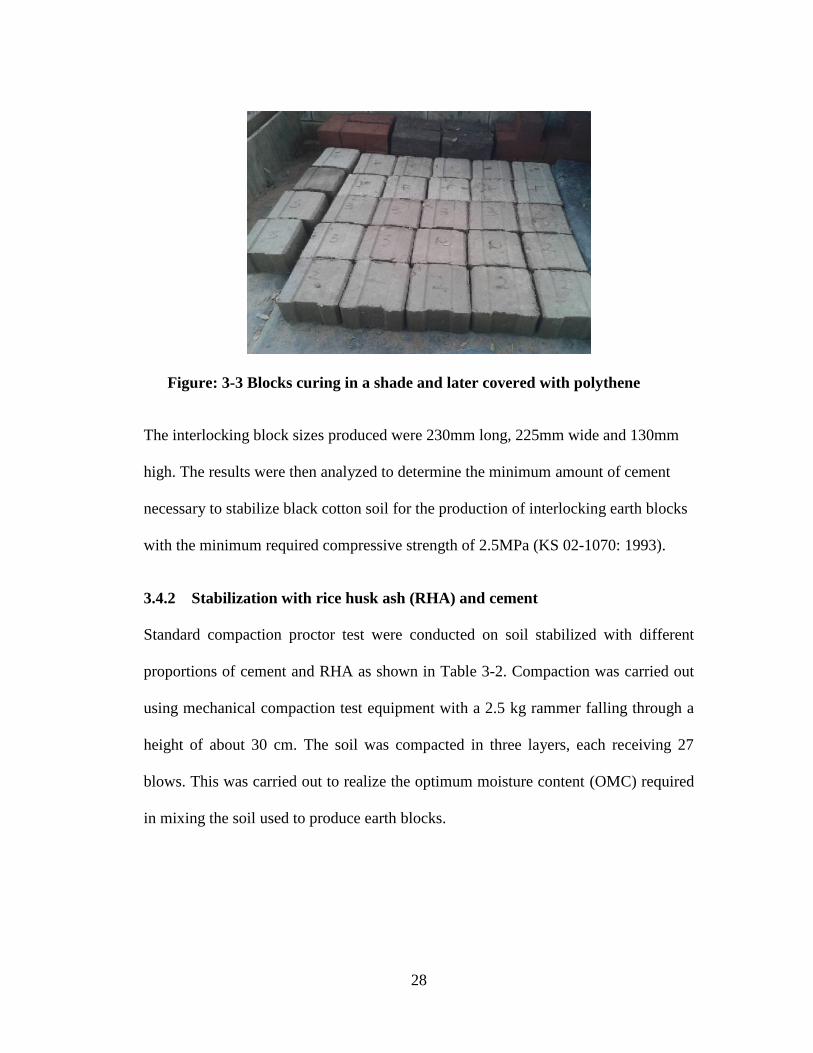
28
Figure: 3-3 Blocks curing in a shade and later covered with polythene
The interlocking block sizes produced were 230mm long, 225mm wide and 130mm
high. The results were then analyzed to determine the minimum amount of cement
necessary to stabilize black cotton soil for the production of interlocking earth blocks
with the minimum required compressive strength of 2.5MPa (KS 02-1070: 1993).
3.4.2 Stabilization with rice husk ash (RHA) and cement
Standard compaction proctor test were conducted on soil stabilized with different
proportions of cement and RHA as shown in Table 3-2. Compaction was carried out
using mechanical compaction test equipment with a 2.5 kg rammer falling through a
height of about 30 cm. The soil was compacted in three layers, each receiving 27
blows. This was carried out to realize the optimum moisture content (OMC) required
in mixing the soil used to produce earth blocks.
29
Table 3-2: Mix proportions for cement and rice husk ash
Batch Cement (%) RHA (%)
1 8 0
2 7 2.5
3 6 5
4 5 7.5
5 4 10
6 3 12.5
7 2 15
8 1 17.5
9 0 20
For each mix twelve replicates were produced. Three blocks were tested for
compressive strength after 7, 14 and 28 days of curing, respectively. Water absorption
test was done for three blocks.
3.5 Compressive strength and water absorption of interlocking earth blocks
3.5.1 Dry compressive strength test of interlocking earth blocks
Compressive strength tests were conducted using a universal testing machine and the
data recorded using a data logger with a sensitivity of 2.0Mv/V and a load cell with a
capacity of 50 tonnes. The block to be tested was loaded across the full width and
breadth. Special steel plates of sizes 100mm x 240mm with slanting edges, 50mm x
240mm with a slanting side and thickness 10 mm were prepared and placed within
the grooves of the blocks as shown in Figure 3-1. The plates were welded on a flat
steel plate to ensure they interlocked well with the grooves of the block. This type of
loading method is set to simulate behavior of blocks in practice, where blocks are laid
in an interlocking tongue and groove manner and all voids are filled with mortar
30
(Deepak, 2010). The load was applied gradually over the plates till failure occurred.
The maximum load at failure was noted. The dry compressive strength of each
specimen is then calculated using the formula:
= ………………………………… . .3.1Where:
CD = Dry compressive strength in N/mm2.
WD = Total load at which the dry specimen failed in Newton’s.
A = the surface area on which the load was applied in mm2
Figure: 3-4 Compressive strength test of the blocks
The compressive strength of the block (CD) was then calculated and the raw is as
shown in appendix ix and xiii. This test was done after curing the blocks for a period
of 7 days, 14 days and again at 28 days.
Introduced plates
31
Various international standards exist to govern the minimum permissible compressive
strength of soil stabilized blocks. German Standard DIN 18954 recommends a
minimum compressive strength between 2 and 4 MPa (Minke, 2006) for dry soil
stabilized blocks, while New Mexico Earthen Building Materials Code Section
14.7.4.23 requires a minimum compressive strength of 300 psi (2.06 MPa) for soil
stabilized blocks that have been fully submerged in water for a minimum of four
hours. Both the above standards limit soil stabilized block buildings to two stories.
Based on these standards, a minimum compressive strength of 2.5 MPa was chosen as
a mix design evaluation criteria. The minimum amount of cement stabilizers required
were obtained by using a linear graph on the 28th day compressive strength values.
3.5.2 Water absorption of interlocking earth blocks
Using an electronic weighing machine, dry blocks were weighed (Wd) and, immersed
in water for 24 hours, after which they were removed and weighed again (Ww). Only
5 mm of a block was inserted in water.
Figure: 3-5 Water absorption test of the blocks
32
The percentage moisture absorption by weight was calculated as follows:
Mc = 100%……………………………………3.2Where:
Mc = percentage moisture absorption (%)
Ww= mass of wetted sample (g)
Wd = mass of dry sample (g)
The resulting value was analyzed in tabular and graphical format to understand the
relationship between the stabilizer and the water absorption.
3.6 Unconfined compressive strength for the experimental soil
Soil stabilized with different amounts of cement was used in this study to prepare the
specimens (See Table 3-1). Cylindrical soil specimens of 50 mm diameter and a
height of 100 mm were molded as shown in figure 3-2 and cured for 7 days in a moist
environment before subjecting them to compression test. An average of three
specimens per mix was tested for unconfined compressive strength, in accordance
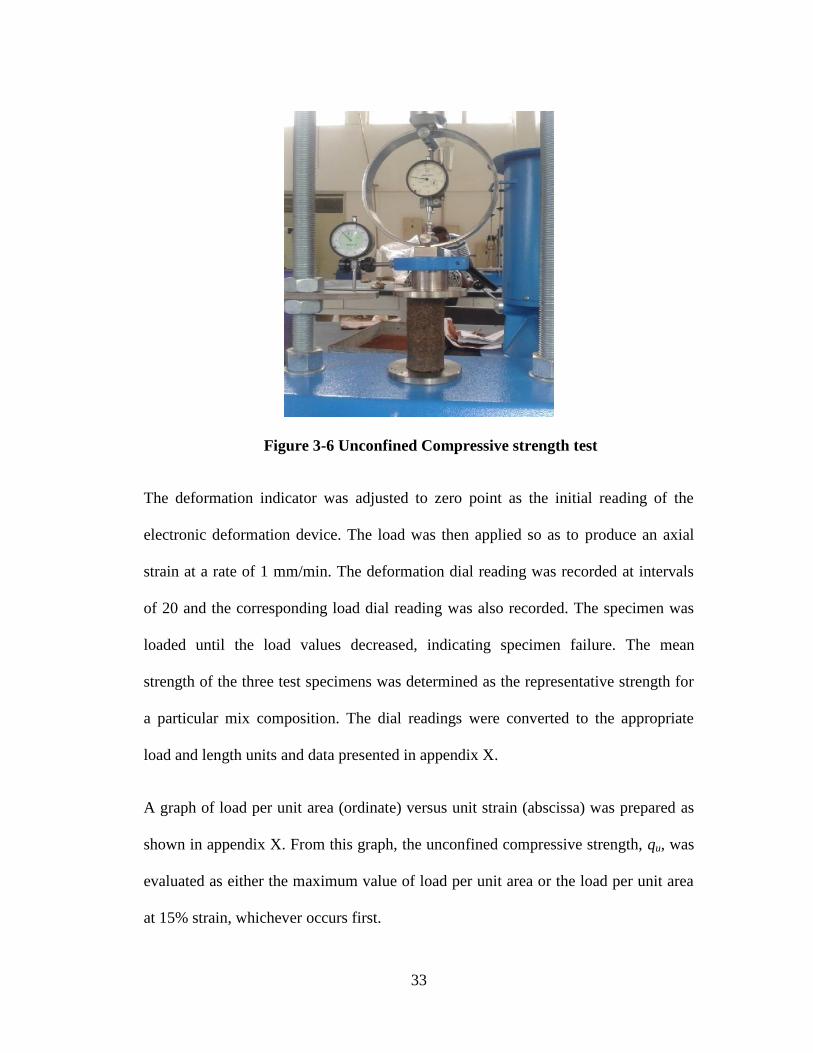
with BS 1924-2; 1990, using a compression machine.
33
Figure 3-6 Unconfined Compressive strength test
The deformation indicator was adjusted to zero point as the initial reading of the
electronic deformation device. The load was then applied so as to produce an axial
strain at a rate of 1 mm/min. The deformation dial reading was recorded at intervals
of 20 and the corresponding load dial reading was also recorded. The specimen was
loaded until the load values decreased, indicating specimen failure. The mean
strength of the three test specimens was determined as the representative strength for
a particular mix composition. The dial readings were converted to the appropriate
load and length units and data presented in appendix X.
A graph of load per unit area (ordinate) versus unit strain (abscissa) was prepared as
shown in appendix X. From this graph, the unconfined compressive strength, qu, was
evaluated as either the maximum value of load per unit area or the load per unit area
at 15% strain, whichever occurs first.
34
3.7 Linear shrinkage test for the interlocking blocks
The dimensions of the interlocking block were measured when dry before testing
them to get the dimensional changes from wet to dry cured blocks. A vernier calliper
was used to measure the dimensions of the blocks and test results are shown in table
4-8. The linear shrinkage was then calculated as:
% ℎ = ∆ 100 ………………………………… . .3.3Where: ΔL = Change in length of the block
L = Original length of the block
The results were recorded in tabular for and analyzed in a bar graph format.
3.8 Cost analysis
The cost of using rice husk ash and cement to stabilize clay for earth block production
was compared against the cost of soil stabilization using cement. This was carried out
upon determining the minimum amount of cement and mix proportion of cement and
rice husk ash required for stabilizing black cotton soil for the production of
interlocking earth blocks which meets the minimum required compressive strength.
35
4 CHAPTER FOUR: RESULTS, ANALYSIS AND DISCUSSION
4.1 Physical properties of the soil sample
The physical and mechanical properties of the soil sample were considered as they
are of greater interest for making compressed stabilized soil block. The results of
these properties will help to determine the ease of mixing, forming, de-molding,
shrinkage, dry strength and apparent bulk density of the blocks.
4.1.1 Particle size distribution
A combined analysis of particle size distribution was used to determine the soil grain
size. Wet and dry sieving analysis was carried out where by the soil was shaken
mechanically through a stack of sieves with different opening sizes and the
percentage retained in each sieve recorded. The particles smaller than sieve 0.075mm
were analyzed by using a hydrometer and Stoke's equation for the velocity of a free
falling sphere to determine the range of fine particles. The results of these tests are
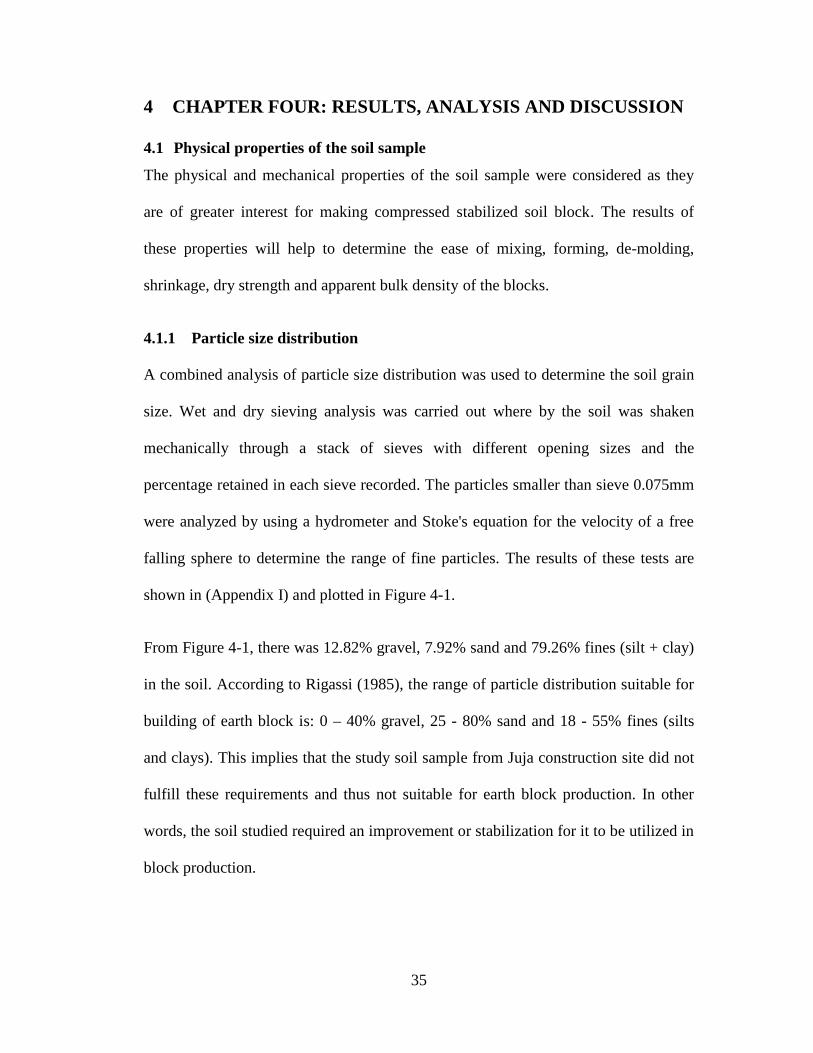
shown in (Appendix I) and plotted in Figure 4-1.
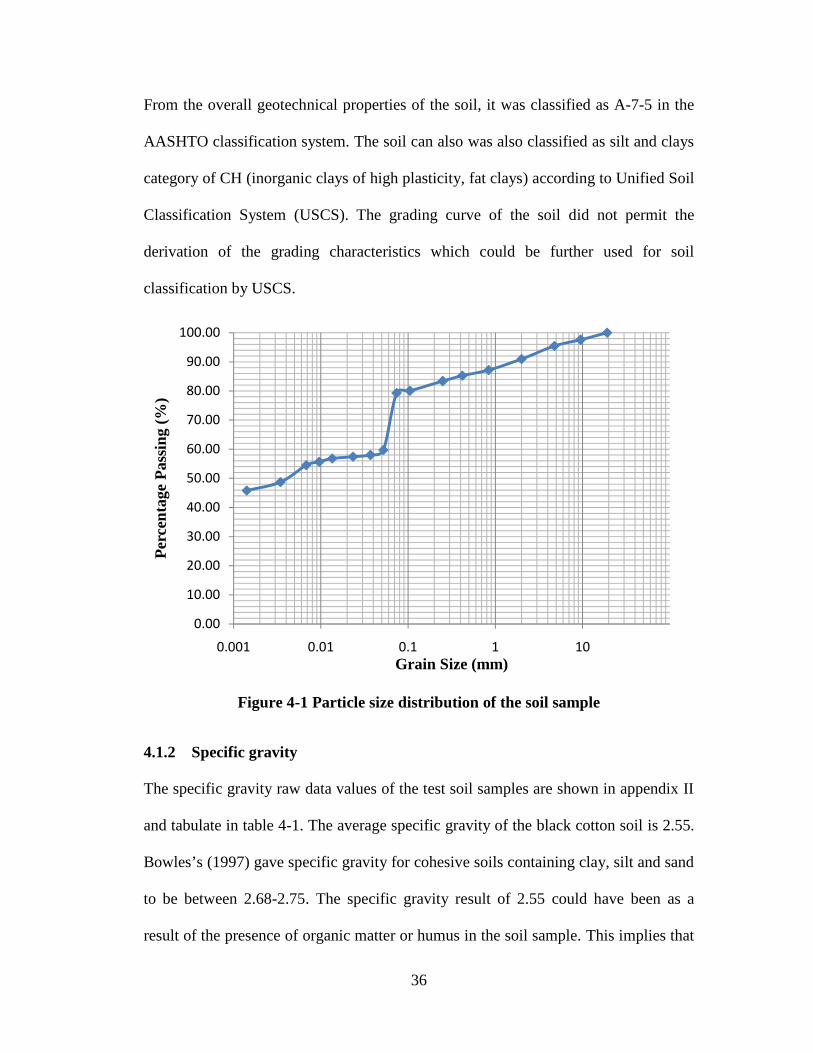
From Figure 4-1, there was 12.82% gravel, 7.92% sand and 79.26% fines (silt + clay)
in the soil. According to Rigassi (1985), the range of particle distribution suitable for
building of earth block is: 0 – 40% gravel, 25 - 80% sand and 18 - 55% fines (silts
and clays). This implies that the study soil sample from Juja construction site did not
fulfill these requirements and thus not suitable for earth block production. In other
words, the soil studied required an improvement or stabilization for it to be utilized in
block production.
36
From the overall geotechnical properties of the soil, it was classified as A-7-5 in the
AASHTO classification system. The soil can also was also classified as silt and clays
category of CH (inorganic clays of high plasticity, fat clays) according to Unified Soil
Classification System (USCS). The grading curve of the soil did not permit the
derivation of the grading characteristics which could be further used for soil
classification by USCS.
Figure 4-1 Particle size distribution of the soil sample
4.1.2 Specific gravity
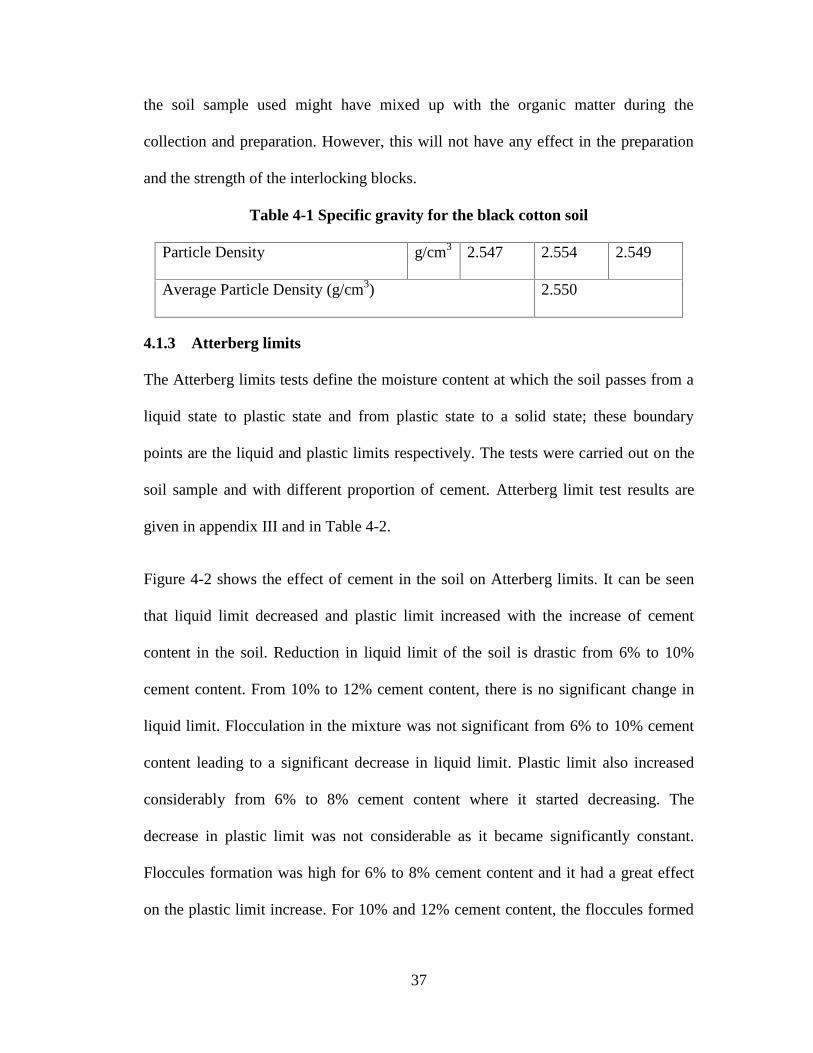
The specific gravity raw data values of the test soil samples are shown in appendix II
and tabulate in table 4-1. The average specific gravity of the black cotton soil is 2.55.
Bowles’s (1997) gave specific gravity for cohesive soils containing clay, silt and sand
to be between 2.68-2.75. The specific gravity result of 2.55 could have been as a
result of the presence of organic matter or humus in the soil sample. This implies that
0.00
10.00
20.00
30.00
40.00
50.00
60.00
70.00
80.00
90.00
100.00
0.001 0.01 0.1 1 10
Per
cent
age
Pas
sing
(%
)
Grain Size (mm)
37
the soil sample used might have mixed up with the organic matter during the
collection and preparation. However, this will not have any effect in the preparation
and the strength of the interlocking blocks.
Table 4-1 Specific gravity for the black cotton soil
Particle Density g/cm3 2.547 2.554 2.549
Average Particle Density (g/cm3) 2.550
4.1.3 Atterberg limits
The Atterberg limits tests define the moisture content at which the soil passes from a
liquid state to plastic state and from plastic state to a solid state; these boundary
points are the liquid and plastic limits respectively. The tests were carried out on the
soil sample and with different proportion of cement. Atterberg limit test results are
given in appendix III and in Table 4-2.
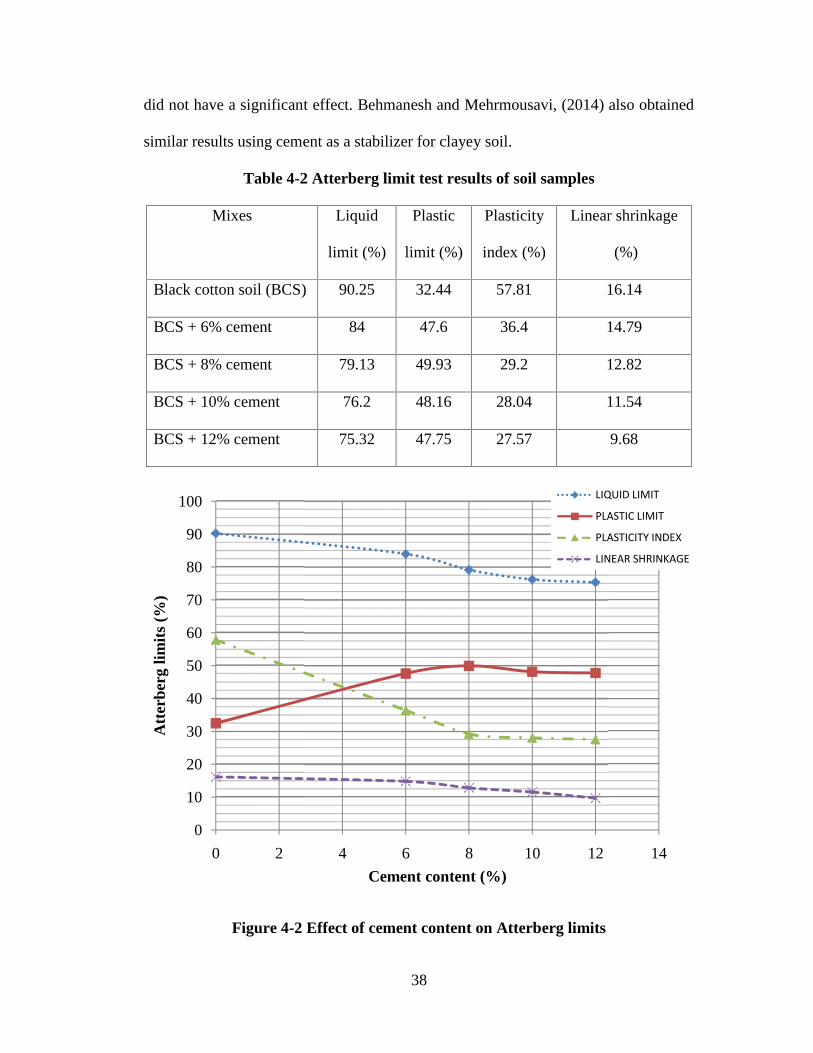
Figure 4-2 shows the effect of cement in the soil on Atterberg limits. It can be seen
that liquid limit decreased and plastic limit increased with the increase of cement
content in the soil. Reduction in liquid limit of the soil is drastic from 6% to 10%
cement content. From 10% to 12% cement content, there is no significant change in
liquid limit. Flocculation in the mixture was not significant from 6% to 10% cement
content leading to a significant decrease in liquid limit. Plastic limit also increased
considerably from 6% to 8% cement content where it started decreasing. The
decrease in plastic limit was not considerable as it became significantly constant.
Floccules formation was high for 6% to 8% cement content and it had a great effect
on the plastic limit increase. For 10% and 12% cement content, the floccules formed
38
did not have a significant effect. Behmanesh and Mehrmousavi, (2014) also obtained
similar results using cement as a stabilizer for clayey soil.
Table 4-2 Atterberg limit test results of soil samples
Mixes Liquid
limit (%)
Plastic
limit (%)
Plasticity
index (%)
Linear shrinkage
(%)
Black cotton soil (BCS) 90.25 32.44 57.81 16.14
BCS + 6% cement 84 47.6 36.4 14.79
BCS + 8% cement 79.13 49.93 29.2 12.82
BCS + 10% cement 76.2 48.16 28.04 11.54
BCS + 12% cement 75.32 47.75 27.57 9.68
Figure 4-2 Effect of cement content on Atterberg limits
0
10
20
30
40
50
60
70
80
90
100
0 2
Att
erbe
rg li
mit
s (%
)
38
did not have a significant effect. Behmanesh and Mehrmousavi, (2014) also obtained
similar results using cement as a stabilizer for clayey soil.
Table 4-2 Atterberg limit test results of soil samples
Mixes Liquid
limit (%)
Plastic
limit (%)
Plasticity
index (%)
Linear shrinkage
(%)
Black cotton soil (BCS) 90.25 32.44 57.81 16.14
BCS + 6% cement 84 47.6 36.4 14.79
BCS + 8% cement 79.13 49.93 29.2 12.82
BCS + 10% cement 76.2 48.16 28.04 11.54
BCS + 12% cement 75.32 47.75 27.57 9.68
Figure 4-2 Effect of cement content on Atterberg limits
4 6 8 10 12
Cement content (%)
LIQUID LIMIT
PLASTIC LIMIT
PLASTICITY INDEX
LINEAR SHRINKAGE
38
did not have a significant effect. Behmanesh and Mehrmousavi, (2014) also obtained
similar results using cement as a stabilizer for clayey soil.
Table 4-2 Atterberg limit test results of soil samples
Mixes Liquid
limit (%)
Plastic
limit (%)
Plasticity
index (%)
Linear shrinkage
(%)
Black cotton soil (BCS) 90.25 32.44 57.81 16.14
BCS + 6% cement 84 47.6 36.4 14.79
BCS + 8% cement 79.13 49.93 29.2 12.82
BCS + 10% cement 76.2 48.16 28.04 11.54
BCS + 12% cement 75.32 47.75 27.57 9.68
Figure 4-2 Effect of cement content on Atterberg limits
12 14
LIQUID LIMIT
PLASTIC LIMIT
PLASTICITY INDEX
LINEAR SHRINKAGE
39
Plasticity index and linear shrinkage decreased with an increase in cement content. A
drastic decrease plasticity index is seen for 6% and 8% cement content and constant
decrease for 10% and 12% cement contents. Linear shrinkage had a constant decrease
for all the cement content increases. This meant that floccule numbers did not have
significant change when cement content was more than 10% because the liquid limit,
plastic limit and plasticity index were nearly constant. The unstabilized soil sample
had 90.25% liquid limit, 32.44% plastic limit, 57.81% plasticity index and 16.14%
linear shrinkage. The greater PI becomes, the greater the swell when soil is moistened
and its shrinkage when it dries.
4.1.4 Maximum dry density – moisture content relationship
The general meaning of soil compaction in soil mechanics is to press soil particles
tightly together by expelling the air from void spaces between the particles. It is also a
cheap and effective way to improve the properties of a soil sample. The amount of
compaction is quantified in terms of dry density (dry unit weight) of the soil.
Appendix IV to VIII shows the compaction test results for soils with various
percentages of cement. A graph of dry density versus moisture content was drawn to
determine the effect of cement on the compaction characteristics of the black cotton
soils.
40
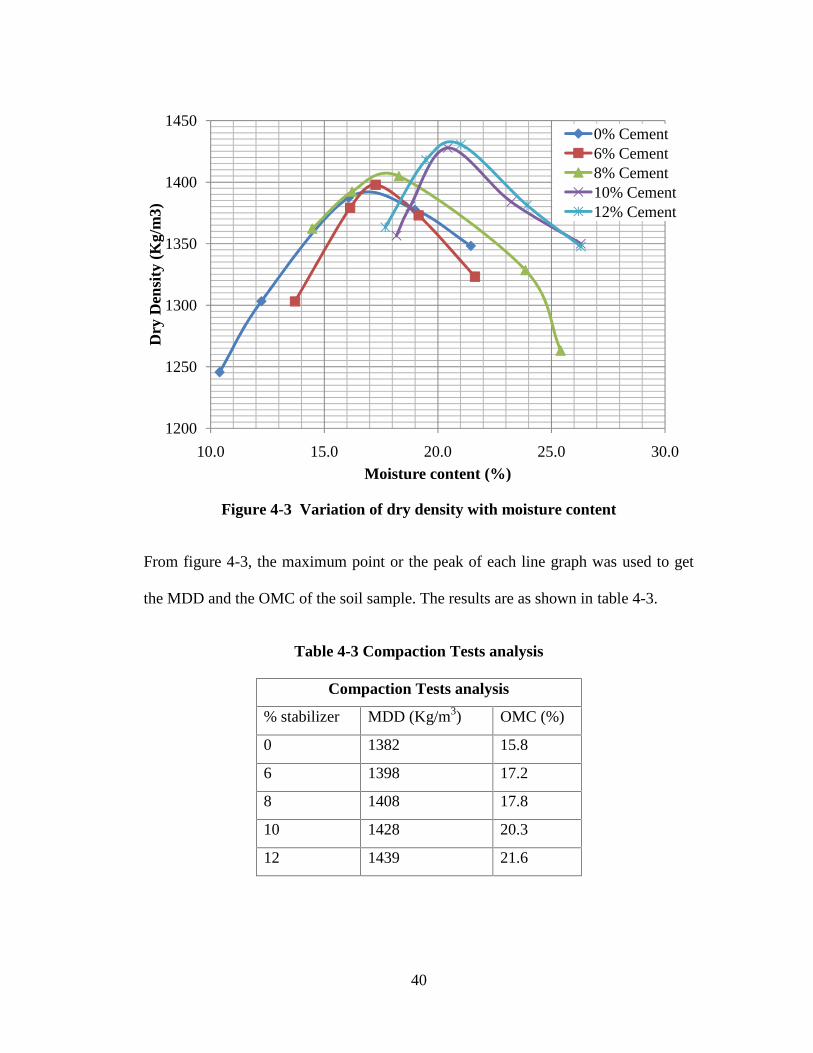
Figure 4-3 Variation of dry density with moisture content
From figure 4-3, the maximum point or the peak of each line graph was used to get
the MDD and the OMC of the soil sample. The results are as shown in table 4-3.
Table 4-3 Compaction Tests analysis
Compaction Tests analysis
% stabilizer MDD (Kg/m3) OMC (%)
0 1382 15.8
6 1398 17.2
8 1408 17.8
10 1428 20.3
12 1439 21.6
1200
1250
1300
1350
1400
1450
10.0 15.0 20.0 25.0 30.0
Dry
Den
sity
(K
g/m
3)
Moisture content (%)
0% Cement6% Cement8% Cement10% Cement12% Cement
41
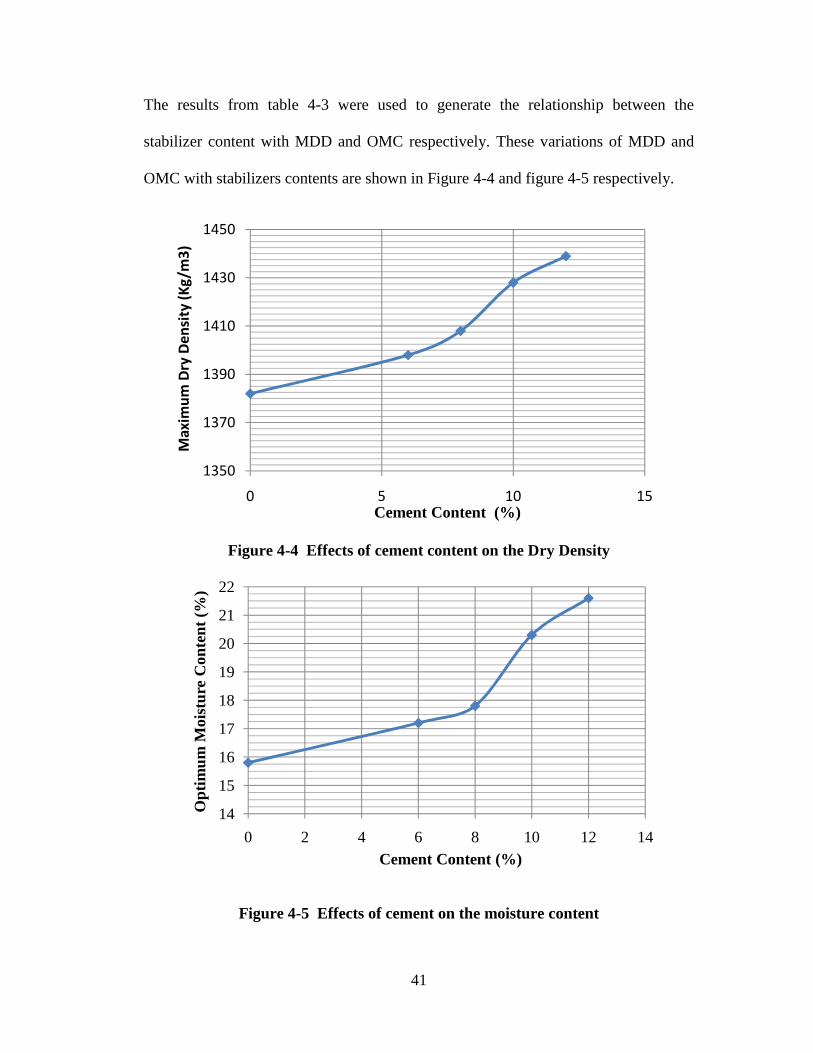
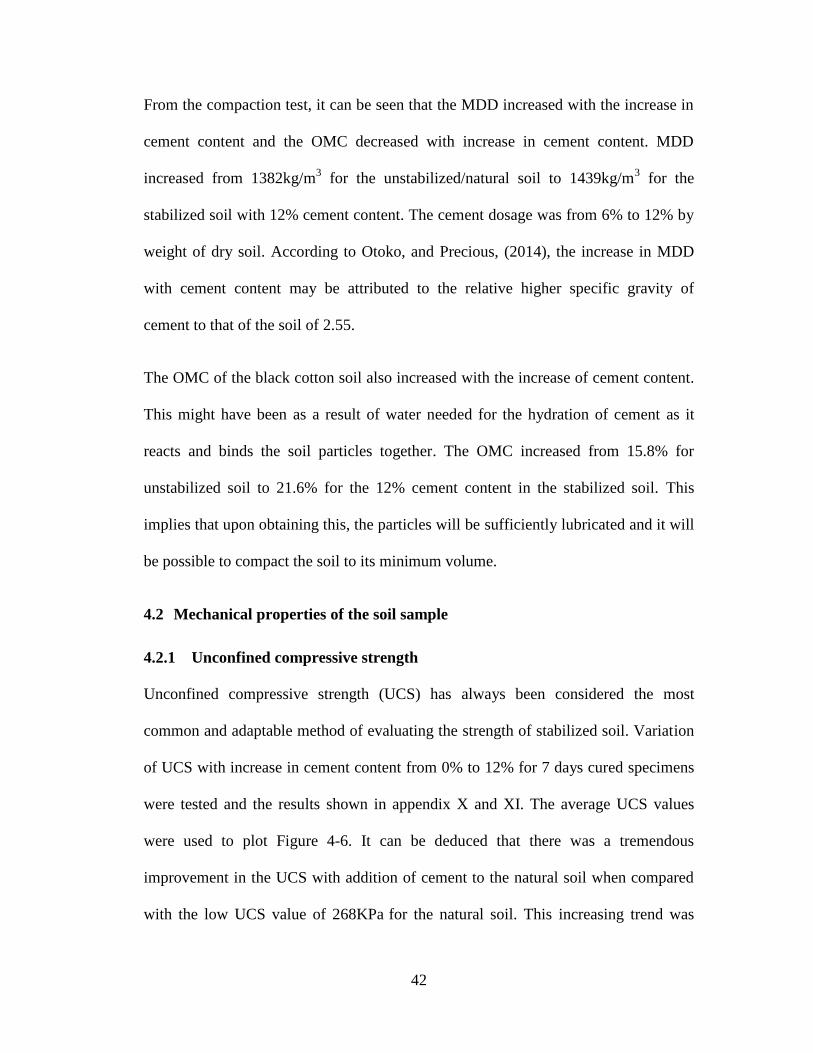
The results from table 4-3 were used to generate the relationship between the
stabilizer content with MDD and OMC respectively. These variations of MDD and
OMC with stabilizers contents are shown in Figure 4-4 and figure 4-5 respectively.
Figure 4-4 Effects of cement content on the Dry Density
Figure 4-5 Effects of cement on the moisture content
1350
1370
1390
1410
1430
1450
0 5 10 15
Max
imum
Dry
Den
sity
(Kg/
m3)
Cement Content (%)
14
15
16
17
18
19
20
21
22
0 2 4 6 8 10 12 14
Opt
imum
Moi
stur
e C
onte
nt (
%)
Cement Content (%)
42
From the compaction test, it can be seen that the MDD increased with the increase in
cement content and the OMC decreased with increase in cement content. MDD
increased from 1382kg/m3 for the unstabilized/natural soil to 1439kg/m3 for the
stabilized soil with 12% cement content. The cement dosage was from 6% to 12% by
weight of dry soil. According to Otoko, and Precious, (2014), the increase in MDD
with cement content may be attributed to the relative higher specific gravity of
cement to that of the soil of 2.55.
The OMC of the black cotton soil also increased with the increase of cement content.
This might have been as a result of water needed for the hydration of cement as it
reacts and binds the soil particles together. The OMC increased from 15.8% for
unstabilized soil to 21.6% for the 12% cement content in the stabilized soil. This
implies that upon obtaining this, the particles will be sufficiently lubricated and it will
be possible to compact the soil to its minimum volume.
4.2 Mechanical properties of the soil sample
4.2.1 Unconfined compressive strength
Unconfined compressive strength (UCS) has always been considered the most
common and adaptable method of evaluating the strength of stabilized soil. Variation
of UCS with increase in cement content from 0% to 12% for 7 days cured specimens
were tested and the results shown in appendix X and XI. The average UCS values
were used to plot Figure 4-6. It can be deduced that there was a tremendous
improvement in the UCS with addition of cement to the natural soil when compared
with the low UCS value of 268KPa for the natural soil. This increasing trend was
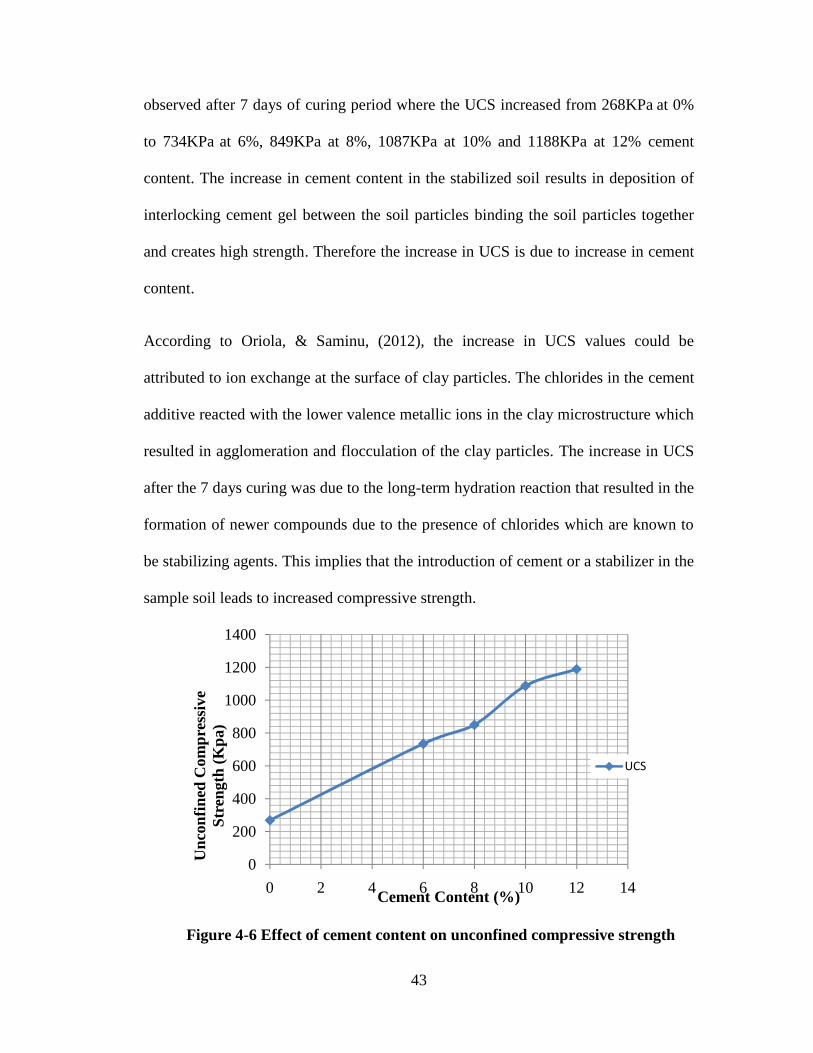
43
observed after 7 days of curing period where the UCS increased from 268KPa at 0%
to 734KPa at 6%, 849KPa at 8%, 1087KPa at 10% and 1188KPa at 12% cement
content. The increase in cement content in the stabilized soil results in deposition of
interlocking cement gel between the soil particles binding the soil particles together
and creates high strength. Therefore the increase in UCS is due to increase in cement
content.
According to Oriola, & Saminu, (2012), the increase in UCS values could be
attributed to ion exchange at the surface of clay particles. The chlorides in the cement
additive reacted with the lower valence metallic ions in the clay microstructure which
resulted in agglomeration and flocculation of the clay particles. The increase in UCS
after the 7 days curing was due to the long-term hydration reaction that resulted in the
formation of newer compounds due to the presence of chlorides which are known to
be stabilizing agents. This implies that the introduction of cement or a stabilizer in the
sample soil leads to increased compressive strength.
Figure 4-6 Effect of cement content on unconfined compressive strength
0
200
400
600
800
1000
1200
1400
0 2 4 6 8 10 12 14
Unc
onfi
ned
Com
pres
sive
Stre
ngth
(Kpa
)
Cement Content (%)
UCS
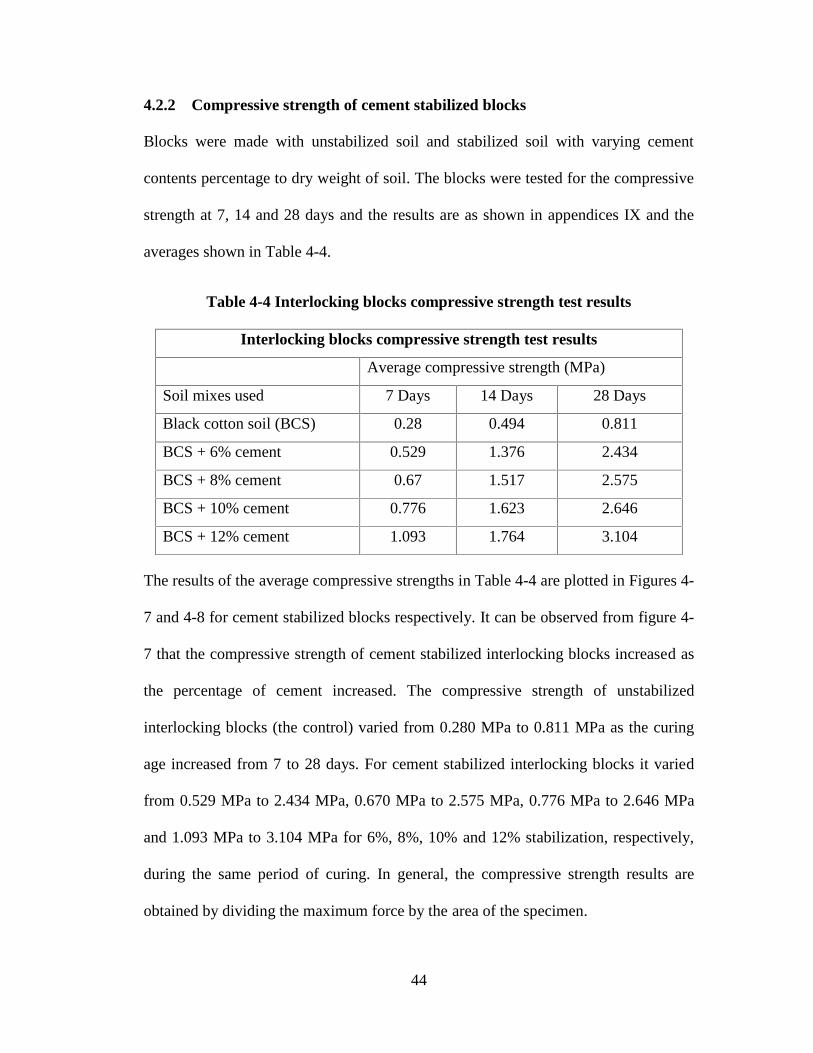
44
4.2.2 Compressive strength of cement stabilized blocks
Blocks were made with unstabilized soil and stabilized soil with varying cement
contents percentage to dry weight of soil. The blocks were tested for the compressive
strength at 7, 14 and 28 days and the results are as shown in appendices IX and the
averages shown in Table 4-4.
Table 4-4 Interlocking blocks compressive strength test results
Interlocking blocks compressive strength test results
Average compressive strength (MPa)
Soil mixes used 7 Days 14 Days 28 Days
Black cotton soil (BCS) 0.28 0.494 0.811
BCS + 6% cement 0.529 1.376 2.434
BCS + 8% cement 0.67 1.517 2.575
BCS + 10% cement 0.776 1.623 2.646
BCS + 12% cement 1.093 1.764 3.104
The results of the average compressive strengths in Table 4-4 are plotted in Figures 4-
7 and 4-8 for cement stabilized blocks respectively. It can be observed from figure 4-
7 that the compressive strength of cement stabilized interlocking blocks increased as
the percentage of cement increased. The compressive strength of unstabilized
interlocking blocks (the control) varied from 0.280 MPa to 0.811 MPa as the curing
age increased from 7 to 28 days. For cement stabilized interlocking blocks it varied
from 0.529 MPa to 2.434 MPa, 0.670 MPa to 2.575 MPa, 0.776 MPa to 2.646 MPa
and 1.093 MPa to 3.104 MPa for 6%, 8%, 10% and 12% stabilization, respectively,
during the same period of curing. In general, the compressive strength results are
obtained by dividing the maximum force by the area of the specimen.
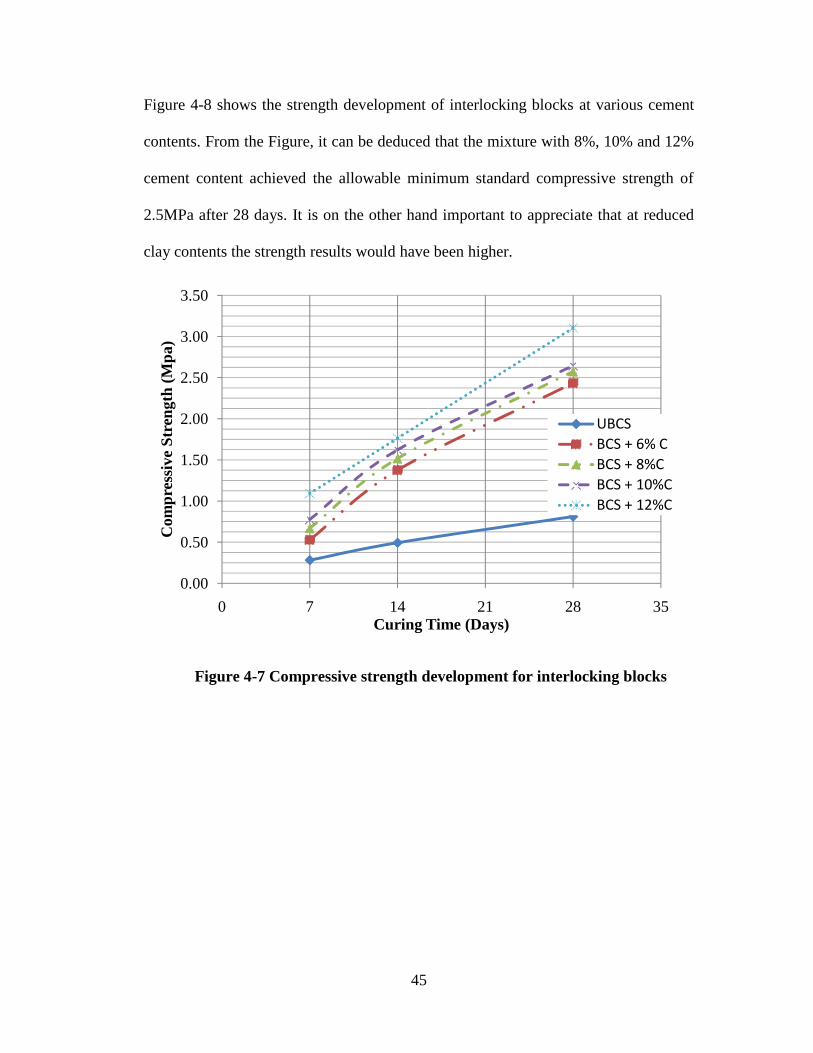
45
Figure 4-8 shows the strength development of interlocking blocks at various cement
contents. From the Figure, it can be deduced that the mixture with 8%, 10% and 12%
cement content achieved the allowable minimum standard compressive strength of
2.5MPa after 28 days. It is on the other hand important to appreciate that at reduced
clay contents the strength results would have been higher.
Figure 4-7 Compressive strength development for interlocking blocks
0.00
0.50
1.00
1.50
2.00
2.50
3.00
3.50
0 7 14 21 28 35
Com
pres
sive
Str
engt
h (M
pa)
Curing Time (Days)
UBCSBCS + 6% CBCS + 8%CBCS + 10%CBCS + 12%C
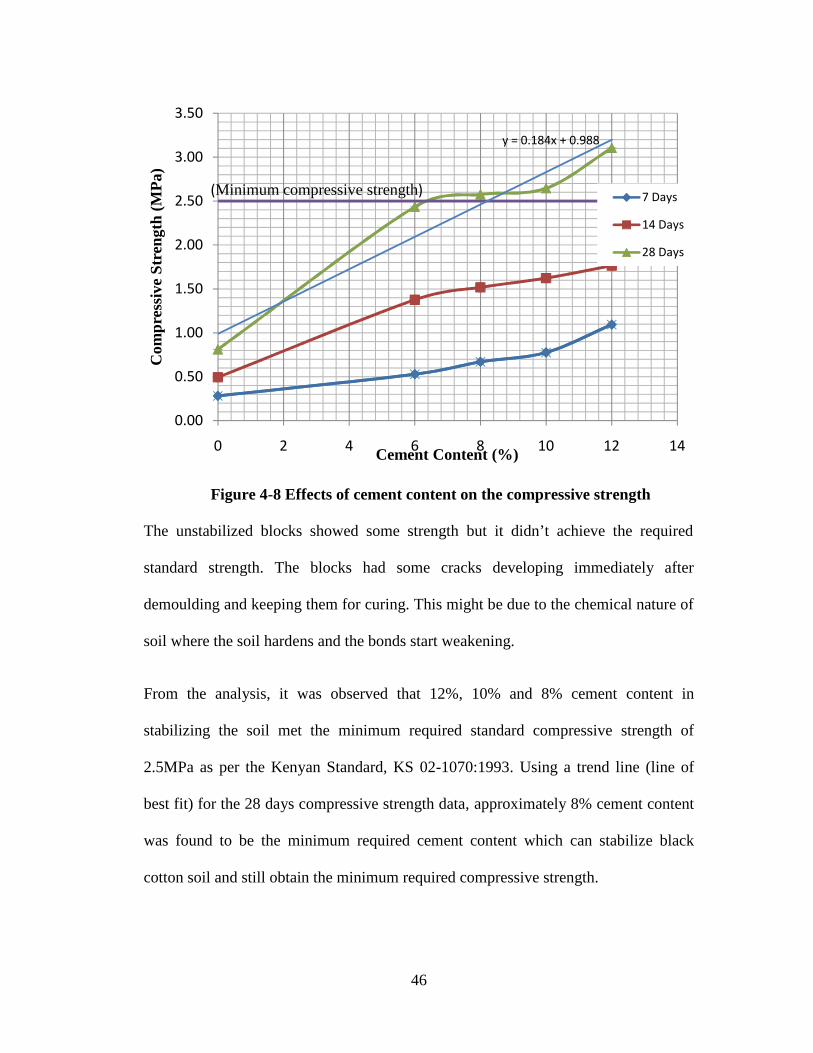
46
Figure 4-8 Effects of cement content on the compressive strength
The unstabilized blocks showed some strength but it didn’t achieve the required
standard strength. The blocks had some cracks developing immediately after
demoulding and keeping them for curing. This might be due to the chemical nature of
soil where the soil hardens and the bonds start weakening.
From the analysis, it was observed that 12%, 10% and 8% cement content in
stabilizing the soil met the minimum required standard compressive strength of
2.5MPa as per the Kenyan Standard, KS 02-1070:1993. Using a trend line (line of
best fit) for the 28 days compressive strength data, approximately 8% cement content
was found to be the minimum required cement content which can stabilize black
cotton soil and still obtain the minimum required compressive strength.
y = 0.184x + 0.988
0.00
0.50
1.00
1.50
2.00
2.50
3.00
3.50
0 2 4 6 8 10 12 14
Com
pres
sive
Str
engt
h (M
Pa)
Cement Content (%)
7 Days
14 Days
28 Days
(Minimum compressive strength)
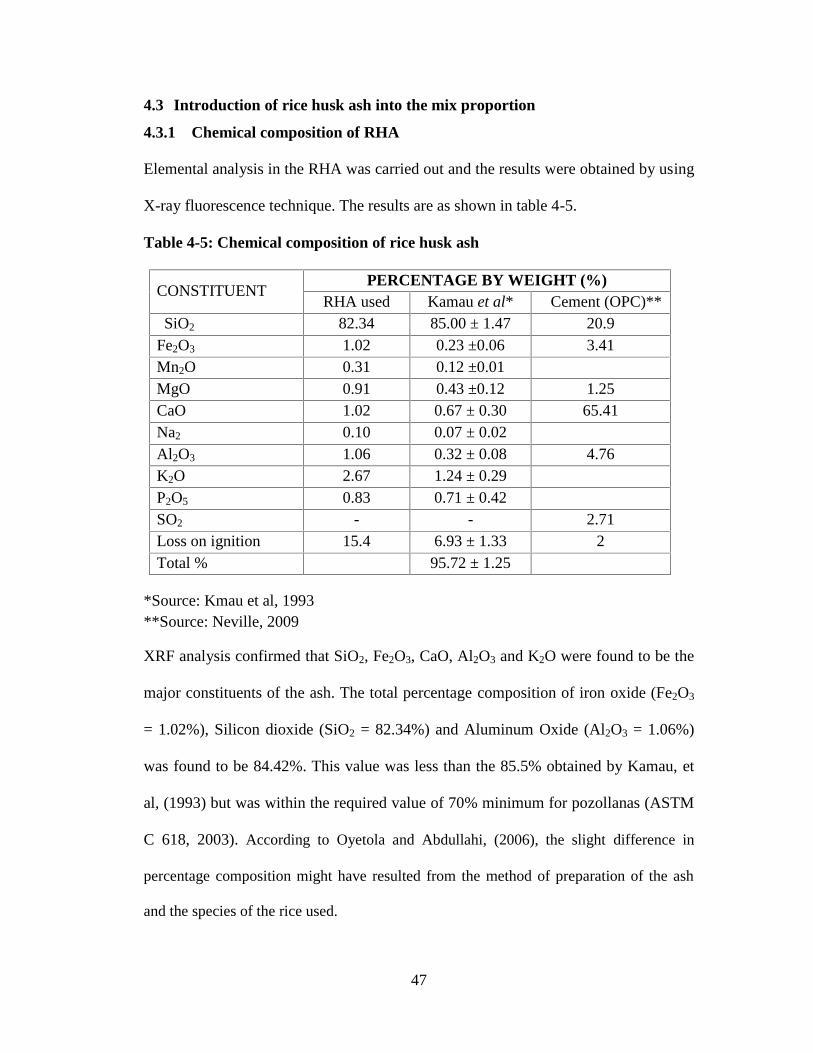
47
4.3 Introduction of rice husk ash into the mix proportion
4.3.1 Chemical composition of RHA
Elemental analysis in the RHA was carried out and the results were obtained by using
X-ray fluorescence technique. The results are as shown in table 4-5.
Table 4-5: Chemical composition of rice husk ash
CONSTITUENTPERCENTAGE BY WEIGHT (%)
RHA used Kamau et al* Cement (OPC)**SiO2 82.34 85.00 ± 1.47 20.9
Fe2O3 1.02 0.23 ±0.06 3.41Mn2O 0.31 0.12 ±0.01MgO 0.91 0.43 ±0.12 1.25CaO 1.02 0.67 ± 0.30 65.41Na2 0.10 0.07 ± 0.02Al2O3 1.06 0.32 ± 0.08 4.76K2O 2.67 1.24 ± 0.29P2O5 0.83 0.71 ± 0.42SO2 - - 2.71Loss on ignition 15.4 6.93 ± 1.33 2Total % 95.72 ± 1.25
*Source: Kmau et al, 1993**Source: Neville, 2009
XRF analysis confirmed that SiO2, Fe2O3, CaO, Al2O3 and K2O were found to be the
major constituents of the ash. The total percentage composition of iron oxide (Fe2O3
= 1.02%), Silicon dioxide (SiO2 = 82.34%) and Aluminum Oxide (Al2O3 = 1.06%)
was found to be 84.42%. This value was less than the 85.5% obtained by Kamau, et
al, (1993) but was within the required value of 70% minimum for pozollanas (ASTM
C 618, 2003). According to Oyetola and Abdullahi, (2006), the slight difference in
percentage composition might have resulted from the method of preparation of the ash
and the species of the rice used.
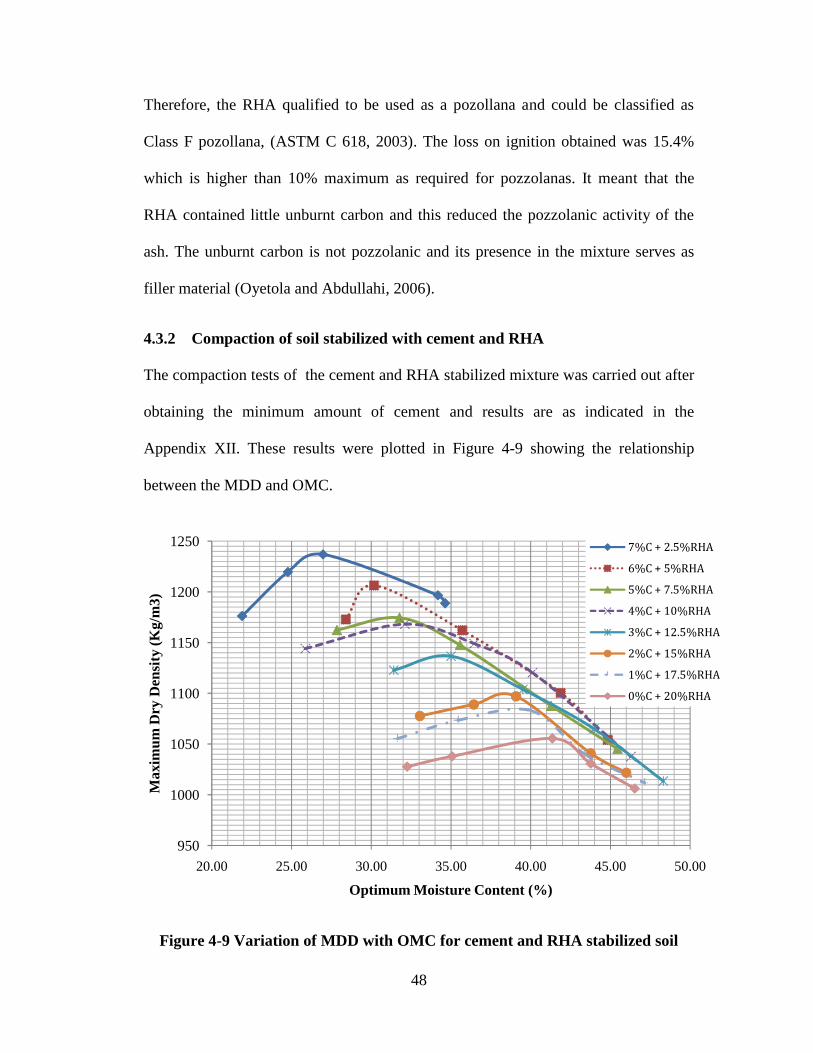
48
Therefore, the RHA qualified to be used as a pozollana and could be classified as
Class F pozollana, (ASTM C 618, 2003). The loss on ignition obtained was 15.4%
which is higher than 10% maximum as required for pozzolanas. It meant that the
RHA contained little unburnt carbon and this reduced the pozzolanic activity of the
ash. The unburnt carbon is not pozzolanic and its presence in the mixture serves as
filler material (Oyetola and Abdullahi, 2006).
4.3.2 Compaction of soil stabilized with cement and RHA
The compaction tests of the cement and RHA stabilized mixture was carried out after
obtaining the minimum amount of cement and results are as indicated in the
Appendix XII. These results were plotted in Figure 4-9 showing the relationship
between the MDD and OMC.
Figure 4-9 Variation of MDD with OMC for cement and RHA stabilized soil
950
1000
1050
1100
1150
1200
1250
20.00 25.00 30.00 35.00 40.00 45.00 50.00
Max
imum
Dry
Den
sity
(Kg/
m3)
Optimum Moisture Content (%)
7%C + 2.5%RHA6%C + 5%RHA5%C + 7.5%RHA4%C + 10%RHA3%C + 12.5%RHA2%C + 15%RHA1%C + 17.5%RHA0%C + 20%RHA
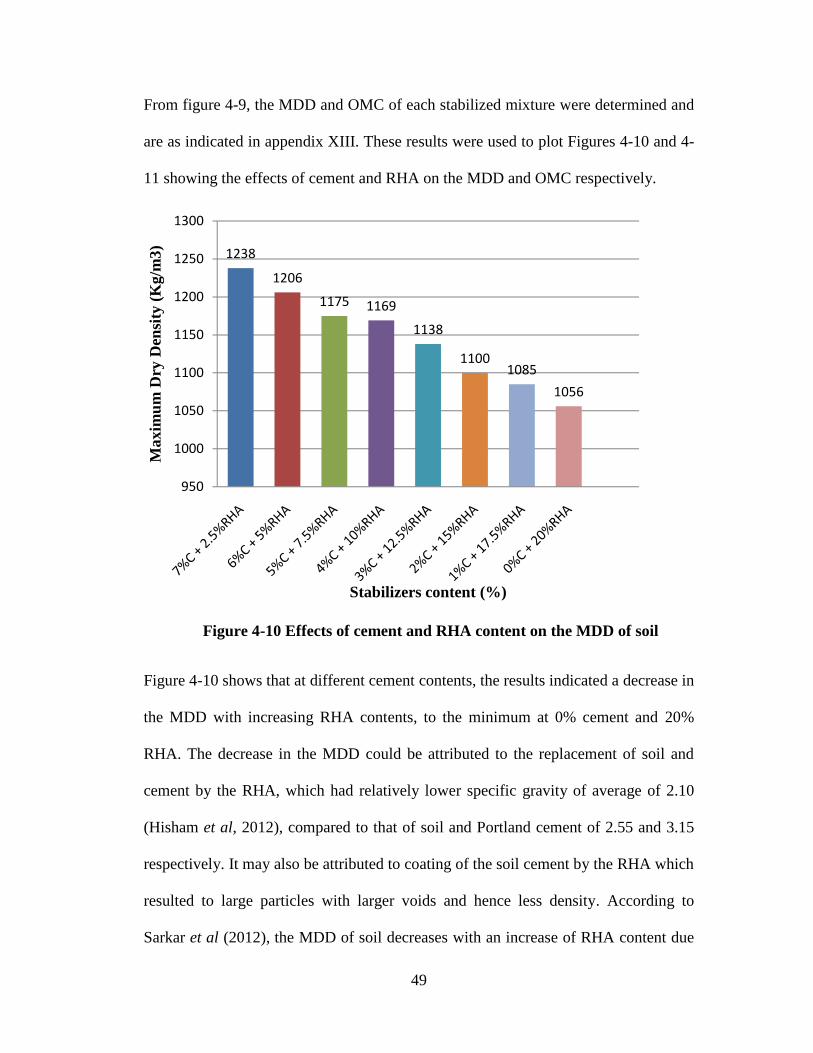
49
From figure 4-9, the MDD and OMC of each stabilized mixture were determined and
are as indicated in appendix XIII. These results were used to plot Figures 4-10 and 4-
11 showing the effects of cement and RHA on the MDD and OMC respectively.
Figure 4-10 Effects of cement and RHA content on the MDD of soil
Figure 4-10 shows that at different cement contents, the results indicated a decrease in
the MDD with increasing RHA contents, to the minimum at 0% cement and 20%
RHA. The decrease in the MDD could be attributed to the replacement of soil and
cement by the RHA, which had relatively lower specific gravity of average of 2.10
(Hisham et al, 2012), compared to that of soil and Portland cement of 2.55 and 3.15
respectively. It may also be attributed to coating of the soil cement by the RHA which
resulted to large particles with larger voids and hence less density. According to
Sarkar et al (2012), the MDD of soil decreases with an increase of RHA content due
1238
1206
1175 1169
1138
11001085
1056
950
1000
1050
1100
1150
1200
1250
1300
Max
imum
Dry
Den
sity
(K
g/m
3)
Stabilizers content (%)
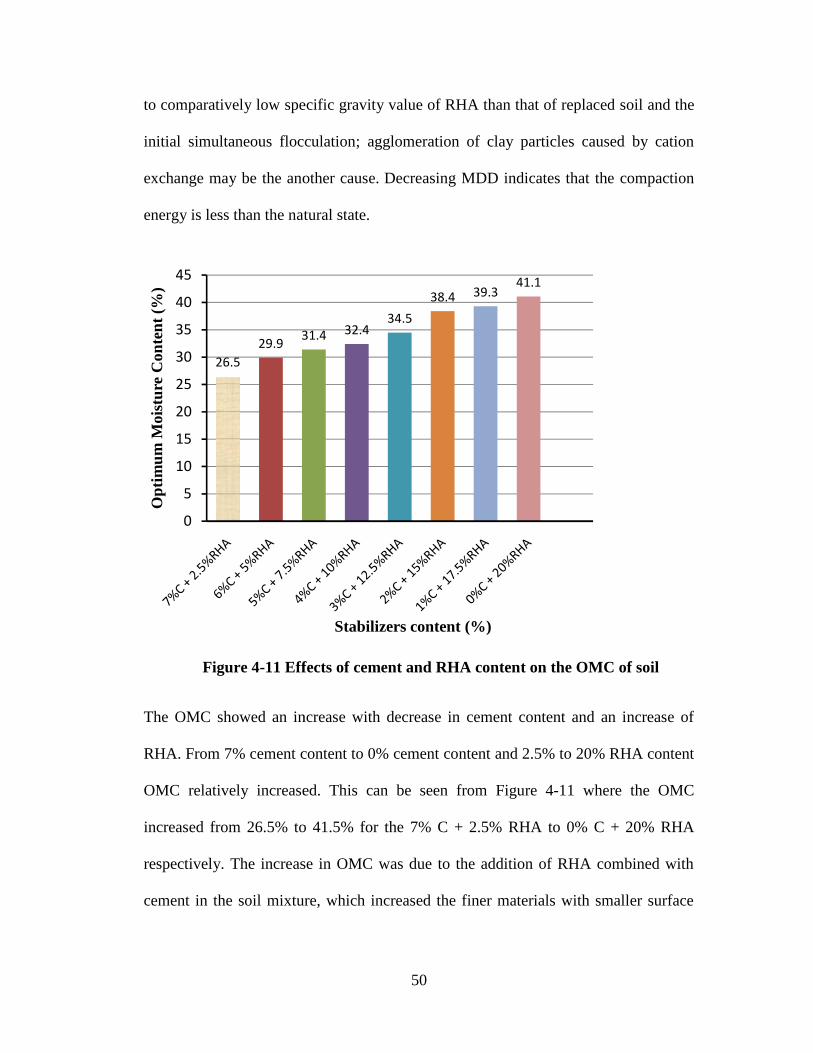
50
to comparatively low specific gravity value of RHA than that of replaced soil and the
initial simultaneous flocculation; agglomeration of clay particles caused by cation
exchange may be the another cause. Decreasing MDD indicates that the compaction
energy is less than the natural state.
Figure 4-11 Effects of cement and RHA content on the OMC of soil
The OMC showed an increase with decrease in cement content and an increase of
RHA. From 7% cement content to 0% cement content and 2.5% to 20% RHA content
OMC relatively increased. This can be seen from Figure 4-11 where the OMC
increased from 26.5% to 41.5% for the 7% C + 2.5% RHA to 0% C + 20% RHA
respectively. The increase in OMC was due to the addition of RHA combined with
cement in the soil mixture, which increased the finer materials with smaller surface
26.529.9 31.4
0
5
10
15
20
25
30
35
40
45
Opt
imum
Moi
stur
e C
onte
nt (
%)
50
to comparatively low specific gravity value of RHA than that of replaced soil and the
initial simultaneous flocculation; agglomeration of clay particles caused by cation
exchange may be the another cause. Decreasing MDD indicates that the compaction
energy is less than the natural state.
Figure 4-11 Effects of cement and RHA content on the OMC of soil
The OMC showed an increase with decrease in cement content and an increase of
RHA. From 7% cement content to 0% cement content and 2.5% to 20% RHA content
OMC relatively increased. This can be seen from Figure 4-11 where the OMC
increased from 26.5% to 41.5% for the 7% C + 2.5% RHA to 0% C + 20% RHA
respectively. The increase in OMC was due to the addition of RHA combined with
cement in the soil mixture, which increased the finer materials with smaller surface
31.4 32.434.5
38.4 39.341.1
Stabilizers content (%)
50
to comparatively low specific gravity value of RHA than that of replaced soil and the
initial simultaneous flocculation; agglomeration of clay particles caused by cation
exchange may be the another cause. Decreasing MDD indicates that the compaction
energy is less than the natural state.
Figure 4-11 Effects of cement and RHA content on the OMC of soil
The OMC showed an increase with decrease in cement content and an increase of
RHA. From 7% cement content to 0% cement content and 2.5% to 20% RHA content
OMC relatively increased. This can be seen from Figure 4-11 where the OMC
increased from 26.5% to 41.5% for the 7% C + 2.5% RHA to 0% C + 20% RHA
respectively. The increase in OMC was due to the addition of RHA combined with
cement in the soil mixture, which increased the finer materials with smaller surface
51
area which combined together with the clay particles forming lumps with larger
surface area which needed more water for the process to take place.
According to Alhassan & Mustapha, (2007) the nature of the process requires water
for it to take place and water for hydration of cement is required; this leads to increase
in water for compaction as RHA content increased. According to Sarkar et al (2012),
the optimum moisture content of soil increased with an increase RHA because RHA
are finer than the soil. The more fines the more surface area, so more water is
required to provide well lubrication. The RHA content also decrease the quantity of
free silt and clay fraction, forming coarser materials, which occupy larger spaces for
retaining water. The increase of water content was also attributed by the pozzalanic
reaction of RHA with the soil.
4.3.3 Compressive strength analysis for Cement and RHA stabilized blocks
The blocks were tested for the compressive strength at 7, 14 and 28 days. The raw
data of the interlocking blocks compressive strength are presented in a tabulated form
in Appendix XIV. The mean compressive strength results are summarized in Table 4-
6 and presented in graphical form in Figures 4-12 and 4-13.
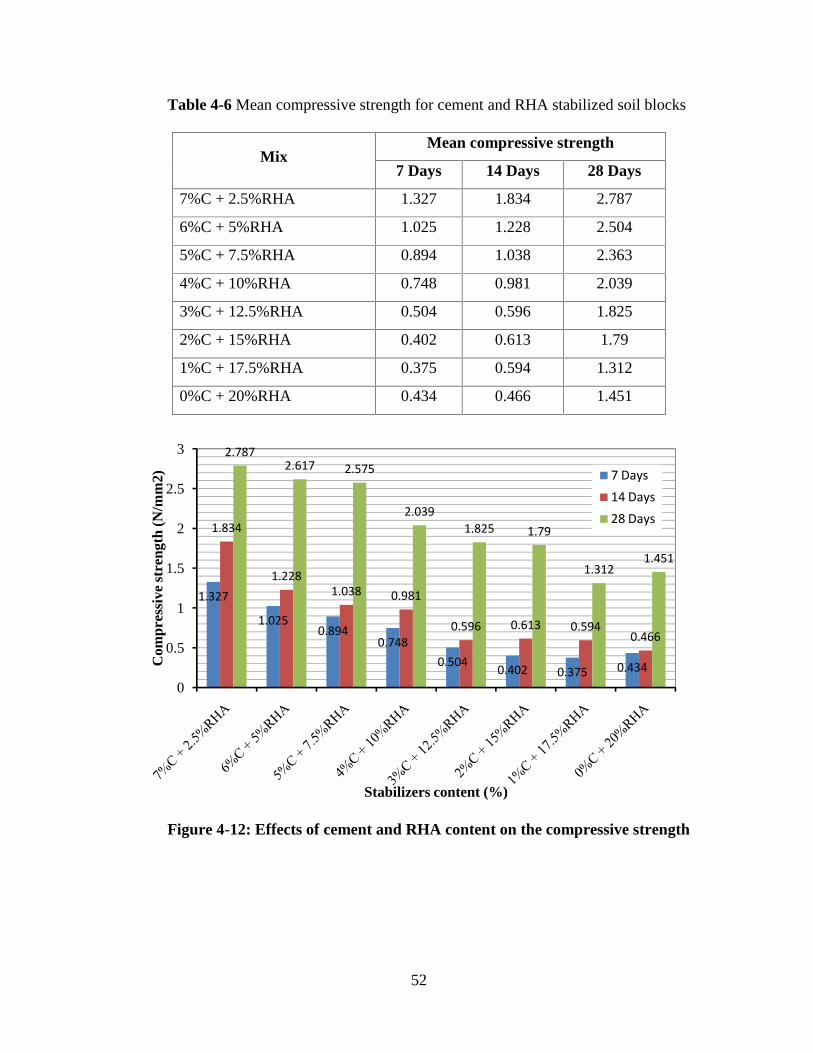
52
Table 4-6 Mean compressive strength for cement and RHA stabilized soil blocks
Figure 4-12: Effects of cement and RHA content on the compressive strength
1.327
1.0250.894
0.7480.504 0.402 0.375 0.434
1.834
1.2281.038 0.981
0.596 0.613 0.5940.466
2.7872.617 2.575
2.0391.825 1.79
1.3121.451
0
0.5
1
1.5
2
2.5
3
Com
pres
sive
str
engt
h (N
/mm
2)
Stabilizers content (%)
7 Days14 Days28 Days
MixMean compressive strength
7 Days 14 Days 28 Days
7%C + 2.5%RHA 1.327 1.834 2.787
6%C + 5%RHA 1.025 1.228 2.504
5%C + 7.5%RHA 0.894 1.038 2.363
4%C + 10%RHA 0.748 0.981 2.039
3%C + 12.5%RHA 0.504 0.596 1.825
2%C + 15%RHA 0.402 0.613 1.79
1%C + 17.5%RHA 0.375 0.594 1.312
0%C + 20%RHA 0.434 0.466 1.451
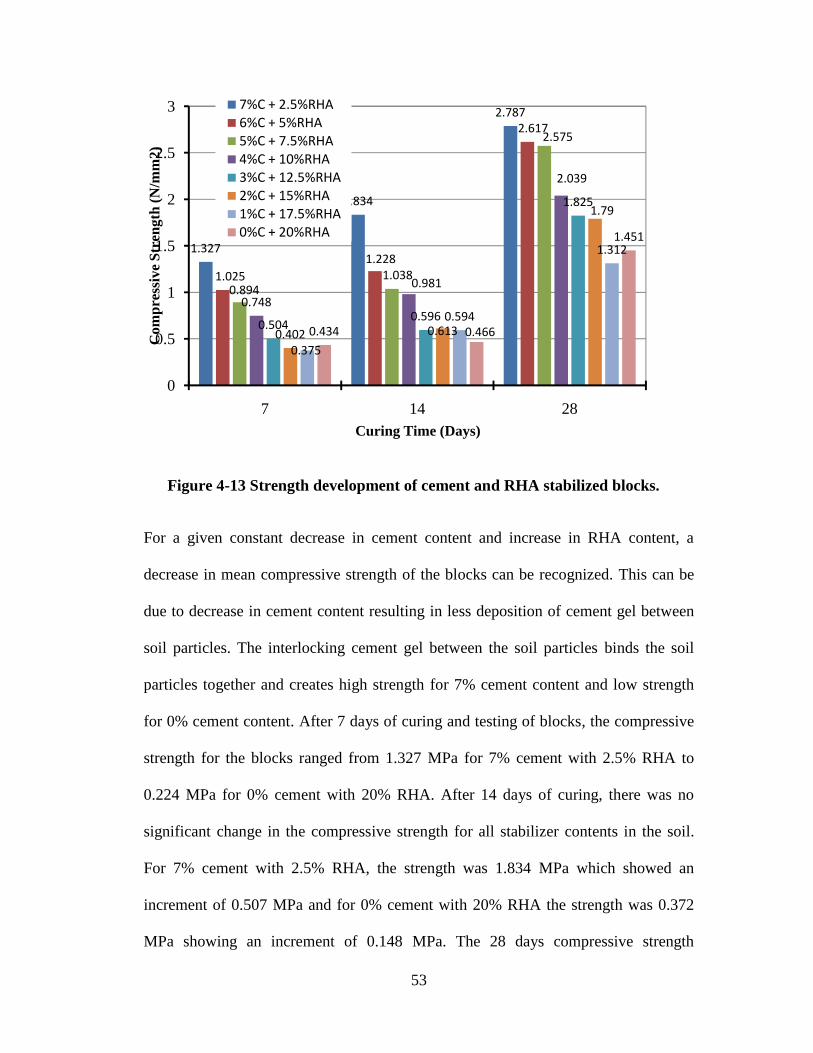
53
Figure 4-13 Strength development of cement and RHA stabilized blocks.
For a given constant decrease in cement content and increase in RHA content, a
decrease in mean compressive strength of the blocks can be recognized. This can be
due to decrease in cement content resulting in less deposition of cement gel between
soil particles. The interlocking cement gel between the soil particles binds the soil
particles together and creates high strength for 7% cement content and low strength
for 0% cement content. After 7 days of curing and testing of blocks, the compressive
strength for the blocks ranged from 1.327 MPa for 7% cement with 2.5% RHA to
0.224 MPa for 0% cement with 20% RHA. After 14 days of curing, there was no
significant change in the compressive strength for all stabilizer contents in the soil.
For 7% cement with 2.5% RHA, the strength was 1.834 MPa which showed an
increment of 0.507 MPa and for 0% cement with 20% RHA the strength was 0.372
MPa showing an increment of 0.148 MPa. The 28 days compressive strength
1.327
1.834
2.787
1.0251.228
2.617
0.8941.038
2.575
0.7480.981
2.039
0.5040.596
1.825
0.402 0.613
1.79
0.375
0.594
1.312
0.434 0.466
1.451
0
0.5
1
1.5
2
2.5
3
7 14 28
Com
pres
sive
Str
engt
h (N
/mm
2)
Curing Time (Days)
7%C + 2.5%RHA6%C + 5%RHA5%C + 7.5%RHA4%C + 10%RHA3%C + 12.5%RHA2%C + 15%RHA1%C + 17.5%RHA0%C + 20%RHA
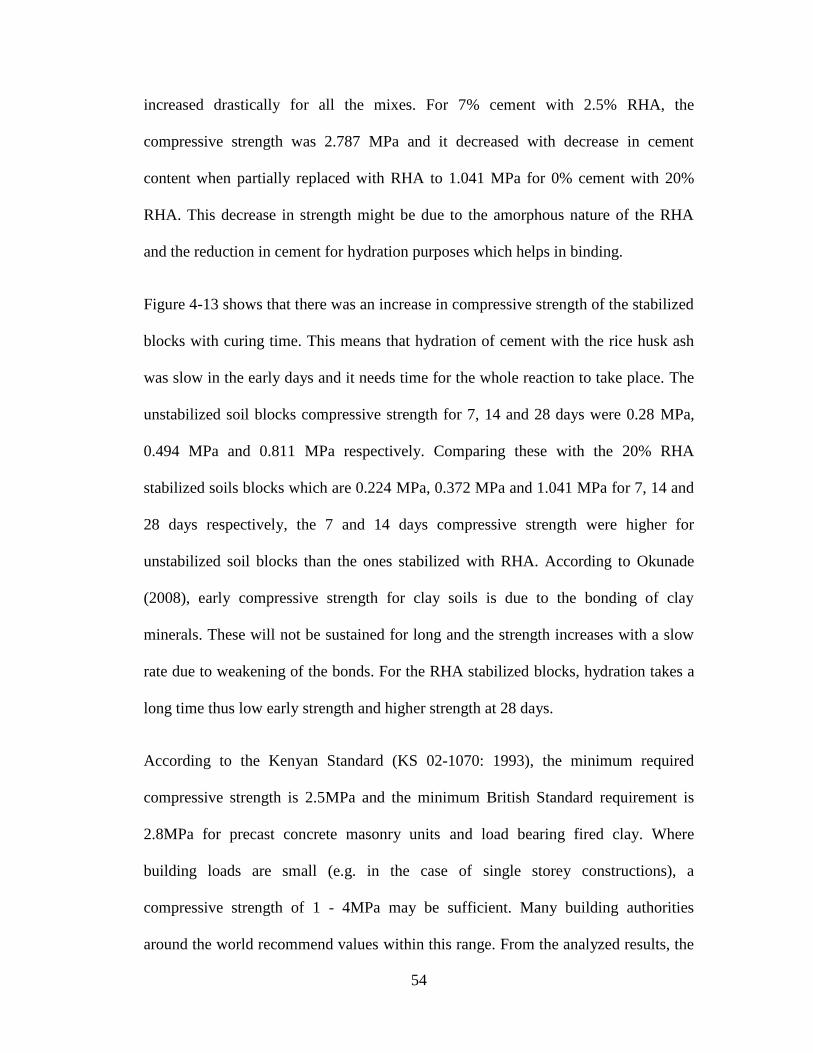
54
increased drastically for all the mixes. For 7% cement with 2.5% RHA, the
compressive strength was 2.787 MPa and it decreased with decrease in cement
content when partially replaced with RHA to 1.041 MPa for 0% cement with 20%
RHA. This decrease in strength might be due to the amorphous nature of the RHA
and the reduction in cement for hydration purposes which helps in binding.
Figure 4-13 shows that there was an increase in compressive strength of the stabilized
blocks with curing time. This means that hydration of cement with the rice husk ash
was slow in the early days and it needs time for the whole reaction to take place. The
unstabilized soil blocks compressive strength for 7, 14 and 28 days were 0.28 MPa,
0.494 MPa and 0.811 MPa respectively. Comparing these with the 20% RHA
stabilized soils blocks which are 0.224 MPa, 0.372 MPa and 1.041 MPa for 7, 14 and
28 days respectively, the 7 and 14 days compressive strength were higher for
unstabilized soil blocks than the ones stabilized with RHA. According to Okunade
(2008), early compressive strength for clay soils is due to the bonding of clay
minerals. These will not be sustained for long and the strength increases with a slow
rate due to weakening of the bonds. For the RHA stabilized blocks, hydration takes a
long time thus low early strength and higher strength at 28 days.
According to the Kenyan Standard (KS 02-1070: 1993), the minimum required
compressive strength is 2.5MPa and the minimum British Standard requirement is
2.8MPa for precast concrete masonry units and load bearing fired clay. Where
building loads are small (e.g. in the case of single storey constructions), a
compressive strength of 1 - 4MPa may be sufficient. Many building authorities
around the world recommend values within this range. From the analyzed results, the
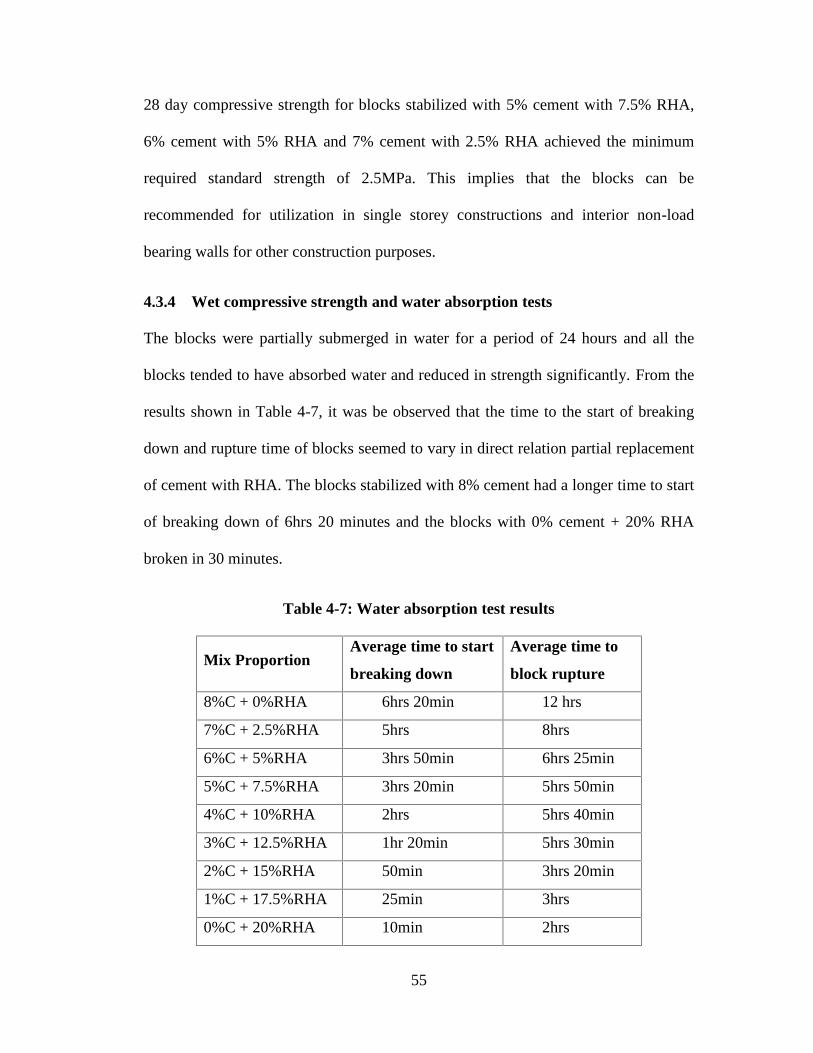
55
28 day compressive strength for blocks stabilized with 5% cement with 7.5% RHA,
6% cement with 5% RHA and 7% cement with 2.5% RHA achieved the minimum
required standard strength of 2.5MPa. This implies that the blocks can be
recommended for utilization in single storey constructions and interior non-load
bearing walls for other construction purposes.
4.3.4 Wet compressive strength and water absorption tests
The blocks were partially submerged in water for a period of 24 hours and all the
blocks tended to have absorbed water and reduced in strength significantly. From the
results shown in Table 4-7, it was be observed that the time to the start of breaking
down and rupture time of blocks seemed to vary in direct relation partial replacement
of cement with RHA. The blocks stabilized with 8% cement had a longer time to start
of breaking down of 6hrs 20 minutes and the blocks with 0% cement + 20% RHA
broken in 30 minutes.
Table 4-7: Water absorption test results
Mix ProportionAverage time to start
breaking down
Average time to
block rupture
8%C + 0%RHA 6hrs 20min 12 hrs
7%C + 2.5%RHA 5hrs 8hrs
6%C + 5%RHA 3hrs 50min 6hrs 25min
5%C + 7.5%RHA 3hrs 20min 5hrs 50min
4%C + 10%RHA 2hrs 5hrs 40min
3%C + 12.5%RHA 1hr 20min 5hrs 30min
2%C + 15%RHA 50min 3hrs 20min
1%C + 17.5%RHA 25min 3hrs
0%C + 20%RHA 10min 2hrs
56
The rupture time was great with an average of 12hrs for the blocks stabilized with 8%
cement and 2hrs for 20 % RHA. Water absorption of the blocks increased with the
increase in RHA and decrease in cement content in the mixture. This is due to the fact
that the breakdown time was high for blocks with 8% cement and decreased gradually
as the cement reduced and RHA increased in the blocks. The breakdown of the blocks
began on the surface, where the block was driest and hence most prone to absorb
water through the pores.
It was not possible to lift the compressed stabilized earth blocks out of the water
without them crumbling. Thus the blocks were considered to be weak in wet
compressive strength and water absorption thus could not be utilized in moist
environment. The failure of the blocks in wet compressive and water absorption tests
meant that a water proofing material must be used for the blocks to be utilized in
external walls or areas exposed to wet environment.
4.3.5 Linear shrinkage of the interlocking blocks
The objective of this test was to determine what effect the various stabilizers have on
the drying shrinkage of the block over a period of twenty-eight days.The blocks were
measured using a vernier calliper after being sun dried and to get the dimensional
changes of the blocks from wet to dry condition. The results are as shown in table 4-8
and analysed in figure 4-14. The blocks stabilized with 7% cement and 2.5% RHA
did not shrink at all as it maintained its original length. The blocks with 6% cement
and 5% RHA, and those with 5% cement and 7.5% RHA had the same shrinkage of
0.87% showing that the introduction of RHA had an effect on the shrinkage of the
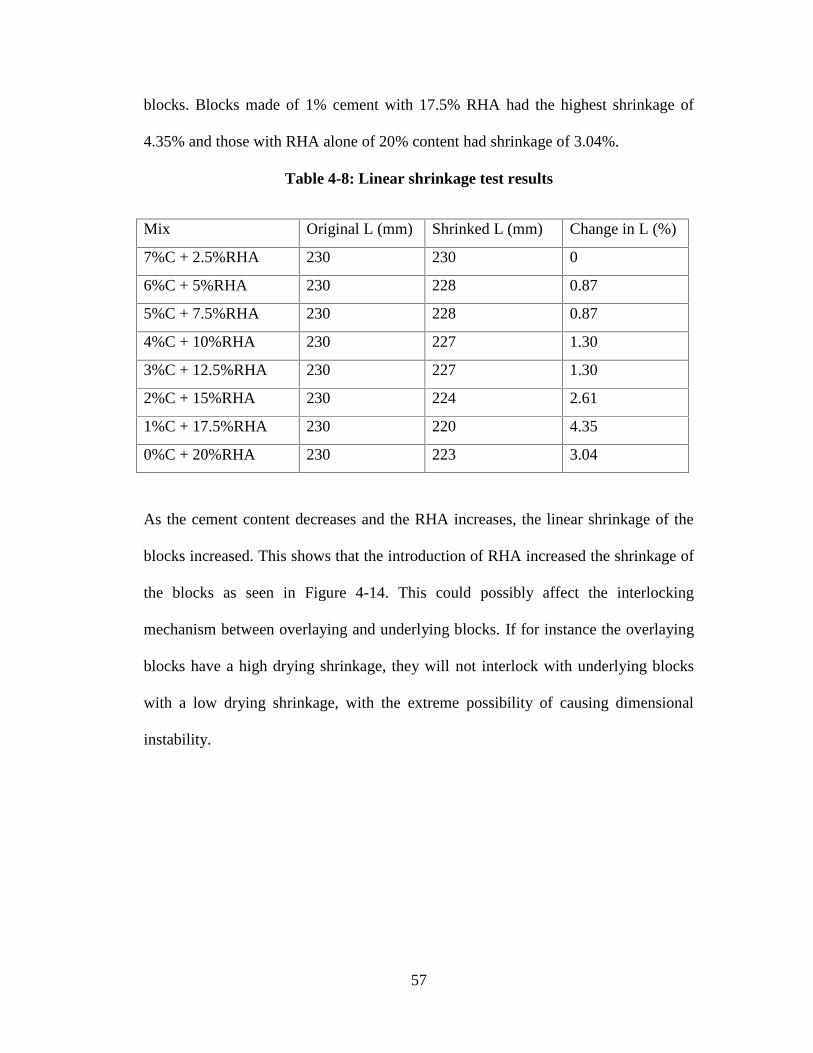
57
blocks. Blocks made of 1% cement with 17.5% RHA had the highest shrinkage of
4.35% and those with RHA alone of 20% content had shrinkage of 3.04%.
Table 4-8: Linear shrinkage test results
Mix Original L (mm) Shrinked L (mm) Change in L (%)
7%C + 2.5%RHA 230 230 0
6%C + 5%RHA 230 228 0.87
5%C + 7.5%RHA 230 228 0.87
4%C + 10%RHA 230 227 1.30
3%C + 12.5%RHA 230 227 1.30
2%C + 15%RHA 230 224 2.61
1%C + 17.5%RHA 230 220 4.35
0%C + 20%RHA 230 223 3.04
As the cement content decreases and the RHA increases, the linear shrinkage of the
blocks increased. This shows that the introduction of RHA increased the shrinkage of
the blocks as seen in Figure 4-14. This could possibly affect the interlocking
mechanism between overlaying and underlying blocks. If for instance the overlaying
blocks have a high drying shrinkage, they will not interlock with underlying blocks
with a low drying shrinkage, with the extreme possibility of causing dimensional
instability.
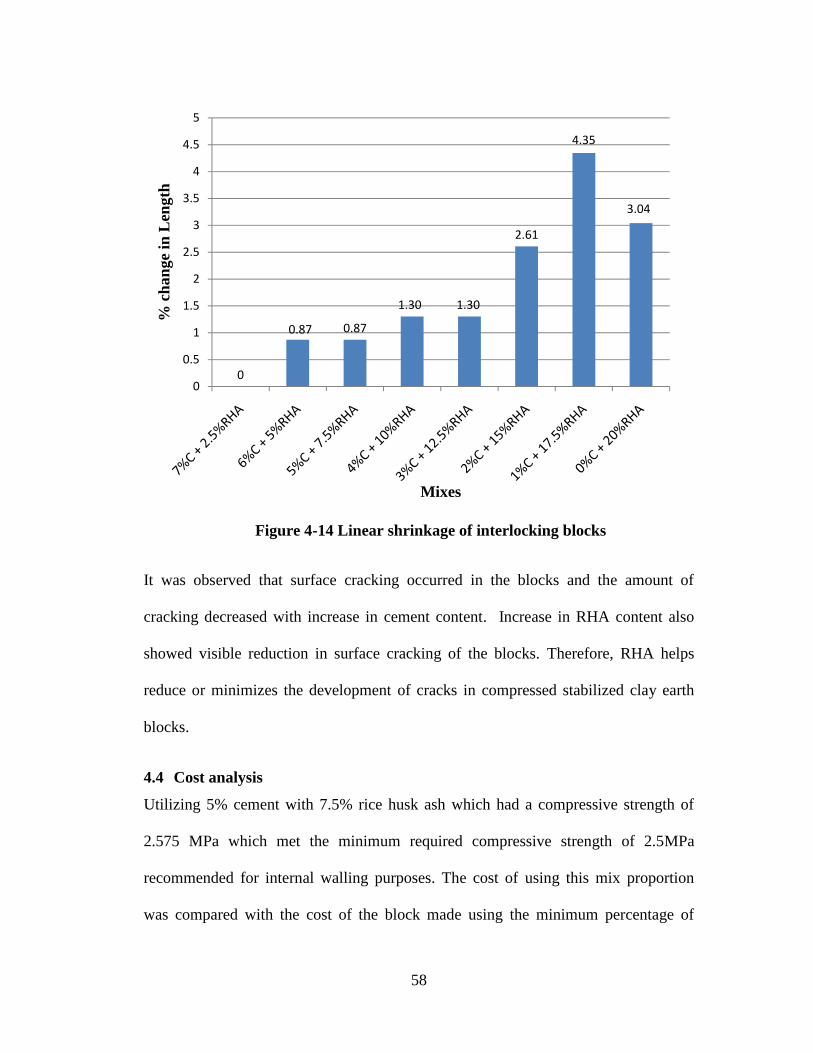
58
Figure 4-14 Linear shrinkage of interlocking blocks
It was observed that surface cracking occurred in the blocks and the amount of
cracking decreased with increase in cement content. Increase in RHA content also
showed visible reduction in surface cracking of the blocks. Therefore, RHA helps
reduce or minimizes the development of cracks in compressed stabilized clay earth
blocks.
4.4 Cost analysis
Utilizing 5% cement with 7.5% rice husk ash which had a compressive strength of
2.575 MPa which met the minimum required compressive strength of 2.5MPa
recommended for internal walling purposes. The cost of using this mix proportion
was compared with the cost of the block made using the minimum percentage of
0
0.87 0.87
1.30 1.30
2.61
4.35
3.04
0
0.5
1
1.5
2
2.5
3
3.5
4
4.5
5
% c
hang
e in
Len
gth
Mixes
59
cement required which is 8%, for production of interlocking stabilized blocks.
Assume the average cost of 50kg bag of cement is Kenya Shillings (KES) 700 and
one unskilled labour producing 150 blocks in a day is paid Kenya Shillings (KES)
450 for that day’s job. Labour cost will be constant for both cases.
Table 4-9: Costs incurred in production of stabilized clay earth blocks
Description 8% cement 5% cement + 7.5% RHA
Cost of 50kg of cement 700 700
Cost of acquiring 50kg of RHA _ 200
Transport of 50kg of RHA from Mwea _ 300
Transport of 50kg of cement from Thika 200 200
Transport of 1 tonne of soil from Juja 400 400
Daily labour cost for producing blocks 450 450
Total expenditure (Kenya shillings) 1750 2250
Table 4-10: Cost analysis of produced stabilized clay earth blocks
Description 8% cement 5% cement + 7.5% RHA
No. of blocks produced with 50kg of cement 63 110
Cost of one block produced (KES) 28 20.50
Wall size build by the no. of blocks produced 1.85 3.23
For each block produced with cement and rice husk ash, 3% of cement is saved.
100kg of soil with 5% cement and 7.5% rice husk ash produced 11 blocks. Therefore
a bag of cement with rice husk ash produced approximately 110 blocks. Utilizing
cement alone in block production meant 100kg of soil with 8% cement produce 10
blocks and thus a bag produced approximately 63 blocks. The cost of cement used in
producing one cement stabilized block was approximately KES 28 while for cement
and RHA stabilized block was approximately KES 20.50.
60
Square meter wall required approximately 34 interlocking blocks. The 8% cement
scenario could build approximately 1.85m2 of a wall while the 5% cement with 7.5%
rice husk ash case could build approximately 3.23m2 of a wall. The cement stabilized
earth blocks walling cost more compared to the walling made of blocks stabilized
with cement and rice husk ash. This showed that the cost of an interlocking wall made
of blocks stabilized with cement and rice husk ash could lead to the production of low
cost housing by utilizing the two waste products (rice husks and clay).
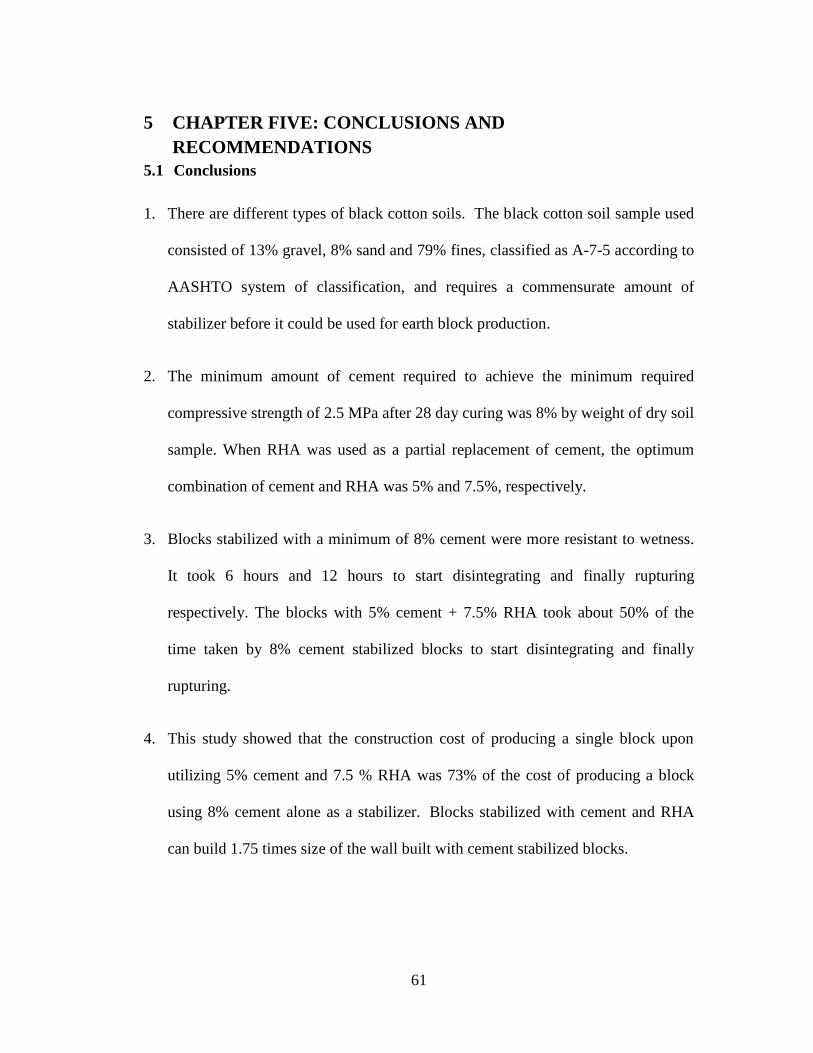
61
5 CHAPTER FIVE: CONCLUSIONS ANDRECOMMENDATIONS
5.1 Conclusions
1. There are different types of black cotton soils. The black cotton soil sample used
consisted of 13% gravel, 8% sand and 79% fines, classified as A-7-5 according to
AASHTO system of classification, and requires a commensurate amount of
stabilizer before it could be used for earth block production.
2. The minimum amount of cement required to achieve the minimum required
compressive strength of 2.5 MPa after 28 day curing was 8% by weight of dry soil
sample. When RHA was used as a partial replacement of cement, the optimum
combination of cement and RHA was 5% and 7.5%, respectively.
3. Blocks stabilized with a minimum of 8% cement were more resistant to wetness.
It took 6 hours and 12 hours to start disintegrating and finally rupturing
respectively. The blocks with 5% cement + 7.5% RHA took about 50% of the
time taken by 8% cement stabilized blocks to start disintegrating and finally
rupturing.
4. This study showed that the construction cost of producing a single block upon
utilizing 5% cement and 7.5 % RHA was 73% of the cost of producing a block
using 8% cement alone as a stabilizer. Blocks stabilized with cement and RHA
can build 1.75 times size of the wall built with cement stabilized blocks.
62
5. For the soil studied, 5% cement with 7.5% RHA could be utilized in production of
compressed earth blocks which could be used in single storey constructions and
interior non-load bearing walls for other construction purposes.
5.2 Recommendation
1. To avert the housing shortage in the country, the compressed stabilized earth
blocks produced with the optimal mix of 5% cement and 7.5 % RHA should
be used for partitioning and other unexposed works.
2. If the blocks are to be utilized in exposed environments, the walls should be
plastered or painted with oil/water resistant paints.
3. Further research should be undertaken to establish the possibility of utilizing
other additives such as bitumen, gypsum and lime with rice husk ash to
stabilize black cotton soil to check on the possibility of improving the water
absorption characteristics of the compressed earth blocks.
63
REFERENCES
1. Alhassan, M., & Mustapha, A. M. (2007). Effect of Rice Husk Ash on Cement
Stabilized Laterite. Leonardo Electronic Journal of Practices and Technologies.
(11), 47–58.
2. ASTM C 618 (2003).Standard Specification for Coal Fly Ash and Raw or
Calcined Natural Pozzolana for Use as a Mineral Admixture in Concrete. Annual
Book of ASTM Standards, 4(2), pp 149-155.
3. Behmanesh, J., & Mehrmousavi, Z. (2014). Effect of Hydraulic Binders on the
Geotechnical Properties of Stabilized Clayey Soil. Journal of Basic and Applied
Scientific Research. 4(3), 261–269.
4. Bowles, J.E. (1997). Foundation analysis and design. Fifth Edition. The McGraw-
Hill Companies, Inc.
5. Brooks, R. M., (2009). Soil Stabilization with Fly ash and Rice husk ash cement.
International Journal of Research and Reviews in Applied Sciences, 1(3) 209-217.
6. BSI. (1990-1). Methods of testing soil for civil engineering purposes. (B.S.1377).
British Standards Institute, London, England.
7. BSI. (1990-2). Methods of testing for stabilized soils (B.S.1924). British
Standards Institute, London, England.
8. Deepak, B. (2010). Interlocking Dry Stack Masonry, 8th International Masonry
Conference 2010 in Dresden, International Masonry Society
9. Eberemu, A. O. (2011). Consolidation Properties of Compacted Lateritic Soil
Treated with Rice Husk Ash. Geomaterials, 01(03), 70–78.
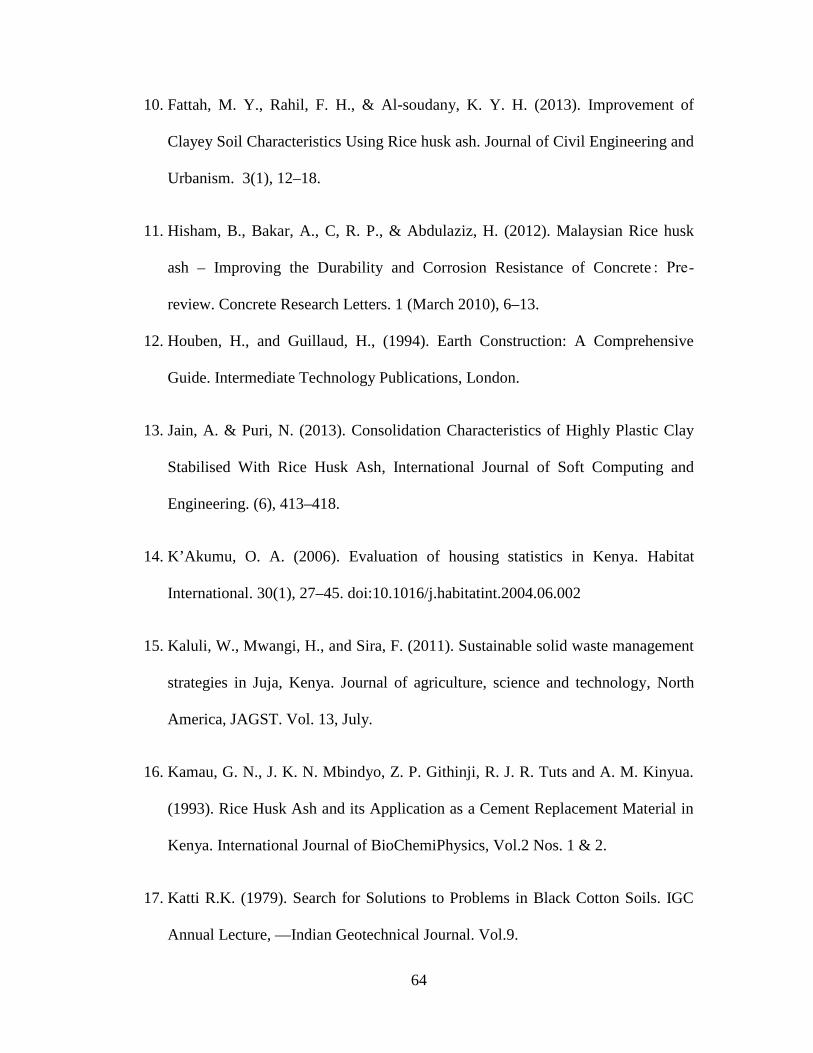
64
10. Fattah, M. Y., Rahil, F. H., & Al-soudany, K. Y. H. (2013). Improvement of
Clayey Soil Characteristics Using Rice husk ash. Journal of Civil Engineering and
Urbanism. 3(1), 12–18.
11. Hisham, B., Bakar, A., C, R. P., & Abdulaziz, H. (2012). Malaysian Rice husk
ash – Improving the Durability and Corrosion Resistance of Concrete : Pre-
review. Concrete Research Letters. 1 (March 2010), 6–13.
12. Houben, H., and Guillaud, H., (1994). Earth Construction: A Comprehensive
Guide. Intermediate Technology Publications, London.
13. Jain, A. & Puri, N. (2013). Consolidation Characteristics of Highly Plastic Clay
Stabilised With Rice Husk Ash, International Journal of Soft Computing and
Engineering. (6), 413–418.
14. K’Akumu, O. A. (2006). Evaluation of housing statistics in Kenya. Habitat
International. 30(1), 27–45. doi:10.1016/j.habitatint.2004.06.002
15. Kaluli, W., Mwangi, H., and Sira, F. (2011). Sustainable solid waste management
strategies in Juja, Kenya. Journal of agriculture, science and technology, North
America, JAGST. Vol. 13, July.
16. Kamau, G. N., J. K. N. Mbindyo, Z. P. Githinji, R. J. R. Tuts and A. M. Kinyua.
(1993). Rice Husk Ash and its Application as a Cement Replacement Material in
Kenya. International Journal of BioChemiPhysics, Vol.2 Nos. 1 & 2.
17. Katti R.K. (1979). Search for Solutions to Problems in Black Cotton Soils. IGC
Annual Lecture, ―Indian Geotechnical Journal. Vol.9.
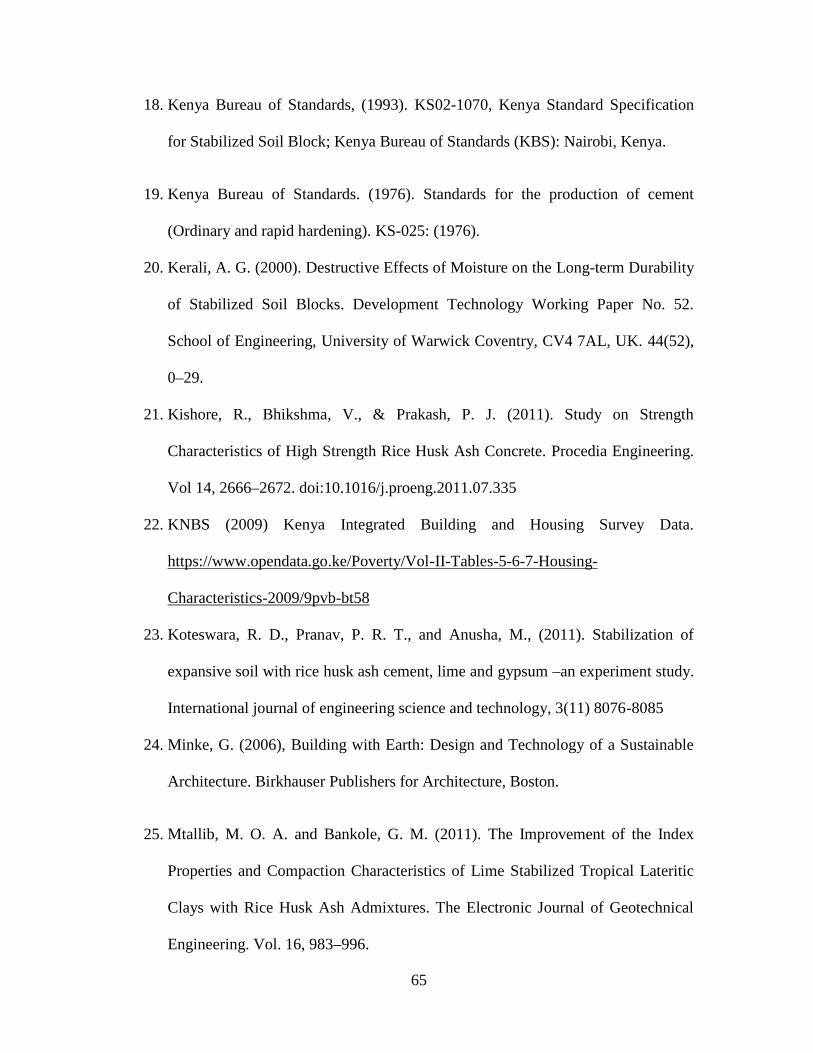
65
18. Kenya Bureau of Standards, (1993). KS02-1070, Kenya Standard Specification
for Stabilized Soil Block; Kenya Bureau of Standards (KBS): Nairobi, Kenya.
19. Kenya Bureau of Standards. (1976). Standards for the production of cement
(Ordinary and rapid hardening). KS-025: (1976).
20. Kerali, A. G. (2000). Destructive Effects of Moisture on the Long-term Durability
of Stabilized Soil Blocks. Development Technology Working Paper No. 52.
School of Engineering, University of Warwick Coventry, CV4 7AL, UK. 44(52),
0–29.
21. Kishore, R., Bhikshma, V., & Prakash, P. J. (2011). Study on Strength
Characteristics of High Strength Rice Husk Ash Concrete. Procedia Engineering.
Vol 14, 2666–2672. doi:10.1016/j.proeng.2011.07.335
22. KNBS (2009) Kenya Integrated Building and Housing Survey Data.
https://www.opendata.go.ke/Poverty/Vol-II-Tables-5-6-7-Housing-
Characteristics-2009/9pvb-bt58
23. Koteswara, R. D., Pranav, P. R. T., and Anusha, M., (2011). Stabilization of
expansive soil with rice husk ash cement, lime and gypsum –an experiment study.
International journal of engineering science and technology, 3(11) 8076-8085
24. Minke, G. (2006), Building with Earth: Design and Technology of a Sustainable
Architecture. Birkhauser Publishers for Architecture, Boston.
25. Mtallib, M. O. A. and Bankole, G. M. (2011). The Improvement of the Index
Properties and Compaction Characteristics of Lime Stabilized Tropical Lateritic
Clays with Rice Husk Ash Admixtures. The Electronic Journal of Geotechnical
Engineering. Vol. 16, 983–996.
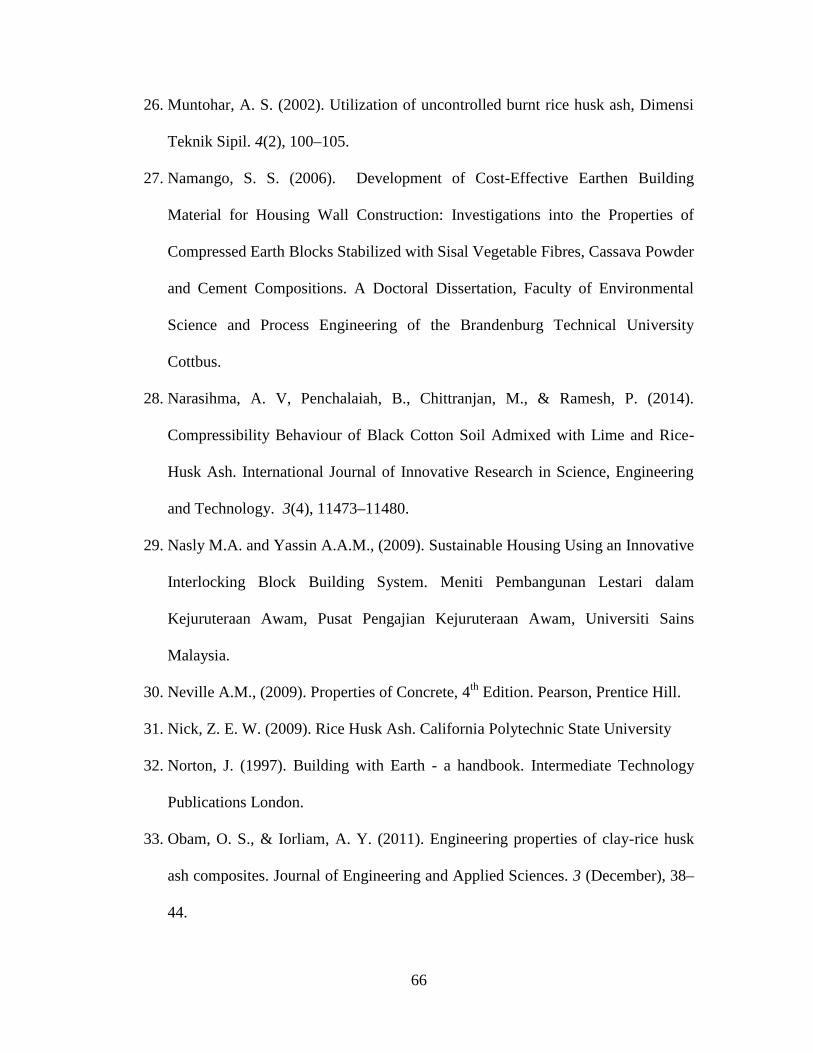
66
26. Muntohar, A. S. (2002). Utilization of uncontrolled burnt rice husk ash, Dimensi
Teknik Sipil. 4(2), 100–105.
27. Namango, S. S. (2006). Development of Cost-Effective Earthen Building
Material for Housing Wall Construction: Investigations into the Properties of
Compressed Earth Blocks Stabilized with Sisal Vegetable Fibres, Cassava Powder
and Cement Compositions. A Doctoral Dissertation, Faculty of Environmental
Science and Process Engineering of the Brandenburg Technical University
Cottbus.
28. Narasihma, A. V, Penchalaiah, B., Chittranjan, M., & Ramesh, P. (2014).
Compressibility Behaviour of Black Cotton Soil Admixed with Lime and Rice-
Husk Ash. International Journal of Innovative Research in Science, Engineering
and Technology. 3(4), 11473–11480.
29. Nasly M.A. and Yassin A.A.M., (2009). Sustainable Housing Using an Innovative
Interlocking Block Building System. Meniti Pembangunan Lestari dalam
Kejuruteraan Awam, Pusat Pengajian Kejuruteraan Awam, Universiti Sains
Malaysia.
30. Neville A.M., (2009). Properties of Concrete, 4th Edition. Pearson, Prentice Hill.
31. Nick, Z. E. W. (2009). Rice Husk Ash. California Polytechnic State University
32. Norton, J. (1997). Building with Earth - a handbook. Intermediate Technology
Publications London.
33. Obam, O. S., & Iorliam, A. Y. (2011). Engineering properties of clay-rice husk
ash composites. Journal of Engineering and Applied Sciences. 3 (December), 38–
44.
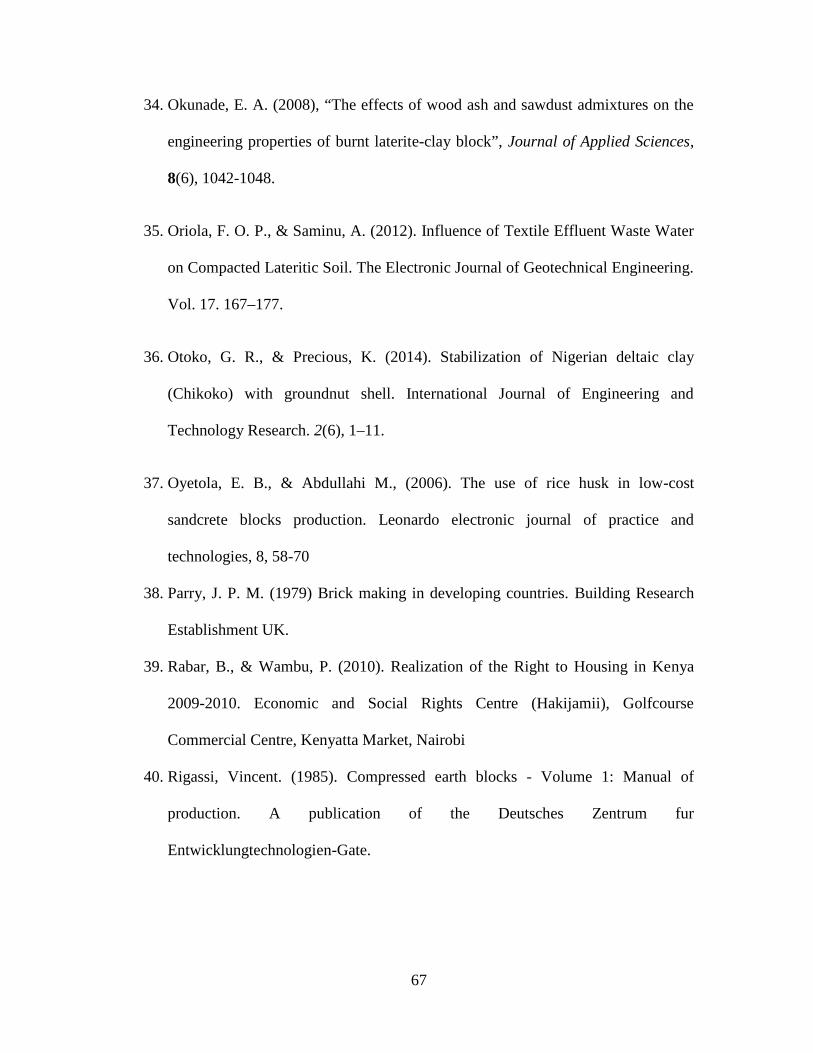
67
34. Okunade, E. A. (2008), “The effects of wood ash and sawdust admixtures on the
engineering properties of burnt laterite-clay block”, Journal of Applied Sciences,
8(6), 1042-1048.
35. Oriola, F. O. P., & Saminu, A. (2012). Influence of Textile Effluent Waste Water
on Compacted Lateritic Soil. The Electronic Journal of Geotechnical Engineering.
Vol. 17. 167–177.
36. Otoko, G. R., & Precious, K. (2014). Stabilization of Nigerian deltaic clay
(Chikoko) with groundnut shell. International Journal of Engineering and
Technology Research. 2(6), 1–11.
37. Oyetola, E. B., & Abdullahi M., (2006). The use of rice husk in low-cost
sandcrete blocks production. Leonardo electronic journal of practice and
technologies, 8, 58-70
38. Parry, J. P. M. (1979) Brick making in developing countries. Building Research
Establishment UK.
39. Rabar, B., & Wambu, P. (2010). Realization of the Right to Housing in Kenya
2009-2010. Economic and Social Rights Centre (Hakijamii), Golfcourse
Commercial Centre, Kenyatta Market, Nairobi
40. Rigassi, Vincent. (1985). Compressed earth blocks - Volume 1: Manual of
production. A publication of the Deutsches Zentrum fur
Entwicklungtechnologien-Gate.
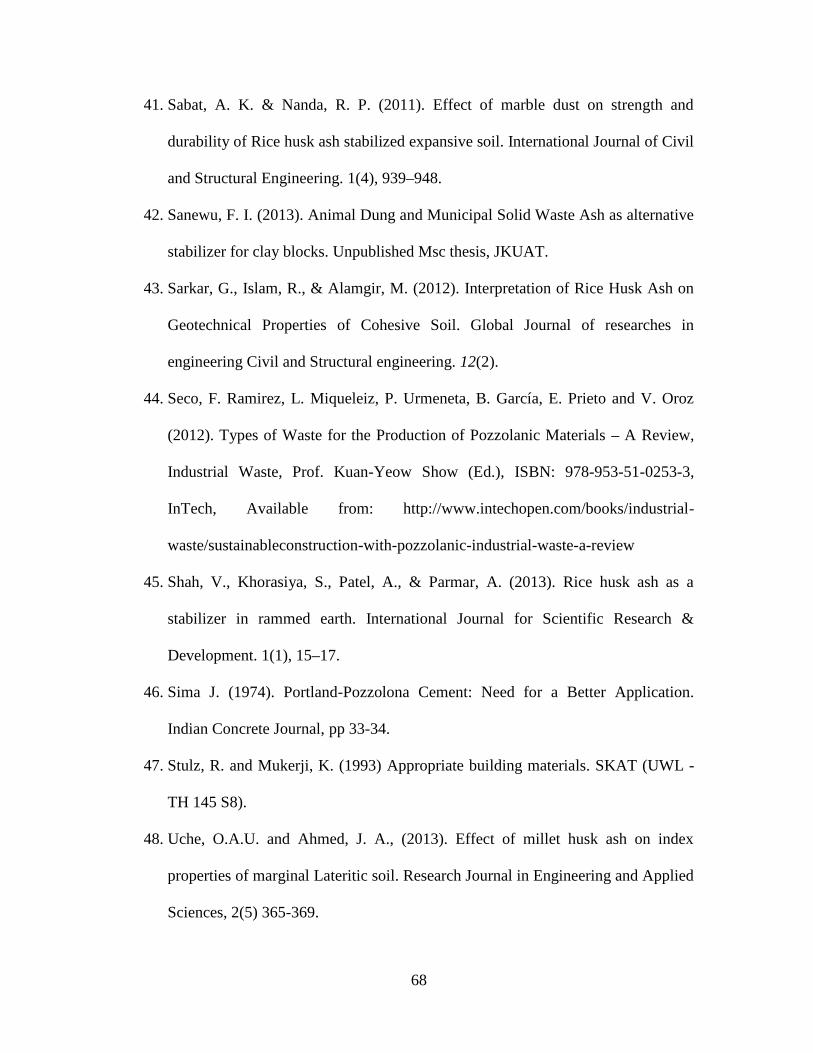
68
41. Sabat, A. K. & Nanda, R. P. (2011). Effect of marble dust on strength and
durability of Rice husk ash stabilized expansive soil. International Journal of Civil
and Structural Engineering. 1(4), 939–948.
42. Sanewu, F. I. (2013). Animal Dung and Municipal Solid Waste Ash as alternative
stabilizer for clay blocks. Unpublished Msc thesis, JKUAT.
43. Sarkar, G., Islam, R., & Alamgir, M. (2012). Interpretation of Rice Husk Ash on
Geotechnical Properties of Cohesive Soil. Global Journal of researches in
engineering Civil and Structural engineering. 12(2).
44. Seco, F. Ramirez, L. Miqueleiz, P. Urmeneta, B. García, E. Prieto and V. Oroz
(2012). Types of Waste for the Production of Pozzolanic Materials – A Review,
Industrial Waste, Prof. Kuan-Yeow Show (Ed.), ISBN: 978-953-51-0253-3,
InTech, Available from: http://www.intechopen.com/books/industrial-
waste/sustainableconstruction-with-pozzolanic-industrial-waste-a-review
45. Shah, V., Khorasiya, S., Patel, A., & Parmar, A. (2013). Rice husk ash as a
stabilizer in rammed earth. International Journal for Scientific Research &
Development. 1(1), 15–17.
46. Sima J. (1974). Portland-Pozzolona Cement: Need for a Better Application.
Indian Concrete Journal, pp 33-34.
47. Stulz, R. and Mukerji, K. (1993) Appropriate building materials. SKAT (UWL -
TH 145 S8).
48. Uche, O.A.U. and Ahmed, J. A., (2013). Effect of millet husk ash on index
properties of marginal Lateritic soil. Research Journal in Engineering and Applied
Sciences, 2(5) 365-369.

69
49. UN. (1948). United Nations Universal Declaration of Human Rights 1948.
50. Walker, P.J. (1995), Strength, Durability and Shrinkage Characteristics of Cement
Stabilised Bricks, Cement and Concrete Composites, Vol 17, pp 301 – 310.
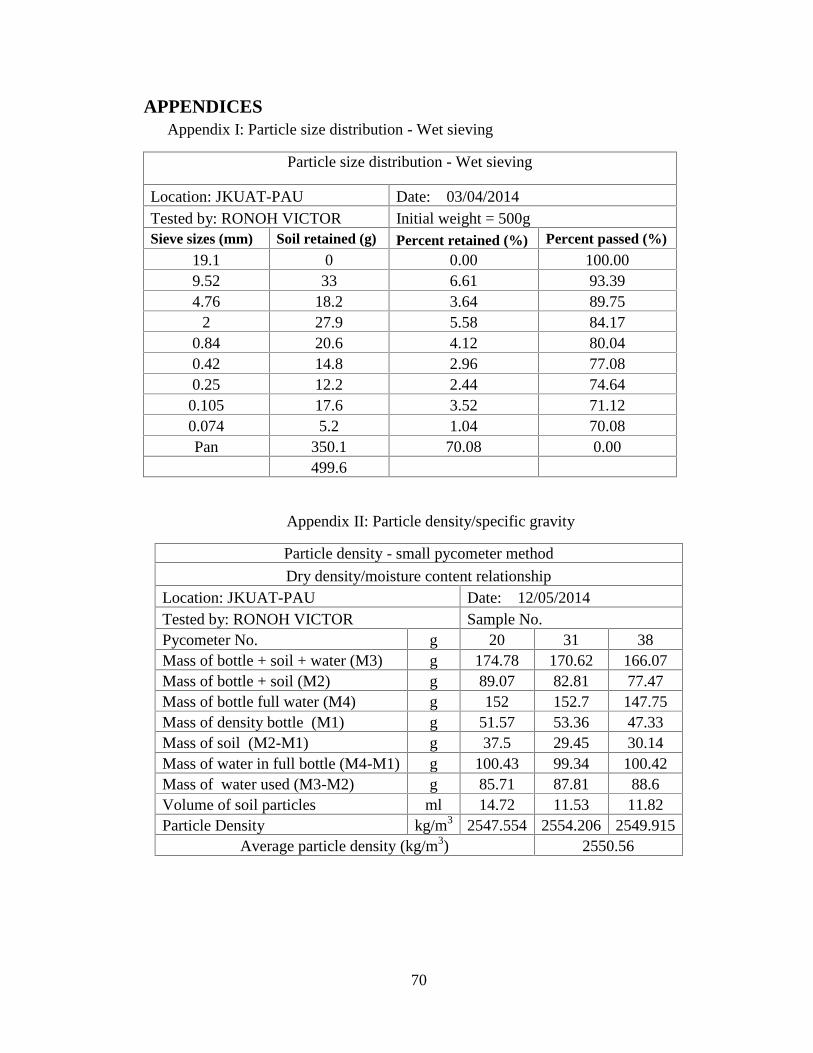
70
APPENDICESAppendix I: Particle size distribution - Wet sieving
Particle size distribution - Wet sieving
Location: JKUAT-PAU Date: 03/04/2014Tested by: RONOH VICTOR Initial weight = 500gSieve sizes (mm) Soil retained (g) Percent retained (%) Percent passed (%)
19.1 0 0.00 100.009.52 33 6.61 93.394.76 18.2 3.64 89.75
2 27.9 5.58 84.170.84 20.6 4.12 80.040.42 14.8 2.96 77.080.25 12.2 2.44 74.64
0.105 17.6 3.52 71.120.074 5.2 1.04 70.08Pan 350.1 70.08 0.00
499.6
Appendix II: Particle density/specific gravity
Particle density - small pycometer method
Dry density/moisture content relationshipLocation: JKUAT-PAU Date: 12/05/2014Tested by: RONOH VICTOR Sample No.Pycometer No. g 20 31 38Mass of bottle + soil + water (M3) g 174.78 170.62 166.07Mass of bottle + soil (M2) g 89.07 82.81 77.47Mass of bottle full water (M4) g 152 152.7 147.75Mass of density bottle (M1) g 51.57 53.36 47.33Mass of soil (M2-M1) g 37.5 29.45 30.14Mass of water in full bottle (M4-M1) g 100.43 99.34 100.42Mass of water used (M3-M2) g 85.71 87.81 88.6Volume of soil particles ml 14.72 11.53 11.82Particle Density kg/m3 2547.554 2554.206 2549.915
Average particle density (kg/m3) 2550.56
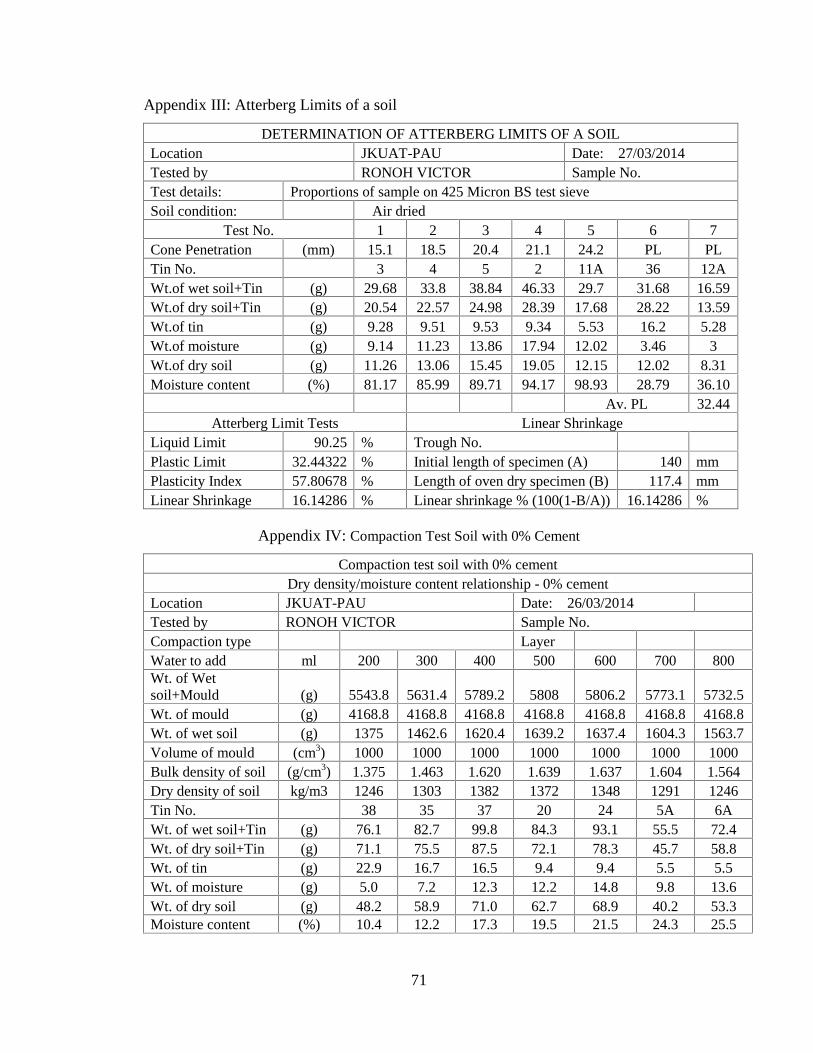
71
Appendix III: Atterberg Limits of a soil
DETERMINATION OF ATTERBERG LIMITS OF A SOILLocation JKUAT-PAU Date: 27/03/2014Tested by RONOH VICTOR Sample No.Test details: Proportions of sample on 425 Micron BS test sieveSoil condition: Air dried
Test No. 1 2 3 4 5 6 7Cone Penetration (mm) 15.1 18.5 20.4 21.1 24.2 PL PLTin No. 3 4 5 2 11A 36 12AWt.of wet soil+Tin (g) 29.68 33.8 38.84 46.33 29.7 31.68 16.59Wt.of dry soil+Tin (g) 20.54 22.57 24.98 28.39 17.68 28.22 13.59Wt.of tin (g) 9.28 9.51 9.53 9.34 5.53 16.2 5.28Wt.of moisture (g) 9.14 11.23 13.86 17.94 12.02 3.46 3Wt.of dry soil (g) 11.26 13.06 15.45 19.05 12.15 12.02 8.31Moisture content (%) 81.17 85.99 89.71 94.17 98.93 28.79 36.10
Av. PL 32.44Atterberg Limit Tests Linear Shrinkage
Liquid Limit 90.25 % Trough No.Plastic Limit 32.44322 % Initial length of specimen (A) 140 mmPlasticity Index 57.80678 % Length of oven dry specimen (B) 117.4 mmLinear Shrinkage 16.14286 % Linear shrinkage % (100(1-B/A)) 16.14286 %
Appendix IV: Compaction Test Soil with 0% Cement
Compaction test soil with 0% cementDry density/moisture content relationship - 0% cement
Location JKUAT-PAU Date: 26/03/2014Tested by RONOH VICTOR Sample No.Compaction type LayerWater to add ml 200 300 400 500 600 700 800Wt. of Wetsoil+Mould (g) 5543.8 5631.4 5789.2 5808 5806.2 5773.1 5732.5Wt. of mould (g) 4168.8 4168.8 4168.8 4168.8 4168.8 4168.8 4168.8Wt. of wet soil (g) 1375 1462.6 1620.4 1639.2 1637.4 1604.3 1563.7Volume of mould (cm3) 1000 1000 1000 1000 1000 1000 1000Bulk density of soil (g/cm3) 1.375 1.463 1.620 1.639 1.637 1.604 1.564Dry density of soil kg/m3 1246 1303 1382 1372 1348 1291 1246Tin No. 38 35 37 20 24 5A 6AWt. of wet soil+Tin (g) 76.1 82.7 99.8 84.3 93.1 55.5 72.4Wt. of dry soil+Tin (g) 71.1 75.5 87.5 72.1 78.3 45.7 58.8Wt. of tin (g) 22.9 16.7 16.5 9.4 9.4 5.5 5.5Wt. of moisture (g) 5.0 7.2 12.3 12.2 14.8 9.8 13.6Wt. of dry soil (g) 48.2 58.9 71.0 62.7 68.9 40.2 53.3Moisture content (%) 10.4 12.2 17.3 19.5 21.5 24.3 25.5
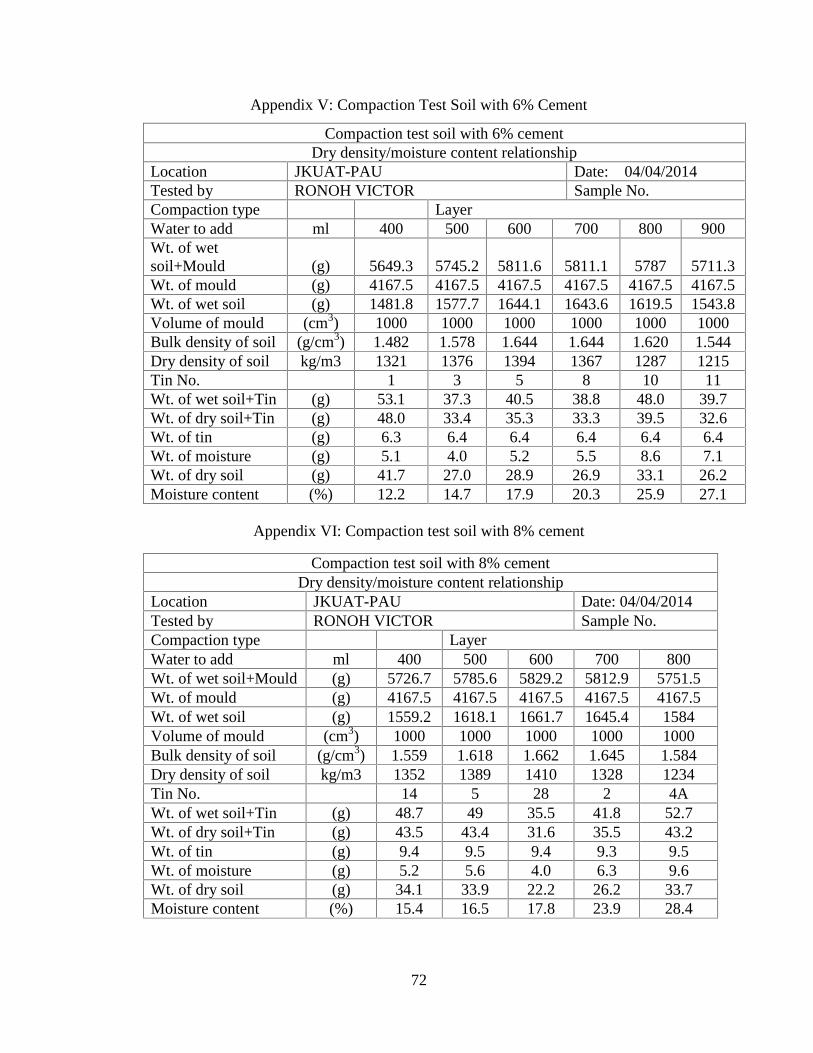
72
Appendix V: Compaction Test Soil with 6% Cement
Compaction test soil with 6% cementDry density/moisture content relationship
Location JKUAT-PAU Date: 04/04/2014Tested by RONOH VICTOR Sample No.Compaction type LayerWater to add ml 400 500 600 700 800 900Wt. of wetsoil+Mould (g) 5649.3 5745.2 5811.6 5811.1 5787 5711.3Wt. of mould (g) 4167.5 4167.5 4167.5 4167.5 4167.5 4167.5Wt. of wet soil (g) 1481.8 1577.7 1644.1 1643.6 1619.5 1543.8Volume of mould (cm3) 1000 1000 1000 1000 1000 1000Bulk density of soil (g/cm3) 1.482 1.578 1.644 1.644 1.620 1.544Dry density of soil kg/m3 1321 1376 1394 1367 1287 1215Tin No. 1 3 5 8 10 11Wt. of wet soil+Tin (g) 53.1 37.3 40.5 38.8 48.0 39.7Wt. of dry soil+Tin (g) 48.0 33.4 35.3 33.3 39.5 32.6Wt. of tin (g) 6.3 6.4 6.4 6.4 6.4 6.4Wt. of moisture (g) 5.1 4.0 5.2 5.5 8.6 7.1Wt. of dry soil (g) 41.7 27.0 28.9 26.9 33.1 26.2Moisture content (%) 12.2 14.7 17.9 20.3 25.9 27.1
Appendix VI: Compaction test soil with 8% cement
Compaction test soil with 8% cementDry density/moisture content relationship
Location JKUAT-PAU Date: 04/04/2014Tested by RONOH VICTOR Sample No.Compaction type LayerWater to add ml 400 500 600 700 800Wt. of wet soil+Mould (g) 5726.7 5785.6 5829.2 5812.9 5751.5Wt. of mould (g) 4167.5 4167.5 4167.5 4167.5 4167.5Wt. of wet soil (g) 1559.2 1618.1 1661.7 1645.4 1584Volume of mould (cm3) 1000 1000 1000 1000 1000Bulk density of soil (g/cm3) 1.559 1.618 1.662 1.645 1.584Dry density of soil kg/m3 1352 1389 1410 1328 1234Tin No. 14 5 28 2 4AWt. of wet soil+Tin (g) 48.7 49 35.5 41.8 52.7Wt. of dry soil+Tin (g) 43.5 43.4 31.6 35.5 43.2Wt. of tin (g) 9.4 9.5 9.4 9.3 9.5Wt. of moisture (g) 5.2 5.6 4.0 6.3 9.6Wt. of dry soil (g) 34.1 33.9 22.2 26.2 33.7Moisture content (%) 15.4 16.5 17.8 23.9 28.4
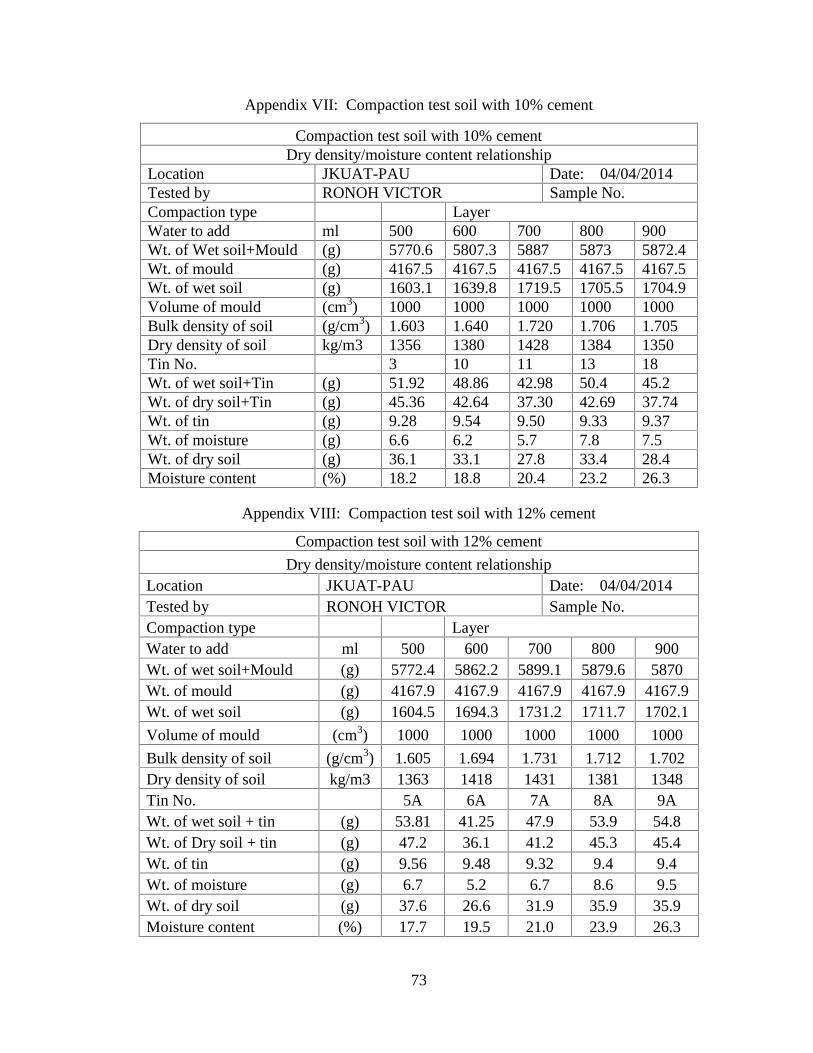
73
Appendix VII: Compaction test soil with 10% cement
Compaction test soil with 10% cementDry density/moisture content relationship
Location JKUAT-PAU Date: 04/04/2014Tested by RONOH VICTOR Sample No.Compaction type LayerWater to add ml 500 600 700 800 900Wt. of Wet soil+Mould (g) 5770.6 5807.3 5887 5873 5872.4Wt. of mould (g) 4167.5 4167.5 4167.5 4167.5 4167.5Wt. of wet soil (g) 1603.1 1639.8 1719.5 1705.5 1704.9Volume of mould (cm3) 1000 1000 1000 1000 1000Bulk density of soil (g/cm3) 1.603 1.640 1.720 1.706 1.705Dry density of soil kg/m3 1356 1380 1428 1384 1350Tin No. 3 10 11 13 18Wt. of wet soil+Tin (g) 51.92 48.86 42.98 50.4 45.2Wt. of dry soil+Tin (g) 45.36 42.64 37.30 42.69 37.74Wt. of tin (g) 9.28 9.54 9.50 9.33 9.37Wt. of moisture (g) 6.6 6.2 5.7 7.8 7.5Wt. of dry soil (g) 36.1 33.1 27.8 33.4 28.4Moisture content (%) 18.2 18.8 20.4 23.2 26.3
Appendix VIII: Compaction test soil with 12% cement
Compaction test soil with 12% cement
Dry density/moisture content relationshipLocation JKUAT-PAU Date: 04/04/2014Tested by RONOH VICTOR Sample No.Compaction type LayerWater to add ml 500 600 700 800 900Wt. of wet soil+Mould (g) 5772.4 5862.2 5899.1 5879.6 5870Wt. of mould (g) 4167.9 4167.9 4167.9 4167.9 4167.9Wt. of wet soil (g) 1604.5 1694.3 1731.2 1711.7 1702.1
Volume of mould (cm3) 1000 1000 1000 1000 1000
Bulk density of soil (g/cm3) 1.605 1.694 1.731 1.712 1.702Dry density of soil kg/m3 1363 1418 1431 1381 1348Tin No. 5A 6A 7A 8A 9AWt. of wet soil + tin (g) 53.81 41.25 47.9 53.9 54.8Wt. of Dry soil + tin (g) 47.2 36.1 41.2 45.3 45.4Wt. of tin (g) 9.56 9.48 9.32 9.4 9.4Wt. of moisture (g) 6.7 5.2 6.7 8.6 9.5Wt. of dry soil (g) 37.6 26.6 31.9 35.9 35.9Moisture content (%) 17.7 19.5 21.0 23.9 26.3
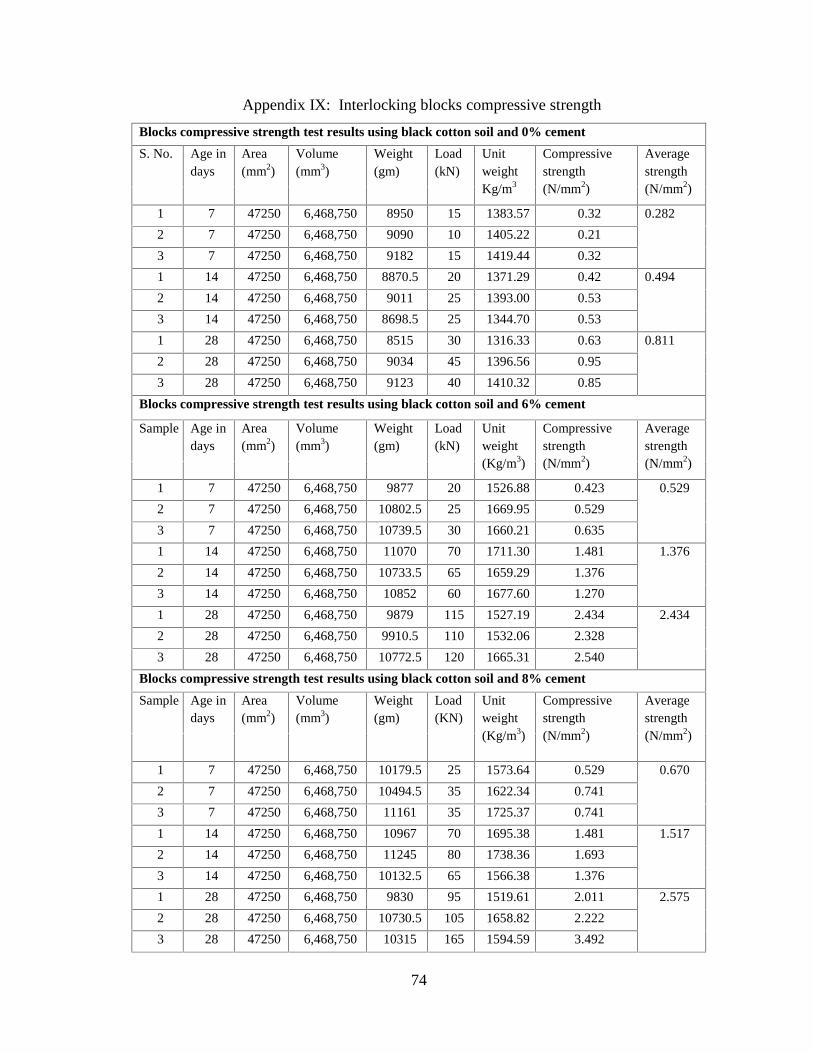
74
Appendix IX: Interlocking blocks compressive strength
Blocks compressive strength test results using black cotton soil and 0% cement
S. No. Age indays
Area(mm2)
Volume(mm3)
Weight(gm)
Load(kN)
UnitweightKg/m3
Compressivestrength(N/mm2)
Averagestrength(N/mm2)
1 7 47250 6,468,750 8950 15 1383.57 0.32 0.282
2 7 47250 6,468,750 9090 10 1405.22 0.21
3 7 47250 6,468,750 9182 15 1419.44 0.32
1 14 47250 6,468,750 8870.5 20 1371.29 0.42 0.494
2 14 47250 6,468,750 9011 25 1393.00 0.53
3 14 47250 6,468,750 8698.5 25 1344.70 0.53
1 28 47250 6,468,750 8515 30 1316.33 0.63 0.811
2 28 47250 6,468,750 9034 45 1396.56 0.95
3 28 47250 6,468,750 9123 40 1410.32 0.85
Blocks compressive strength test results using black cotton soil and 6% cement
Sample Age indays
Area(mm2)
Volume(mm3)
Weight(gm)
Load(kN)
Unitweight(Kg/m3)
Compressivestrength(N/mm2)
Averagestrength(N/mm2)
1 7 47250 6,468,750 9877 20 1526.88 0.423 0.529
2 7 47250 6,468,750 10802.5 25 1669.95 0.529
3 7 47250 6,468,750 10739.5 30 1660.21 0.635
1 14 47250 6,468,750 11070 70 1711.30 1.481 1.376
2 14 47250 6,468,750 10733.5 65 1659.29 1.376
3 14 47250 6,468,750 10852 60 1677.60 1.270
1 28 47250 6,468,750 9879 115 1527.19 2.434 2.434
2 28 47250 6,468,750 9910.5 110 1532.06 2.328
3 28 47250 6,468,750 10772.5 120 1665.31 2.540
Blocks compressive strength test results using black cotton soil and 8% cement
Sample Age indays
Area(mm2)
Volume(mm3)
Weight(gm)
Load(KN)
Unitweight(Kg/m3)
Compressivestrength(N/mm2)
Averagestrength(N/mm2)
1 7 47250 6,468,750 10179.5 25 1573.64 0.529 0.670
2 7 47250 6,468,750 10494.5 35 1622.34 0.741
3 7 47250 6,468,750 11161 35 1725.37 0.741
1 14 47250 6,468,750 10967 70 1695.38 1.481 1.517
2 14 47250 6,468,750 11245 80 1738.36 1.693
3 14 47250 6,468,750 10132.5 65 1566.38 1.376
1 28 47250 6,468,750 9830 95 1519.61 2.011 2.575
2 28 47250 6,468,750 10730.5 105 1658.82 2.222
3 28 47250 6,468,750 10315 165 1594.59 3.492
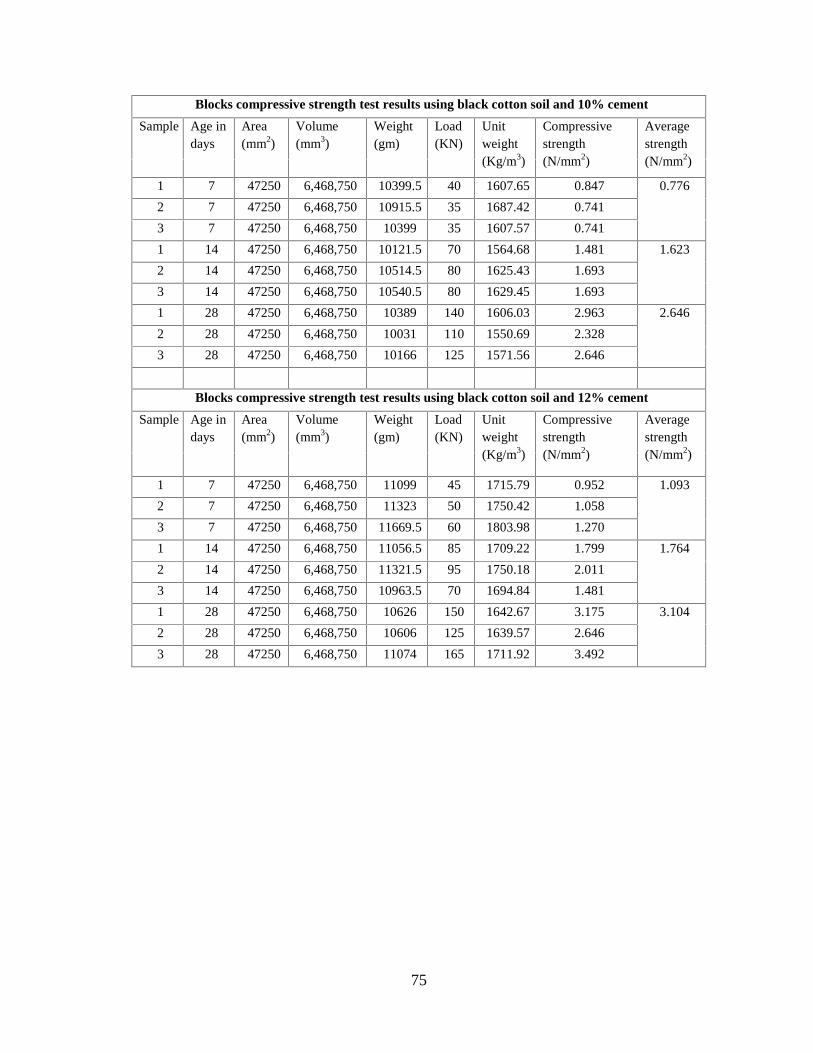
75
Blocks compressive strength test results using black cotton soil and 10% cement
Sample Age indays
Area(mm2)
Volume(mm3)
Weight(gm)
Load(KN)
Unitweight(Kg/m3)
Compressivestrength(N/mm2)
Averagestrength(N/mm2)
1 7 47250 6,468,750 10399.5 40 1607.65 0.847 0.776
2 7 47250 6,468,750 10915.5 35 1687.42 0.741
3 7 47250 6,468,750 10399 35 1607.57 0.741
1 14 47250 6,468,750 10121.5 70 1564.68 1.481 1.623
2 14 47250 6,468,750 10514.5 80 1625.43 1.693
3 14 47250 6,468,750 10540.5 80 1629.45 1.693
1 28 47250 6,468,750 10389 140 1606.03 2.963 2.646
2 28 47250 6,468,750 10031 110 1550.69 2.328
3 28 47250 6,468,750 10166 125 1571.56 2.646
Blocks compressive strength test results using black cotton soil and 12% cement
Sample Age indays
Area(mm2)
Volume(mm3)
Weight(gm)
Load(KN)
Unitweight(Kg/m3)
Compressivestrength(N/mm2)
Averagestrength(N/mm2)
1 7 47250 6,468,750 11099 45 1715.79 0.952 1.093
2 7 47250 6,468,750 11323 50 1750.42 1.058
3 7 47250 6,468,750 11669.5 60 1803.98 1.270
1 14 47250 6,468,750 11056.5 85 1709.22 1.799 1.764
2 14 47250 6,468,750 11321.5 95 1750.18 2.011
3 14 47250 6,468,750 10963.5 70 1694.84 1.481
1 28 47250 6,468,750 10626 150 1642.67 3.175 3.104
2 28 47250 6,468,750 10606 125 1639.57 2.646
3 28 47250 6,468,750 11074 165 1711.92 3.492
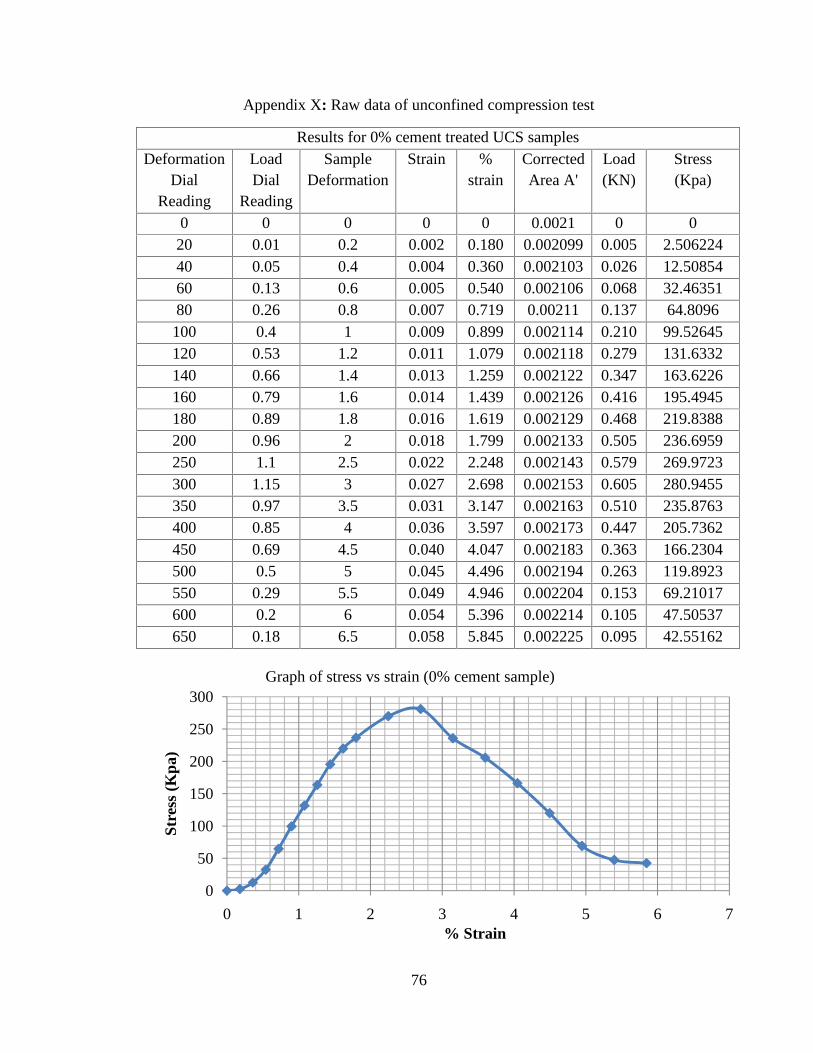
76
Appendix X: Raw data of unconfined compression test
Results for 0% cement treated UCS samplesDeformation
DialReading
LoadDial
Reading
SampleDeformation
Strain %strain
CorrectedArea A'
Load(KN)
Stress(Kpa)
0 0 0 0 0 0.0021 0 020 0.01 0.2 0.002 0.180 0.002099 0.005 2.50622440 0.05 0.4 0.004 0.360 0.002103 0.026 12.5085460 0.13 0.6 0.005 0.540 0.002106 0.068 32.4635180 0.26 0.8 0.007 0.719 0.00211 0.137 64.8096
100 0.4 1 0.009 0.899 0.002114 0.210 99.52645120 0.53 1.2 0.011 1.079 0.002118 0.279 131.6332140 0.66 1.4 0.013 1.259 0.002122 0.347 163.6226160 0.79 1.6 0.014 1.439 0.002126 0.416 195.4945180 0.89 1.8 0.016 1.619 0.002129 0.468 219.8388200 0.96 2 0.018 1.799 0.002133 0.505 236.6959250 1.1 2.5 0.022 2.248 0.002143 0.579 269.9723300 1.15 3 0.027 2.698 0.002153 0.605 280.9455350 0.97 3.5 0.031 3.147 0.002163 0.510 235.8763400 0.85 4 0.036 3.597 0.002173 0.447 205.7362450 0.69 4.5 0.040 4.047 0.002183 0.363 166.2304500 0.5 5 0.045 4.496 0.002194 0.263 119.8923550 0.29 5.5 0.049 4.946 0.002204 0.153 69.21017600 0.2 6 0.054 5.396 0.002214 0.105 47.50537650 0.18 6.5 0.058 5.845 0.002225 0.095 42.55162
0
50
100
150
200
250
300
0 1 2 3 4 5 6 7
Stre
ss (
Kpa
)
% Strain
Graph of stress vs strain (0% cement sample)
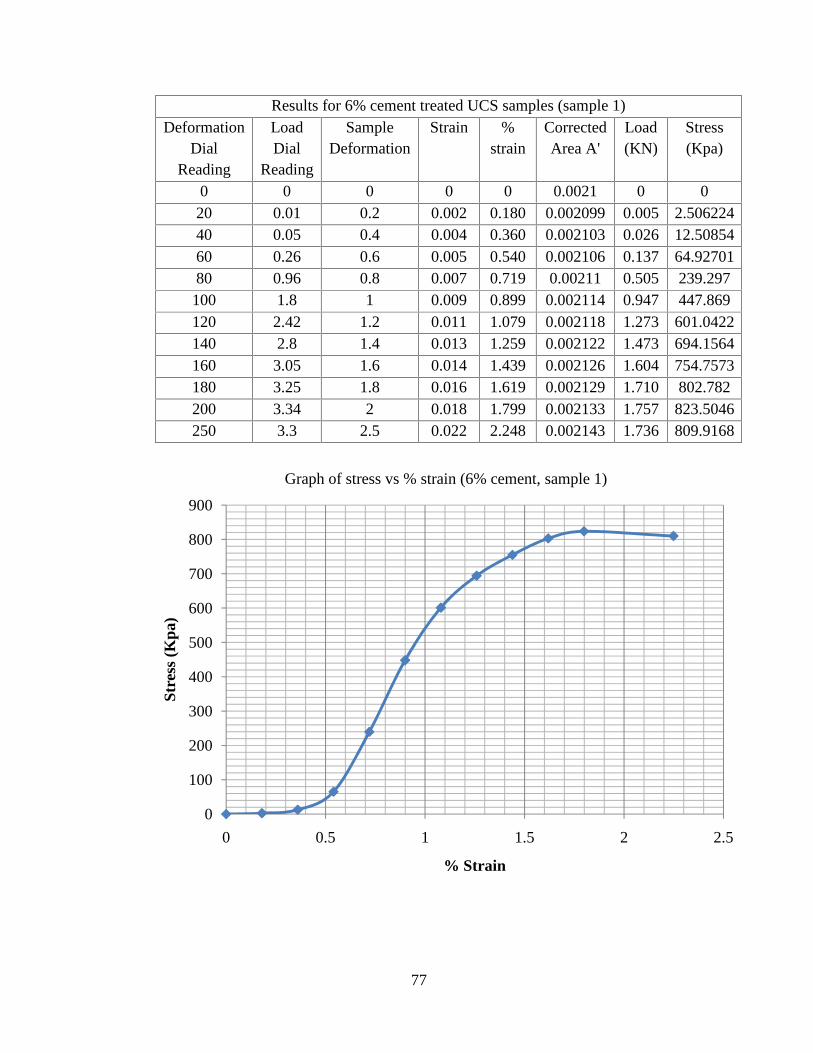
77
Results for 6% cement treated UCS samples (sample 1)Deformation
DialReading
LoadDial
Reading
SampleDeformation
Strain %strain
CorrectedArea A'
Load(KN)
Stress(Kpa)
0 0 0 0 0 0.0021 0 020 0.01 0.2 0.002 0.180 0.002099 0.005 2.50622440 0.05 0.4 0.004 0.360 0.002103 0.026 12.5085460 0.26 0.6 0.005 0.540 0.002106 0.137 64.9270180 0.96 0.8 0.007 0.719 0.00211 0.505 239.297
100 1.8 1 0.009 0.899 0.002114 0.947 447.869120 2.42 1.2 0.011 1.079 0.002118 1.273 601.0422140 2.8 1.4 0.013 1.259 0.002122 1.473 694.1564160 3.05 1.6 0.014 1.439 0.002126 1.604 754.7573180 3.25 1.8 0.016 1.619 0.002129 1.710 802.782200 3.34 2 0.018 1.799 0.002133 1.757 823.5046250 3.3 2.5 0.022 2.248 0.002143 1.736 809.9168
0
100
200
300
400
500
600
700
800
900
0 0.5 1 1.5 2 2.5
Stre
ss (
Kpa
)
% Strain
Graph of stress vs % strain (6% cement, sample 1)
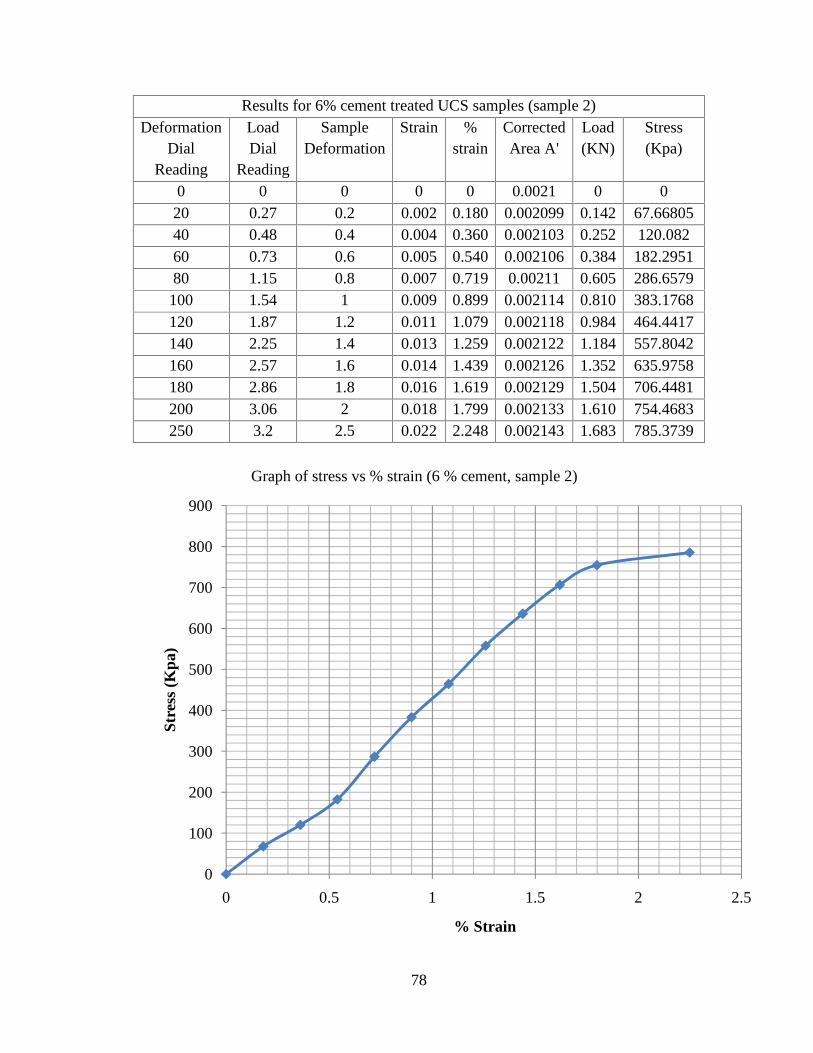
78
Results for 6% cement treated UCS samples (sample 2)Deformation
DialReading
LoadDial
Reading
SampleDeformation
Strain %strain
CorrectedArea A'
Load(KN)
Stress(Kpa)
0 0 0 0 0 0.0021 0 020 0.27 0.2 0.002 0.180 0.002099 0.142 67.6680540 0.48 0.4 0.004 0.360 0.002103 0.252 120.08260 0.73 0.6 0.005 0.540 0.002106 0.384 182.295180 1.15 0.8 0.007 0.719 0.00211 0.605 286.6579
100 1.54 1 0.009 0.899 0.002114 0.810 383.1768120 1.87 1.2 0.011 1.079 0.002118 0.984 464.4417140 2.25 1.4 0.013 1.259 0.002122 1.184 557.8042160 2.57 1.6 0.014 1.439 0.002126 1.352 635.9758180 2.86 1.8 0.016 1.619 0.002129 1.504 706.4481200 3.06 2 0.018 1.799 0.002133 1.610 754.4683250 3.2 2.5 0.022 2.248 0.002143 1.683 785.3739
0
100
200
300
400
500
600
700
800
900
0 0.5 1 1.5 2 2.5
Stre
ss (
Kpa
)
% Strain
Graph of stress vs % strain (6 % cement, sample 2)
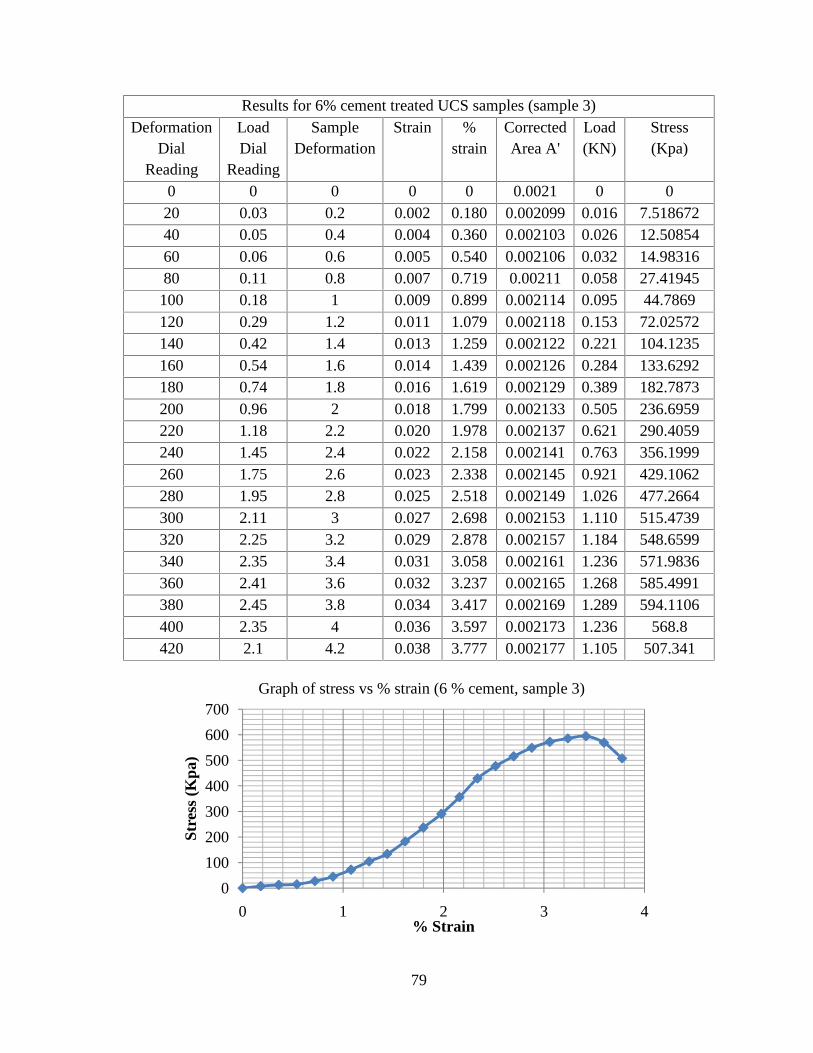
79
Results for 6% cement treated UCS samples (sample 3)Deformation
DialReading
LoadDial
Reading
SampleDeformation
Strain %strain
CorrectedArea A'
Load(KN)
Stress(Kpa)
0 0 0 0 0 0.0021 0 020 0.03 0.2 0.002 0.180 0.002099 0.016 7.51867240 0.05 0.4 0.004 0.360 0.002103 0.026 12.5085460 0.06 0.6 0.005 0.540 0.002106 0.032 14.9831680 0.11 0.8 0.007 0.719 0.00211 0.058 27.41945
100 0.18 1 0.009 0.899 0.002114 0.095 44.7869120 0.29 1.2 0.011 1.079 0.002118 0.153 72.02572140 0.42 1.4 0.013 1.259 0.002122 0.221 104.1235160 0.54 1.6 0.014 1.439 0.002126 0.284 133.6292180 0.74 1.8 0.016 1.619 0.002129 0.389 182.7873200 0.96 2 0.018 1.799 0.002133 0.505 236.6959220 1.18 2.2 0.020 1.978 0.002137 0.621 290.4059240 1.45 2.4 0.022 2.158 0.002141 0.763 356.1999260 1.75 2.6 0.023 2.338 0.002145 0.921 429.1062280 1.95 2.8 0.025 2.518 0.002149 1.026 477.2664300 2.11 3 0.027 2.698 0.002153 1.110 515.4739320 2.25 3.2 0.029 2.878 0.002157 1.184 548.6599340 2.35 3.4 0.031 3.058 0.002161 1.236 571.9836360 2.41 3.6 0.032 3.237 0.002165 1.268 585.4991380 2.45 3.8 0.034 3.417 0.002169 1.289 594.1106400 2.35 4 0.036 3.597 0.002173 1.236 568.8420 2.1 4.2 0.038 3.777 0.002177 1.105 507.341
0
100
200
300
400
500
600
700
0 1 2 3 4
Stre
ss (
Kpa
)
% Strain
Graph of stress vs % strain (6 % cement, sample 3)
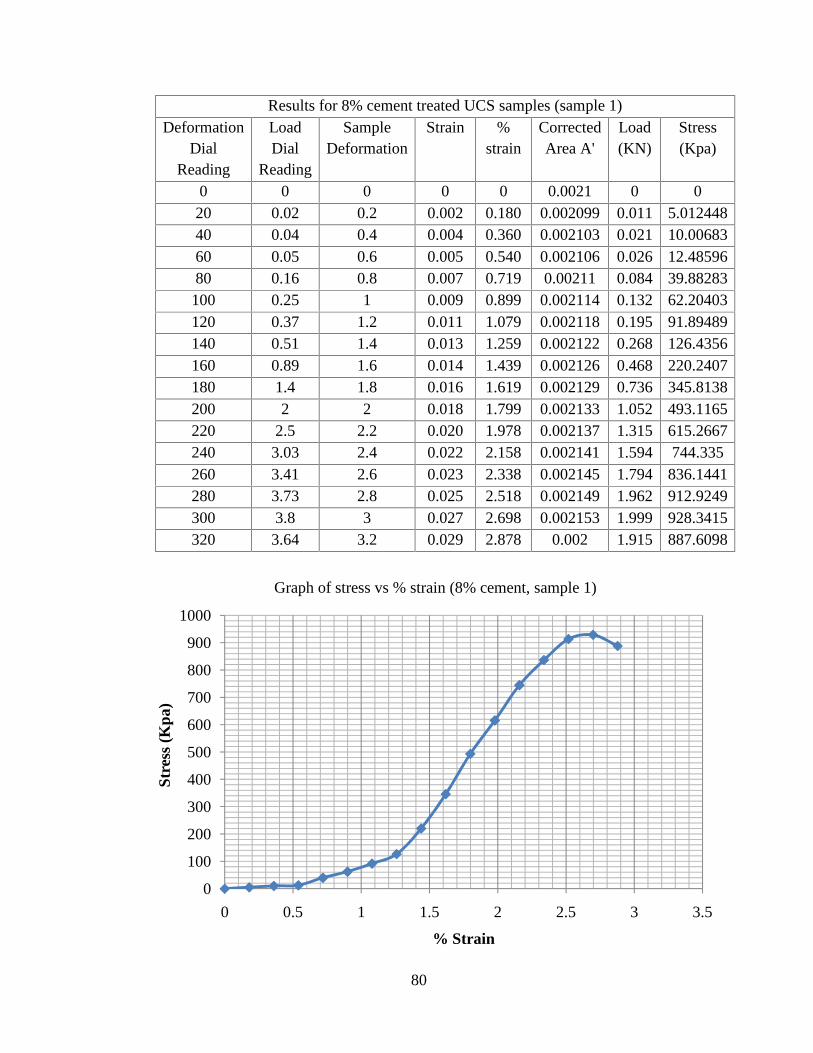
80
Results for 8% cement treated UCS samples (sample 1)Deformation
DialReading
LoadDial
Reading
SampleDeformation
Strain %strain
CorrectedArea A'
Load(KN)
Stress(Kpa)
0 0 0 0 0 0.0021 0 020 0.02 0.2 0.002 0.180 0.002099 0.011 5.01244840 0.04 0.4 0.004 0.360 0.002103 0.021 10.0068360 0.05 0.6 0.005 0.540 0.002106 0.026 12.4859680 0.16 0.8 0.007 0.719 0.00211 0.084 39.88283
100 0.25 1 0.009 0.899 0.002114 0.132 62.20403120 0.37 1.2 0.011 1.079 0.002118 0.195 91.89489140 0.51 1.4 0.013 1.259 0.002122 0.268 126.4356160 0.89 1.6 0.014 1.439 0.002126 0.468 220.2407180 1.4 1.8 0.016 1.619 0.002129 0.736 345.8138200 2 2 0.018 1.799 0.002133 1.052 493.1165220 2.5 2.2 0.020 1.978 0.002137 1.315 615.2667240 3.03 2.4 0.022 2.158 0.002141 1.594 744.335260 3.41 2.6 0.023 2.338 0.002145 1.794 836.1441280 3.73 2.8 0.025 2.518 0.002149 1.962 912.9249300 3.8 3 0.027 2.698 0.002153 1.999 928.3415320 3.64 3.2 0.029 2.878 0.002 1.915 887.6098
0
100
200
300
400
500
600
700
800
900
1000
0 0.5 1 1.5 2 2.5 3 3.5
Stre
ss (
Kpa
)
% Strain
Graph of stress vs % strain (8% cement, sample 1)
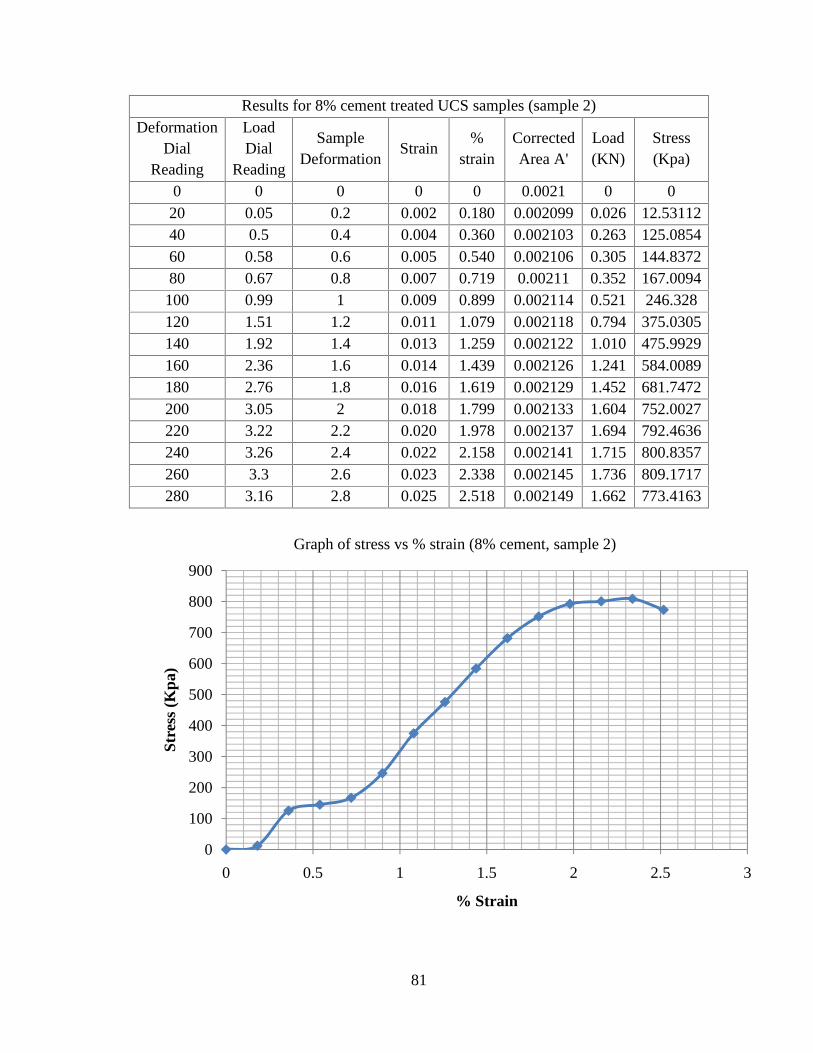
81
Results for 8% cement treated UCS samples (sample 2)Deformation
DialReading
LoadDial
Reading
SampleDeformation
Strain%
strainCorrectedArea A'
Load(KN)
Stress(Kpa)
0 0 0 0 0 0.0021 0 020 0.05 0.2 0.002 0.180 0.002099 0.026 12.5311240 0.5 0.4 0.004 0.360 0.002103 0.263 125.085460 0.58 0.6 0.005 0.540 0.002106 0.305 144.837280 0.67 0.8 0.007 0.719 0.00211 0.352 167.0094
100 0.99 1 0.009 0.899 0.002114 0.521 246.328120 1.51 1.2 0.011 1.079 0.002118 0.794 375.0305140 1.92 1.4 0.013 1.259 0.002122 1.010 475.9929160 2.36 1.6 0.014 1.439 0.002126 1.241 584.0089180 2.76 1.8 0.016 1.619 0.002129 1.452 681.7472200 3.05 2 0.018 1.799 0.002133 1.604 752.0027220 3.22 2.2 0.020 1.978 0.002137 1.694 792.4636240 3.26 2.4 0.022 2.158 0.002141 1.715 800.8357260 3.3 2.6 0.023 2.338 0.002145 1.736 809.1717280 3.16 2.8 0.025 2.518 0.002149 1.662 773.4163
0
100
200
300
400
500
600
700
800
900
0 0.5 1 1.5 2 2.5 3
Stre
ss (
Kpa
)
% Strain
Graph of stress vs % strain (8% cement, sample 2)
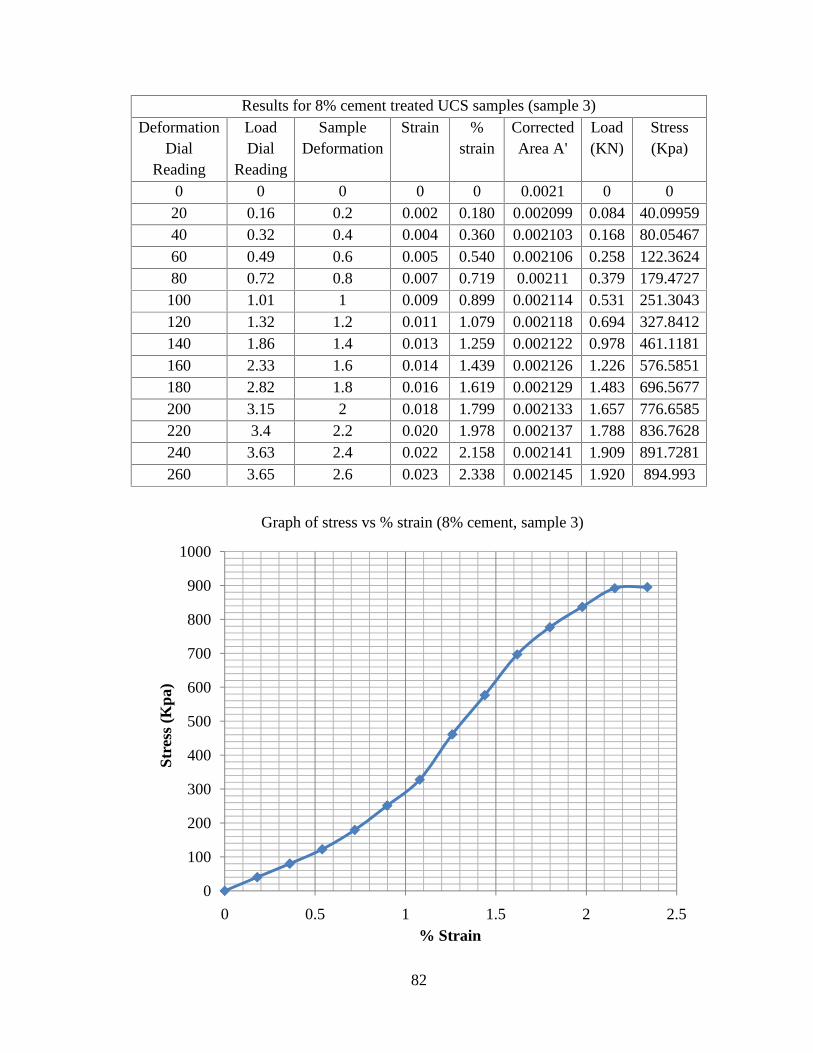
82
Results for 8% cement treated UCS samples (sample 3)Deformation
DialReading
LoadDial
Reading
SampleDeformation
Strain %strain
CorrectedArea A'
Load(KN)
Stress(Kpa)
0 0 0 0 0 0.0021 0 020 0.16 0.2 0.002 0.180 0.002099 0.084 40.0995940 0.32 0.4 0.004 0.360 0.002103 0.168 80.0546760 0.49 0.6 0.005 0.540 0.002106 0.258 122.362480 0.72 0.8 0.007 0.719 0.00211 0.379 179.4727
100 1.01 1 0.009 0.899 0.002114 0.531 251.3043120 1.32 1.2 0.011 1.079 0.002118 0.694 327.8412140 1.86 1.4 0.013 1.259 0.002122 0.978 461.1181160 2.33 1.6 0.014 1.439 0.002126 1.226 576.5851180 2.82 1.8 0.016 1.619 0.002129 1.483 696.5677200 3.15 2 0.018 1.799 0.002133 1.657 776.6585220 3.4 2.2 0.020 1.978 0.002137 1.788 836.7628240 3.63 2.4 0.022 2.158 0.002141 1.909 891.7281260 3.65 2.6 0.023 2.338 0.002145 1.920 894.993
0
100
200
300
400
500
600
700
800
900
1000
0 0.5 1 1.5 2 2.5
Stre
ss (
Kpa
)
% Strain
Graph of stress vs % strain (8% cement, sample 3)
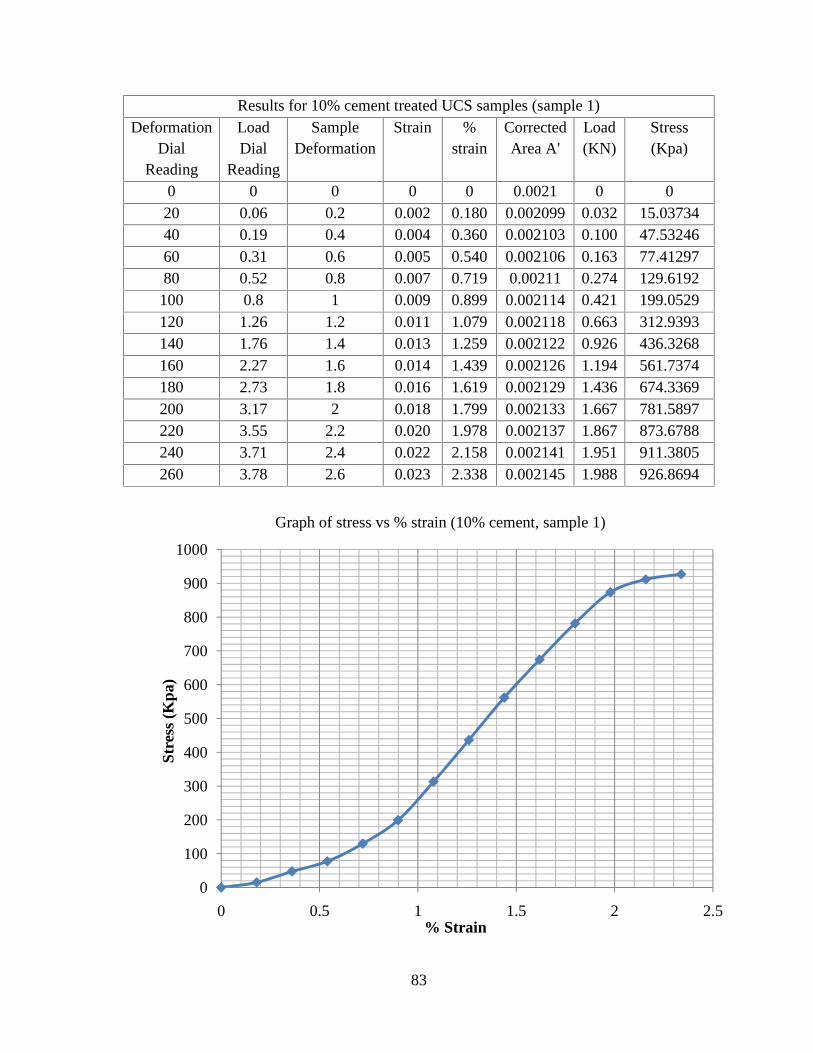
83
Results for 10% cement treated UCS samples (sample 1)Deformation
DialReading
LoadDial
Reading
SampleDeformation
Strain %strain
CorrectedArea A'
Load(KN)
Stress(Kpa)
0 0 0 0 0 0.0021 0 020 0.06 0.2 0.002 0.180 0.002099 0.032 15.0373440 0.19 0.4 0.004 0.360 0.002103 0.100 47.5324660 0.31 0.6 0.005 0.540 0.002106 0.163 77.4129780 0.52 0.8 0.007 0.719 0.00211 0.274 129.6192
100 0.8 1 0.009 0.899 0.002114 0.421 199.0529120 1.26 1.2 0.011 1.079 0.002118 0.663 312.9393140 1.76 1.4 0.013 1.259 0.002122 0.926 436.3268160 2.27 1.6 0.014 1.439 0.002126 1.194 561.7374180 2.73 1.8 0.016 1.619 0.002129 1.436 674.3369200 3.17 2 0.018 1.799 0.002133 1.667 781.5897220 3.55 2.2 0.020 1.978 0.002137 1.867 873.6788240 3.71 2.4 0.022 2.158 0.002141 1.951 911.3805260 3.78 2.6 0.023 2.338 0.002145 1.988 926.8694
0
100
200
300
400
500
600
700
800
900
1000
0 0.5 1 1.5 2 2.5
Stre
ss (
Kpa
)
% Strain
Graph of stress vs % strain (10% cement, sample 1)
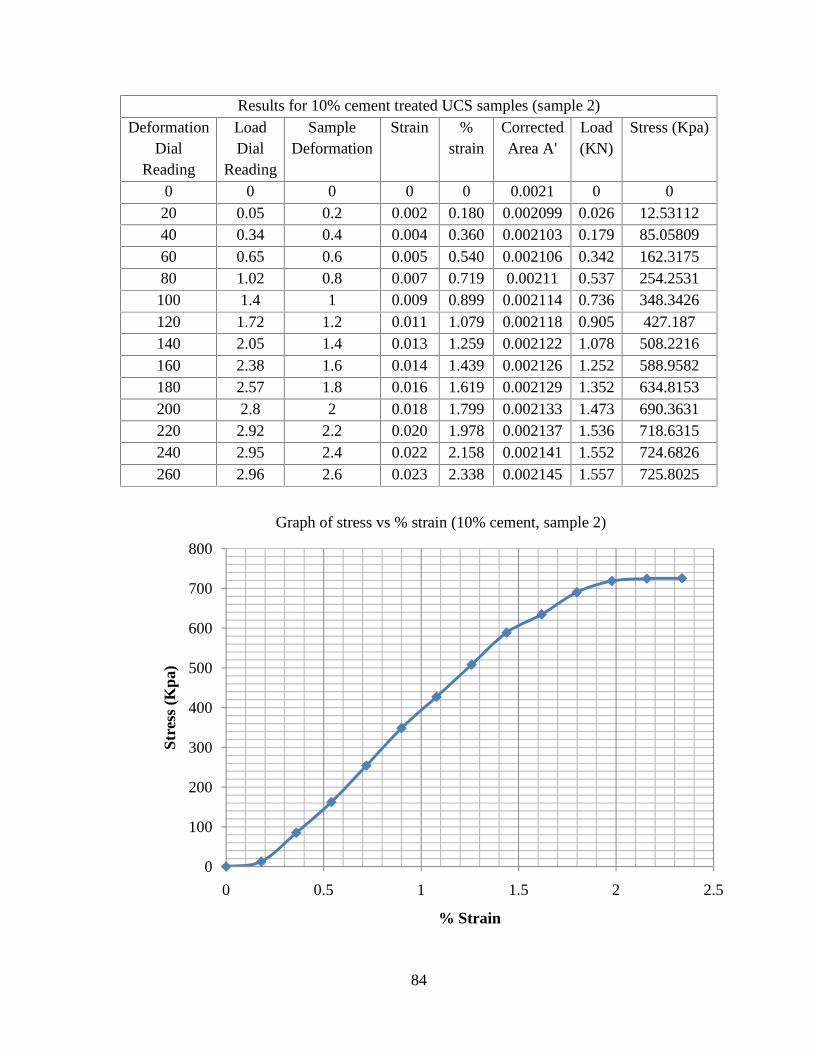
84
Results for 10% cement treated UCS samples (sample 2)Deformation
DialReading
LoadDial
Reading
SampleDeformation
Strain %strain
CorrectedArea A'
Load(KN)
Stress (Kpa)
0 0 0 0 0 0.0021 0 020 0.05 0.2 0.002 0.180 0.002099 0.026 12.5311240 0.34 0.4 0.004 0.360 0.002103 0.179 85.0580960 0.65 0.6 0.005 0.540 0.002106 0.342 162.317580 1.02 0.8 0.007 0.719 0.00211 0.537 254.2531
100 1.4 1 0.009 0.899 0.002114 0.736 348.3426120 1.72 1.2 0.011 1.079 0.002118 0.905 427.187140 2.05 1.4 0.013 1.259 0.002122 1.078 508.2216160 2.38 1.6 0.014 1.439 0.002126 1.252 588.9582180 2.57 1.8 0.016 1.619 0.002129 1.352 634.8153200 2.8 2 0.018 1.799 0.002133 1.473 690.3631220 2.92 2.2 0.020 1.978 0.002137 1.536 718.6315240 2.95 2.4 0.022 2.158 0.002141 1.552 724.6826260 2.96 2.6 0.023 2.338 0.002145 1.557 725.8025
0
100
200
300
400
500
600
700
800
0 0.5 1 1.5 2 2.5
Stre
ss (
Kpa
)
% Strain
Graph of stress vs % strain (10% cement, sample 2)
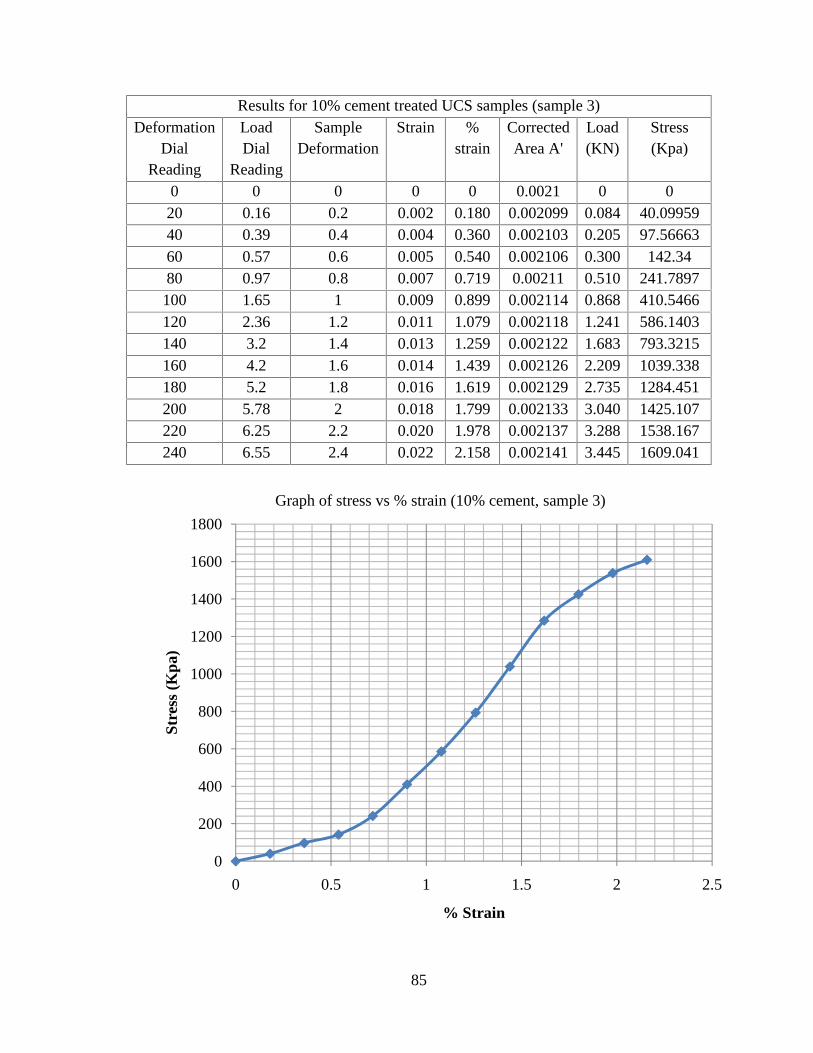
85
Results for 10% cement treated UCS samples (sample 3)Deformation
DialReading
LoadDial
Reading
SampleDeformation
Strain %strain
CorrectedArea A'
Load(KN)
Stress(Kpa)
0 0 0 0 0 0.0021 0 020 0.16 0.2 0.002 0.180 0.002099 0.084 40.0995940 0.39 0.4 0.004 0.360 0.002103 0.205 97.5666360 0.57 0.6 0.005 0.540 0.002106 0.300 142.3480 0.97 0.8 0.007 0.719 0.00211 0.510 241.7897
100 1.65 1 0.009 0.899 0.002114 0.868 410.5466120 2.36 1.2 0.011 1.079 0.002118 1.241 586.1403140 3.2 1.4 0.013 1.259 0.002122 1.683 793.3215160 4.2 1.6 0.014 1.439 0.002126 2.209 1039.338180 5.2 1.8 0.016 1.619 0.002129 2.735 1284.451200 5.78 2 0.018 1.799 0.002133 3.040 1425.107220 6.25 2.2 0.020 1.978 0.002137 3.288 1538.167240 6.55 2.4 0.022 2.158 0.002141 3.445 1609.041
0
200
400
600
800
1000
1200
1400
1600
1800
0 0.5 1 1.5 2 2.5
Stre
ss (
Kpa
)
% Strain
Graph of stress vs % strain (10% cement, sample 3)
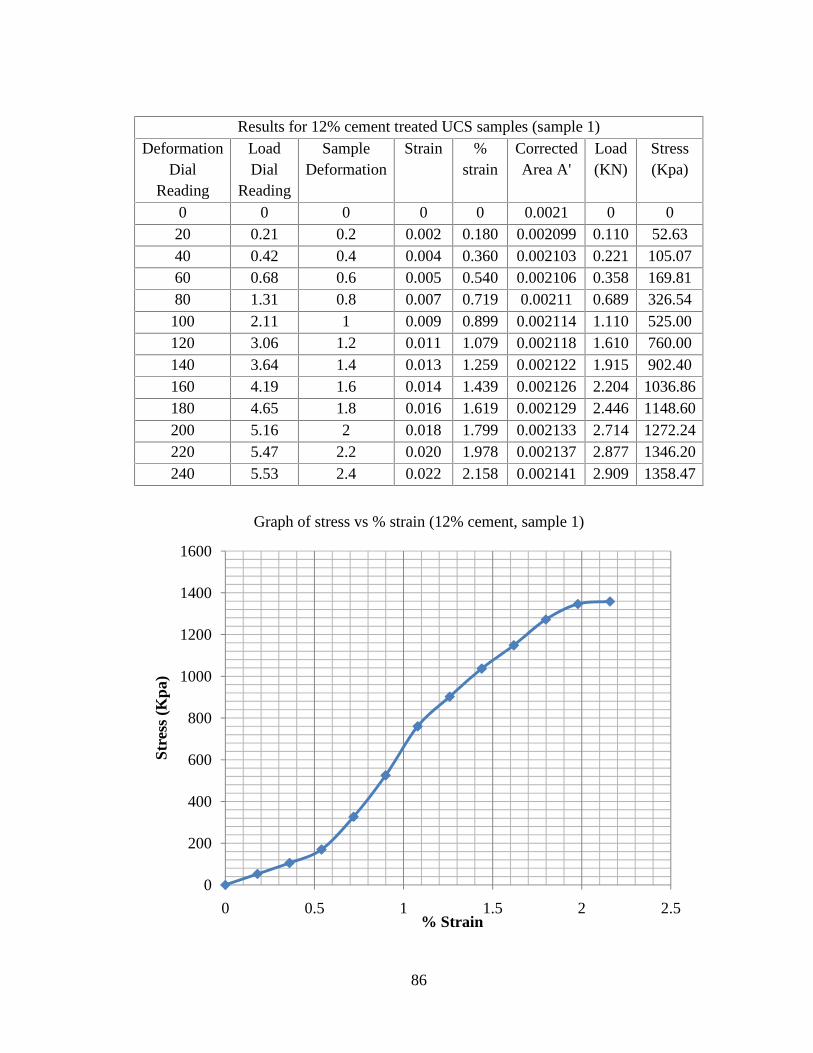
86
Results for 12% cement treated UCS samples (sample 1)Deformation
DialReading
LoadDial
Reading
SampleDeformation
Strain %strain
CorrectedArea A'
Load(KN)
Stress(Kpa)
0 0 0 0 0 0.0021 0 020 0.21 0.2 0.002 0.180 0.002099 0.110 52.6340 0.42 0.4 0.004 0.360 0.002103 0.221 105.0760 0.68 0.6 0.005 0.540 0.002106 0.358 169.8180 1.31 0.8 0.007 0.719 0.00211 0.689 326.54
100 2.11 1 0.009 0.899 0.002114 1.110 525.00120 3.06 1.2 0.011 1.079 0.002118 1.610 760.00140 3.64 1.4 0.013 1.259 0.002122 1.915 902.40160 4.19 1.6 0.014 1.439 0.002126 2.204 1036.86180 4.65 1.8 0.016 1.619 0.002129 2.446 1148.60200 5.16 2 0.018 1.799 0.002133 2.714 1272.24220 5.47 2.2 0.020 1.978 0.002137 2.877 1346.20240 5.53 2.4 0.022 2.158 0.002141 2.909 1358.47
0
200
400
600
800
1000
1200
1400
1600
0 0.5 1 1.5 2 2.5
Stre
ss (
Kpa
)
% Strain
Graph of stress vs % strain (12% cement, sample 1)
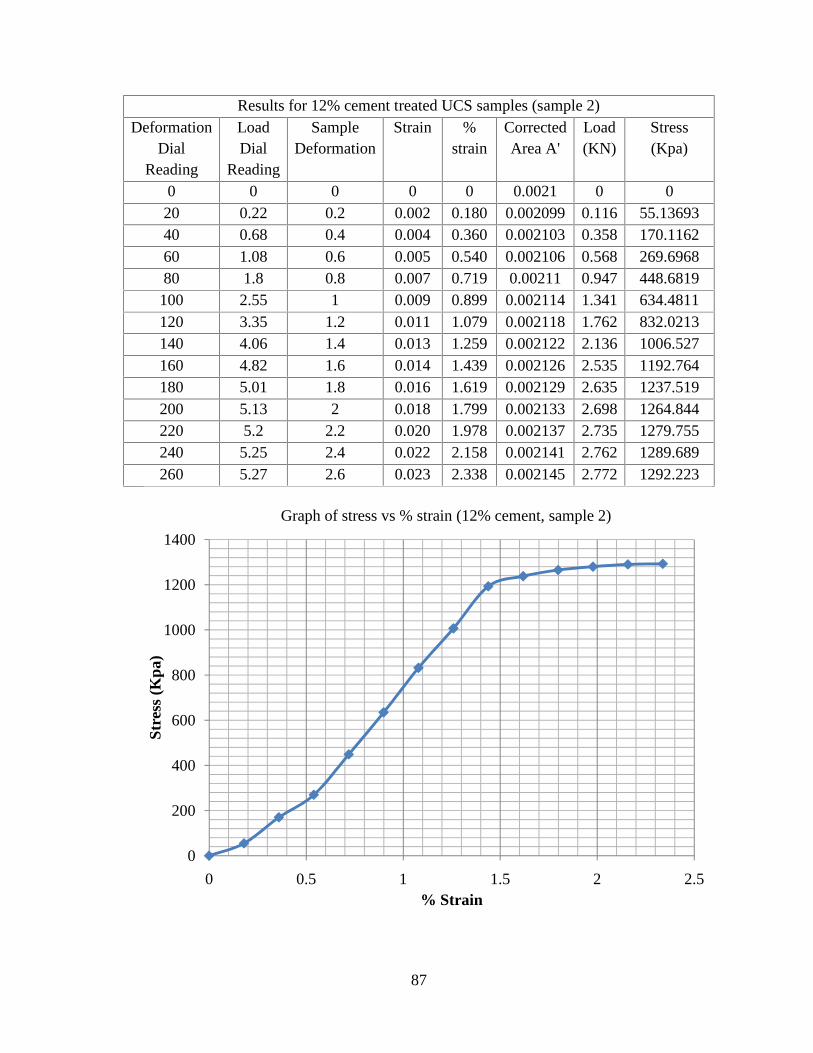
87
Results for 12% cement treated UCS samples (sample 2)Deformation
DialReading
LoadDial
Reading
SampleDeformation
Strain %strain
CorrectedArea A'
Load(KN)
Stress(Kpa)
0 0 0 0 0 0.0021 0 020 0.22 0.2 0.002 0.180 0.002099 0.116 55.1369340 0.68 0.4 0.004 0.360 0.002103 0.358 170.116260 1.08 0.6 0.005 0.540 0.002106 0.568 269.696880 1.8 0.8 0.007 0.719 0.00211 0.947 448.6819
100 2.55 1 0.009 0.899 0.002114 1.341 634.4811120 3.35 1.2 0.011 1.079 0.002118 1.762 832.0213140 4.06 1.4 0.013 1.259 0.002122 2.136 1006.527160 4.82 1.6 0.014 1.439 0.002126 2.535 1192.764180 5.01 1.8 0.016 1.619 0.002129 2.635 1237.519200 5.13 2 0.018 1.799 0.002133 2.698 1264.844220 5.2 2.2 0.020 1.978 0.002137 2.735 1279.755240 5.25 2.4 0.022 2.158 0.002141 2.762 1289.689260 5.27 2.6 0.023 2.338 0.002145 2.772 1292.223
0
200
400
600
800
1000
1200
1400
0 0.5 1 1.5 2 2.5
Stre
ss (
Kpa
)
% Strain
Graph of stress vs % strain (12% cement, sample 2)
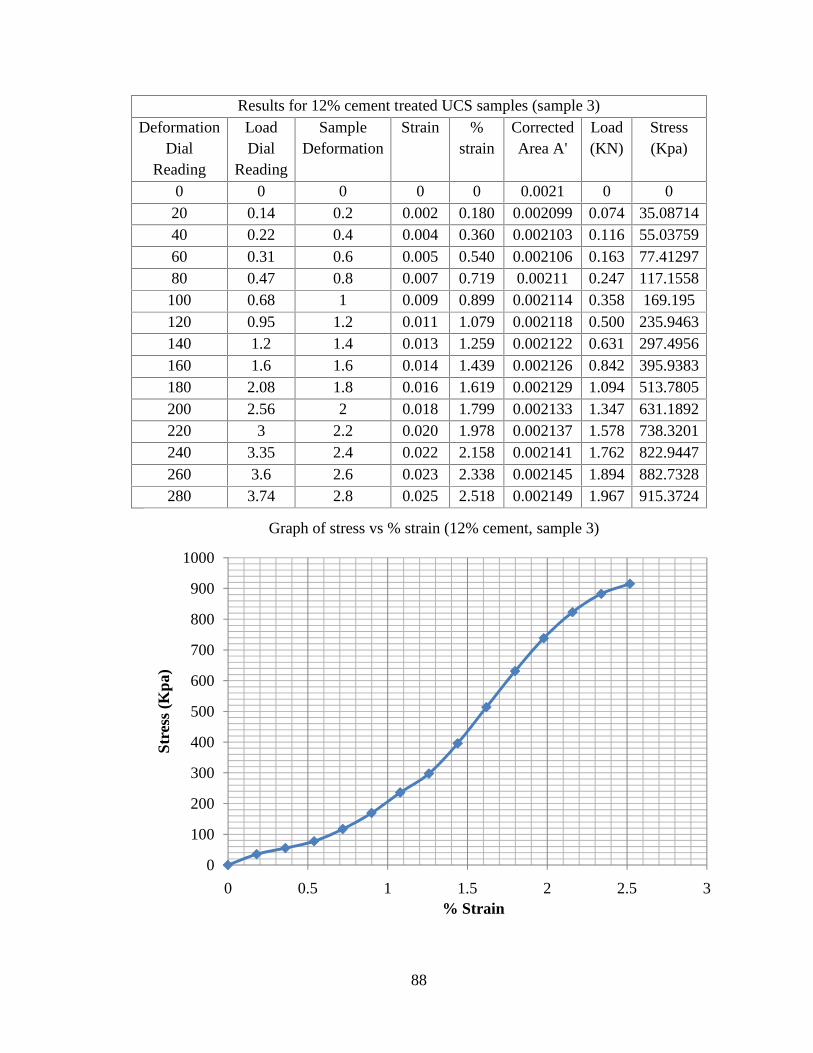
88
Results for 12% cement treated UCS samples (sample 3)Deformation
DialReading
LoadDial
Reading
SampleDeformation
Strain %strain
CorrectedArea A'
Load(KN)
Stress(Kpa)
0 0 0 0 0 0.0021 0 020 0.14 0.2 0.002 0.180 0.002099 0.074 35.0871440 0.22 0.4 0.004 0.360 0.002103 0.116 55.0375960 0.31 0.6 0.005 0.540 0.002106 0.163 77.4129780 0.47 0.8 0.007 0.719 0.00211 0.247 117.1558
100 0.68 1 0.009 0.899 0.002114 0.358 169.195120 0.95 1.2 0.011 1.079 0.002118 0.500 235.9463140 1.2 1.4 0.013 1.259 0.002122 0.631 297.4956160 1.6 1.6 0.014 1.439 0.002126 0.842 395.9383180 2.08 1.8 0.016 1.619 0.002129 1.094 513.7805200 2.56 2 0.018 1.799 0.002133 1.347 631.1892220 3 2.2 0.020 1.978 0.002137 1.578 738.3201240 3.35 2.4 0.022 2.158 0.002141 1.762 822.9447260 3.6 2.6 0.023 2.338 0.002145 1.894 882.7328280 3.74 2.8 0.025 2.518 0.002149 1.967 915.3724
0
100
200
300
400
500
600
700
800
900
1000
0 0.5 1 1.5 2 2.5 3
Stre
ss (
Kpa
)
% Strain
Graph of stress vs % strain (12% cement, sample 3)
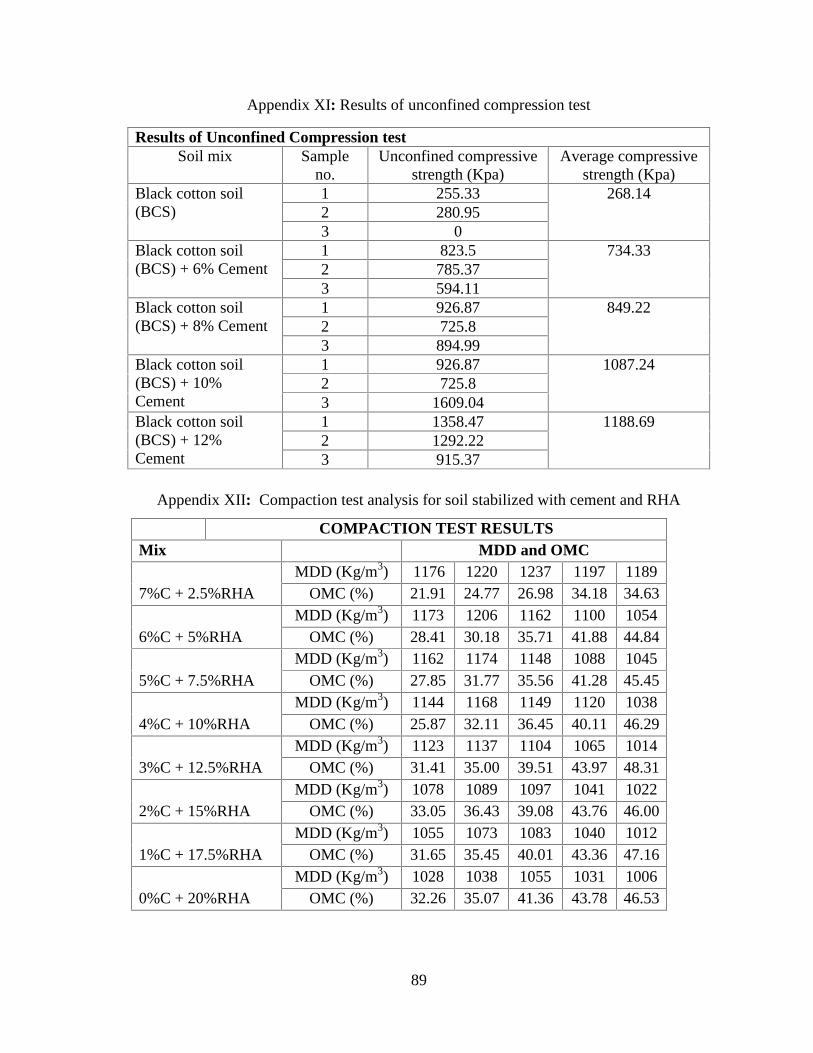
89
Appendix XI: Results of unconfined compression test
Results of Unconfined Compression testSoil mix Sample
no.Unconfined compressive
strength (Kpa)Average compressive
strength (Kpa)Black cotton soil(BCS)
1 255.33 268.142 280.953 0
Black cotton soil(BCS) + 6% Cement
1 823.5 734.332 785.373 594.11
Black cotton soil(BCS) + 8% Cement
1 926.87 849.222 725.83 894.99
Black cotton soil(BCS) + 10%Cement
1 926.87 1087.242 725.83 1609.04
Black cotton soil(BCS) + 12%Cement
1 1358.47 1188.692 1292.223 915.37
Appendix XII: Compaction test analysis for soil stabilized with cement and RHA
COMPACTION TEST RESULTSMix MDD and OMC
7%C + 2.5%RHAMDD (Kg/m3) 1176 1220 1237 1197 1189
OMC (%) 21.91 24.77 26.98 34.18 34.63
6%C + 5%RHAMDD (Kg/m3) 1173 1206 1162 1100 1054
OMC (%) 28.41 30.18 35.71 41.88 44.84
5%C + 7.5%RHAMDD (Kg/m3) 1162 1174 1148 1088 1045
OMC (%) 27.85 31.77 35.56 41.28 45.45
4%C + 10%RHAMDD (Kg/m3) 1144 1168 1149 1120 1038
OMC (%) 25.87 32.11 36.45 40.11 46.29
3%C + 12.5%RHAMDD (Kg/m3) 1123 1137 1104 1065 1014
OMC (%) 31.41 35.00 39.51 43.97 48.31
2%C + 15%RHAMDD (Kg/m3) 1078 1089 1097 1041 1022
OMC (%) 33.05 36.43 39.08 43.76 46.00
1%C + 17.5%RHAMDD (Kg/m3) 1055 1073 1083 1040 1012
OMC (%) 31.65 35.45 40.01 43.36 47.16
0%C + 20%RHAMDD (Kg/m3) 1028 1038 1055 1031 1006
OMC (%) 32.26 35.07 41.36 43.78 46.53
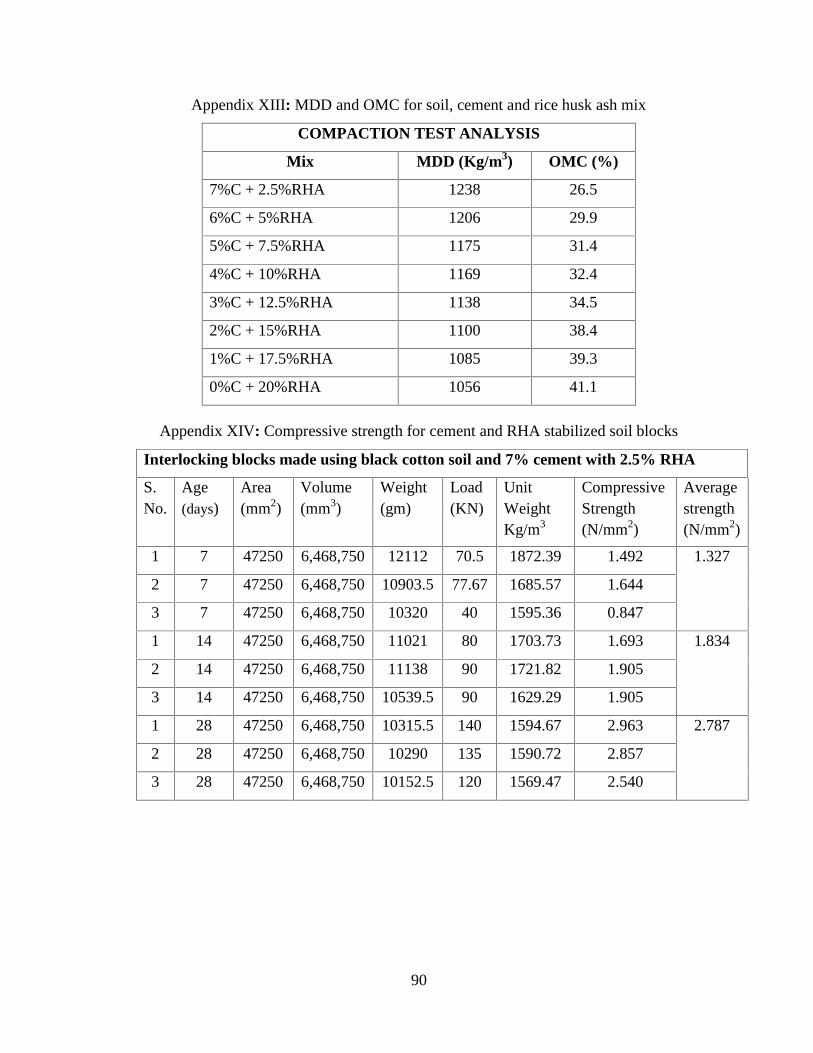
90
Appendix XIII: MDD and OMC for soil, cement and rice husk ash mix
COMPACTION TEST ANALYSIS
Mix MDD (Kg/m3) OMC (%)
7%C + 2.5%RHA 1238 26.5
6%C + 5%RHA 1206 29.9
5%C + 7.5%RHA 1175 31.4
4%C + 10%RHA 1169 32.4
3%C + 12.5%RHA 1138 34.5
2%C + 15%RHA 1100 38.4
1%C + 17.5%RHA 1085 39.3
0%C + 20%RHA 1056 41.1
Appendix XIV: Compressive strength for cement and RHA stabilized soil blocks
Interlocking blocks made using black cotton soil and 7% cement with 2.5% RHA
S.No.
Age(days)
Area(mm2)
Volume(mm3)
Weight(gm)
Load(KN)
UnitWeightKg/m3
CompressiveStrength(N/mm2)
Averagestrength(N/mm2)
1 7 47250 6,468,750 12112 70.5 1872.39 1.492 1.327
2 7 47250 6,468,750 10903.5 77.67 1685.57 1.644
3 7 47250 6,468,750 10320 40 1595.36 0.847
1 14 47250 6,468,750 11021 80 1703.73 1.693 1.834
2 14 47250 6,468,750 11138 90 1721.82 1.905
3 14 47250 6,468,750 10539.5 90 1629.29 1.905
1 28 47250 6,468,750 10315.5 140 1594.67 2.963 2.787
2 28 47250 6,468,750 10290 135 1590.72 2.857
3 28 47250 6,468,750 10152.5 120 1569.47 2.540
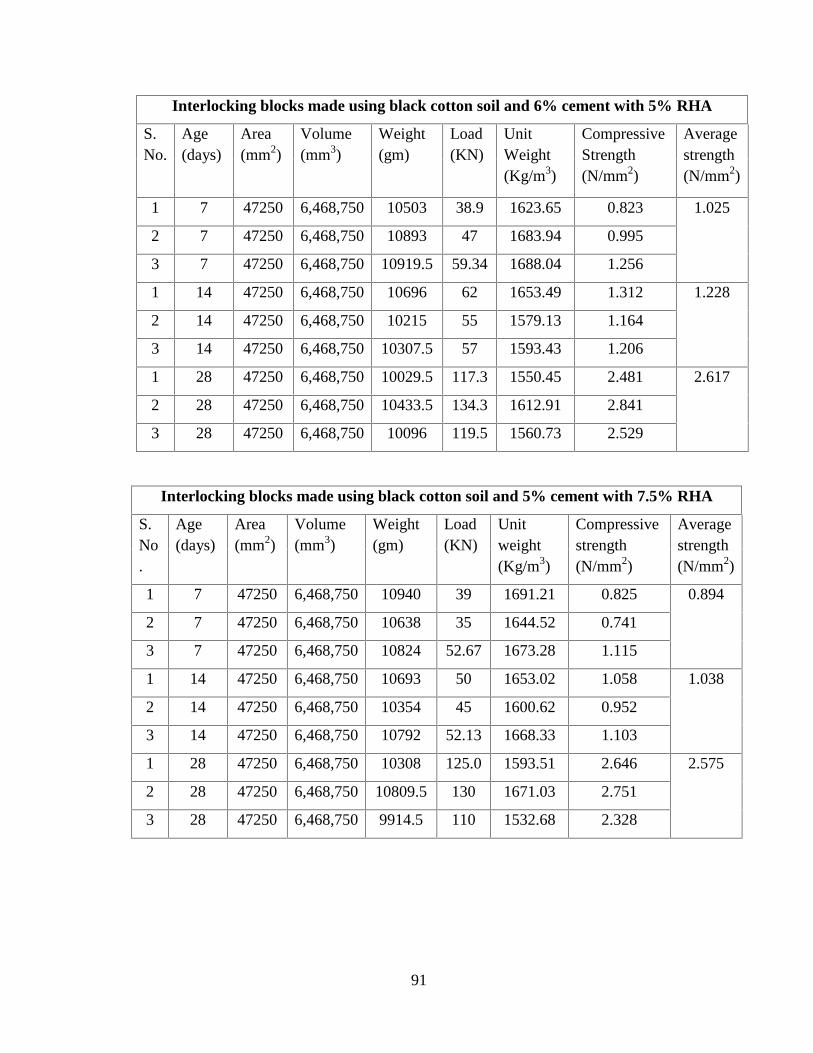
91
Interlocking blocks made using black cotton soil and 6% cement with 5% RHA
S.No.
Age(days)
Area(mm2)
Volume(mm3)
Weight(gm)
Load(KN)
UnitWeight(Kg/m3)
CompressiveStrength(N/mm2)
Averagestrength(N/mm2)
1 7 47250 6,468,750 10503 38.9 1623.65 0.823 1.025
2 7 47250 6,468,750 10893 47 1683.94 0.995
3 7 47250 6,468,750 10919.5 59.34 1688.04 1.256
1 14 47250 6,468,750 10696 62 1653.49 1.312 1.228
2 14 47250 6,468,750 10215 55 1579.13 1.164
3 14 47250 6,468,750 10307.5 57 1593.43 1.206
1 28 47250 6,468,750 10029.5 117.3 1550.45 2.481 2.617
2 28 47250 6,468,750 10433.5 134.3 1612.91 2.841
3 28 47250 6,468,750 10096 119.5 1560.73 2.529
Interlocking blocks made using black cotton soil and 5% cement with 7.5% RHA
S.No.
Age(days)
Area(mm2)
Volume(mm3)
Weight(gm)
Load(KN)
Unitweight(Kg/m3)
Compressivestrength(N/mm2)
Averagestrength(N/mm2)
1 7 47250 6,468,750 10940 39 1691.21 0.825 0.894
2 7 47250 6,468,750 10638 35 1644.52 0.741
3 7 47250 6,468,750 10824 52.67 1673.28 1.115
1 14 47250 6,468,750 10693 50 1653.02 1.058 1.038
2 14 47250 6,468,750 10354 45 1600.62 0.952
3 14 47250 6,468,750 10792 52.13 1668.33 1.103
1 28 47250 6,468,750 10308 125.0 1593.51 2.646 2.575
2 28 47250 6,468,750 10809.5 130 1671.03 2.751
3 28 47250 6,468,750 9914.5 110 1532.68 2.328
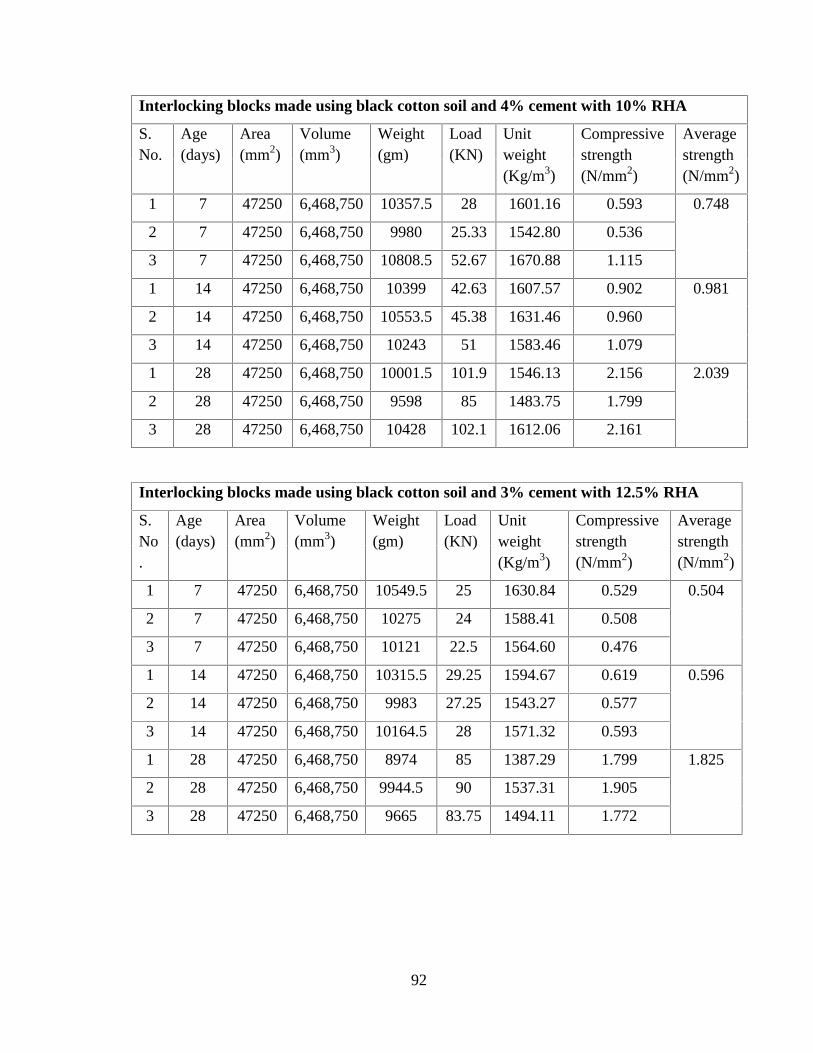
92
Interlocking blocks made using black cotton soil and 4% cement with 10% RHA
S.No.
Age(days)
Area(mm2)
Volume(mm3)
Weight(gm)
Load(KN)
Unitweight(Kg/m3)
Compressivestrength(N/mm2)
Averagestrength(N/mm2)
1 7 47250 6,468,750 10357.5 28 1601.16 0.593 0.748
2 7 47250 6,468,750 9980 25.33 1542.80 0.536
3 7 47250 6,468,750 10808.5 52.67 1670.88 1.115
1 14 47250 6,468,750 10399 42.63 1607.57 0.902 0.981
2 14 47250 6,468,750 10553.5 45.38 1631.46 0.960
3 14 47250 6,468,750 10243 51 1583.46 1.079
1 28 47250 6,468,750 10001.5 101.9 1546.13 2.156 2.039
2 28 47250 6,468,750 9598 85 1483.75 1.799
3 28 47250 6,468,750 10428 102.1 1612.06 2.161
Interlocking blocks made using black cotton soil and 3% cement with 12.5% RHA
S.No.
Age(days)
Area(mm2)
Volume(mm3)
Weight(gm)
Load(KN)
Unitweight(Kg/m3)
Compressivestrength(N/mm2)
Averagestrength(N/mm2)
1 7 47250 6,468,750 10549.5 25 1630.84 0.529 0.504
2 7 47250 6,468,750 10275 24 1588.41 0.508
3 7 47250 6,468,750 10121 22.5 1564.60 0.476
1 14 47250 6,468,750 10315.5 29.25 1594.67 0.619 0.596
2 14 47250 6,468,750 9983 27.25 1543.27 0.577
3 14 47250 6,468,750 10164.5 28 1571.32 0.593
1 28 47250 6,468,750 8974 85 1387.29 1.799 1.825
2 28 47250 6,468,750 9944.5 90 1537.31 1.905
3 28 47250 6,468,750 9665 83.75 1494.11 1.772
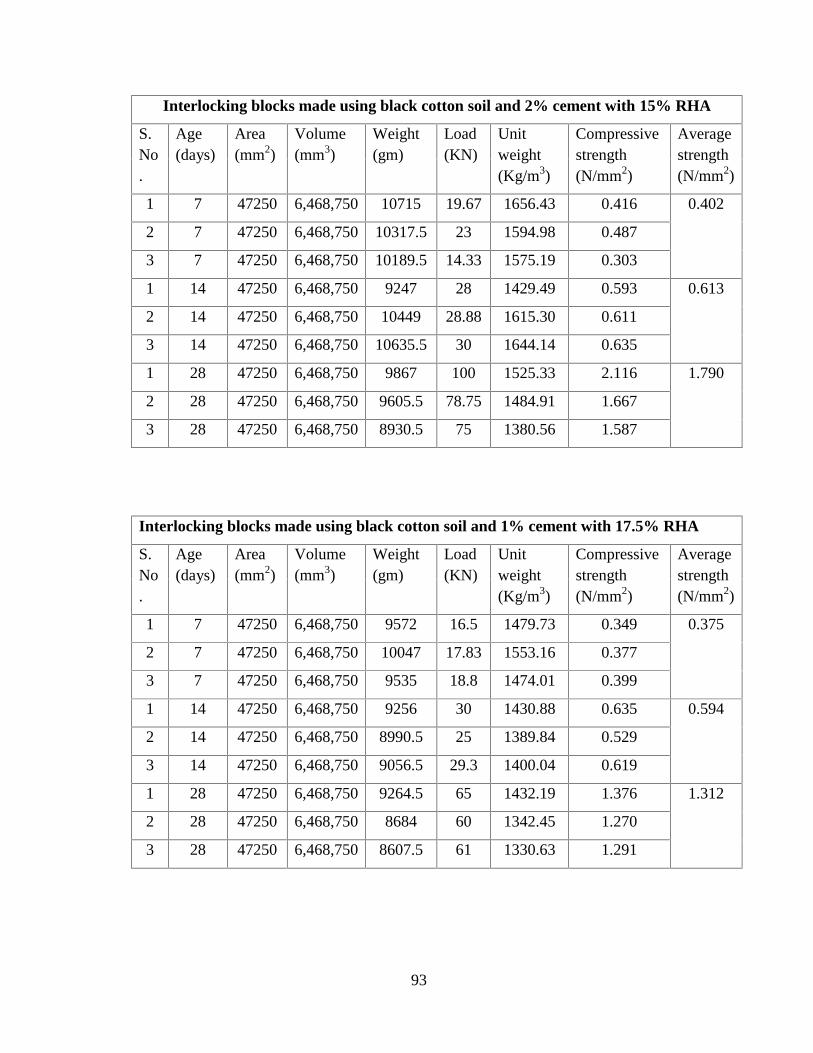
93
Interlocking blocks made using black cotton soil and 2% cement with 15% RHA
S.No.
Age(days)
Area(mm2)
Volume(mm3)
Weight(gm)
Load(KN)
Unitweight(Kg/m3)
Compressivestrength(N/mm2)
Averagestrength(N/mm2)
1 7 47250 6,468,750 10715 19.67 1656.43 0.416 0.402
2 7 47250 6,468,750 10317.5 23 1594.98 0.487
3 7 47250 6,468,750 10189.5 14.33 1575.19 0.303
1 14 47250 6,468,750 9247 28 1429.49 0.593 0.613
2 14 47250 6,468,750 10449 28.88 1615.30 0.611
3 14 47250 6,468,750 10635.5 30 1644.14 0.635
1 28 47250 6,468,750 9867 100 1525.33 2.116 1.790
2 28 47250 6,468,750 9605.5 78.75 1484.91 1.667
3 28 47250 6,468,750 8930.5 75 1380.56 1.587
Interlocking blocks made using black cotton soil and 1% cement with 17.5% RHA
S.No.
Age(days)
Area(mm2)
Volume(mm3)
Weight(gm)
Load(KN)
Unitweight(Kg/m3)
Compressivestrength(N/mm2)
Averagestrength(N/mm2)
1 7 47250 6,468,750 9572 16.5 1479.73 0.349 0.375
2 7 47250 6,468,750 10047 17.83 1553.16 0.377
3 7 47250 6,468,750 9535 18.8 1474.01 0.399
1 14 47250 6,468,750 9256 30 1430.88 0.635 0.594
2 14 47250 6,468,750 8990.5 25 1389.84 0.529
3 14 47250 6,468,750 9056.5 29.3 1400.04 0.619
1 28 47250 6,468,750 9264.5 65 1432.19 1.376 1.312
2 28 47250 6,468,750 8684 60 1342.45 1.270
3 28 47250 6,468,750 8607.5 61 1330.63 1.291
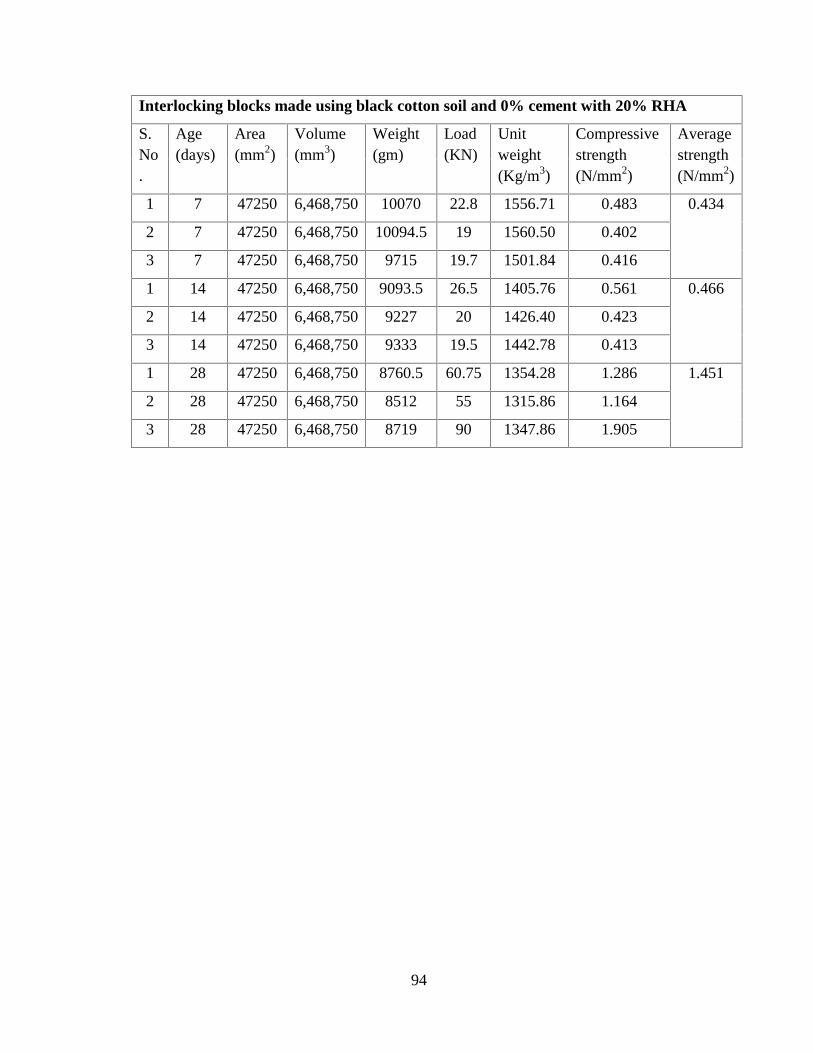
94
Interlocking blocks made using black cotton soil and 0% cement with 20% RHA
S.No.
Age(days)
Area(mm2)
Volume(mm3)
Weight(gm)
Load(KN)
Unitweight(Kg/m3)
Compressivestrength(N/mm2)
Averagestrength(N/mm2)
1 7 47250 6,468,750 10070 22.8 1556.71 0.483 0.434
2 7 47250 6,468,750 10094.5 19 1560.50 0.402
3 7 47250 6,468,750 9715 19.7 1501.84 0.416
1 14 47250 6,468,750 9093.5 26.5 1405.76 0.561 0.466
2 14 47250 6,468,750 9227 20 1426.40 0.423
3 14 47250 6,468,750 9333 19.5 1442.78 0.413
1 28 47250 6,468,750 8760.5 60.75 1354.28 1.286 1.451
2 28 47250 6,468,750 8512 55 1315.86 1.164
3 28 47250 6,468,750 8719 90 1347.86 1.905