Embed Size (px)
Citation preview

�������� ����� ��
Structural mapping using PALSAR data in the Central Gold Belt, PeninsularMalaysia
Amin Beiranvand Pour, Mazlan Hashim
PII: S0169-1368(14)00144-9DOI: doi: 10.1016/j.oregeorev.2014.06.011Reference: OREGEO 1259
To appear in: Ore Geology Reviews
Received date: 18 February 2014Revised date: 5 June 2014Accepted date: 12 June 2014
Please cite this article as: Pour, Amin Beiranvand, Hashim, Mazlan, Structural mappingusing PALSAR data in the Central Gold Belt, Peninsular Malaysia, Ore Geology Reviews(2014), doi: 10.1016/j.oregeorev.2014.06.011
This is a PDF file of an unedited manuscript that has been accepted for publication.As a service to our customers we are providing this early version of the manuscript.The manuscript will undergo copyediting, typesetting, and review of the resulting proofbefore it is published in its final form. Please note that during the production processerrors may be discovered which could affect the content, and all legal disclaimers thatapply to the journal pertain.

ACC
EPTE
D M
ANU
SCR
IPT
ACCEPTED MANUSCRIPT
1
Structural mapping using PALSAR data in the Central Gold Belt, Peninsular Malaysia
Amin Beiranvand Pour*, Mazlan Hashim
Institute of Geospatial Science & Technology (INSTeG) Universiti Teknologi Malaysia
81310 UTM Skudai, Johor Bahru, Malaysia Abstract
The Central Gold Belt (CGB) of Peninsular Malaysia has been investigated to map structural
elements associated with gold mineralization using the Phased Array type L-band Synthetic
Aperture Radar (PALSAR) satellite remote sensing data. Gold mineralization in this belt is
structurally controlled and associated with steeply dipping faults and fold hinges. Adaptive
local sigma and directional filters were applied to PALSAR data for tracing structural
elements associated with gold mineralization. Structural features along the Bentong-Raub
Suture Zone have been identified as highly potential areas for gold prospecting. Four sets of
lineaments trending N-S, NE-SW, NNW-SSE and ESE-WNW were identified. Results of this
study demonstrate the applicability of PALSAR remote sensing data to assist gold
exploration in the CGB particularly in reducing costs related to exploration for epithermal
and polymetallic vein-type mineralization in tropical environments.
Key words: PALSAR; Structural mapping; Central Gold Belt; Peninsular Malaysia. *Corresponding Author. Tel: +607 -5530666; Fax: +607- 5531174; Email address: [email protected]; [email protected]; [email protected]; [email protected].

ACC
EPTE
D M
ANU
SCR
IPT
ACCEPTED MANUSCRIPT
2
1. Introduction
The identification of geological structures and lineament analysis using remote sensing
imagery are always considered complementary for any precious metals exploration program
in arid and semi-arid regions (Sabins, 1999; Abdelsalam et al., 2000; Ramadan et al., 2001;
Kusky and Ramadan, 2002; Pour and Hashim, 2011, 2012 a,b, 2013). However, in tropical
environments, the application of remote sensing data for geological structure mapping has
been much more limited (Hashim et al., 2013), because of the persistent cloud coverage,
limited bedrock exposures, and vegetation. Preliminary studies by Pour et al. (2013 a,b) and
Pour and Hashim (2014) in the Bau gold mining district, Sarawak, East Malaysia, on the
island of Borneo demonstrated the applicability of satellite remote sensing imagery for
mineral exploration in tropical environments. These studies suggest that more investigation is
required to test the application of remote sensing data for locating potential gold exploration
targets in the Central Gold Belt (CGB) of the Peninsular Malaysia. Many gold mines and
prospects in the Peninsular Malaysia are located in the Central Gold Belt (CGB) (Scrivenor,
1931; Yeap, 1993; Arffin and Hewson, 2007; Arffin, 2012). Gold mineralization in this belt
is structurally controlled. The CGB is a highly potential region for prospecting gold
exploration targets along the major lineament structures using remote sensing technology. To
date, this gold belt has not been tested using recent generations of very high resolution
satellite remote sensing imagery.
Synthetic Aperture Radar (SAR) is an active microwave remote sensing system which can
acquire data regardless of day or night, cloud, haze or smoke over a region. SAR image data
provide information different from that of optical sensors. Clouds are reasonably transparent
to microwave providing measurements with almost any weather conditions. SAR images
have been used for geological mapping in glaciated and vegetated terrain, structural geology
investigations related to the search for mineral deposits and hydrocarbon traps, and studies of

ACC
EPTE
D M
ANU
SCR
IPT
ACCEPTED MANUSCRIPT
3
geologic hazards (Singhroy, 1992; Abdelsalam and Stern, 2000; Abdelsalam et al., 2000;
Ramadan et al., 2001; Kusky and Ramadan, 2002; Thurmond et al., 2006; Zandbergen, 2008;
Raharimahefa and Kusky, 2009; Pour et al., 2013 a,b; Pettinato et al., 2013; Pour and
Hashim, 2014). Radar transmits and detects radiation with wavelengths between 2.0 to 100
cm, but typically at 2.5-3.8 cm (X-band), 4.0-7.5 cm (C-band), and 15.0-30.0 cm (L-band)
(Spatz, 1997; Woodhouse, 2006; Campbell, 2007). Longer wavelengths optimize the depth of
investigation of the radar signal and allow radar to have complete atmospheric transmission.
Generally, the approximate depth of penetration is equal to radar’s nominal wavelength. L-
band can observe the forest’s underlying surface features as well as the canopy because of its
penetration capability (Henderson and Lewis 1998; Abdelsalam et al., 2000; Shimada and
Isoguchi, 2002). Thus, in tropical environments, L-band SAR data provide the possibility of
obtaining more useable geological structure information from the ground than shorter
wavelengths.
This research presents a remote sensing approach for geological structure mapping in tropical
environments. The objectives of this study are: (1) to map structural elements associated with
gold mineralization in the Central Gold Belt of the Peninsular Malaysia using the Phased
Array type L-band Synthetic Aperture Radar (PALSAR) satellite remote sensing data at both
regional and local scales; (2) to establish a cost-effective exploration approach for
prospecting epithermal and polymetallic vein-type mineralization in tropical environments
using PALSAR data.

ACC
EPTE
D M
ANU
SCR
IPT
ACCEPTED MANUSCRIPT
4
2. Geological setting
Peninsular Malaysia forms an integral part of the Southeast Asian continental core of
Sundaland and comprises two tectonic blocks/terranes, the Sibumasu Terrane in the west and
the Sukhothai Arc (East Malaya Block) in the east, which were assembled by the Late
Triassic (Metcalfe, 2011, 2013a,b). Sibumasu and East Malaya are separated by the Bentong-
Raub Suture Zone, which includes a tectonic mélange with ribbon-bedded cherts, schists, and
minor ophiolites that represent Palaeo-Tethys remnants (Hutchison, 1975, 2009; Metcalfe,
2000). More than 90% of the plutonic rocks in the Peninsular Malaysia are granitic. The
granitoids can be divided into two belts, a West Malaya Main Range S-Type group of
granitoids that yield Late Triassic to earliest Jurassic, and an eastern Malaya group of
dominantly I-Type granitoids with a range of ages from early Middle Permian to early Late
Triassic (Sevastjanova et al., 2011; Searle et al., 2012).
Based on stratigraphical and structural differences the Peninsular Malaysia is divided into
three geological belts: the Eastern Tin Belt, Central Gold Belt, and Western Tin Belt that are
bounded by major fault zones (Hutchison, 1975; Khoo and Tan, 1983) (Fig. 1). The Central
Belt of the Peninsular Malaysia is well-known as the Gold Belt (Scrivenor, 1931; Yeap,
1993). The Central Gold Belt (CGB) consists mainly of Permo-Triassic, low-grade
metasediments, deep to shallow marine clastic sediments and limestone with abundant
intermediate to acid volcanics and volcaniclastics, deposited in a paleo-arc basin (Metcalfe,
2002; 2011; 2013 a,b). The belt coincides with the Bentong-Raub suture, which is a deep
rooted 13km wide north-south trending tectonic zone (Tan, 1996; Cocks et al., 2005). The
CGB is bounded by the Bentong-Raub Suture Zone to the west and the Lebir Fault Zone to
the East (Campi et al., 2002). The north-south trending Bentong-Raub Suture extends from
Thailand through Raub and Bentong to the east of Malacca, Peninsular Malaysia (Fig. 1).

ACC
EPTE
D M
ANU
SCR
IPT
ACCEPTED MANUSCRIPT
5
This suture represents the main Palaeo-Tethys Ocean that was destroyed by collision between
the Sibumasu and Sukhothai continental terranes of Southeast Asia (Matcalfe, 2000).
Major faults in the Peninsular Malaysia strike N-S, NNW-SSE, NW-SE, WNW-ESE, E-W,
ENE-WSW and NE-SW and have undergone complex repeated movements, including
microstructure evidence for both sinistral and dextral movements along many strike-slip
faults (Shuib, 2009). Dating of faults in the Peninsular Malaysia is largely poorly constrained
but major N-S trending faults are interpreted as the earliest and are related to oblique
amalgamation of Sibumasu and the Sukhothai Arc in the Permian-Triassic. NNW-SSE major
dextral faults are interpreted to be Late Triassic-Jurassic and to have resulted in the opening
of the Jurassic-Cretaceous continental pull-apart basins. Reactivation of these faults as
sinistral strike-slip faults occurred in the Late Cretaceous, synchronous with emplacement of
granitoids, and deformation of Jurassic-Cretaceous red bed sequences (Shuib, 2009). Further
reactivation of these faults occurred in the Cenozoic (Replumaz and Tapponnier, 2003).
Gold mineralization in the CGB is associated with the accretionary prism along the North-
south trending terrain boundary of the Bentong-Raub Suture zone. Most of the gold
mineralization took place within a low-grade meta-sedimentary-volcanic terrain formed
during the collision of the Sibumasu block underneath the East Malaya (Sukhothai) block
through the Permian to late Triassic (Hutchison, 1996; Metcalf, 2000, Arffin and Hewson,
2007). A collision structural overprint has generated major N-S and NW-SW trending left
slip faults, and dilational Riedel and subsidiary shear zones and numerous splays associated
with these faults (Hewson and Crips, 1992; Tjia and Zaitun, 1985).
The Bentong-Raub suture has accommodated considerable strike-slip movement. This has
resulted in numerous splays running along the CGB (Metcalf, 2000, 2013b). The formation of
the Bentong-Raub suture zone was probably coeval with the emplacement of major faults.
The ore fluids ascended and deposited in structurally favourable traps, such as shear zones,

ACC
EPTE
D M
ANU
SCR
IPT
ACCEPTED MANUSCRIPT
6
saddle reefs, and fold hinges during metamorphism and deformation (Yeap, 1993). Major
gold mineralization is observed along the steeply dipping faults and hosted in sandstone,
carbonaceous shale, tuffaceous siltstone, and tuffaceous conglomerate (Arffin and Hewson,
2007; Makoundi, 2012). These structures host many quartz-gold lodes within the CGB
(Arffin, 2012). Major primary gold mineralization patterns within the CGB can be grouped
into two types (I and II). The type I mineralization consist of large quartz reefs/lodes and
parallel swarms of veins that traverse metasediments and granite. Type II mineralization
exhibits a broader variety of gold mineralization styles such disseminated gold with
stockwork quartz veins affiliated with intrusive bodies, and volcanogenic exhalative
sulphides within a shear zone system (Ariffin and Azizi, 1995; Pereira, 1993; Pereira et al.,
1993). The ore mineral assemblages in both types include gold, pyrite, arsenopyrite,
chalcopyrite, pyrrhotite, sphalerite, galena, geochronite (Makoundi, 2012).
3. Materials and Methods
3.1 PALSAR
Phased Array type L-band Synthetic Aperture Radar (PALSAR), onboard the Advanced Land
Observing Satellite (ALOS), was launched on January 24, 2006 by an H-IIA rocket from
Tanegashima Space Center. It was developed by Japanese Ministry of Economy, Trade and
Industry (METI) as a joint effort with Japan Aerospace Exploration Agency (JAXA).
PALSAR is an active microwave sensor for all-weather conditions observation and operable
both day and night (Igarashi, 2001; Rosenqvist et al., 2004; ERSDAC, 2006). It has L-band
synthetic aperture radar with multi mode observation function (Fine mode, Direct downlink,
ScanSar mode, and Polarimetric mode) of multi polarization configuration (HH, HV, VH,

ACC
EPTE
D M
ANU
SCR
IPT
ACCEPTED MANUSCRIPT
7
and VV), variable off-nadir angle (9.9 to 50.8 degrees), switching spatial resolution (10 m, 30
m, 100 m for Fine, Polarimetric, and ScanSar modes, respectively) and swath width
observation (30 km, 70 km, and 250-350 km for Polarimetric, Fine and ScanSar modes,
respectively) (Igarashi, 2001; ERSDAC, 2006).
PALSAR data can be used in specific fields, including (i) land area basin mapping
(geological structural analysis of target areas); (ii) coastal area basin mapping; (iii)
monitoring of environments and natural disasters; and (iv) research and development for the
processing and application of multi polarimetric SAR data (geological structural analysis
during the first stage of resource exploration) (ERSDAC, 2006).
Generally, fine (high resolution) mode is the most frequently used observation mode with a
ground resolution of up to 7m, which enables detailed observation of the area of interest. Its
maximum ground resolution of 7m is one of the highest for a Synthetic Aperture Radar
(SAR) loaded on a satellite. There are two kinds of observation modes; namely one is the
observation mode by single polarization of HH or VV (FBS: High Resolution Mode, Single
polarization), and the other is the observation mode by dual polarization of HH+HV and
VV+VH (FBD: High Resolution Mode, Dual polarization). PALSAR can also
simultaneously receive horizontal and vertical polarization per each polarized transmission,
which is called multi polarimetry. In addition, PALSAR can switch from horizontal to
vertical polarization and vice versa at respective transmission pulse, enabling four
polarizations by double simultaneous polarization, a function called full polarimetry
(ERSDAC, 2006).
High resolution (fine mode), full polarimetry (multi-polarization mode), off nadir pointing
function and other functions of PALSAR improved the accuracy of analyzing geological
structure, distribution of rocks, and is expected to be used for the first stage of ore deposits
exploration (ERSDAC, 2006). Consequently, PALSAR data are useful for geological

ACC
EPTE
D M
ANU
SCR
IPT
ACCEPTED MANUSCRIPT
8
structural analysis associated with epithermal or polymetallic vein-type mineralization
especially in tropical regions, where optical sensors often fail due to bad weather conditions.
3.2 Data for the study area
In this investigation, two Fine Mode Dual polarization and two Polarimetric Mode Quad
polarization Level 4.1 PALSAR scenes were obtained from the Earth and Remote Sensing
Data Analysis Center (ERSDAC) Japan (http://gds.palsar.ersdac.jspacesystems.or.jp/e/) for
the Central Gold Belt (CGB) of the Peninsular Malaysia. The fine mode scenes used in this
study contain high accuracy orbit data with good quality, 12.5 m pixel spacing, 16 bits per
pixel, 83km observation width in range direction, 81km observation width in azimuth
direction, incident angle 38.7◦, and off-nadir angle of 34.3◦. Polarimetric mode scenes have
high accuracy orbit data with good quality, 25 m pixel spacing, 16 bits per pixel, 44km
observation width in range direction, 73km observation width in azimuth direction, incident
angle 24.0◦, and off-nadir angle of 21.5◦. Both datasets are geo-reference and geo-coded. It
should be noted that the PALSAR images were acquired during the dry seasons. Table 1
shows the characteristics of PALSAR data used in this study.
3.3 Data pre-processing
Level 4.1 is the product of the high resolution mode by dual polarization or the product of
polarimetry mode (or quad polarization). It is derived from processing Level 1.1 data with
respect to dual polarization data of high resolution mode and quad polarization data of
polarimetry mode. The processing includes: (a) range compression using Fast Fourier
Transform (FFT); (b) secondary range compression using range migration compensation; (c)
range migration curvature corrections; (d) azimuth compression; (e) multi-look processing;

ACC
EPTE
D M
ANU
SCR
IPT
ACCEPTED MANUSCRIPT
9
and (f) conversion from coordination system from slant range to ground range (for only Geo-
coded data). It consists of values for cross products (e.g; HH*HH, HH*HV) based on
observed polarizations (HH, HV, VV and VH). Furthermore, these are the data with a slant
range, which have calculated cross-products capable of making Stoke’s matrices to
effectively utilize polarization data. The data are Geo-reference and Geo-coded data, which
enables the images to be oriented so that the north direction of the observed image
corresponds to the upper direction of the image. With Geo-coded data, slant range is
converted to ground range (Gelautz et al., 1998; Franceschetti and Lanari, 1999; Wise, 2002;
ERSDAC, 2006; Campbell, 2007; Marino, 2012).
Radar images are inherently corrupted by speckle. The presence of speckle in an image
reduces the detectability of ground targets, obscures the spatial patterns of surface features,
and decreases the accuracy of automated image classification. Therefore, it is necessary to
treat the speckle by filtering the data before it can be used in various applications (Lee and
Jurkevich, 1994; Sveinsson and Benediktsson, 1996; Sheng and Xia, 1996).
To facilitate tracing the structural patterns and investigate the relationship between structural
setting and gold mineralization in the Central Gold Belt (CGB) of the Peninsular Malaysia,
Level 4.1 PALSAR data required to be filtered for speckle reduction. Adaptive filters remove
radar speckle from images without seriously affecting the spatial characteristics of the data
(Lopes et al., 1990; Shi and Fung, 1994; Research Systems, Inc., 2008). Therefore, adaptive
filtering was applied to the Level 4.1 PALSAR data. The data were processed using the
ENVI (Environment for Visualizing Images) version 4.8 software package.
In this study, the adaptive Local Sigma filter was selected and applied to accomplish speckle
reduction and preserving both edges and features. The Local Sigma filter uses the local
standard deviation computed for the filter box to determine valid pixels within the filter

ACC
EPTE
D M
ANU
SCR
IPT
ACCEPTED MANUSCRIPT
10
window. It replaces the pixel being filtered with the mean calculated using only the valid
pixels within the filter box (Eliason and McEwen, 1990). 7*7 filter size in pixels was applied.
A default value of 1.000 was used for the Sigma Factor field. ENVI uses the Sigma Factor to
determine which pixels are valid by calculating a minimum and maximum pixel value based
on the number of standard deviations (sigma) entered and the local statistics. The pixel being
filtered will be replaced by the average of surrounding valid pixels (Research Systems, Inc.,
2008). Local Sigma filter showed favorable output in preserving edges and features as well as
speckle suppression in this study, and it seems to be more practical than other adaptive filters
for geological structural analysis.
3.4 Data processing
Directional filtering technique was applied to the Local Sigma resultant image for detailed
lineament extraction and edge enhancement. It is a spatial domain filtering technique and
derivative edge enhancement filter that selectively enhances image features having specific
direction components (gradients) (Haralick et al., 1987; Carr, 1995; Sabins, 1996; Vincent,
1997). Edge enhancement delineates the edge and makes the shapes and details comprising
the image more conspicuous. It can be used in geological applications to highlight faults and
lineaments. Directional filter is used for producing artificial effects suggesting tectonically
controlled linear features (Drury, 1986; Suzen and Toprak, 1998; Kavak and Cetin, 2007;
Amri et al., 2011). It is a straightforward method for extracting edges in the spatial domain
that approximates the first derivative between two adjacent pixels. The algorithm produces
the first difference of the image input in the horizontal, vertical, and diagonal directions
(Jensen, 2005). As a result, many additional edges of diverse orientations are enhanced. Edge
enhancement is performed by convolving the original data with a weighted mask or kernel.
Chavez and Bauer (1982) suggested that the optimum kernel size (3*3, 5*5, 7*7, etc)

ACC
EPTE
D M
ANU
SCR
IPT
ACCEPTED MANUSCRIPT
11
typically used in edge enhancement is a function of the surface roughness. Blurring becomes
more severe as the size of the kernel increases, especially at the edges of objects (Jensen,
2005).
Directional filters were used to enhance specific linear trends in the Local Sigma resultant
images. Four principal Directional filters: N-S, E-W, NE-SW, and NW-SE with a 7*7 kernel
size were applied (Table 2). Filters were chosen to highlight the main lineament directions in
the Central Gold Belt (CGB) of the Peninsular Malaysia. Directional filter angles were
adjusted as N-S: 0◦, E-W: 90◦, NE-SW: 45◦, and NW-SE: 135◦. North (up) is zero degrees and
the other angles are measured in the counterclockwise direction. 7*7 kernel matrix was
selected to enhance semi-smooth and smooth/rough features. Image Add Back value was
entered 60%. The Image Add Back value is the percentage of the original image that is
included in the final output image. This part of the original image preserves the spatial
context and is typically done to sharpen an image.
3.5 Fieldwork
A Global Positioning System (GPS) survey was carried out using a Garmin® MONTANA®
650 to provide accurate locations for structural features associated with gold mineralization in
the study area. Field view and outcrop photographs were taken of the geomorphology,
hydrothermal alteration areas and structural elements. Additionally, image processing results
were compared with the mineral distribution map of the Peninsular Malaysia (1:500,000
scale) (Geological Survey Malaysia, 1988).

ACC
EPTE
D M
ANU
SCR
IPT
ACCEPTED MANUSCRIPT
12
4. Results and discussion
4.1 Structural mapping of Bentong-Raub Suture Zone
PALSAR polarimetry observation data used in this study cover the southeastern part of
Bentong-Raub Suture Zone. They were analyzed to illustrate the major lineaments trend and
accentuate the tectonic structures of the region. Polarimetric mode observation function of
PALSAR data has appropriate characteristics for structural mapping at a regional scale. It is
possible to produce synthesized color images by allocating Red-Green-Blue (RGB) color
combination and placing them on each polarization data that are obtained by multi-
polarization configuration (HH, HV, VH, and VV). RGB color-composite produces an image
that depicts surface roughness associated with geological structures and lithology.
In this study, Local Sigma resultant images with different polarization configuration were
assigned to RGB color-composite to provide visual interpretation of the Bentong-Raub
Suture Zone. HH polarization image was assigned to red, HV polarization image was
assigned to green, and VV polarization image was assigned to blue. Figure 2 shows RGB
color-composite image generated from PALSAR polarimetry observation data. Structural
trends of the Bentong-Raub Suture Zone and collision and compressional structures in the
Cameron Highlands are identified. Main orientations in the Bentong-Raub Suture Zone are
N-S, NE-SW, and NW-SE. Water bodies appear black (south-western part of the image) and
wet lands as mauve color (Fig. 2). Smooth surfaces such as calm water bodies appear dark in
radar images due to reflection. The radar signal reflects away from the receiving antenna with
an angle equal to that of the incident angle. In this case no returning radar signal will be
detected in the receiving antenna (Abdelsalam, 2000, Thurmond et al., 2006). Figure 3 shows

ACC
EPTE
D M
ANU
SCR
IPT
ACCEPTED MANUSCRIPT
13
a panoramic view of the topographic expression of collision and compressional structures in
the Cameron Highlands.
For detailed mapping of lineament structures in the Bentong-Raub Suture Zone, Directional
filters were applied to HH, HV, VH, and VV polarization images. It seems that HV
polarization is more suitable for lineament extraction and edge enhancement than other
polarization images. Geological structures are more recognizable after directional filtering in
the HV polarization image. Therefore, RGB color-composite was allocated to N-S, NE-SW,
and NW-SE (R: 0◦, G: 45◦, B: 135◦) with filtering directions derived from the HV polarization
image (Fig. 4).
Two dominant directions can easily be identified, namely, N-S and NE-SW sets of
lineaments (Fig. 4). More subtle lineaments strike approximately E-W and NW-SE. The
continuous N-S striking lineament in the central to eastern part of the image corresponds to
the boundary of the Bentong-Raub Suture Zone. N-S trending structures of the Bentong-Raub
Suture Zone are apparent in Figure 4. The collision zone and compressional structures appear
clearly in the Cameron Highlands. Generally, most of the lineaments are clustered in the
western part of the image. These lines mostly strike NNE.
PALSAR fine observation data were processed using Directional filters to map structural
elements associated with known gold deposits in the Kuala Lipis region, Pahang and to
identify areas along major lineaments in the Kelantan state that are prospective for ore
deposits. Fine observation data have suitable spatial resolution (10m) and a swath width
(70km), which enable detailed geological structural analysis of the study area at both regional
and district scales.
ACC
EPTE
D M
ANU
SCR
IPT
ACCEPTED MANUSCRIPT
14
4.2 Structural mapping of goldfields in Kuala Lipis, Pahang
PALSAR fine observation scene covering many of the gold mining districts in Kuala Lipis
region in the state of Pahang was selected for detailed analysis of structural features
associated with known gold deposits. It covers the eastern part of the Bentong-Raub Suture
Zone and the central part of the CGB. Panjom (101◦ 58′ 58″ E, 4◦ 08′ 27″ N), Buffalo reef
(101◦ 47′ 11″ E, 4◦ 15′ 59″ N), Selinsing (101◦ 47′ 38″ E, 4◦ 14′ 57″ N), Rubber hill (101◦ 47′
55″ E, 4◦ 14′ 38″ N), Kechau-Tui (101◦ 58′ 49″ E, 4◦ 16′ 27″ N) and Tersang (101◦ 51′ 96″ E,
4◦ 04′ 81″ N) mines are located in this PALSAR scene. Figure 5 shows the district-scale
geological map of the selected study area.
Major gold mineralization is observed along the steeply dipping faults. Favorable settings for
high-grade gold veins are the contact between tonalite and carbonaceous sedimentary rocks,
especially where the latter are carbonaceous and/or strata are tightly folded or intensely
faulted (Ariffin and Hewson, 2007). Fillies (2000) highlighted fold hinges as particularly well
mineralized sites.
Directional filtering was implemented to the PALSAR data for tracing structural elements in
the selected spatial scene covering the Panjom, Buffalo reef, Selinsing, Rubber hill, Kechau-
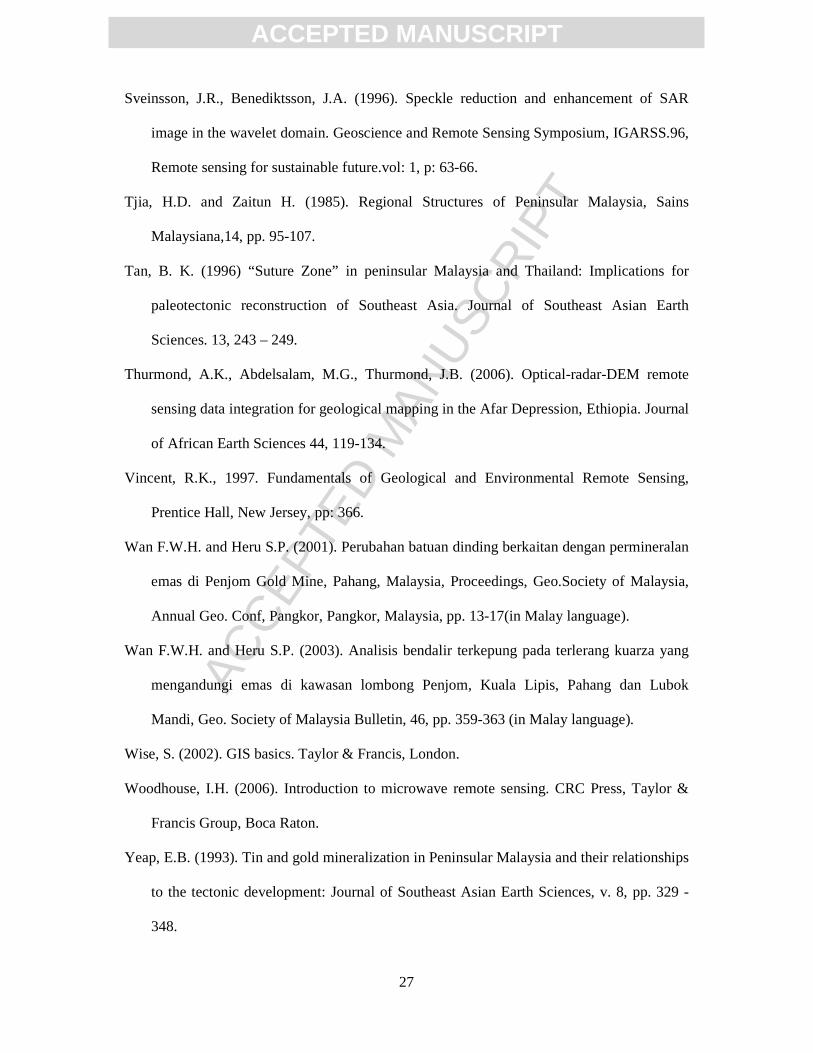
Tui and Tersang goldfields. Figure 6 shows the RGB results for N-S, NE-SW, and NW-SE
(R: 0◦, G: 45◦, B: 135◦) filtering directions applied to the HV image. The above mentioned
Directional filters have been selected for RGB color application because NE-striking thrusts,
NS-striking normal faults and NW-striking strike-slip faults are the most important structural
elements for gold exploration in the CGB (Ariffin and Hewson, 2007; Ariffin, 2012).
Lineaments and form-lines are detected (Fig. 6), including the long lineaments and short
lineaments that form linked systems with longer lineaments. The western and northern parts
of the images exhibit longer and more lineaments than in the eastern part. Two major trends

ACC
EPTE
D M
ANU
SCR
IPT
ACCEPTED MANUSCRIPT
15
N and NE are mainly present in the western part of the image. The central and eastern parts
of the image contain lineaments that strike NE and NW (Fig. 6). Lineaments mapped in the
northern and central parts of the image express several fold systems as curvilinear structures.
Lineaments associated with streams are interpreted to be fracture or fault controlled in the
central north part.
N-S and NE-SW trending lineament systems are extensive in the region. Most longer
lineaments strike N-S. N-S trending, normal-slip faults parallel to the Bentong-Raub Suture
Zone trend are defined by a prominent west facing fault escarpment. This N-S trend is similar
to the orientation of the Bentong-Raub Suture Zone (Fig. 6). Some NW trending lineaments
are associated with normal faults. In the radar image, strike-slip faults mark sharp boundaries;
the planar fabric on either side is either sharply truncated or sheared (Abdelsalam et al.,
2000).
Most of the known gold deposits are located along splay faults in the CGB, which are
confined within brittle-ductile share or brecciated zones (Yeap, 1993; Ariffin and Hewson,
2007). Penjom gold deposit is located along splay faults. The Kelau-Karak fault (normal) is
one of the major faults running across the Penjom goldfield that controls major plutonic
emplacements (Tjia and Zaitun, 1985). Localized distribution of plutons is caused by faulting
and folding, and the Penjom thrust has a NE-SW strike and southerly dip within the deposit
(Ariffin, 2007). Major gold mineralization took place within the footwall of this thrust
(Flindell, 2003). The Kelau-Karak fault and Penjom thrust are detected in the south-eastern
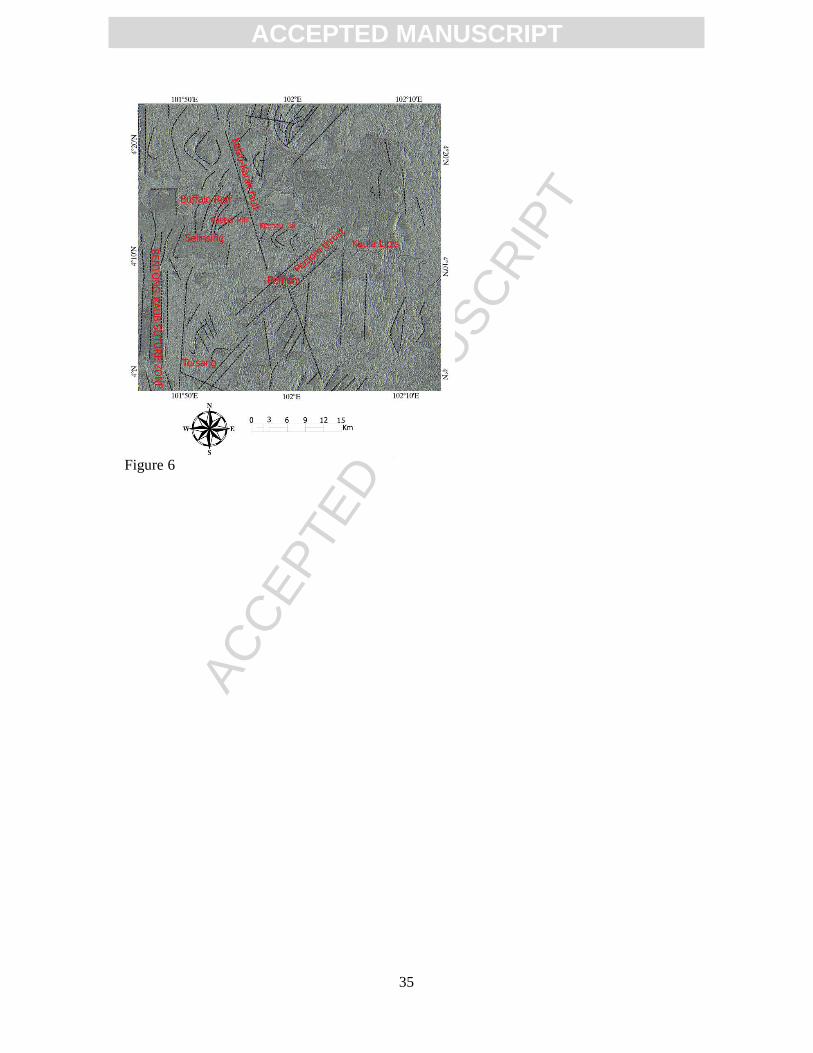
part of the image (Fig. 6). A regional view of the open-pit quarry of Penjom is shown in
Figure 7. The Penjom thrust is the dominant feature controlling the distribution of ore at
Penjom and strikes NE (035◦) and dips to the southwest (30◦-40◦) (Jasmi, 2007).
The stratigraphic sequence of sedimentary rocks at Penjom strikes N-S and dips moderately
to the east (Fig. 8), which coincides with the regional N-S strike and with the trend of

ACC
EPTE
D M
ANU
SCR
IPT
ACCEPTED MANUSCRIPT
16
granitoid bodies. At Penjom goldfield, the lateral faults and shear zones are oriented in the N-
S and NE-SW. Most high angle faults that strike N355◦-005◦E or N-S and N300◦-310◦E or
WNW-ESE show right-lateral slip. Whereas, faults that strike N035◦-045◦E or NE-SW
indicate left-lateral slip (Heru et al., 2000). Lineaments that are spatially associated with
alteration zones are likely target areas for gold mineralization. Three dominant types of
alteration were recognised in the Penjom gold deposit, including silicification, argillic
alteration (illite) and chloritisation. Limonitic iron staining is also present (Wan and Heru,
2001, 2003). Figure 9 shows the association between hydrothermal alteration zones,
lineaments, and gold mineralization in the Penjom ore deposit.
The other major goldfields featured in Figure 6 are the Buffalo reef, Selinsing, and Tersang.
They are located along N-S trending regional structures in the NW and SW parts of the image
(Fig. 6). N-S and NE-SW trending faults and fold systems are obviously manifested in the
gold mining districts (Fig. 6).
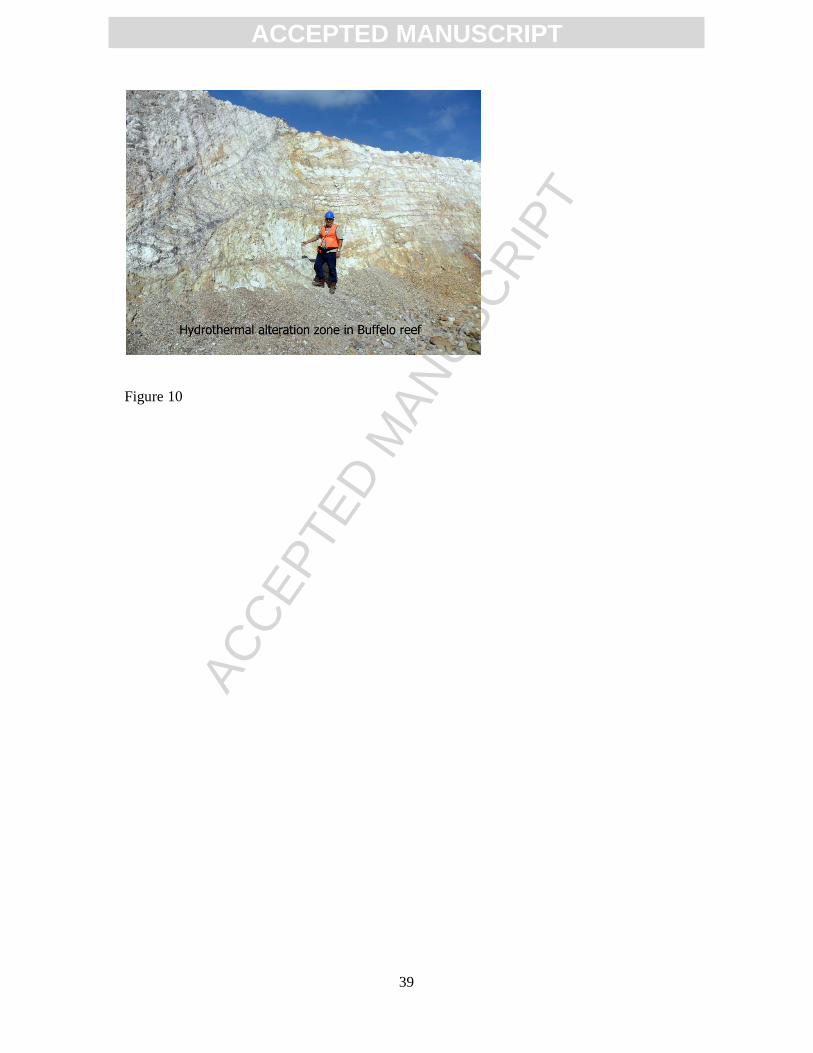
The Buffalo reef lies close to the eastern flank of the Bentong-Raub Suture Zone. Gold
mineralization in Buffalo reef is mainly confined to the marine clastic rock sequence, which
mainly strikes in N-NE and dips south (Pereira, 1993; Ariffin, 1995). Significant gold
mineralization is commonly hosted by a N-S trending sheared zone that cuts metamorphosed,
brecciated and hydrothermally altered calcareous graphitic shale (Ariffin, 2012). Figure 10
shows hydrothermally altered calcareous graphitic shale associated with gold mineralization
in the Buffalo reef ore deposit.
Selinsing is located along the north striking Bentong-Raub Suture Zone, south of the Buffalo
reef (Figs. 5 and 6). Figure 11 shows the Selinsing open-pit. Gold mineralization areas are
associated with N-S and NNE orientated faults and associated hydrothermal alteration zones
(Mohd et al., 2009; Makoundi, 2012 (Fig. 12)).

ACC
EPTE
D M
ANU
SCR
IPT
ACCEPTED MANUSCRIPT
17
Structural and textural investigations have shown two sets of NNW-SSE and NE-SW
oriented mineralised veins at Tersang deposit (Fig .6). The argillic alteration in the Tersang
deposit is characterised by sericite, illite, and montmorillonite (Fig 13). Sericite alteration is
located proximal to the high grade zone (Makoundi, 2012).
4.3 Prospecting potential areas in Kelantan state
PALSAR fine observation data scene that covers northern parts of the Bentong-Raub Suture
Zone and the CGB were processed to map geological structures and identify prospective
areas for gold mineralization along major lineaments in the Kelantan state. Gold
mineralization is typically associated with hydrothermal quartz vein systems, skarns, and
volcanogenic massive sulfides in the northern part of the CGB in Kelantan state. Structural
element is one of the main controls on gold mineralization in this region (Ariffin, 2012).
Figure 14 shows a selected spatial subset scene covering northern parts of the Bentong-Raub
Suture Zone and CGB in the Kelantan state. RGB color combination was assigned for N-S
(R: 0◦), NE-SW (G: 45◦), and NW-SE (B: 135◦) directional filters. The HV polarization
PALSAR image was selected to perform directional filtering. The N-S orientation of the
Bentong-Raub Suture Zone is detected in the western part of the image (Fig. 14). The
structural lines with NE-SW and NW-SE directions are in accordance with the tectonic
framework of the study area. Major N-S and NE-SW orientations and strike-slip faults with
sharp boundaries are revealed in Figure 14. Several small faults and fractures with a NE-SW
trend are clearly visible in the south and central part of the image. However, few small faults
with N-S and NW-SE trends are observable in the north and eastern part of the image.
Curvilinear features and some curving faults with NE-SW and NW-SE trends are apparent in

ACC
EPTE
D M
ANU
SCR
IPT
ACCEPTED MANUSCRIPT
18
the image especially in the central part (Fig. 14). These lineaments and curvilinear structures
have great potential for hosting quartz-gold lodes.
Major gold deposits are located along the N-S Bentong-Raub Suture Zone in the CGB.
Consequently, similar N-S trending structures are prospective for gold mineralization in the
CGB. However, extensive deformation associated with the intersections of N-S, NE-SW,
NNW-SSE and ESE-WNW brittle-ductile shear zones also represent favorable sites for gold
mineralization at the district scale. Particularly favorable structural elements include the
presence of fault-related rocks (cataclasite and mylonite) and coincident hydrothermal
alteration. Curvilinear features are also important for gold prospecting. Fold hinges are
favorable sites where they are associated with intensely faulted zones in contact between
tonalite and carbonaceous sedimentary rocks. Consequently, the intersections of circular
features, lineaments and hydrothermal alteration zones are important indicators for gold
exploration in the CGB.
5. Conclusions
Results of this investigation provide an exploration approach using PALSAR data to map
structural elements associated with gold mineralization along the Bentong-Raub Suture Zone
in the Central Gold Belt (CGB) of the Peninsular Malaysia. Structural investigation has
shown sets of N-S, NE-SW, NNW-SSE and ESE-WNW mineralized trends associated with
fault-related rocks and hydrothermal alteration zones. These main fault trends are intersected
by many shear or lateral fault zones. Of particular importance to exploration are shear zone,
mylonite, cataclasite and felsic intrusive with coincident hydrothermal alteration. The results
of this study demonstrates the usefulness of PALSAR satellite remote sensing data for

ACC
EPTE
D M
ANU
SCR
IPT
ACCEPTED MANUSCRIPT
19
mapping regional and district structural elements associated with epithermal and polymetallic
vein-type mineralization in tropical environments.
Acknowledgements This study was conducted as a part of Potential Academic Staff (PAS) scheme (Vote no: Q.J130000.2709.00K72) granted by Universiti Teknologi Malaysia (UTM). We acknowledge the assistance of the Specific Resources Sdn Bhd (J.Resources) Penjom gold mine and Selinsing gold mine Sdn Bhd companies for their logistic support during the field investigations and ground truth data collection. The authors would like to express their sincere to Zakaria Endut, Norfarulrafiq Ghazali and geology department of Penjom gold mine for their assistance in various other ways during this research. We also would like to express our great appreciation to Prof. Dr. Franco Pirajno and the anonymous reviewers for their very useful and constructive comments and suggestions for improvement of this manuscript. References Abdelsalam, M.G., Robinson, C., El-Baz, F., Stern, R. (2000). Application of orbital imaging
radar for geologic studies in arid regions: The Saharan Testimony. Photogrammetic
engineering and remote sensing 66, 717-726.
Abdelsalam, M. and Stern, R. (2000). Mapping gossans in arid regions with Landsat TM and
SIR-C images, the Beddaho Alteration Zone in northern Eritrea. Journal of African Earth
Sciences, 30(4), 903-916.
Amri, K., Mahdjoub, Y., Guergour, L. (2011). Use of Landsat 7 ETM+ for lithological and
structural mapping of Wadi Afara Heouine area (Tahifet–Central Hoggar, Algeria).
Arabian Journal of Geosciences 4, 1273–1287.
Ariffin, K.S. (1995). Geology and Mineralogy of the Penjom Gold Mineralization Prospect.
(unpublished M.Sc. thesis) Universiti Sains Malaysia, 176pp.
Ariffin, K.S., and Azizi, M.A.K. (1995). An overview of the mineralization and
mineralogical characteristic of the goldfields from Central Belt of Peninsular Malaysia,

ACC
EPTE
D M
ANU
SCR
IPT
ACCEPTED MANUSCRIPT
20
Proceeding of the International Conference on Geology, Geotechnology and Mineral
Res. of Indochina, Khon Khean, Thailand, pp. 188-199.
Ariffin, K.S., Hewson, N.j. (2007). Gold-related sulfide mineralization and ore genesis of the
Pejom gold deposit, Pahang, Malaysia. Resource Geology, 57(2), 149-169.
Ariffin, K.S. (2007). Low grade mesothermal gold deposit, characteristics of the Penjom gold
deposit, Kuala Lipis, Pahang, Malaysia: Warta Geologi, v. 33, No. 3,pp. 102 - 110.
Ariffin, K.S. (2012). Mesothermal lode gold deposit Central Belt Peninsular Malaysia. Earth
Sciences. ISBN: 978-953-307-861-8.
Campbell, J.B. (2007). Introduction to remote sensing. The Guilford Press, New York.
Campi, M.J., Shi, G.R., Leman, M.S. (2002). The Leptodus shale of central peninsular
Malaysia: distribution, age and palaeobiogeographical affinities. Journal of Asian Earth
Sciences 20, 703 – 717.
Carr, J.R. (1995). Numerical analysis for the geological science. Prentice-Hall, Inc., pp:592.
Chavez, P.C. and Bauer, B. (1982). An automatic optimum kernel-size selection technique
for edge enhancement. Remote Sensing of Environment 12, 23-38.
Cocks , L. R. M. , Fortey , R. A. and Lee , C. P. (2005). A review of lower and middle
palaeozoic biostratigraphy in west peninsular Malaysia and southern Thailand in its
context within the Sibumasu Terrane. Journal of Asian Earth Sciences 24, 703 – 717.
Drury, S. (1986). Remote sensing of geological structure in temperate agricultural areas.
Geological Magazine, 123, 113-121.
Eliason, E.M. and McEwen, A.S. (1990). Adaptive Box Filters for Removal of Random
Noise from Digital Images. Photogrammetric Engineering & Remote Sensing, April,
1990, V56 No. 4, p. 453.
Earth Remote Sensing Data Analysis Center (ERSDAC) (2006). PALSAR user’s guide. 1st
Edition. March 2006.

ACC
EPTE
D M
ANU
SCR
IPT
ACCEPTED MANUSCRIPT
21
Fillis, P. (2000). Penjom resource model. Unpublished internal report for Specifi c Resources
Sdn. Bhd. Kuala Lipis, Specific Resources, Pahang, Malaysia, 4p.
Flindell, P. (2003). Avocet Mining – Exploration and Development Across Central and
Southeast Asia, Australia Institute of Geoscientists (AIG), Mineral Exploration
Discussion Group (SMEDG). 10 Oct., Sydney, 8pp.
Franceschetti, G., Lanari, R. (1999). Synthetic aperture radar processing. CRC Press, Boca
Raton.
Gelautz, M., Frick, H., Raggam, J., Burgstaller, J., Leberl ., F.( 1998). SAR image simulation
and analysis of alpine terrain. ISPRS Journal of Photogrammetry & Remote Sensing, 53,
17-38.
Geological Survey Malaysia, (1988). Mineral distribution map of Peninsular Malaysia. 8TH
Edition. Published by the director-general Geological Survey, Malaysia (YIN EE
HENG). Scale 1:500,000.
Haralick, R.M., Sternberg, S.R., and Zhuang, X. (1987). Image Analysis Using Mathematical
Morphology. IEEE Transactions on Pattern Analysis and Machine Intelligence, Vol.
PAMI-9, No. 4, July 1987, pp. 532-550.
Hashim, M., Ahmad, S., Johari, M.A.M., Pour, A.B. (2013). Automatic lineament extraction
in a heavily vegetated region using Landsat Enhanced Thematic Mapper (ETM+)
imagery. Advances in Space Research 51, 874-890.
Henderson, F.M., and Lewis, A.J. (1998). Principles and applications of imaging radar.
Manual of Remote Sensing (3rd ed.). John Wiley and Sons, New York.
Heru, S.G., Wan Fuad, W.H., and Ibrahim, A. (2000). Palaeostress influence in controlling
the gold mineralisation in Penjom area, Peninsular Malaysia, Geoscience Journal, 4, pp.
85-90.

ACC
EPTE
D M
ANU
SCR
IPT
ACCEPTED MANUSCRIPT
22
Hewson, J.N. and Crips, D.A. (1992). Final Report Phase One Exploration Block 7,
Pahang,Malaysia, Luckfrost Limited, London (unpublished internal report).
Hutchison, C.S., (1975). Ophiolite in Southeast Asia. Geological Society of America Bulletin
86, 797–806.
Hutchison, C.S. (1996). South-East Asian Oil, Gas, Coal and Mineral Deposits. Oxford
Monographs on Geology and Geophysics 36. Clarendon Press, Oxford.
Hutchison, C.S. (2009). Tectonic evolution. In: Hutchison, C.S., Tan, D.N.K. (Eds.), Geology
of Peninsular Malaysia. University of Malaya/Geological Society of Malaysia, Kuala
Lumpur, pp. 309–330.
Igarashi, T. (2001).ALOS Mission requirement and sensor specifications. Advances in
Space Research 28(1), 127-131.
Jensen, J.R. (2005). Introductory Digital Image Processing: A remote sensing perspective.
Pearson Prentice Hall, Upper Saddle River NJ 07458. Third edition, p: 276-287.
Kavak, K.S., Cetin, H. (2007). A detailed geologic lineament analysis using Landsat TM data
of Golmarmara/Manisa region, Turkey. Journal of Earth Sciences 1(3), 145-153.
Khoo, T.T., Tan, B.K., 1983. Geological evolution of Peninsular Malaysia. In: Proceedings of
Workshop on Stratigraphic Correlation of Thailand and Malaysia. 1: Tachnical Papers.
Geological Society of Thailand & Geological Society of Malaysia, pp. 253–290.
Kusky T, M. and Ramadan, T.M. (2002). Structural controls on Neoproterozoic
mineralization in the South Eastern Desert, Egypt: an integrated field, Landsat TM, and
SIR-C/X SAR approach. Journal of African Earth Sciences, 35, 107-121.
Lee, J.S., and Jurkevich, I. (1994). Speckle filtering of synthetic aperture radar images: a
review. Remote Sensing Review. Vol: 8, pp:313-340.

ACC
EPTE
D M
ANU
SCR
IPT
ACCEPTED MANUSCRIPT
23
Lopes, A., Touzi, R., and Nezary, E. (1990). Adaptive speckle filters and scene
heterogeneity. IEEE Transactions of Geosciences and Remote Sensing. Vol: GE-28, pp:
992-1000.
Makoundi, C. (2012). Geology, geochemistry and metallogenesis of selected sediment-hosted
gold deposits in the Central Gold Belt, Peninsular Malaysia. (Unpublished M.Sc thesis)
University of Tasmania.
Marino, A. (2012). A new target detector based on geometrical perturbation filters for
Polarimetric Synthetic Aperture Radar (POL-SAR), Springer Theses, DOI: 10.1007/978-
3-642-27163-2_2. Springer-Verlag Berlin Hiedelberg 2012.
Metcalfe, I. (2000). The Bentong-Raub Suture Zone . Journal of Asian Earth Sciences. 18 ,
691 – 712 .
Metcalfe, I. (2002). Permian tectonic framework and palaeogeography of SE Asia. Journal of
Asian Earth Sciences 20, 551–566.
Metcalfe, I. (2006). Palaeozoic and Mesozoic tectonic evolution and palaeogeography of East
Asian crustal fragments: The Korean Peninsula in context. Gondwana Research 9, 24-46.
Metcalfe, I., (2011). Tectonic framework and Phanerozoic evolution of Sundaland.
Gondwana Research 19, 3–21.
Metcalfe, I. (2013a). Tectonic evolution of the Malay Peninsula. Journal of Asian Earth
Sciences. 76, 195-213.
Metcalfe, I. (2013b). Gondwana dispersion and Asian accretion: Tectonic and
palaeogeographic evolution of eastern Tethys. Journal of Asian Earth Sciences 66, 1-33.
Mohd, B.I.B., Ibrahim, A., Wan, F.W.H. (2009). The relationships of structure and
deformation to the gold mineralization in Selinsing Gold Mine, Pahang. Geological
Society of Malaysia, Bull. 55, pp. 33 – 37.

ACC
EPTE
D M
ANU
SCR
IPT
ACCEPTED MANUSCRIPT
24
Pereira, J.J. (1993). Geology, Mining and Tailing Characteristic of the Selinsing Gold mine,
Pahang, Warta Geologi, Newsletter of the Geology Society of Malaysia, Mac-April,
19(2),pp. 35-41.
Pereira, J.J. Yeap, E.B. and Ng, T.F. (1993). Application of soil geochemistry to the
detection of Sb-Au mineralization in the Buffalo Reef Area, Geological Society of
Malaysia Bulletin, 33, pp. 1-10.
Pettinato, S., Santi, E., Paloscia, S., Pampaloni, P., Fontanelli., G. (2013).The
intercomparison of X-Band SAR image from COSMO-SkyMed and TerraSAR-X
satellites: case studies. Remote Sensing, 5, 2982-2942.
Pour, B.A. and Hashim, M. (2011). Identification of hydrothermal alteration minerals for
exploring of porphyry copper deposit using ASTER data, SE Iran. Journal of Asian Earth
Sciences, 42, 1309-1323.
Pour, B.A. and Hashim, M. (2012a). The application of ASTER remote sensing data to
porphyry copper and epithermal gold deposits. Ore Geology Reviews. 44, 1-9.
Pour, B. A. and Hashim, M. (2012b). Identifying areas of high economic-potential copper
mineralization using ASTER data in Urumieh-Dokhtar Volcanic Belt, Iran. Advances in
Space Research 49, 753-769.
Pour, B.A. and Hashim, M. (2013). Fusing ASTER, ALI and Hyperion data for enhanced
mineral mapping. International Journal of Image and Data Fusion. 4, 126-145.
Pour, B. A., Hashim, M, and van Genderen. J. (2013a). Detection of hydrothermal alteration
zones in a tropical region using satellite remote sensing data: Bau gold field, Sarawak,
Malaysia. Ore Geology Reviews. 54, 181-196.
Pour, B. A., Hashim, M, Marghany. M (2013b). Exploration of gold mineralization in a
tropical region using Earth Observing-1 (EO1) and JERS-1 SAR data: a case study from

ACC
EPTE
D M
ANU
SCR
IPT
ACCEPTED MANUSCRIPT
25
Bau gold field, Sarawak, Malaysia. Arabian Journal of Geosciences. DOI
10.1007/S12517-013-0969-3.
Pour, B. A., Hashim, M. (2014). Structural geology mapping using PALSAR data in the Bau
gold mining district, Sarawak, Malaysia. Advances in Space Research, doi:
http://dx.doi.org/10.1016/j.asr.2014.02.012.
Raharimahefa, T., Kusky, T.M. (2009). Structural and remote sensing analysis of the
Betsimisaraka Suture in northeastern Madagascar. Gondwana Reseach 15, 14-27.
Ramadan,T.M., Abdelsalam, M.G., Stern, R. (2001). Mapping gold-bearing massive sulfide
deposits in the Neoproterozoic Allaqi Suture, Southeast Egypt with Landsat TM and
SIR-C/X SAR images. Photogrammetic engineering and remote sensing 67(4), 491-497.
Replumaz, A., Tapponnier, P. (2003). Reconstruction of the deformed collision zone between
India and Asia by backward motion of lithospheric blocks. Journal of Geophysical
Research 108 (2285), 1–24.
Research Systems, Inc. (2008). ENVI Tutorials. Research Systems, Inc., Boulder, CO.
Rosenqvist, A., Shimada M., Chapman B. (2004). An overview of the JERS-1 SAR Global
Boreal Forest Mapping (GBFM) project. Geoscience and Remote Sensing Symposium,
IGARRS 0.4, Proceedings. 20-24 September 2004. Vol:2, p: 1033-1036.
Sabins, F.F. (1996). Remote sensing: Principal and Interpretation, (3rd Edn.), W.H. Freeman
and Co.
Sabins, F.F. (1999). Remote sensing for mineral exploration. Ore Geology Reviews, 14, 157-
183.
Scrivenor , J. B . (1931) The geology of Malaya . MacMillan , London , 250p .
Searle, M.P., Whitehouse, M.J., Robb, L.J., Ghani, A., Hutchison, C.S., Sone, M., Ng, W.P.,
Roselee, M.H., Chung, S.-L., Oliver, G.J.H. (2012). Tectonic evolution of the Sibumasu–
Indochina terrane collision zone in Thailand and Malaysia: constraints from new U -Pb

ACC
EPTE
D M
ANU
SCR
IPT
ACCEPTED MANUSCRIPT
26
zircon chronology of SE Asian tin granitoids. Journal of the Geological Society 169,
489–500.
Sevastjanova, I., Clements, B., Hall, R., Belousova, E.A., Griffin, W.L., Pearson, N., (2011).
Granitic magmatism, basement ages, and provenance indicators in the Malay Peninsula:
Insights from detrital zircon U–Pb and Hf-isotope data. Gondwana Research 19, 1024–
1039.
Sheng, Y., and Xia, Z.G. (1996). A comprehensive evaluation of filters for radar speckle
suppression. Geoscience and Remote Sensing Symposium, IGARSS.96, Remote sensing
for sustainable future.vol: 3, p: 1559-1561.
Shi, Z., and Fung, B. (1994). A Comparison of Digital Speckle Filters. Proceedings of
IGARSS, International Geoscience and Remote Sensing Symposium 94, 2129-2133.
Shimada, M., Isoguchi, O. (2002). JERS-1 SAR mosaics of South-EastAsia using calibrated
path images. International Journal of Remote Sensing 23(7), 1507–1526.
Shuib, M.K. (2009). Major faults. In: Hutchison, C.S., Tan, D.N.K. (Eds.), Geology of
Peninsular Malaysia. University of Malaya/Geological Society of Malaysia, Kuala
Lumpur, pp. 249–269.
Singhroy, V.H. (1992).Radar geology: techniques and results. Episodes 15(1): 15-20.
Spatz, D.M. (1997). Remote sensing characteristics of the sediment- and volcanic-hosted
precious metal systems: imagery selection for exploration and development. Inter J
Remote Sensing 18 (7):1413-1438.
Suzen, M.L., Toprak, V. (1998). Filtering of satellite images in geological lineament anlyses:
an application to a fault zone in Central Turkey. International Journal of Remote Sensing
19(6), 1101–1114.
ACC
EPTE
D M
ANU
SCR
IPT
ACCEPTED MANUSCRIPT
27
Sveinsson, J.R., Benediktsson, J.A. (1996). Speckle reduction and enhancement of SAR
image in the wavelet domain. Geoscience and Remote Sensing Symposium, IGARSS.96,
Remote sensing for sustainable future.vol: 1, p: 63-66.
Tjia, H.D. and Zaitun H. (1985). Regional Structures of Peninsular Malaysia, Sains
Malaysiana,14, pp. 95-107.
Tan, B. K. (1996) “Suture Zone” in peninsular Malaysia and Thailand: Implications for
paleotectonic reconstruction of Southeast Asia. Journal of Southeast Asian Earth
Sciences. 13, 243 – 249.
Thurmond, A.K., Abdelsalam, M.G., Thurmond, J.B. (2006). Optical-radar-DEM remote
sensing data integration for geological mapping in the Afar Depression, Ethiopia. Journal
of African Earth Sciences 44, 119-134.
Vincent, R.K., 1997. Fundamentals of Geological and Environmental Remote Sensing,
Prentice Hall, New Jersey, pp: 366.
Wan F.W.H. and Heru S.P. (2001). Perubahan batuan dinding berkaitan dengan permineralan
emas di Penjom Gold Mine, Pahang, Malaysia, Proceedings, Geo.Society of Malaysia,
Annual Geo. Conf, Pangkor, Pangkor, Malaysia, pp. 13-17(in Malay language).
Wan F.W.H. and Heru S.P. (2003). Analisis bendalir terkepung pada terlerang kuarza yang
mengandungi emas di kawasan lombong Penjom, Kuala Lipis, Pahang dan Lubok
Mandi, Geo. Society of Malaysia Bulletin, 46, pp. 359-363 (in Malay language).
Wise, S. (2002). GIS basics. Taylor & Francis, London.
Woodhouse, I.H. (2006). Introduction to microwave remote sensing. CRC Press, Taylor &
Francis Group, Boca Raton.
Yeap, E.B. (1993). Tin and gold mineralization in Peninsular Malaysia and their relationships
to the tectonic development: Journal of Southeast Asian Earth Sciences, v. 8, pp. 329 -
348.

ACC
EPTE
D M
ANU
SCR
IPT
ACCEPTED MANUSCRIPT
28
Zandbergen, P. (2008). Applications of shuttle radar topography mission elevation data.
Geography Compass, 2/5 1404-1431.
Figure captions Figure 1. Simplified geological map of the peninsular Malaysia. Modified from Metcalfe,
(2013a). Study area is located in black rectangle.
Figure 2. RGB color combination of PALSAR polarimetric HH, HV and VV images,
southeastern part of the Bentong-Raub Suture Zone.
Figure 3. Field photographs of the topographic expression of collision and compressional
structures in Cameron Highlands.
Figure 4. RGB image of N-S (0◦), NE-SW (45◦), and NW-SE (135◦) directional filters,
southeastern part of the Bentong-Raub Suture Zone.
Figure 5. District-scale geological map of the gold deposits, Kuala Lipis, Pahang, Central
Malaysia. Modified from Makoundi, (2012).
Figure 6. RGB image of N-S (0◦), NE-SW (45◦), and NW-SE (135◦) directional filters
covering gold mining districts in Kuala Lipis region, Pahang.
Figure 7. A regional view of the open-pit quarry of Penjom ore deposit.
Figure 8. Stratigraphic sequence of sedimentary rocks at Penjom ore deposit.
Figure 9. Association of hydrothermal alteration zones and lineament intersections with gold
mineralization in Penjom ore deposit.
Figure 10. Hydrothermally altered zone in Buffalo reef ore deposit.
Figure 11. A regional view of the open-pit quarry of Selinsing ore deposit.
Figure 12. Association of hydrothermally altered zones and fault-related rocks with high
grade ore mineralization section in the open pit quarry of Selinsing.

ACC
EPTE
D M
ANU
SCR
IPT
ACCEPTED MANUSCRIPT
29
Figure 13. A view of argillic alteration zone in the Tersang goldfield.
Figure 14. RGB image of N-S (0◦), NE-SW (45◦), and NW-SE (135◦) directional filters
covering the northern part of the CGB, Kelantan state.
Table captions Table 1. The characteristics of PALSAR Level 4.1 data used in this study (HH= Horizontally
transmitted and Horizontally received, HV= Horizontally transmitted and Vertically received, VV= Vertically transmitted and Vertically
received, VH= Vertically transmitted and Horizontally received).
Table 2. Directional filters with 7*7 kernel matrix.

ACC
EPTE
D M
ANU
SCR
IPT
ACCEPTED MANUSCRIPT
30
Figure 1

ACC
EPTE
D M
ANU
SCR
IPT
ACCEPTED MANUSCRIPT
31
Figure 2

ACC
EPTE
D M
ANU
SCR
IPT
ACCEPTED MANUSCRIPT
32
Figure 3

ACC
EPTE
D M
ANU
SCR
IPT
ACCEPTED MANUSCRIPT
Figure 4
33

ACC
EPTE
D M
ANU
SCR
IPT
ACCEPTED MANUSCRIPT
34
Figure 5
ACC
EPTE
D M
ANU
SCR
IPT
ACCEPTED MANUSCRIPT
Figure 6
35
ACC
EPTE
D M
ANU
SCR
IPT
ACCEPTED MANUSCRIPT
36
Figure 7

ACC
EPTE
D M
ANU
SCR
IPT
ACCEPTED MANUSCRIPT
37
Figure 8

ACC
EPTE
D M
ANU
SCR
IPT
ACCEPTED MANUSCRIPT
38
Figure 9
ACC
EPTE
D M
ANU
SCR
IPT
ACCEPTED MANUSCRIPT
39
Figure 10

ACC
EPTE
D M
ANU
SCR
IPT
ACCEPTED MANUSCRIPT
40
Figure 11

ACC
EPTE
D M
ANU
SCR
IPT
ACCEPTED MANUSCRIPT
41
Figure 12

ACC
EPTE
D M
ANU
SCR
IPT
ACCEPTED MANUSCRIPT
42
Figure 13

ACC
EPTE
D M
ANU
SCR
IPT
ACCEPTED MANUSCRIPT
Figure 14
43

ACC
EPTE
D M
ANU
SCR
IPT
ACCEPTED MANUSCRIPT
44
Table 1: The characteristics of PALSAR Level 4.1 data used in this study (HH= Horizontally transmitted and Horizontally received, HV= Horizontally transmitted and Vertically received, VV= Vertically transmitted and Vertically
received, VH= Vertically transmitted and Horizontally received). Granule ID Date of acquisation Instrument operation mode Polarity Path/Row PASL4100706061550471312030001 2007/06/06 PLRM HH+HV+VV+VH 485/8 PASL4100706061550391312030000 2007/06/06 PLRM HH+HV+VV+VH 485/7 PASL4100709111556501312030004 2007/09/11 FBDH HH+HV 488/7 PASL4100709111556581312030003 2007/09/11 FBDH HH+HV 488/8

ACC
EPTE
D M
ANU
SCR
IPT
ACCEPTED MANUSCRIPT
45
Table 2: Directional filters with 7*7 kernel matrix. N-S -1.0000 -1.0000 -1.0000 0.0000 1.0000 1.0000 1.0000 -1.0000 -1.0000 -1.0000 0.0000 1.0000 1.0000 1.0000 -1.0000 -1.0000 -1.0000 0.0000 1.0000 1.0000 1.0000 -1.0000 -1.0000 -1.0000 0.0000 1.0000 1.0000 1.0000 -1.0000 -1.0000 -1.0000 0.0000 1.0000 1.0000 1.0000 -1.0000 -1.0000 -1.0000 0.0000 1.0000 1.0000 1.0000 -1.0000 -1.0000 -1.0000 0.0000 1.0000 1.0000 1.0000
E-W -1.0000 -1.0000 -1.0000 -1.0000 -1.0000 -1.0000 -1.0000 -1.0000 -1.0000 -1.0000 -1.0000 -1.0000 -1.0000 -1.0000 -1.0000 -1.0000 -1.0000 -1.0000 -1.0000 -1.0000 -1.0000 0.0000 0.0000 0.0000 -0.0000 -0.0000 -0.0000 -0.0000 1.0000 1.0000 1.0000 1.0000 1.0000 1.0000 1.0000 1.0000 1.0000 1.0000 1.0000 1.0000 1.0000 1.0000 1.0000 1.0000 1.0000 1.0000 1.0000 1.0000 1.0000
NE-SW -1.4142 -1.4142 -1.4142 -0.7071 0.0000 0.0000 0.0000 -1.4142 -1.4142 -1.4142 -0.7071 0.0000 0.0000 0.0000 -1.4142 -1.4142 -1.4142 -0.7071 0.0000 0.0000 0.0000 -0.7071 -0.7071 -0.7071 0.0000 0.7071 0.7071 0.7071 0.0000 0.0000 0.0000 0.7071 1.4142 1.4142 1.4142 0.0000 0.0000 0.0000 0.7071 1.4142 1.4142 1.4142 0.0000 0.0000 0.0000 0.7071 1.4142 1.4142 1.4142
NW-SE 0.0000 0.0000 0.0000 -0.7071 -1.4142 -1.4142 -1.4142 0.0000 0.0000 0.0000 -0.7071 -1.4142 -1.4142 - 1.4142 0.0000 0.0000 0.0000 -0.7071 -1.4142 -1.4142 -1.4142 0.7071 0.7071 0.7071 0.0000 -0.7071 -0.7071 -0.7071 1.4142 1.4142 1.4142 0.7071 0.0000 0.0000 0.0000 1.4142 1.4142 1.4142 0.7071 0.0000 0.0000 0.0000 1.4142 1.4142 1.4142 0.7071 0.0000 0.0000 0.0000