Embed Size (px)
Citation preview
Smart Structures and Systems, Vol. 10, No. 4-5 (2012) 375-391 375
Structural health monitoring of Canton Tower using Bayesian framework
Sin-Chi Kuok and Ka-Veng Yuen*
Department of Civil and Environmental Engineering, Faculty of Science and Technology,
University of Macau, Macao, China
(Received January 13, 2012, Revised March 2, 2012, Accepted March 15, 2012)
Abstract. This paper reports the structural health monitoring benchmark study results for the Canton Towerusing Bayesian methods. In this study, output-only modal identification and finite element model updating areconsidered using a given set of structural acceleration measurements and the corresponding ambient conditionsof 24 hours. In the first stage, the Bayesian spectral density approach is used for output-only modalidentification with the acceleration time histories as the excitation to the tower is unknown. The modalparameters and the associated uncertainty can be estimated through Bayesian inference. Uncertaintyquantification is important for determination of statistically significant change of the modal parameters and forweighting assignment in the subsequent stage of model updating. In the second stage, a Bayesian modelupdating approach is utilized to update the finite element model of the tower. The uncertain stiffnessparameters can be obtained by minimizing an objective function that is a weighted sum of the square of thedifferences (residuals) between the identified modal parameters and the corresponding values of the model.The weightings distinguish the contribution of different residuals with different uncertain levels. They areobtained using the Bayesian spectral density approach in the first stage. Again, uncertainty of the stiffnessparameters can be quantified with Bayesian inference. Finally, this Bayesian framework is applied to the 24-hour field measurements to investigate the variation of the modal and stiffness parameters under changingambient conditions. Results show that the Bayesian framework successfully achieves the goal of the first taskof this benchmark study.
Keywords: ambient vibration; Bayesian analysis; high-rise structures; model updating; structural healthmonitoring; system identification
1. Introduction
Structural health monitoring has received extensive attention in last decades (Doebling et al. 1996,
Farrar and Doebling 1997, Sohn et al. 2003, Brownjohn 2007). The objective is to evaluate the
structural integrity and diagnose possible damages in a structure. Modal and stiffness parameters are
widely adopted indicators for diagnosis of the structural health conditions (Farrar and Doebling
1997, Brownjohn 2007). In order to provide reliable estimates of these indicators from response
measurements, tremendous research effort has been devoted to the development of effective
identification methodologies. Meanwhile, various applications were presented to demonstrate the
appropriateness and limitations of different approaches (Doebling et al. 1996, Sohn et al. 2003). In
*Corresponding author, Professor, E-mail: [email protected]
376 Sin-Chi Kuok and Ka-Veng Yuen
recent years, the Asian-Pacific Network of Centers for Research in Smart Structures Technology
(ANCRiSST) established a structural health monitoring benchmark study to provide an international
platform for comparison among different structural health monitoring algorithms and strategies. The
comprehensive structural health monitoring project was developed on the 610 m height Canton
Tower (formerly named Guangzhou New Television Tower) (Ni et al. 2009, Ni and Zhou 2010, Ni
et al. 2012). The structural health monitoring system consists of over 700 sensors to capture the
field measurements of the structural response as well as the ambient conditions of the operating
environment. Some noteworthy references about this structure and the structural health monitoring
system include the finite element analysis (Ni et al. 2012), modal analysis (Chen et al. 2011, Niu
et al. 2011, Ye et al. 2011), vibration control (Ni and Zhou 2010, He et al. 2011), and wireless
sensing technology (Ni et al. 2011).
This paper tackles with the first task of the benchmark study using Bayesian inference. Regarding
this task, a set of 24-hour structural acceleration time histories and the corresponding ambient
conditions were provided for output-only system identification and model updating. In addition, the
mass and stiffness matrices of a 3D reduced model with 185 DOFs were provided as a reference
model. This reduced model was obtained by model reduction from a fine 3D finite element model
with 122,476 elements with 505,164 degrees of freedom. Detailed descriptions on the modular
design of the structural health monitoring system, the task requirements of the benchmark problem
and the finite element model can be found in Ni et al. (2009), Ni et al. (2012) and the official
website (http://www.cse.polyu.edu.hk/benchmark/).
Bayesian inference provides a promising and feasible identification solution for the purpose of
structural health monitoring (Beck and Katafygiotis 1998, Vanik et al. 2000, Ching and Beck 2004,
Gaitanaros et al. 2010, Yuen 2010a). An attracting feature of Bayesian inference is that not only the
optimal estimates can be determined but also their associated uncertainties can be quantified in the
form of probability distributions. It provides useful information for assessment of structural health
conditions. In this study, the Bayesian spectral density approach (Katafygiotis and Yuen 2001) is
applied for output-only modal identification. This frequency-domain method employs the statistical
characteristics of the discrete Fourier transform to construct the likelihood function of the modal
parameters. Based on the modal identification results, a Bayesian model updating approach is
formulated to update the finite element model of the tower. In contrast to the weighted least squares
method which usually requires subjective decision on the weightings of the residuals, the Bayesian
approach provides rational assignment of such weightings. The structural response of the tower is
utilized to demonstrate the effectiveness of the Bayesian framework on modal identification and
model updating.
Thereafter, the ambient influence on the modal and stiffness parameters of the tower is examined.
Previous long-term structural health monitoring studies revealed that operating conditions may
induce substantial effects on the diagnostic parameters (Askegaard and Mossing 1988, Clinton et al.
2006, Liu and DeWolf 2007, Zhou et al. 2008, Xia et al. 2011). In order to conduct reliable
assessment on the structural health condition, it is necessary to understand the ambient influence on
the structural health indicators (Tamura and Suganuma 1996). Taking the advantage of Bayesian
inference, the statistical uncertainty can be quantified and, therefore, can be distinguish from the
actual change of the parameters. The result shows that the Bayesian framework successfully
achieves the task goals of the benchmark study.
Structural health monitoring of Canton Tower using Bayesian framework 377
2. Formulation
The Bayesian structural health monitoring framework used in this study is a two-stage approach.
It was investigated by Lam et al. (2004) for the IASC-ASCE structural health monitoring
benchmark problem (Johnson et al. 2004). In the first stage, the modal frequencies, damping
ratios and mode shapes are identified using the Bayesian spectral density approach (Katafygiotis
and Yuen 2001). In the second stage, the modal identification results, including the estimated
values and the associated uncertainty, will be utilized to update the finite element model of the
structure. In the following sections, these modal identification and model updating methods will
be introduced.
2.1 Bayesian spectral density approach for output-only modal identification
Consider a linear dynamical system with Nd degrees of freedom and equation of motion:
(1)
where M, C and K are the mass, damping and stiffness matrix, respectively; and T0 is a force
distributing matrix. The external excitation F can modeled as zero-mean Gaussian white noise with
spectral intensity matrix . Assume that the measurement
contains No channels of structural response, corrupted by the measurement noise ε
(2)
where is the measurement at the nth time step; is the concerned structural
response (e.g., displacement or acceleration) at the same time step; and ; is the observation
matrix comprised of zeros and ones. The measurement noise ε is modeled as zero-mean discrete
Gaussian independent and identical distributed (i.i.d.) process with covariance matrix Σε.
The generalized eigenvalue problem of the structure is given by
(3)
where the spectral matrix , contains the squared modal
frequencies on its diagonal. The modal matrix contains the mode shape vectors.
Assume that there are modes significantly contributing to the structural response and the
modal parameters of these modes are to be identified. Use α to denote the uncertain modal
parameter vector for identification. It consists of: (i) the modal frequencies and damping ratios
of the concerned modes; (ii) the partial mode shapes including only the components at the
observed degrees of freedom of the concerned modes. Since the mass matrix is unknown and only
some of the degrees of freedom are observed in practical situation, mass normalization cannot be
used. Here, each mode shape is normalized such that its component with largest absolute value is
unity. Therefore, these normalizing components will be excluded from the uncertain modal
parameter vector; and (iii) the upper triangles (diagonal inclusive) of SF0 and as symmetry
defines the lower triangular part.
Mx·· Cx· Kx+ + T0F t( )=
SF ω( ) SF0= YN y n( ) n 1= 2 … N, , , ,{ }=
Y n( ) L0q n( ) ε n( )+=
Y n( ) RNo∈ q n( ) R
Nd∈
L0 RNo
Nd
×∈
KΦ MΦΛ=
Λ diag ω1
2 … ωNd
2, ,( )= ω1
2 ω2
2 … ωNd
2≤ ≤ ≤Φ φ1 φ2 … φN
d, , ,[ ]=
Nι
ωm
ζm Ψm
Σε
378 Sin-Chi Kuok and Ka-Veng Yuen
To identify the uncertain modal parameter vector α, a discrete estimator of the power spectral
density matrix is utilized (Katafygiotis and Yuen 2001)
(4)
where is the sampling time step; is the frequency precision in the discrete Fourier
transform; and , .
With independent sets of discrete time histories , the averaged spectral
density estimator can be obtained
(5)
where can be calculated using Eq. (4) with measurement . Given that , the
averaged spectral density matrix estimator follows the central complex Wishart distribution with
dimension and degrees of freedom (Krishnaiah 1976). With a properly selected frequency range
, the averaged spectral density matrix estimators in are approximately
independent (Yuen et al. 2002).
Using the Bayes’ theorem, the posterior probability density function (PDF) of given is
(Beck and Katafygiotis 1998)
(6)
where is a normalizing constant. The prior PDF quantifies the prior information of the modal
parameters in . Throughout this study, it is taken as a uniform distribution over the entire possible
range of . Therefore, it can be absorbed into the normalizing constant. The likelihood function
is given by product of Wishart distributions (Yuen and Beck 2003)
(7)
where is a constant that does not depend on the modal parameters; is the conditional
expectation given a particular modal parameter vector ; and tr(.) are the determinant and trace of a
matrix, respectively. The optimal modal parameter vector can be determined by maximizing its
posterior PDF. However, to provide better computational condition, the optimal modal parameters can
be obtained equivalently by minimizing the objective function defined as . This
can be done by using the function “fminsearch” in MATLAB (Matlab 1994). Consequently, the
covariance matrix of the modal parameters is given by the inverse of the Hessian of evaluated at
, i.e., (Yuen 2010a). With the uniform prior PDF, the elements
of can be expressed as
(8)
Sy N, ωk( ) ∆t
2πN---------- y n( )y n'( )T i– ωk n n'–( )∆t[ ]exp
n n', 0=
N 1–
∑=
∆t ∆ω 2π( ) N∆t⁄=
ωk k∆ω= k 0 1 … INT N 2⁄( ), , ,=
Ns Y YN
s( )s 1= 2 … Ns, , , ,{ }=
Sy N,
avgωk( ) 1
N----
s
Sy N,
s( )ωk( )
s 1=
Ns
∑=
Sy N,
s( )ωk( ) YN
s( )Ns No≥
Ns
No
Ξ SΞ
avgSy N,
avgωk( ) ωk Ξ∈,{ }=
α SΞ
avg
p α SΞ
avg( ) c1p α( )p SΞ
avgα( )=
c1 p α( )α
α
p SΞ
avgα( )
p SΞ
avgα( ) c2
1
E Sy N, ωk( ) α[ ]Ns
---------------------------------------ωk
Ξ∈∏ Ns– tr E Sy N, ωk( ) α[ ]{ } 1–
Sy N,
avgωk( )( )[ ]exp=
c2 E . α[ ]α .
α̂
J1 α( ) pln SΞ
avgα( )–=
J1 α( )α α̂= Σα H α̂( )[ ] 1– ∇J1 α( )∇T
α α̂=[ ]
1–
≡=
H α̂( )
Hr r',( )
α̂( ) Ns∂2
∂αrαr'
-------------- ln E Sy N, ωk( ) α[ ]| tr E Sy N, ωk( ) α[ ]{ } 1–Sy N,
avgωk( )( )+{ }
ωk
Ξ∈∑
α α̂=
=
Structural health monitoring of Canton Tower using Bayesian framework 379
and it can be computed using finite difference. Based on the modal identification results, a Bayesian
probabilistic technique will be introduced next for finite element model updating.
2.2 Bayesian model updating using identified modal parameters
Note that only the modal frequencies and mode shapes will be used for finite element model
updating. Therefore, the identified target vector is defined to include only the identified modal
parameters to be used for model updating: where , m = 1,2,...,Nm.
In other words, the identified target vector includes some of the elements in . Specifically, it
consists of the identified modal frequencies and Nn (≤ Nο) components of the identified mode shape
vector for Nm (≤ ) modes. The covariance matrix of the identified target vector is denoted as
and it is a submatrix of (with appropriate rearrangement of the rows and columns) obtained
from the previous stage of modal identification.
The structural model includes a prescribed mass matrix M and an uncertain stiffness matrix K(θ )
governed by the uncertain stiffness parameter vector (Yuen and Katafygiotis
2006). By solving the generalized eigenvalue problem of the dynamical model in Eq. (3),
the modal frequencies and mode shape vectors can be computed for a given stiffness parameter
vector . Then, the target vector of a given structural model can be obtained. The residual
vector follows the zero-mean Gaussian distribution with covariance matrix .
Using the Bayes’ theorem, the posterior PDF of given the identified target vector can be
readily obtained (Beck and Katafygiotis 1998)
(9)
where is a normalizing constant. The prior PDF quantifies the prior information of the
stiffness parameters in and a uniform distribution is used throughout this study. The likelihood
function can be expressed as
(10)
Again, instead of maximizing the posterior PDF, one can equivalently minimize the objective
function to obtain the optimal stiffness parameter vector . This can be done
by using the function “fminsearch” in MATLAB (Matlab 1994). The associated covariance matrix
is given by the inverse of the Hessian of evaluated at , i.e., =
. It is worth noting that minimization of the objective function is equivalent
to the weighted least-squares solution for a diagonal . The Bayesian inference provides a rational
assignment of the weightings. The weightings are inversely proportional to the posterior variance
obtained from the first stage. Therefore, residuals (differences between the identified target vector
and its corresponding value of a structural model) will be given higher weightings if they are
associated with smaller posterior uncertainty. Moreover, by using the Bayesian influence (Box and
Tiao 1992), the parametric uncertainty can be quantified. This provides valuable information for
further judgment of the structural health condition (Vanik et al. 2000, Yuen and Kuok 2011) and it
will be further discussed in the subsequent sections.
χ̂ χ̂1
T … χ̂Nm
T, ,[ ]T
= χ̂m ω̂m Ψ̂ mT
,[ ]T
=
α̂
Nι Σχ
Σα
θ θ1 θ1 … θNθ
, , ,[ ]T=
M K θ( ),( )
θ χ θ( )χ̂ χ θ( )– Σχ
θ
p θ χ̂( ) c3p θ( )p χ̂ θ( )=
c3 p θ( )θ
p χ̂ θ( )
p χ̂ θ( ) 2π( ) Σχ
NmNn
2-------------–
1
2---–
1
2--- χ̂ χ θ( )–[ ]TΣχ
1– χ̂ χ θ( )–[ ]–⎩ ⎭⎨ ⎬⎧ ⎫
exp=
J2 θ( ) pln χ̂ θ( )–= θ̂
J2 θ( ) θ θ̂= Σθ H θ̂( )[ ]1–
≡∇J2 θ( )∇T
θ θˆ
=[ ]
1–
J2 θ( )Σχ
380 Sin-Chi Kuok and Ka-Veng Yuen
3. Application to the structural health monitoring benchmark study of Canton Tower
3.1 Background information
A structural health monitoring benchmark study was established and it was based on the full-scale
field measurement of the 610 m tall Canton Tower (Ni et al. 2009, Ni et al. 2012). Twenty uni-axial
accelerometers were installed in various locations of the tower to measure the structural response. In
the first task of this benchmark study, 24-hour field measurements of the structural acceleration time
histories and the corresponding ambient conditions (temperature and wind properties) were
provided. In addition, the mass and stiffness matrix of a reduced 3D beam model with 185 degrees
of freedom were given as a reference model for finite element model updating. This reduced model
was constructed using model reduction from a full model of 122,476 elements with 505,164 degrees
of freedom obtained by using ANSYS. Detailed descriptions on the modular design of the structural
health monitoring system, the task requirements of the benchmark problem and the finite element
models can be found in Ni et al. (2009), Ni et al. (2012) and the official website (http://www.cse.
polyu.edu.hk/benchmark/). In this section, we first present detailed results of modal identification
and model updating using the acceleration measurements of the first hour (obtained from 18:00 to
19:00 on 20th January 2010). Then, correlation between the modal/stiffness parameters and the
ambient conditions throughout the entire duration of 24 hours will be presented in Section 4.
3.2 Modal identification with the field measurements of Canton Tower
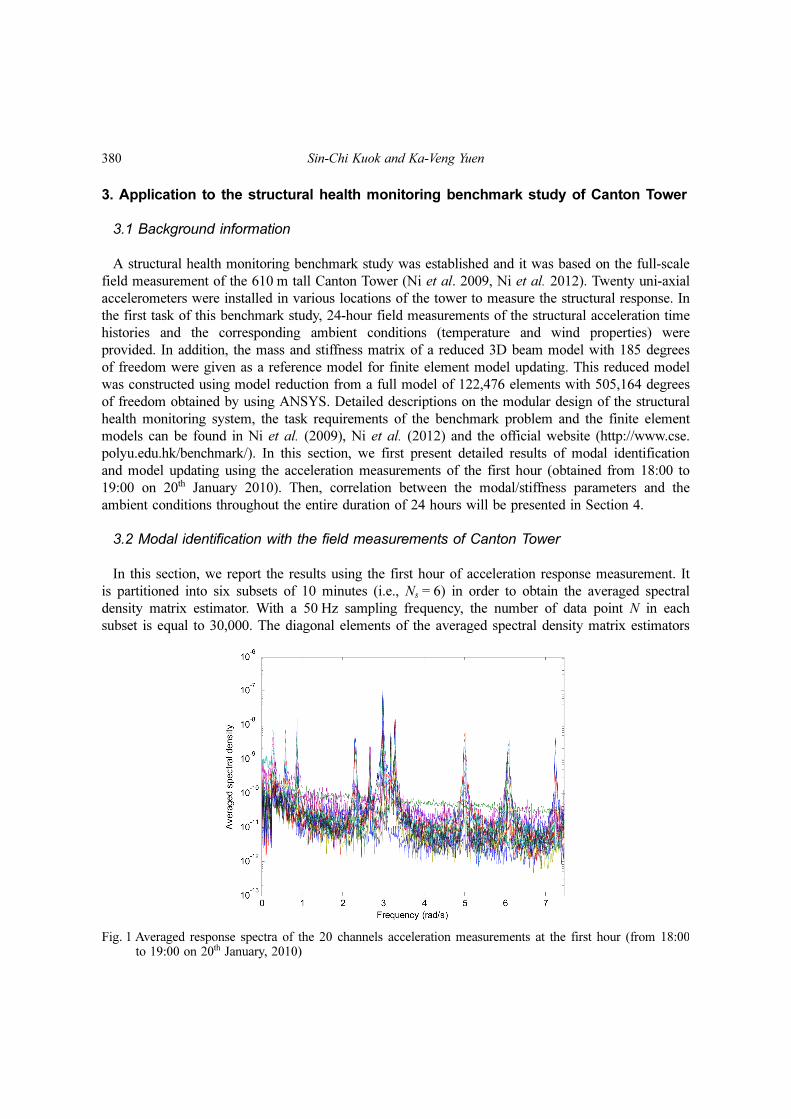
In this section, we report the results using the first hour of acceleration response measurement. It
is partitioned into six subsets of 10 minutes (i.e., Ns = 6) in order to obtain the averaged spectral
density matrix estimator. With a 50 Hz sampling frequency, the number of data point N in each
subset is equal to 30,000. The diagonal elements of the averaged spectral density matrix estimators
Fig. 1 Averaged response spectra of the 20 channels acceleration measurements at the first hour (from 18:00to 19:00 on 20th January, 2010)
Structural health monitoring of Canton Tower using Bayesian framework 381
of the 20-channel of acceleration response are shown in Fig. 1. Since the first peak is not stable, it
is not considered as a mode (Chen et al. 2011).
The identification results of the modal frequencies and damping ratios of the first ten modes (i.e.,
) are shown in Table 1. It lists the identified values, the posterior standard derivations and
the coefficients of variation (COV). It is found that the posterior standard derivations are in
acceptable range. The COVs of all the identified modal frequencies are less than 0.25%. They are
sufficiently for detection of any notable changes of the modal frequencies. On the other hand, it is
not surprising to obtain large posterior uncertainty for the damping ratios and the COV values are
around 20% in most cases. However, this will not affect the model updating results as the damping
ratios will not participate in this process.
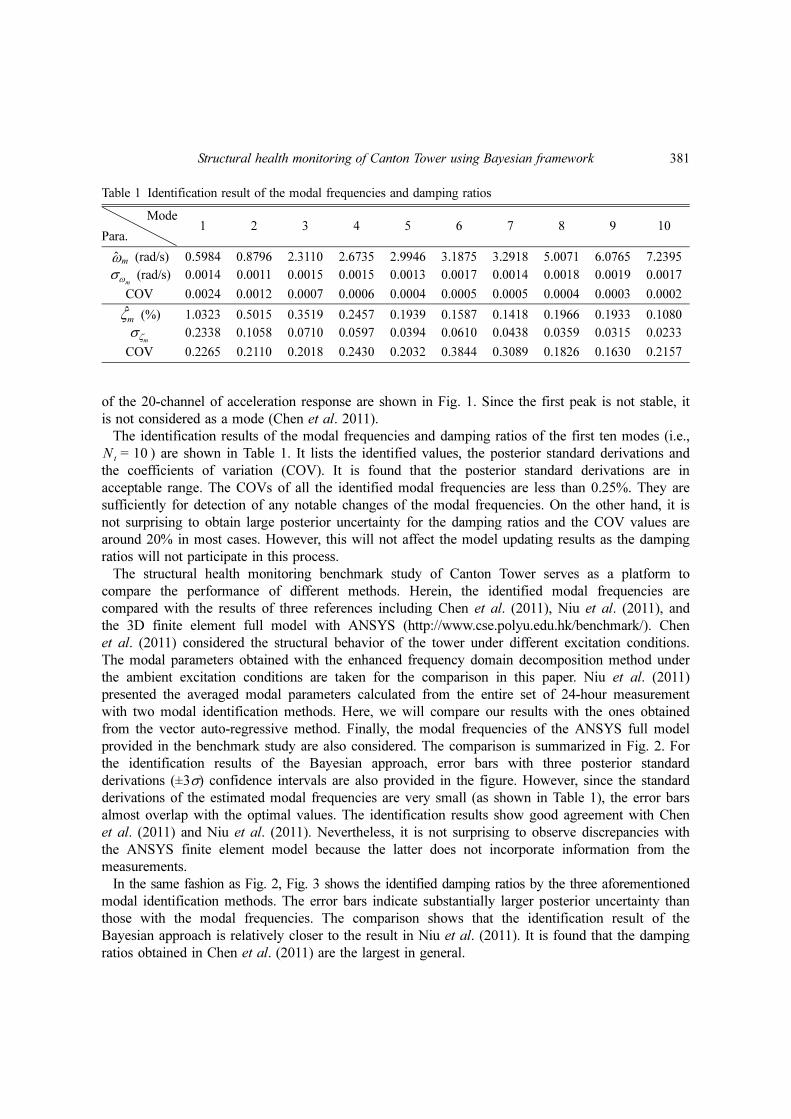
The structural health monitoring benchmark study of Canton Tower serves as a platform to
compare the performance of different methods. Herein, the identified modal frequencies are
compared with the results of three references including Chen et al. (2011), Niu et al. (2011), and
the 3D finite element full model with ANSYS (http://www.cse.polyu.edu.hk/benchmark/). Chen
et al. (2011) considered the structural behavior of the tower under different excitation conditions.
The modal parameters obtained with the enhanced frequency domain decomposition method under
the ambient excitation conditions are taken for the comparison in this paper. Niu et al. (2011)
presented the averaged modal parameters calculated from the entire set of 24-hour measurement
with two modal identification methods. Here, we will compare our results with the ones obtained
from the vector auto-regressive method. Finally, the modal frequencies of the ANSYS full model
provided in the benchmark study are also considered. The comparison is summarized in Fig. 2. For
the identification results of the Bayesian approach, error bars with three posterior standard
derivations (±3σ) confidence intervals are also provided in the figure. However, since the standard
derivations of the estimated modal frequencies are very small (as shown in Table 1), the error bars
almost overlap with the optimal values. The identification results show good agreement with Chen
et al. (2011) and Niu et al. (2011). Nevertheless, it is not surprising to observe discrepancies with
the ANSYS finite element model because the latter does not incorporate information from the
measurements.
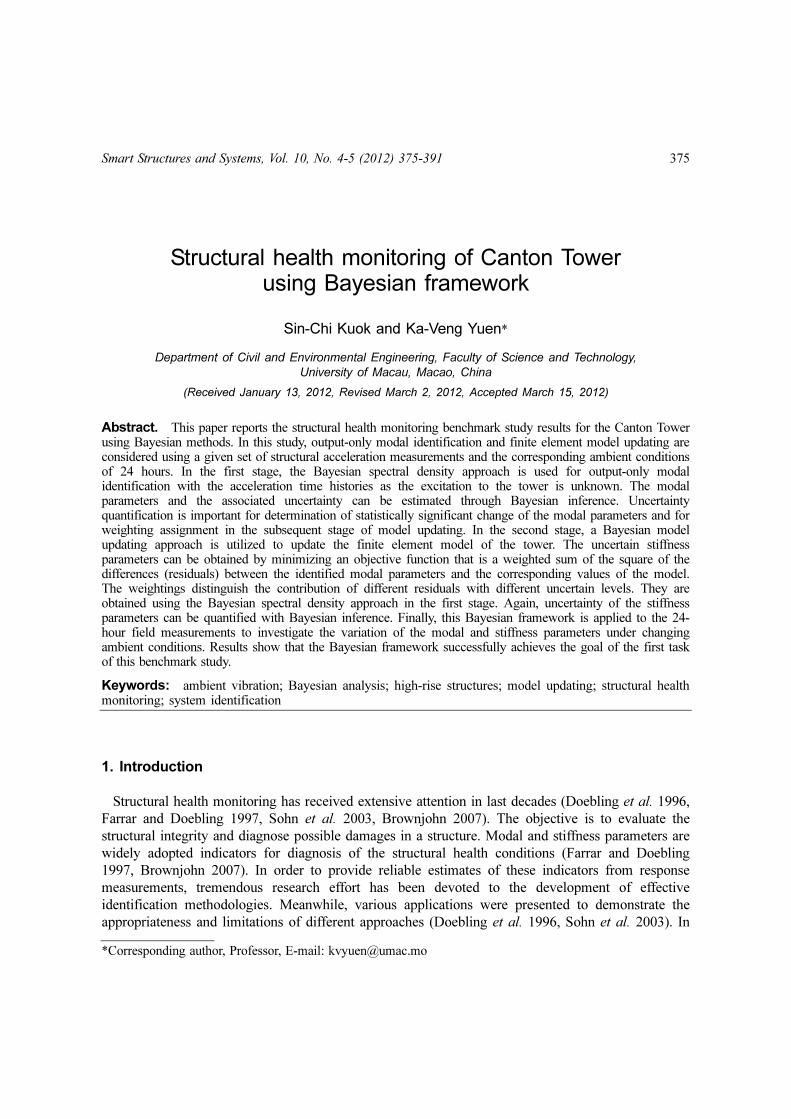
In the same fashion as Fig. 2, Fig. 3 shows the identified damping ratios by the three aforementioned
modal identification methods. The error bars indicate substantially larger posterior uncertainty than
those with the modal frequencies. The comparison shows that the identification result of the
Bayesian approach is relatively closer to the result in Niu et al. (2011). It is found that the damping
ratios obtained in Chen et al. (2011) are the largest in general.
Nι 10=
Table 1 Identification result of the modal frequencies and damping ratios
Mode1 2 3 4 5 6 7 8 9 10
Para.
(rad/s) 0.5984 0.8796 2.3110 2.6735 2.9946 3.1875 3.2918 5.0071 6.0765 7.2395
(rad/s) 0.0014 0.0011 0.0015 0.0015 0.0013 0.0017 0.0014 0.0018 0.0019 0.0017
COV 0.0024 0.0012 0.0007 0.0006 0.0004 0.0005 0.0005 0.0004 0.0003 0.0002
(%) 1.0323 0.5015 0.3519 0.2457 0.1939 0.1587 0.1418 0.1966 0.1933 0.1080
0.2338 0.1058 0.0710 0.0597 0.0394 0.0610 0.0438 0.0359 0.0315 0.0233
COV 0.2265 0.2110 0.2018 0.2430 0.2032 0.3844 0.3089 0.1826 0.1630 0.2157
ω̂m
σωm
ζm̂σζ
m
382 Sin-Chi Kuok and Ka-Veng Yuen
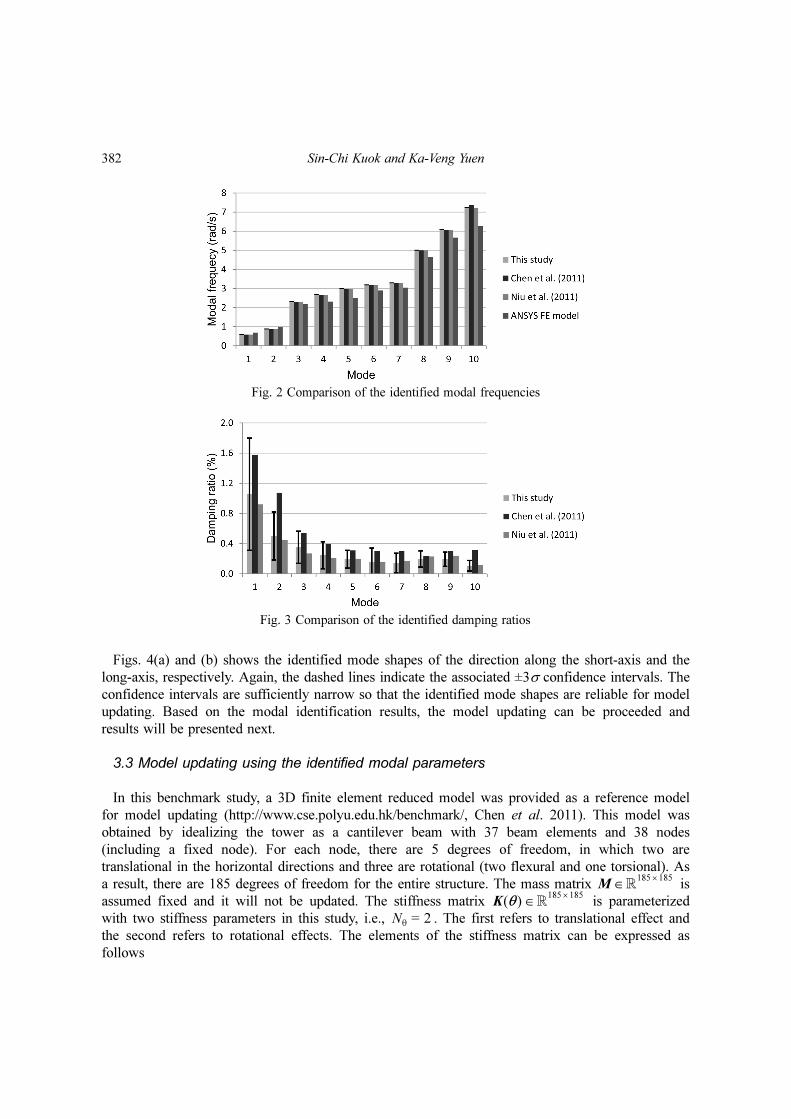
Figs. 4(a) and (b) shows the identified mode shapes of the direction along the short-axis and the
long-axis, respectively. Again, the dashed lines indicate the associated ±3σ confidence intervals. The
confidence intervals are sufficiently narrow so that the identified mode shapes are reliable for model
updating. Based on the modal identification results, the model updating can be proceeded and
results will be presented next.
3.3 Model updating using the identified modal parameters
In this benchmark study, a 3D finite element reduced model was provided as a reference model
for model updating (http://www.cse.polyu.edu.hk/benchmark/, Chen et al. 2011). This model was
obtained by idealizing the tower as a cantilever beam with 37 beam elements and 38 nodes
(including a fixed node). For each node, there are 5 degrees of freedom, in which two are
translational in the horizontal directions and three are rotational (two flexural and one torsional). As
a result, there are 185 degrees of freedom for the entire structure. The mass matrix is
assumed fixed and it will not be updated. The stiffness matrix is parameterized
with two stiffness parameters in this study, i.e., . The first refers to translational effect and
the second refers to rotational effects. The elements of the stiffness matrix can be expressed as
follows
M R185 185×∈
K θ( ) R185 185×∈
Nθ 2=
Fig. 2 Comparison of the identified modal frequencies
Fig. 3 Comparison of the identified damping ratios
Structural health monitoring of Canton Tower using Bayesian framework 383
(11)
where is the element of the nominal stiffness matrix. The first group associates with the
translational degrees of freedom while the second group associates with the rotational degrees of
freedom. The cross terms are multiplied with to ensure positive definiteness of the stiffness
matrix.
The Bayesian model updating approach is applied to estimate the stiffness parameters. For this
purpose, the modal identification results of the first four modes are utilized. As shown in the pilot
study by Ni et al. (2012), the first four modes correspond to the first bending mode of the short
axis, the first bending mode of the long axis, the second bending mode of the short axis and the
second bending mode of the long axis, respectively. The identified target vector for model updating
is where , . The partial mode shape vectors of the
first and third modes ( and ) consist of the mode shape components of channel 1, 3, 8, 13, 15
and 18. These degrees of freedom are chosen because their direction aligns with the short axis. By
the same argument, and consist of the mode shape components of channel 2, 4, 9, 14, 16
and 20.
Table 2 shows the identified stiffness parameters, the posterior standard derivations and the
corresponding coefficients of variation (COV). The identified stiffness parameter vector is =
Kij θ( )
θ1Kij
η, i j, 1 2 mod 5( ),=
θ2Kij
η, i j, 3 4 5 mod 5( ), ,=
θ1θ2Kij
η, otherwise⎩
⎪⎨⎪⎧
=
Kij
ηi j,( )
θ1θ2
χ̂ χ̂ 1
Tχ̂ 2
Tχ̂ 3
Tχ̂ 4
T, , ,[ ]T
= χ̂ i ω̂m ψm
Tˆ,[ ]
T= m 1 … 4, ,=
ψ̂1 ψ̂3
ψ̂2 ψ̂4
θ̂
Fig. 4 Identified mode shape with ±3σ confidence intervals (a) short-axis direction and (b) long-axis direction
Table 2 Estimation result of the stiffness parameters
COV
0.9908 0.0027 0.0027
0.5920 0.0029 0.0050
θ̂ σθ
θ1
θ2
384 Sin-Chi Kuok and Ka-Veng Yuen
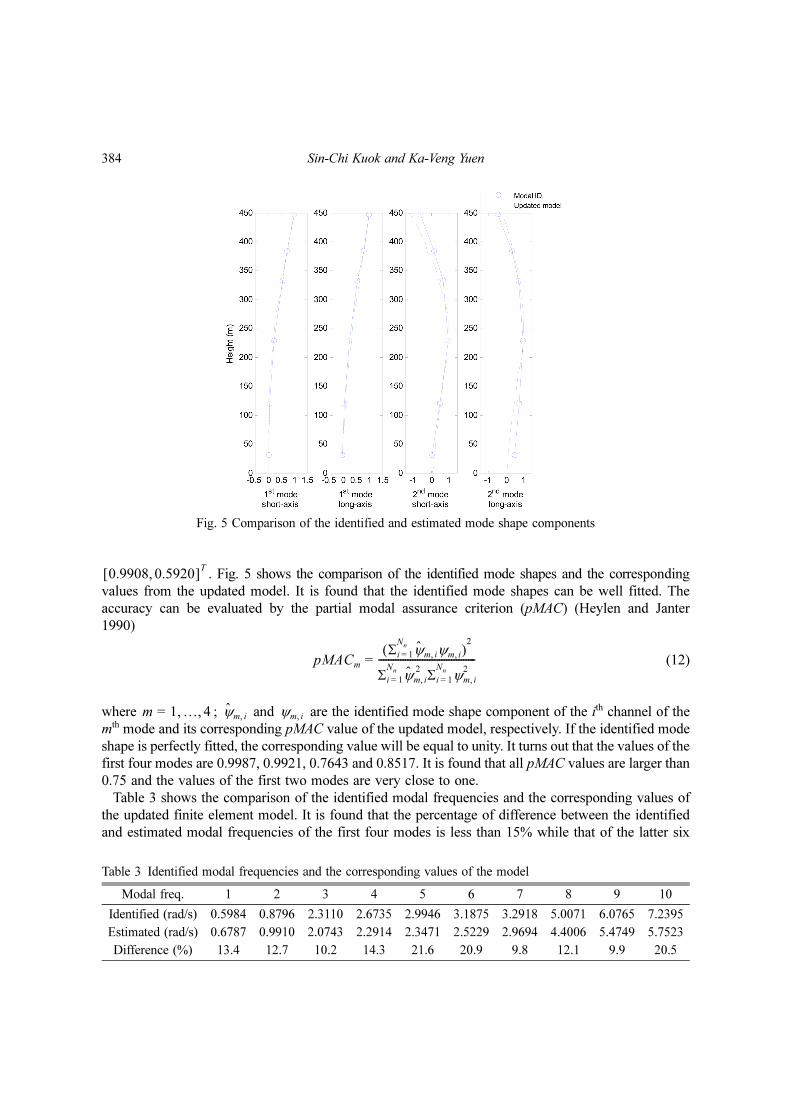
. Fig. 5 shows the comparison of the identified mode shapes and the corresponding
values from the updated model. It is found that the identified mode shapes can be well fitted. The
accuracy can be evaluated by the partial modal assurance criterion (pMAC) (Heylen and Janter
1990)
(12)
where ; and are the identified mode shape component of the ith channel of the
mth mode and its corresponding pMAC value of the updated model, respectively. If the identified mode
shape is perfectly fitted, the corresponding value will be equal to unity. It turns out that the values of the
first four modes are 0.9987, 0.9921, 0.7643 and 0.8517. It is found that all pMAC values are larger than
0.75 and the values of the first two modes are very close to one.
Table 3 shows the comparison of the identified modal frequencies and the corresponding values of
the updated finite element model. It is found that the percentage of difference between the identified
and estimated modal frequencies of the first four modes is less than 15% while that of the latter six
0.9908 0.5920,[ ]T
pMACm
Σi 1=
Nn
ψ̂m i, ψm i,( )2
Σi 1=
Nn
ψ̂m i,
2 Σi 1=
Nn
ψm i,
2
----------------------------------------=
m 1 … 4, ,= ψ̂m i, ψm i,
Fig. 5 Comparison of the identified and estimated mode shape components
Table 3 Identified modal frequencies and the corresponding values of the model
Modal freq. 1 2 3 4 5 6 7 8 9 10
Identified (rad/s) 0.5984 0.8796 2.3110 2.6735 2.9946 3.1875 3.2918 5.0071 6.0765 7.2395
Estimated (rad/s) 0.6787 0.9910 2.0743 2.2914 2.3471 2.5229 2.9694 4.4006 5.4749 5.7523
Difference (%) 13.4 12.7 10.2 14.3 21.6 20.9 9.8 12.1 9.9 20.5
Structural health monitoring of Canton Tower using Bayesian framework 385
modes is less than 22%. In this study, a simple model with two stiffness parameters is utilized for
the model updating. In order to improve the fitting capability, a model with adjustable stiffness
parameters is needed.
It is realized that understanding the physical behavior of the underlying system is a key for
construction of a proper model. A preferable model should possess good balance between the data
fitting capability and robustness. Selection of a realistic and applicable model to describe the
structural behavior is a challenging topic (Beck and Yuen 2004, Beck 2010, Yuen 2010b).
Furthermore, an appropriate dynamical model can serve as a baseline model and it is essential for
structural health monitoring.
4. Ambient influence on the modal and stiffness parameters
The Bayesian modal identification and model updating framework is applied to the 24-hour field
measurements of the tower to study the ambient influence on the structural behavior. This issue was
first addressed in Chen et al. (2011). In particular, we will investigate the effects of ambient
temperature and wind speed on the modal frequencies and damping ratios of the first ten modes and
the stiffness parameters of the finite element model. It is worth emphasizing again that Bayesian
inference allows for uncertainty quantification of the identified modal and stiffness parameters (Box
and Tiao 1992). This is important to distinguish statistical uncertainty from any actual change of the
parameters.
4.1 Ambient effects on modal frequencies and damping ratios
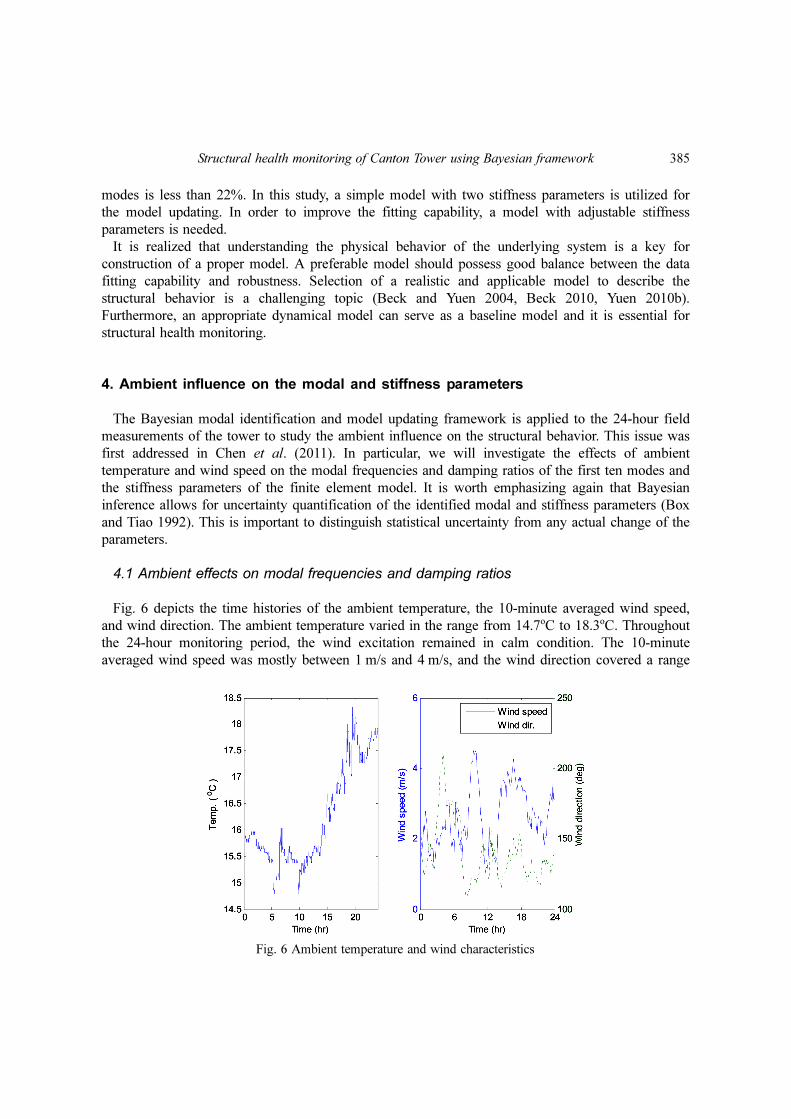
Fig. 6 depicts the time histories of the ambient temperature, the 10-minute averaged wind speed,
and wind direction. The ambient temperature varied in the range from 14.7oC to 18.3oC. Throughout
the 24-hour monitoring period, the wind excitation remained in calm condition. The 10-minute
averaged wind speed was mostly between 1 m/s and 4 m/s, and the wind direction covered a range
Fig. 6 Ambient temperature and wind characteristics
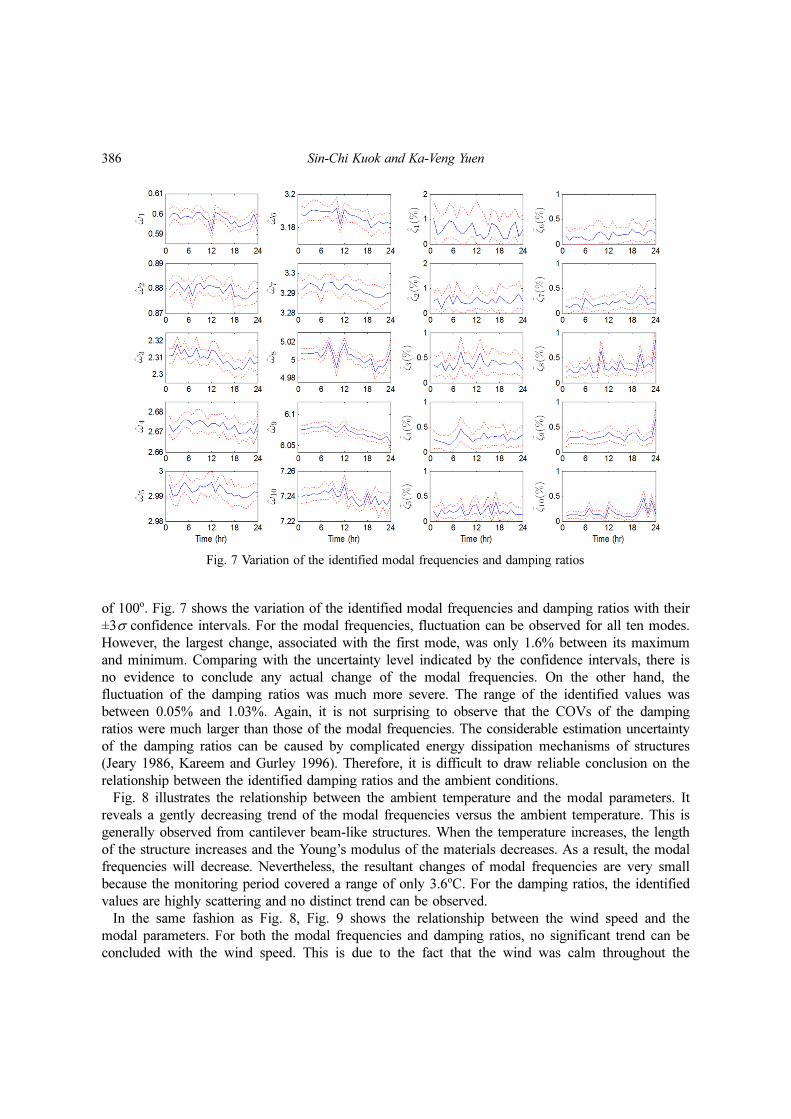
386 Sin-Chi Kuok and Ka-Veng Yuen
of 100o. Fig. 7 shows the variation of the identified modal frequencies and damping ratios with their
±3σ confidence intervals. For the modal frequencies, fluctuation can be observed for all ten modes.
However, the largest change, associated with the first mode, was only 1.6% between its maximum
and minimum. Comparing with the uncertainty level indicated by the confidence intervals, there is
no evidence to conclude any actual change of the modal frequencies. On the other hand, the
fluctuation of the damping ratios was much more severe. The range of the identified values was
between 0.05% and 1.03%. Again, it is not surprising to observe that the COVs of the damping
ratios were much larger than those of the modal frequencies. The considerable estimation uncertainty
of the damping ratios can be caused by complicated energy dissipation mechanisms of structures
(Jeary 1986, Kareem and Gurley 1996). Therefore, it is difficult to draw reliable conclusion on the
relationship between the identified damping ratios and the ambient conditions.
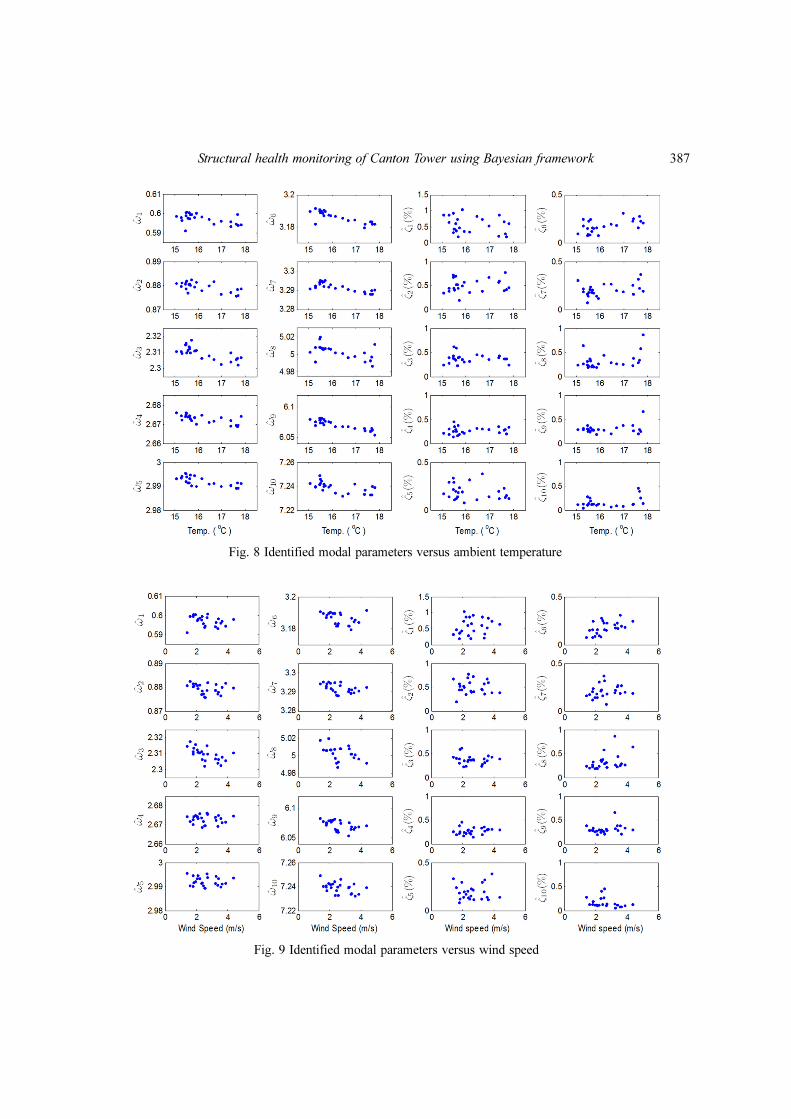
Fig. 8 illustrates the relationship between the ambient temperature and the modal parameters. It
reveals a gently decreasing trend of the modal frequencies versus the ambient temperature. This is
generally observed from cantilever beam-like structures. When the temperature increases, the length
of the structure increases and the Young’s modulus of the materials decreases. As a result, the modal
frequencies will decrease. Nevertheless, the resultant changes of modal frequencies are very small
because the monitoring period covered a range of only 3.6oC. For the damping ratios, the identified
values are highly scattering and no distinct trend can be observed.
In the same fashion as Fig. 8, Fig. 9 shows the relationship between the wind speed and the
modal parameters. For both the modal frequencies and damping ratios, no significant trend can be
concluded with the wind speed. This is due to the fact that the wind was calm throughout the
Fig. 7 Variation of the identified modal frequencies and damping ratios
Structural health monitoring of Canton Tower using Bayesian framework 387
Fig. 8 Identified modal parameters versus ambient temperature
Fig. 9 Identified modal parameters versus wind speed
388 Sin-Chi Kuok and Ka-Veng Yuen
monitoring period. Therefore, the wind loading remained at a low level and the structural behavior
was virtually linear. Of course, as found in previous studies (Jeary 1986, Tamura and Suganuma
1996), severe wind excitation, such as typhoon and hurricane, can induce nonlinear response of
structures. This causes considerable reduction of the modal frequencies and increase of the damping
ratios of the equivalent linear system for modal identification. However, it is necessary to obtain
measurements of the tower in such excitation level for further investigation.
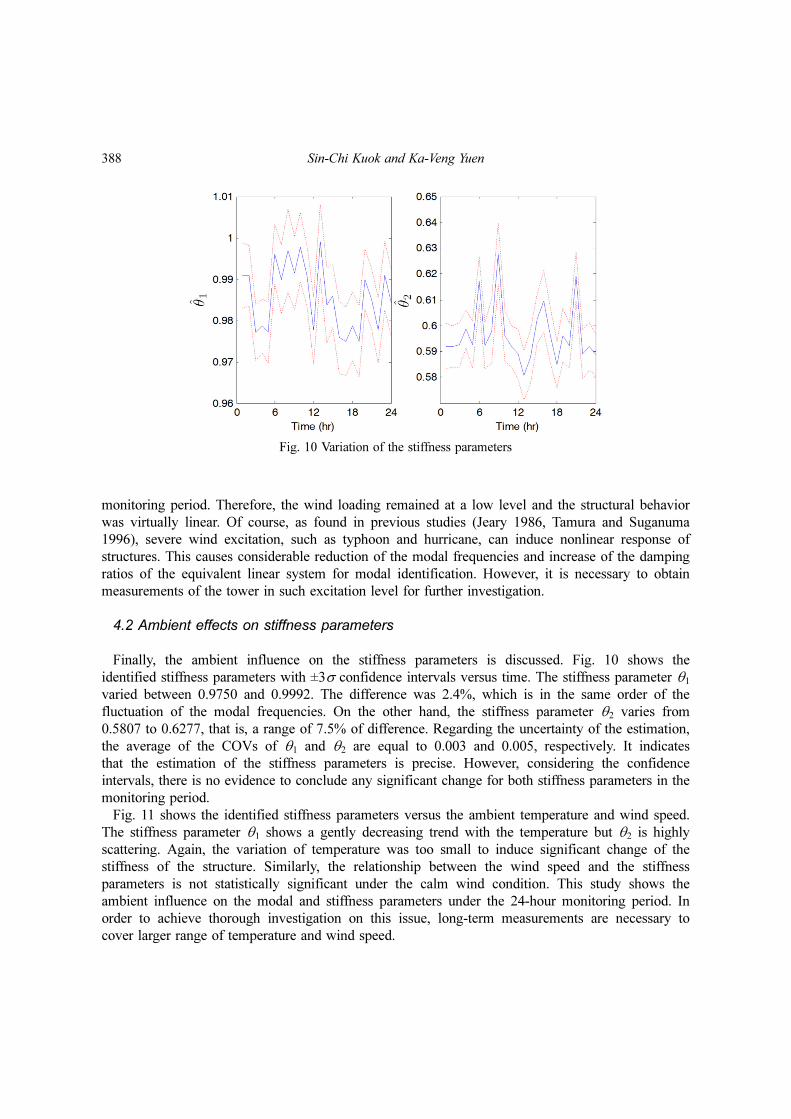
4.2 Ambient effects on stiffness parameters
Finally, the ambient influence on the stiffness parameters is discussed. Fig. 10 shows the
identified stiffness parameters with ±3σ confidence intervals versus time. The stiffness parameter θ1
varied between 0.9750 and 0.9992. The difference was 2.4%, which is in the same order of the
fluctuation of the modal frequencies. On the other hand, the stiffness parameter θ2 varies from
0.5807 to 0.6277, that is, a range of 7.5% of difference. Regarding the uncertainty of the estimation,
the average of the COVs of θ1 and θ2 are equal to 0.003 and 0.005, respectively. It indicates
that the estimation of the stiffness parameters is precise. However, considering the confidence
intervals, there is no evidence to conclude any significant change for both stiffness parameters in the
monitoring period.
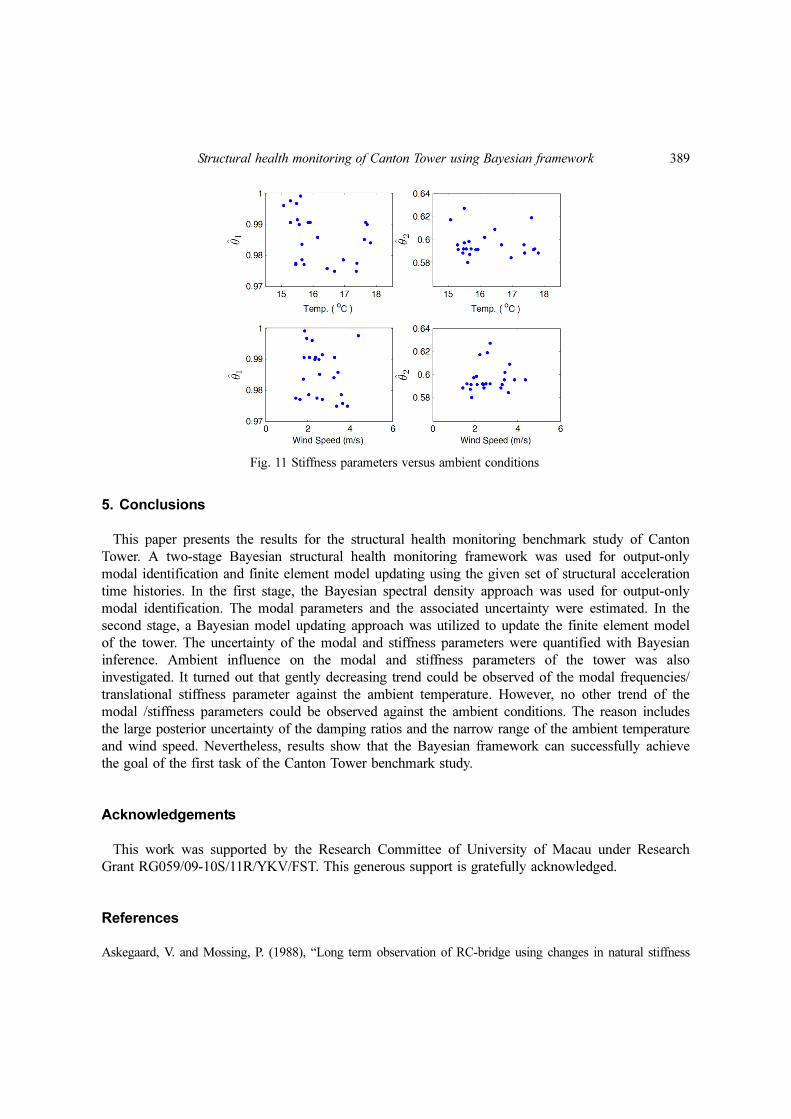
Fig. 11 shows the identified stiffness parameters versus the ambient temperature and wind speed.
The stiffness parameter θ1 shows a gently decreasing trend with the temperature but θ2 is highly
scattering. Again, the variation of temperature was too small to induce significant change of the
stiffness of the structure. Similarly, the relationship between the wind speed and the stiffness
parameters is not statistically significant under the calm wind condition. This study shows the
ambient influence on the modal and stiffness parameters under the 24-hour monitoring period. In
order to achieve thorough investigation on this issue, long-term measurements are necessary to
cover larger range of temperature and wind speed.
Fig. 10 Variation of the stiffness parameters
Structural health monitoring of Canton Tower using Bayesian framework 389
5. Conclusions
This paper presents the results for the structural health monitoring benchmark study of Canton
Tower. A two-stage Bayesian structural health monitoring framework was used for output-only
modal identification and finite element model updating using the given set of structural acceleration
time histories. In the first stage, the Bayesian spectral density approach was used for output-only
modal identification. The modal parameters and the associated uncertainty were estimated. In the
second stage, a Bayesian model updating approach was utilized to update the finite element model
of the tower. The uncertainty of the modal and stiffness parameters were quantified with Bayesian
inference. Ambient influence on the modal and stiffness parameters of the tower was also
investigated. It turned out that gently decreasing trend could be observed of the modal frequencies/
translational stiffness parameter against the ambient temperature. However, no other trend of the
modal /stiffness parameters could be observed against the ambient conditions. The reason includes
the large posterior uncertainty of the damping ratios and the narrow range of the ambient temperature
and wind speed. Nevertheless, results show that the Bayesian framework can successfully achieve
the goal of the first task of the Canton Tower benchmark study.
Acknowledgements
This work was supported by the Research Committee of University of Macau under Research
Grant RG059/09-10S/11R/YKV/FST. This generous support is gratefully acknowledged.
References
Askegaard, V. and Mossing, P. (1988), “Long term observation of RC-bridge using changes in natural stiffness
Fig. 11 Stiffness parameters versus ambient conditions
390 Sin-Chi Kuok and Ka-Veng Yuen
parameters versus ambient conditions frequencies”, Nord. Concr. Res., 7, 20-27.Beck, J.L. (2010), “Bayesian system identification based on probability logic”, Struct.Health Monit., 17(7), 825-
847.Beck, J.L. and Katafygiotis, L.S. (1998), “Updating models and their uncertainties. I: Bayesian statistical
framework”, J. Eng. Mech. - ASCE, 124(4), 455-461.Beck, J.L. and Yuen, K.V. (2004), “Model selection using response measurements: Bayesian probabilistic
approach”, J. Eng. Mech. - ASCE, 130(2), 192-203.Box, G.E.P. and Tiao, G.C. (1992), Bayesian inference in statistical analysis, John Wiley and Sons, New York.Brownjohn, J.M.W. (2007), “Structural health monitoring of civil infrastructure”, Philos. T. R. Soc. A.,365(1851), 589-622.
Chen, W.H., Lu, Z.R., Lin, W., Chen, S.H., Ni, Y.Q., Xia, Y. and Liao, W.Y. (2011), “Theoretical andexperimental modal analysis of the Guangzhou new TV tower”, Eng. Struct., 33(12), 3628-3646.
Ching, J. and Beck, J.L. (2004), “Bayesian analysis of the phase II IASC-ASC structural health monitoringexperimental benchmark data”, J. Eng. Mech. - ASCE, 130(10), 1233-1244.
Clinton, J.F., Bradford, S.C., Heaton, T.H. and Favela, J. (2006), “The observed wander of the natural frequencies ina structure”, B. Seismol. Soc. Am., 96(1), 237-257.
Doebling, S.W., Farrar, C.R., Prime, M.B. and Shevitz, D.W. (1996), Damage Identification and Health Monitoringof Structural and Mechanical Systems from Changes in Their Vibration Characteristics: A Literature Review,Los Alamos National Laboratory Report, LA-13070-MS.
Farrar, C.R. and Doebling, S.W. (1997), An overview of modal-based damage identification methods, LosAlamos National Laboratory, Los Alamos, NM.
Gaitanaros, S., Karaiskos, G., Papadimitriou, C. and Aravas, N. (2010), “A Bayesian methodology for crackidentification in structures using strain measurements”, Int. J. Reliability Saf., 4(2-3), 206-237.
He, J.,Wu, X.P. and Yan, Z.C. (2011), “Anti-wind safety of Guangzhou new TV tower during construction”,Appl. Mech. Mater., 94-96, 1912-1916.
Heylen, W. and Janter, T. (1990), “Extensions of the modal assurance criterion”, J. Vib. Acoust., 112(4), 468-472.Jeary, A.P. (1986), “Damping in tall buildings-a mechanism and a predictor”, Earthq. Eng. Struct. D., 14(5), 733-
750.Johnson, E.A., Lam, H.F., Katafygiotis, L.S. and Beck, J.L. (2004), “Phase I IASC-ASCE structural health
monitoring benchmark problem using simulated data”, J. Eng. Mech. - ASCE, 130(1), 3-15.Kareem, A. and Gurley, K. (1996), “Damping in structures: its evaluation and treatment of uncertainty”, J. Wind
Eng. Ind. Aerod., 59(2-3), 131-157.Katafygiotis, L.S. and Yuen, K.V. (2001), “Bayesian spectral density approach for modal updating using ambient
data”, Earthq. Eng. Struct. D., 30(8), 1103-1123.Krishnaiah, P.R. (1976), “Some recent developments on complex multivariate distributions”, J. Multivariate
Anal., 6(1), 1-30.Lam, H.F., Katafygiotis, L.S. and Mickleborough, N.C. (2004), “Application of a statistical model updating
approach on phase I of the IASC-ASCE structural health monitoring benchmark study”, J. Eng. Mech. - ASCE,130(1), 34-48.
Liu, C. and DeWolf, J.T. (2007), “Effect of temperature on modal variability of a curved concrete bridge underambient loads”, J. Struct. Eng. - ASCE, 133(12), 1742-1751.
Matlab (1994), Matlab User’s Guide, The MathWorks, Inc., Natick, MA.Ni, Y.Q. and Zhou, H.F. (2010), “Guangzhou new TV tower: integrated structural health monitoring and
vibration control”, Proceedings of the 2010 Structure Congress, Orlando, USA, 3155-3164.Ni, Y.Q., Li, B., Lam, K.H., Zhu, D., Wang, Y., Lynch, J.P. and Law, K.H. (2011), “In-construction vibration
monitoring of a super-tall structure using a long-range wireless sensing system”, Smart Struct. Syst., 7(2), 83-102.Ni, Y.Q., Xia, Y., Liao, W.Y. and Ko, J.M. (2009), “Technology innovation in developing the structural health
monitoring system for Guangzhou new TV tower”, Struct. Health Monit., 16(1), 73-98.Ni, Y.Q., Xia, Y., Lin, W., Chen, W.H. and Ko, J.M. (2012), “SHM benchmark for high-rise structures: a
reduced-order finite element model and field measurement data”, Smart Struct. Syst., in this issue.Niu, Y., Kraemer, P. and Fritzen, C.P. (2011), “Operational modal analysis for the Guangzhou new TV tower”,
Proceedings of the 29th International Modal Analysis Conference, Jacksonville, Florida, USA.
Structural health monitoring of Canton Tower using Bayesian framework 391
Sohn, H., Farrar, C.R., Hemez, F.M., Shunk, D.D., Stinemates, D.W. and Nadler, B.R. (2003), A Review ofStructural Health Monitoring Literature: 1996-2001, Los Alamos National Laboratory Report LA-13976-MS.
Tamura, Y. and Suganuma, S. (1996), “Evaluation of amplitude-dependent damping and natural frequency ofbuildings during strong winds”, J. Wind Eng. Ind. Aerod., 59(2-3), 115-130.
Vanik, M.W., Beck, J.L. and Au, S.K. (2000), “A Bayesian probabilistic approach to structural healthmonitoring”, J. Eng. Mech. - ASCE, 126(7), 738-745.
Xia, Y., Xu, Y.L., Wei, Z.L., Zhu, H.P. and Zhou, X.Q., (2011), “Variation of structural vibration characteristicsversus nonuniform temperature distribution”, Eng. Struct., 33(1), 146-153.
Ye, X., Yan, Q., Wang, W., Yu, X. and Zhu, T. (2011), “Output-only modal identification of Guangzhou new TVtower subject to different environment effects”, Proceedings of the 6th International Workshop on AdvancedSmart Materials and Smart Structures Technology, July.
Yuen, K.V. (2010a), Bayesian methods for structural dynamics and civil engineering, John Wiley & Sons, NewYork.
Yuen, K.V. (2010b), “Recent developments of Bayesian model class selection and applications in civil engineering”,Struct. Saf., 32(5), 338-346.
Yuen, K.V. and Beck, J.L. (2003), “Updating properties of nonlinear dynamical systems with uncertain input”, J.Eng. Mech. - ASCE, 129(1), 9-20.
Yuen, K.V. and Katafygiotis, L.S. (2006), “Substructure identification and health monitoring using responsemeasurement only”, Comput. Aided Civ. Inf. Eng., 21(4), 280-291.
Yuen, K.V., Katafygiotis, L.S. and Beck, J.L. (2002), “Spectral density estimation of stochastic vector processes”,Probab. Eng. Mech., 17(3), 265-272.
Yuen, K.V. and Kuok, S.C. (2011), “Bayesian methods for updating dynamic models”, Appl. Mech. Rev., 64(1),010802-1 -- 010802-18.
Zhou, H.F., Ni, Y.Q., Ko, J.M. and Wong, K.Y. (2008), “Modeling of wind and temperature effects on modalfrequencies and analysis of relative strength of effect”, Wind Struct., 11(1), 35-50.