Embed Size (px)
Citation preview

Title: Structural Design of the new Chinese Culture University GymnasiumTaipei, Taiwan
Authors: King-Le Chang, King-Le Chang & AssociatesStephen Huang, Jaelien Engineering Consultant
Subjects: Building Case StudyStructural Engineering
Keywords: CultureStructure
Publication Date: 2004
Original Publication: CTBUH 2004 Seoul Conference
Paper Type: 1. Book chapter/Part chapter2. Journal paper3. Conference proceeding4. Unpublished conference paper5. Magazine article6. Unpublished
© Council on Tall Buildings and Urban Habitat / King-Le Chang; Stephen Huang
ctbuh.org/papers

1278 CTBUH 2004 October 10~13, Seoul, Korea
Structural Design of the new Chinese Culture University Gymnasium Taipei, Taiwan
King-Le Chang 1 , Stephen Huang 2
A. Introduction The gymnasium complex consists of an eight stories main elliptical shaped mix-use gymnasium and a ten stories rectangular administration tower (Fig.1). The site is located at a hill slope at approximately elevation 400 meters above sea level with the full view of Taipei basin over the cliff. The elliptical floor plate is approximately 50 meters by 75 meters (short and long dimensions of the ellipse) and the rectangular floor plate is approximately 15 meters by 60 meters. The building has a four stories basement. The total gross area is approximately 55,000 square meters.
The main elliptical building consists of the pool area at the ground level, multi-use gymnasium areas at levels 2 to 7 and a conference center at the 8th level. All basement floors are for parking and machine rooms. The basement structure is reinforced concrete frame with one-way slab spanning approximately 3.0 meters; the slab system is supported by reinforced concrete beam/column frame. The above grade structure of the rectangular administration tower is structural steel ductile moment frame; it is separated from the main elliptical gymnasium building with a separation joint.
1 King-Le Chang is the managing director of King-Le Chang & Associates and was the managing director & chief structural engineer of Arup’s Los Angeles office. 2 Stephen Huang is the structural engineer of Jaelien Engineering Consultant, Taipei, Taiwan.
Fig. 1

CTBUH 2004 October 10~13, Seoul, Korea 1279
The elliptical gymnasium building is supported by four mega columns and four inter-story arches. The four arches are identical; they are paired on plan with one pair spanning between the 2nd and 5th levels, and the other pair between the 5th and 8th levels (Fig, 2). The elliptical floor plates are “full floors” at the 2nd, 5th and 8th levels. The 3rd, 4th, 6th and 7th floors are “partial floors”, which are hanged from the main arches and will be used as maintenance area and joking lanes. (Fig.3).
Fig. 2
Fig. 3
Level
3,4,6,7
Level
2,5,8

1280 CTBUH 2004 October 10~13, Seoul, Korea
Fig. 5
The building is located in an area of moderate to high seismicity, equivalent to between seismic zones 3 to 4 according to the Uniform Building Code. The structural design of the building is therefore governed by the combination of the gravity and seismic lateral load effects, ductility and post yielding behavior of the seismic energy absorbing system. The paper is to study the framing system for the main elliptical building. B. Structural System
The above grade floor slab system consists of 75mm deep W3 metal deck with 115mm regular weight concrete fill at the main gymnasium floors. The use of the 115mm concrete fill at the gymnasium area is to reduce floor vibration. All steel floor beams are designed composite with the concrete slab.
The primary structural system consists of the four mega-columns and the four arches. The four arches are identical, paired in plan between the 2nd and 5th levels; and between the 5th and 8th levels. These arches are compression elements of the cantilever system with the floor framing at levels 5 and 8 acting as tension ties (Fig. 4). The arches are curved both on plan and on elevation. There are four mega columns, located at the long side of the elliptical floor plate. These mega columns are formed with four-700x700mm steel boxes in filled with high-strength concrete. The 700x700mm boxes are linked together by moment-connected steel members and the steel boxes are approximately 3500mm centers (Fig. 5). Connecting between these mega columns are the braced frames with buckling-restrained bracings (BRB Device) in the X direction and the long span floor trusses in the Y direction. The long span floor trusses are located at the 5th and 8th
Fig. 4

CTBUH 2004 October 10~13, Seoul, Korea 1281
levels; there are buckling-restrained bracing (BRB Device) elements at the bottom chords of the trusses at the supports (Fig. 6 and 7).
The top and bottom chords of the arches are 500mm diameter pipes in filled with high strength concrete; and they are linked together by 350 and 275mm diameter web members (Fig. 5). The arch elements are functioned primary as gravity members, they also resist part of the wind and seismic lateral loadings. It is therefore important to confirm that the arches remain elastic while the building subject to the severe earthquake excitation.
C. General Behavior of Building Frame Under Gravity Loading
Under gravity loading, the global system is primary four mega cantilever trusses with the floor framing at level 5 and 8 acting as tension members and the arches as compression bracings. The overall system’s 15.0 meters depth has sufficient stiffness to span (cantilever) approximately 28 meters from centers of the mega columns (Fig. 8). The deflection of the
Fig. 6 X-Direction Frame Fig. 7 Y-direction Frame
BRB DEVICE
Fig. 8 Partial Elevation of Framing System Composite Cantilever Arch
Compression
Tension
membe
2
1282 CTBUH 2004 October 10~13, Seoul, Korea
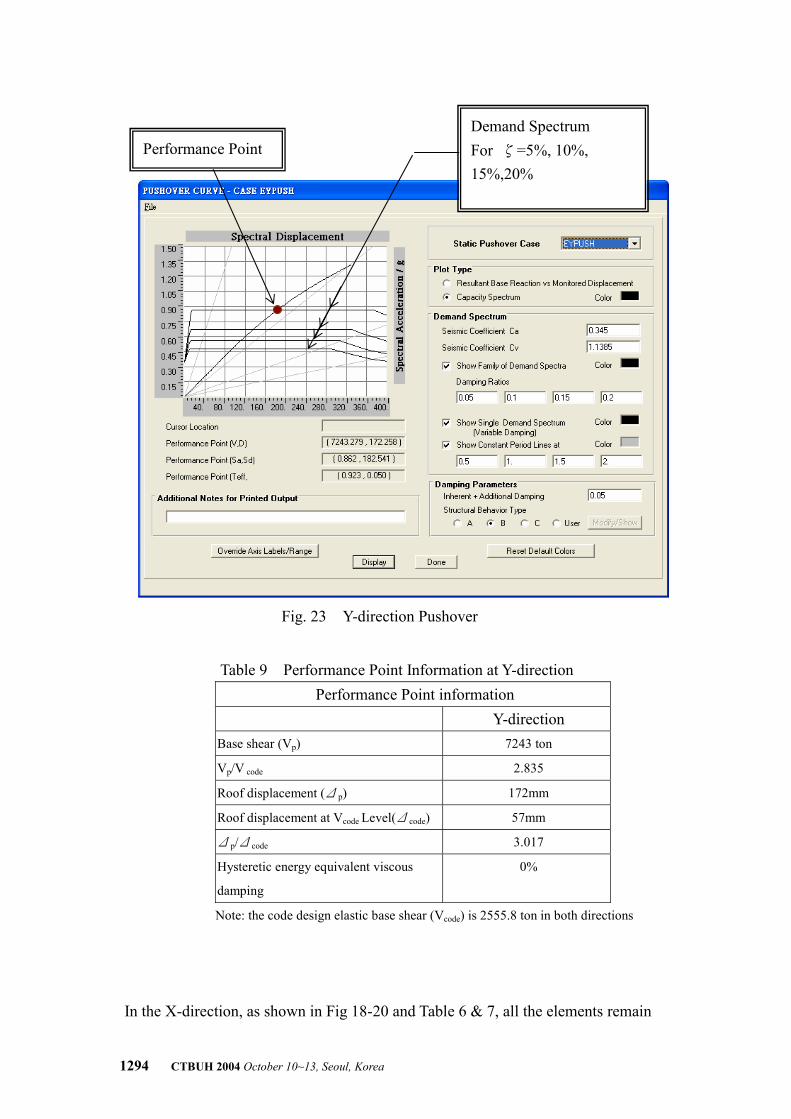
overall arch system under dead load (self weight plus superimposed dead load) and unbalanced live load are as shown on Fig. 9 to 10. Part of the dead load deflection will be cambered during construction.
The steel floor beams, as shown on Fig. 11 on level 5 & 8 were arranged line-up in the design continuously across the floor plate to transfer the tensile forces created by the system’s overall cantilever action.
δ
δULL,max= 4.48cm (δ/L = 1/582)
Fig. 9 Dead Load Deflection
δDL,max= 4.85cm (δ/L=1/577)
δ
Fig. 10 Unbalanced Live Load Deflection
Fig. 11 Floor Framing at Level 5

CTBUH 2004 October 10~13, Seoul, Korea 1283
D. Seismic Design 1. Design Criteria
The Building Code of Taiwan, similar to the Uniform Building Code, is based on the life safety criteria with a set of empirical rules specifying the minimum design seismic loads. With the understanding of the inelastic behavior of the various types of generic structural systems, design criteria associated to these systems were established and requested to be satisfied. Understanding the fundamentals of the Code requirements in terms of strength & ductility and the behavior of the proposed structural system, two sets of design parameters were developed for the proposed structural system’s seismic performance. The first design parameter is an explicit set of quantifiable acceptable criteria defining performance levels, as shown in table 1:
Table 1 Design Criteria Design Earthquake Level 1 (Code Design) Level 2 (Code Design) Level 3 (Performance)Qualitative Performance Level No Damage Repairable Damage No Collapse
Gravity Load System including Main Arches and Columns
No Damage No Damage No Damage
Energy Absorption Device (BRB Devices) Performance
Elastic Ductility u<4 Ductility u<8
Allowable Story Drift Ratio 0.005 0.010 0.015
M.F. Beam Performance Elastic Rotation<0.01 radians Rotation<0.15 radians The second set of design parameter, as shown in table 2, relates the seismic load design levels stated in table 1 to the Taipei basin peak ground motion. The peak ground motions were determined from Taipei City hazard assessment and the Taipei City response analysis, taking into account the seismic performance objectives described in the first design parameter.
Table 2 Design Earthquake Levels
Design Earthquake
Qualitative Description
Probability of Occurrence in
50 Years Return
Period (Year) Corresponding
Effective PGA (g)
Level 1 Occasional 50% 72 0.12
Level 2 Rare 10% 475 0.23 Level 3 Very Rare 2% 2500 0.345
The level 1 earthquake is similar in magnitude to the code level elastic design earthquake, which is the serviceability state event. The level 2 earthquakes correspond to the Code ultimate state level earthquake.

1284 CTBUH 2004 October 10~13, Seoul, Korea
Using the above-mentioned performance based approach; a Code based response spectrum analysis was used to size all the structural members. Following this initial stage of design, the non-linear pushover analysis was used to understand the global behavior of the structural system for its compliance with the design criteria.
2. Buckling-Restrained-Brace Device (BRB) The Buckling Restrained Brace device (BRB) used on the project was developed by Professor K.C. Tsai at the National Center for Research on Earthquake Engineering (NCREE), Taiwan. It is similar in function to the conventional unbounded bracing system. The device consists of two T-shaped steel core members connected to the lateral frame with high-strength bolts and field welding. The T-shaped steel core members are encased in steel tube and confined by infill concrete.
An unbonding material is placed between the T-shaped steel core members and the confining concrete. Refer to Fig. 12 for the BRB device assembly. The introduction of the buckling restrain elements (encase steel tube & concrete infill) to the core steel member will alter the load/deformation relationship of the brace frame as shown on Fig. 13. The design of the BRB Device has gone through numerous tests to confirm its performance in term of strength and ductility. Full-scale test of the BRB device used were also conducted. Refer to section D (5) of this paper for details of the test.
TabPlate
Steel Tube(Buckling Restrained Part)
UnbondingMaterials
Core SteelMember
Concrete(Mortar)
BucklingRestrained
BraceFig. 12 Buckling Restrained Brace Device Assembly

CTBUH 2004 October 10~13, Seoul, Korea 1285
3. Code Based Seismic Analysis
For the code based elastic design, the static seismic loading represents an earthquake loading scaled from the code ultimate earthquake level loading by structural ductility factor, overstrength factor and allowable stress factor. The loading and the factors were calculated per the Taiwan Seismic Code dated November 1996. The seismic base shear obtained corresponds to 20.5% of the building mass and is related approximately to the Uniform Building Code ‘s zone 4 loading. The horizontal and vertical Respond Spectrums of the Taipei Basin are shown on Fig.14. A three dimensional SAP model was used in the spectrum analysis assuming 5% damping. All the primary and secondary elements of the framing system were included in the analysis model. The spectrum analysis base shear was scaled to the static base shear of approximately 2,500 tons in both directions.
The fundamental modes of the building frame are shown in table 3: Table 3 Fundamental Modes Of the Building Frame 1st Mode (Translation Y) 1.24 seconds 2nd Mode (Translation X) 1.20 seconds 3rd Mode (Rotation) 0.99 second
Fig. 13 Load/Deformation Relationship of conventional concentric brace vs. BRB

1286 CTBUH 2004 October 10~13, Seoul, Korea
The lateral displacements and story drift ratios under Code level loading are shown in table 4:
Table 4 Story Drift Ratios Under Code Level Loading
Displacement X Displacement Y Story Drift X Story Drift Y Level 8 38mm 44mm 0.0011 0.0013 Level 5 22mm 23mm 0.0014 0.0016
The story drifts are well below the code allowable of 0.005.
4. Non-Linear Pushover Analysis
Conventional seismic design of buildings is based on an elastic analysis procedure with a scaled (reduced) earthquake loading. The process incorporates the understanding of the inelastic behavior of the structural system, including the system’s strength and ductility. For the proposed unconventional framing system, we are to study and confirm the inelastic behavior of the proposed system under severe earthquake events for the system’s overall stability and ductility. An inelastic pushover analysis was performed on the proposed structural framing system. The process was based on the ATC-40 and FEMA-273 documents. The main objective of the pushover analysis is to develop the structure system’s capacity curve and the
Taipei Basin Vertical N ormalized Design Specturm
0 .0
0 .5
1 .0
1 .5
2 .0
2 .5
3 .0
0.0 0.5 1 .0 1 .5 2 .0 2 .5 3 .0 3 .5 4.0 4 .5
T (s ec)
C
Tv=0.43sec
Fig. 14 Taipei Basin Normalized Design Spectrum
Taipei Basin Horizontal N ormalized Design Specturm
0 .0
0 .5
1 .0
1 .5
2 .0
2 .5
3 .0
0 .0 0 .5 1 .0 1 .5 2 .0 2 .5 3 .0 3 .5 4 .0 4 .5
T (s e c)
C
Th=1.24sec

CTBUH 2004 October 10~13, Seoul, Korea 1287
demand spectrum. The items investigated include: 1. The global yielding mechanism of the lateral load resisting system; 2. The yielding sequence and the plastic rotation demand of all yielding members; 3. The structure performance under severe earthquake event; 4. Verifying the individual element’s plastic deformation demand vs. the ductility
capacity of the elements. Figure 15 illustrates a global pushover (capacity) curve and the three levels of earthquake demand: minor event, moderate event and severe event. The intersection of earthquake demand spectrum with the capacity curve indicates globally how far the building would be pushed and is defined as the Performance Point of the particular event. Individual elements and components tend to reach yield at different global displacements. Full yielding of the structure (capacity curve plateau) implies that all individual elements and components necessary to form a global mechanism have reached their elastic limit. Generally minor event is not expected to cause yielding in the structure, performance point of this level of earthquake is located within the elastic range. Moderate event is expected to cause significant yielding of some structural component, but only moderate damage due to the limited degree of post-yield response. Major event is expected to push at least some of the structural components significantly past yield and thus extensive damage of structural system will occur. The pushover analysis provided framing performance data (demand data) to confirm the
Minor Event (Level 1)
Moderate Event (Level 2)
Severe Event (Level 3)
Demand Spectra Capacity Curve
Bui
ldin
g Fo
rce
Building Displacement
Building Response Curve
Fig. 15 Building’s Capacity Curve vs. Earthquake Demand Curve
Performance Point
of Level 3 Event Performance Point
of Level 2 Event
Performance Point
of Level 1 Event

1288 CTBUH 2004 October 10~13, Seoul, Korea
system’s compliance with the design criteria specified in section D(1), especially the mega-columns and the primary arches that are the primary gravity load supporting members and therefore needed to maintain their gravity load supporting capacity during a major seismic event. The pushover analysis model incorporates inelastic material response of the structural frame. The pushover process is to displace the structural frame to a target displacement, with continuously increase lateral loadings. The resulting member deformations and forces are determined at each loading step. The nonlinear load-deformation characteristics of individual components of building structure are included in the analysis. The mathematical model of the building structure is subjected to the monotonically lateral forces of code-base distribution and increasing displacements until either a target displacement is exceeded or the building collapses. The stiffness and strength properties of all steel members were developed using the data from FEMA 273 chapter 5. The load-deformation curve of all steel members for post-yielding behavior is as shown on Fig. 16. The post-yielding stiffness assumes a strain-hardening slope of 2% of the elastic slope. The X-axis indicates the deformation ratio to yielding deformation and Y-axis is force ratio to yielding strength. For axial capacity, Δrepresents actual deformation and Δy is yield deformation. For bending capacity, θ represents the element rotation and θy is the yield rotation. With the loading increase, element yields and plastic hinge forms. While the plastic deformation exceed the element ductility capacity, (as showed as distance “d” and point “C”), the stiffness degraded and section resistance reduced to “residual strength”. Eventually the element ruptures at point “E”.
Definition of the parameters for generalized post-yielding behavior
Fig. 16 Load and Deformation Relationship of Framing Members
LS IO CP A
D
CB
E
Deformation Ratio
Forc
e R
atio
P/P
y or M
/My
Δy/Δ or θy/θ
2%K
K
d e
c
1.0
IO: Immediate Occupancy
LS: Life Safety
CP: Collapse Prevention
1.0

CTBUH 2004 October 10~13, Seoul, Korea 1289
Table 5 Post Yielding Parameters of Framing Member
Δ/Δy or θ/θy Element Type Yielding Type
c d e IO LS CP BRB Device
PureAxial strength Pcr=Pt=Fy 0.6 8 10 2 8 10
Moment Frame at Admin. Building
P-M-M Type Pcr, Mx, My 0.6 10 12 2 7 9
Mega truss P-M-M Type Pcr, Mx, My 0.6 10 12 2 7 9
Mega columns
P-M-M Type Pcr, Mx, My 0.2 3 6 1 3 5
Arch members
P-M-M Type Pcr, Mx, My 0.2 3 6 1 3 5
Note: The parameter c, d, e, is the residual strength and ductility ratio define in Fig. 16 For the proposed structural system, the lateral system’s elements were grouped into five categories: BRB devices, moment frame beams, top & bottom chord of mega trusses, mega columns and arches members. The yielding type could be classified as pure axial yielding and bi-axial bending/axial force interactive yielding. Except for the BRB devices, all of the steel members are axial/moment interaction type and the yield experimental information was derived from FEMA 273. In the analysis model, the definitions of the nonlinear parameters of these members are as illustrated in Figure 16 and Table 5. The yielding interaction equations of members subjected to axial compression and biaxial bending was defined as follows:
For 2.0≥n
u
PP
0.198
≤
++
ny
uy
nx
ux
n
u
MM
MM
PP
For 2.0<n
u
PP
0.12
≤
++
ny
uy
nx
ux
n
u
MM
MM
PP
Where Pu = the demand axial strength. Pn = the nominal axial strength.
Mux = the demand flexural strength in major axis. Mnx = the nominal flexural strength in major axis.
Muy = the demand flexural strength in minor axis. Mny = the nominal flexural strength in minor axis The interaction relationship is per the AISC “Load and Resistance Factor Design

1290 CTBUH 2004 October 10~13, Seoul, Korea
Fig. 17 Stress/Strain relationship of BRB
Specification for Structural Steel Building”. For the BRB devices, as discussed in section D (2), the buckling restrain elements of the device will alter the load/deformation curve of the device. Base on the research work by professor K.C. Tsai at NCREE, the double-cored BRB can sustain severe inelastic cyclic axial strain reversals as high as 1.5%, which is approximate 8 times the yielding strain. The nonlinear parameter of BRB is illustrated as Table 5 and its stress/strain relationship illustrated in Fig.17
In the pushover analysis, gravity sustained loads, including 100% dead load and 50% live load, were applied to the structural framing to simulate loadings applied to the system before the system subjected to the pushover lateral loading.
While developing the capacity curve of the system, the target roof displacement was limited to 1.5% of the building height, and the load pattern was proportional to the load distribution of code level earthquake. The demand spectrum was derived from the level 3 earthquake (severe earthquake), i.e. 2500 year returned period, with damping ratio of 5%, 10%, 15% and 20%. The result of the pushover analysis is summarized as shown on Fig. 18, 19, 20, 21,22 &23 and table 6,7,8 &9: (1). X-Direction
Fig 18 X-Direction Capacity Curve
Performance Point at level 3 event
Code Base Shear First Hinge
Roof Displacement (mm)
Bas
e Sh
ear (
ton)

CTBUH 2004 October 10~13, Seoul, Korea 1291
Fig. 19 X-direction Hinge distribution at Performance Point
Table 6 Summary of X-direction Capacity Curve
X-direction (long dimension of ellipse) Mark Step No. Roof Disp. (mm) Performance description A 33 60.5 Code design elastic earthquake base shear
B 53 93.2 First plastic hinge of system formed. (occur at BRB)
55-64 97.9~116 Structural significant yield
C 83 148 “Performance point” , hinge occurs only at BRB
devices, plastic deformation demand≦2.0Δy
Other members remain elastic.
D 200 350 Analysis terminated.
1292 CTBUH 2004 October 10~13, Seoul, Korea
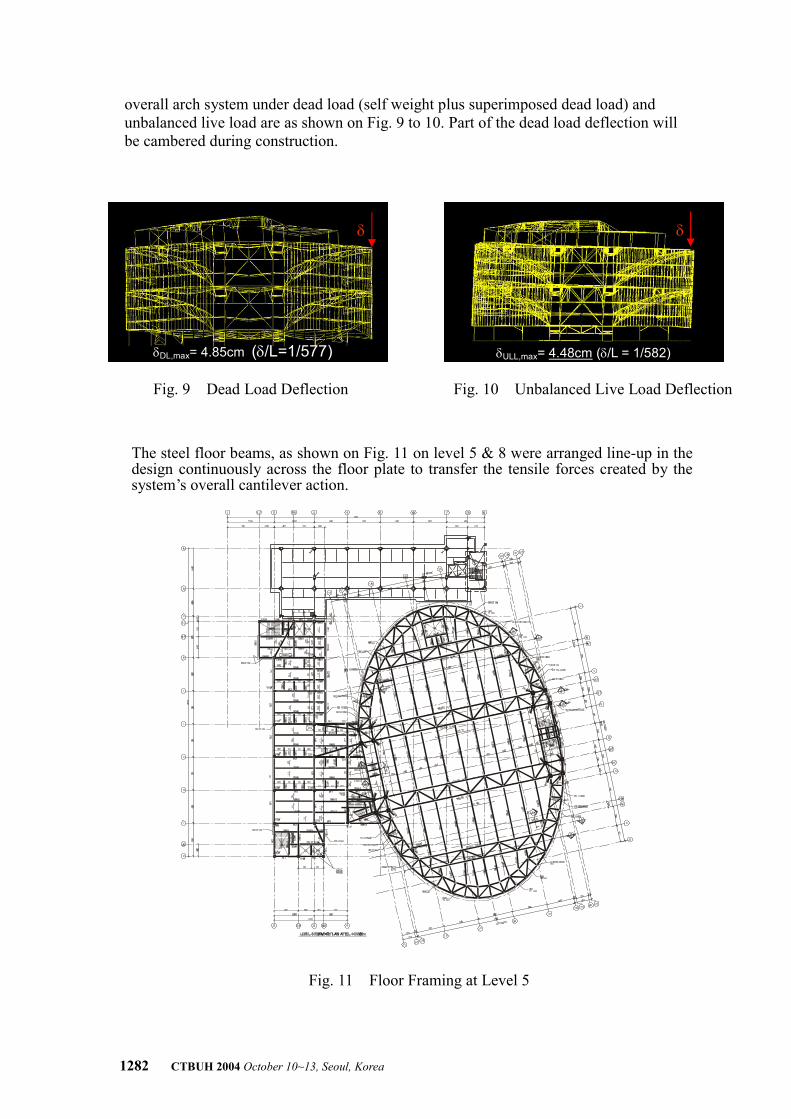
Table 7. Performance Point Information at X-direction Performance Point information
X-direction Base shear (Vp) 5026 ton
Vp/V code 1.967
Roof displacement (Δp) 148 mm
Roof displacement at Vcode Level(Δcode) 60.5mm
Δp/Δcode 2.446
equivalent damping by Hysteretic energy 7.5%
Note: the code design elastic base shear (Vcode) is 2555.8 ton in both directions
Fig. 20 X-direction Pushover
Demand Spectrum For ζ=5%, 10%, 15%,20%
Performance Point

CTBUH 2004 October 10~13, Seoul, Korea 1293
Fig. 22 Y-direction Hinge distribution at Performance Point
(2). Y-Direction
Table 8 Performance Point information at Y-direction Y-direction (short dimension of ellipse)
Step No. Roof Disp. (mm) Performance 33 57 Code design elastic earthquake base shear
50 87.9 First plastic hinge of system formed (occurred at BRB)
92 172 “Performance point”, Plastic deformation demand of BRB ≦2.0Δy Plastic deformation demand oft Moment Frame of rectangular building≦2.0θy Arches members remain elastic.
172 313 Analysis terminated.
Fig 21 Y-Direction Capacity Curve
Performance Point at level 3 event
Code Base Shear First Hinge
Roof Displacement (mm)
Bas
e Sh
ear (
ton)
1294 CTBUH 2004 October 10~13, Seoul, Korea
Fig. 22 X-direction Hinge distribution at Performance Point
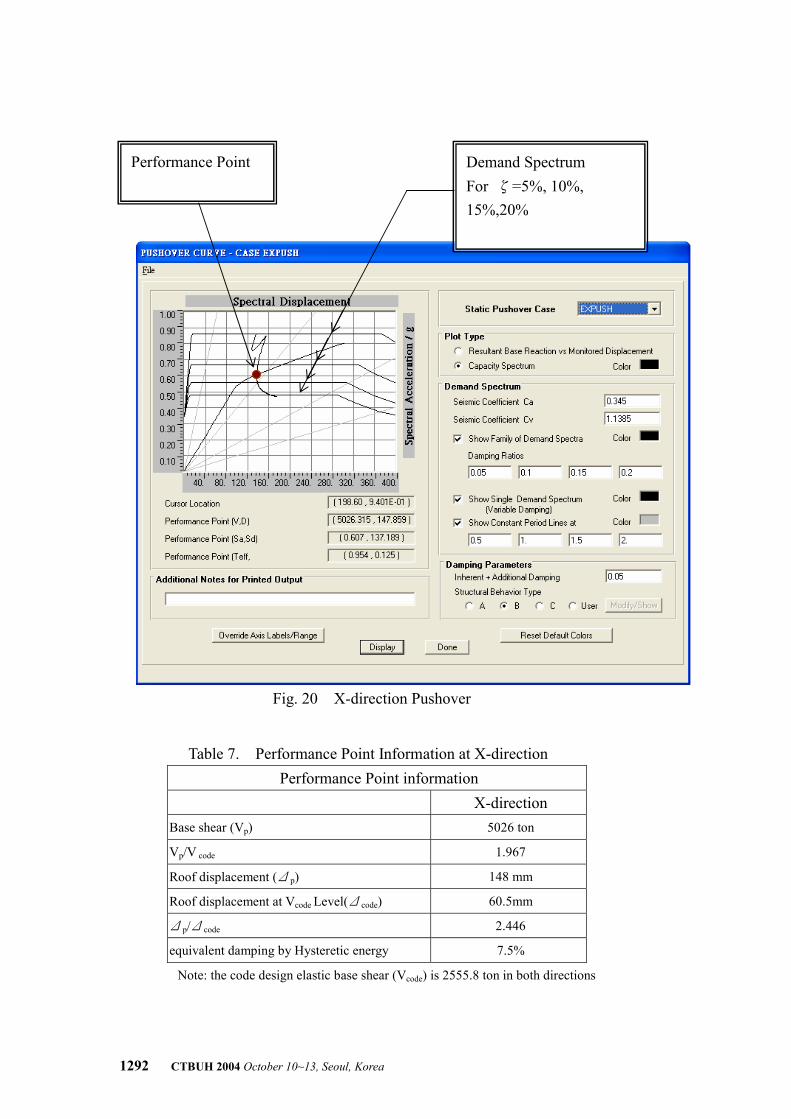
Table 9 Performance Point Information at Y-direction Performance Point information
Y-direction Base shear (Vp) 7243 ton
Vp/V code 2.835
Roof displacement (Δp) 172mm
Roof displacement at Vcode Level(Δcode) 57mm
Δp/Δcode 3.017
Hysteretic energy equivalent viscous
damping
0%
Note: the code design elastic base shear (Vcode) is 2555.8 ton in both directions
In the X-direction, as shown in Fig 18-20 and Table 6 & 7, all the elements remain
Fig. 23 Y-direction Pushover
Demand Spectrum For ζ=5%, 10%, 15%,20%
Performance Point

CTBUH 2004 October 10~13, Seoul, Korea 1295
elastic under the severe event except the BRB devices. The BRB is the primary element in terms of strength and stiffness of the whole system. After the BRB yields, the global yield mechanism forms, the capacity curve plateau developed since the majority of the stiffness reduce. The plastic deformation demand of BRB is approximately two times the yielding deformation. The roof displacement corresponding to the severe event is 2.5 times the displacement at code elastic design level. The relative roof story drift corresponding to severe event is approximately 0.6% of the story height. The effective damping ratio resulting from the BRB hysteretic energy is 7.5%. In the Y-direction, as shown in Fig 21-23 and Table 8&9, the stiffness of whole system remains almost linear without any reduction under the severe event. Some of the element yields, which include BRB devices, the connections of moment resistant frame. The plastic deformation demand of BRB is approximately two times the yielding deformation and the plastic deformation demand of moment connection is also twice the yielding rotation. By comparing the post yielding parameters specified in Table 5,which stated the plastic capacity of moment connection could be 10 times the yielding rotation. The roof displacement corresponding to severe event is 3.0 times of the displacement to code elastic design level. The relative roof story drift correspond to severe event is approximated to 0.5% of the story height. Since stiffness of the whole system remains almost elastic under the severe event, the effective damping ratio resulting from the hysteretic energy is zero. The overall result of the pushover analysis indicated that the ductility and capacity of the proposed structure is adequate to sustain the severe earthquake excitation, and all members of the gravity system (including the arches) remain elastic and thus maintain the stability of building structure.
5. Full Scale Test Of BRB Device
In order to confirm the behavior of the double-cored BRB device used in the project to satisfy the performance provisions for buckling-restrained braced frame components, full-scale nonlinear component tests were conducted in NCREE. The performance provision for the buckling-restrained braced frame components is based on AISC/SEAOC “Recommended Provisions for Buckling-Restrained Braced Frames” dated 10/2001, it includes the following requirements: 1. The BRB device is to exhibit stable hysteretic behaviors and stable axial stiffness
under non-linear cyclic loadings. Before the device’s end rotation which corresponding to 2.25% radian of the story drift, the difference between tensile and compression capacities of BRB device shall be less than 30%;
1296 CTBUH 2004 October 10~13, Seoul, Korea
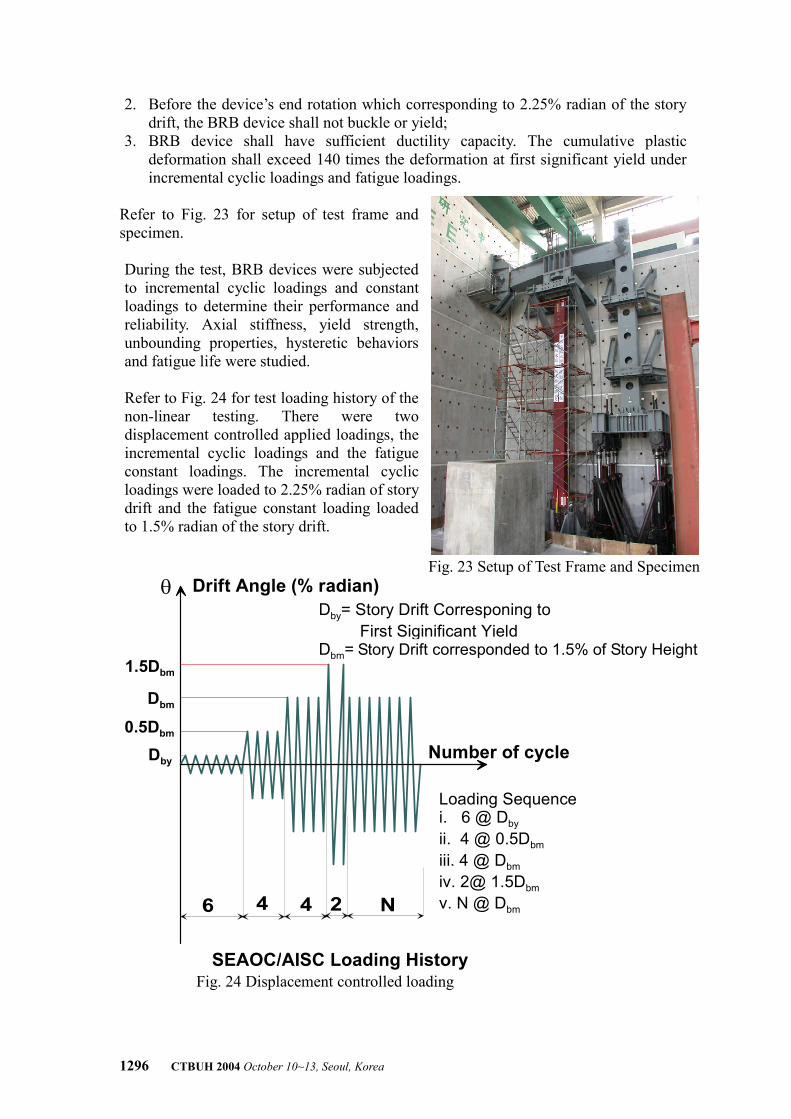
2. Before the device’s end rotation which corresponding to 2.25% radian of the story drift, the BRB device shall not buckle or yield;
3. BRB device shall have sufficient ductility capacity. The cumulative plastic deformation shall exceed 140 times the deformation at first significant yield under incremental cyclic loadings and fatigue loadings.
Refer to Fig. 23 for setup of test frame and specimen. During the test, BRB devices were subjected to incremental cyclic loadings and constant loadings to determine their performance and reliability. Axial stiffness, yield strength, unbounding properties, hysteretic behaviors and fatigue life were studied. Refer to Fig. 24 for test loading history of the non-linear testing. There were two displacement controlled applied loadings, the incremental cyclic loadings and the fatigue constant loadings. The incremental cyclic loadings were loaded to 2.25% radian of story drift and the fatigue constant loading loaded to 1.5% radian of the story drift.
Drift Angle (% radian)
1.5Dbm
Dbm
0.5Dbm
4
Number of cycle
θ
Dby
Dby= Story Drift Corresponing to First Siginificant YieldDbm= Design Story Drift
6 4 2 N
Loading Sequencei. 6 @ Dby
ii. 4 @ 0.5Dbm
iii. 4 @ Dbm
iv. 2@ 1.5Dbm
v. N @ Dbm
SEAOC/AISC Loading History
Fig. 23 Setup of Test Frame and Specimen
Fig. 24 Displacement controlled loading
Story Drift corresponded to 1.5% of Story Height
CTBUH 2004 October 10~13, Seoul, Korea 1297
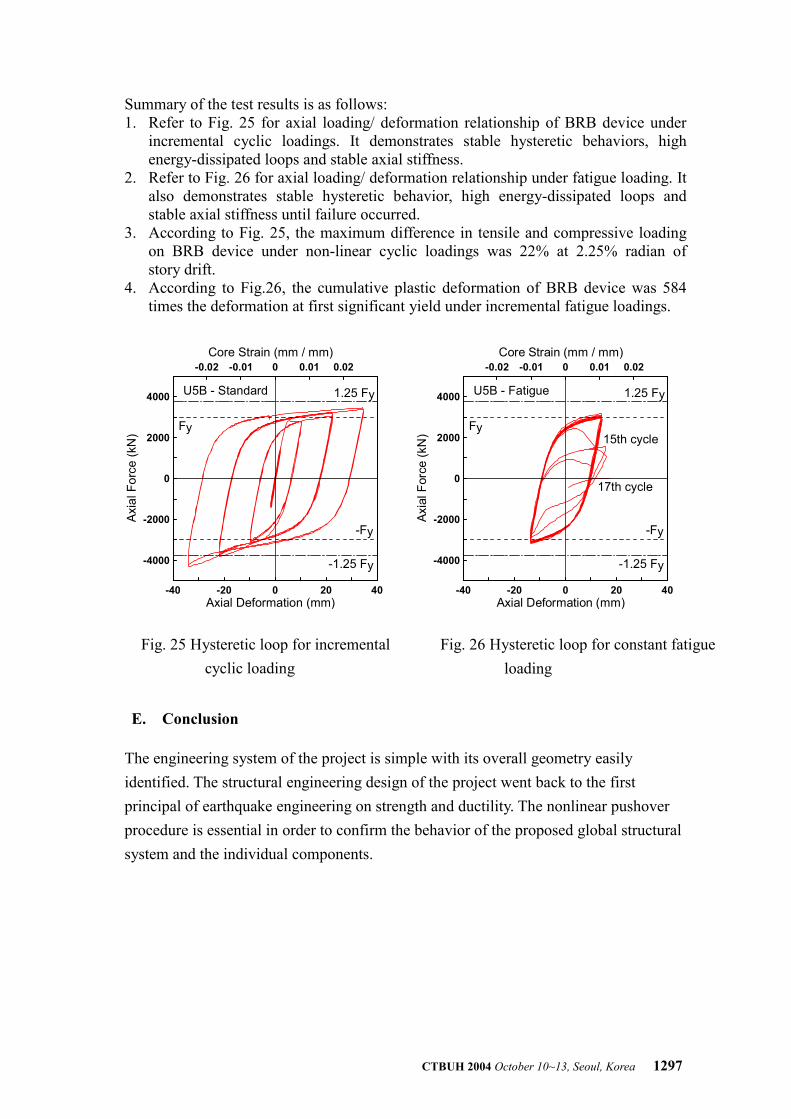
Summary of the test results is as follows: 1. Refer to Fig. 25 for axial loading/ deformation relationship of BRB device under
incremental cyclic loadings. It demonstrates stable hysteretic behaviors, high energy-dissipated loops and stable axial stiffness.
2. Refer to Fig. 26 for axial loading/ deformation relationship under fatigue loading. It also demonstrates stable hysteretic behavior, high energy-dissipated loops and stable axial stiffness until failure occurred.
3. According to Fig. 25, the maximum difference in tensile and compressive loading on BRB device under non-linear cyclic loadings was 22% at 2.25% radian of story drift.
4. According to Fig.26, the cumulative plastic deformation of BRB device was 584 times the deformation at first significant yield under incremental fatigue loadings.
-40 -20 0 20 40Axial Deformation (mm)
-4000
-2000
0
2000
4000
Axia
l For
ce (k
N)
-0.02 0 0.02-0.01 0.01Core Strain (mm / mm)
1.25 Fy
-1.25 Fy
Fy
-Fy
U5B - Standard
-40 -20 0 20 40
Axial Deformation (mm)
-4000
-2000
0
2000
4000
Axia
l For
ce (k
N)
-0.02 0 0.02-0.01 0.01Core Strain (mm / mm)
1.25 Fy
-1.25 Fy
Fy
-Fy
U5B - Fatigue
15th cycle
17th cycle
E. Conclusion
The engineering system of the project is simple with its overall geometry easily identified. The structural engineering design of the project went back to the first principal of earthquake engineering on strength and ductility. The nonlinear pushover procedure is essential in order to confirm the behavior of the proposed global structural system and the individual components.
Fig. 25 Hysteretic loop for incremental cyclic loading
Fig. 26 Hysteretic loop for constant fatigue loading
1298 CTBUH 2004 October 10~13, Seoul, Korea
F. Reference
1. Federal Emergency Management Agency, “NEHRP Guidelines for the Seismic Rehabilitation of Buildings” , FEMA 273 Oct, 1997.
2. California Seismic Safety Commission-Applied Technology Council, “Seismic Evaluation And Retrofit of Concrete Buildings Volume 1”, ATC-40, Report No SSC96-01.
3. EERI Technical Seminar Series, “Earthquake Analysis Methods: Predicting Building Behavior” , 1999.
4. Federal Emergency Management Agency, “Recommended Seismic Design Criteria For New Steel Moment-Frame Buildings”, FEMA 350 July, 2000.
5. American Institute of Steel Construction Inc, “ Load and Resistance Factor Design Specification for Structural Steel Buildings”,1993
6. The Ministry of Interior of R.O.C. , Taiwan, “The Seismic Design Criteria and Commentary”,1996.
7. Chinese Society of Structural Engineering, “Provision, Commentary and Example for wind loads on buildings”, June 1996 (referred to as “Building Wind Loads Provisions”)
8. K. C. Tsai and Chung-Hsin Weng “Experimental Responses of Double-Tube Unbonded Brace Elements and Connections” Center for Earthquake Engineering Research of National Taiwan University, 2002, July.
9. K. C. Tsai and Yen-Chih Huang “Experimental Responses of Large Scale Buckling Restrained Brace Frames” Center for Earthquake Engineering Research of National Taiwan University, 2002, July.
10. K. C. Tsai, Jiun-Wei Lai, Yean-Chih Huang, Shen-Ling Lin and Chong-Hsing Weng, “Research And Application of Double-Core Buckling Restrained Braces In Taiwan”, 13th World Conference on Earthquake Engineering Vancouver, Canada, August 2004, paper No 2179.
11. J. W. Lai, K. C. Tsai, P. C. Hsiao, and Shen-Ling Lin “Research And Application of Double-Core Buckling Restrained Braces In Taiwan”, 1st Asia Conference on Earthquake Engineering , 2004