Embed Size (px)
DESCRIPTION
Structural Concrete, the official journal of the fib, provides conceptual and procedural guidance in the field of concrete construction, and features peer-reviewed papers, keynote research and industry news covering all aspects of the design, construction, performance in service and demolition of concrete structures.
Citation preview

1Volume 16March 2015ISSN 1464-4177
- Eurocode 2 – analysis of National Annexes
- Extended design parameters for columns in fire with 2nd order effects
- Low-strength mortars – EC/US code approaches
- Bond/Anchorage of steel bars in fib Model Code 2010
- Bond behaviour of normal- and high-strength RAC
- 5-spring model for full shear behaviour of deep beams
- Transverse stresses and bursting forces in post-tensioned anchorages
- Derivation of σ-w relationship for SFRC with bending tests
- Thin-walled TRC shells – Part I: Design and construction
- Thin-walled TRC shells – Part II: ULS assessment, simulation
- Quality assessment of material models for RC flexural members
- Small-scale tests for composite slab design

HALFEN GmbH • Liebigstrasse 14 • 40764 Langenfeld • GermanyTel.: +49 (0) 2173 970-9020 • Fax: +49 (0) 2173 970-450 • www.halfen.com
European.Technical. Approved.
HALFEN Cast-in channels ETA approved and -marked
March 2015ISSN 1464-4177 (print)ISSN 1751-7648 (online)
3Bautechnik 81 (2004), Heft 1
Contents
Structural Concrete Vol. 16 / 1
Message from the president1 Harald S. Müller
From accomplishments to challenges
Technical Papers3 Anett Ignatiadis, Frank Fingerloos, Josef Hegger, Frederik Teworte
Eurocode 2 – analysis of National Annexes
17 Lijie Wang, Robby Caspeele, Ruben Van Coile, Luc TaerweExtension of tabulated design parameters for rectangular columns exposed to firetaking into account second-order effects and various fire models
36 François Duplan, Ariane Abou-Chakra, Anaclet Turatsinze, Gilles Escadeillas, Stéphane Brûlé,Emmanuel Javelaud, Frédéric MasséOn the use of European and American building codes with low-strength mortars
45 John CairnsBond and anchorage of embedded steel reinforcement in fib Model Code 2010
56 M. John Robert Prince, Bhupinder SinghBond behaviour of normal- and high-strength recycled aggregate concrete
71 Boyan MihaylovFive-spring model for complete shear behaviour of deep beams
84 Lin-Yun Zhou, Zhao Liu, Zhi-Qi HeFurther investigation of transverse stresses and bursting forces in post-tensioned anchorage zones
93 Ali Amin, Stephen J. Foster, Aurelio MuttoniDerivation of the σ-w relationship for SFRC from prism bending tests
106 Alexander Scholzen, Rostislav Chudoba, Josef HeggerThin-walled shell structures made of textile-reinforced concretePart I: Structural design and construction
115 Alexander Scholzen, Rostislav Chudoba, Josef HeggerThin-walled shell structures made of textile-reinforced concretePart II: Experimental characterization, ultimate limit state assessment and numericalsimulation
125 Bastian Jung, Guido Morgenthal, Dong Xu, Hendrik SchröterQuality assessment of material models for reinforced concrete flexural members
137 Josef Holomek, Miroslav Bajer, Jan Barnat, Pavel SchmidDesign of composite slabs with prepressed embossments using small-scale tests
fib-news149 The fib in Russia: new standards150 Worldwide representation at ACF 2014151 DISC2014: the past and the future151 Old for new: Penang Bridge152 A venerable institute turns 80152 JPEE2014 in Lisbon153 fib MC2010 course in Brazil153 Short notes155 Nigel Priestley † 1943–2014156 Congresses and symposia157 Acknowledgement
A5 Products and Projects
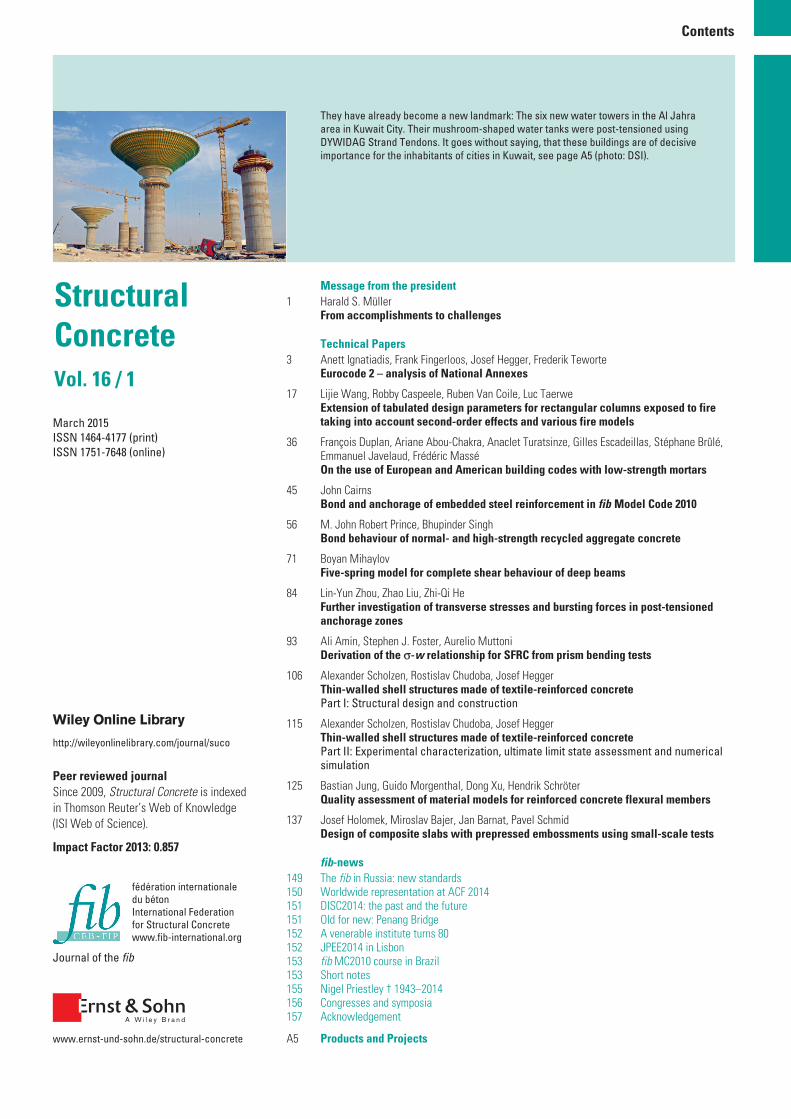
They have already become a new landmark: The six new water towers in the Al Jahraarea in Kuwait City. Their mushroom-shaped water tanks were post-tensioned using DYWIDAG Strand Tendons. It goes without saying, that these buildings are of decisive importance for the inhabitants of cities in Kuwait, see page A5 (photo: DSI).
fédération internationale du bétonInternational Federation for Structural Concrete www.fib-international.org
Journal of the fib
Peer reviewed journalSince 2009, Structural Concrete is indexed in Thomson Reuter’s Web of Knowledge (ISI Web of Science).
Impact Factor 2013: 0.857
www.ernst-und-sohn.de/structural-concrete
http://wileyonlinelibrary.com/journal/suco
The journal “Structural Concrete”, the official journal of the Inter -national Federation for Structural Concrete (fib – fédérationinternationale du béton), provides conceptual and proceduralguidance in the field of concrete construction, and features peer-reviewed papers, keynote research and industry news covering allaspects of the design, construction, performance in service anddemolition of concrete structures.
“Structural Concrete” is published four times per year completely inEnglish.
Except for a manuscript, the publisher Ernst & Sohn purchasesexclusive publishing rights. Only works are accepted for publication,whose content has never been published before. The publishingrights for the pictures and drawings made available are to beobtained from the author. The author undertakes not to reprint hisarticle without the express permission of the publisher Ernst & Sohn.The “Notes for authors” regulate the relationship between authorand editorial staff or publisher, and the composition of articles. Thesecan be obtained from the publisher or in the Internet at www.ernst-und-sohn.de/en/journals.
The articles published in the journal are protected by copyright. Allrights, particularly that of translation into foreign languages, arereserved. No part of this journal may be reproduced in any formwithout the written approval of the publisher. Names of brands ortrade names published in the journal are not to be considered freeunder the terms of the law regarding the protection of trademarks,even if they are not individually marked as registered trademarks.
Manuscripts can be submitted via ScholarOne Manuscripts atwww.ernst-und-sohn.de/suco/for_authors
If required, special prints can be produced of single articles. Requestsshould be sent to the publisher.
Publisherfib – International Federation for Structural ConcreteCase Postale 88, CH-1015 Lausanne,Switzerlandphone: +41 (0)21 693 2747, fax: +41 (0)21 693 6245e-mail: [email protected], Website: www.fib-international.org
Publishing houseWilhelm Ernst & SohnVerlag für Architektur und technische Wissenschaften GmbH & Co. KGRotherstraße 2110245 Berlin/Germanyphone: +49 (0)30/47031-200fax: +49 (0)30/47031-270e-mail: [email protected], Website: www.ernst-und-sohn.de
Managing editorFrancisco Velasco, Verlag Ernst & SohnRotherstraße 21, D-10245 Berlinphone: +49 (0)30/47031-277, fax: +49 (0)30/47031-227e-mail: [email protected]
Advertising managerFred Doischer, Verlag Ernst & Sohnphone: +49 (0)30/47031-234
AdvertisingAnnekatrin Gottschalk, Verlag Ernst & SohnRotherstraße 21, D-10245 Berlinphone: +49 (0)30/4 70 31-2 49, fax: +49 (0)30/4 70 31-2 30e-mail: [email protected]
Layout and typesetting: TypoDesign Hecker GmbH, LeimenPrinting: ColorDruck Solutions GmbH, Leimen
Editorial boardEditor-in-Chief� Luc Taerwe (Belgium), e-mail: [email protected]
Deputy Editor� Steinar Helland (Norway), e-mail: [email protected]
Members� György L. Balázs (Hungary)� Josée Bastien (Canada)� Mikael Braestrup (Denmark)� Tom d’ Arcy (USA)� Michael Fardis (Greece)� Stephen Foster (Australia)� Sung Gul Hong (Korea)� Tim Ibell (UK)� S.G. Joglekar (India)� Akio Kasuga (Japan)� Daniel A. Kuchma (USA)� Gaetano Manfredi (Italy)� Pierre Rossi (France)� Guilhemo Sales Melo (Brazil)� Petra Schumacher (Secretary General fib)� Tamon Ueda (Japan)� Yong Yuan (China)
Current pricesThe journal Structural Concrete has four issues per year. In additionto “Structural Concrete print”, the PDF version “Structural Concreteonline” is available on subscription through the online service WileyOnline Library.
print print print + online print + online Single copy (personal) (institutional) (personal) (institutional) (print)
180.00 € 749.00 € 216.00 € 899.00 € 51.00 €
Other currencies and bulk discounts are available on request.Members of the fib receive the journal Structural Concrete as part oftheir membership.Prices exclusive VAT and inclusive postage, errors and omissionsexcepted. Subject to change without notice. Prices are valid until 31 August 2015.A subscription lasts for one year. It can be terminated in writing at any time with a period of notice of three months to the end of thecalendar year. Otherwise, the subscription extends for a further yearwithout written notification.
Bank detailsCommerzbank AG Mannheimaccount number 751118800bank sort code 67080050SWIFT: DRESDEFF670Structural Concrete, ISSN 1464-4177, is published quarterly. USmailing agent: SPP, PO Box 437, Emigsville, PA 17318. Periodicalspostage paid at Emigsville PA.Postmaster: Send all address changes to Structural Concrete, JohnWiley & Sons Inc., c/o The Sheridan Press, PO Box 465, Hanover,PA 17331.
Service for customers and readersWiley-VCH Customer Service for Ernst & SohnBoschstrasse 12, D-69469 WeinheimTel.: +49 (0)800 1800 536 (within Germany)Tel.: +44 (0)1865476721 (outside Germany)Fax: +49 (0)6201 [email protected]
Quicklink: www.wileycustomerhelp.com
© 2015 Ernst & Sohn Verlag für Architektur und technischeWissenschaften GmbH & Co. KG, Berlin
Imprint
Structural Concrete 16 (2015), No. 1
Inserts in this issue: Verlag Ernst & Sohn GmbH & Co. KG, 10245 Berlin
A5Responsible for Products & Projects: Publishing House Ernst & Sohn Structural Concrete 16 (2015), No. 1
Products & Projects
DYWIDAG Ring Tendons stabilize Kuwait’s new Landmark
Afterwards, concreting, post-tensioning and grouting of the ten-dons were carried out using the equipment that had been sup-plied by DSI.
Further Information:DSI Holding GmbH, Destouchesstrasse 68, 80796 Munich, Germany, Tel. +49 (0)89 – 30 90 50-200, Fax +49 (0)89 – 30 90 50-215, [email protected], www.dywidag-systems.com
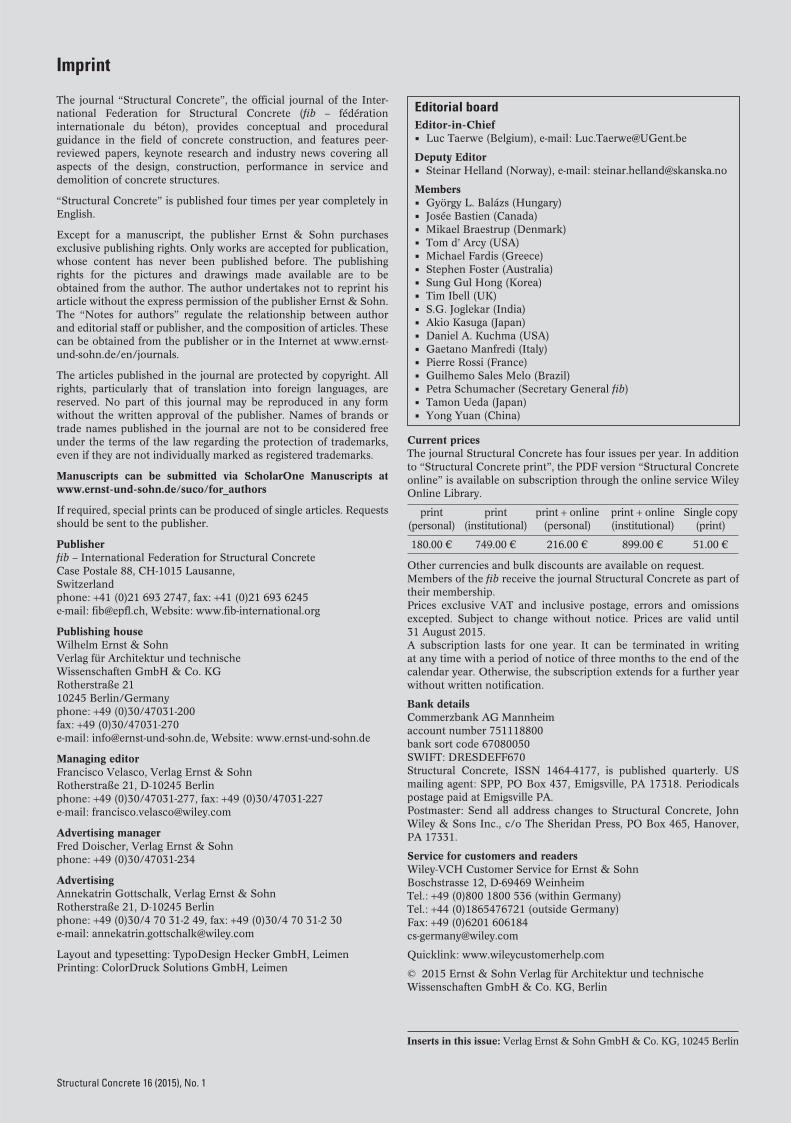
Water is a valuable commodity in Kuwait – bottled water iseven more expensive than petrol. Consequently, the six newwater towers that were built in the Al Jahra area in KuwaitCity are an investment of decisive importance for cities inthat country.
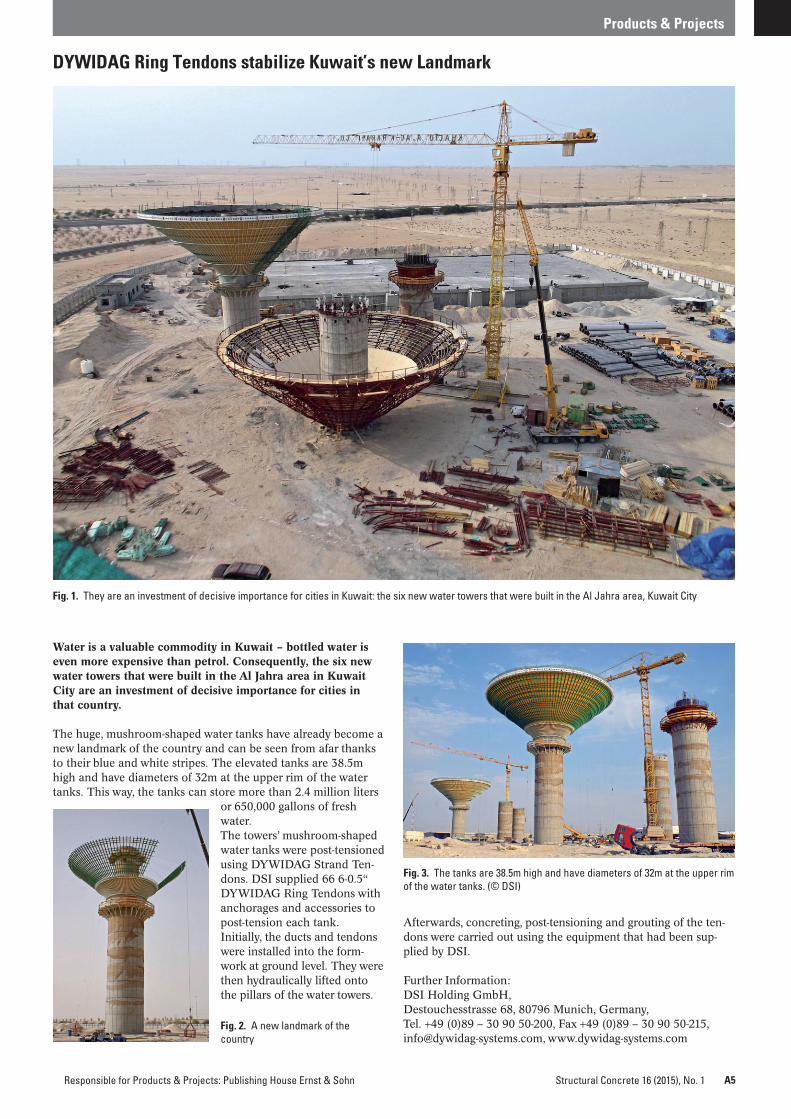
The huge, mushroom-shaped water tanks have already become anew landmark of the country and can be seen from afar thanksto their blue and white stripes. The elevated tanks are 38.5mhigh and have diameters of 32m at the upper rim of the watertanks. This way, the tanks can store more than 2.4 million liters
or 650,000 gallons of fresh water.The towers’ mushroom-shapedwater tanks were post-tensionedusing DYWIDAG Strand Ten-dons. DSI supplied 66 6-0.5“DYWIDAG Ring Tendons withanchorages and accessories topost-tension each tank.Initially, the ducts and tendonswere installed into the form-work at ground level. They werethen hydraulically lifted ontothe pillars of the water towers.
Fig. 1. They are an investment of decisive importance for cities in Kuwait: the six new water towers that were built in the Al Jahra area, Kuwait City
Fig. 3. The tanks are 38.5m high and have diameters of 32m at the upper rimof the water tanks. (© DSI)
Fig. 2. A new landmark of the country
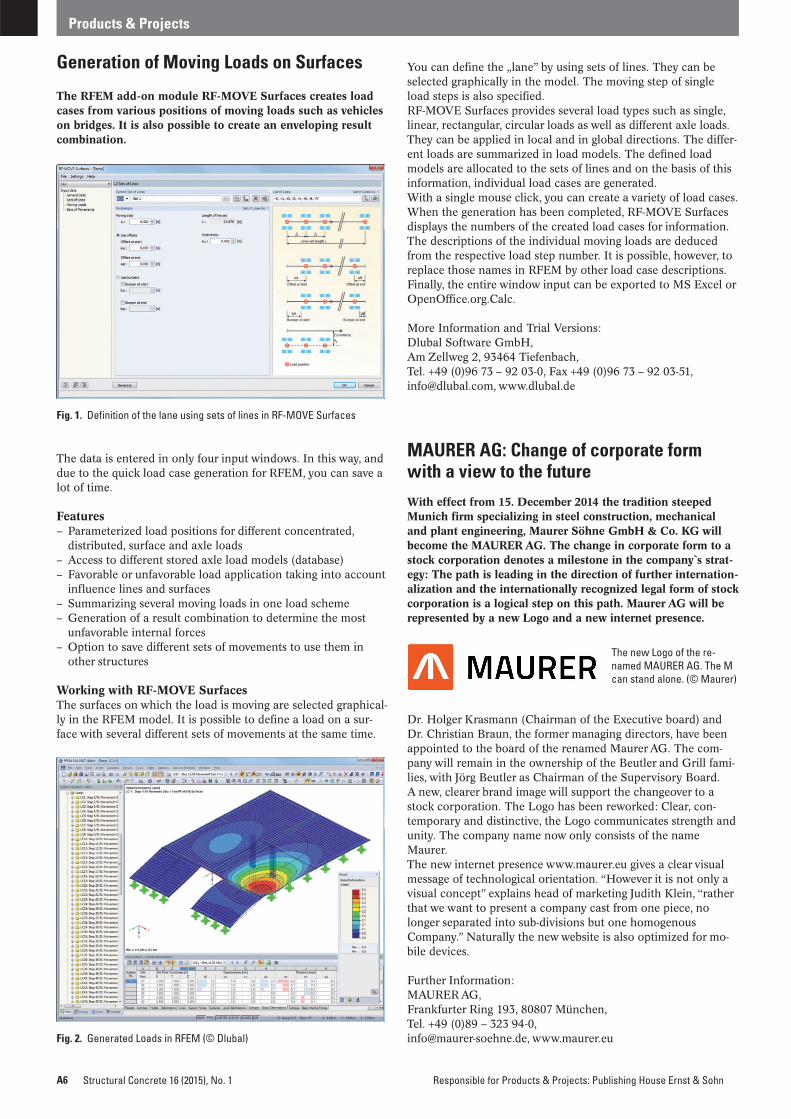
Generation of Moving Loads on Surfaces
The RFEM add-on module RF-MOVE Surfaces creates loadcases from various positions of moving loads such as vehicleson bridges. It is also possible to create an enveloping resultcombination.
The data is entered in only four input windows. In this way, anddue to the quick load case generation for RFEM, you can save alot of time.
Features– Parameterized load positions for different concentrated,
distributed, surface and axle loads– Access to different stored axle load models (database)– Favorable or unfavorable load application taking into account
influence lines and surfaces– Summarizing several moving loads in one load scheme– Generation of a result combination to determine the most
unfavorable internal forces– Option to save different sets of movements to use them in
other structures
Working with RF-MOVE SurfacesThe surfaces on which the load is moving are selected graphical-ly in the RFEM model. It is possible to define a load on a sur-face with several different sets of movements at the same time.
You can define the „lane” by using sets of lines. They can be selected graphically in the model. The moving step of singleload steps is also specified.RF-MOVE Surfaces provides several load types such as single,linear, rectangular, circular loads as well as different axle loads.They can be applied in local and in global directions. The differ-ent loads are summarized in load models. The defined loadmodels are allocated to the sets of lines and on the basis of thisinformation, individual load cases are generated.With a single mouse click, you can create a variety of load cases.When the generation has been completed, RF-MOVE Surfacesdisplays the numbers of the created load cases for information.The descriptions of the individual moving loads are deducedfrom the respective load step number. It is possible, however, toreplace those names in RFEM by other load case descriptions.Finally, the entire window input can be exported to MS Excel orOpenOffice.org.Calc.
More Information and Trial Versions:Dlubal Software GmbH, Am Zellweg 2, 93464 Tiefenbach, Tel. +49 (0)96 73 – 92 03-0, Fax +49 (0)96 73 – 92 03-51, [email protected], www.dlubal.de
MAURER AG: Change of corporate formwith a view to the future
With effect from 15. December 2014 the tradition steeped Munich firm specializing in steel construction, mechanicaland plant engineering, Maurer Söhne GmbH & Co. KG willbecome the MAURER AG. The change in corporate form to astock corporation denotes a milestone in the company`s strat-egy: The path is leading in the direction of further internation-alization and the inter nationally recognized legal form of stockcorporation is a logical step on this path. Maurer AG will berepresented by a new Logo and a new internet presence.
Dr. Holger Krasmann (Chairman of the Executive board) andDr. Christian Braun, the former managing directors, have beenappointed to the board of the renamed Maurer AG. The com -pany will remain in the ownership of the Beutler and Grill fami-lies, with Jörg Beutler as Chairman of the Supervisory Board.A new, clearer brand image will support the changeover to astock corporation. The Logo has been reworked: Clear, con -temporary and distinctive, the Logo communicates strength andunity. The company name now only consists of the name Maurer.The new internet presence www.maurer.eu gives a clear visualmessage of technological orientation. “However it is not only avisual concept” explains head of marketing Judith Klein, “ratherthat we want to present a company cast from one piece, nolonger separated into sub-divisions but one homogenous Company.” Naturally the new website is also optimized for mo-bile devices.
Further Information:MAURER AG, Frankfurter Ring 193, 80807 München, Tel. +49 (0)89 – 323 94-0, [email protected], www.maurer.eu
A6 Structural Concrete 16 (2015), No. 1 Responsible for Products & Projects: Publishing House Ernst & Sohn
Products & Projects
Fig. 1. Definition of the lane using sets of lines in RF-MOVE Surfaces
Fig. 2. Generated Loads in RFEM (© Dlubal)
The new Logo of the re-named MAURER AG. The Mcan stand alone. (© Maurer)


Strasbourg receives another clinic
PASCHAL gets things moving on the construction site in theStrasbourg district of Cronenbourg with its “TTR” Trapezoi-dal girder circular formwork and the speedy construction pro-gress for column formwork is supported with the multi-pur-pose panel.
EPSAN and ARS Alsace, partners for psychiatric care, commis-sioned the construction of a 140-bed hospital to provide betterpatient care.
The Alsace branch of the construction company EIFFAGECONSTRUCTION in Strasbourg prepared the project for theclinic, which is scheduled to open at the end of 2015.The square building structure is broken up by two two-storey, elliptical reinforced concrete constructions and a rounded rein-forced concrete construction.
First choice for rounded reinforced concrete constructionsTo form the two ellipses and the semi-circular rein-forced con-crete wall, Eiffrage, the construction company in charge, usedthe TTR Trapezoidal girder circular formwork from PASCHAL.The construction company relied on the materials being deliv-ered and also profited from PASCHAL’s specialist knowledgeand experience, which they used for the preparations and com-pliance with the work safety regulations.The application engineering department at PASCHAL wastherefore involved in the construction project from the very be-ginning and delivered a de-tailed and practical formwork con-cept in close coordination with the other parties involved in theproject.
Individual columns on individual foundationsRight at the start of the shell construction, the slim reinforcedconcrete columns (dimensions: 35 × 65 cm) were formed andconcreted with the multi-purpose panel from the LOGO.3 form-work system. Four multi-purpose panels can be used to form rectangular andsquare columns with edge lengths from 20 cm to 75 cm quicklyand easily using the “windmill vane principle”. This was appliedon the construction site in Strasbourg. To speed up the workprogress and to meet the strict French accident prevention regu-lations, the column forms were each fitted with two preassem-bled work platforms opposite each other.
Curved concrete constructionsBoth ellipses consist of a 20 cm thick C25/30 reinforced con-crete wall. The large ellipse has a length of 13.352 m and awidth of 5.825 m. The small construction has a length of 6.50 mand a width of 4.26 m. Both ellipses have a height of 9.39 m to9.75 m. The height difference is due to the sloping upper con-necting wall.To optimally support the construction progress, PASCHAL sup-plied completely preassembled and rounded TTR formworkunits for the first step, in-cluding preassembled folding workplatforms for the construction site. For the height intervals ofthe working levels, attention was paid to the easy accessibility of
A8 Structural Concrete 16 (2015), No. 1 Responsible for Products & Projects: Publishing House Ernst & Sohn
Products & Projects
Anchor ProfiOne Software for all Anchors
The cross-vendor anchor design software makes the an-chor world transparent and saves you time and money.
Anchor Profi is probably the best tool available to you tomeet your future requirements in anchorage design, an-chor comparison and selection from all major Europeananchor manufacturers.
For further information, please contact:Dr. Li Anchor Profi GmbHGustav-Stoll-Weg 7, D-72250 FreudenstadtPhone: +49 7441 4073833, Fax: +49 7441 4077139Internet: www.anchorprofi.de, E-mail: [email protected]
Independent �Powerful �
Easy �
Fig. 1. The small ellipse is rounder and has 5 x 4 = 20 radii.
Fig. 2. The small ellipse with half of a Trapezoidal girder circular formworkunit in the foreground; the assembled recess formwork for the penetrationsis subsequently reinforced.

the ties during formwork planning, sothat the formwork tasks could be com-pleted quickly and safely. For each preassembled formwork unit,the dead weight and the admissible ca-pacity of the crane lifting eyes were calcu-lated exactly and recorded on the form-work drawings for the work phases. Inthis way, the crane operator knew the lift-ing weight for each moving process of theformwork units.
Formwork planning for ellipsesTo shape each ellipse as planned, the en-gineers in application engineering “mir-rored” each ellipse along the longitudinalaxis.To form the large ellipse, the two infinite-ly “adjustable ranges” were combinedwith the “adjustable range” up to 5 me-tres inside diameter. When added togeth-er, this ellipse comprises 8 × 4 = 32 radii.To ensure a smooth transition at the con-crete sections to the left and right of thelongitudinal axis, the inner and outerformworks extended beyond the actualconcrete section and 3/4 were coveredwith a panel of 1.25 m during concretingof the opposite halves of the formworkwith the two formwork units.All three rounded structural parts werebuilt with system formwork and form-
work filler plates supplied by PASCHALwere used for compensation.As the pioneer of circular formwork withadjustable radii, PASCHAL is constantlyfaced with diverse reinforced concreteconstruction shapes, as highlighted bythe Strasbourg clinic example. Thanks toextensive practical experience,PASCHAL’s specialist team is able to pre-pare system formwork even for such un-usual shapes.The invaluable benefits come from theTrapezoidal girder circular formworkavailable in two versions:– For inside diameters from 5.00 m (r =
2.50 m) to infinity (straight).– For inside diameters from 2.00 m (r =
1.00 m) to inside dia meters of 5.00 m.
These possible combinations allow allcurvatures to be shaped exactly, as thereis a matching outside segment for eachinside segment.The system only uses a few ties and reli-ably absorbs fresh concrete pressure ofup to 60 kN/m².
Further information:PASCHAL-Werk G. Maier GmbH, Kreuzbühlstraße 5, 77790 Steinach, Tel. +49 (0)78 32 – 71-0, Fax +49 (0)78 32 – 71-209, [email protected], www.paschal.de
Responsible for Products & Projects: Publishing House Ernst & Sohn
Products & Projects
Structural Analysis and Design
Up-to-Date Information...
Free Trial Version atwww.dlubal.com
FurtherInformation:
Dlubal Software GmbHAm Zellweg 2, D-93464 TiefenbachTel.: +49 9673 9203-0Fax: +49 9673 [email protected]
DESIGN according to EC 2, ACI 318-11, SIA 262:2013, GB 50010-2010RF-/FOUNDATION Pro: foundationsaccording to Eurocode 2 and 7RF-MOVE Surfaces: generationof moving loads on surfaces
The Ultimate FEA Program
Steel Construction
Solid Construction
Co
lum
n B
ases
3D Finite Elements
BIM
/CA
D In
teg
rati
on
Stab
ility
an
d D
ynam
ics
© www.ibehlenz.de
© www.ssp-muc.com
3D Frameworks
Cro
ss-S
ecti
on
s
Follo
w u
s on
:
© www.isenmann-ingenieure.de
The Structural Beam Analysis Program
© www.ewb-karlsruhe.de
Bridge Construction
Fig. 3. Completely pre-assembled formwork units ofthe Trapezoidal girder circu-lar formwork with plywoodand built-on, folding workplatforms are ready for use.
Fig. 4. To the left, the dis-mantled “large ellipse”. Tothe right, the mounted form-work unit consisting of TTRsegments for the roundedreinforced concrete wall in“Block 11”. The three work-ing levels were coordinatedwith the formwork and rein-forcements to be executedso that the builders couldwork quickly and safely.(© Paschal)

Topping-out ceremony for New OfficeAirport StuttgartLast year’s November saw the topping-out ceremony for NewOffice Airport Stuttgart (NOAS), a new office building andone of the largest construction projects at Stuttgart Airportin recent years. With its rounded contours, the striking newbuilding will redefine the character of the entrance toStuttgart’s Airport City. Züblin completed the structuralworks on time within the schedule provided and the build-ing’s first tenant, financial audit firm Ernst & Young, is slatedto move its Germany headquarters into the complex in early2016.
In his ceremonial speech, Walter Schoefer, managing director ofStuttgart Airport, stressed: “We are investing about € 130 mil-lion in this excellent office property as a symbol for the furtherstate-driven development of our airport site. Over 1,500 employ-ees of Ernst & Young will relocate here in 2016, giving the cam-pus enormous economic strength. The move shows that optimalinfrastructure and mobility are extremely important for globallypositioned companies. In this respect, Stuttgart Airport is one ofthe best-developed locations in the state of Baden-Württem-berg.”
Michael Marbler, lead partner for southwest Germany at Ernst& Young, and Roland Wiehl, business unit manager for turnkeyconstruction at Züblin, which is handling the project turnkey asgeneral contractor, expressed their thanks to the workers forhelping to complete the structural works so swiftly and perfect-ly.The new office building was planned and is being built accord-ing to the latest standards in terms of efficiency, sustainabilityand comfort. The architectural design by Hascher Jehle Ar-chitekten consists of two building complexes in the form of a reclining figure eight plus a third complex housing a conferencecentre. The office building, which is clearly visible as a newlandmark from the A8 motorway, comprises an abovegroundarea of around 40,000 m2 as well as two underground floorswith approximately 20,000 m2 for parking, storage and cellarrooms.
Further Information:Ed. Züblin AG, Albstadtweg 3, 70567 Stuttgart, Tel. +49 (0)711 – 78 83-0, Fax +49 (0)711 – 78 83-390, [email protected], www.zueblin.de
A10 Structural Concrete 16 (2015), No. 1 Responsible for Products & Projects: Publishing House Ernst & Sohn
Products & Projects
Fig. 1. Bird’s eye view on one of the largest construction projects atStuttgart Airport in recent years
Fig. 2. With its rounded contours, the striking new building will redefine thecharacter of the entrance to Stuttgart’s Airport City.The structural workshave been completed by Züblin on time within the schedule provided.(© Stuttgart Airport)

Structural Concrete 16 (2015), No. 1 A11
software
Dlubal Software GmbHAm Zellweg 293464 TiefenbachPhone +49 (0) 96 73 92 03-0Fax +49 (0) 96 73 92 03-51Mail: [email protected]: www.dlubal.de
stay cables
DYWIDAG-Systems International GmbHMax-Planck-Ring 140764 Langenfeld/GermanyPhone +49 (0)21 73/7 90 20Mail: [email protected]: www.dywidag-systems.de
vibration isolation
BSW GmbHAm Hilgenacker 24D-57319 Bad BerleburgPhone +49(0)2751 803-126Mail: [email protected]:www.bsw-vibration-technology.com
under-screed impact sound insulation with European TechnicalApproval, PUR foam & PUR rubbermaterials for vibration isolation
reinforcement technologies
HALFEN Vertriebsgesellschaft mbHKatzbergstraße 3D-40764 LangenfeldPhone +49 (0) 21 73 9 70-0Fax +49 (0) 21 73 9 70-2 25Mail: [email protected]: www.halfen.de
concrete: fixing systems facade: fastening technology framing systems: products and systems
Max Frank GmbH & Co. KGTechnologies for the construction industryMitterweg 194339 LeiblfingGermanyPhone +49 (0)94 27/1 89-0Fax +49 (0)94 27/15 88Mail: [email protected]: www.maxfrank.com
sealing technologies
Max Frank GmbH & Co. KGTechnologies for the construction industryMitterweg 194339 LeiblfingGermanyPhone +49 (0)94 27/1 89-0Fax +49 (0)94 27/15 88Mail: [email protected]: www.maxfrank.com
Provider directoryproducts & services
bridge accessories
Maurer Söhne GmbH & Co. KGFrankfurter Ring 193D-80807 MünchenPhone +49(0)89 32394-341Fax +49(0)89 32394-306Mail: [email protected]: www.maurer-soehne.de
Structural Protection Systems Expansion Joints Structural Bearings Seismic Devices Vibration Absorbers
literature
Ernst & SohnVerlag für Architektur und technische Wissenschaften GmbH & Co. KGRotherstraße 2110245 BerlinPhone +49 (0) 30 4 70 31-2 00Fax +49 (0) 30 4 70 31-2 70E-mail: [email protected]: www.ernst-und-sohn.de
fastening technology
HALFEN Vertriebsgesellschaft mbHKatzbergstraße 3D-40764 LangenfeldPhone +49 (0) 21 73 9 70-0Fax +49 (0) 21 73 9 70-2 25Mail: [email protected]: www.halfen.de
concrete: fixing systems facade: fastening technology framing systems: products and systems
post-tensioning
DYWIDAG-Systems International GmbHMax-Planck-Ring 140764 Langenfeld/GermanyPhone +49 (0)21 73/7 90 20Mail: [email protected]: www.dywidag-systems.de
prestressed concrete
Paul Maschinenfabrik GmbH & Co. KGMax-Paul-Straße 188525 Dürmentingen/GermanyPhone +49 (0)73 71/5 00-0Fax +49 (0)73 71/5 00-1 11Mail: [email protected]: www.paul.eu
The potential and the limitations of numerical methods
The book gives a compact review of fi nite element and other nu-merical methods. The key to these methods is through a proper description of material behavior. Thus, the book summarizes the essential material properties of concrete and reinforcement and their interaction through bond.
Most problems are illustrated by examples which are solved by the program package ConFem, based on the freely available Py-thon programming language. The ConFem source code together with the problem data is available under open source rules in combination with this book.
Table of content:
fi nite element in a nutschell uniaxial structural concrete behavior 2D structural beams and frames strut-and-tie models multiaxial concrete material behavior deep beams slabs appendix
*€ Prices are valid in Germany, exclusively, and subject to alterations. Prices incl. VAT. excl. shipping. 1044106_dp
Order online: www.ernst-und-sohn.de
Customer Service: Wiley-VCH
Boschstraße 12
D-69469 Weinheim
Tel. +49 (0)6201 606-400
Fax +49 (0)6201 606-184
Ernst & Sohn
Verlag für Architektur und technische
Wissenschaften GmbH & Co. KG
Recommendations:
Ulrich Häussler-Combe
Computational Methods for
Reinforced Concrete Structures
2014. 354 pages.
€ 59,–*
ISBN 978-3-433-03054-7
Also available as
fib Model Code for
Concrete Structures
2010
Structural Concrete
Journal of the fib
1© Ernst & Sohn Verlag für Architektur und technische Wissenschaften GmbH & Co. KG, Berlin · Structural Concrete 16 (2015), No. 1
On 1 January I began my two-year term as fib presidentwith emotions ranging from deep respect for the office topleasure at the idea of serving the fib in such a prominentrole. This outstanding international association has beenmy home for many years and I have occupied various po-sitions within it since I started in the CEB in 1979. I amtruly humbled to fill the same role as such extraordinaryindividuals as Gordon Clark, György L. Balázs, andMichael Fardis, to mention but a few.
When I think of the fib’s mission and look back at itsrecent history, I see significant contributions to the ad-vancement of knowledge and technical developments inthe field of structural concrete. The greatest accomplish-ment was the publication of the fib Model Code for Con-crete Structures 2010 in September 2013, which exempli-fied the fib’s ambition to compile the most up-to-dateknowledge in code-type form to serve as a model for newgenerations of standards. Following in-depth analyses anddiscussions that began in 2010, the new structure for thefib’s commissions and task groups was implemented at thebeginning of this year and will help the fib to run more ef-ficiently. Finally, Structural Concrete, journal of the fib,has made great progress: last year its impact factor in-creased from 0.289 to 0.857, testimony to the high qualityof its articles.
Therefore, it would seem that, as president, I have on-ly to steer the association forward with a steady hand onthe wheel. Not so. I think such an approach would be haz-ardous in our rapidly changing world. Stagnation meansregression. We have to build on our accomplishments. Thetrue challenge consists of developing a vision that looksbeyond the horizon.
With this in mind, I would define my main targets inthese terms: strategy, development, and globalisation.
For me, ‘strategy’ comprises, for example, a conceptfor continuously updating the fib Model Code. Exactly 20years elapsed between MC 1990 and MC 2010; MC 1990was already partially outdated by the end of the 1990s.‘Strategy’ also means finding the best framework for desig-nating fib membership status and future benefits.
By ‘development’, I mean defining the technical ad-vances to be promoted by the fib, one of which is of
course sustainability. Simplypartially replacing Portland ce-ment in concrete with otherbinders will not solve futureproblems. Since concrete usewill increase by a factor of fiveover the next 30 years, only thedevelopment of new concretesand design concepts will helpto avert increased environmen-tal troubles. We need taskgroups to tackle these prob-lems. Developing a model codefor existing structures is a logi-cal step, as maintenance and re-habilitation are the most effec-tive sustainable measures.
Referring to ‘globalisation’, I think firstly of the fib’srole within the international associations scene, whereISO, CEN, the ACI, RILEM, the ACF, and others, havemissions that are partially similar and certain publicationsthat are comparable to those of the fib. Defining our ownposition more clearly and developing closer official con-tacts, for example through cooperation agreements ormemoranda of understanding, appears to be advanta-geous in many respects.
My approach may mean that I, along with my desig-nated successor, current Deputy President Hugo Corres,will face sizable challenges. I am, however, rather confi-dent that we will contribute to the progress of the fib, notbecause of our own aptitudes, but because of the supportof the excellent engineers, scientists, and practitionersfrom all over the world who form the backbone andstrength of the fib.
Univ.-Prof. Dr.-Ing. Harald S. MüllerPresident, International Federation for Structural Concrete (fib)
From accomplishments to challenges
Message from the president
Harald S. Müller

EXPERTS, EXPERIENCES AND STATE OF ART ACHIEVEMENTS
International community of bridge engineering with particular skills in multi span large bridges.
WHO
ORGANIZED BY FEUP (FACULTY OF ENGINEERING OF THE UNIVERSITY OF PORTO) IN COOPERATION WITH IST LISBON, UNIVERSITY OF MINHO AND LNEC.PUBLISHED BY CRC PRESS / BALKEMA (TAYLOR & FRANCIS GROUP)
WHATThemes: Landmark Projects, Conceptual Design, Innovative Construction Methods, Special Foundations and Geotechnical Site Investigations, Life Cycle, Monitoring & Maintenance & Management, Incidents and Accidents, Logistics, Durability, New Materials and Special Devices, Extreme Loads, Rehabilitation, Operational Risk Analysis, Safety and Serviceability. “Experts, Experiences and State of Art Achievements” - We are expecting an important contribution of experts and other
site: www.fe.up.pt/mslb2015 email: [email protected]
CONTACTS
JIRI STRASKYJAVIER MANTEROLAARNE FREDERIKSEN BAEKSTEDAKIO KASUGA
DANTE LIUS MICHEL VIRLOGEUXFRANCISCO CATÃO RIBEIROKARL HUMPF
AIRONG CHENNAEEM HUSSAIN
KEYNOTE SPEAKERS:
WHERE
PORTO /01-03/JULY//2015WHERE
CO-SPONSORS INSTITUTIONAL SPONSORS MEDIA PARTNER
REGISTRATIONS OPENED SPECIAL CONDITIONS IN EARLY STAGES
BOOK NOWYOUR SPONSORSHIP AND EXHIBITION PLACE!
3© 2015 Ernst & Sohn Verlag für Architektur und technische Wissenschaften GmbH & Co. KG, Berlin · Structural Concrete (2015), No. 1
Eurocode 2 consists of four parts that have to be applied in con-junction with the respective National Annexes of the CEN mem-ber states. The National Annexes were introduced, in particular,to maintain national safety levels and to account for regional as-pects in the different states.The CEN (European Committee for Standardization) will reviseand extend all structural Eurocodes by 2018. As part of thatprocess, two main objectives for revising Eurocodes have beenformulated: a reduction in the number of Nationally DeterminedParameters (NDP) and improving the “ease of use”.In order to reduce the number of NDP, improve the ease of useand allow for further harmonization without changing the mainstructure and the design models of Eurocode 2, the National An-nexes of EN 1992-1-1 for the different CEN member states havebeen compared and analysed. Furthermore, the analysis of theNational Annexes may help to identify some main aspects for therevision of Eurocode 2.This paper summarizes the analysis of the National annexes ofEN 1992-1-1 and makes first proposals for further harmonization.
Keywords: Eurocode 2, national annexes, NDP comparison, harmonization
1 Reason and introduction
The European Commission has initiated the amendmentand evolution of the present Eurocode generation by 2018in accordance with mandate M/515 [1]. The Europeanstandards organization CEN followed up the mandatewith detailed proposals for the respective work pro-grammes [2]. As part of that process, two main objectivesfor the revision of Eurocodes have been formulated: a re-duction in the number of Nationally Determined Parame-ters (NDP) and improving the “ease of use”.
In Germany these objectives have been expresslysupported. Therefore, the engineering offices and industri-al associations chiefly affected by the codes in their every-day business have established the Initiative PRB, an orga-nization that aims to make the Eurocodes easier to use.Based on collecting and evaluating the experience gainedwith the present Eurocodes, practice-oriented proposalswill be developed for the next Eurocode generation.
Looking after concrete construction and Eurocode 2within this organization are the German Committee forStructural Concrete (DAfStb) and the German Society forConcrete and Construction Technology (DBV). One ofthe first tasks was to analyse the implementation of Eu-rocode 2 in the National Annexes of the CEN memberstates (CEN-MS).
Eurocode 2 consists of four parts ([3], [4], [5], [6]),which have to be applied in conjunction with the respec-tive National Annexes. The National Annexes were intro-duced, in particular, to maintain national safety levels andto account for regional aspects in the different CEN-MS.Some CEN-MS also implemented additional nationalrules and explanations in the form of NCI (Non-contra-dictory Complementary Information) for further guid-ance. In order to reduce the number of NDP, improve theease of use and allow for further harmonization withoutchanging the main structure and the existing models, theNational Annexes of EN 1992-1-1 of the different CEN-MShave been compared and analysed. Furthermore, theanalysis of the National Annexes may help to identifysome main aspects for the revision of Eurocode 2.
The German mirror committee for Eurocode 2 takesthe view that, in principle, the present code structure andthe design and detailing rules should remain largely unchanged, unless unacceptable safety deficits or othertechnical and economical reasons exist (e.g. “ease ofuse”).
The following sections summarize the results of ananalysis of the National Annexes of EN 1992-1-1 and makethe first proposals for further harmonization.
2 Analysis and comparison
The National Annexes contain two types of information:the Nationally Determined Parameters (NDP) and thenon-contradictory complementary information (NCI).Whereas the NCI may contain additional or specific na-tional rules (e.g. application rules for cases not covered byEurocode 2, links to national codes or literature), theNDP represent mostly single values, groups of values, ta-bles or methods from which choices can be made. Recom-mended values are given in Eurocode 2, which can beadopted or changed in the National Annexes of the manyCEN-MS. Background information to the German Na-tional Annex [8] can be found in [7].
Technical Paper
Eurocode 2 – analysis of National Annexes
Anett IgnatiadisFrank Fingerloos*Josef HeggerFrederik Teworte
DOI: 10.1002/suco.201400060
* Corresponding author: [email protected]
Submitted for review: 21 July 2014Accepted for publication: 5 September 2014

4
A. Ignatiadis/F. Fingerloos/J. Hegger/F. Teworte · Eurocode 2 – analysis of National Annexes
Structural Concrete (2015), No. 1
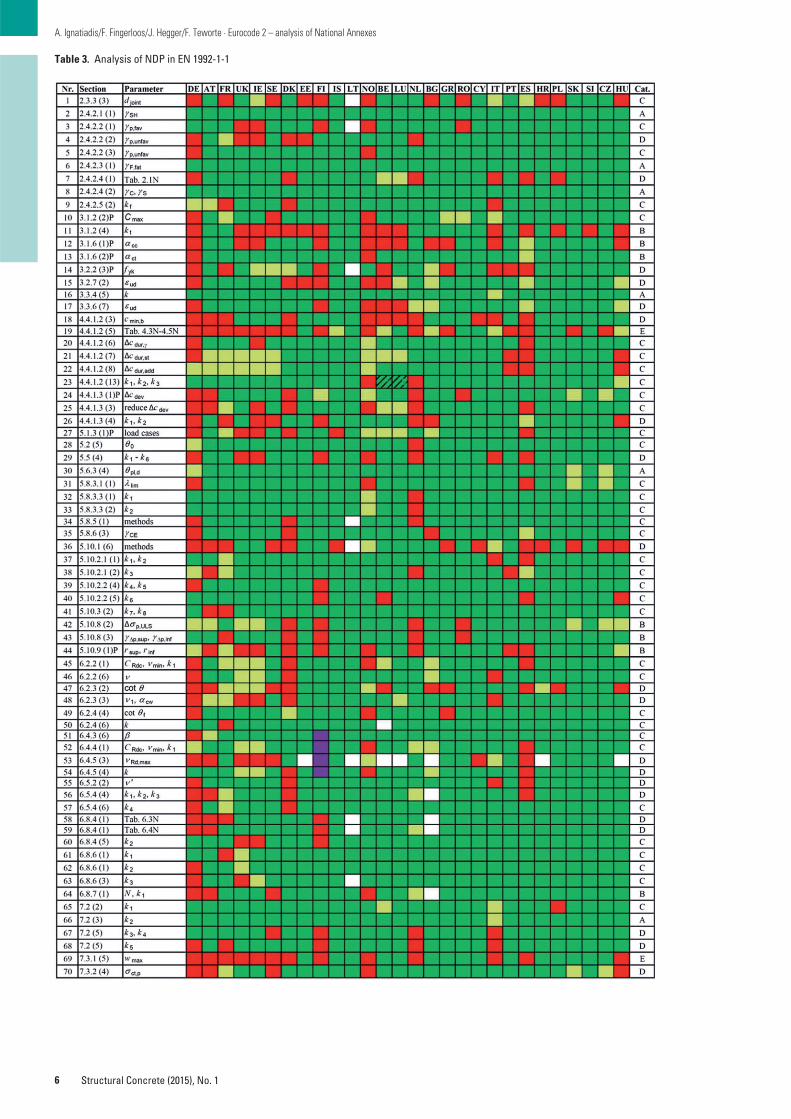
Altogether, Eurocode 2 refers to more than 120 NDPin EN 1992-1-1 [3] and a further approx. 70 NDP in EN1992-1-2 [4], EN 1992-2 [5] and EN 1992-3 [6]. The Nation-al Annexes of EN 1992-1-1 of 28 states ([8] to [36]) havebeen compared in the present analysis. Malta and Latviado not have National Annexes and the Swiss document isstill in print. Fig. 2 shows the implementation of the rec-ommended values given in Eurocode 2 in the differentNational Annexes. The resulting potential for harmoniza-tion is shown in Fig. 1.
In general, the concepts and models of Eurocode 2are adopted by all states. Only the informative annexes donot apply in every state, and in some states single para-graphs are omitted via NDP or NCI. In many cases theNDP just change some values compared with [3]. Hence,the number of differences between the National Annexesand [3] does not necessarily reflect the acceptance of EC2in the different countries. Larger changes to the modelsand concepts implemented are exceptions (e.g. Finlanddoes not apply the sections concerning punching, whichmay be solved with the current amendment [37]; Denmarkhas introduced a more detailed concept for the materialsafety factors and a design concept based on plastic theo-ry).
Key to Fig. 1: Categories
A: Harmonization by fixing valueB: Harmonization possible by introducing classes C: Good chance for harmonizationD: Harmonization may be possible (fixed or classes)E: Harmonization very difficult
C: 48(38%)
D: 44(34%)
B: 23(18%)
A: 8(6%)
E: 5(4%)
Fig. 1. Potential for harmonization of NDP in EN 1992-1-1 (28 statesanalysed)
NOBELUNLBGGRROCYITPTESHRPLSKSI
CZHU
NDP in EN 1992-1-1HungaryCzech RepublicSloveniaSlovakiaPolandCroatiaSpainPortugalItalyCyprusRomaniaGreeceBulgariaNetherlandsLuxembourgBelgiumNorway
0 10 20 30 40 50 60 70 80 90 100 110 120 130
DEATFRUK
IESE
DKEEFIISLT
NO
Number of NDP
NorwayLithuaniaIcelandFinlandEstoniaDenmarkSwedenIrelandUnited KingdomFranceAustriaGermany
Key:
Recommended values adopted In general, recommended values adopted, but special conditions for application or exceptions possible Different values Section does not apply
Section not mentioned in NA / information incomplete or ambiguous
Fig. 2. Comparison of Nationally Determined Parameters (NDP) with the recommended values in EN 1992-1-1
5
A. Ignatiadis/F. Fingerloos/J. Hegger/F. Teworte · Eurocode 2 – analysis of National Annexes
Structural Concrete (2015), No. 1
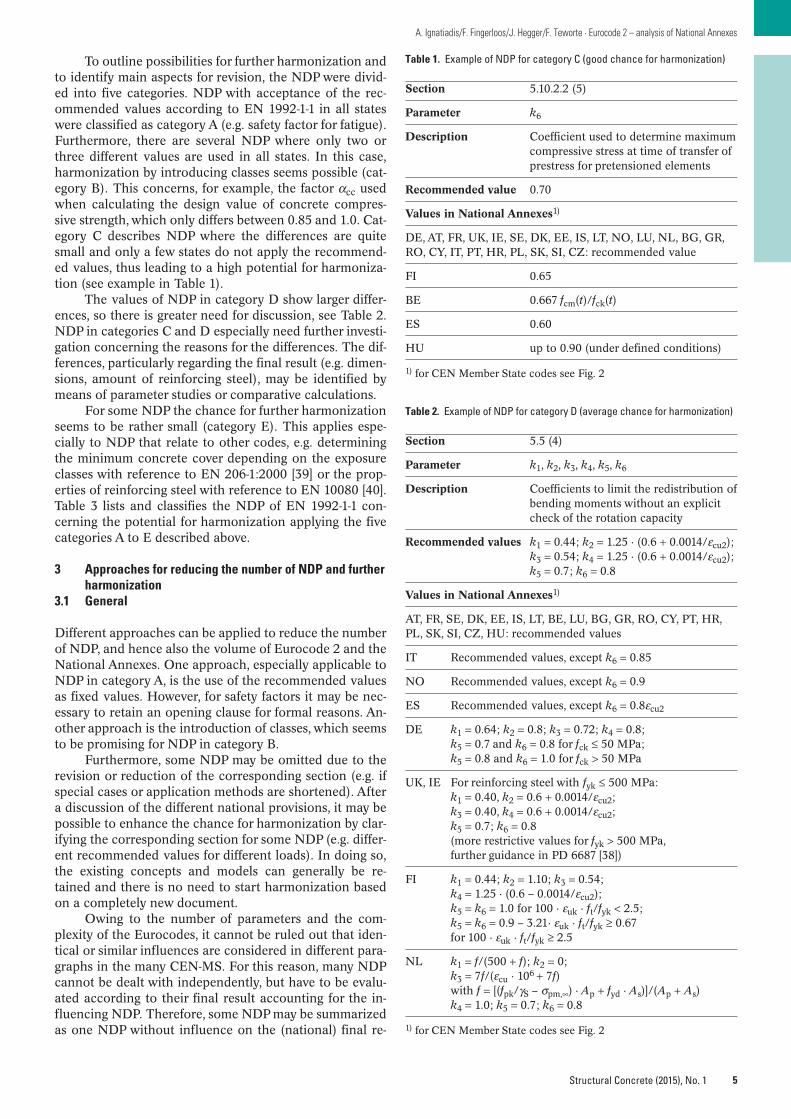
To outline possibilities for further harmonization andto identify main aspects for revision, the NDP were divid-ed into five categories. NDP with acceptance of the rec-ommended values according to EN 1992-1-1 in all stateswere classified as category A (e.g. safety factor for fatigue).Furthermore, there are several NDP where only two orthree different values are used in all states. In this case,harmonization by introducing classes seems possible (cat-egory B). This concerns, for example, the factor αcc usedwhen calculating the design value of concrete compres-sive strength, which only differs between 0.85 and 1.0. Cat-egory C describes NDP where the differences are quitesmall and only a few states do not apply the recommend-ed values, thus leading to a high potential for harmoniza-tion (see example in Table 1).
The values of NDP in category D show larger differ-ences, so there is greater need for discussion, see Table 2.NDP in categories C and D especially need further investi-gation concerning the reasons for the differences. The dif-ferences, particularly regarding the final result (e.g. dimen-sions, amount of reinforcing steel), may be identified bymeans of parameter studies or comparative calculations.
For some NDP the chance for further harmonizationseems to be rather small (category E). This applies espe-cially to NDP that relate to other codes, e.g. determiningthe minimum concrete cover depending on the exposureclasses with reference to EN 206-1:2000 [39] or the prop-erties of reinforcing steel with reference to EN 10080 [40].Table 3 lists and classifies the NDP of EN 1992-1-1 con-cerning the potential for harmonization applying the fivecategories A to E described above.
3 Approaches for reducing the number of NDP and furtherharmonization
3.1 General
Different approaches can be applied to reduce the numberof NDP, and hence also the volume of Eurocode 2 and theNational Annexes. One approach, especially applicable toNDP in category A, is the use of the recommended valuesas fixed values. However, for safety factors it may be nec-essary to retain an opening clause for formal reasons. An-other approach is the introduction of classes, which seemsto be promising for NDP in category B.
Furthermore, some NDP may be omitted due to therevision or reduction of the corresponding section (e.g. ifspecial cases or application methods are shortened). Aftera discussion of the different national provisions, it may bepossible to enhance the chance for harmonization by clar-ifying the corresponding section for some NDP (e.g. differ-ent recommended values for different loads). In doing so,the existing concepts and models can generally be re-tained and there is no need to start harmonization basedon a completely new document.
Owing to the number of parameters and the com-plexity of the Eurocodes, it cannot be ruled out that iden-tical or similar influences are considered in different para-graphs in the many CEN-MS. For this reason, many NDPcannot be dealt with independently, but have to be evalu-ated according to their final result accounting for the in-fluencing NDP. Therefore, some NDP may be summarizedas one NDP without influence on the (national) final re-
Table 1. Example of NDP for category C (good chance for harmonization)
Section 5.10.2.2 (5)
Parameter k6
Description Coefficient used to determine maximumcompressive stress at time of transfer ofprestress for pretensioned elements
Recommended value 0.70
Values in National Annexes1)
DE, AT, FR, UK, IE, SE, DK, EE, IS, LT, NO, LU, NL, BG, GR,RO, CY, IT, PT, HR, PL, SK, SI, CZ: recommended value
FI 0.65
BE 0.667 fcm(t)/fck(t)
ES 0.60
HU up to 0.90 (under defined conditions)
1) for CEN Member State codes see Fig. 2
Table 2. Example of NDP for category D (average chance for harmonization)
Section 5.5 (4)
Parameter k1, k2, k3, k4, k5, k6
Description Coefficients to limit the redistribution ofbending moments without an explicitcheck of the rotation capacity
Recommended values k1 = 0.44; k2 = 1.25 · (0.6 + 0.0014/εcu2);k3 = 0.54; k4 = 1.25 · (0.6 + 0.0014/εcu2);k5 = 0.7; k6 = 0.8
Values in National Annexes1)
AT, FR, SE, DK, EE, IS, LT, BE, LU, BG, GR, RO, CY, PT, HR,PL, SK, SI, CZ, HU: recommended values
IT Recommended values, except k6 = 0.85
NO Recommended values, except k6 = 0.9
ES Recommended values, except k6 = 0.8εcu2
DE k1 = 0.64; k2 = 0.8; k3 = 0.72; k4 = 0.8;k5 = 0.7 and k6 = 0.8 for fck ≤ 50 MPa;k5 = 0.8 and k6 = 1.0 for fck > 50 MPa
UK, IE For reinforcing steel with fyk ≤ 500 MPa:k1 = 0.40, k2 = 0.6 + 0.0014/εcu2;k3 = 0.40, k4 = 0.6 + 0.0014/εcu2;k5 = 0.7; k6 = 0.8(more restrictive values for fyk > 500 MPa, further guidance in PD 6687 [38])
FI k1 = 0.44; k2 = 1.10; k3 = 0.54;k4 = 1.25 · (0.6 – 0.0014/εcu2);k5 = k6 = 1.0 for 100 · εuk · ft/fyk < 2.5;k5 = k6 = 0.9 – 3.21· εuk · ft/fyk ≥ 0.67for 100 · εuk · ft/fyk ≥ 2.5
NL k1 = f/(500 + f); k2 = 0;k3 = 7f/(εcu · 106 + 7f)with f = [(fpk/γS – σpm,∞) · Ap + fyd · As)]/(Ap + As)k4 = 1.0; k5 = 0.7; k6 = 0.8
1) for CEN Member State codes see Fig. 2
6
A. Ignatiadis/F. Fingerloos/J. Hegger/F. Teworte · Eurocode 2 – analysis of National Annexes
Structural Concrete (2015), No. 1
Table 3. Analysis of NDP in EN 1992-1-1

7
A. Ignatiadis/F. Fingerloos/J. Hegger/F. Teworte · Eurocode 2 – analysis of National Annexes
Structural Concrete (2015), No. 1
Table 3. Analysis of NDP in EN 1992-1-1 (Continued)
sult, whereas in other cases a single NDP cannot be har-monized, instead a group of NDP has to be considered incombination (e.g. the permitted angle of the inclined com-pression strut determining the shear resistance and themaximum spacing of shear reinforcement).
During the revision of Eurocode 2, attention has tobe paid to ensuring consistent recommended values in theremaining NDP, which means avoiding mixing up differ-ent national methods and philosophies so that the use ofall recommended values is possible and on the safe side.Furthermore, the influences on the other parts of Eu-rocode 2, especially part 2, have to be considered.
It cannot be ruled out that new NDP have to be in-troduced during the revision. However, this may still leadto a reduction in the National Annexes if NCI can beomitted instead. In particular, in cases where NCI in theNational Annex contradict the Eurocode or contain morerestrictive requirements, the implementation of NDP willbe a better solution.
Further research concerning the background to thenational provisions, parameter studies and in some casescomparative analyses is necessary to make specific pro-posals. The classification of the NDP into categories A toE is explained in the following section. In addition, NDPrelated to other NDP are identified. Proposals for harmo-nization and further procedures are described for certainNDP.
3.2 Specific approach for certain NDP3.2.1 Basis of design
In section 2.3.3 (3) a value of 30 m is recommended asthe maximum spacing for joints to preclude temperatureand shrinkage effects from the global structural analysis.Although only some CEN-MS have adopted this value, thechances for harmonization are high (category C). In thestates not adopting the recommended value, this valuehas to be determined for each individual case (e.g. in Ger-many), or several values dependent on different influencesare given (e.g. member geometry, concrete composition,foundation type, regional factors and others). Since thisparameter can be dealt with independently from otherNDP, the section could be revised, not recommending anyspecific value but instead pointing out factors to be con-sidered so that the NDP could be omitted. Detailed guid-ance and recommendations for several cases could be giv-en in background literature.
The recommended values for the partial factor forshrinkage action in section 2.4.2.1 (1), for the partial safe-ty factor for fatigue loading in section 2.4.2.3 (1) and forthe partial safety factors for materials for serviceabilitylimit states in section 2.4.2.4 (2) have been adopted by allstates and could be fixed unless barred for formal reasons(category A).
The recommended value of 1.0 for the partial safetyfactor for favourable prestressing action in section 2.4.2.2(1) has been adopted by most CEN-MS. In the UnitedKingdom, Ireland and Finland, a value of 0.9 is used,while in Norway and Romania values of 0.9 and 1.1 areapplied. Therefore, this NDP was classified as category C.The recommended value of 1.3 for the partial safety factorfor unfavourable external prestressing action at the stabili-
8
A. Ignatiadis/F. Fingerloos/J. Hegger/F. Teworte · Eurocode 2 – analysis of National Annexes
Structural Concrete (2015), No. 1
ty limit state in section 2.4.2.2 (2) has been adopted bymany states. The differing values range from 1.0 to 1.3 andso this NDP was classified as category D. The recom-mended value of 1.2 for the partial safety factor for un-favourable prestressing action for local effects in section2.4.2.2 (3) has been adopted by most states; only Germanyand Norway use other values (category C). These threeNDP cannot be observed independently from other NDPconcerning prestressing (especially in section 5.10). Sincethese NDP concern special cases (external prestressingwith additional European Technical Approvals (ETAs)) orcertain verifications (tensile splitting reinforcement, partlyalso requirements in ETAs), NDP in sections 2.4.2.2 (2)and (3) may eventually be omitted.
The recommended values for the partial safety fac-tors for materials for ultimate limit states in section 2.4.2.4(1) have been adopted by many states. This NDP was clas-sified as category D even though the differences are notvery great. Denmark has applied a more detailed systemtaking into account the type of failure and the level of in-spection. Here, it can be checked whether some of theseinfluences are already covered by the current Annex A ofEurocode 2 as well. The values for reinforcing and pre-stressing steel with γS = 1.15 for the persistent, transientand fatigue design situations and γS = 1.0 for the acciden-tal design situation have been adopted by all other states,except The Netherlands, where the factor γS = 1.1 is appliedfor prestressing steel in these situations. Further, γC = 1.5for concrete in the persistent, transient and fatigue designsituations has been adopted by almost all other states, withthe following exceptions: Poland: γC = 1.4; Italy: other values for special cases; The Netherlands: γC = 1.35 for fatigue design. The maximum deviation occurs in the acci-dental design situation, where values of γC higher than therecommended value (1.2) are applied (Germany, Spain:1.3) as well as values lower than the recommended one(Italy: 1.0). Complete harmonization seems to be quite dif-ficult. In addition, these factors (especially γC) are usedseveral times in Eurocode 2, but eventually some of thesevalues could be fixed unless barred for formal reasons.
The recommended value kf = 1.1 for the coefficientfor multiplying the partial safety factor for concrete whencalculating the design resistance of cast-in-place pileswithout a permanent casing in section 2.4.2.5 (2) hasbeen adopted by most CEN-MS (category C). In Germanyand Austria, kf = 1.0 is possible if the bored piles are builtaccording to EN 1536 [41], and in Denmark and Italy avalue of 1.0 is applied in general. In France the factor hasto be determined according to the national code NF P94-262 [42]. It is necessary to check (also in section 9.8)which provisions for foundation members are necessary inEurocode 2 and what is already covered in Eurocode 7[43] or in the codes for execution of special geotechnicalwork (e.g. EN 1536).
3.2.2 Materials
The maximum concrete strength class of C90/105 for us-ing Eurocode 2 in section 3.1.2 (2) has been adopted bymost CEN-MS (category C). Germany, Sweden and Nor-way allow a higher strength class (C100/115 or C95/110).In some states the use of strength classes higher than
9
A. Ignatiadis/F. Fingerloos/J. Hegger/F. Teworte · Eurocode 2 – analysis of National Annexes
Structural Concrete (2015), No. 1
C50/60 requires the approval of the authority responsibleand in other states they can be used only with some re-strictions. The value for bridges may be different (EN1992-2 NDP to 3.1.2 (102)P). Owing to developments inconcrete technology, harmonization seems possible by thetime the new generation of Eurocodes is published.
Factor kt, for reducing coefficients αcc and αct if theconcrete strength is determined at age t > 28d, is definedin section 3.1.2 (4). In most of the states the recommend-ed value of 0.85 or a value of 1.0 is applied. In some statesthe influence is considered by interpolation (Spain, Hun-gary), determination according to the development of thestrength (Germany, Denmark) or by equation 1/αcc(t)(Norway, Slovenia). The introduction of classes might bepossible in this case (category B). This NDP could also beincluded in the NDP αcc in 3.1.6 (1) and αct in 3.1.6 (2) asit only can be observed in relation to these parameters.
Coefficient αcc in section 3.1.6 (1) takes into accountlong-term effects on the compressive strength and un-favourable effects resulting from the load application. Therecommended value of 1.0 is adopted in about half thestates. Some states apply a value of 0.85 and some statesapply values of 0.85 or 1.0 depending on the load (e.g.0.85 for axial force and bending, 1.0 in other cases). Theintroduction of classes could be a way of harmonizinghere (category B). It has to be considered that this para-meter influences many verifications indirectly via fcd. Toenhance the chances for harmonization, it has to bechecked in the several sections as to whether the reduc-tion in compressive strength is justified and if other NDPin the several sections include a similar reduction, espe-cially in the states that apply αcc = 1.0. For this purpose,careful investigation of which influences are consideredprecisely by coefficient αcc is necessary. It is the same withcoefficient αct in section 3.1.6 (2), which takes into ac-count long-term effects on the tensile strength and un-favourable effects resulting from load application. In mostof the states the recommended value of 1.0 is adopted.Only Germany and Norway apply a value of 0.85 andSpain reduces the value for high ratios of permanent andfull load. Furthermore, it should be confirmed whether the
applied values for NDP to 3.1.6 (101)P and NDP to 3.1.6(102)P in EN 1992-2 are different in one state. If not, atleast this NDP could be eliminated there.
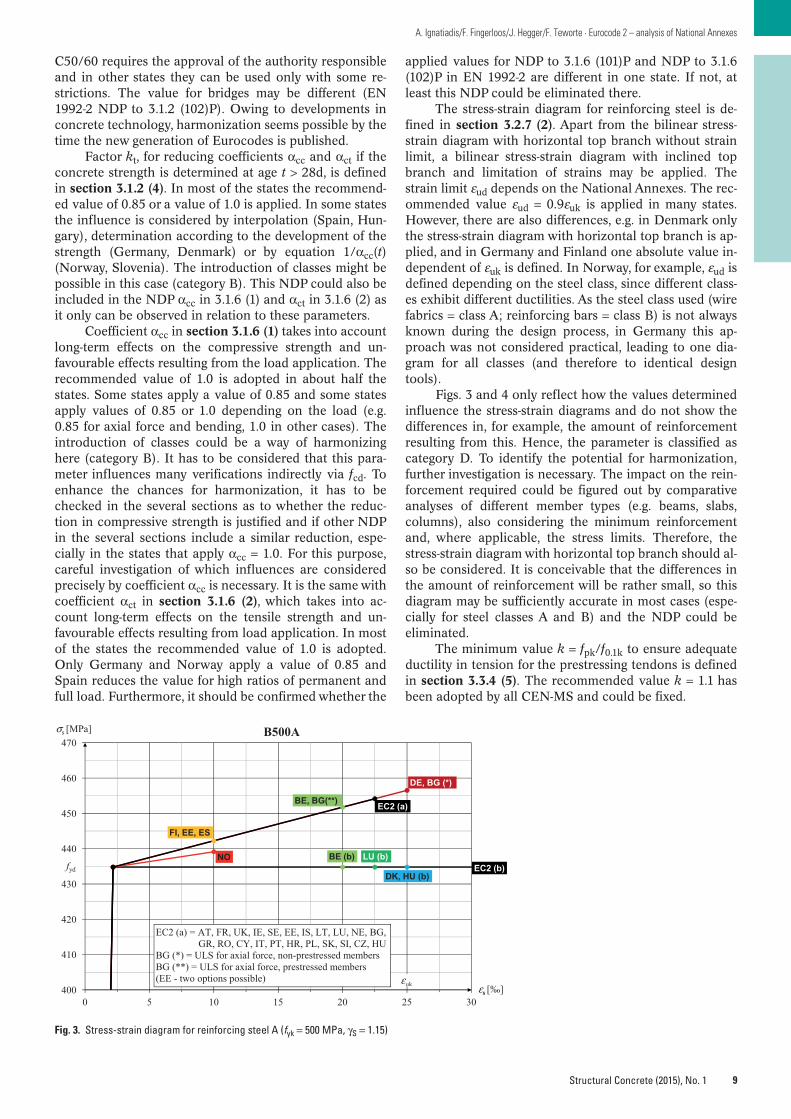
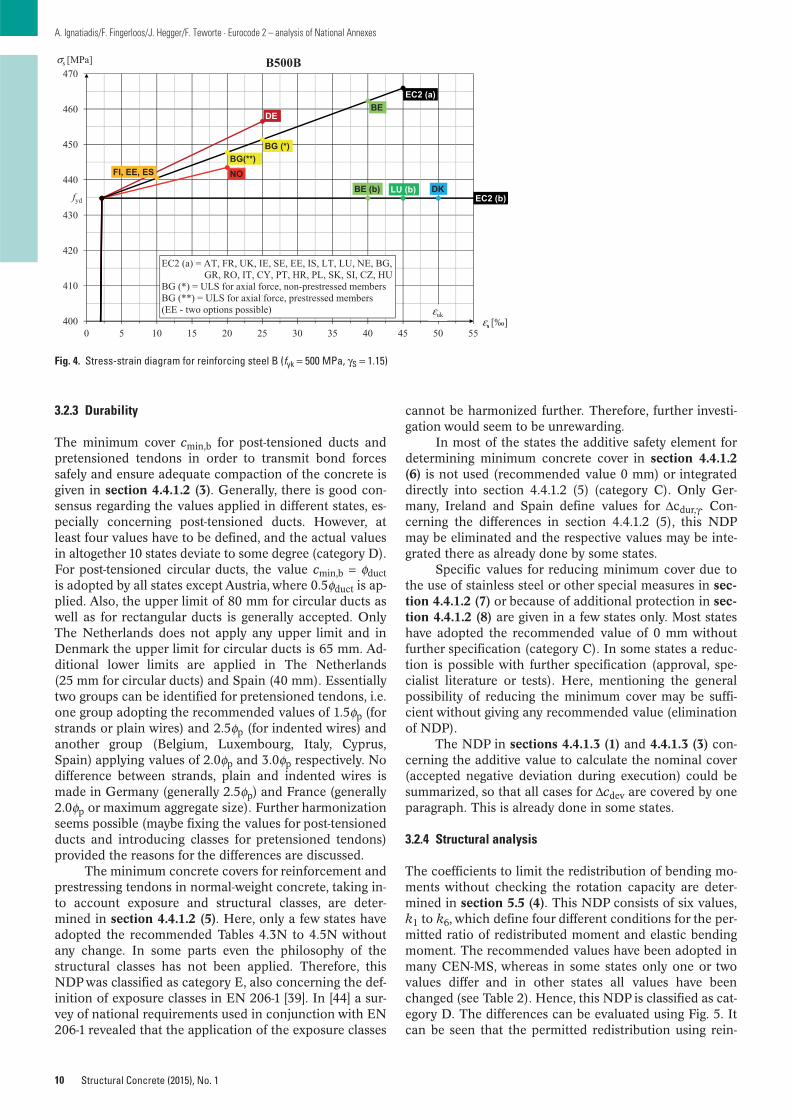
The stress-strain diagram for reinforcing steel is de-fined in section 3.2.7 (2). Apart from the bilinear stress-strain diagram with horizontal top branch without strainlimit, a bilinear stress-strain diagram with inclined topbranch and limitation of strains may be applied. Thestrain limit εud depends on the National Annexes. The rec-ommended value εud = 0.9εuk is applied in many states.However, there are also differences, e.g. in Denmark onlythe stress-strain diagram with horizontal top branch is ap-plied, and in Germany and Finland one absolute value in-dependent of εuk is defined. In Norway, for example, εud isdefined depending on the steel class, since different class-es exhibit different ductilities. As the steel class used (wirefabrics = class A; reinforcing bars = class B) is not alwaysknown during the design process, in Germany this ap-proach was not considered practical, leading to one dia-gram for all classes (and therefore to identical designtools).
Figs. 3 and 4 only reflect how the values determinedinfluence the stress-strain diagrams and do not show thedifferences in, for example, the amount of reinforcementresulting from this. Hence, the parameter is classified ascategory D. To identify the potential for harmonization,further investigation is necessary. The impact on the rein-forcement required could be figured out by comparativeanalyses of different member types (e.g. beams, slabs,columns), also considering the minimum reinforcementand, where applicable, the stress limits. Therefore, thestress-strain diagram with horizontal top branch should al-so be considered. It is conceivable that the differences inthe amount of reinforcement will be rather small, so thisdiagram may be sufficiently accurate in most cases (espe-cially for steel classes A and B) and the NDP could beeliminated.
The minimum value k = fpk/f0.1k to ensure adequateductility in tension for the prestressing tendons is definedin section 3.3.4 (5). The recommended value k = 1.1 hasbeen adopted by all CEN-MS and could be fixed.
440
450
460
470σs [MPa] B500A
EC2 (b)
EC2 (a)
DE, BG (*)
NOfyd
BE, BG(**)
FI, EE, ES
DK, HU (b)
BE (b) LU (b)
400
410
420
430
0 5 10 15 20 25 30εs [‰]uk
, ( )
EC2 (a) = AT, FR, UK, IE, SE, EE, IS, LT, LU, NE, BG, GR, RO, CY, IT, PT, HR, PL, SK, SI, CZ, HU
BG (*) = ULS for axial force, non-prestressed membersBG (**) = ULS for axial force, prestressed members(EE - two options possible) ε
Fig. 3. Stress-strain diagram for reinforcing steel A (fyk = 500 MPa, γS = 1.15)
3.2.3 Durability
The minimum cover cmin,b for post-tensioned ducts andpretensioned tendons in order to transmit bond forcessafely and ensure adequate compaction of the concrete isgiven in section 4.4.1.2 (3). Generally, there is good con-sensus regarding the values applied in different states, es-pecially concerning post-tensioned ducts. However, atleast four values have to be defined, and the actual valuesin altogether 10 states deviate to some degree (category D).For post-tensioned circular ducts, the value cmin,b = φductis adopted by all states except Austria, where 0.5φduct is ap-plied. Also, the upper limit of 80 mm for circular ducts aswell as for rectangular ducts is generally accepted. OnlyThe Netherlands does not apply any upper limit and inDenmark the upper limit for circular ducts is 65 mm. Ad-ditional lower limits are applied in The Netherlands(25 mm for circular ducts) and Spain (40 mm). Essentiallytwo groups can be identified for pretensioned tendons, i.e.one group adopting the recommended values of 1.5φp (forstrands or plain wires) and 2.5φp (for indented wires) andanother group (Belgium, Luxembourg, Italy, Cyprus,Spain) applying values of 2.0φp and 3.0φp respectively. Nodifference between strands, plain and indented wires ismade in Germany (generally 2.5φp) and France (generally2.0φp or maximum aggregate size). Further harmonizationseems possible (maybe fixing the values for post-tensionedducts and introducing classes for pretensioned tendons)provided the reasons for the differences are discussed.
The minimum concrete covers for reinforcement andprestressing tendons in normal-weight concrete, taking in-to account exposure and structural classes, are deter-mined in section 4.4.1.2 (5). Here, only a few states haveadopted the recommended Tables 4.3N to 4.5N withoutany change. In some parts even the philosophy of thestructural classes has not been applied. Therefore, thisNDP was classified as category E, also concerning the def-inition of exposure classes in EN 206-1 [39]. In [44] a sur-vey of national requirements used in conjunction with EN206-1 revealed that the application of the exposure classes
10
A. Ignatiadis/F. Fingerloos/J. Hegger/F. Teworte · Eurocode 2 – analysis of National Annexes
Structural Concrete (2015), No. 1
cannot be harmonized further. Therefore, further investi-gation would seem to be unrewarding.
In most of the states the additive safety element fordetermining minimum concrete cover in section 4.4.1.2(6) is not used (recommended value 0 mm) or integrateddirectly into section 4.4.1.2 (5) (category C). Only Ger-many, Ireland and Spain define values for Δcdur,γ. Con-cerning the differences in section 4.4.1.2 (5), this NDPmay be eliminated and the respective values may be inte-grated there as already done by some states.
Specific values for reducing minimum cover due tothe use of stainless steel or other special measures in sec-tion 4.4.1.2 (7) or because of additional protection in sec-tion 4.4.1.2 (8) are given in a few states only. Most stateshave adopted the recommended value of 0 mm withoutfurther specification (category C). In some states a reduc-tion is possible with further specification (approval, spe-cialist literature or tests). Here, mentioning the generalpossibility of reducing the minimum cover may be suffi-cient without giving any recommended value (eliminationof NDP).
The NDP in sections 4.4.1.3 (1) and 4.4.1.3 (3) con-cerning the additive value to calculate the nominal cover(accepted negative deviation during execution) could besummarized, so that all cases for Δcdev are covered by oneparagraph. This is already done in some states.
3.2.4 Structural analysis
The coefficients to limit the redistribution of bending mo-ments without checking the rotation capacity are deter-mined in section 5.5 (4). This NDP consists of six values,k1 to k6, which define four different conditions for the per-mitted ratio of redistributed moment and elastic bendingmoment. The recommended values have been adopted inmany CEN-MS, whereas in some states only one or twovalues differ and in other states all values have beenchanged (see Table 2). Hence, this NDP is classified as cat-egory D. The differences can be evaluated using Fig. 5. Itcan be seen that the permitted redistribution using rein-
470σs [MPa] B500B
460EC2 (a)
DEBE
450
FI EE ES
BG (*)BG(**)
440
EC2 (b)
NO
fyd
FI, EE, ES
DKBE (b) LU (b)
420
430
410
420EC2 (a) = AT, FR, UK, IE, SE, EE, IS, LT, LU, NE, BG,
GR, RO, IT, CY, PT, HR, PL, SK, SI, CZ, HU BG (*) = ULS for axial force, non-prestressed membersBG (**) ULS f i l f t d b
4000 5 10 15 20 25 30 35 40 45 50 55
εs [‰]εuk
BG (**) = ULS for axial force, prestressed members(EE - two options possible)
Fig. 4. Stress-strain diagram for reinforcing steel B (fyk = 500 MPa, γS = 1.15)
11
A. Ignatiadis/F. Fingerloos/J. Hegger/F. Teworte · Eurocode 2 – analysis of National Annexes
Structural Concrete (2015), No. 1
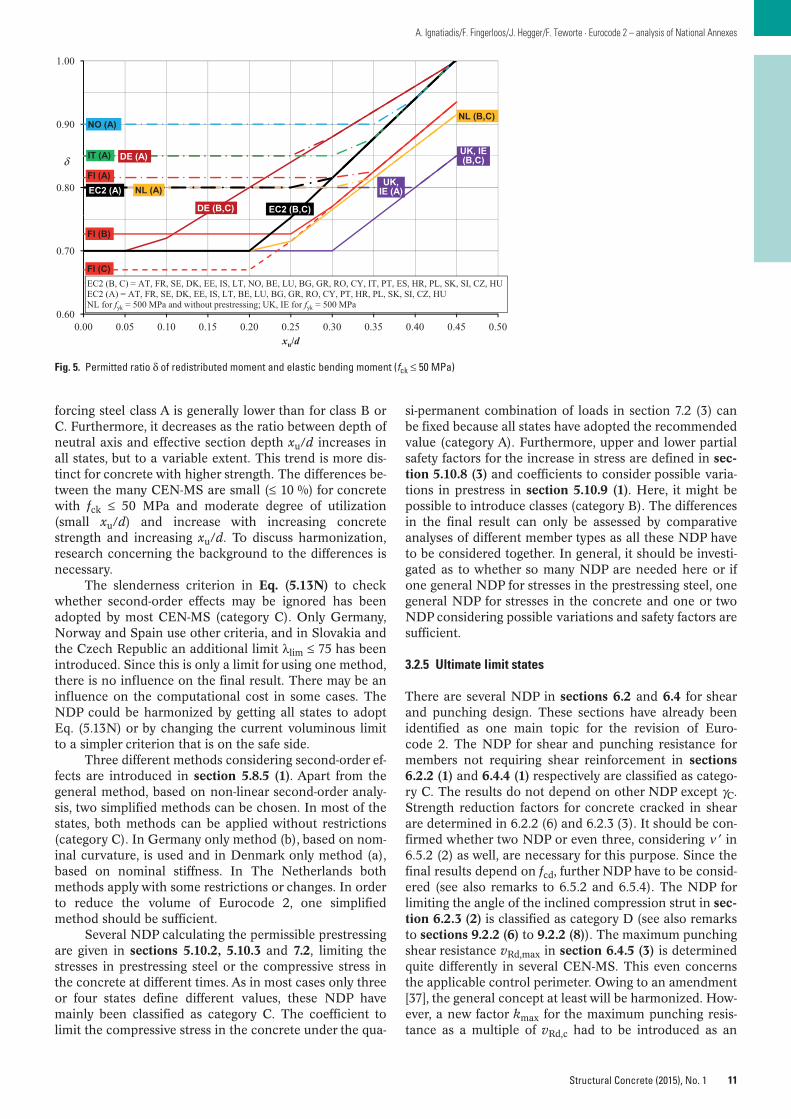
forcing steel class A is generally lower than for class B orC. Furthermore, it decreases as the ratio between depth ofneutral axis and effective section depth xu/d increases inall states, but to a variable extent. This trend is more dis-tinct for concrete with higher strength. The differences be-tween the many CEN-MS are small (≤ 10 %) for concretewith fck ≤ 50 MPa and moderate degree of utilization(small xu/d) and increase with increasing concretestrength and increasing xu/d. To discuss harmonization,research concerning the background to the differences isnecessary.
The slenderness criterion in Eq. (5.13N) to checkwhether second-order effects may be ignored has beenadopted by most CEN-MS (category C). Only Germany,Norway and Spain use other criteria, and in Slovakia andthe Czech Republic an additional limit λlim ≤ 75 has beenintroduced. Since this is only a limit for using one method,there is no influence on the final result. There may be aninfluence on the computational cost in some cases. TheNDP could be harmonized by getting all states to adoptEq. (5.13N) or by changing the current voluminous limitto a simpler criterion that is on the safe side.
Three different methods considering second-order ef-fects are introduced in section 5.8.5 (1). Apart from thegeneral method, based on non-linear second-order analy-sis, two simplified methods can be chosen. In most of thestates, both methods can be applied without restrictions(category C). In Germany only method (b), based on nom-inal curvature, is used and in Denmark only method (a),based on nominal stiffness. In The Netherlands bothmethods apply with some restrictions or changes. In orderto reduce the volume of Eurocode 2, one simplifiedmethod should be sufficient.
Several NDP calculating the permissible prestressingare given in sections 5.10.2, 5.10.3 and 7.2, limiting thestresses in prestressing steel or the compressive stress inthe concrete at different times. As in most cases only threeor four states define different values, these NDP havemainly been classified as category C. The coefficient tolimit the compressive stress in the concrete under the qua-
si-permanent combination of loads in section 7.2 (3) canbe fixed because all states have adopted the recommendedvalue (category A). Furthermore, upper and lower partialsafety factors for the increase in stress are defined in sec-tion 5.10.8 (3) and coefficients to consider possible varia-tions in prestress in section 5.10.9 (1). Here, it might bepossible to introduce classes (category B). The differencesin the final result can only be assessed by comparativeanalyses of different member types as all these NDP haveto be considered together. In general, it should be investi-gated as to whether so many NDP are needed here or ifone general NDP for stresses in the prestressing steel, onegeneral NDP for stresses in the concrete and one or twoNDP considering possible variations and safety factors aresufficient.
3.2.5 Ultimate limit states
There are several NDP in sections 6.2 and 6.4 for shearand punching design. These sections have already beenidentified as one main topic for the revision of Euro -code 2. The NDP for shear and punching resistance formembers not requiring shear reinforcement in sections6.2.2 (1) and 6.4.4 (1) respectively are classified as catego-ry C. The results do not depend on other NDP except γC.Strength reduction factors for concrete cracked in shearare determined in 6.2.2 (6) and 6.2.3 (3). It should be con-firmed whether two NDP or even three, considering ν ′ in6.5.2 (2) as well, are necessary for this purpose. Since thefinal results depend on fcd, further NDP have to be consid-ered (see also remarks to 6.5.2 and 6.5.4). The NDP forlimiting the angle of the inclined compression strut in sec-tion 6.2.3 (2) is classified as category D (see also remarksto sections 9.2.2 (6) to 9.2.2 (8)). The maximum punchingshear resistance vRd,max in section 6.4.5 (3) is determinedquite differently in several CEN-MS. This even concernsthe applicable control perimeter. Owing to an amendment[37], the general concept at least will be harmonized. How-ever, a new factor kmax for the maximum punching resis-tance as a multiple of vRd,c had to be introduced as an
0.80
0.90
1.00
δ
DE (B,C)
DE (A)IT (A)
EC2 (B,C)
UK, IE (B,C)
NL (B,C)
UK, IE (A)
FI (A)EC2 (A) NL (A)
NO (A)
0.60
0.70
0.00 0.05 0.10 0.15 0.20 0.25 0.30 0.35 0.40 0.45 0.50xu/d
EC2 (B, C) = AT, FR, SE, DK, EE, IS, LT, NO, BE, LU, BG, GR, RO, CY, IT, PT, ES, HR, PL, SK, SI, CZ, HUEC2 (A) = AT, FR, SE, DK, EE, IS, LT, BE, LU, BG, GR, RO, CY, PT, HR, PL, SK, SI, CZ, HUNL for fyk = 500 MPa and without prestressing; UK, IE for fyk = 500 MPa
FI (B)
FI (C)
Fig. 5. Permitted ratio δ of redistributed moment and elastic bending moment (fck ≤ 50 MPa)
NDP, which can hardly be harmonized since it also de-pends on the actual punching reinforcement details in theseveral states (EC2 recommendation: kmax = 1.5, but, forexample, Germany has kmax = 1.4). Further comparison ofnational rules can be found in [45–47].
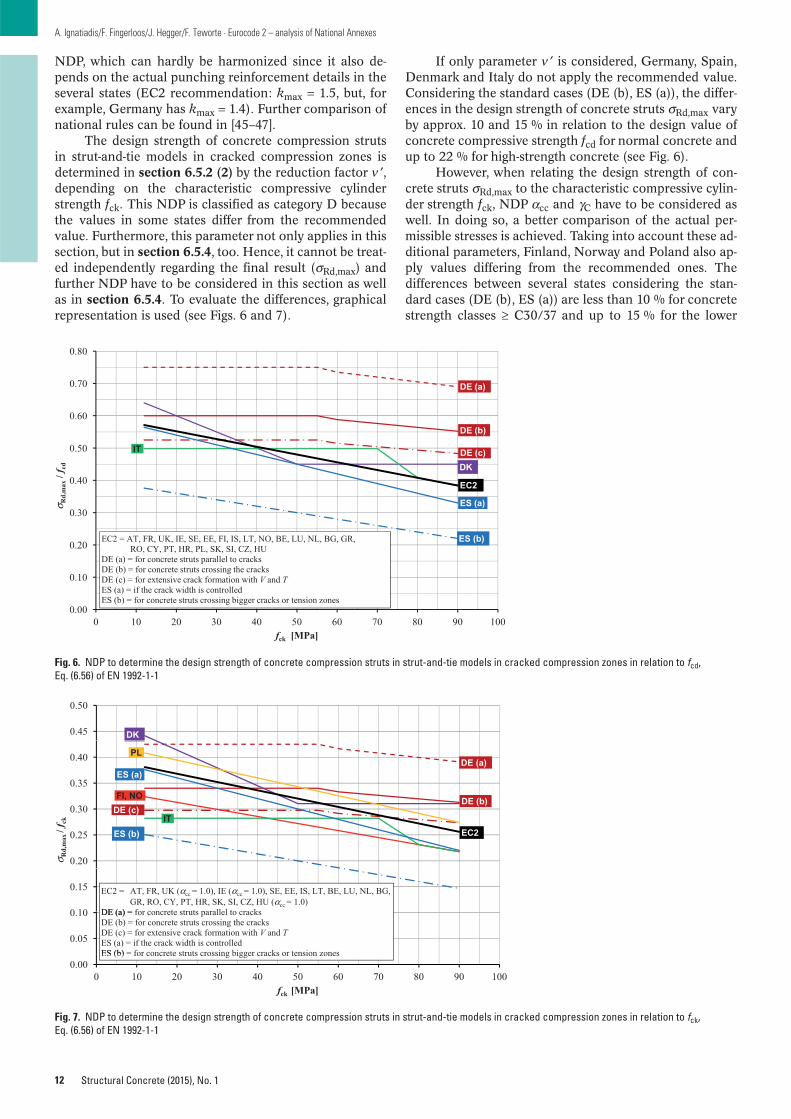
The design strength of concrete compression strutsin strut-and-tie models in cracked compression zones isdetermined in section 6.5.2 (2) by the reduction factor ν ′,depending on the characteristic compressive cylinderstrength fck. This NDP is classified as category D becausethe values in some states differ from the recommendedvalue. Furthermore, this parameter not only applies in thissection, but in section 6.5.4, too. Hence, it cannot be treat-ed independently regarding the final result (σRd,max) andfurther NDP have to be considered in this section as wellas in section 6.5.4. To evaluate the differences, graphicalrepresentation is used (see Figs. 6 and 7).
12
A. Ignatiadis/F. Fingerloos/J. Hegger/F. Teworte · Eurocode 2 – analysis of National Annexes
Structural Concrete (2015), No. 1
If only parameter ν ′ is considered, Germany, Spain,Denmark and Italy do not apply the recommended value.Considering the standard cases (DE (b), ES (a)), the differ-ences in the design strength of concrete struts σRd,max varyby approx. 10 and 15 % in relation to the design value ofconcrete compressive strength fcd for normal concrete andup to 22 % for high-strength concrete (see Fig. 6).
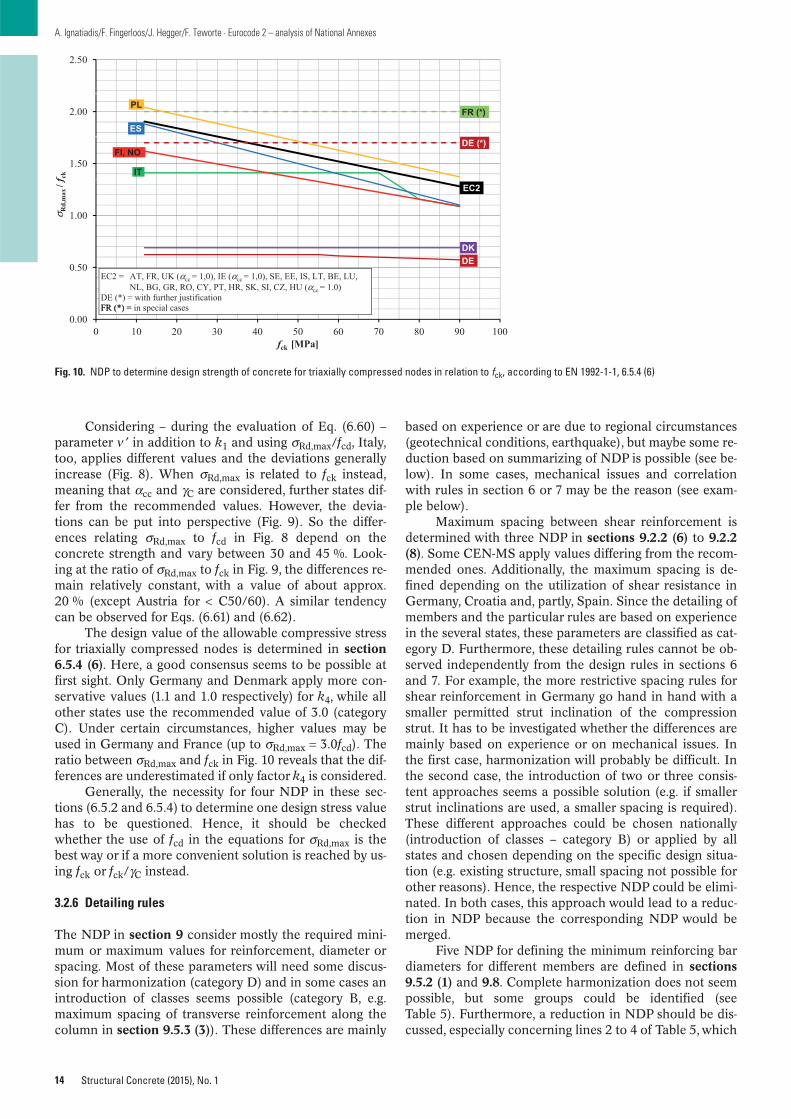
However, when relating the design strength of con-crete struts σRd,max to the characteristic compressive cylin-der strength fck, NDP αcc and γC have to be considered aswell. In doing so, a better comparison of the actual per-missible stresses is achieved. Taking into account these ad-ditional parameters, Finland, Norway and Poland also ap-ply values differing from the recommended ones. Thedifferences between several states considering the stan-dard cases (DE (b), ES (a)) are less than 10 % for concretestrength classes ≥ C30/37 and up to 15 % for the lower
0 30
0.40
0.50
0.60
0.70
0.80
σ Rd,
max
/ fcd
DE (a)
DE (b)
DE (c)IT
ES (a)
EC2
DK
0.00
0.10
0.20
0.30
0 10 20 30 40 50 60 70 80 90 100fck [MPa]
ES (b)EC2 = AT, FR, UK, IE, SE, EE, FI, IS, LT, NO, BE, LU, NL, BG, GR, RO, CY, PT, HR, PL, SK, SI, CZ, HU
DE (a) = for concrete struts parallel to cracksDE (b) = for concrete struts crossing the cracksDE (c) = for extensive crack formation with V and TES (a) = if the crack width is controlledES (b) = for concrete struts crossing bigger cracks or tension zones
Fig. 6. NDP to determine the design strength of concrete compression struts in strut-and-tie models in cracked compression zones in relation to fcd,Eq. (6.56) of EN 1992-1-1
0.45
0.50
DK
0 35
0.40 DE (a)ES (a)
PL
0.30
0.35
f ck
DE (b)DE (c)FI, NO
IT
0.20
0.25
σ Rd,
max
/ f
ES (b) EC2
0 10
0.15 EC2 = AT, FR, UK (αcc = 1.0), IE (αcc = 1.0), SE, EE, IS, LT, BE, LU, NL, BG, GR, RO, CY, PT, HR, SK, SI, CZ, HU (αcc = 1.0)
0.05
0.10 DE (a) = DE (b) = for concrete struts crossing the cracksDE (c) = for extensive crack formation with V and TES (a) = if the crack width is controlledES (b) =
0.000 10 20 30 40 50 60 70 80 90 100
fck [MPa]
ES (b) for concrete struts crossing bigger cracks or tension zones
DE (a) = for concrete struts parallel to cracks
Fig. 7. NDP to determine the design strength of concrete compression struts in strut-and-tie models in cracked compression zones in relation to fck,Eq. (6.56) of EN 1992-1-1

13
A. Ignatiadis/F. Fingerloos/J. Hegger/F. Teworte · Eurocode 2 – analysis of National Annexes
Structural Concrete (2015), No. 1
concrete strength classes (see Fig. 7). This means that thedeviations are overall smaller than they initially seem inFig. 6.
The allowable design values for compressive stresseswithin nodes of truss models are determined in section6.5.4 (4). In this context, different values are defined forcompression nodes without ties anchored at the node (Eq.(6.60)), compression-tension nodes with ties anchored inone direction (Eq. (6.61)) and compression-tension nodeswith ties anchored in more than one direction (Eq.(6.62)). The design values are determined by means ofNDP k1 to k3 defined in this section. Furthermore, allthree equations consider factor ν ′ (NDP to 6.5.2 (2)).Therefore, this NDP cannot be considered in isolation andis classified as category D, although the differences andthe number of states not applying the recommended val-ues seem rather small initially (see Table 4).
0.80
0.90
1.00
1.10
1.20
σ Rd,
max
/ f cd
DE
ITDK
AT
0.50
0.60
0.70
0 10 20 30 40 50 60 70 80 90 100fck [MPa]
ES
EC2
EC2 = FR, UK, IE, SE, EE, FI, IS, LT, NO, BE, LU, NL, BG, GR, RO, CY, PT, HR, PL, SK, SI, CZ, HU
Fig. 8. NDP to determine design strength of concrete for compression nodes without ties anchored at the node in relation to fcd, Eq. (6.60) of EN 1992-1-1
0.75
0.80
0 65
0.70
0.60
0.65
f ck DE
0.50
0.55
σ Rd,
max
/ f
DKFI, NO AT
0 40
0.45IT
EC2PL
0.35
0.40ES
EC2 = FR, UK (αcc = 1,0), IE (αcc = 1,0), SE, EE, IS, LT, BE, LU, = 1 0)
0.300 10 20 30 40 50 60 70 80 90 100
fck [MPa]
, , , , , , , , , , ( cc 1.0)αNL BG GR RO CY PT HR SK SI CZ HU (
Fig. 9. NDP to determine design strength of concrete for compression nodes without ties anchored at the node in relation to fck, Eq. (6.60) of EN 1992-1-1
Table 4. Differences in NDP to 6.5.4 (4)
Recommended values k1 = 1.0; k2 = 0.85; k3 = 0.75
(FR) Recommended values(in individual cases up to:k1 = 1/ν ′; k2 = 1.0; k3 = 0.9)
DE k1 = 1.1; k2 = 0.75; k3 = 0.75
AT k1 = 1.25; k2 = 0.9; k3 = 0.9
DK k2 = k3 = 1.0 and ν ′ = ν(ν according to NCI to 5.6.1 (3),usually ν = 0.8 for nodes)
ES k1 = 1.0; k2 = 0.7; k3 = 0.75
Considering – during the evaluation of Eq. (6.60) –parameter ν ′ in addition to k1 and using σRd,max/fcd, Italy,too, applies different values and the deviations generallyincrease (Fig. 8). When σRd,max is related to fck instead,meaning that αcc and γC are considered, further states dif-fer from the recommended values. However, the devia-tions can be put into perspective (Fig. 9). So the differ-ences relating σRd,max to fcd in Fig. 8 depend on theconcrete strength and vary between 30 and 45 %. Look-ing at the ratio of σRd,max to fck in Fig. 9, the differences re-main relatively constant, with a value of about approx.20 % (except Austria for < C50/60). A similar tendencycan be observed for Eqs. (6.61) and (6.62).
The design value of the allowable compressive stressfor triaxially compressed nodes is determined in section6.5.4 (6). Here, a good consensus seems to be possible atfirst sight. Only Germany and Denmark apply more con-servative values (1.1 and 1.0 respectively) for k4, while allother states use the recommended value of 3.0 (categoryC). Under certain circumstances, higher values may beused in Germany and France (up to σRd,max = 3.0fcd). Theratio between σRd,max and fck in Fig. 10 reveals that the dif-ferences are underestimated if only factor k4 is considered.
Generally, the necessity for four NDP in these sec-tions (6.5.2 and 6.5.4) to determine one design stress valuehas to be questioned. Hence, it should be checkedwhether the use of fcd in the equations for σRd,max is thebest way or if a more convenient solution is reached by us-ing fck or fck/γC instead.
3.2.6 Detailing rules
The NDP in section 9 consider mostly the required mini-mum or maximum values for reinforcement, diameter orspacing. Most of these parameters will need some discus-sion for harmonization (category D) and in some cases anintroduction of classes seems possible (category B, e.g.maximum spacing of transverse reinforcement along thecolumn in section 9.5.3 (3)). These differences are mainly
14
A. Ignatiadis/F. Fingerloos/J. Hegger/F. Teworte · Eurocode 2 – analysis of National Annexes
Structural Concrete (2015), No. 1
based on experience or are due to regional circumstances(geotechnical conditions, earthquake), but maybe some re-duction based on summarizing of NDP is possible (see be-low). In some cases, mechanical issues and correlationwith rules in section 6 or 7 may be the reason (see exam-ple below).
Maximum spacing between shear reinforcement isdetermined with three NDP in sections 9.2.2 (6) to 9.2.2(8). Some CEN-MS apply values differing from the recom-mended ones. Additionally, the maximum spacing is de-fined depending on the utilization of shear resistance inGermany, Croatia and, partly, Spain. Since the detailing ofmembers and the particular rules are based on experiencein the several states, these parameters are classified as cat-egory D. Furthermore, these detailing rules cannot be ob-served independently from the design rules in sections 6and 7. For example, the more restrictive spacing rules forshear reinforcement in Germany go hand in hand with asmaller permitted strut inclination of the compressionstrut. It has to be investigated whether the differences aremainly based on experience or on mechanical issues. Inthe first case, harmonization will probably be difficult. Inthe second case, the introduction of two or three consis-tent approaches seems a possible solution (e.g. if smallerstrut inclinations are used, a smaller spacing is required).These different approaches could be chosen nationally(introduction of classes – category B) or applied by allstates and chosen depending on the specific design situa-tion (e.g. existing structure, small spacing not possible forother reasons). Hence, the respective NDP could be elimi-nated. In both cases, this approach would lead to a reduc-tion in NDP because the corresponding NDP would bemerged.
Five NDP for defining the minimum reinforcing bardiameters for different members are defined in sections9.5.2 (1) and 9.8. Complete harmonization does not seempossible, but some groups could be identified (seeTable 5). Furthermore, a reduction in NDP should be dis-cussed, especially concerning lines 2 to 4 of Table 5, which
2.50
2.00ES
PLFR (*)
1.50
f ck IT
FI, NODE (*)
1.00σ Rd,
max
/ f
EC2
0 50DEDK
0 50EC2 = AT, FR, UK (αcc = 1,0), IE (αcc = 1,0), SE, EE, IS, LT, BE, LU,
NL, BG, GR, RO, CY, PT, HR, SK, SI, CZ, HU (αcc = 1.0)DE (*) = with further justification
0.000 10 20 30 40 50 60 70 80 90 100
fck [MPa]
FR (*) =
.
special casesFR (*) = in
Fig. 10. NDP to determine design strength of concrete for triaxially compressed nodes in relation to fck, according to EN 1992-1-1, 6.5.4 (6)
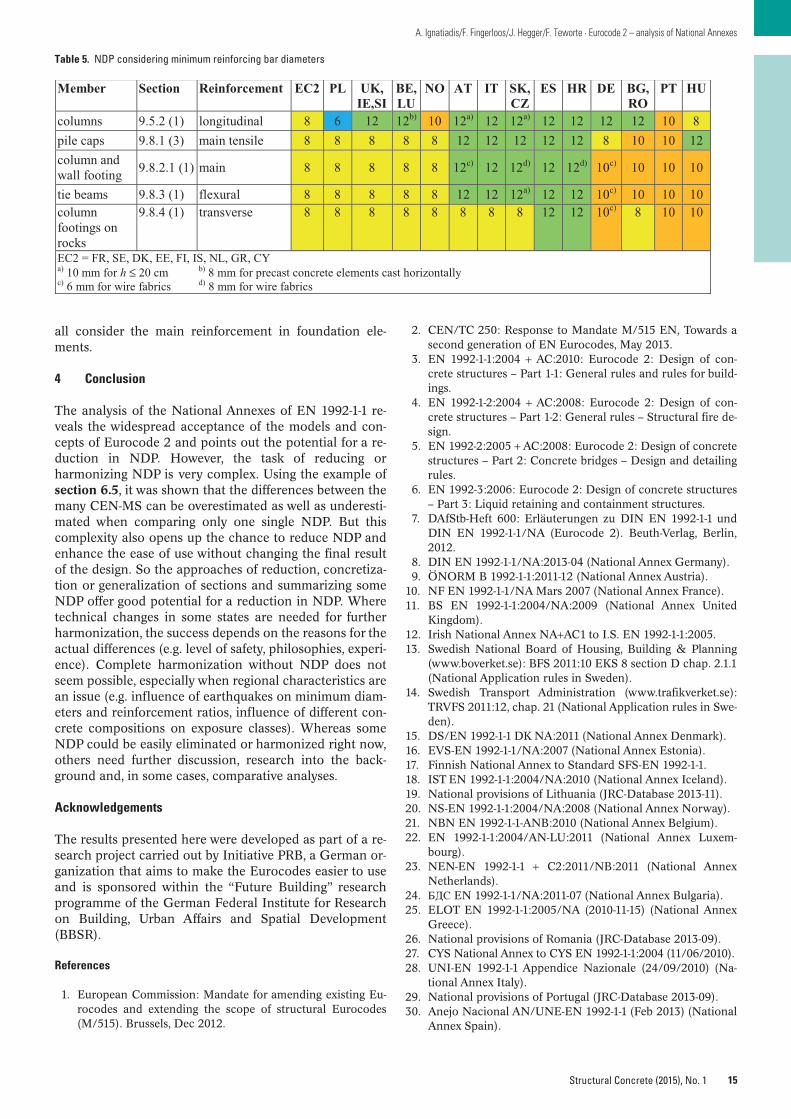
15
A. Ignatiadis/F. Fingerloos/J. Hegger/F. Teworte · Eurocode 2 – analysis of National Annexes
Structural Concrete (2015), No. 1
all consider the main reinforcement in foundation ele-ments.
4 Conclusion
The analysis of the National Annexes of EN 1992-1-1 re-veals the widespread acceptance of the models and con-cepts of Eurocode 2 and points out the potential for a re-duction in NDP. However, the task of reducing orharmonizing NDP is very complex. Using the example ofsection 6.5, it was shown that the differences between themany CEN-MS can be overestimated as well as underesti-mated when comparing only one single NDP. But thiscomplexity also opens up the chance to reduce NDP andenhance the ease of use without changing the final resultof the design. So the approaches of reduction, concretiza-tion or generalization of sections and summarizing someNDP offer good potential for a reduction in NDP. Wheretechnical changes in some states are needed for furtherharmonization, the success depends on the reasons for theactual differences (e.g. level of safety, philosophies, experi-ence). Complete harmonization without NDP does notseem possible, especially when regional characteristics arean issue (e.g. influence of earthquakes on minimum diam-eters and reinforcement ratios, influence of different con-crete compositions on exposure classes). Whereas someNDP could be easily eliminated or harmonized right now,others need further discussion, research into the back-ground and, in some cases, comparative analyses.
Acknowledgements
The results presented here were developed as part of a re-search project carried out by Initiative PRB, a German or-ganization that aims to make the Eurocodes easier to useand is sponsored within the “Future Building” researchprogramme of the German Federal Institute for Researchon Building, Urban Affairs and Spatial Development (BBSR).
References
1. European Commission: Mandate for amending existing Eu-rocodes and extending the scope of structural Eurocodes(M/515). Brussels, Dec 2012.
2. CEN/TC 250: Response to Mandate M/515 EN, Towards asecond generation of EN Eurocodes, May 2013.
3. EN 1992-1-1:2004 + AC:2010: Eurocode 2: Design of con-crete structures – Part 1-1: General rules and rules for build-ings.
4. EN 1992-1-2:2004 + AC:2008: Eurocode 2: Design of con-crete structures – Part 1-2: General rules – Structural fire de-sign.
5. EN 1992-2:2005 +AC:2008: Eurocode 2: Design of concretestructures – Part 2: Concrete bridges – Design and detailingrules.
6. EN 1992-3:2006: Eurocode 2: Design of concrete structures– Part 3: Liquid retaining and containment structures.
7. DAfStb-Heft 600: Erläuterungen zu DIN EN 1992-1-1 undDIN EN 1992-1-1/NA (Eurocode 2). Beuth-Verlag, Berlin,2012.
8. DIN EN 1992-1-1/NA:2013-04 (National Annex Germany).9. ÖNORM B 1992-1-1:2011-12 (National Annex Austria).
10. NF EN 1992-1-1/NA Mars 2007 (National Annex France).11. BS EN 1992-1-1:2004/NA:2009 (National Annex United
Kingdom).12. Irish National Annex NA+AC1 to I.S. EN 1992-1-1:2005.13. Swedish National Board of Housing, Building & Planning
(www.boverket.se): BFS 2011:10 EKS 8 section D chap. 2.1.1(National Application rules in Sweden).
14. Swedish Transport Administration (www.trafikverket.se):TRVFS 2011:12, chap. 21 (National Application rules in Swe-den).
15. DS/EN 1992-1-1 DK NA:2011 (National Annex Denmark).16. EVS-EN 1992-1-1/NA:2007 (National Annex Estonia).17. Finnish National Annex to Standard SFS-EN 1992-1-1.18. IST EN 1992-1-1:2004/NA:2010 (National Annex Iceland).19. National provisions of Lithuania (JRC-Database 2013-11).20. NS-EN 1992-1-1:2004/NA:2008 (National Annex Norway).21. NBN EN 1992-1-1-ANB:2010 (National Annex Belgium).22. EN 1992-1-1:2004/AN-LU:2011 (National Annex Luxem-
bourg).23. NEN-EN 1992-1-1 + C2:2011/NB:2011 (National Annex
Netherlands).24. БДС EN 1992-1-1/NA:2011-07 (National Annex Bulgaria).25. ELOT EN 1992-1-1:2005/NA (2010-11-15) (National Annex
Greece).26. National provisions of Romania (JRC-Database 2013-09).27. CYS National Annex to CYS EN 1992-1-1:2004 (11/06/2010).28. UNI-EN 1992-1-1 Appendice Nazionale (24/09/2010) (Na-
tional Annex Italy).29. National provisions of Portugal (JRC-Database 2013-09).30. Anejo Nacional AN/UNE-EN 1992-1-1 (Feb 2013) (National
Annex Spain).
Table 5. NDP considering minimum reinforcing bar diameters
Member Section Reinforcement EC2 PL UK,IE,SI
BE,LU
NO AT IT SK,CZ
ES HR DE BG,RO
PT HU
columns 9.5.2 (1) longitudinal 8 6 12 12b) 10 12a) 12 12a) 12 12 12 12 10 8pile caps 9.8.1 (3) main tensile 8 8 8 8 8 12 12 12 12 12 8 10 10 12column and wall footing 9.8.2.1 (1) main 8 8 8 8 8 12c) 12 12d) 12 12d) 10c) 10 10 10
tie beams 9.8.3 (1) flexural 8 8 8 8 8 12 12 12a) 12 12 10c) 10 10 10column footings on rocks
9.8.4 (1) transverse 8 8 8 8 8 8 8 8 12 12 10c) 8 10 10
EC2 = FR, SE, DK, EE, FI, IS, NL, GR, CYa) 10 mm for h ≤ 20 cm b) 8 mm for precast concrete elements cast horizontallyc) 6 mm for wire fabrics d) 8 mm for wire fabrics
31. HRN EN 1992-1-1:2013/NA (National Annex Croatia).32. PN-EN 1992-1-1:2008/NA:2010 (National Annex Poland).33. Národná príloha STN 1992-1-1/NA (2005) (National Annex
Slovakia).34. National provisions of Slovenia (JRC-Database 2013-09).35. CSN EN 1992-1-1 NA ed. A: 2011 (National Annex Czech Re-
public).36. MSZ EN 1992-1-1 NM (2012-06-04) (National Annex Hun-
gary).37. Draft (Amendment) Eurocode 2: Design of concrete struc-
tures – Part 1-1: General rules and rules for buildings; EN1992-1-1:2004/prA1:2013
38. PD 6687-1:2010 Background paper to the National Annexesto BS EN 1992-1 and BS EN 1992-3.
39. EN 206-1:2000-12: Concrete – Part 1: Specification, perfor-mance, production and conformity.
40. EN 10080:2005: Steel for the reinforcement of concrete –Weldable reinforcing steel – General.
41. EN 1536:2010: Execution of special geotechnical work –Bored piles.
42. NF P94-262: Justification of geotechnical work – Nationalapplication standards for the implementation of Eurocode 7– Deep foundations.
43. EN 1997: Eurocode 7: Geotechnical design.44. CEN/TR 15868:2009, Survey of national requirements used
in conjunction with EN 206-1:2000.45. Gmainer, S., Walraven, J.: Comparison of the National An-
nexes of Eurocode 2 for shear and punching shear capacity.In: Proc. of 3rd Intl. Workshop Design of Concrete Struc-tures using Eurocodes, Vienna, Sept 2012.
46. Siburg, C., Hegger, J.: Punching design of foundations ac-cording to Eurocode 2. In: Proc. of 3rd Intl. Workshop De-sign of Concrete Structures using Eurocodes, Vienna, Sept2012.
47. Siburg, C., Ricker, M., Hegger, J. (2014): Punching shear design of footings: critical review of different code provi-sions. Structural Concrete, 15: 497–508. doi: 10.1002/suco.201300092
16
A. Ignatiadis/F. Fingerloos/J. Hegger/F. Teworte · Eurocode 2 – analysis of National Annexes
Structural Concrete (2015), No. 1
Dr.-Ing. Frederik TeworteH+P Ingenieure GmbH & Co. KGKackertstr. 1052072 [email protected]
Prof. Dr.-Ing. Josef HeggerRWTH Aachen UniversityInstitute of Structural ConcreteMies-van-der-Rohe-Str. 152074 [email protected]
Dr.-Ing. Frank FingerloosGerman Society for Concrete & Construction TechnologyKurfuerstenstr. 12910785 [email protected]
Dipl.-Ing. Anett IgnatiadisGerman Committee for Structural ConcreteBudapester Str. 3110787 [email protected]
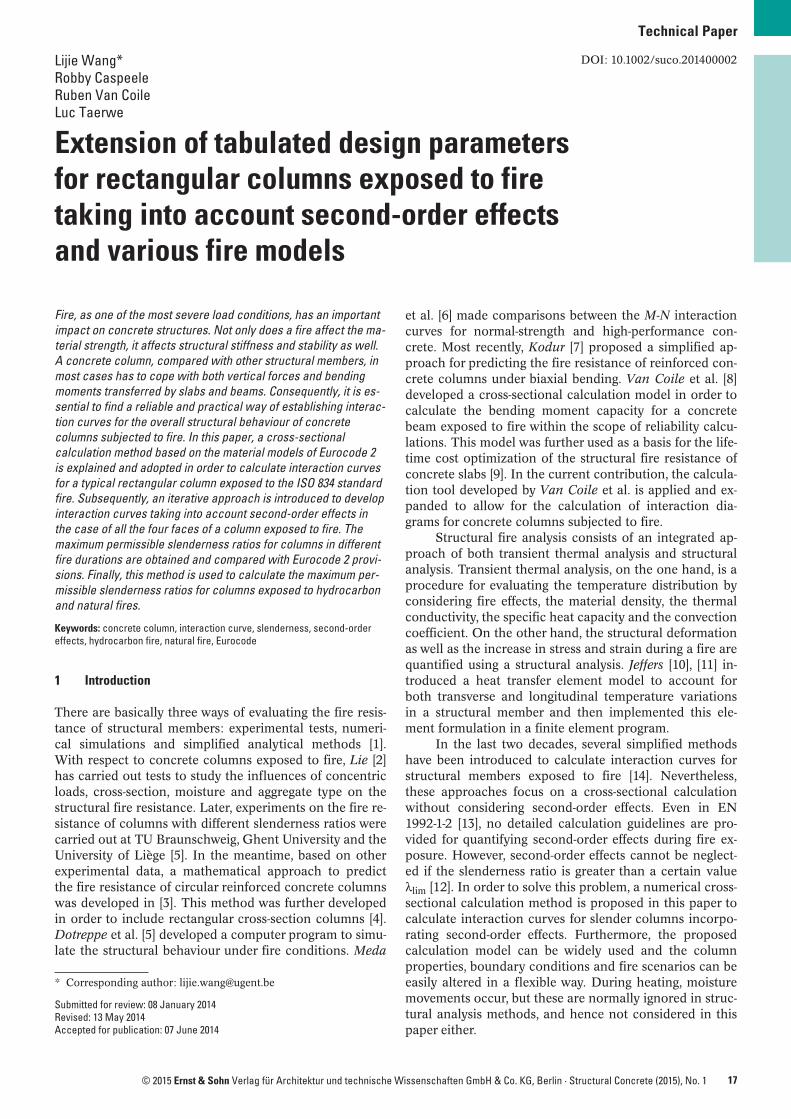
17© 2015 Ernst & Sohn Verlag für Architektur und technische Wissenschaften GmbH & Co. KG, Berlin · Structural Concrete (2015), No. 1
Fire, as one of the most severe load conditions, has an importantimpact on concrete structures. Not only does a fire affect the ma-terial strength, it affects structural stiffness and stability as well.A concrete column, compared with other structural members, inmost cases has to cope with both vertical forces and bendingmoments transferred by slabs and beams. Consequently, it is es-sential to find a reliable and practical way of establishing interac-tion curves for the overall structural behaviour of concretecolumns subjected to fire. In this paper, a cross-sectional calculation method based on the material models of Eurocode 2is explained and adopted in order to calculate interaction curvesfor a typical rectangular column exposed to the ISO 834 standardfire. Subsequently, an iterative approach is introduced to developinteraction curves taking into account second-order effects inthe case of all the four faces of a column exposed to fire. Themaximum permissible slenderness ratios for columns in differentfire durations are obtained and compared with Eurocode 2 provi-sions. Finally, this method is used to calculate the maximum per-missible slenderness ratios for columns exposed to hydrocarbonand natural fires.
Keywords: concrete column, interaction curve, slenderness, second-ordereffects, hydrocarbon fire, natural fire, Eurocode
1 Introduction
There are basically three ways of evaluating the fire resis-tance of structural members: experimental tests, numeri-cal simulations and simplified analytical methods [1].With respect to concrete columns exposed to fire, Lie [2]has carried out tests to study the influences of concentricloads, cross-section, moisture and aggregate type on thestructural fire resistance. Later, experiments on the fire re-sistance of columns with different slenderness ratios werecarried out at TU Braunschweig, Ghent University and theUniversity of Liège [5]. In the meantime, based on otherexperimental data, a mathematical approach to predictthe fire resistance of circular reinforced concrete columnswas developed in [3]. This method was further developedin order to include rectangular cross-section columns [4].Dotreppe et al. [5] developed a computer program to simu-late the structural behaviour under fire conditions. Meda
et al. [6] made comparisons between the M-N interactioncurves for normal-strength and high-performance con-crete. Most recently, Kodur [7] proposed a simplified ap-proach for predicting the fire resistance of reinforced con-crete columns under biaxial bending. Van Coile et al. [8]developed a cross-sectional calculation model in order tocalculate the bending moment capacity for a concretebeam exposed to fire within the scope of reliability calcu-lations. This model was further used as a basis for the life-time cost optimization of the structural fire resistance ofconcrete slabs [9]. In the current contribution, the calcula-tion tool developed by Van Coile et al. is applied and ex-panded to allow for the calculation of interaction dia-grams for concrete columns subjected to fire.
Structural fire analysis consists of an integrated ap-proach of both transient thermal analysis and structuralanalysis. Transient thermal analysis, on the one hand, is aprocedure for evaluating the temperature distribution byconsidering fire effects, the material density, the thermalconductivity, the specific heat capacity and the convectioncoefficient. On the other hand, the structural deformationas well as the increase in stress and strain during a fire arequantified using a structural analysis. Jeffers [10], [11] in-troduced a heat transfer element model to account forboth transverse and longitudinal temperature variationsin a structural member and then implemented this ele-ment formulation in a finite element program.
In the last two decades, several simplified methodshave been introduced to calculate interaction curves forstructural members exposed to fire [14]. Nevertheless,these approaches focus on a cross-sectional calculationwithout considering second-order effects. Even in EN1992-1-2 [13], no detailed calculation guidelines are pro-vided for quantifying second-order effects during fire ex-posure. However, second-order effects cannot be neglect-ed if the slenderness ratio is greater than a certain valueλlim [12]. In order to solve this problem, a numerical cross-sectional calculation method is proposed in this paper tocalculate interaction curves for slender columns incorpo-rating second-order effects. Furthermore, the proposedcalculation model can be widely used and the columnproperties, boundary conditions and fire scenarios can beeasily altered in a flexible way. During heating, moisturemovements occur, but these are normally ignored in struc-tural analysis methods, and hence not considered in thispaper either.
Technical Paper
Extension of tabulated design parametersfor rectangular columns exposed to firetaking into account second-order effectsand various fire models
Lijie Wang*Robby CaspeeleRuben Van CoileLuc Taerwe
DOI: 10.1002/suco.201400002
* Corresponding author: [email protected]
Submitted for review: 08 January 2014Revised: 13 May 2014Accepted for publication: 07 June 2014
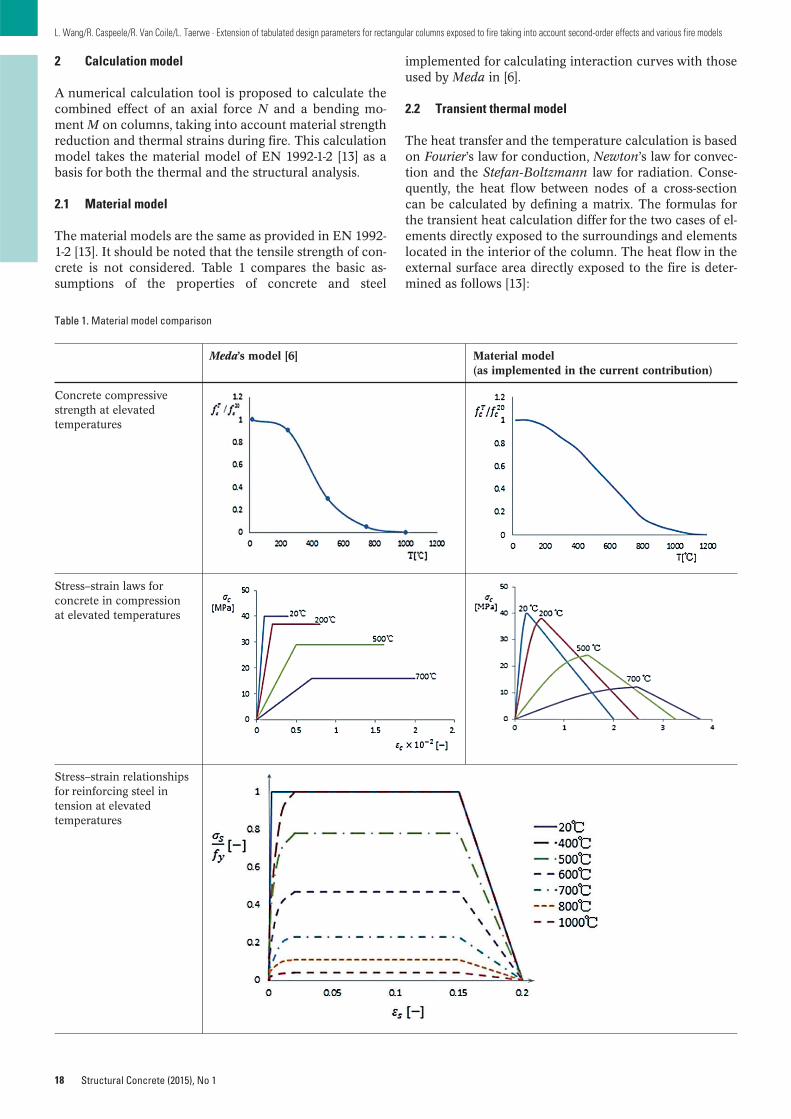
2 Calculation model
A numerical calculation tool is proposed to calculate thecombined effect of an axial force N and a bending mo-ment M on columns, taking into account material strengthreduction and thermal strains during fire. This calculationmodel takes the material model of EN 1992-1-2 [13] as abasis for both the thermal and the structural analysis.
2.1 Material model
The material models are the same as provided in EN 1992-1-2 [13]. It should be noted that the tensile strength of con-crete is not considered. Table 1 compares the basic as-sumptions of the properties of concrete and steel
18
L. Wang/R. Caspeele/R. Van Coile/L. Taerwe · Extension of tabulated design parameters for rectangular columns exposed to fire taking into account second-order effects and various fire models
Structural Concrete (2015), No 1
implemented for calculating interaction curves with thoseused by Meda in [6].
2.2 Transient thermal model
The heat transfer and the temperature calculation is basedon Fourier’s law for conduction, Newton’s law for convec-tion and the Stefan-Boltzmann law for radiation. Conse-quently, the heat flow between nodes of a cross-sectioncan be calculated by defining a matrix. The formulas forthe transient heat calculation differ for the two cases of el-ements directly exposed to the surroundings and elementslocated in the interior of the column. The heat flow in theexternal surface area directly exposed to the fire is deter-mined as follows [13]:
Table 1. Material model comparison
Meda’s model [6] Material model(as implemented in the current contribution)
Concrete compressive strength at elevated temperatures
Stress–strain laws for concrete in compression at elevated temperatures
Stress–strain relationships for reinforcing steel in tension at elevated temperatures
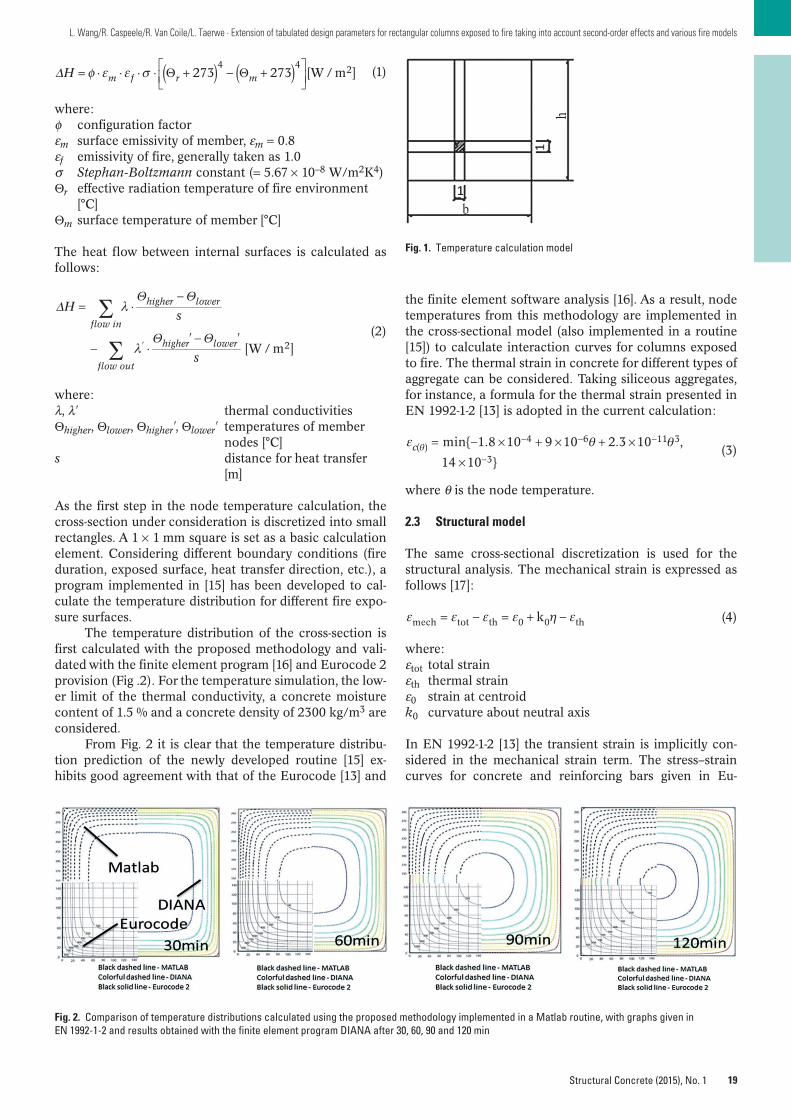
19
L. Wang/R. Caspeele/R. Van Coile/L. Taerwe · Extension of tabulated design parameters for rectangular columns exposed to fire taking into account second-order effects and various fire models
Structural Concrete (2015), No. 1
(1)
where:φ configuration factorεm surface emissivity of member, εm = 0.8εf emissivity of fire, generally taken as 1.0σ Stephan-Boltzmann constant (= 5.67 × 10⁻⁸ W/m2K4)Θr effective radiation temperature of fire environment
[°C]Θm surface temperature of member [°C]
The heat flow between internal surfaces is calculated asfollows:
(2)
where:λ, λ' thermal conductivitiesΘhigher, Θlower, Θhigher', Θlower' temperatures of member
nodes [°C]s distance for heat transfer
[m]
As the first step in the node temperature calculation, thecross-section under consideration is discretized into smallrectangles. A 1 × 1 mm square is set as a basic calculationelement. Considering different boundary conditions (fireduration, exposed surface, heat transfer direction, etc.), aprogram implemented in [15] has been developed to cal-culate the temperature distribution for different fire expo-sure surfaces.
The temperature distribution of the cross-section isfirst calculated with the proposed methodology and vali-dated with the finite element program [16] and Eurocode 2provision (Fig .2). For the temperature simulation, the low-er limit of the thermal conductivity, a concrete moisturecontent of 1.5 % and a concrete density of 2300 kg/m3 areconsidered.
From Fig. 2 it is clear that the temperature distribu-tion prediction of the newly developed routine [15] ex-hibits good agreement with that of the Eurocode [13] and
H 273 273 [W / m ]m f r m4 4 2
Hs
' '
s[W / m ]
flow in
higher lower
flow out
' higher lower 2
the finite element software analysis [16]. As a result, nodetemperatures from this methodology are implemented inthe cross-sectional model (also implemented in a routine[15]) to calculate interaction curves for columns exposedto fire. The thermal strain in concrete for different types ofaggregate can be considered. Taking siliceous aggregates,for instance, a formula for the thermal strain presented inEN 1992-1-2 [13] is adopted in the current calculation:
(3)
where θ is the node temperature.
2.3 Structural model
The same cross-sectional discretization is used for thestructural analysis. The mechanical strain is expressed asfollows [17]:
(4)
where:εtot total strainεth thermal strainε0 strain at centroidk0 curvature about neutral axis
In EN 1992-1-2 [13] the transient strain is implicitly con-sidered in the mechanical strain term. The stress–straincurves for concrete and reinforcing bars given in Eu-
kmech tot th 0 0 th
min{ 1.8 10 9 10 2.3 10 ,
14 10 }c( )
4 6 11 3
3
Fig. 1. Temperature calculation model
Fig. 2. Comparison of temperature distributions calculated using the proposed methodology implemented in a Matlab routine, with graphs given in EN 1992-1-2 and results obtained with the finite element program DIANA after 30, 60, 90 and 120 min
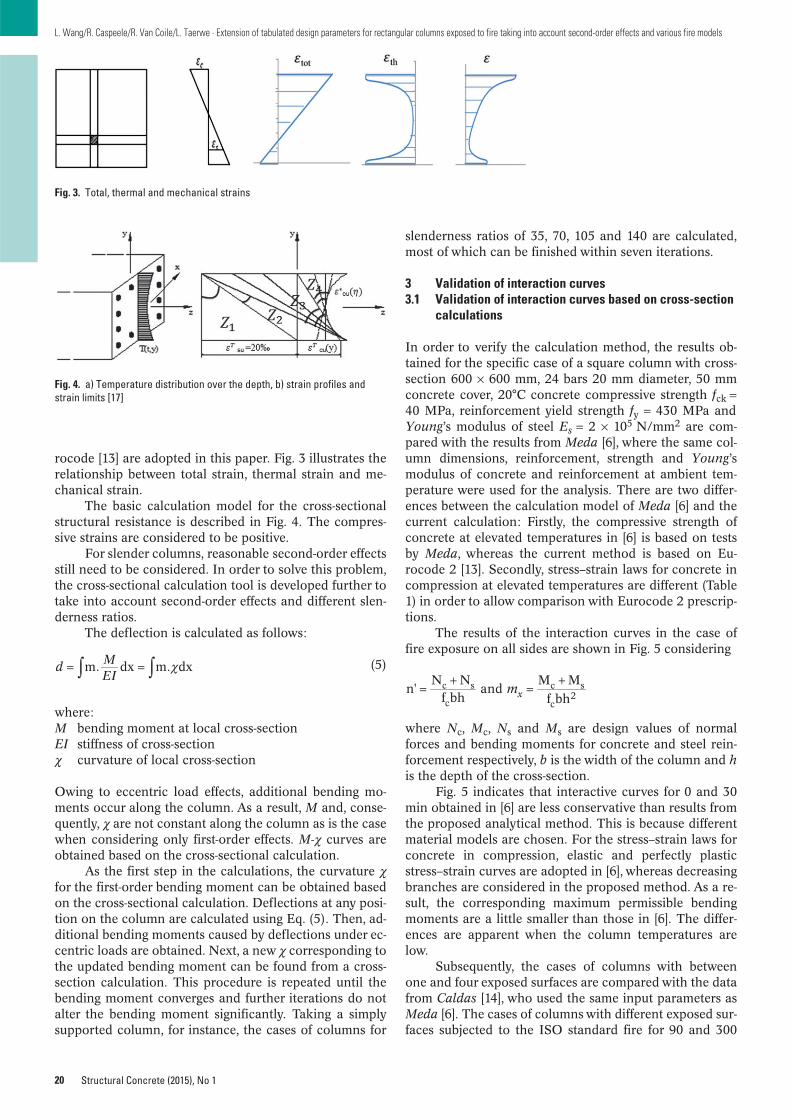
20
L. Wang/R. Caspeele/R. Van Coile/L. Taerwe · Extension of tabulated design parameters for rectangular columns exposed to fire taking into account second-order effects and various fire models
Structural Concrete (2015), No 1
slenderness ratios of 35, 70, 105 and 140 are calculated,most of which can be finished within seven iterations.
3 Validation of interaction curves3.1 Validation of interaction curves based on cross-section
calculations
In order to verify the calculation method, the results ob-tained for the specific case of a square column with cross-section 600 × 600 mm, 24 bars 20 mm diameter, 50 mmconcrete cover, 20°C concrete compressive strength fck =40 MPa, reinforcement yield strength fy = 430 MPa andYoung’s modulus of steel Es = 2 × 10⁵ N/mm2 are com-pared with the results from Meda [6], where the same col-umn dimensions, reinforcement, strength and Young’smodulus of concrete and reinforcement at ambient tem-perature were used for the analysis. There are two differ-ences between the calculation model of Meda [6] and thecurrent calculation: Firstly, the compressive strength ofconcrete at elevated temperatures in [6] is based on testsby Meda, whereas the current method is based on Eu-rocode 2 [13]. Secondly, stress–strain laws for concrete incompression at elevated temperatures are different (Table1) in order to allow comparison with Eurocode 2 prescrip-tions.
The results of the interaction curves in the case offire exposure on all sides are shown in Fig. 5 considering
where Nc, Mc, Ns and Ms are design values of normalforces and bending moments for concrete and steel rein-forcement respectively, b is the width of the column and his the depth of the cross-section.
Fig. 5 indicates that interactive curves for 0 and 30min obtained in [6] are less conservative than results fromthe proposed analytical method. This is because differentmaterial models are chosen. For the stress–strain laws forconcrete in compression, elastic and perfectly plasticstress–strain curves are adopted in [6], whereas decreasingbranches are considered in the proposed method. As a re-sult, the corresponding maximum permissible bendingmoments are a little smaller than those in [6]. The differ-ences are apparent when the column temperatures arelow.
Subsequently, the cases of columns with betweenone and four exposed surfaces are compared with the datafrom Caldas [14], who used the same input parameters asMeda [6]. The cases of columns with different exposed sur-faces subjected to the ISO standard fire for 90 and 300
mn'N N
f bhand
M M
f bhxc s
c
c s
c2
rocode [13] are adopted in this paper. Fig. 3 illustrates therelationship between total strain, thermal strain and me-chanical strain.
The basic calculation model for the cross-sectionalstructural resistance is described in Fig. 4. The compres-sive strains are considered to be positive.
For slender columns, reasonable second-order effectsstill need to be considered. In order to solve this problem,the cross-sectional calculation tool is developed further totake into account second-order effects and different slen-derness ratios.
The deflection is calculated as follows:
(5)
where:M bending moment at local cross-sectionEI stiffness of cross-sectionχ curvature of local cross-section
Owing to eccentric load effects, additional bending mo-ments occur along the column. As a result, M and, conse-quently, χ are not constant along the column as is the casewhen considering only first-order effects. M-χ curves areobtained based on the cross-sectional calculation.
As the first step in the calculations, the curvature χfor the first-order bending moment can be obtained basedon the cross-sectional calculation. Deflections at any posi-tion on the column are calculated using Eq. (5). Then, ad-ditional bending moments caused by deflections under ec-centric loads are obtained. Next, a new χ corresponding tothe updated bending moment can be found from a cross-section calculation. This procedure is repeated until thebending moment converges and further iterations do notalter the bending moment significantly. Taking a simplysupported column, for instance, the cases of columns for
d MEI
m. dx m. dx
Fig. 3. Total, thermal and mechanical strains
Fig. 4. a) Temperature distribution over the depth, b) strain profiles andstrain limits [17]
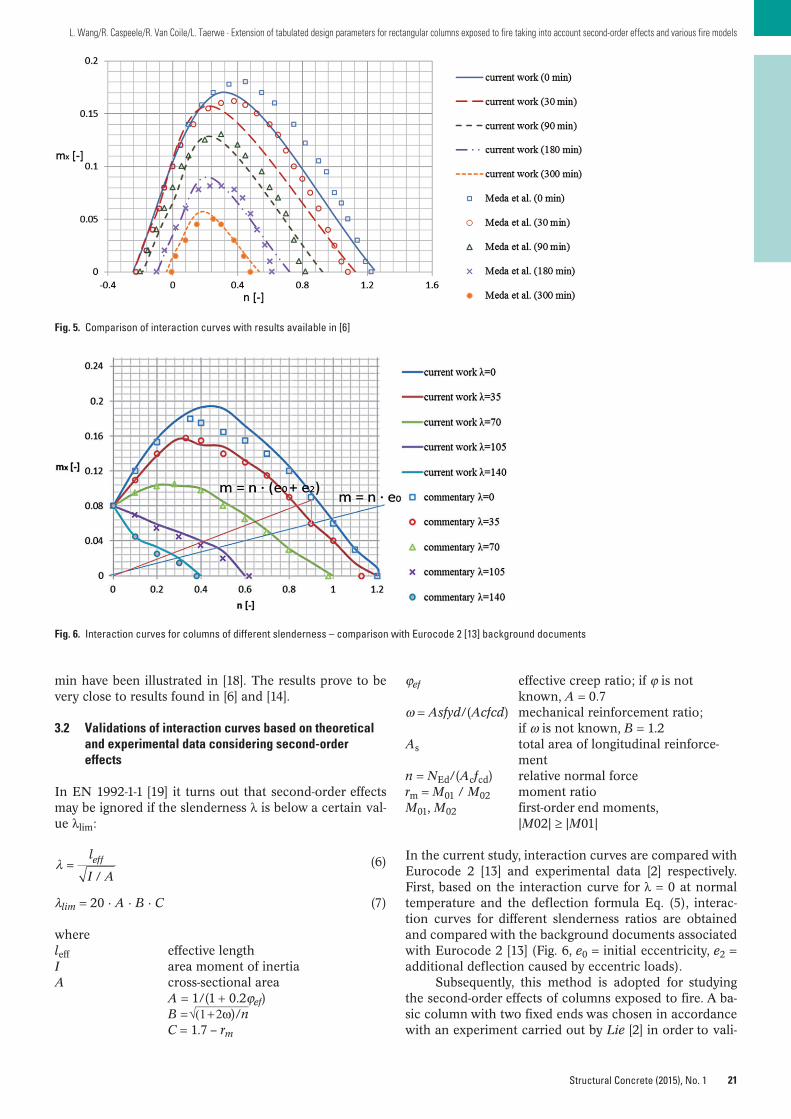
21
L. Wang/R. Caspeele/R. Van Coile/L. Taerwe · Extension of tabulated design parameters for rectangular columns exposed to fire taking into account second-order effects and various fire models
Structural Concrete (2015), No. 1
min have been illustrated in [18]. The results prove to bevery close to results found in [6] and [14].
3.2 Validations of interaction curves based on theoreticaland experimental data considering second-ordereffects
In EN 1992-1-1 [19] it turns out that second-order effectsmay be ignored if the slenderness λ is below a certain val-ue λlim:
(6)
λlim = 20 · A · B · C (7)
whereleff effective lengthI area moment of inertiaA cross-sectional area
A = 1/(1 + 0.2ϕef)B = √(1 + 2ω)/nC = 1.7 – rm
l
I A/eff
ϕef effective creep ratio; if ϕ is notknown, A = 0.7
ω = Asfyd/(Acfcd) mechanical reinforcement ratio; if ω is not known, B = 1.2
As total area of longitudinal reinforce-ment
n = NEd/(Acfcd) relative normal forcerm = M01 / M02 moment ratioM01, M02 first-order end moments,
|M02| ≥ |M01|
In the current study, interaction curves are compared withEurocode 2 [13] and experimental data [2] respectively.First, based on the interaction curve for λ = 0 at normaltemperature and the deflection formula Eq. (5), interac-tion curves for different slenderness ratios are obtainedand compared with the background documents associatedwith Eurocode 2 [13] (Fig. 6, e0 = initial eccentricity, e2 =additional deflection caused by eccentric loads).
Subsequently, this method is adopted for studyingthe second-order effects of columns exposed to fire. A ba-sic column with two fixed ends was chosen in accordancewith an experiment carried out by Lie [2] in order to vali-
Fig. 5. Comparison of interaction curves with results available in [6]
Fig. 6. Interaction curves for columns of different slenderness – comparison with Eurocode 2 [13] background documents
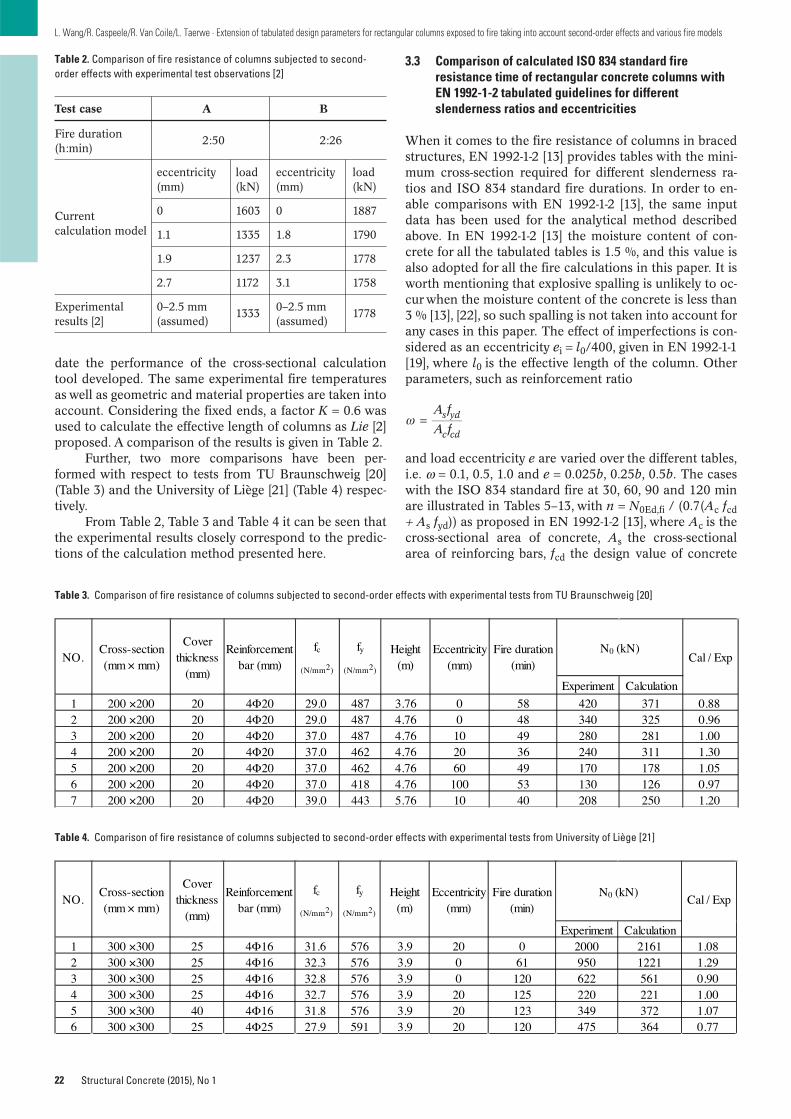
date the performance of the cross-sectional calculationtool developed. The same experimental fire temperaturesas well as geometric and material properties are taken intoaccount. Considering the fixed ends, a factor K = 0.6 wasused to calculate the effective length of columns as Lie [2]proposed. A comparison of the results is given in Table 2.
Further, two more comparisons have been per-formed with respect to tests from TU Braunschweig [20](Table 3) and the University of Liège [21] (Table 4) respec-tively.
From Table 2, Table 3 and Table 4 it can be seen thatthe experimental results closely correspond to the predic-tions of the calculation method presented here.
22
L. Wang/R. Caspeele/R. Van Coile/L. Taerwe · Extension of tabulated design parameters for rectangular columns exposed to fire taking into account second-order effects and various fire models
Structural Concrete (2015), No 1
3.3 Comparison of calculated ISO 834 standard fireresistance time of rectangular concrete columns withEN 1992-1-2 tabulated guidelines for differentslenderness ratios and eccentricities
When it comes to the fire resistance of columns in bracedstructures, EN 1992-1-2 [13] provides tables with the mini-mum cross-section required for different slenderness ra-tios and ISO 834 standard fire durations. In order to en-able comparisons with EN 1992-1-2 [13], the same inputdata has been used for the analytical method describedabove. In EN 1992-1-2 [13] the moisture content of con-crete for all the tabulated tables is 1.5 %, and this value isalso adopted for all the fire calculations in this paper. It isworth mentioning that explosive spalling is unlikely to oc-cur when the moisture content of the concrete is less than3 % [13], [22], so such spalling is not taken into account forany cases in this paper. The effect of imperfections is con-sidered as an eccentricity ei = l0/400, given in EN 1992-1-1[19], where l0 is the effective length of the column. Otherparameters, such as reinforcement ratio
and load eccentricity e are varied over the different tables,i.e. ω = 0.1, 0.5, 1.0 and e = 0.025b, 0.25b, 0.5b. The caseswith the ISO 834 standard fire at 30, 60, 90 and 120 minare illustrated in Tables 5–13, with n = N0Ed,fi / (0.7(Ac fcd+ As fyd)) as proposed in EN 1992-1-2 [13], where Ac is thecross-sectional area of concrete, As the cross-sectionalarea of reinforcing bars, fcd the design value of concrete
A f
A fs yd
c cd
Table 2. Comparison of fire resistance of columns subjected to second- order effects with experimental test observations [2]
Test case A B
Fire duration 2:50 2:26
(h:min)
eccentricity load eccentricity load (mm) (kN) (mm) (kN)
Current 0 1603 0 1887
calculation model 1.1 1335 1.8 1790
1.9 1237 2.3 1778
2.7 1172 3.1 1758
Experimental 0–2.5 mm 1333
0–2.5 mm 1778
results [2] (assumed) (assumed)
Table 3. Comparison of fire resistance of columns subjected to second-order effects with experimental tests from TU Braunschweig [20]
Experiment Calculation
1 200 ×200 20 4Ф20 29.0 487 3.76 0 58 420 371 0.882 200 ×200 20 4Ф20 29.0 487 4.76 0 48 340 325 0.963 200 ×200 20 4Ф20 37.0 487 4.76 10 49 280 281 1.004 200 ×200 20 4Ф20 37.0 462 4.76 20 36 240 311 1.305 200 ×200 20 4Ф20 37.0 462 4.76 60 49 170 178 1.056 200 ×200 20 4Ф20 37.0 418 4.76 100 53 130 126 0.977 200 ×200 20 4Ф20 39.0 443 5.76 10 40 208 250 1.20
Cal / Expfy
(N/mm2)
Height(m)
Eccentricity(mm)
Fire duration(min)
N0 (kN)NO.
Cross-section(mm × mm)
Coverthickness
(mm)
Reinforcementbar (mm)
fc
(N/mm2)
Table 4. Comparison of fire resistance of columns subjected to second-order effects with experimental tests from University of Liège [21]
Experiment Calculation1 300 ×300 25 4Ф16 31.6 576 3.9 20 0 2000 2161 1.082 300 ×300 25 4Ф16 32.3 576 3.9 0 61 950 1221 1.293 300 ×300 25 4Ф16 32.8 576 3.9 0 120 622 561 0.904 300 ×300 25 4Ф16 32.7 576 3.9 20 125 220 221 1.005 300 ×300 40 4Ф16 31.8 576 3.9 20 123 349 372 1.076 300 ×300 25 4Ф25 27.9 591 3.9 20 120 475 364 0.77
Cal / ExpN0 (kN)
NO.Cross-section(mm × mm)
Coverthickness
(mm)
Reinforcementbar (mm)
fc
(N/mm2)
fy
(N/mm2)
Height(m)
Eccentricity(mm)
Fire duration(min)
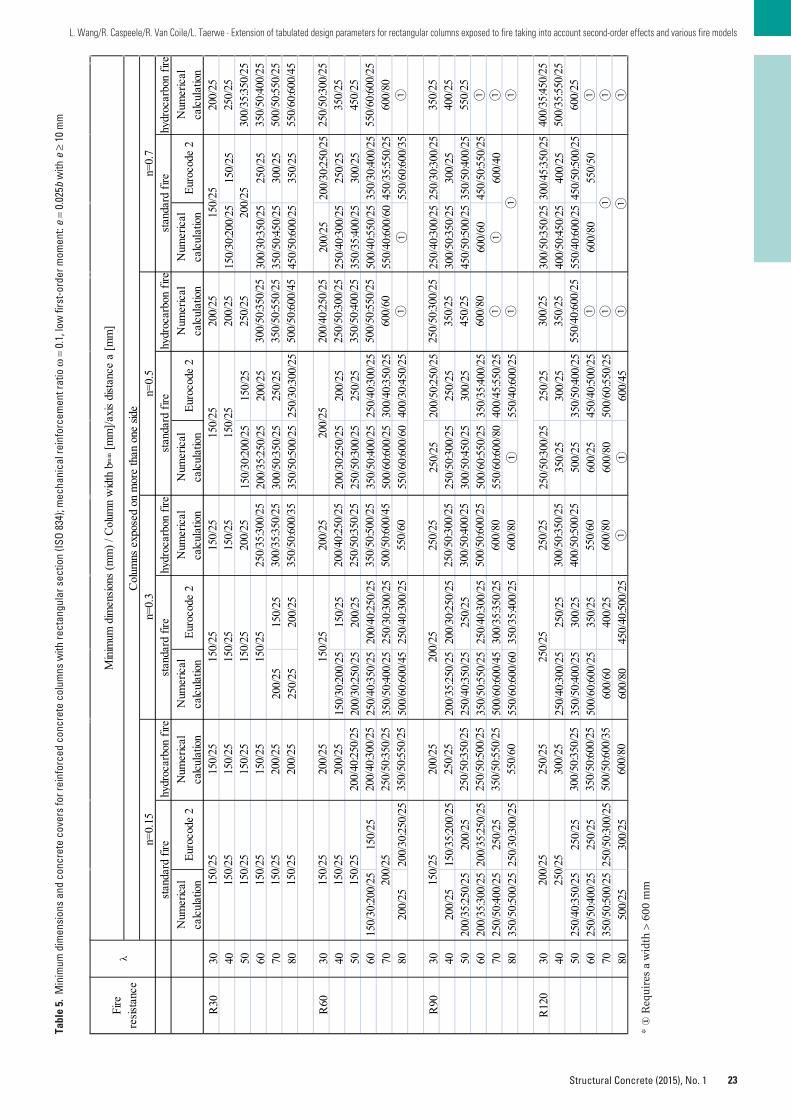
23
L. Wang/R. Caspeele/R. Van Coile/L. Taerwe · Extension of tabulated design parameters for rectangular columns exposed to fire taking into account second-order effects and various fire models
Structural Concrete (2015), No. 1
Tabl
e 5.
Min
imum
dim
ensi
ons
and
conc
rete
cov
ers
for
rein
forc
ed c
oncr
ete
colu
mns
with
rec
tang
ular
sec
tion
(IS
O 8
34);
mec
hani
cal r
einf
orce
men
t rat
io ω
=0.
1, lo
w fi
rst-
orde
r m
omen
t: e
=0.
025b
with
e≥
10 m
m
Num
erica
lca
lcul
atio
nEu
roco
de 2
Num
eric
alca
lcul
atio
nEu
roco
de 2
Num
eric
alca
lcul
atio
nEu
roco
de 2
Num
eric
alca
lcul
atio
nEu
roco
de 2
R30
30 4015
0/30
:200
/25
150/
2550
150/
30:2
00/2
515
0/25
6020
0/35
:250
/25
200/
2530
0/30
:350
/25
250/
2570
200/
2515
0/25
300/
50:3
50/2
525
0/25
350/
50:4
50/2
530
0/25
8025
0/25
200/
2535
0/50
:500
/25
250/
30:3
00/2
545
0/50
:600
/25
350/
25
R60
3020
0/25
200/
30:2
50/2
540
150/
30:2
00/2
515
0/25
200/
30:2
50/2
520
0/25
250/
40:3
00/2
525
0/25
5020
0/30
:250
/25
200/
2525
0/50
:300
/25
250/
2535
0/35
:400
/25
300/
2560
150/
30:2
00/2
515
0/25
250/
40:3
50/2
520
0/40
:250
/25
350/
50:4
00/2
525
0/40
:300
/25
500/
40:5
50/2
535
0/30
:400
/25
7035
0/50
:400
/25
250/
30:3
00/2
550
0/60
:600
/25
300/
40:3
50/2
555
0/40
:600
/60
450/
35:5
50/2
580
200/
2520
0/30
:250
/25
500/
60:6
00/4
525
0/40
:300
/25
550/
60:6
00/6
040
0/30
:450
/25
①55
0/60
:600
/35
R90
3025
0/25
200/
50:2
50/2
525
0/40
:300
/25
250/
30:3
00/2
540
200/
2515
0/35
:200
/25
200/
35:2
50/2
520
0/30
:250
/25
250/
50:3
00/2
525
0/25
300/
50:3
50/2
530
0/25
5020
0/35
:250
/25
200/
2525
0/40
:350
/25
250/
2530
0/50
:450
/25
300/
2545
0/50
:500
/25
350/
50:4
00/2
560
200/
35:3
00/2
520
0/35
:250
/25
350/
50:5
50/2
525
0/40
:300
/25
500/
60:5
50/2
535
0/35
:400
/25
600/
6045
0/50
:550
/25
7025
0/50
:400
/25
250/
2550
0/60
:600
/45
300/
35:3
50/2
555
0/60
:600
/80
400/
45:5
50/2
5①
600/
4080
350/
50:5
00/2
525
0/30
:300
/25
550/
60:6
00/6
035
0/35
:400
/25
①55
0/40
:600
/25
R12
030
250/
50:3
00/2
525
0/25
300/
50:3
50/2
530
0/45
:350
/25
4025
0/40
:300
/25
250/
2535
0/25
300/
2540
0/50
:450
/25
400/
2550
250/
40:3
50/2
525
0/25
350/
50:4
00/2
530
0/25
500/
2535
0/50
:400
/25
550/
40:6
00/2
545
0/50
:500
/25
6025
0/50
:400
/25
250/
2550
0/60
:600
/25
350/
2560
0/25
450/
40:5
00/2
560
0/80
550/
5070
350/
50:5
00/2
525
0/50
:300
/25
600/
6040
0/25
600/
8050
0/60
:550
/25
8050
0/25
300/
2560
0/80
450/
40:5
00/2
5①
600/
45
Num
eric
alca
lcul
atio
n
① ①
400/
35:4
50/2
550
0/35
:550
/25
600/
25① ① ①
450/
2555
0/60
:600
/25
600/
80①
350/
2540
0/25
550/
25①
200/
2525
0/25
300/
35:3
50/2
535
0/50
:400
/25
500/
50:5
50/2
555
0/60
:600
/45
250/
50:3
00/2
535
0/25
600/
80① ①
300/
2535
0/25
550/
40:6
00/2
5① ①
250/
50:3
00/2
535
0/50
:400
/25
500/
50:5
50/2
560
0/60①
250/
50:3
00/2
535
0/25
450/
25
Num
eric
alca
lcul
atio
n20
0/25
200/
2525
0/25
300/
50:3
50/2
535
0/50
:550
/25
500/
50:6
00/4
5
200/
40:2
50/2
5
500/
50:6
00/2
560
0/80
600/
80
250/
2530
0/50
:350
/25
400/
50:5
00/2
555
0/60
600/
80
200/
40:2
50/2
525
0/50
:350
/25
350/
50:5
00/2
550
0/50
:600
/45
550/
60
250/
2525
0/50
:300
/25
300/
50:4
00/2
5
Num
eric
alca
lcul
atio
n15
0/25
150/
2520
0/25
250/
35:3
00/2
530
0/35
:350
/25
350/
50:6
00/3
5
200/
25
250/
50:3
50/2
525
0/50
:500
/25
350/
50:5
50/2
555
0/60
250/
2530
0/25
300/
50:3
50/2
535
0/50
:600
/25
Num
erica
lca
lcula
tion
hydr
ocar
bon
fire
150/
2515
0/25
150/
2515
0/25
200/
2520
0/25
200/
2520
0/25
200/
40:2
50/2
520
0/40
:300
/25
250/
50:3
50/2
535
0/50
:550
/25
200/
2525
0/25
stan
dard
fire
stan
dard
fire
stan
dard
fire
n=0.
15n=
0.3
n=0.
5hy
droc
arbo
n fir
ehy
droc
arbo
n fir
e
Min
imum
dim
ensio
ns (m
m) /
Col
umn
wid
th b
min [m
m]/a
xis
dist
ance
a [m
m]
Col
umns
exp
osed
on
mor
e th
an o
ne si
den=
0.7
hydr
ocar
bon
fire
150/
25
150/
2515
0/25
200/
25
150/
25
200/
25
150/
2515
0/25
150/
2515
0/25
①
250/
2525
0/25
Fire
resis
tanc
eλ
200/
25
150/
2515
0/25
150/
2515
0/25
150/
2515
0/25
150/
2515
0/25
150/
25
stan
dard
fire
① ①50
0/50
:600
/35
600/
80①
①
200/
25
200/
2515
0/25
* �
Req
uir
es a
wid
th >
600
mm
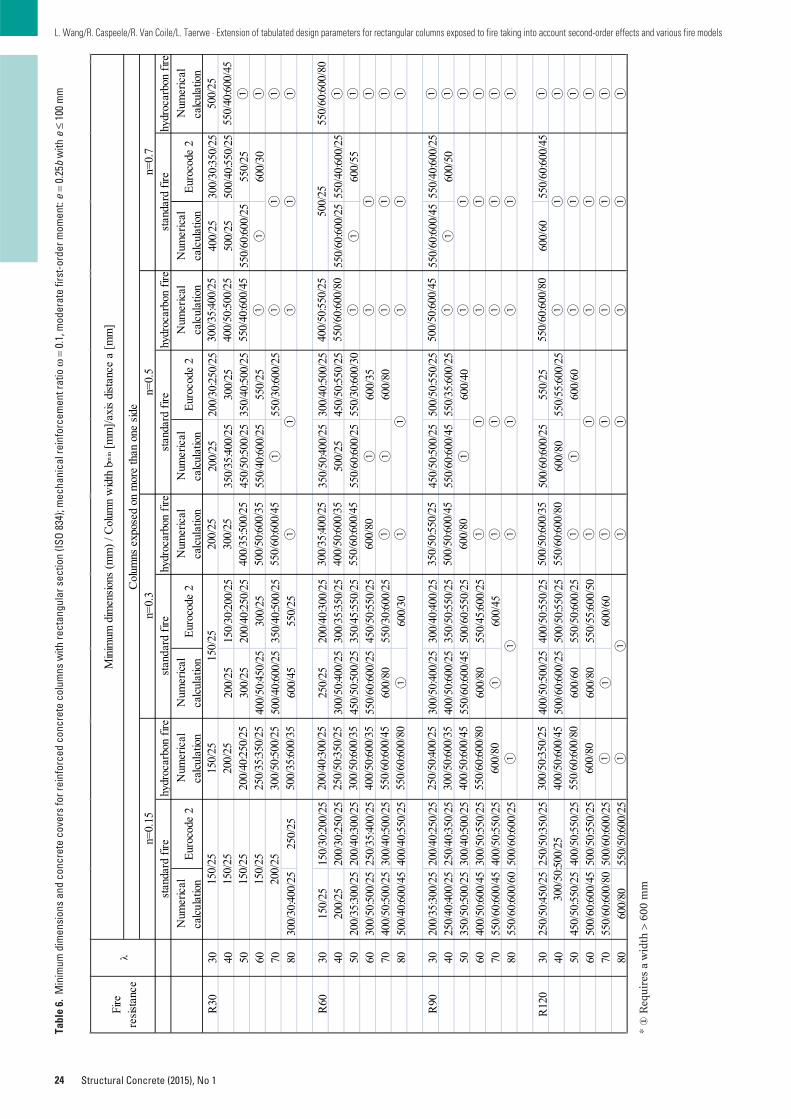
24
L. Wang/R. Caspeele/R. Van Coile/L. Taerwe · Extension of tabulated design parameters for rectangular columns exposed to fire taking into account second-order effects and various fire models
Structural Concrete (2015), No 1
Tabl
e 6.
Min
imum
dim
ensi
ons
and
conc
rete
cov
ers
for
rein
forc
ed c
oncr
ete
colu
mns
with
rec
tang
ular
sec
tion
(IS
O 8
34);
mec
hani
cal r
einf
orce
men
t rat
io ω
=0.
1, m
oder
ate
first
-ord
er m
omen
t: e
=0.
25b
with
e≤
100
mm
Num
eric
alca
lcula
tion
Euro
code
2N
umer
ical
calcu
latio
nEu
roco
de 2
Num
eric
alca
lcula
tion
Euro
code
2N
umer
ical
calc
ulat
ion
Euro
code
2
R30
3020
0/25
200/
30:2
50/2
540
0/25
300/
30:3
50/2
540
200/
2515
0/30
:200
/25
350/
35:4
00/2
530
0/25
500/
2550
0/40
:550
/25
5030
0/25
200/
40:2
50/2
545
0/50
:500
/25
350/
40:5
00/2
555
0/60
:600
/25
550/
2560
400/
50:4
50/2
530
0/25
550/
40:6
00/2
555
0/25
①60
0/30
7050
0/40
:600
/25
350/
40:5
00/2
5①
550/
30:6
00/2
580
300/
30:4
00/2
525
0/25
600/
4555
0/25
R60
3015
0/25
150/
30:2
00/2
525
0/25
200/
40:3
00/2
535
0/50
:400
/25
300/
40:5
00/2
540
200/
2520
0/30
:250
/25
300/
50:4
00/2
530
0/35
:350
/25
500/
2545
0/50
:550
/25
550/
60:6
00/2
555
0/40
:600
/25
5020
0/35
:300
/25
200/
40:3
00/2
545
0/50
:500
/25
350/
45:5
50/2
555
0/60
:600
/25
550/
30:6
00/3
0①
600/
5560
300/
50:5
00/2
525
0/35
:400
/25
550/
60:6
00/2
545
0/50
:550
/25
①60
0/35
7040
0/50
:500
/25
300/
40:5
00/2
560
0/80
550/
30:6
00/2
5①
600/
8080
500/
40:6
00/4
540
0/40
:550
/25
①60
0/30
R90
3020
0/35
:300
/25
200/
40:2
50/2
530
0/50
:400
/25
300/
40:4
00/2
545
0/50
:500
/25
500/
50:5
50/2
555
0/60
:600
/45
550/
40:6
00/2
540
250/
40:4
00/2
525
0/40
:350
/25
400/
50:6
00/2
535
0/50
:550
/25
550/
60:6
00/4
555
0/35
:600
/25
①60
0/50
5035
0/50
:500
/25
300/
40:5
00/2
555
0/60
:600
/45
500/
60:5
50/2
5①
600/
4060
400/
50:6
00/4
530
0/50
:550
/25
600/
8055
0/45
:600
/25
7055
0/60
:600
/45
400/
50:5
50/2
5①
600/
4580
550/
60:6
00/6
050
0/60
:600
/25
R12
030
250/
50:4
50/2
525
0/50
:350
/25
400/
50:5
00/2
540
0/50
:550
/25
500/
60:6
00/2
555
0/25
600/
6055
0/60
:600
/45
4050
0/60
:600
/25
500/
50:5
50/2
560
0/80
550/
55:6
00/2
550
450/
50:5
50/2
540
0/50
:550
/25
600/
6055
0/50
:600
/25
①60
0/60
6050
0/60
:600
/45
500/
50:5
50/2
560
0/80
550/
55:6
00/5
070
550/
60:6
00/8
050
0/60
:600
/25
①60
0/60
8060
0/80
550/
50:6
00/2
5
① ① ① ①①
500/
2555
0/40
:600
/45
① ① ① ①
550/
60:6
00/8
0① ① ① ① ① ① ① ① ① ① ① ① ①
① ① ①
550/
60:6
00/8
0① ① ① ①
500/
50:6
00/3
555
0/60
:600
/80
① ① ① ①
300/
35:4
00/2
540
0/50
:500
/25
550/
40:6
00/4
5① ① ①
400/
50:5
50/2
555
0/60
:600
/80
① ① ① ①
500/
50:6
00/4
5① ①
550/
60:6
00/8
060
0/80① ①
200/
2530
0/25
400/
35:5
00/2
550
0/50
:600
/35
550/
60:6
00/4
5①
300/
35:4
00/2
540
0/50
:600
/35
550/
60:6
00/4
560
0/80① ①
350/
50:5
50/2
550
0/50
:600
/45
600/
80① ① ①
250/
50:4
00/2
530
0/50
:600
/35
400/
50:6
00/4
555
0/60
:600
/80
600/
80①
300/
50:3
50/2
540
0/50
:600
/45
Num
eric
alca
lcula
tion
Min
imum
dim
ensio
ns (m
m) /
Col
umn
wid
th b
min [m
m]/a
xis
dist
ance
a [m
m]
Col
umns
exp
osed
on
mor
e th
an o
ne s
ide
n=0.
15n=
0.3
n=0.
5n=
0.7
stan
dard
fire
hydr
ocar
bon
fire
stan
dard
fire
hydr
ocar
bon
fire
stan
dard
fire
hydr
ocar
bon
fire
stan
dard
fire
hydr
ocar
bon
fire
300/
50:5
00/2
5
150/
2515
0/25
150/
2515
0/25
150/
25
Fire
resis
tanc
eλ
Num
eric
alca
lcula
tion
Num
eric
alca
lcul
atio
nN
umer
ical
calc
ulat
ion
150/
2520
0/25
200/
40:2
50/2
525
0/35
:350
/25
200/
25
①
① ① ①
①
500/
25
300/
50:5
00/2
550
0/35
:600
/35
200/
40:3
00/2
525
0/50
:350
/25
300/
50:6
00/3
540
0/50
:600
/35
550/
60:6
00/4
555
0/60
:600
/80
①
①
①① ①
① ①
①①① ① ① ① ①①
① ① ①①
* �
Req
uir
es a
wid
th >
600
mm

25
L. Wang/R. Caspeele/R. Van Coile/L. Taerwe · Extension of tabulated design parameters for rectangular columns exposed to fire taking into account second-order effects and various fire models
Structural Concrete (2015)
Tabl
e 7.
Min
imum
dim
ensi
ons
and
conc
rete
cov
ers
for
rein
forc
ed c
oncr
ete
colu
mns
with
rec
tang
ular
sec
tion
(IS
O 8
34);
mec
hani
cal r
einf
orce
men
t rat
io ω
=0.
1, h
igh
first
-ord
er m
omen
t: e
=0.
5bw
ith e
≤20
0 m
m
Num
eric
alca
lcul
atio
nEu
roco
de 2
Num
eric
alca
lcul
atio
nEu
roco
de 2
Num
eric
alca
lcul
atio
nEu
roco
de 2
Num
eric
alca
lcul
atio
nEu
roco
de 2
R30
3045
0/25
400/
40:5
50/2
555
0/40
:600
/25
550/
2540
500/
40:5
50/2
555
0/25
①55
0/35
:600
/30
5030
0/30
:400
/25
250/
30:3
00/2
560
0/25
550/
30:6
00/2
560
400/
50:4
50/2
530
0/40
:550
/25
①60
0/50
7050
0/40
:550
/25
400/
40:5
50/2
580
550/
40:6
00/2
555
0/25
R60
3030
0/30
:400
/25
300/
35:5
00/2
555
0/25
500/
50:5
50/2
5①
550/
50:6
00/4
040
400/
50:5
50/2
535
0/40
:550
/25
600/
2555
0/40
:600
/30
5055
0/25
450/
50:5
50/2
5①
550/
50:6
00/4
060
550/
40:6
00/2
555
0/30
①60
0/80
7060
0/60
550/
3580
①55
0/40
R90
3055
0/60
:600
/45
550/
45:6
00/4
0①
600/
8040
450/
50:6
00/4
550
0/60
:600
/30
①55
0/60
:600
/50
5055
0/60
:600
/45
550/
40①
600/
8060
550/
60:6
00/6
055
0/50
:600
/45
70①
550/
60:6
00/5
080
①60
0/70
R12
030
450/
50:6
00/2
555
0/40
:600
/30
600/
6055
0/50
4050
0/60
:600
/45
550/
50:6
00/4
5①
600/
7050
550/
60:6
00/6
055
0/55
:600
/50
6060
0/80
550/
60:6
00/5
070
①60
0/70
80
① ① ① ①①
① ① ① ① ① ① ① ① ① ① ① ① ① ① ① ① ① ① ① ①① ① ① ① ① ①
① ① ① ① ① ① ① ① ① ① ① ① ① ① ① ①
① ① ① ①
500/
2555
0/60① ① ① ①
550/
40① ① ① ① ① ① ① ① ① ① ①
400/
50:6
00/4
555
0/60
:600
/80
600/
80① ① ①
500/
50:6
00/8
055
0/60
:600
/80
250/
35:3
00/2
530
0/35
:400
/25
400/
35:5
00/2
550
0/50
:600
/35
550/
60:6
00/4
5
stan
dard
fire
hydr
ocar
bon
fire
stan
dard
fire
hydr
ocar
bon
fire
stan
dard
fire
hydr
ocar
bon
fire
stan
dard
fire
hydr
ocar
bon
fire
Num
eric
alca
lcul
atio
nN
umer
ical
calc
ulat
ion
Num
eric
alca
lcul
atio
nN
umer
ical
calcu
latio
n
350/
50:5
50/2
5
①
150/
2520
0/25
Fire
resis
tanc
eλ
① ①
Min
imum
dim
ensio
ns (m
m) /
Col
umn
wid
th b
min [m
m]/a
xis
dist
ance
a [m
m]
Col
umns
exp
osed
on
mor
e th
an o
ne s
ide
n=0.
15n=
0.3
n=0.
5n=
0.7
①①
① ①
① ① ①
①
350/
50:5
50/2
550
0/35
:600
/35
550/
60:6
00/4
5① ① ①
①
① ① ① ①①① ① ①
① ① ① ①① ①
① ①
① ① ①① ①
①
①① ① ① ① ①
①
① ① ① ①
① ① ①
① ①
① ① ①
① ①
① ① ① ① ① ①①①①
* �
Req
uir
es a
wid
th >
600
mm
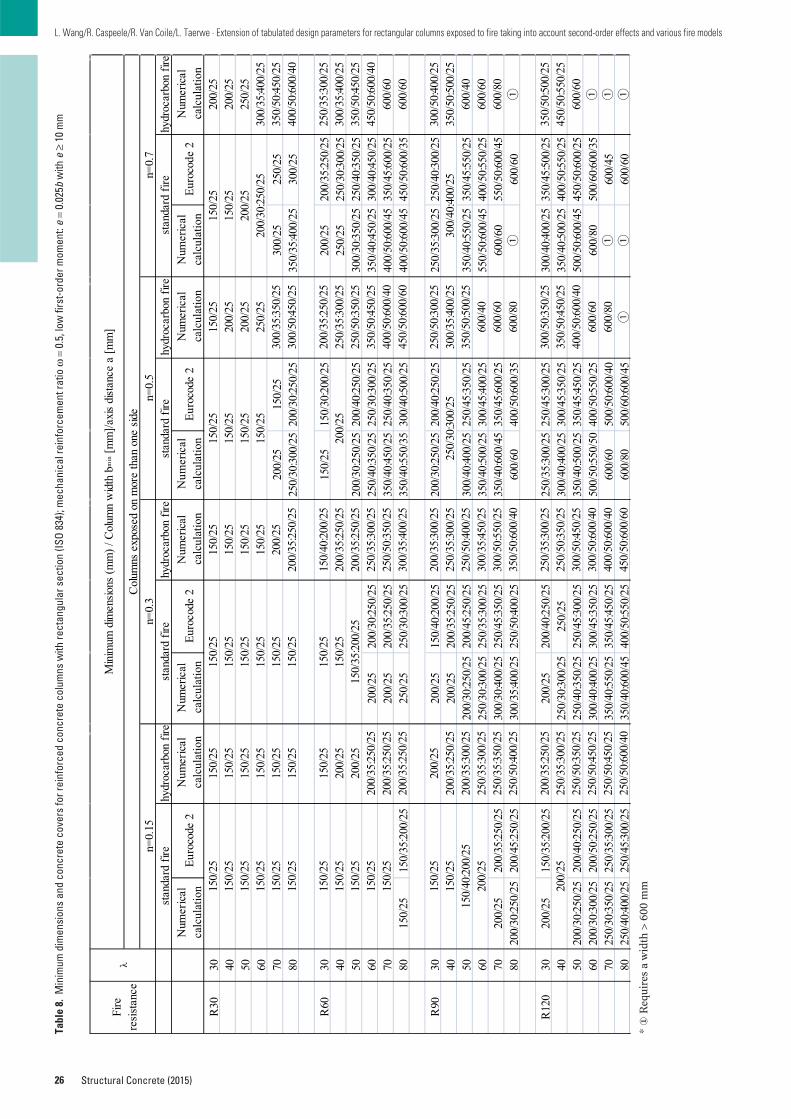
26
L. Wang/R. Caspeele/R. Van Coile/L. Taerwe · Extension of tabulated design parameters for rectangular columns exposed to fire taking into account second-order effects and various fire models
Structural Concrete (2015)
Tabl
e 8.
Min
imum
dim
ensi
ons
and
conc
rete
cov
ers
for
rein
forc
ed c
oncr
ete
colu
mns
with
rec
tang
ular
sec
tion
(IS
O 8
34);
mec
hani
cal r
einf
orce
men
t rat
io ω
=0.
5, lo
w fi
rst-
orde
r m
omen
t: e
=0.
025b
with
e≥
10 m
m
Num
eric
alca
lcul
atio
nEu
roco
de 2
Num
eric
alca
lcul
atio
nEu
roco
de 2
Num
eric
alca
lcul
atio
nEu
roco
de 2
Num
eric
alca
lcul
atio
nEu
roco
de 2
R30
30 40 50 60 7020
0/25
150/
2530
0/25
250/
2580
250/
30:3
00/2
520
0/30
:250
/25
350/
35:4
00/2
530
0/25
R60
3015
0/25
150/
30:2
00/2
520
0/25
200/
35:2
50/2
540
250/
2525
0/30
:300
/25
5020
0/30
:250
/25
200/
40:2
50/2
530
0/30
:350
/25
250/
40:3
50/2
560
200/
2520
0/30
:250
/25
250/
40:3
50/2
525
0/30
:300
/25
350/
40:4
50/2
530
0/40
:450
/25
7020
0/25
200/
35:2
50/2
535
0/40
:450
/25
250/
40:3
50/2
540
0/50
:600
/45
350/
45:6
00/2
580
150/
2515
0/35
:200
/25
250/
2525
0/30
:300
/25
350/
40:5
50/3
530
0/40
:500
/25
400/
50:6
00/4
545
0/50
:600
/35
R90
3020
0/25
150/
40:2
00/2
520
0/30
:250
/25
200/
40:2
50/2
525
0/35
:300
/25
250/
40:3
00/2
540
200/
2520
0/35
:250
/25
5020
0/30
:250
/25
200/
45:2
50/2
530
0/40
:400
/25
250/
45:3
50/2
535
0/40
:550
/25
350/
45:5
50/2
560
250/
30:3
00/2
525
0/35
:300
/25
350/
40:5
00/2
530
0/45
:400
/25
550/
50:6
00/4
540
0/50
:550
/25
7020
0/25
200/
35:2
50/2
530
0/30
:400
/25
250/
45:3
50/2
535
0/40
:600
/45
350/
45:6
00/2
560
0/60
550/
50:6
00/4
580
200/
30:2
50/2
520
0/45
:250
/25
300/
35:4
00/2
525
0/50
:400
/25
600/
6040
0/50
:600
/35
①60
0/60
R12
030
200/
2515
0/35
:200
/25
200/
2520
0/40
:250
/25
250/
35:3
00/2
525
0/45
:300
/25
300/
40:4
00/2
535
0/45
:500
/25
4025
0/30
:300
/25
250/
2530
0/40
:400
/25
300/
45:3
50/2
535
0/40
:500
/25
400/
50:5
50/2
550
200/
30:2
50/2
520
0/40
:250
/25
250/
40:3
50/2
525
0/45
:300
/25
350/
40:5
00/2
535
0/45
:450
/25
500/
50:6
00/4
545
0/50
:600
/25
6020
0/30
:300
/25
200/
50:2
50/2
530
0/40
:400
/25
300/
45:3
50/2
550
0/50
:550
/50
400/
50:5
50/2
560
0/80
500/
60:6
00/3
570
250/
30:3
50/2
525
0/35
:300
/25
350/
40:5
50/2
535
0/45
:450
/25
600/
6050
0/50
:600
/40
①60
0/45
8025
0/40
:400
/25
250/
45:3
00/2
535
0/40
:600
/45
400/
50:5
50/2
560
0/80
500/
60:6
00/4
5①
600/
60
①
350/
50:5
00/2
545
0/50
:550
/25
600/
60① ① ①
450/
50:6
00/4
060
0/60
600/
60
300/
50:4
00/2
535
0/50
:500
/25
600/
4060
0/60
600/
80
200/
2525
0/25
300/
35:4
00/2
535
0/50
:450
/25
400/
50:6
00/4
0
250/
35:3
00/2
530
0/35
:400
/25
350/
50:4
50/2
5
200/
35:2
50/2
525
0/35
:300
/25
250/
50:3
50/2
535
0/50
:450
/25
400/
50:6
00/4
045
0/50
:600
/60
250/
50:3
00/2
530
0/35
:400
/25
250/
50:4
00/2
530
0/35
:450
/25
300/
50:5
50/2
535
0/50
:600
/40
250/
35:3
00/2
525
0/50
:350
/25
300/
50:4
50/2
530
0/50
:600
/40
150/
40:2
00/2
520
0/35
:250
/25
200/
35:2
50/2
525
0/35
:300
/25
250/
50:3
50/2
530
0/35
:400
/25
200/
35:3
00/2
525
0/35
:300
/25
200/
35:2
50/2
5
200/
2520
0/35
:250
/25
200/
35:3
00/2
525
0/35
:300
/25
250/
35:3
50/2
525
0/50
:400
/25
Num
eric
alca
lcul
atio
nN
umer
ical
calc
ulat
ion
150/
2515
0/25
150/
2515
0/25
150/
2515
0/25
150/
2515
0/25
150/
2515
0/25
200/
2520
0/35
:250
/25
150/
2520
0/25
200/
2525
0/25
300/
35:3
50/2
530
0/50
:450
/25
200/
25
200/
25
150/
2515
0/25
150/
2515
0/25
200/
25
150/
2515
0/25
150/
25
150/
2515
0/25
200/
25
n=0.
15
Fire
resi
stan
ceλ
150/
25
200/
30:2
50/2
5
150/
40:2
00/2
5
Min
imum
dim
ensio
ns (m
m) /
Col
umn
wid
th b
min [m
m]/a
xis
dist
ance
a [m
m]
Col
umns
exp
osed
on
mor
e th
an o
ne s
ide
n=0.
3n=
0.5
n=0.
7st
anda
rd fi
rehy
droc
arbo
n fir
est
anda
rd fi
rehy
droc
arbo
n fir
est
anda
rd f
irehy
droc
arbo
n fir
est
anda
rd fi
rehy
droc
arbo
n fir
eN
umer
ical
calc
ulat
ion
Num
erica
lca
lcul
atio
n
150/
25
150/
2515
0/25
150/
2515
0/25
150/
2515
0/25
150/
2515
0/25
150/
2515
0/25
150/
2515
0/25
150/
2515
0/25
150/
2515
0/35
:200
/25
150/
2515
0/25
200/
2520
0/25
200/
35:2
50/2
520
0/35
:250
/25
200/
2520
0/35
:250
/25
250/
35:3
00/2
525
0/50
:350
/25
250/
50:4
50/2
525
0/50
:450
/25
250/
50:6
00/4
040
0/50
:600
/40
450/
50:6
00/6
0
300/
50:3
50/2
535
0/50
:450
/25
400/
50:6
00/4
060
0/60
250/
30:3
00/2
530
0/40
:400
/25
350/
50:5
00/2
560
0/40
600/
6060
0/80
600/
80①
* �
Req
uir
es a
wid
th >
600
mm
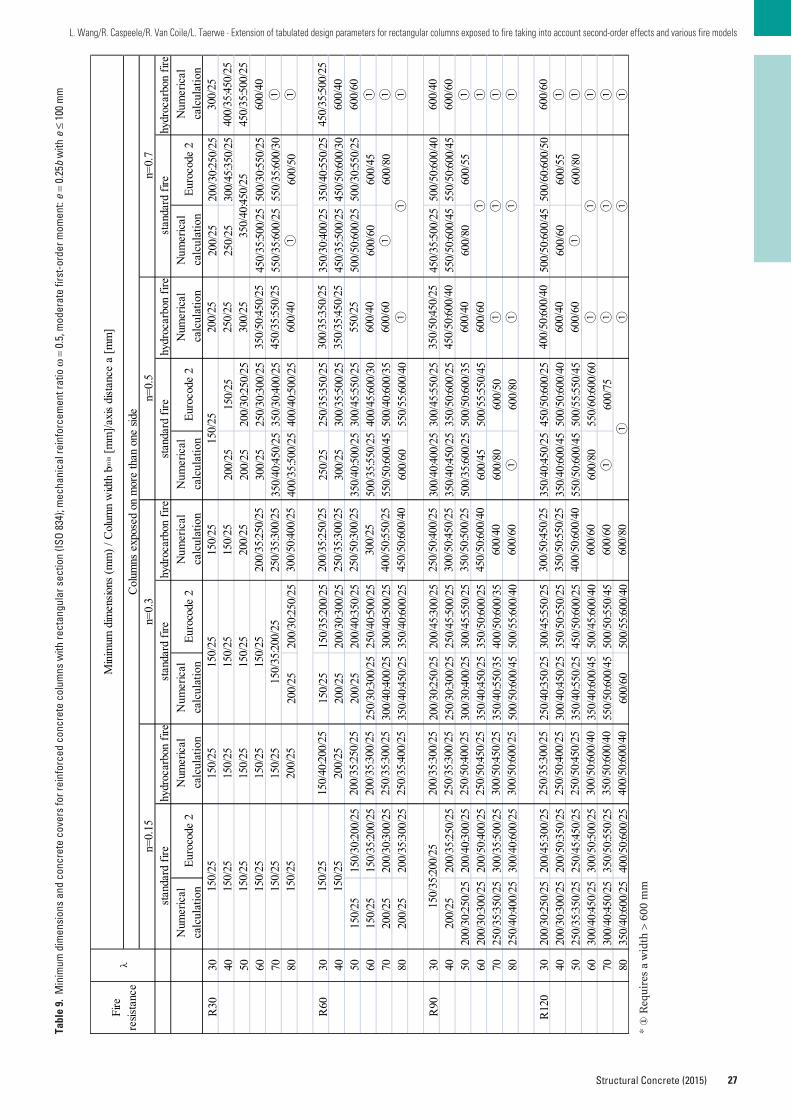
27
L. Wang/R. Caspeele/R. Van Coile/L. Taerwe · Extension of tabulated design parameters for rectangular columns exposed to fire taking into account second-order effects and various fire models
Structural Concrete (2015)
Tabl
e 9.
Min
imum
dim
ensi
ons
and
conc
rete
cov
ers
for
rein
forc
ed c
oncr
ete
colu
mns
with
rec
tang
ular
sec
tion
(IS
O 8
34);
mec
hani
cal r
einf
orce
men
t rat
io ω
=0.
5, m
oder
ate
first
-ord
er m
omen
t: e
=0.
25b
with
e≤
100
mm
Num
eric
alca
lcul
atio
nEu
roco
de 2
Num
eric
alca
lcul
atio
nEu
roco
de 2
Num
eric
alca
lcul
atio
nEu
roco
de 2
Num
eric
alca
lcul
atio
nEu
roco
de 2
R30
3020
0/25
200/
30:2
50/2
540
200/
2515
0/25
250/
2530
0/45
:350
/25
5020
0/25
200/
30:2
50/2
560
300/
2525
0/30
:300
/25
450/
35:5
00/2
550
0/30
:550
/25
7035
0/40
:450
/25
350/
30:4
00/2
555
0/35
:600
/25
550/
35:6
00/3
080
200/
2520
0/30
:250
/25
400/
35:5
00/2
540
0/40
:500
/25
①60
0/50
R60
3015
0/25
150/
35:2
00/2
525
0/25
250/
35:3
50/2
535
0/30
:400
/25
350/
40:5
50/2
540
200/
2520
0/30
:300
/25
300/
2530
0/35
:500
/25
450/
35:5
00/2
545
0/50
:600
/30
5015
0/25
150/
30:2
00/2
520
0/25
200/
40:3
50/2
535
0/40
:500
/25
300/
45:5
50/2
550
0/50
:600
/25
500/
30:5
50/2
560
150/
2515
0/35
:200
/25
250/
30:3
00/2
525
0/40
:500
/25
500/
35:5
50/2
540
0/45
:600
/30
600/
6060
0/45
7020
0/25
200/
30:3
00/2
530
0/40
:400
/25
300/
40:5
00/2
555
0/50
:600
/45
500/
40:6
00/3
5①
600/
8080
200/
2520
0/35
:300
/25
350/
40:4
50/2
535
0/40
:600
/25
600/
6055
0/55
:600
/40
R90
3020
0/30
:250
/25
200/
45:3
00/2
530
0/40
:400
/25
300/
45:5
50/2
545
0/35
:500
/25
500/
50:6
00/4
040
200/
2520
0/35
:250
/25
250/
30:3
00/2
525
0/45
:500
/25
350/
40:4
50/2
535
0/50
:600
/25
550/
50:6
00/4
555
0/50
:600
/45
5020
0/30
:250
/25
200/
40:3
00/2
530
0/30
:400
/25
300/
45:5
50/2
550
0/35
:600
/25
500/
50:6
00/3
560
0/80
600/
5560
200/
30:3
00/2
520
0/50
:400
/25
350/
40:4
50/2
535
0/50
:600
/25
600/
4550
0/55
:550
/45
7025
0/35
:350
/25
300/
35:5
00/2
535
0/40
:550
/35
400/
50:6
00/3
560
0/80
600/
5080
250/
40:4
00/2
530
0/40
:600
/25
500/
50:6
00/4
550
0/55
:600
/40
①60
0/80
R12
030
200/
30:2
50/2
520
0/45
:300
/25
250/
40:3
50/2
530
0/45
:550
/25
350/
40:4
50/2
545
0/50
:600
/25
500/
50:6
00/4
550
0/60
:600
/50
4020
0/30
:300
/25
200/
50:3
50/2
530
0/40
:450
/25
350/
50:5
50/2
535
0/40
:600
/45
500/
50:6
00/4
060
0/60
600/
5550
250/
35:3
50/2
525
0/45
:450
/25
350/
40:5
50/2
545
0/50
:600
/25
550/
50:6
00/4
550
0/55
:550
/45
①60
0/80
6030
0/40
:450
/25
300/
50:5
00/2
535
0/40
:600
/45
500/
45:6
00/4
060
0/80
550/
60:6
00/6
070
300/
40:4
50/2
535
0/50
:550
/25
550/
50:6
00/4
550
0/50
:550
/45
①60
0/75
8035
0/40
:600
/25
400/
50:6
00/2
560
0/60
500/
55:6
00/4
0
① ①
600/
60① ① ① ① ①
400/
50:6
00/4
060
0/40
600/
60① ① ①
300/
2540
0/35
:450
/25
450/
35:5
00/2
560
0/40① ①
450/
35:5
00/2
560
0/40
600/
60① ① ①
600/
4060
0/60① ①
300/
50:4
50/2
535
0/50
:550
/25
400/
50:6
00/4
060
0/60
600/
6060
0/80
200/
2525
0/25
300/
2535
0/50
:450
/25
450/
35:5
50/2
560
0/40
300/
35:3
50/2
535
0/35
:450
/25
550/
2560
0/40
600/
60①
350/
50:4
50/2
545
0/50
:600
/40
600/
4060
0/60
250/
35:3
00/2
525
0/50
:400
/25
250/
50:4
50/2
530
0/50
:600
/40
350/
50:6
00/4
040
0/50
:600
/40
150/
2515
0/25
200/
2520
0/35
:250
/25
250/
35:3
00/2
530
0/50
:400
/25
200/
35:2
50/2
525
0/35
:300
/25
250/
50:3
00/2
530
0/25
400/
50:5
50/2
545
0/50
:600
/40
250/
50:4
00/2
530
0/50
:450
/25
350/
50:5
00/2
545
0/50
:600
/40
200/
35:2
50/2
520
0/35
:300
/25
250/
35:3
00/2
525
0/35
:400
/25
200/
35:3
00/2
525
0/35
:300
/25
250/
50:4
00/2
525
0/50
:450
/25
stan
dard
fire
hydr
ocar
bon
fire
stan
dard
fire
hydr
ocar
bon
fire
stan
dard
fire
hydr
ocar
bon
fire
stan
dard
fire
hydr
ocar
bon
fire
Num
eric
alca
lcul
atio
nN
umer
ical
calc
ulat
ion
Num
eric
alca
lcul
atio
nN
umer
ical
calc
ulat
ion
Min
imum
dim
ensio
ns (m
m) /
Col
umn
wid
th b
min [m
m]/a
xis
dist
ance
a [m
m]
Fire
resis
tanc
eλ
150/
2515
0/25
150/
2515
0/25
150/
2515
0/25
150/
2515
0/25
150/
2515
0/25
150/
2515
0/25
150/
25
150/
2515
0/25
150/
2515
0/35
:200
/25
150/
2515
0/25
200/
25
150/
40:2
00/2
520
0/25
150/
35:2
00/2
5
①30
0/50
:450
/25
300/
50:6
00/2
560
0/40
600/
60① ①
①
① ① ①
350/
40:4
50/2
5
①① ①
Col
umns
exp
osed
on
mor
e th
an o
ne si
den=
0.15
n=0.
3n=
0.5
n=0.
7
* �
Req
uir
es a
wid
th >
600
mm
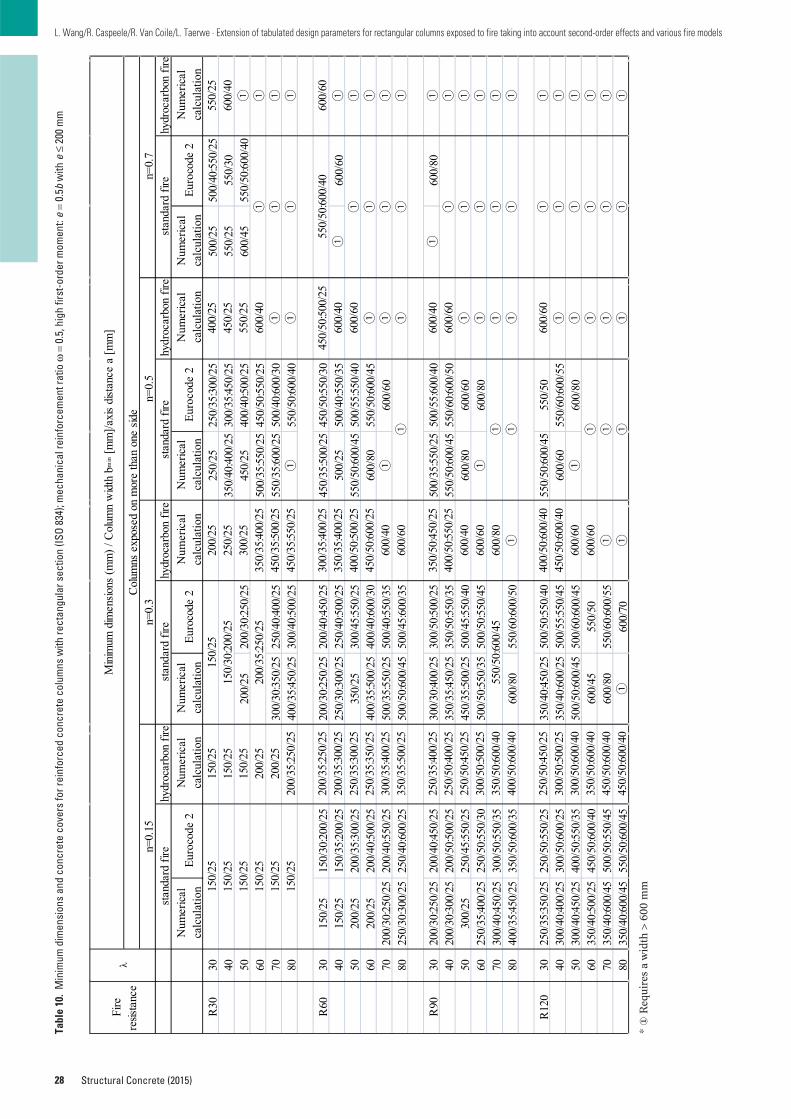
28
L. Wang/R. Caspeele/R. Van Coile/L. Taerwe · Extension of tabulated design parameters for rectangular columns exposed to fire taking into account second-order effects and various fire models
Structural Concrete (2015)
Tabl
e 10
.M
inim
um d
imen
sion
s an
d co
ncre
te c
over
s fo
r re
info
rced
con
cret
e co
lum
ns w
ith r
ecta
ngul
ar s
ectio
n (I
SO
834
); m
echa
nica
l rei
nfor
cem
ent r
atio
ω=
0.5,
hig
h fir
st-o
rder
mom
ent:
e=
0.5b
with
e≤
200
mm
Num
eric
alca
lcul
atio
nEu
roco
de 2
Num
eric
alca
lcul
atio
nEu
roco
de 2
Num
eric
alca
lcul
atio
nEu
roco
de 2
Num
eric
alca
lcul
atio
nEu
roco
de 2
R30
3025
0/25
250/
35:3
00/2
550
0/25
500/
40:5
50/2
540
350/
40:4
00/2
530
0/35
:450
/25
550/
2555
0/30
5020
0/25
200/
30:2
50/2
545
0/25
400/
40:5
00/2
560
0/45
550/
50:6
00/4
060
500/
35:5
50/2
545
0/50
:550
/25
7030
0/30
:350
/25
250/
40:4
00/2
555
0/35
:600
/25
500/
40:6
00/3
080
400/
35:4
50/2
530
0/40
:500
/25
①55
0/50
:600
/40
R60
3015
0/25
150/
30:2
00/2
520
0/30
:250
/25
200/
40:4
50/2
545
0/35
:500
/25
450/
50:5
50/3
040
150/
2515
0/35
:200
/25
250/
30:3
00/2
525
0/40
:500
/25
500/
2550
0/40
:550
/35
①60
0/60
5020
0/25
200/
35:3
00/2
535
0/25
300/
45:5
50/2
555
0/50
:600
/45
500/
55:5
50/4
060
200/
2520
0/40
:500
/25
400/
35:5
00/2
540
0/40
:600
/30
600/
8055
0/50
:600
/45
7020
0/30
:250
/25
200/
40:5
50/2
550
0/35
:550
/25
500/
40:5
50/3
5①
600/
6080
250/
30:3
00/2
525
0/40
:600
/25
500/
50:6
00/4
550
0/45
:600
/35
R90
3020
0/30
:250
/25
200/
40:4
50/2
530
0/30
:400
/25
300/
50:5
00/2
550
0/35
:550
/25
500/
55:6
00/4
0①
600/
8040
200/
30:3
00/2
520
0/50
:500
/25
350/
35:4
50/2
535
0/50
:550
/35
550/
50:6
00/4
555
0/60
:600
/50
5030
0/25
250/
45:5
50/2
545
0/35
:500
/25
500/
45:5
50/4
060
0/80
600/
6060
250/
35:4
00/2
525
0/50
:550
/30
500/
50:5
50/3
550
0/50
:550
/45
①60
0/80
7030
0/40
:450
/25
300/
50:5
50/3
580
400/
35:4
50/2
535
0/50
:600
/35
600/
8055
0/60
:600
/50
R12
030
250/
35:3
50/2
525
0/50
:550
/25
350/
40:4
50/2
550
0/50
:550
/40
550/
50:6
00/4
555
0/50
4030
0/40
:400
/25
300/
50:6
00/2
535
0/40
:600
/25
500/
55:5
50/4
560
0/60
550/
60:6
00/5
550
300/
40:4
50/2
540
0/50
:550
/35
500/
50:6
00/4
550
0/60
:600
/45
①60
0/80
6035
0/40
:500
/25
450/
50:6
00/4
060
0/45
550/
5070
350/
40:6
00/4
550
0/50
:550
/45
600/
8055
0/60
:600
/55
8035
0/40
:600
/45
550/
50:6
00/4
5①
600/
70
① ① ① ① ① ① ① ①① ① ① ① ① ① ① ①
550/
2560
0/40① ① ① ①
600/
60①
400/
50:6
00/4
045
0/50
:600
/40
600/
6060
0/60① ①
400/
2545
0/25
550/
2560
0/40① ①
450/
50:5
00/2
560
0/40
600/
60① ① ①
600/
4060
0/60① ①
250/
50:4
50/2
530
0/50
:500
/25
300/
50:6
00/4
035
0/50
:600
/40
450/
50:6
00/4
045
0/50
:600
/40
200/
2525
0/25
300/
2535
0/35
:400
/25
450/
35:5
00/2
545
0/35
:550
/25
300/
35:4
00/2
535
0/35
:400
/25
400/
50:5
00/2
545
0/50
:600
/25
600/
4060
0/60
350/
50:4
50/2
540
0/50
:550
/25
600/
4060
0/60
250/
35:3
00/2
525
0/35
:350
/25
300/
35:4
00/2
535
0/35
:500
/25
250/
35:4
00/2
525
0/50
:400
/25
250/
50:4
50/2
530
0/50
:500
/25
150/
2515
0/25
150/
2520
0/25
200/
2520
0/35
:250
/25
200/
35:2
50/2
520
0/35
:300
/25
stan
dard
fire
hydr
ocar
bon
fire
stan
dard
fire
hydr
ocar
bon
fire
stan
dard
fire
hydr
ocar
bon
fire
Num
eric
alca
lcul
atio
nN
umer
ical
calc
ulat
ion
Num
eric
alca
lcul
atio
nN
umer
ical
calc
ulat
ion
150/
2515
0/25
150/
2515
0/30
:200
/25
Fire
resis
tanc
eλ
Min
imum
dim
ensio
ns (m
m) /
Col
umn
wid
th b
min [m
m]/a
xis
dist
ance
a [m
m]
Col
umns
exp
osed
on
mor
e th
an o
ne s
ide
n=0.
15n=
0.3
n=0.
5n=
0.7
stan
dard
fire
hydr
ocar
bon
fire
150/
25
150/
2515
0/25
200/
35:2
50/2
515
0/25
①55
0/50
:600
/45
350/
50:6
00/4
040
0/50
:600
/40
600/
80①
① ①
①①① ① ①
①
① ① ①
①
①
①
① ① ① ①
550/
50:6
00/4
0
600/
60① ① ① ① ①
① ①
① ① ① ① ①
* �
Req
uir
es a
wid
th >
600
mm
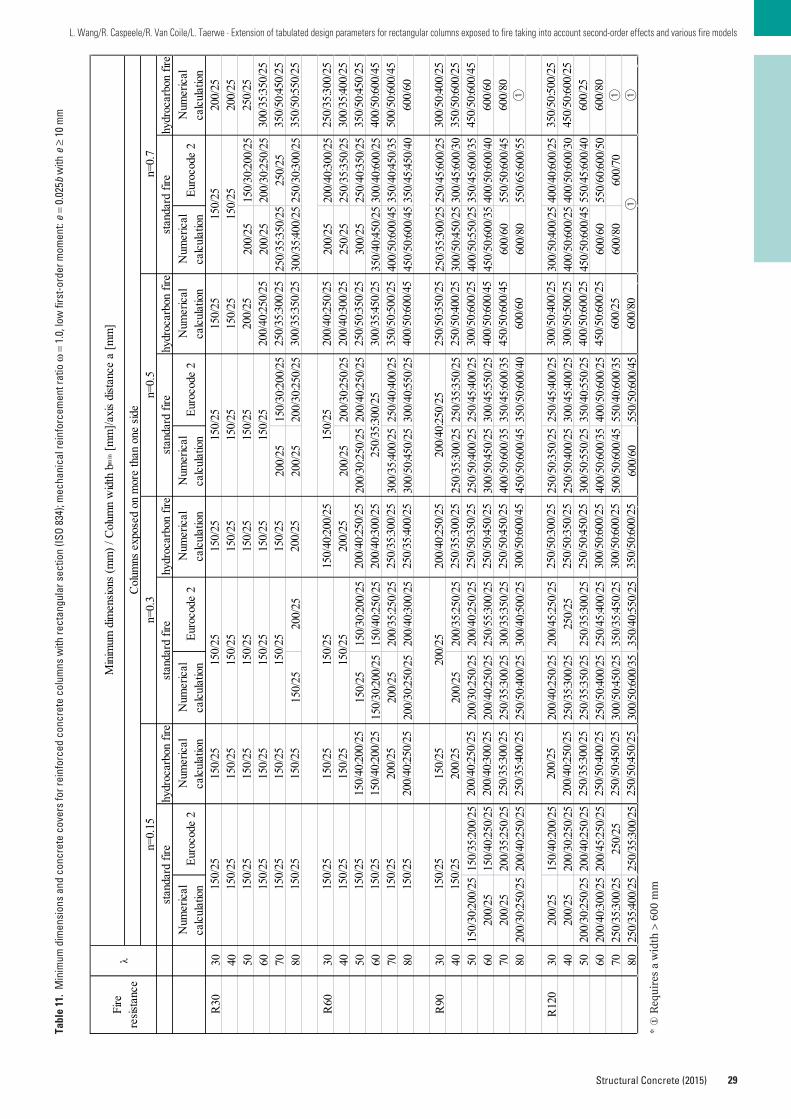
29
L. Wang/R. Caspeele/R. Van Coile/L. Taerwe · Extension of tabulated design parameters for rectangular columns exposed to fire taking into account second-order effects and various fire models
Structural Concrete (2015)
Tabl
e 11
.M
inim
um d
imen
sion
s an
d co
ncre
te c
over
s fo
r re
info
rced
con
cret
e co
lum
ns w
ith r
ecta
ngul
ar s
ectio
n (I
SO
834
); m
echa
nica
l rei
nfor
cem
ent r
atio
ω=
1.0,
low
firs
t-or
der
mom
ent:
e=
0.02
5bw
ith e
≥10
mm
Num
eric
alca
lcul
atio
nEu
roco
de 2
Num
eric
alca
lcul
atio
nEu
roco
de 2
Num
eric
alca
lcul
atio
nEu
roco
de 2
Num
eric
alca
lcul
atio
nEu
roco
de 2
R30
30 40 5020
0/25
150/
30:2
00/2
560
200/
2520
0/30
:250
/25
7020
0/25
150/
30:2
00/2
525
0/35
:350
/25
250/
2580
150/
2520
0/25
200/
2520
0/30
:250
/25
300/
35:4
00/2
525
0/30
:300
/25
R60
3020
0/25
200/
40:3
00/2
540
200/
2520
0/30
:250
/25
250/
2525
0/35
:350
/25
5015
0/25
150/
30:2
00/2
520
0/30
:250
/25
200/
40:2
50/2
530
0/25
250/
40:3
50/2
560
150/
30:2
00/2
515
0/40
:250
/25
350/
40:4
50/2
530
0/40
:600
/25
7020
0/25
200/
35:2
50/2
530
0/35
:400
/25
250/
40:4
00/2
540
0/50
:600
/45
350/
40:4
50/3
580
200/
30:2
50/2
520
0/40
:300
/25
300/
50:4
50/2
530
0/40
:550
/25
450/
50:6
00/4
535
0/45
:450
/40
R90
3025
0/35
:300
/25
250/
45:6
00/2
540
200/
2520
0/35
:250
/25
250/
35:3
00/2
525
0/35
:350
/25
300/
50:4
50/2
530
0/45
:600
/30
5015
0/30
:200
/25
150/
35:2
00/2
520
0/30
:250
/25
200/
40:2
50/2
525
0/50
:400
/25
250/
45:4
00/2
540
0/50
:550
/25
350/
45:6
00/3
560
200/
2515
0/40
:250
/25
200/
40:2
50/2
525
0/55
:300
/25
300/
50:4
50/2
530
0/45
:550
/25
450/
50:6
00/3
540
0/50
:600
/40
7020
0/25
200/
35:2
50/2
525
0/35
:300
/25
300/
35:3
50/2
540
0/50
:600
/35
350/
45:6
00/3
560
0/60
550/
50:6
00/4
580
200/
30:2
50/2
520
0/40
:250
/25
250/
50:4
00/2
530
0/40
:500
/25
450/
50:6
00/4
535
0/50
:600
/40
600/
8055
0/65
:600
/55
R12
030
200/
2515
0/40
:200
/25
200/
40:2
50/2
520
0/45
:250
/25
250/
50:3
50/2
525
0/45
:400
/25
300/
50:4
00/2
540
0/40
:600
/25
4020
0/25
200/
30:2
50/2
525
0/35
:300
/25
250/
2525
0/50
:400
/25
300/
45:4
00/2
540
0/50
:600
/25
400/
50:6
00/3
050
200/
30:2
50/2
520
0/40
:250
/25
250/
35:3
50/2
525
0/35
:300
/25
300/
50:5
50/2
535
0/40
:550
/25
450/
50:6
00/4
555
0/45
:600
/40
6020
0/40
:300
/25
200/
45:2
50/2
525
0/50
:400
/25
250/
45:4
00/2
540
0/50
:600
/35
400/
50:6
00/2
560
0/60
550/
60:6
00/5
070
250/
35:3
00/2
525
0/25
300/
50:4
50/2
535
0/35
:450
/25
500/
50:6
00/4
555
0/40
:600
/35
600/
8060
0/70
8025
0/35
:400
/25
250/
35:3
00/2
530
0/50
:600
/35
350/
40:5
50/2
560
0/60
550/
50:6
00/4
5
600/
80①
350/
50:5
00/2
545
0/50
:600
/25
600/
2560
0/80① ①
350/
50:4
50/2
540
0/50
:600
/45
500/
50:6
00/4
560
0/60
300/
50:4
00/2
535
0/50
:600
/25
450/
50:6
00/4
560
0/60
200/
2520
0/25
250/
2530
0/35
:350
/25
350/
50:4
50/2
535
0/50
:550
/25
250/
35:3
00/2
530
0/35
:400
/25
250/
50:4
50/2
530
0/50
:600
/25
300/
50:6
00/2
535
0/50
:600
/25
150/
2515
0/25
200/
2520
0/40
:250
/25
250/
35:3
00/2
530
0/35
:350
/25
200/
40:2
50/2
520
0/40
:300
/25
250/
50:3
50/2
530
0/35
:450
/25
350/
50:5
00/2
540
0/50
:600
/45
250/
50:3
50/2
525
0/50
:400
/25
300/
50:6
00/2
540
0/50
:600
/45
450/
50:6
00/4
560
0/60
250/
50:4
50/2
5
150/
2515
0/25
150/
2515
0/25
150/
2520
0/25
150/
40:2
00/2
520
0/25
200/
40:2
50/2
520
0/40
:300
/25
250/
35:3
00/2
525
0/35
:400
/25
200/
40:2
50/2
525
0/35
:300
/25
250/
50:3
50/2
525
0/50
:450
/25
250/
50:4
50/2
530
0/50
:600
/45
250/
50:3
00/2
525
0/50
:350
/25
200/
40:3
00/2
525
0/35
:300
/25
250/
35:4
00/2
5
200/
2520
0/40
:250
/25
250/
35:3
00/2
525
0/50
:400
/25
250/
50:4
50/2
5
Num
eric
alca
lcul
atio
nN
umer
ical
calc
ulat
ion
Num
eric
alca
lcul
atio
nN
umer
ical
calc
ulat
ion
150/
2515
0/25
150/
2515
0/25
150/
2515
0/25
150/
2515
0/25
150/
40:2
00/2
515
0/40
:200
/25
200/
2520
0/40
:250
/25
Min
imum
dim
ensio
ns (m
m) /
Col
umn
wid
th b
min [m
m]/a
xis
dist
ance
a [m
m]
Col
umns
exp
osed
on
mor
e th
an o
ne s
ide
n=0.
15n=
0.3
n=0.
5n=
0.7
stan
dard
fire
hydr
ocar
bon
fire
stan
dard
fire
hydr
ocar
bon
fire
stan
dard
fire
hydr
ocar
bon
fire
stan
dard
fire
hydr
ocar
bon
fire
200/
40:2
50/2
5
①
300/
50:4
00/2
530
0/50
:500
/25
400/
50:6
00/2
545
0/50
:600
/25
600/
2560
0/80
150/
2515
0/25
150/
2520
0/25
200/
40:2
50/2
5
150/
25
150/
25
150/
2515
0/25
150/
2515
0/25
150/
25
150/
25
250/
35:3
00/2
5
Fire
resis
tanc
eλ
150/
25
150/
2515
0/25
150/
2515
0/25
150/
25
150/
2515
0/25
150/
2515
0/25
150/
2515
0/25
150/
2515
0/25
150/
25
150/
2515
0/25
200/
25
150/
25
* �
Req
uir
es a
wid
th >
600
mm
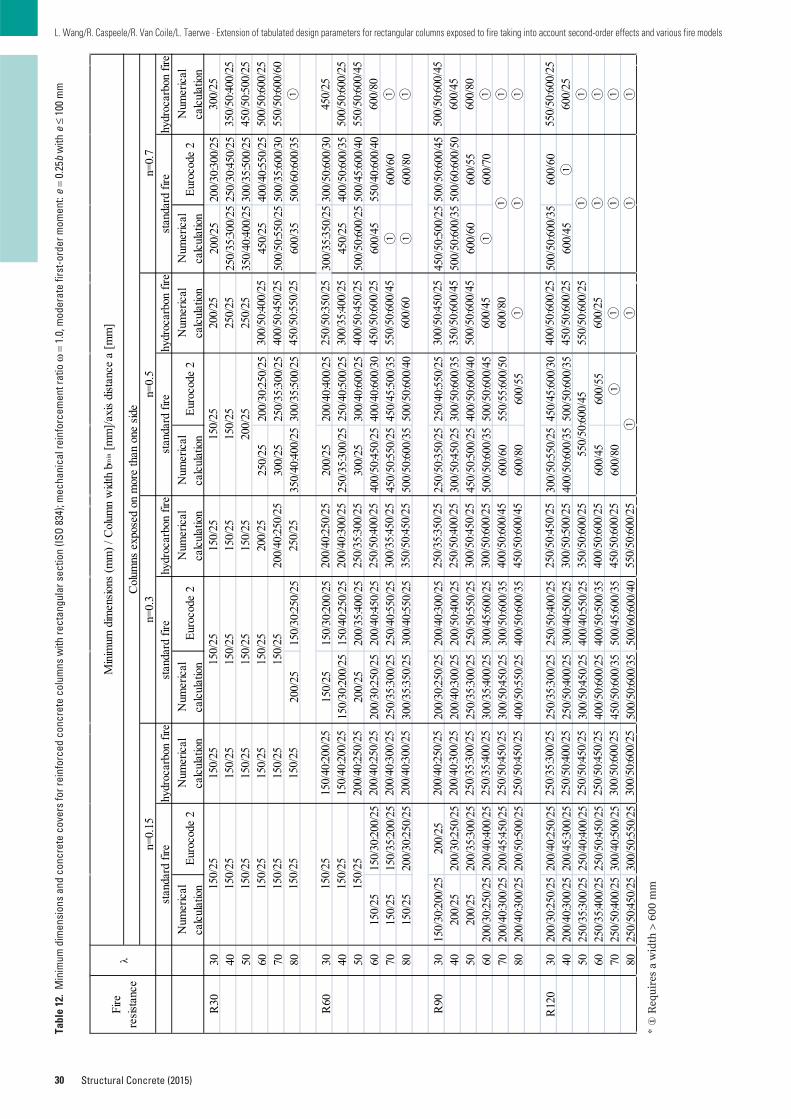
30
L. Wang/R. Caspeele/R. Van Coile/L. Taerwe · Extension of tabulated design parameters for rectangular columns exposed to fire taking into account second-order effects and various fire models
Structural Concrete (2015)
Tabl
e 12
.M
inim
um d
imen
sion
s an
d co
ncre
te c
over
s fo
r re
info
rced
con
cret
e co
lum
ns w
ith r
ecta
ngul
ar s
ectio
n (I
SO
834
); m
echa
nica
l rei
nfor
cem
ent r
atio
ω=
1.0,
mod
erat
e fir
st-o
rder
mom
ent:
e=
0.25
bw
ith e
≤10
0 m
m
Num
eric
alca
lcul
atio
nEu
roco
de 2
Num
eric
alca
lcul
atio
nEu
roco
de 2
Num
eric
alca
lcul
atio
nEu
roco
de 2
Num
eric
alca
lcul
atio
nEu
roco
de 2
R30
3020
0/25
200/
30:3
00/2
540
250/
35:3
00/2
525
0/30
:450
/25
5035
0/40
:400
/25
300/
35:5
00/2
560
250/
2520
0/30
:250
/25
450/
2540
0/40
:550
/25
7030
0/25
250/
35:3
00/2
550
0/50
:550
/25
500/
35:6
00/3
080
200/
2515
0/30
:250
/25
350/
40:4
00/2
530
0/35
:500
/25
600/
3550
0/60
:600
/35
R60
3015
0/25
150/
30:2
00/2
520
0/25
200/
40:4
00/2
530
0/35
:350
/25
300/
50:6
00/3
040
150/
30:2
00/2
515
0/40
:250
/25
250/
35:3
00/2
525
0/40
:500
/25
450/
2540
0/50
:600
/35
5020
0/25
200/
35:4
00/2
530
0/25
300/
40:6
00/2
550
0/50
:600
/25
500/
45:6
00/4
060
150/
2515
0/30
:200
/25
200/
30:2
50/2
520
0/40
:450
/25
400/
50:4
50/2
540
0/40
:600
/30
600/
4555
0/40
:600
/40
7015
0/25
150/
35:2
00/2
525
0/35
:300
/25
250/
40:5
50/2
545
0/50
:550
/25
450/
45:5
00/3
5①
600/
6080
150/
2520
0/30
:250
/25
300/
35:3
50/2
530
0/40
:550
/25
500/
50:6
00/3
550
0/50
:600
/40
①60
0/80
R90
3015
0/30
:200
/25
200/
2520
0/30
:250
/25
200/
40:3
00/2
525
0/50
:350
/25
250/
40:5
50/2
545
0/50
:500
/25
500/
50:6
00/4
540
200/
2520
0/30
:250
/25
200/
40:3
00/2
520
0/50
:400
/25
300/
50:4
50/2
530
0/50
:600
/35
500/
50:6
00/3
550
0/60
:600
/50
5020
0/25
200/
35:3
00/2
525
0/35
:300
/25
250/
50:5
50/2
545
0/50
:500
/25
400/
50:6
00/4
060
0/60
600/
5560
200/
30:2
50/2
520
0/40
:400
/25
300/
35:4
00/2
530
0/45
:600
/25
500/
50:6
00/3
550
0/50
:600
/45
①60
0/70
7020
0/40
:300
/25
200/
45:4
50/2
530
0/50
:450
/25
300/
50:6
00/3
560
0/60
550/
55:6
00/5
080
200/
40:3
00/2
520
0/50
:500
/25
400/
50:5
50/2
540
0/50
:600
/35
600/
8060
0/55
R12
030
200/
30:2
50/2
520
0/40
:250
/25
250/
35:3
00/2
525
0/50
:400
/25
300/
50:5
50/2
545
0/45
:600
/30
500/
50:6
00/3
560
0/60
4020
0/40
:300
/25
200/
45:3
00/2
525
0/50
:400
/25
300/
40:5
00/2
540
0/50
:600
/35
500/
50:6
00/3
560
0/45
①50
250/
35:3
00/2
525
0/40
:400
/25
300/
50:4
50/2
540
0/40
:550
/25
6025
0/35
:400
/25
250/
50:4
50/2
540
0/50
:600
/25
400/
50:5
00/3
560
0/45
600/
5570
250/
50:4
00/2
530
0/40
:500
/25
450/
50:6
00/3
550
0/45
:600
/35
600/
80①
8025
0/50
:450
/25
300/
50:5
50/2
550
0/50
:600
/35
500/
60:6
00/4
0
600/
25① ① ① ①
① ①
300/
2535
0/50
:400
/25
450/
50:5
00/2
550
0/50
:600
/25
550/
50:6
00/6
0①
450/
2550
0/50
:600
/25
550/
50:6
00/4
560
0/80① ①
500/
50:6
00/4
560
0/45
600/
80① ① ①
550/
50:6
00/2
5
550/
50:6
00/2
5
200/
2525
0/25
250/
2530
0/50
:400
/25
400/
50:4
50/2
545
0/50
:550
/25
250/
50:3
50/2
530
0/35
:400
/25
400/
50:4
50/2
545
0/50
:600
/25
550/
50:6
00/4
560
0/60
300/
50:4
50/2
535
0/50
:600
/45
500/
50:6
00/4
560
0/45
600/
80①
400/
50:6
00/2
545
0/50
:600
/25
300/
50:6
00/2
540
0/50
:600
/45
450/
50:6
00/4
5
250/
50:4
50/2
530
0/50
:500
/25
350/
50:6
00/2
540
0/50
:600
/25
450/
50:6
00/2
5
250/
35:3
00/2
525
0/50
:400
/25
250/
50:4
50/2
525
0/50
:450
/25
300/
50:6
00/2
530
0/50
:600
/25
150/
2515
0/25
150/
2520
0/25
200/
40:2
50/2
525
0/25
200/
40:2
50/2
520
0/40
:300
/25
250/
35:3
00/2
525
0/50
:400
/25
300/
35:4
50/2
535
0/50
:450
/25
250/
35:3
50/2
525
0/50
:400
/25
300/
50:4
50/2
5
hydr
ocar
bon
fire
Num
eric
alca
lcul
atio
nN
umer
ical
calc
ulat
ion
Num
eric
alca
lcul
atio
nN
umer
ical
calc
ulat
ion
150/
2515
0/25
150/
2515
0/25
150/
2515
0/25
150/
40:2
00/2
515
0/40
:200
/25
200/
40:2
50/2
520
0/40
:250
/25
200/
40:3
00/2
520
0/40
:300
/25
Min
imum
dim
ensio
ns (m
m) /
Col
umn
wid
th b
min [m
m]/a
xis
dist
ance
a [m
m]
Col
umns
exp
osed
on
mor
e th
an o
ne s
ide
n=0.
15n=
0.3
n=0.
5n=
0.7
①
①
① ①55
0/50
:600
/45
150/
25
stan
dard
fire
hydr
ocar
bon
fire
stan
dard
fire
550/
50:6
00/2
560
0/25
150/
25
stan
dard
fire
hydr
ocar
bon
fire
stan
dard
fire
Fire
resis
tanc
eλ
① ①
hydr
ocar
bon
fire
200/
40:2
50/2
520
0/40
:300
/25
250/
35:3
00/2
525
0/35
:400
/25
250/
50:4
50/2
525
0/50
:450
/25
150/
25
150/
25
150/
2515
0/25
①
200/
25
150/
25
150/
25
150/
2515
0/25
150/
2515
0/25
150/
2515
0/25
150/
2515
0/25
* �
Req
uir
es a
wid
th >
600
mm
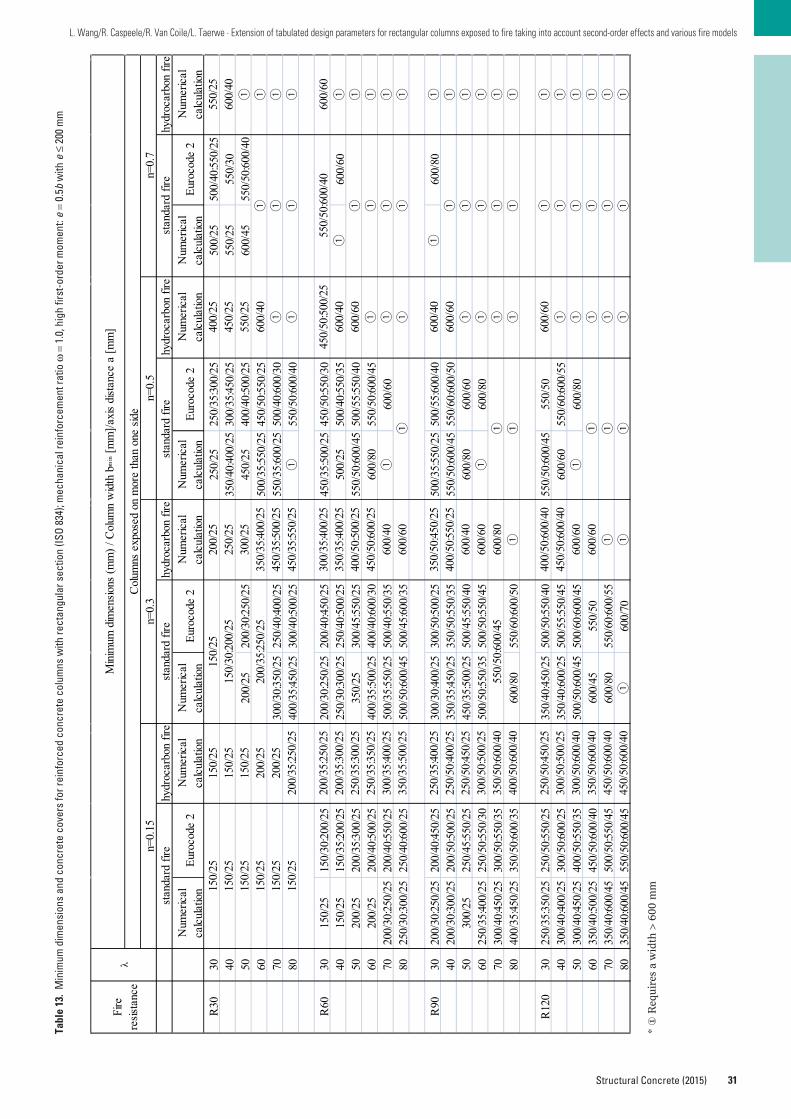
31
L. Wang/R. Caspeele/R. Van Coile/L. Taerwe · Extension of tabulated design parameters for rectangular columns exposed to fire taking into account second-order effects and various fire models
Structural Concrete (2015)
Tabl
e 13
.M
inim
um d
imen
sion
s an
d co
ncre
te c
over
s fo
r re
info
rced
con
cret
e co
lum
ns w
ith r
ecta
ngul
ar s
ectio
n (I
SO
834
); m
echa
nica
l rei
nfor
cem
ent r
atio
ω=
1.0,
hig
h fir
st-o
rder
mom
ent:
e=
0.5b
with
e≤
200
mm
Num
eric
alca
lcul
atio
nEu
roco
de 2
Num
eric
alca
lcul
atio
nEu
roco
de 2
Num
eric
alca
lcul
atio
nEu
roco
de 2
Num
eric
alca
lcul
atio
nEu
roco
de 2
R30
3025
0/25
250/
35:3
00/2
550
0/25
500/
40:5
50/2
540
350/
40:4
00/2
530
0/35
:450
/25
550/
2555
0/30
5020
0/25
200/
30:2
50/2
545
0/25
400/
40:5
00/2
560
0/45
550/
50:6
00/4
060
500/
35:5
50/2
545
0/50
:550
/25
7030
0/30
:350
/25
250/
40:4
00/2
555
0/35
:600
/25
500/
40:6
00/3
080
400/
35:4
50/2
530
0/40
:500
/25
①55
0/50
:600
/40
R60
3015
0/25
150/
30:2
00/2
520
0/30
:250
/25
200/
40:4
50/2
545
0/35
:500
/25
450/
50:5
50/3
040
150/
2515
0/35
:200
/25
250/
30:3
00/2
525
0/40
:500
/25
500/
2550
0/40
:550
/35
①60
0/60
5020
0/25
200/
35:3
00/2
535
0/25
300/
45:5
50/2
555
0/50
:600
/45
500/
55:5
50/4
060
200/
2520
0/40
:500
/25
400/
35:5
00/2
540
0/40
:600
/30
600/
8055
0/50
:600
/45
7020
0/30
:250
/25
200/
40:5
50/2
550
0/35
:550
/25
500/
40:5
50/3
5①
600/
6080
250/
30:3
00/2
525
0/40
:600
/25
500/
50:6
00/4
550
0/45
:600
/35
R90
3020
0/30
:250
/25
200/
40:4
50/2
530
0/30
:400
/25
300/
50:5
00/2
550
0/35
:550
/25
500/
55:6
00/4
0①
600/
8040
200/
30:3
00/2
520
0/50
:500
/25
350/
35:4
50/2
535
0/50
:550
/35
550/
50:6
00/4
555
0/60
:600
/50
5030
0/25
250/
45:5
50/2
545
0/35
:500
/25
500/
45:5
50/4
060
0/80
600/
6060
250/
35:4
00/2
525
0/50
:550
/30
500/
50:5
50/3
550
0/50
:550
/45
①60
0/80
7030
0/40
:450
/25
300/
50:5
50/3
580
400/
35:4
50/2
535
0/50
:600
/35
600/
8055
0/60
:600
/50
R12
030
250/
35:3
50/2
525
0/50
:550
/25
350/
40:4
50/2
550
0/50
:550
/40
550/
50:6
00/4
555
0/50
4030
0/40
:400
/25
300/
50:6
00/2
535
0/40
:600
/25
500/
55:5
50/4
560
0/60
550/
60:6
00/5
550
300/
40:4
50/2
540
0/50
:550
/35
500/
50:6
00/4
550
0/60
:600
/45
①60
0/80
6035
0/40
:500
/25
450/
50:6
00/4
060
0/45
550/
5070
350/
40:6
00/4
550
0/50
:550
/45
600/
8055
0/60
:600
/55
8035
0/40
:600
/45
550/
50:6
00/4
5①
600/
70
① ① ① ① ① ① ① ①① ① ① ① ① ① ① ①
550/
2560
0/40① ① ① ①
600/
60①
400/
50:6
00/4
045
0/50
:600
/40
600/
6060
0/60① ①
400/
2545
0/25
550/
2560
0/40① ①
450/
50:5
00/2
560
0/40
600/
60① ① ①
600/
4060
0/60① ①
250/
50:4
50/2
530
0/50
:500
/25
300/
50:6
00/4
035
0/50
:600
/40
450/
50:6
00/4
045
0/50
:600
/40
200/
2525
0/25
300/
2535
0/35
:400
/25
450/
35:5
00/2
545
0/35
:550
/25
300/
35:4
00/2
535
0/35
:400
/25
400/
50:5
00/2
545
0/50
:600
/25
600/
4060
0/60
350/
50:4
50/2
540
0/50
:550
/25
600/
4060
0/60
250/
35:3
00/2
525
0/35
:350
/25
300/
35:4
00/2
535
0/35
:500
/25
250/
35:4
00/2
525
0/50
:400
/25
250/
50:4
50/2
530
0/50
:500
/25
150/
2515
0/25
150/
2520
0/25
200/
2520
0/35
:250
/25
200/
35:2
50/2
520
0/35
:300
/25
stan
dard
fire
hydr
ocar
bon
fire
stan
dard
fire
hydr
ocar
bon
fire
stan
dard
fire
hydr
ocar
bon
fire
Num
eric
alca
lcul
atio
nN
umer
ical
calc
ulat
ion
Num
eric
alca
lcul
atio
nN
umer
ical
calc
ulat
ion
150/
2515
0/25
150/
2515
0/30
:200
/25
Fire
resis
tanc
eλ
Min
imum
dim
ensio
ns (m
m) /
Col
umn
wid
th b
min [m
m]/a
xis
dist
ance
a [m
m]
Col
umns
exp
osed
on
mor
e th
an o
ne s
ide
n=0.
15n=
0.3
n=0.
5n=
0.7
stan
dard
fire
hydr
ocar
bon
fire
150/
25
150/
2515
0/25
200/
35:2
50/2
515
0/25
①55
0/50
:600
/45
350/
50:6
00/4
040
0/50
:600
/40
600/
80①
① ①
①①① ① ①
①
① ① ①
①
①
①
① ① ① ①
550/
50:6
00/4
0
600/
60① ① ① ① ①
① ①
① ① ① ① ①
* �
Req
uir
es a
wid
th >
600
mm
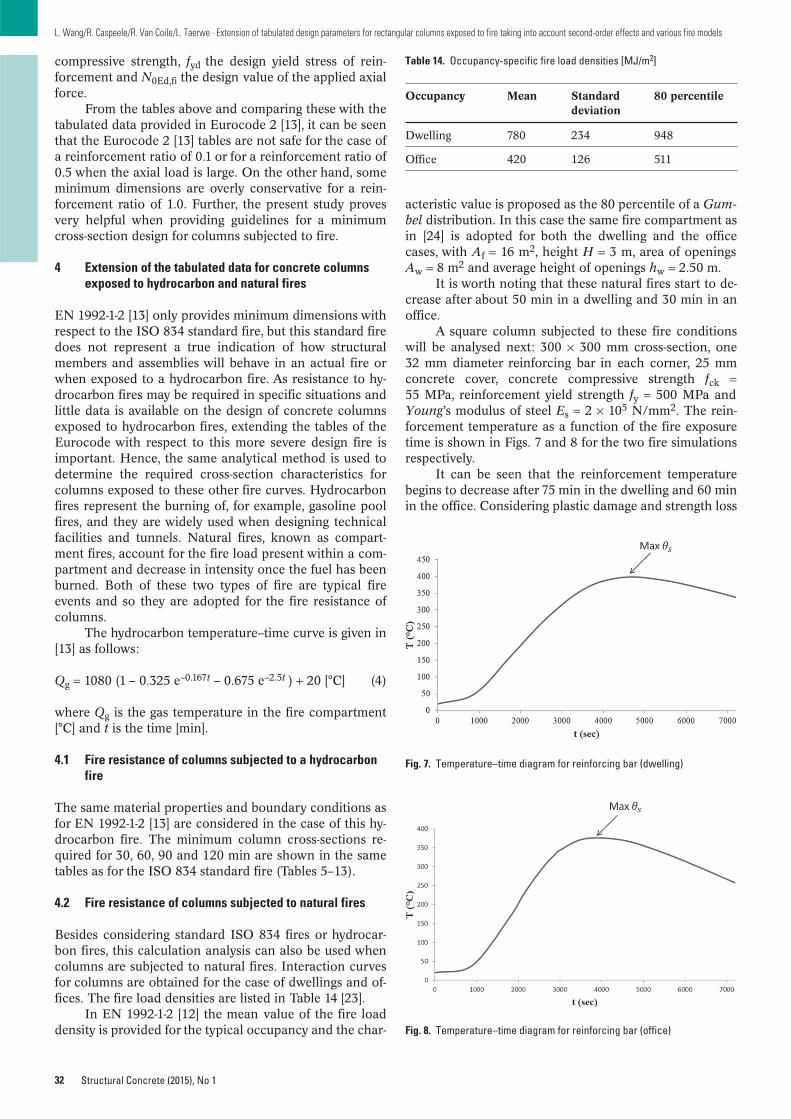
compressive strength, fyd the design yield stress of rein-forcement and N0Ed,fi the design value of the applied axialforce.
From the tables above and comparing these with thetabulated data provided in Eurocode 2 [13], it can be seenthat the Eurocode 2 [13] tables are not safe for the case ofa reinforcement ratio of 0.1 or for a reinforcement ratio of0.5 when the axial load is large. On the other hand, someminimum dimensions are overly conservative for a rein-forcement ratio of 1.0. Further, the present study provesvery helpful when providing guidelines for a minimumcross-section design for columns subjected to fire.
4 Extension of the tabulated data for concrete columnsexposed to hydrocarbon and natural fires
EN 1992-1-2 [13] only provides minimum dimensions withrespect to the ISO 834 standard fire, but this standard firedoes not represent a true indication of how structuralmembers and assemblies will behave in an actual fire orwhen exposed to a hydrocarbon fire. As resistance to hy-drocarbon fires may be required in specific situations andlittle data is available on the design of concrete columnsexposed to hydrocarbon fires, extending the tables of theEurocode with respect to this more severe design fire isimportant. Hence, the same analytical method is used todetermine the required cross-section characteristics forcolumns exposed to these other fire curves. Hydrocarbonfires represent the burning of, for example, gasoline poolfires, and they are widely used when designing technicalfacilities and tunnels. Natural fires, known as compart-ment fires, account for the fire load present within a com-partment and decrease in intensity once the fuel has beenburned. Both of these two types of fire are typical fireevents and so they are adopted for the fire resistance ofcolumns.
The hydrocarbon temperature–time curve is given in[13] as follows:
Qg = 1080 (1 – 0.325 e–0.167t – 0.675 e–2.5t ) + 20 [°C] (4)
where Qg is the gas temperature in the fire compartment[°C] and t is the time [min].
4.1 Fire resistance of columns subjected to a hydrocarbonfire
The same material properties and boundary conditions asfor EN 1992-1-2 [13] are considered in the case of this hy-drocarbon fire. The minimum column cross-sections re-quired for 30, 60, 90 and 120 min are shown in the sametables as for the ISO 834 standard fire (Tables 5–13).
4.2 Fire resistance of columns subjected to natural fires
Besides considering standard ISO 834 fires or hydrocar-bon fires, this calculation analysis can also be used whencolumns are subjected to natural fires. Interaction curvesfor columns are obtained for the case of dwellings and of-fices. The fire load densities are listed in Table 14 [23].
In EN 1992-1-2 [12] the mean value of the fire loaddensity is provided for the typical occupancy and the char-
32
L. Wang/R. Caspeele/R. Van Coile/L. Taerwe · Extension of tabulated design parameters for rectangular columns exposed to fire taking into account second-order effects and various fire models
Structural Concrete (2015), No 1
acteristic value is proposed as the 80 percentile of a Gum-bel distribution. In this case the same fire compartment asin [24] is adopted for both the dwelling and the office cases, with Af = 16 m2, height H = 3 m, area of openingsAw = 8 m2 and average height of openings hw = 2.50 m.
It is worth noting that these natural fires start to de-crease after about 50 min in a dwelling and 30 min in anoffice.
A square column subjected to these fire conditionswill be analysed next: 300 × 300 mm cross-section, one32 mm diameter reinforcing bar in each corner, 25 mmconcrete cover, concrete compressive strength fck =55 MPa, reinforcement yield strength fy = 500 MPa andYoung’s modulus of steel Es = 2 × 10⁵ N/mm2. The rein-forcement temperature as a function of the fire exposuretime is shown in Figs. 7 and 8 for the two fire simulationsrespectively.
It can be seen that the reinforcement temperaturebegins to decrease after 75 min in the dwelling and 60 minin the office. Considering plastic damage and strength loss
Table 14. Occupancy-specific fire load densities [MJ/m2]
Occupancy Mean Standard 80 percentiledeviation
Dwelling 780 234 948
Office 420 126 511
Fig. 7. Temperature–time diagram for reinforcing bar (dwelling)
Fig. 8. Temperature–time diagram for reinforcing bar (office)
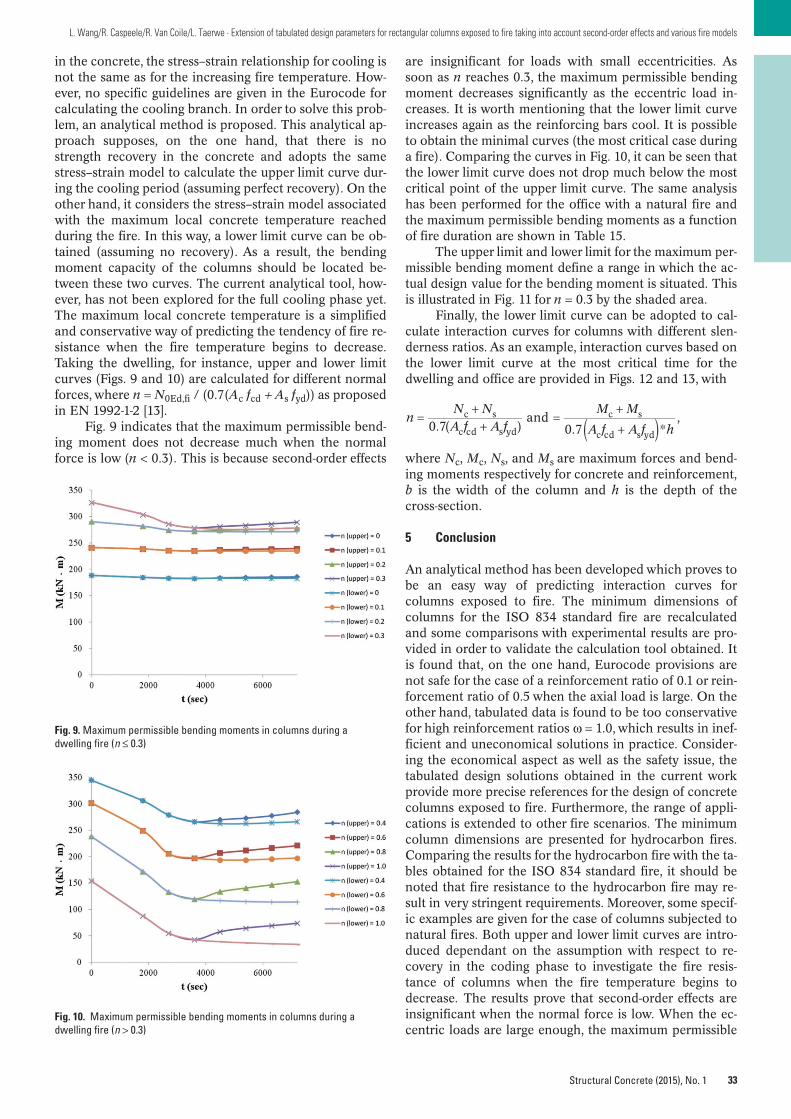
33
L. Wang/R. Caspeele/R. Van Coile/L. Taerwe · Extension of tabulated design parameters for rectangular columns exposed to fire taking into account second-order effects and various fire models
Structural Concrete (2015), No. 1
in the concrete, the stress–strain relationship for cooling isnot the same as for the increasing fire temperature. How-ever, no specific guidelines are given in the Eurocode forcalculating the cooling branch. In order to solve this prob-lem, an analytical method is proposed. This analytical ap-proach supposes, on the one hand, that there is nostrength recovery in the concrete and adopts the samestress–strain model to calculate the upper limit curve dur-ing the cooling period (assuming perfect recovery). On theother hand, it considers the stress–strain model associatedwith the maximum local concrete temperature reachedduring the fire. In this way, a lower limit curve can be ob-tained (assuming no recovery). As a result, the bendingmoment capacity of the columns should be located be-tween these two curves. The current analytical tool, how-ever, has not been explored for the full cooling phase yet.The maximum local concrete temperature is a simplifiedand conservative way of predicting the tendency of fire re-sistance when the fire temperature begins to decrease.Taking the dwelling, for instance, upper and lower limitcurves (Figs. 9 and 10) are calculated for different normalforces, where n = N0Ed,fi / (0.7(Ac fcd + As fyd)) as proposedin EN 1992-1-2 [13].
Fig. 9 indicates that the maximum permissible bend-ing moment does not decrease much when the normalforce is low (n < 0.3). This is because second-order effects
Fig. 9. Maximum permissible bending moments in columns during adwelling fire (n ≤ 0.3)
Fig. 10. Maximum permissible bending moments in columns during adwelling fire (n > 0.3)
are insignificant for loads with small eccentricities. Assoon as n reaches 0.3, the maximum permissible bendingmoment decreases significantly as the eccentric load in-creases. It is worth mentioning that the lower limit curveincreases again as the reinforcing bars cool. It is possibleto obtain the minimal curves (the most critical case duringa fire). Comparing the curves in Fig. 10, it can be seen thatthe lower limit curve does not drop much below the mostcritical point of the upper limit curve. The same analysishas been performed for the office with a natural fire andthe maximum permissible bending moments as a functionof fire duration are shown in Table 15.
The upper limit and lower limit for the maximum per-missible bending moment define a range in which the ac-tual design value for the bending moment is situated. Thisis illustrated in Fig. 11 for n = 0.3 by the shaded area.
Finally, the lower limit curve can be adopted to cal-culate interaction curves for columns with different slen-derness ratios. As an example, interaction curves based onthe lower limit curve at the most critical time for thedwelling and office are provided in Figs. 12 and 13, with
where Nc, Mc, Ns, and Ms are maximum forces and bend-ing moments respectively for concrete and reinforcement,b is the width of the column and h is the depth of thecross-section.
5 Conclusion
An analytical method has been developed which proves tobe an easy way of predicting interaction curves forcolumns exposed to fire. The minimum dimensions ofcolumns for the ISO 834 standard fire are recalculatedand some comparisons with experimental results are pro-vided in order to validate the calculation tool obtained. Itis found that, on the one hand, Eurocode provisions arenot safe for the case of a reinforcement ratio of 0.1 or rein-forcement ratio of 0.5 when the axial load is large. On theother hand, tabulated data is found to be too conservativefor high reinforcement ratios ω = 1.0, which results in inef-ficient and uneconomical solutions in practice. Consider-ing the economical aspect as well as the safety issue, thetabulated design solutions obtained in the current workprovide more precise references for the design of concretecolumns exposed to fire. Furthermore, the range of appli-cations is extended to other fire scenarios. The minimumcolumn dimensions are presented for hydrocarbon fires.Comparing the results for the hydrocarbon fire with the ta-bles obtained for the ISO 834 standard fire, it should benoted that fire resistance to the hydrocarbon fire may re-sult in very stringent requirements. Moreover, some specif-ic examples are given for the case of columns subjected tonatural fires. Both upper and lower limit curves are intro-duced dependant on the assumption with respect to re-covery in the coding phase to investigate the fire resis-tance of columns when the fire temperature begins todecrease. The results prove that second-order effects areinsignificant when the normal force is low. When the ec-centric loads are large enough, the maximum permissible
nN NA f A f
M M
A f A f h0.7( )and
0.7 *,c s
c cd s yd
c s
c cd s yd
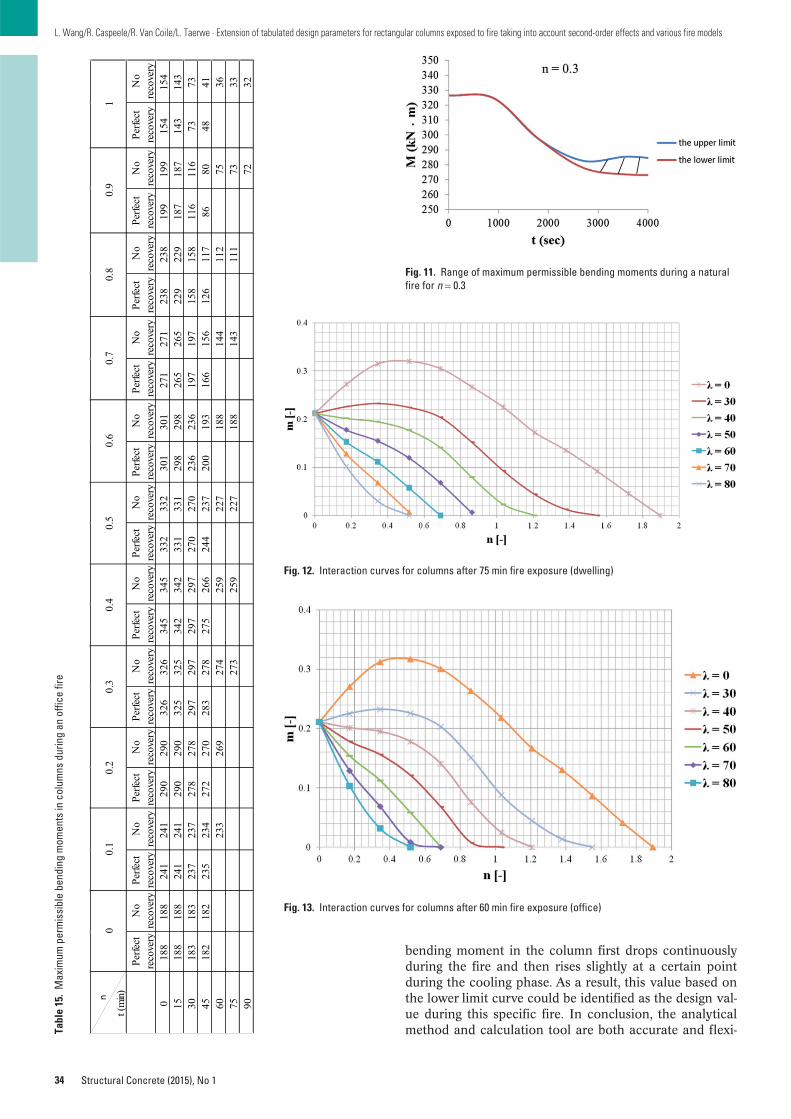
34
L. Wang/R. Caspeele/R. Van Coile/L. Taerwe · Extension of tabulated design parameters for rectangular columns exposed to fire taking into account second-order effects and various fire models
Structural Concrete (2015), No 1
bending moment in the column first drops continuouslyduring the fire and then rises slightly at a certain pointduring the cooling phase. As a result, this value based onthe lower limit curve could be identified as the design val-ue during this specific fire. In conclusion, the analyticalmethod and calculation tool are both accurate and flexi-Ta
ble
15.
Max
imum
per
mis
sibl
e be
ndin
g m
omen
ts in
col
umns
dur
ing
an o
ffic
e fir
e
t (m
in)
Perfe
ctre
cove
ryN
ore
cove
ryPe
rfect
reco
very
No
reco
very
Perfe
ctre
cove
ryN
ore
cove
ryPe
rfect
reco
very
No
reco
very
Perfe
ctre
cove
ryN
ore
cove
ryPe
rfect
reco
very
No
reco
very
Perfe
ctre
cove
ryN
ore
cove
ryPe
rfect
reco
very
No
reco
very
Perfe
ctre
cove
ryN
ore
cove
ryPe
rfect
reco
very
No
reco
very
Perfe
ctre
cove
ryN
ore
cove
ry0
188
188
241
241
290
290
326
326
345
345
332
332
301
301
271
271
238
238
199
199
154
154
1518
818
824
124
129
029
032
532
534
234
233
133
129
829
826
526
522
922
918
718
714
314
330
183
183
237
237
278
278
297
297
297
297
270
270
236
236
197
197
158
158
116
116
7373
4518
218
223
523
427
227
028
327
827
526
624
423
720
019
316
615
612
611
786
8048
4160
233
269
274
259
227
188
144
112
7536
7527
325
922
718
814
311
173
3390
7232
0.5
00.
10.
20.
30.
40.
60.
70.
80.
91
n
Fig. 11. Range of maximum permissible bending moments during a naturalfire for n = 0.3
Fig. 12. Interaction curves for columns after 75 min fire exposure (dwelling)
Fig. 13. Interaction curves for columns after 60 min fire exposure (office)
35
L. Wang/R. Caspeele/R. Van Coile/L. Taerwe · Extension of tabulated design parameters for rectangular columns exposed to fire taking into account second-order effects and various fire models
Structural Concrete (2015), No. 1
ble, and could possibly be effective in quantifying the in-teraction curves of columns exposed to any types of firewhen considering second-order effects.
Acknowledgements
The authors would like to thank the China ScholarshipCouncil (CSC) for their financial support.
References
1. Franssen, J. M., Dotreppe, J. C.: Fire tests and calculationmethods for circular concrete columns. Fire Technology,2003(39), pp. 89–97.
2. Lie, T. T., Lin, T. D., Allen, D. E., Abrams, M. S.: Fire resis-tance of reinforced concrete columns. Division of BuildingResearch, DBR paper No. 1167, National Research Councilof Canada, Ottawa, Canada, Feb 1984.
3. Lie, T. T., Celikkol, B.: Method to calculate the fire resis-tance of circular reinforced concrete columns. ACI MaterialsJournal, 1991, 88(1), pp. 84–91.
4. Lie, T. T., Irwin, R. J.: Method to calculate the fire resistanceof reinforced concrete columns with rectangular cross sec-tion. ACI Structural Journal, 1993, 90(1), pp. 52–60.
5. Dotreppe, J. C., Franssen, J. M., Vanderzeypen, Y.: Calcula-tion method for design of reinforced concrete columns un-der fire conditions. ACI Structural Journal, 1999, 96(1), pp.9–18.
6. Meda, A., Gambarova, P. G., Bonomi, M.: High-perfor-mance concrete in fire-exposed reinforced concrete sections.ACI Structural Journal, 2002, 99(3), pp. 277–287.
7. Kodur, V., Raut, N.: A simplified approach for predicting fireresistance of reinforced concrete columns under biaxialbending. Eng Struct, 2012, 41, pp. 428–443.
8. Van Coile, R., Annerel, E., Caspeele, R., Taerwe, L.: Full-Probabilistic analysis of concrete beams during fire. Journalof Structural Fire Engineering, 2013, pp. 165–174.
9. Van Coile, R., Caspeele, R., Taerwe, L.: Lifetime cost opti-mization for the structural fire resistance of concrete slabs.Fire Technology, Jun 2013.
10. Jeffers, A., Sotelino, E.: Fiber heat transfer element for mod-eling the thermal response of structures in fire. J. Struct.Eng., 2009, 135(10), pp. 1191–1200.
11. Jeffers, A.: Heat transfer element for modeling the thermalresponse of non-uniformly heated plates. Finite Elements inAnalysis and Design. 2013, 63, pp. 62–68.
12. Eurocode 2 – Commentary – European Concrete PlatformASBL, Jun 2008.
13. CEN. EN 1992-1-2: Design of concrete structures – Part 1-2:General rules – Structural fire design. European Committeefor Standardization, Brussels, Belgium, 2004.
14. Caldas, R. B., Sousa, J. B. M., Fakury, R. H.: Interaction dia-grams for reinforced concrete sections subjected to fire. EngStruct, 2010, 32(9), pp. 2832–2838.
15. MATLAB version 8.1 (R2013a), The MathWorks Inc., Nat-ick, Massachusetts, 2013.
16. DIANA version 9.4.4, TNO DIANA BV, Delft, The Nether-lands, 2012.
17. fib Bulletin No. 46: Fire design of concrete structures –structural behaviour and assessment, State of the art report,2008.
18. Wang, L. J., Caspeele, R., Taerwe, L.: Development of an Ex-cel-based calculation tool for interaction curves of rectangu-lar concrete columns subjected to fire. IRF’2013, 4th Int.Conf. on Integrity, Reliability & Failure, 2013, pp. 49–50.
19. CEN: EN 1992-1-1: Design of concrete structures – Part 1-1:General rules and rules for buildings. European Committeefor Standardization, Brussels, Belgium, 2004.
20. Hass, R.: Zur praxisgerechten brandschutztechnischenBeurteilung von Stützen aus Stahl und Beton. PhD disserta-tion, 1986.
21. Dotreppe, J.-C., Franssen, J.-M.: Dimensionnement descolonnes en béton armé en considérant le problème de la ré-sistance au feu. External Report, 1993.
22. fib Bulletin No. 38: Fire design of concrete structures – ma-terials, structures and modeling, State of the art report, 2007.
23. Albrecht, C., Hosser, D.: Risk-informed framework for per-formance-based structural fire protection according to theEurocode fire parts, Proc. of 12th Interflam Conf., Notting-ham, 5–7 Jul 2010, pp. 1031–1042.
24. Zehfuss, J., Hosser, D.: A parametric natural fire model forthe structural fire design of multi-storey buildings. Fire Safe-ty Journal, 2007, 42, pp. 115–126.
Luc TaerweGhent UniversityDepartment of Structural EngineeringMagnel Laboratory for Concrete ResearchTechnologiepark-Zwijnaarde 9049000 GhentBelgium
Robby CaspeeleGhent UniversityDepartment of Structural EngineeringMagnel Laboratory for Concrete ResearchTechnologiepark-Zwijnaarde 9049000 GhentBelgium
Ruben Van CoileGhent UniversityDepartment of Structural EngineeringMagnel Laboratory for Concrete ResearchTechnologiepark-Zwijnaarde 9049000 GhentBelgium
Lijie WangGhent UniversityDepartment of Structural EngineeringMagnel Laboratory for Concrete ResearchTechnologiepark-Zwijnaarde 9049000 GhentBelgiumE-mail: [email protected]
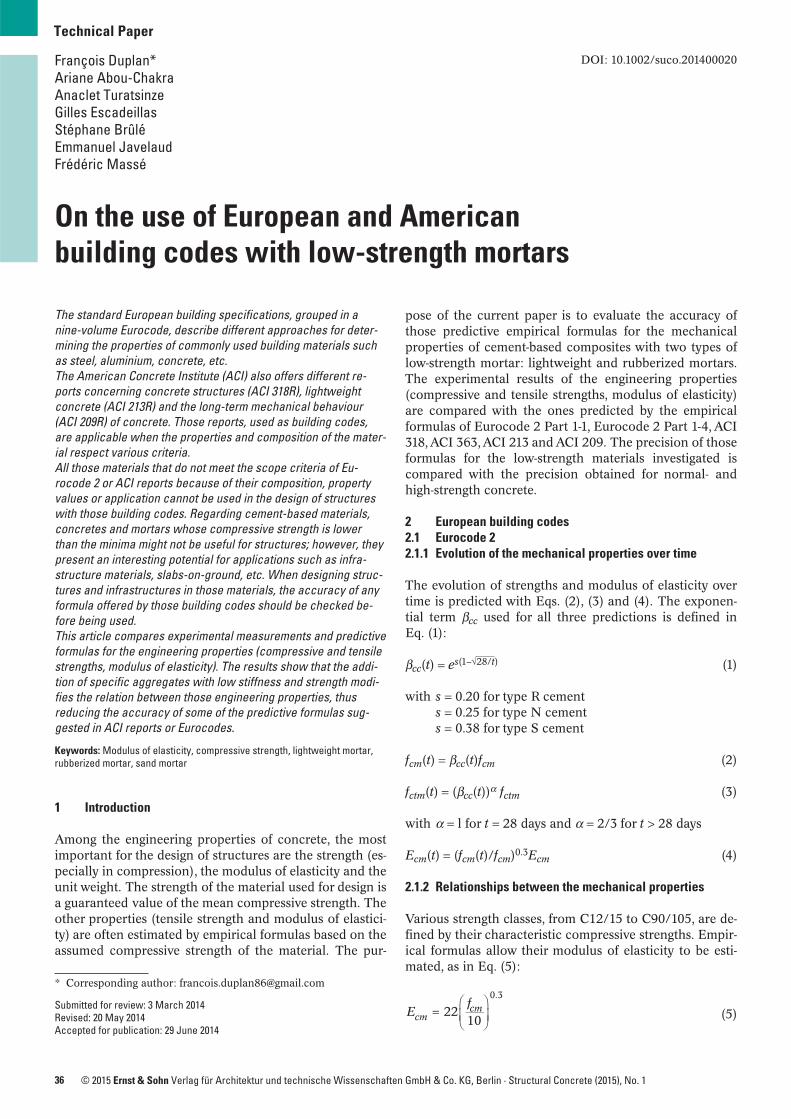
36 © 2015 Ernst & Sohn Verlag für Architektur und technische Wissenschaften GmbH & Co. KG, Berlin · Structural Concrete (2015), No. 1
Technical Paper
DOI: 10.1002/suco.201400020
The standard European building specifications, grouped in anine-volume Eurocode, describe different approaches for deter-mining the properties of commonly used building materials suchas steel, aluminium, concrete, etc.The American Concrete Institute (ACI) also offers different re-ports concerning concrete structures (ACI 318R), lightweightconcrete (ACI 213R) and the long-term mechanical behaviour(ACI 209R) of concrete. Those reports, used as building codes,are applicable when the properties and composition of the mater-ial respect various criteria.All those materials that do not meet the scope criteria of Eu-rocode 2 or ACI reports because of their composition, propertyvalues or application cannot be used in the design of structureswith those building codes. Regarding cement-based materials,concretes and mortars whose compressive strength is lowerthan the minima might not be useful for structures; however, theypresent an interesting potential for applications such as infra-structure materials, slabs-on-ground, etc. When designing struc-tures and infrastructures in those materials, the accuracy of anyformula offered by those building codes should be checked be-fore being used.This article compares experimental measurements and predictiveformulas for the engineering properties (compressive and tensilestrengths, modulus of elasticity). The results show that the addi-tion of specific aggregates with low stiffness and strength modi-fies the relation between those engineering properties, thus reducing the accuracy of some of the predictive formulas sug-gested in ACI reports or Eurocodes.
Keywords: Modulus of elasticity, compressive strength, lightweight mortar,rubberized mortar, sand mortar
1 Introduction
Among the engineering properties of concrete, the mostimportant for the design of structures are the strength (es-pecially in compression), the modulus of elasticity and theunit weight. The strength of the material used for design isa guaranteed value of the mean compressive strength. Theother properties (tensile strength and modulus of elastici-ty) are often estimated by empirical formulas based on theassumed compressive strength of the material. The pur-
pose of the current paper is to evaluate the accuracy ofthose predictive empirical formulas for the mechanicalproperties of cement-based composites with two types oflow-strength mortar: lightweight and rubberized mortars.The experimental results of the engineering properties(compressive and tensile strengths, modulus of elasticity)are compared with the ones predicted by the empiricalformulas of Eurocode 2 Part 1-1, Eurocode 2 Part 1-4, ACI318, ACI 363, ACI 213 and ACI 209. The precision of thoseformulas for the low-strength materials investigated iscompared with the precision obtained for normal- andhigh-strength concrete.
2 European building codes2.1 Eurocode 22.1.1 Evolution of the mechanical properties over time
The evolution of strengths and modulus of elasticity overtime is predicted with Eqs. (2), (3) and (4). The exponen-tial term βcc used for all three predictions is defined inEq. (1):
βcc(t) = es(1–√⎯28/t) (1)
with s = 0.20 for type R cements = 0.25 for type N cements = 0.38 for type S cement
fcm(t) = βcc(t)fcm (2)
fctm(t) = (βcc(t))α fctm (3)
with α = l for t = 28 days and α = 2/3 for t > 28 days
Ecm(t) = (fcm(t)/fcm)0.3Ecm (4)
2.1.2 Relationships between the mechanical properties
Various strength classes, from C12/15 to C90/105, are de-fined by their characteristic compressive strengths. Empir-ical formulas allow their modulus of elasticity to be esti-mated, as in Eq. (5):
(5)2210
0.3
Ef
cmcm
On the use of European and Americanbuilding codes with low-strength mortars
François Duplan*Ariane Abou-ChakraAnaclet TuratsinzeGilles EscadeillasStéphane BrûléEmmanuel JavelaudFrédéric Massé
* Corresponding author: [email protected]
Submitted for review: 3 March 2014Revised: 20 May 2014Accepted for publication: 29 June 2014
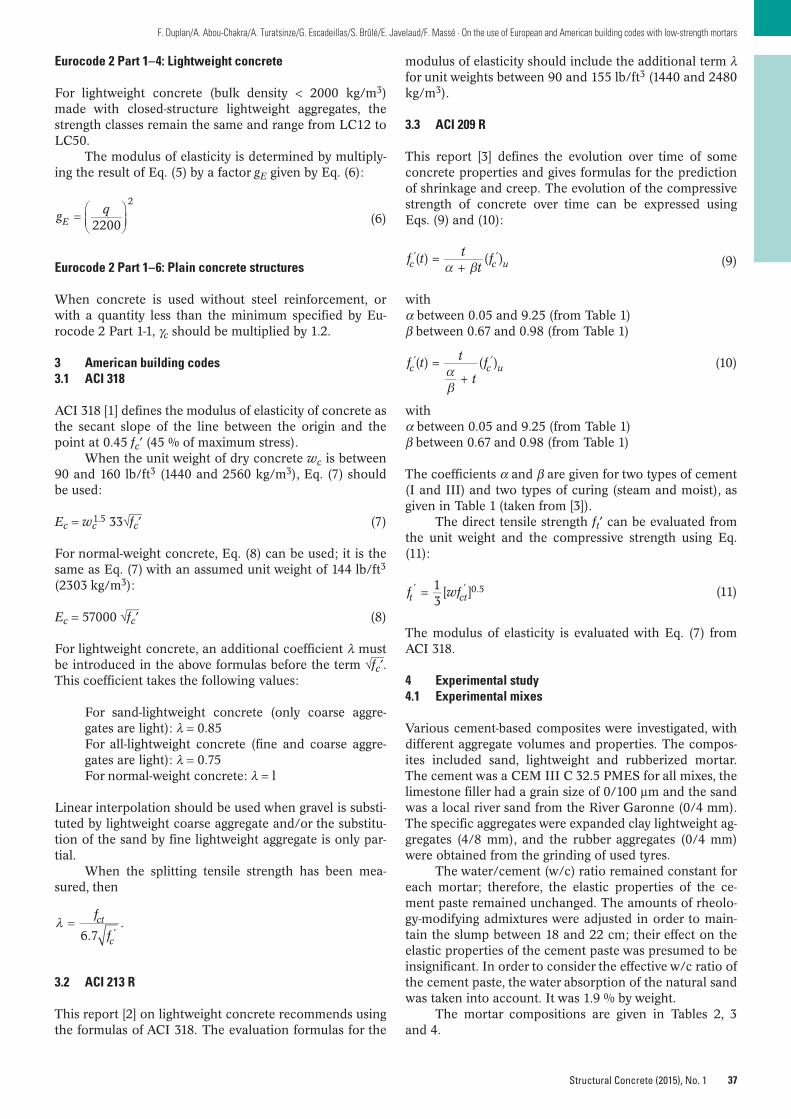
37
F. Duplan/A. Abou-Chakra/A. Turatsinze/G. Escadeillas/S. Brûlé/E. Javelaud/F. Massé · On the use of European and American building codes with low-strength mortars
Structural Concrete (2015), No. 1
Eurocode 2 Part 1–4: Lightweight concrete
For lightweight concrete (bulk density < 2000 kg/m3)made with closed-structure lightweight aggregates, thestrength classes remain the same and range from LC12 toLC50.
The modulus of elasticity is determined by multiply-ing the result of Eq. (5) by a factor gE given by Eq. (6):
(6)
Eurocode 2 Part 1–6: Plain concrete structures
When concrete is used without steel reinforcement, orwith a quantity less than the minimum specified by Eu-rocode 2 Part 1-1, γc should be multiplied by 1.2.
3 American building codes3.1 ACI 318
ACI 318 [1] defines the modulus of elasticity of concrete asthe secant slope of the line between the origin and thepoint at 0.45 fc′ (45 % of maximum stress).
When the unit weight of dry concrete wc is between90 and 160 lb/ft3 (1440 and 2560 kg/m3), Eq. (7) shouldbe used:
Ec = wc1.5 33√⎯fc′ (7)
For normal-weight concrete, Eq. (8) can be used; it is thesame as Eq. (7) with an assumed unit weight of 144 lb/ft3
(2303 kg/m3):
Ec = 57000 √⎯fc′ (8)
For lightweight concrete, an additional coefficient λ mustbe introduced in the above formulas before the term √⎯fc′.This coefficient takes the following values:
For sand-lightweight concrete (only coarse aggre-gates are light): λ = 0.85For all-lightweight concrete (fine and coarse aggre-gates are light): λ = 0.75For normal-weight concrete: λ = l
Linear interpolation should be used when gravel is substi-tuted by lightweight coarse aggregate and/or the substitu-tion of the sand by fine lightweight aggregate is only par-tial.
When the splitting tensile strength has been mea-sured, then
3.2 ACI 213 R
This report [2] on lightweight concrete recommends usingthe formulas of ACI 318. The evaluation formulas for the
2200
2
g qE
6.7.
f
fct
c
modulus of elasticity should include the additional term λfor unit weights between 90 and 155 lb/ft3 (1440 and 2480kg/m3).
3.3 ACI 209 R
This report [3] defines the evolution over time of someconcrete properties and gives formulas for the predictionof shrinkage and creep. The evolution of the compressivestrength of concrete over time can be expressed usingEqs. (9) and (10):
(9)
withα between 0.05 and 9.25 (from Table 1)β between 0.67 and 0.98 (from Table 1)
(10)
withα between 0.05 and 9.25 (from Table 1)β between 0.67 and 0.98 (from Table 1)
The coefficients α and β are given for two types of cement(I and III) and two types of curing (steam and moist), asgiven in Table 1 (taken from [3]).
The direct tensile strength ft′ can be evaluated fromthe unit weight and the compressive strength using Eq.(11):
(11)
The modulus of elasticity is evaluated with Eq. (7) fromACI 318.
4 Experimental study4.1 Experimental mixes
Various cement-based composites were investigated, withdifferent aggregate volumes and properties. The compos-ites included sand, lightweight and rubberized mortar.The cement was a CEM III C 32.5 PMES for all mixes, thelimestone filler had a grain size of 0/100 μm and the sandwas a local river sand from the River Garonne (0/4 mm).The specific aggregates were expanded clay lightweight ag-gregates (4/8 mm), and the rubber aggregates (0/4 mm)were obtained from the grinding of used tyres.
The water/cement (w/c) ratio remained constant foreach mortar; therefore, the elastic properties of the ce-ment paste remained unchanged. The amounts of rheolo-gy-modifying admixtures were adjusted in order to main-tain the slump between 18 and 22 cm; their effect on theelastic properties of the cement paste was presumed to beinsignificant. In order to consider the effective w/c ratio ofthe cement paste, the water absorption of the natural sandwas taken into account. It was 1.9 % by weight.
The mortar compositions are given in Tables 2, 3and 4.
( ) ( )f t tt
fc c u
( ) ( )f t t
tfc c u
13
[ ]0.5f wft ct

38
F. Duplan/A. Abou-Chakra/A. Turatsinze/G. Escadeillas/S. Brûlé/E. Javelaud/F. Massé · On the use of European and American building codes with low-strength mortars
Structural Concrete (2015), No. 1
The lightweight and rubberized mortars were formu-lated by substituting natural sand by those specific aggre-gates from a control mix. The control mix is the mortarcontaining a 62 % volume fraction of natural sand. Thismethod of formulation maintains the properties and vol-ume fraction of the cement paste, whereas the relative vol-ume fractions of sand and specific aggregates were vari-able.
The lightweight aggregates were pre-saturated beforemixing according to their data sheet. Their pre-saturationwater (5 min water absorption ratio of 9 %) does not figurein the mix details in Table 3.
The water absorption ratio of the rubber aggregatescould not be measured, but is known to be very low sincevulcanized rubber is hydrophobic [4]. Without any com-plementary data, the total water quantity was kept con-stant.
4.2 Testing methods
The elastic moduli were tested according to the RILEMCPC8 recommendations. The compressive strength anddensity tests were carried out according to EN 12390.
5 Results taken from the literature
In order to judge the validity of the formulas for low-strength mortars, it was decided to compare their accuracywith structural concrete data from the literature, and then
Table 1. α and β coefficients for the evolution of fc′(t)
Time ratio Type of Cement Constants Concrete age Ultimatecuring Type α, and α/β
Days Years(in time)
3 7 14 21 28 56 91 1 10
(fc′)t/(fc′) 28 Moist I α = 4.0Eq. (2-1) Cured β = 0.85 0.46 0.70 0.88 0.96 1.0 1.08 1.12 1.16 1.17 1.18
III α = 2.3β = 0.92 0.59 0.80 0.92 0.97 1.0 1.04 1.06 1.08 1.09 1.09
Steam I α = 1.0Cured β = 0.95 0.78 0.91 0.98 1.0 1.0 1.03 1.04 1.05 1.05 1.05
III α = 0.70β = 0.98 0.82 0.93 0.97 0.99 1.0 1.0 1.01 1.01 1.02 1.02
(fc′)t/(fc′) u, Moist I α/β = 4.71 0.39 0.60 0.75 0.82 0.86 0.92 0.95 0.99 1.0 1.0Eq. (2-2) Cured
III α/β = 2.5 0.54 0.74 0.85 0.89 0.92 0.96 0.97 0.99 1.0 1.0
Steam I α/β = 1.05 0.74 0.87 0.93 0.95 0.96 0.98 0.99 1.0 1.0 1.0Cured
III α/β = 0.71 0.81 0.91 0.95 0.97 0.97 0.99 0.99 1.0 1.0 1.0
Table 2. Natural sand mortar mix
Cement (kg/m3) 242
Water (kg/m3) 254
Sand (kg/m3) 1644
Filler (kg/m3) 135
Super-plasticizer (kg/m3) 4.73
Table 3. Lightweight mortar mixes
Lightweight aggregates substitution rate (%) 0 30 60
Cement (kg/m3) 242 242 242
Water (kg/m3) 254 254 254
Sand (kg/m3) 1644 1151 658
Filler (kg/m3) 135 135 135
Pre-saturated lightweight aggregates (kg/m3) 0 222 444
Superplaticizer (kg/m3) 4.73 7.20 7.20
Viscosity agent (kg/m3) 0 1.06 1.06
Table 4. Rubberized mortar mixes
Rubber aggregates substitution rate (%) 0 5 15 30
Cement (kg/m3) 242 242 242 242
Water (kg/m3) 254 254 254 254
Sand (kg/m3) 1644 1562 1397 1151
Filler (kg/m3) 135 135 135 135
Rubber aggregates (kg/m3) 0 37 111 221
Super-platicizer (kg/m3) 4.73 7.20 7.20 7.20
Viscosity agent (kg/m3) 0 1.06 1.06 1.08
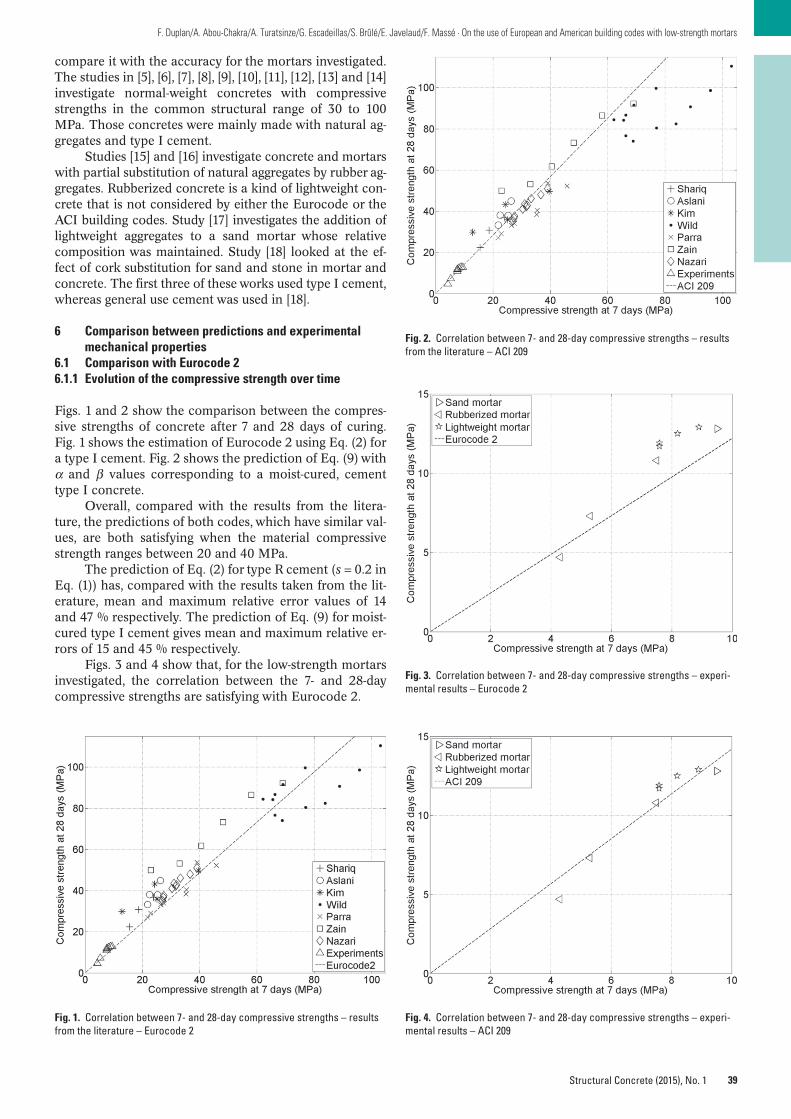
39
F. Duplan/A. Abou-Chakra/A. Turatsinze/G. Escadeillas/S. Brûlé/E. Javelaud/F. Massé · On the use of European and American building codes with low-strength mortars
Structural Concrete (2015), No. 1
compare it with the accuracy for the mortars investigated.The studies in [5], [6], [7], [8], [9], [10], [11], [12], [13] and [14]investigate normal-weight concretes with compressivestrengths in the common structural range of 30 to 100MPa. Those concretes were mainly made with natural ag-gregates and type I cement.
Studies [15] and [16] investigate concrete and mortarswith partial substitution of natural aggregates by rubber ag-gregates. Rubberized concrete is a kind of lightweight con-crete that is not considered by either the Eurocode or theACI building codes. Study [17] investigates the addition oflightweight aggregates to a sand mortar whose relativecomposition was maintained. Study [18] looked at the ef-fect of cork substitution for sand and stone in mortar andconcrete. The first three of these works used type I cement,whereas general use cement was used in [18].
6 Comparison between predictions and experimental mechanical properties
6.1 Comparison with Eurocode 26.1.1 Evolution of the compressive strength over time
Figs. 1 and 2 show the comparison between the compres-sive strengths of concrete after 7 and 28 days of curing.Fig. 1 shows the estimation of Eurocode 2 using Eq. (2) fora type I cement. Fig. 2 shows the prediction of Eq. (9) withα and β values corresponding to a moist-cured, cementtype I concrete.
Overall, compared with the results from the litera-ture, the predictions of both codes, which have similar val-ues, are both satisfying when the material compressivestrength ranges between 20 and 40 MPa.
The prediction of Eq. (2) for type R cement (s = 0.2 inEq. (1)) has, compared with the results taken from the lit-erature, mean and maximum relative error values of 14and 47 % respectively. The prediction of Eq. (9) for moist-cured type I cement gives mean and maximum relative er-rors of 15 and 45 % respectively.
Figs. 3 and 4 show that, for the low-strength mortarsinvestigated, the correlation between the 7- and 28-daycompressive strengths are satisfying with Eurocode 2.
Fig. 1. Correlation between 7- and 28-day compressive strengths – resultsfrom the literature – Eurocode 2
Fig. 2. Correlation between 7- and 28-day compressive strengths – resultsfrom the literature – ACI 209
Fig. 3. Correlation between 7- and 28-day compressive strengths – experi-mental results – Eurocode 2
Fig. 4. Correlation between 7- and 28-day compressive strengths – experi-mental results – ACI 209
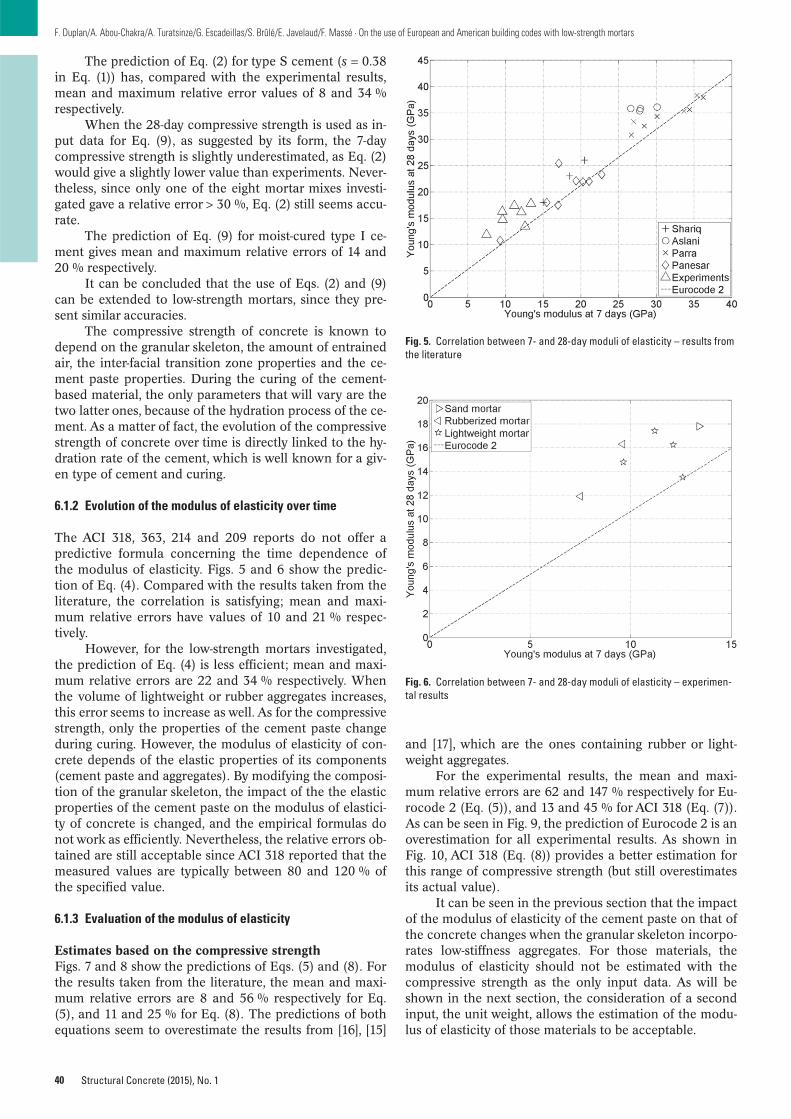
40
F. Duplan/A. Abou-Chakra/A. Turatsinze/G. Escadeillas/S. Brûlé/E. Javelaud/F. Massé · On the use of European and American building codes with low-strength mortars
Structural Concrete (2015), No. 1
The prediction of Eq. (2) for type S cement (s = 0.38in Eq. (1)) has, compared with the experimental results,mean and maximum relative error values of 8 and 34 %respectively.
When the 28-day compressive strength is used as in-put data for Eq. (9), as suggested by its form, the 7-daycompressive strength is slightly underestimated, as Eq. (2)would give a slightly lower value than experiments. Never-theless, since only one of the eight mortar mixes investi-gated gave a relative error > 30 %, Eq. (2) still seems accu-rate.
The prediction of Eq. (9) for moist-cured type I ce-ment gives mean and maximum relative errors of 14 and20 % respectively.
It can be concluded that the use of Eqs. (2) and (9)can be extended to low-strength mortars, since they pre-sent similar accuracies.
The compressive strength of concrete is known todepend on the granular skeleton, the amount of entrainedair, the inter-facial transition zone properties and the ce-ment paste properties. During the curing of the cement-based material, the only parameters that will vary are thetwo latter ones, because of the hydration process of the ce-ment. As a matter of fact, the evolution of the compressivestrength of concrete over time is directly linked to the hy-dration rate of the cement, which is well known for a giv-en type of cement and curing.
6.1.2 Evolution of the modulus of elasticity over time
The ACI 318, 363, 214 and 209 reports do not offer a predictive formula concerning the time dependence ofthe modulus of elasticity. Figs. 5 and 6 show the predic-tion of Eq. (4). Compared with the results taken from theliterature, the correlation is satisfying; mean and maxi-mum relative errors have values of 10 and 21 % respec-tively.
However, for the low-strength mortars investigated,the prediction of Eq. (4) is less efficient; mean and maxi-mum relative errors are 22 and 34 % respectively. Whenthe volume of lightweight or rubber aggregates increases,this error seems to increase as well. As for the compressivestrength, only the properties of the cement paste changeduring curing. However, the modulus of elasticity of con-crete depends of the elastic properties of its components(cement paste and aggregates). By modifying the composi-tion of the granular skeleton, the impact of the the elasticproperties of the cement paste on the modulus of elastici-ty of concrete is changed, and the empirical formulas donot work as efficiently. Nevertheless, the relative errors ob-tained are still acceptable since ACI 318 reported that themeasured values are typically between 80 and 120 % ofthe specified value.
6.1.3 Evaluation of the modulus of elasticity
Estimates based on the compressive strengthFigs. 7 and 8 show the predictions of Eqs. (5) and (8). Forthe results taken from the literature, the mean and maxi-mum relative errors are 8 and 56 % respectively for Eq.(5), and 11 and 25 % for Eq. (8). The predictions of bothequations seem to overestimate the results from [16], [15]
and [17], which are the ones containing rubber or light-weight aggregates.
For the experimental results, the mean and maxi-mum relative errors are 62 and 147 % respectively for Eu-rocode 2 (Eq. (5)), and 13 and 45 % for ACI 318 (Eq. (7)).As can be seen in Fig. 9, the prediction of Eurocode 2 is anoverestimation for all experimental results. As shown inFig. 10, ACI 318 (Eq. (8)) provides a better estimation forthis range of compressive strength (but still overestimatesits actual value).
It can be seen in the previous section that the impactof the modulus of elasticity of the cement paste on that ofthe concrete changes when the granular skeleton incorpo-rates low-stiffness aggregates. For those materials, themodulus of elasticity should not be estimated with thecompressive strength as the only input data. As will beshown in the next section, the consideration of a secondinput, the unit weight, allows the estimation of the modu-lus of elasticity of those materials to be acceptable.
Fig. 5. Correlation between 7- and 28-day moduli of elasticity – results fromthe literature
Fig. 6. Correlation between 7- and 28-day moduli of elasticity – experimen-tal results
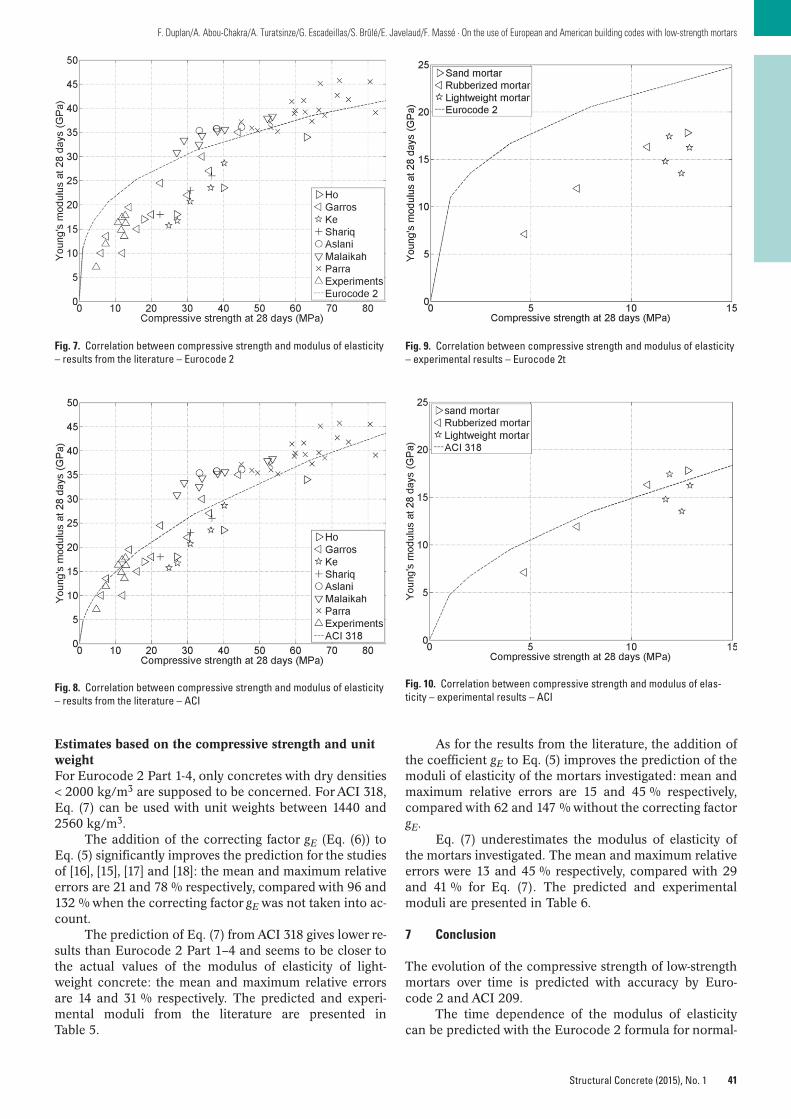
41
F. Duplan/A. Abou-Chakra/A. Turatsinze/G. Escadeillas/S. Brûlé/E. Javelaud/F. Massé · On the use of European and American building codes with low-strength mortars
Structural Concrete (2015), No. 1
Estimates based on the compressive strength and unitweightFor Eurocode 2 Part 1-4, only concretes with dry densities< 2000 kg/m3 are supposed to be concerned. For ACI 318,Eq. (7) can be used with unit weights between 1440 and2560 kg/m3.
The addition of the correcting factor gE (Eq. (6)) toEq. (5) significantly improves the prediction for the studiesof [16], [15], [17] and [18]: the mean and maximum relativeerrors are 21 and 78 % respectively, compared with 96 and132 % when the correcting factor gE was not taken into ac-count.
The prediction of Eq. (7) from ACI 318 gives lower re-sults than Eurocode 2 Part 1–4 and seems to be closer tothe actual values of the modulus of elasticity of light-weight concrete: the mean and maximum relative errorsare 14 and 31 % respectively. The predicted and experi-mental moduli from the literature are presented inTable 5.
As for the results from the literature, the addition ofthe coefficient gE to Eq. (5) improves the prediction of themoduli of elasticity of the mortars investigated: mean andmaximum relative errors are 15 and 45 % respectively,compared with 62 and 147 % without the correcting factorgE.
Eq. (7) underestimates the modulus of elasticity ofthe mortars investigated. The mean and maximum relativeerrors were 13 and 45 % respectively, compared with 29and 41 % for Eq. (7). The predicted and experimentalmoduli are presented in Table 6.
7 Conclusion
The evolution of the compressive strength of low-strengthmortars over time is predicted with accuracy by Euro -code 2 and ACI 209.
The time dependence of the modulus of elasticitycan be predicted with the Eurocode 2 formula for normal-
Fig. 7. Correlation between compressive strength and modulus of elasticity– results from the literature – Eurocode 2
Fig. 8. Correlation between compressive strength and modulus of elasticity– results from the literature – ACI
Fig. 9. Correlation between compressive strength and modulus of elasticity– experimental results – Eurocode 2t
Fig. 10. Correlation between compressive strength and modulus of elas -ticity – experimental results – ACI
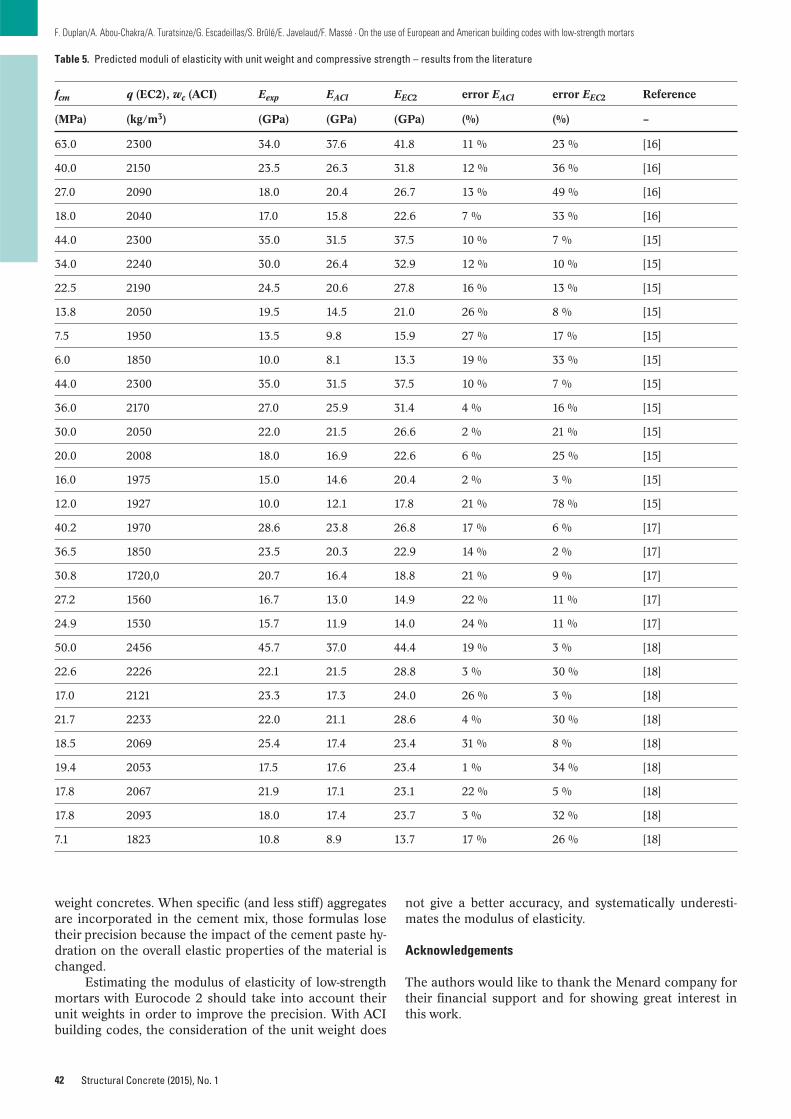
42
F. Duplan/A. Abou-Chakra/A. Turatsinze/G. Escadeillas/S. Brûlé/E. Javelaud/F. Massé · On the use of European and American building codes with low-strength mortars
Structural Concrete (2015), No. 1
weight concretes. When specific (and less stiff) aggregatesare incorporated in the cement mix, those formulas losetheir precision because the impact of the cement paste hy-dration on the overall elastic properties of the material ischanged.
Estimating the modulus of elasticity of low-strengthmortars with Eurocode 2 should take into account theirunit weights in order to improve the precision. With ACIbuilding codes, the consideration of the unit weight does
not give a better accuracy, and systematically underesti-mates the modulus of elasticity.
Acknowledgements
The authors would like to thank the Menard company fortheir financial support and for showing great interest inthis work.
Table 5. Predicted moduli of elasticity with unit weight and compressive strength – results from the literature
fcm q (EC2), wc (ACI) Eexp EACl EEC2 error EACl error EEC2 Reference
(MPa) (kg/m3) (GPa) (GPa) (GPa) (%) (%) –
63.0 2300 34.0 37.6 41.8 11 % 23 % [16]
40.0 2150 23.5 26.3 31.8 12 % 36 % [16]
27.0 2090 18.0 20.4 26.7 13 % 49 % [16]
18.0 2040 17.0 15.8 22.6 7 % 33 % [16]
44.0 2300 35.0 31.5 37.5 10 % 7 % [15]
34.0 2240 30.0 26.4 32.9 12 % 10 % [15]
22.5 2190 24.5 20.6 27.8 16 % 13 % [15]
13.8 2050 19.5 14.5 21.0 26 % 8 % [15]
7.5 1950 13.5 9.8 15.9 27 % 17 % [15]
6.0 1850 10.0 8.1 13.3 19 % 33 % [15]
44.0 2300 35.0 31.5 37.5 10 % 7 % [15]
36.0 2170 27.0 25.9 31.4 4 % 16 % [15]
30.0 2050 22.0 21.5 26.6 2 % 21 % [15]
20.0 2008 18.0 16.9 22.6 6 % 25 % [15]
16.0 1975 15.0 14.6 20.4 2 % 3 % [15]
12.0 1927 10.0 12.1 17.8 21 % 78 % [15]
40.2 1970 28.6 23.8 26.8 17 % 6 % [17]
36.5 1850 23.5 20.3 22.9 14 % 2 % [17]
30.8 1720,0 20.7 16.4 18.8 21 % 9 % [17]
27.2 1560 16.7 13.0 14.9 22 % 11 % [17]
24.9 1530 15.7 11.9 14.0 24 % 11 % [17]
50.0 2456 45.7 37.0 44.4 19 % 3 % [18]
22.6 2226 22.1 21.5 28.8 3 % 30 % [18]
17.0 2121 23.3 17.3 24.0 26 % 3 % [18]
21.7 2233 22.0 21.1 28.6 4 % 30 % [18]
18.5 2069 25.4 17.4 23.4 31 % 8 % [18]
19.4 2053 17.5 17.6 23.4 1 % 34 % [18]
17.8 2067 21.9 17.1 23.1 22 % 5 % [18]
17.8 2093 18.0 17.4 23.7 3 % 32 % [18]
7.1 1823 10.8 8.9 13.7 17 % 26 % [18]
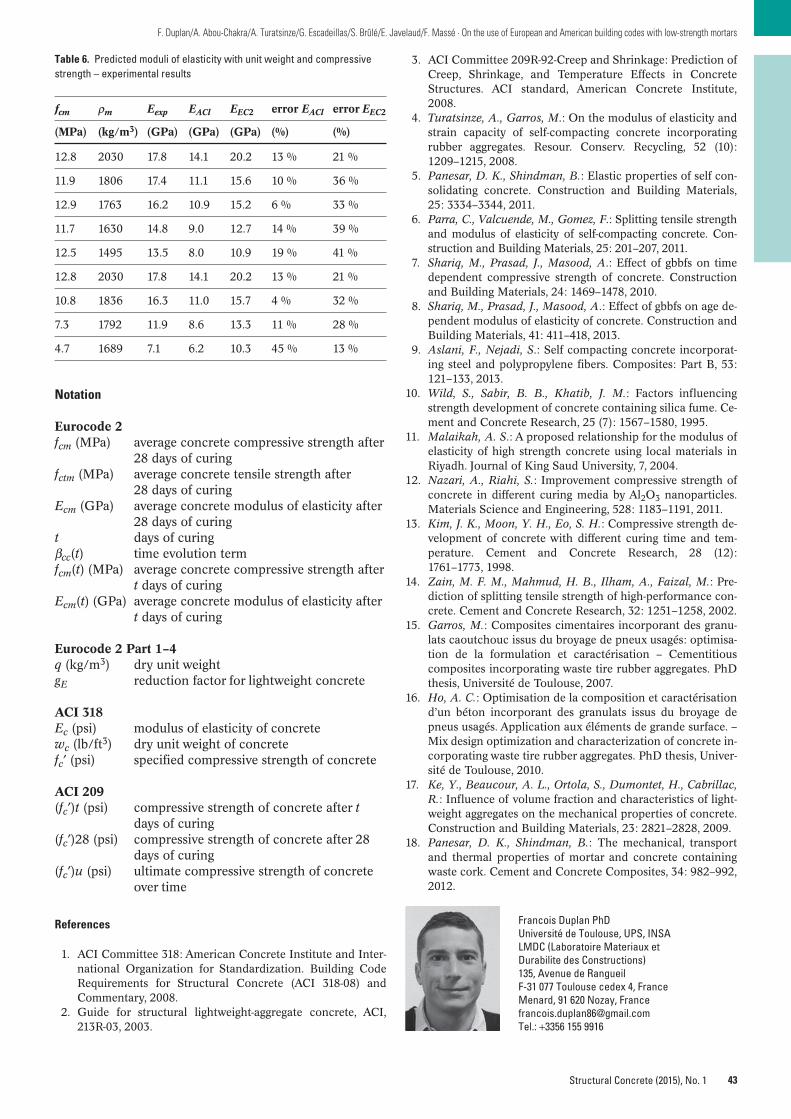
43
F. Duplan/A. Abou-Chakra/A. Turatsinze/G. Escadeillas/S. Brûlé/E. Javelaud/F. Massé · On the use of European and American building codes with low-strength mortars
Structural Concrete (2015), No. 1
Notation
Eurocode 2fcm (MPa) average concrete compressive strength after
28 days of curingfctm (MPa) average concrete tensile strength after
28 days of curingEcm (GPa) average concrete modulus of elasticity after
28 days of curingt days of curingβcc(t) time evolution termfcm(t) (MPa) average concrete compressive strength after
t days of curingEcm(t) (GPa) average concrete modulus of elasticity after
t days of curing
Eurocode 2 Part 1–4q (kg/m3) dry unit weightgE reduction factor for lightweight concrete
ACI 318Ec (psi) modulus of elasticity of concretewc (lb/ft3) dry unit weight of concretefc′ (psi) specified compressive strength of concrete
ACI 209(fc′)t (psi) compressive strength of concrete after t
days of curing(fc′)28 (psi) compressive strength of concrete after 28
days of curing(fc′)u (psi) ultimate compressive strength of concrete
over time
References
1. ACI Committee 318: American Concrete Institute and Inter-national Organization for Standardization. Building CodeRequirements for Structural Concrete (ACI 318-08) andCommentary, 2008.
2. Guide for structural lightweight-aggregate concrete, ACI,213R-03, 2003.
3. ACI Committee 209R-92-Creep and Shrinkage: Prediction ofCreep, Shrinkage, and Temperature Effects in ConcreteStructures. ACI standard, American Concrete Institute,2008.
4. Turatsinze, A., Garros, M.: On the modulus of elasticity andstrain capacity of self-compacting concrete incorporatingrubber aggregates. Resour. Conserv. Recycling, 52 (10):1209–1215, 2008.
5. Panesar, D. K., Shindman, B.: Elastic properties of self con-solidating concrete. Construction and Building Materials,25: 3334–3344, 2011.
6. Parra, C., Valcuende, M., Gomez, F.: Splitting tensile strengthand modulus of elasticity of self-compacting concrete. Con-struction and Building Materials, 25: 201–207, 2011.
7. Shariq, M., Prasad, J., Masood, A.: Effect of gbbfs on timedependent compressive strength of concrete. Constructionand Building Materials, 24: 1469–1478, 2010.
8. Shariq, M., Prasad, J., Masood, A.: Effect of gbbfs on age de-pendent modulus of elasticity of concrete. Construction andBuilding Materials, 41: 411–418, 2013.
9. Aslani, F., Nejadi, S.: Self compacting concrete incorporat-ing steel and polypropylene fibers. Composites: Part B, 53:121–133, 2013.
10. Wild, S., Sabir, B. B., Khatib, J. M.: Factors influencingstrength development of concrete containing silica fume. Ce-ment and Concrete Research, 25 (7): 1567–1580, 1995.
11. Malaikah, A. S.: A proposed relationship for the modulus ofelasticity of high strength concrete using local materials inRiyadh. Journal of King Saud University, 7, 2004.
12. Nazari, A., Riahi, S.: Improvement compressive strength ofconcrete in different curing media by Al2O3 nanoparticles.Materials Science and Engineering, 528: 1183–1191, 2011.
13. Kim, J. K., Moon, Y. H., Eo, S. H.: Compressive strength de-velopment of concrete with different curing time and tem-perature. Cement and Concrete Research, 28 (12):1761–1773, 1998.
14. Zain, M. F. M., Mahmud, H. B., Ilham, A., Faizal, M.: Pre-diction of splitting tensile strength of high-performance con-crete. Cement and Concrete Research, 32: 1251–1258, 2002.
15. Garros, M.: Composites cimentaires incorporant des granu-lats caoutchouc issus du broyage de pneux usagés: optimisa-tion de la formulation et caractérisation – Cementitiouscomposites incorporating waste tire rubber aggregates. PhDthesis, Université de Toulouse, 2007.
16. Ho, A. C.: Optimisation de la composition et caractérisationd’un béton incorporant des granulats issus du broyage depneus usagés. Application aux éléments de grande surface. –Mix design optimization and characterization of concrete in-corporating waste tire rubber aggregates. PhD thesis, Univer-sité de Toulouse, 2010.
17. Ke, Y., Beaucour, A. L., Ortola, S., Dumontet, H., Cabrillac,R.: Influence of volume fraction and characteristics of light-weight aggregates on the mechanical properties of concrete.Construction and Building Materials, 23: 2821–2828, 2009.
18. Panesar, D. K., Shindman, B.: The mechanical, transportand thermal properties of mortar and concrete containingwaste cork. Cement and Concrete Composites, 34: 982–992,2012.
Francois Duplan PhDUniversité de Toulouse, UPS, INSALMDC (Laboratoire Materiaux et Durabilite des Constructions)135, Avenue de RangueilF-31 077 Toulouse cedex 4, FranceMenard, 91 620 Nozay, [email protected].: +3356 155 9916
Table 6. Predicted moduli of elasticity with unit weight and compressivestrength – experimental results
fcm ρm Eexp EACl EEC2 error EACl error EEC2
(MPa) (kg/m3) (GPa) (GPa) (GPa) (%) (%)
12.8 2030 17.8 14.1 20.2 13 % 21 %
11.9 1806 17.4 11.1 15.6 10 % 36 %
12.9 1763 16.2 10.9 15.2 6 % 33 %
11.7 1630 14.8 9.0 12.7 14 % 39 %
12.5 1495 13.5 8.0 10.9 19 % 41 %
12.8 2030 17.8 14.1 20.2 13 % 21 %
10.8 1836 16.3 11.0 15.7 4 % 32 %
7.3 1792 11.9 8.6 13.3 11 % 28 %
4.7 1689 7.1 6.2 10.3 45 % 13 %

44
F. Duplan/A. Abou-Chakra/A. Turatsinze/G. Escadeillas/S. Brûlé/E. Javelaud/F. Massé · On the use of European and American building codes with low-strength mortars
Structural Concrete (2015), No. 1
Ariane Abou-Chakra, Assistant professorUniversité de Toulouse, UPS, INSALMDC (Laboratoire Materiaux et Durabilite des Constructions)135, Avenue de RangueilF-31 077 Toulouse cedex 4, [email protected].: +3356155 9930
Anaclet Turatsinze, ProfessorUniversité de Toulouse, UPS, INSALMDC (Laboratoire Materiaux et Durabilite des Constructions)135, Avenue de RangueilF-31 077 Toulouse cedex 4, [email protected].: +3356155 9934
Gilles Escadeillas, Head of departementUniversité de Toulouse, UPS, INSALMDC (Laboratoire Materiaux et Durabilite des Constructions)135, Avenue de RangueilF-31 077 Toulouse cedex 4, [email protected].: +3356155 7498
Stéphane BrûléMenard, 91 620 [email protected].: +33478513394
Emmanuel JavelaudMenard, 91 620 [email protected].: +33478513394
Frédéric MasséMenard, 150 East Main Street, Suite 500 Carnegie, PA 15106, United [email protected]. : +14126206000
45© 2015 Ernst & Sohn Verlag für Architektur und technische Wissenschaften GmbH & Co. KG, Berlin · Structural Concrete (2015), No. 1
This paper describes the changes to design provisions for em-bedded steel reinforcement in the fib Model Code for ConcreteStructures 2010. The changes introduce new coefficients forsteel grade and clear spacing between bars, and extend therange of concrete strengths covered. The way in which the con-tribution of hooks or anchorages is calculated has been revisedand the contribution of end bearing to laps and anchorages ofcompression bars is recognized. The revised rules represent amove away from a distinction between laps and anchorages perse towards a distinction based on the presence or absence oftransverse pressure perpendicular to the bar axis within the bondlength. The benefits of staggering laps with only a proportion ofbars lapped at a section are also reviewed. Finally, the potentialimpact of lap and anchorage performance on structural robust-ness is discussed, and it is concluded that this can only beachieved if bar yield precedes splitting mode bond failures.
Keywords: fib Model Code, bond, anchorage, lapped joints, hooks and bends
1 Introduction
The fib Model Code for Concrete Structures 2010 [1] waspublished in its final version in 2013. As part of the revi-sion process, fib Task Group 4.5 “Bond Models” under-took a thorough review of the content for bond of embed-ded steel reinforcement, the outcome of which hasresulted in section 6.1 of fib Model Code 2010. This paperreviews the major changes between MC90 [2] and fibModel Code 2010 with the aim of helping users to under-stand the revised rules and the underlying physical basisfor the changes introduced. The scope of the paper is re-stricted to conventional non-coated ribbed reinforcingbars.
The basic expressions for bond strength in the ModelCodes have remained essentially unchanged since MC78[3]. Since then there has been a general increase in thestrengths of both concrete and reinforcement used in con-struction. For example, the characteristic strength of rein-forcement in many European countries was about410 MPa in 1978, but is currently 500 MPa. The CEB Bul-letin on High Performance Concrete [4] recommendedthat the range of concrete grades covered in the 1990
Model Code be extended from the limit of C80/100 thenup to C100/125 now, and that the validity of current rulesfor bond and anchorage should be reconsidered. In addi-tion, the source of many rules in MC90 was unknown andevidence to support them lacking. A rigorous review of theModel Code provisions for bond and anchorage was there-fore considered necessary.
1.1 Basics of bond and anchorage
Bond and anchorage are the terms used to denote thetransfer of force between reinforcement and concrete.Bond is conventionally described as the change in forcealong a bar divided by the (nominal) area of bar surfaceover which this change takes place, Eq. (1). This conceptrepresents a major simplification, however, as most barsproduced today rely on the bearing of ribs rolled onto thesurface of the bar during manufacture to transfer force. Al-though the transfer of force between reinforcement andconcrete depends on adhesion and friction over the wholebar surface at low bond stresses, as the ultimate limit stateis approached, so bond relies increasingly on the bearingof the ribs on the concrete. The definition of Eq. (1) is,nonetheless, a convenient one and is used here:
fb = Δfs · As/πφlb (1)
where:fb average bond stress over length lbΔfs change in bar stress over length lbAs cross-sectional area of barφ nominal diameter of barlb bond length over which Δfs takes place
The simplicity of Eq. (1) can be misleading; the evaluationof bond resistance is complex. MC90 includes no less than10 parameters for the calculation of anchorage or laplength. While there is general agreement on the parame-ters that influence bond resistance, there are inconsisten-cies in the magnitude of the contribution attributed toeach reported by various investigators. The one commonconclusion on which all agree, however, is that bond is nota fundamental property of the bar, as has been asserted inthe past, but is influenced by bar and concrete sectiongeometry, materials characteristics and stress state as wellas the surface characteristics of the steel.
Technical Paper
Bond and anchorage of embedded steelreinforcement in fib Model Code 2010
John Cairns DOI: 10.1002/suco.201400043
* Corresponding author: [email protected]
Submitted for review: 26 May 2014Accepted for publication: 20 July 2014
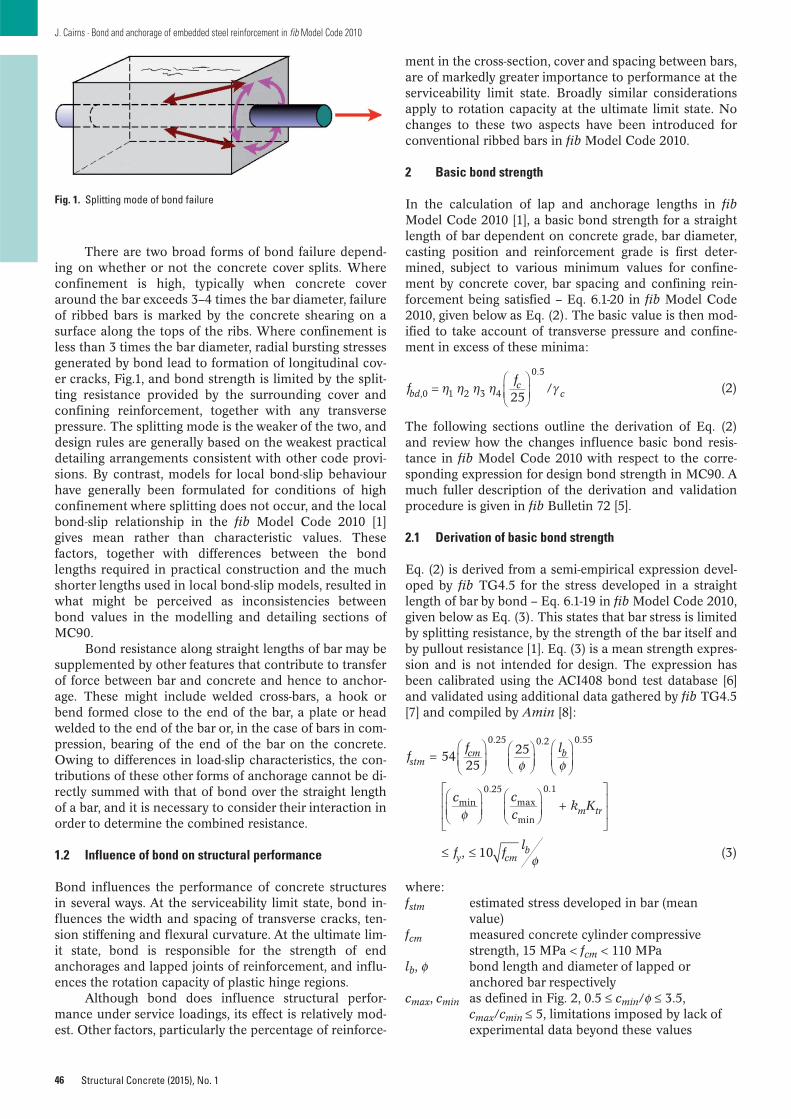
There are two broad forms of bond failure depend-ing on whether or not the concrete cover splits. Whereconfinement is high, typically when concrete coveraround the bar exceeds 3–4 times the bar diameter, failureof ribbed bars is marked by the concrete shearing on asurface along the tops of the ribs. Where confinement isless than 3 times the bar diameter, radial bursting stressesgenerated by bond lead to formation of longitudinal cov-er cracks, Fig.1, and bond strength is limited by the split-ting resistance provided by the surrounding cover andconfining reinforcement, together with any transversepressure. The splitting mode is the weaker of the two, anddesign rules are generally based on the weakest practicaldetailing arrangements consistent with other code provi-sions. By contrast, models for local bond-slip behaviourhave generally been formulated for conditions of highconfinement where splitting does not occur, and the localbond-slip relationship in the fib Model Code 2010 [1]gives mean rather than characteristic values. These factors, together with differences between the bondlengths required in practical construction and the muchshorter lengths used in local bond-slip models, resulted inwhat might be perceived as inconsistencies betweenbond values in the modelling and detailing sections ofMC90.
Bond resistance along straight lengths of bar may besupplemented by other features that contribute to transferof force between bar and concrete and hence to anchor-age. These might include welded cross-bars, a hook orbend formed close to the end of the bar, a plate or headwelded to the end of the bar or, in the case of bars in com-pression, bearing of the end of the bar on the concrete.Owing to differences in load-slip characteristics, the con-tributions of these other forms of anchorage cannot be di-rectly summed with that of bond over the straight lengthof a bar, and it is necessary to consider their interaction inorder to determine the combined resistance.
1.2 Influence of bond on structural performance
Bond influences the performance of concrete structuresin several ways. At the serviceability limit state, bond in-fluences the width and spacing of transverse cracks, ten-sion stiffening and flexural curvature. At the ultimate lim-it state, bond is responsible for the strength of endanchorages and lapped joints of reinforcement, and influ-ences the rotation capacity of plastic hinge regions.
Although bond does influence structural perfor-mance under service loadings, its effect is relatively mod-est. Other factors, particularly the percentage of reinforce-
46
J. Cairns · Bond and anchorage of embedded steel reinforcement in fib Model Code 2010
Structural Concrete (2015), No. 1
ment in the cross-section, cover and spacing between bars,are of markedly greater importance to performance at theserviceability limit state. Broadly similar considerationsapply to rotation capacity at the ultimate limit state. Nochanges to these two aspects have been introduced forconventional ribbed bars in fib Model Code 2010.
2 Basic bond strength
In the calculation of lap and anchorage lengths in fibModel Code 2010 [1], a basic bond strength for a straightlength of bar dependent on concrete grade, bar diameter,casting position and reinforcement grade is first deter-mined, subject to various minimum values for confine-ment by concrete cover, bar spacing and confining rein-forcement being satisfied – Eq. 6.1-20 in fib Model Code2010, given below as Eq. (2). The basic value is then mod-ified to take account of transverse pressure and confine-ment in excess of these minima:
(2)
The following sections outline the derivation of Eq. (2)and review how the changes influence basic bond resis-tance in fib Model Code 2010 with respect to the corre-sponding expression for design bond strength in MC90. Amuch fuller description of the derivation and validationprocedure is given in fib Bulletin 72 [5].
2.1 Derivation of basic bond strength
Eq. (2) is derived from a semi-empirical expression devel-oped by fib TG4.5 for the stress developed in a straightlength of bar by bond – Eq. 6.1-19 in fib Model Code 2010,given below as Eq. (3). This states that bar stress is limitedby splitting resistance, by the strength of the bar itself andby pullout resistance [1]. Eq. (3) is a mean strength expres-sion and is not intended for design. The expression hasbeen calibrated using the ACI408 bond test database [6]and validated using additional data gathered by fib TG4.5[7] and compiled by Amin [8]:
(3)
where:fstm estimated stress developed in bar (mean
value)fcm measured concrete cylinder compressive
strength, 15 MPa < fcm < 110 MPalb, φ bond length and diameter of lapped or
anchored bar respectivelycmax, cmin as defined in Fig. 2, 0.5 ≤ cmin/φ ≤ 3.5,
cmax/cmin ≤ 5, limitations imposed by lack ofexperimental data beyond these values
25/,0 1 2 3 4
0.5
ff
bdc
c
5425
25
, 10
0.25 0.2 0.55
min0.25
max
min
0.1
ff l
c cc
k K
f fl
stmcm b
m tr
y cmb
Fig. 1. Splitting mode of bond failure

47
J. Cairns · Bond and anchorage of embedded steel reinforcement in fib Model Code 2010
Structural Concrete (2015), No. 1
Ktr = nl.ng.Asv/(lb.φ.nb) ≤ 0.05, representing the density oftransverse reinforcement
nt number of legs of confining reinforcementcrossing a potential splitting failure surface ata section
Ast cross-sectional area of one leg of a confiningbar
st longitudinal spacing of confining reinforce-ment
nb number of anchored bars or pairs of lappedbars at potential splitting surface
km “effectiveness factor” for link confinement, tak-en as 12 where a bar is confined by a link pass-ing through an angle of at least 90°
fy yield strength of reinforcement
The coefficient 54 in Eq. (3) has units of MPa. The ratio25/φ is limited to a maximum of 2.0 on the basis of evi-dence in the database, the limit probably reflecting thelesser relative rib area of smaller (i.e. ≤ 12 mm) diameterbars.
Fig. 3 demonstrates that Eq. (3) provides a reason-able fit to test data, marginally better than that achieved byother investigators for confined situations, Table 1b, al-though not quite as good as some alternatives for uncon-fined conditions, Table 1a (data for other investigations[10, 11] is taken from Canbay and Frosch [9]). As confiningreinforcement would be required in all beams and
columns of structural significance, somewhat greater im-portance was placed on this situation when deriving fibModel Code 2010 provisions.
Basic bond strength is initially derived for minimumcover equal to bar diameter, cmax = cmin, and no confiningreinforcement, for which the term in square brackets inEq. (3) has a value of 1.0. Eq. (3) is a mean strength ex-pression, and is first converted into a characteristic ex-pression by multiplying the mean coefficient 54 in Eq. (3)by the characteristic ratio from Table 1b to obtain a simi-lar expression for lower 5 % characteristic values. The re-sulting expression is then rearranged to allow basic bondlength lb,0 to be determined as a function of the bar stressto be anchored fst, Eq. (4):
(4)
Setting fst to the design strength fyd = fyk/γst of grade 500reinforcement and including partial safety coefficients of1.15 and 1.5 for reinforcement and concrete respectivelyleads to Eq. (5):
(5)
Basic bond strength for design is then obtained by insert-ing bond length lb,0/φ, obtained from Eq. (5), into Eq. (6),which leads to Eq. (7):
(6)
(7)
Making allowance for the contribution of minimum trans-verse reinforcement and including a partial safety factor
5001.15
41 2525
73.525
25
,0
1.820.45 0.36
0.45 0.36
l f
f
b c
c
4.,0,0f
f lbk
yd b
1.525
25,0
0.45 0.36
ff
bkc
41 2525,0
1.82 0.45 0.36l f fb st c
Fig. 2. Definition of concrete cover dimensions [1]
0.00
0.50
1.00
1.50
2.00
2.50
0 20 40 60 80 100 120
Ra�
o m
easu
red/
es�
mat
ed st
reng
th
Concrete cylinder compressive strength (MPa)
Laps, confined
Laps, unconfined
Fig. 3. Ratio of measured/calculated bond strength vs. concrete cylinder compressive strength [5]
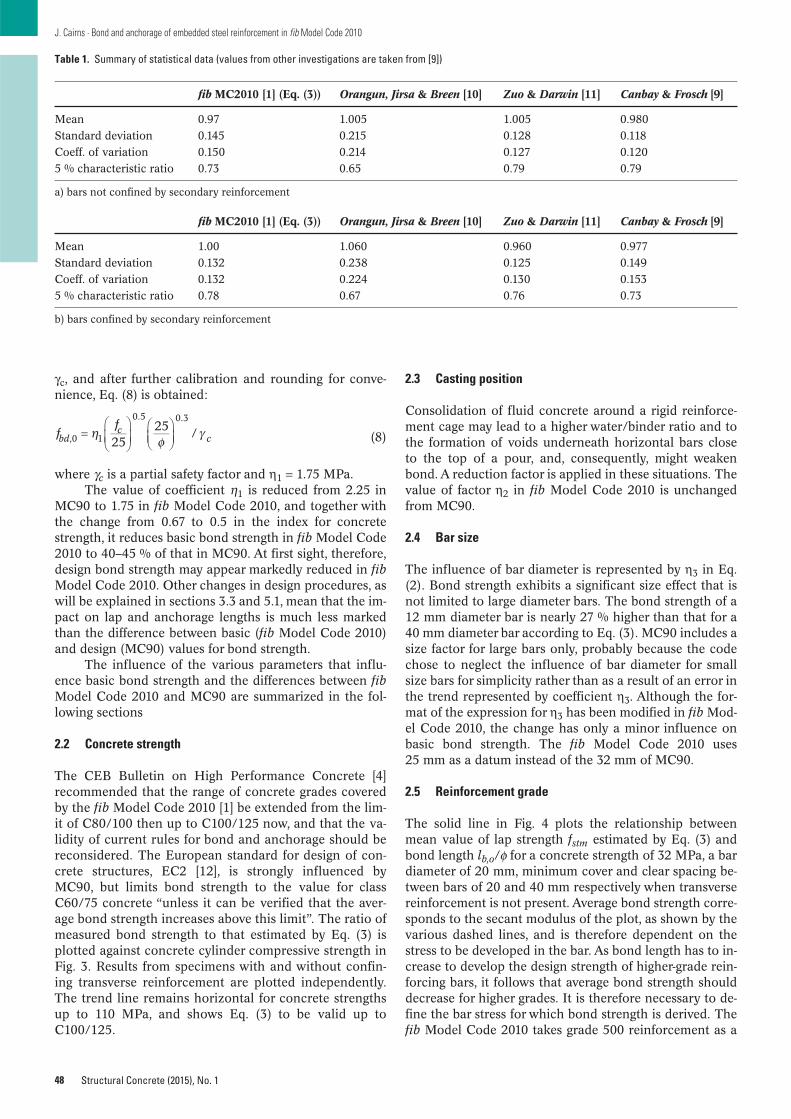
γc, and after further calibration and rounding for conve-nience, Eq. (8) is obtained:
(8)
where γc is a partial safety factor and η1 = 1.75 MPa.The value of coefficient η1 is reduced from 2.25 in
MC90 to 1.75 in fib Model Code 2010, and together withthe change from 0.67 to 0.5 in the index for concretestrength, it reduces basic bond strength in fib Model Code2010 to 40–45 % of that in MC90. At first sight, therefore,design bond strength may appear markedly reduced in fibModel Code 2010. Other changes in design procedures, aswill be explained in sections 3.3 and 5.1, mean that the im-pact on lap and anchorage lengths is much less markedthan the difference between basic (fib Model Code 2010)and design (MC90) values for bond strength.
The influence of the various parameters that influ-ence basic bond strength and the differences between fibModel Code 2010 and MC90 are summarized in the fol-lowing sections
2.2 Concrete strength
The CEB Bulletin on High Performance Concrete [4] recommended that the range of concrete grades coveredby the fib Model Code 2010 [1] be extended from the lim-it of C80/100 then up to C100/125 now, and that the va-lidity of current rules for bond and anchorage should bereconsidered. The European standard for design of con-crete structures, EC2 [12], is strongly influenced byMC90, but limits bond strength to the value for classC60/75 concrete “unless it can be verified that the aver-age bond strength increases above this limit”. The ratio ofmeasured bond strength to that estimated by Eq. (3) isplotted against concrete cylinder compressive strength inFig. 3. Results from specimens with and without confin-ing transverse reinforcement are plotted independently.The trend line remains horizontal for concrete strengthsup to 110 MPa, and shows Eq. (3) to be valid up toC100/125.
2525 /,0 1
0.5 0.3
ff
bdc
c
48
J. Cairns · Bond and anchorage of embedded steel reinforcement in fib Model Code 2010
Structural Concrete (2015), No. 1
2.3 Casting position
Consolidation of fluid concrete around a rigid reinforce-ment cage may lead to a higher water/binder ratio and tothe formation of voids underneath horizontal bars closeto the top of a pour, and, consequently, might weakenbond. A reduction factor is applied in these situations. Thevalue of factor η2 in fib Model Code 2010 is unchangedfrom MC90.
2.4 Bar size
The influence of bar diameter is represented by η3 in Eq.(2). Bond strength exhibits a significant size effect that isnot limited to large diameter bars. The bond strength of a12 mm diameter bar is nearly 27 % higher than that for a40 mm diameter bar according to Eq. (3). MC90 includes asize factor for large bars only, probably because the codechose to neglect the influence of bar diameter for smallsize bars for simplicity rather than as a result of an error inthe trend represented by coefficient η3. Although the for-mat of the expression for η3 has been modified in fib Mod-el Code 2010, the change has only a minor influence onbasic bond strength. The fib Model Code 2010 uses25 mm as a datum instead of the 32 mm of MC90.
2.5 Reinforcement grade
The solid line in Fig. 4 plots the relationship betweenmean value of lap strength fstm estimated by Eq. (3) andbond length lb,o/φ for a concrete strength of 32 MPa, a bardiameter of 20 mm, minimum cover and clear spacing be-tween bars of 20 and 40 mm respectively when transversereinforcement is not present. Average bond strength corre-sponds to the secant modulus of the plot, as shown by thevarious dashed lines, and is therefore dependent on thestress to be developed in the bar. As bond length has to in-crease to develop the design strength of higher-grade rein-forcing bars, it follows that average bond strength shoulddecrease for higher grades. It is therefore necessary to de-fine the bar stress for which bond strength is derived. Thefib Model Code 2010 takes grade 500 reinforcement as a
Table 1. Summary of statistical data (values from other investigations are taken from [9])
fib MC2010 [1] (Eq. (3)) Orangun, Jirsa & Breen [10] Zuo & Darwin [11] Canbay & Frosch [9]
Mean 0.97 1.005 1.005 0.980
Standard deviation 0.145 0.215 0.128 0.118
Coeff. of variation 0.150 0.214 0.127 0.120
5 % characteristic ratio 0.73 0.65 0.79 0.79
a) bars not confined by secondary reinforcement
fib MC2010 [1] (Eq. (3)) Orangun, Jirsa & Breen [10] Zuo & Darwin [11] Canbay & Frosch [9]
Mean 1.00 1.060 0.960 0.977
Standard deviation 0.132 0.238 0.125 0.149
Coeff. of variation 0.132 0.224 0.130 0.153
5 % characteristic ratio 0.78 0.67 0.76 0.73
b) bars confined by secondary reinforcement
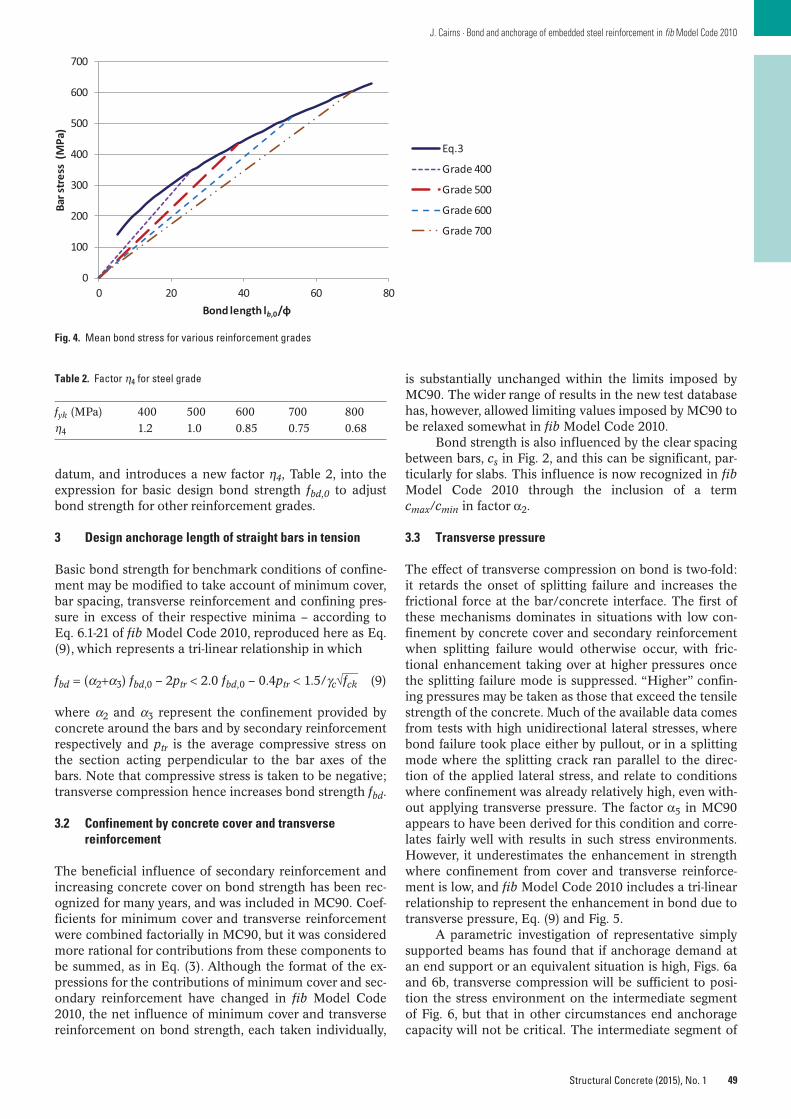
49
J. Cairns · Bond and anchorage of embedded steel reinforcement in fib Model Code 2010
Structural Concrete (2015), No. 1
datum, and introduces a new factor η4, Table 2, into theexpression for basic design bond strength fbd,0 to adjustbond strength for other reinforcement grades.
3 Design anchorage length of straight bars in tension
Basic bond strength for benchmark conditions of confine-ment may be modified to take account of minimum cover,bar spacing, transverse reinforcement and confining pres-sure in excess of their respective minima – according toEq. 6.1-21 of fib Model Code 2010, reproduced here as Eq.(9), which represents a tri-linear relationship in which
fbd = (α2+α3) fbd,0 – 2ptr < 2.0 fbd,0 – 0.4ptr < 1.5/γc√⎯fck (9)
where α2 and α3 represent the confinement provided byconcrete around the bars and by secondary reinforcementrespectively and ptr is the average compressive stress onthe section acting perpendicular to the bar axes of thebars. Note that compressive stress is taken to be negative;transverse compression hence increases bond strength fbd.
3.2 Confinement by concrete cover and transversereinforcement
The beneficial influence of secondary reinforcement andincreasing concrete cover on bond strength has been rec-ognized for many years, and was included in MC90. Coef-ficients for minimum cover and transverse reinforcementwere combined factorially in MC90, but it was consideredmore rational for contributions from these components tobe summed, as in Eq. (3). Although the format of the ex-pressions for the contributions of minimum cover and sec-ondary reinforcement have changed in fib Model Code2010, the net influence of minimum cover and transversereinforcement on bond strength, each taken individually,
is substantially unchanged within the limits imposed byMC90. The wider range of results in the new test databasehas, however, allowed limiting values imposed by MC90 tobe relaxed somewhat in fib Model Code 2010.
Bond strength is also influenced by the clear spacingbetween bars, cs in Fig. 2, and this can be significant, par-ticularly for slabs. This influence is now recognized in fibModel Code 2010 through the inclusion of a termcmax/cmin in factor α2.
3.3 Transverse pressure
The effect of transverse compression on bond is two-fold:it retards the onset of splitting failure and increases thefrictional force at the bar/concrete interface. The first ofthese mechanisms dominates in situations with low con-finement by concrete cover and secondary reinforcementwhen splitting failure would otherwise occur, with fric-tional enhancement taking over at higher pressures oncethe splitting failure mode is suppressed. “Higher” confin-ing pressures may be taken as those that exceed the tensilestrength of the concrete. Much of the available data comesfrom tests with high unidirectional lateral stresses, wherebond failure took place either by pullout, or in a splittingmode where the splitting crack ran parallel to the direc-tion of the applied lateral stress, and relate to conditionswhere confinement was already relatively high, even with-out applying transverse pressure. The factor α5 in MC90appears to have been derived for this condition and corre-lates fairly well with results in such stress environments.However, it underestimates the enhancement in strengthwhere confinement from cover and transverse reinforce-ment is low, and fib Model Code 2010 includes a tri-linearrelationship to represent the enhancement in bond due totransverse pressure, Eq. (9) and Fig. 5.
A parametric investigation of representative simplysupported beams has found that if anchorage demand atan end support or an equivalent situation is high, Figs. 6aand 6b, transverse compression will be sufficient to posi-tion the stress environment on the intermediate segmentof Fig. 6, but that in other circumstances end anchoragecapacity will not be critical. The intermediate segment of
0
100
200
300
400
500
600
700
0 20 40 60 80
Bar s
tres
s (M
Pa)
Bond length lb,0/φ
Eq.3
Grade 400
Grade 500
Grade 600
Grade 700
Fig. 4. Mean bond stress for various reinforcement grades
Table 2. Factor η4 for steel grade
fyk (MPa) 400 500 600 700 800
η4 1.2 1.0 0.85 0.75 0.68

the plot in Fig. 5 takes over at a bond strength corre-sponding to approximately twice the basic value; conse-quently, the design bond resistance at a support would beat least double the basic value (assuming all other para-meters are identical). In these circumstances the apparentreduction in basic bond strength mentioned in section 2.1is negated when determining anchorage length. Thus, infib Model Code 2010, higher bond strengths are permittedat anchorages as a consequence of transverse compres-sion rather than being based on a distinction between lapsand anchorages per se as in MC90.
In other situations where bars must be anchored, e.g.where hogging reinforcement over a continuous support iscurtailed, the enhancement in anchorage resistance pro-vided by transverse compression may not be present, Figs.6c and 6d. At locations such as these there is generally agreater probability of other modes of failure, but there isrelatively little experimental evidence covering such situa-tions. Further work to determine safe bond stresses insuch situations is desirable (see also section 5.1).
4 Hooks, bends and end bearing
The rules in MC90 permit a 30 % reduction in anchoragelength for bars terminating in a hook or bend, subject tocertain restrictions on minimum cover. They were derivedprincipally from numerical analyses of load-slip behaviour
50
J. Cairns · Bond and anchorage of embedded steel reinforcement in fib Model Code 2010
Structural Concrete (2015), No. 1
by Schiessl [13]. By modelling local bond-slip behaviourand bend-slip behaviour measured in tests using the finitedifference approach, Schiessl determined the relationshipbetween the lengths of straight and bent bar which resultin zero slip at the free end of the bar under service loadand a limiting slip of 0.1 mm at ultimate load. The modeldid not represent splitting failure modes, although it is re-ported that this was taken into consideration in otherways. The fib Model Code 2010 adopts a different formatin which the net contribution from a hook or bend is sub-tracted from the stress to be anchored and the straightlength required to carry the difference σsd then calculated– Eq. 6.1-24 of fib Model Code 2010, reproduced here asEq. (10):
σsd = α1 fyd – (Fh/Ab) (10)
where:Fh force developed by a hook, bend or head (Fh = 0 in the
case of straight tension bars)Ab cross-sectional area of barα1 stress to be anchored, with α1 = As,cal/As,ef for anchor-
ages and 1.0 for laps
The change to the format is adopted for several reasons:1. The existing format reduces safety margins as the bar
strength increases. The capacity of a hook or bend isprimarily dependent on the bearing capacity of theconcrete, but the MC90 format implies that the contri-bution varies with reinforcement grade.
2. The introduction of headed bars with a range of dimen-sions means that a single value for the contribution of abar termination is no longer sufficient.
3. Consistency with the strategy adopted for laps and an-chorages of bars in compression (see section 5.2).
This approach permits shorter anchorages at end supportswhen the force to be anchored is below the full designstrength of the reinforcement, although this cannot be ap-plied to laps for the reasons described in section 7.
There is currently no consensus model for anchorageof headed bars. The rules presented in fib Model Code2010 represent a conservative approach based on bars ter-
d) ‘ Top hat’ sectionb) Pilecap
a) Simply supported end c) Half jont
Benefical transverse compression No transverse compression
Fig. 6. Transverse pressure at support
Fig. 5. Enhancement in bond strength due to transverse compression
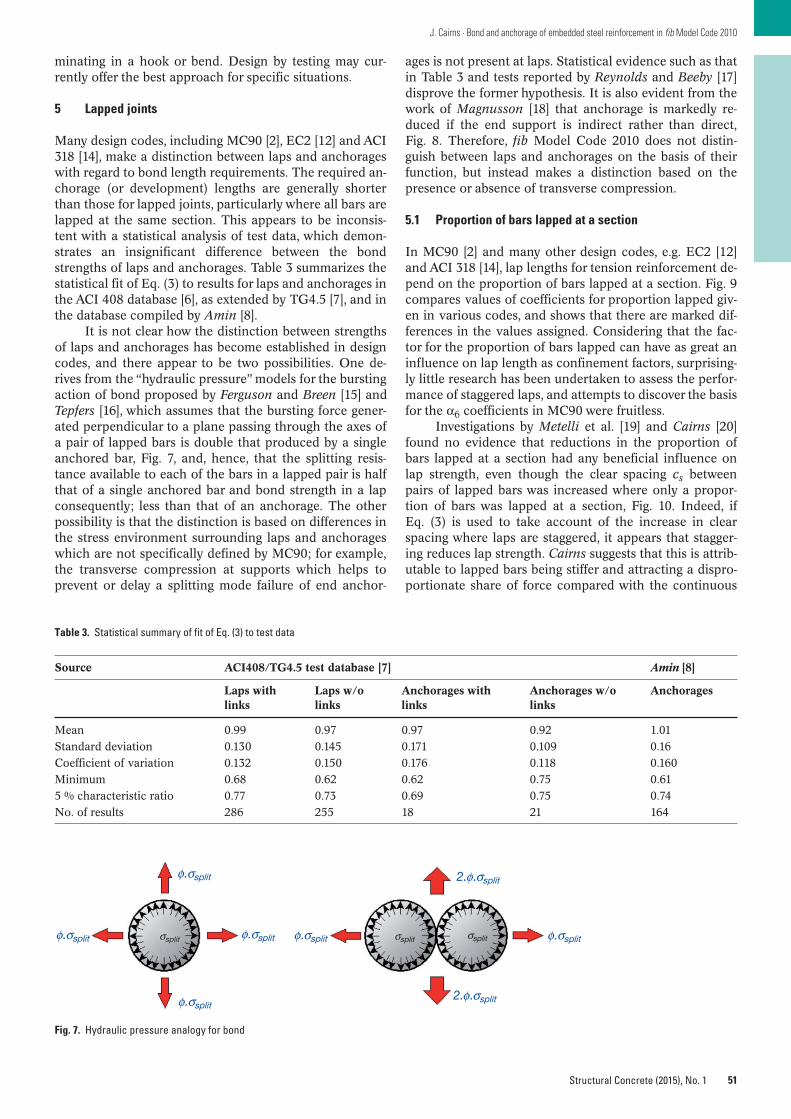
51
J. Cairns · Bond and anchorage of embedded steel reinforcement in fib Model Code 2010
Structural Concrete (2015), No. 1
minating in a hook or bend. Design by testing may cur-rently offer the best approach for specific situations.
5 Lapped joints
Many design codes, including MC90 [2], EC2 [12] and ACI318 [14], make a distinction between laps and anchorageswith regard to bond length requirements. The required an-chorage (or development) lengths are generally shorterthan those for lapped joints, particularly where all bars arelapped at the same section. This appears to be inconsis-tent with a statistical analysis of test data, which demon-strates an insignificant difference between the bondstrengths of laps and anchorages. Table 3 summarizes thestatistical fit of Eq. (3) to results for laps and anchorages inthe ACI 408 database [6], as extended by TG4.5 [7], and inthe database compiled by Amin [8].
It is not clear how the distinction between strengthsof laps and anchorages has become established in designcodes, and there appear to be two possibilities. One de-rives from the “hydraulic pressure” models for the burstingaction of bond proposed by Ferguson and Breen [15] andTepfers [16], which assumes that the bursting force gener-ated perpendicular to a plane passing through the axes ofa pair of lapped bars is double that produced by a singleanchored bar, Fig. 7, and, hence, that the splitting resis-tance available to each of the bars in a lapped pair is halfthat of a single anchored bar and bond strength in a lapconsequently; less than that of an anchorage. The otherpossibility is that the distinction is based on differences inthe stress environment surrounding laps and anchorageswhich are not specifically defined by MC90; for example,the transverse compression at supports which helps toprevent or delay a splitting mode failure of end anchor-
ages is not present at laps. Statistical evidence such as thatin Table 3 and tests reported by Reynolds and Beeby [17]disprove the former hypothesis. It is also evident from thework of Magnusson [18] that anchorage is markedly re-duced if the end support is indirect rather than direct,Fig. 8. Therefore, fib Model Code 2010 does not distin-guish between laps and anchorages on the basis of theirfunction, but instead makes a distinction based on thepresence or absence of transverse compression.
5.1 Proportion of bars lapped at a section
In MC90 [2] and many other design codes, e.g. EC2 [12]and ACI 318 [14], lap lengths for tension reinforcement de-pend on the proportion of bars lapped at a section. Fig. 9compares values of coefficients for proportion lapped giv-en in various codes, and shows that there are marked dif-ferences in the values assigned. Considering that the fac-tor for the proportion of bars lapped can have as great aninfluence on lap length as confinement factors, surprising-ly little research has been undertaken to assess the perfor-mance of staggered laps, and attempts to discover the basisfor the α6 coefficients in MC90 were fruitless.
Investigations by Metelli et al. [19] and Cairns [20]found no evidence that reductions in the proportion ofbars lapped at a section had any beneficial influence onlap strength, even though the clear spacing cs betweenpairs of lapped bars was increased where only a propor-tion of bars was lapped at a section, Fig. 10. Indeed, ifEq. (3) is used to take account of the increase in clearspacing where laps are staggered, it appears that stagger-ing reduces lap strength. Cairns suggests that this is attrib-utable to lapped bars being stiffer and attracting a dispro-portionate share of force compared with the continuous
φ.σsplit
φ.σsplit
φ.σsplit φ.σsplit
φ.σsplit
σsplit σsplit σsplit φ.σsplit
φ σsplit2. .
φ σsplit2. .
Fig. 7. Hydraulic pressure analogy for bond
Table 3. Statistical summary of fit of Eq. (3) to test data
Source ACI408/TG4.5 test database [7] Amin [8]
Laps with Laps w/o Anchorages with Anchorages w/o Anchorageslinks links links links
Mean 0.99 0.97 0.97 0.92 1.01
Standard deviation 0.130 0.145 0.171 0.109 0.16
Coefficient of variation 0.132 0.150 0.176 0.118 0.160
Minimum 0.68 0.62 0.62 0.75 0.61
5 % characteristic ratio 0.77 0.73 0.69 0.75 0.74
No. of results 286 255 18 21 164
bars [20]. In the absence of any evidence to support itscontinued inclusion, the proportion lapped factor α6 givenin MC90 has been discontinued.
As the proportion lapped coefficient α6 in MC90 ef-fectively halved basic bond strength when all bars werelapped at a section, the lower basic bond strength of fibModel Code 2010 mentioned in section 2.1 is largelynegated when determining lap length.
5.2 Compression laps
Eq. (3) for the stress developed by bond over a straightlength of bar is broadly applicable whether lapped bars arein tension or in compression, although there are differ-ences between the two. The major factor is that bearing ofthe ends of compression bars on concrete provides an ad-ditional contribution to load transfer. Several other differ-ences are probably of secondary importance; “in and out”bond stresses in the vicinity of transverse cracks are ab-sent in compression laps, the transfer of force betweenbars is less uniform within a compression lapped joint,splitting resistance of the concrete cover is reduced due tobiaxial tension/compression in the case of compressionlaps and the contribution from links in compression lapsand anchorages is enhanced by increases in their bondstiffness as a result of compression transverse to the planeof the links [21]. These secondary effects are believed to berelatively modest, and analysis of test data has not foundany justification to make explicit allowance for them. The
52
J. Cairns · Bond and anchorage of embedded steel reinforcement in fib Model Code 2010
Structural Concrete (2015), No. 1
contribution of end bearing of the bar in fib Model Code2010 is allowed for by the same approach as that used forhooks and bends, Eq. (10), subject to the condition thatthe distance along the bar axis from the end of the bar tothe nearest face exceeds a specified minimum.
The requirement for multiple links to be located nearthe ends of compression laps has been eased in fib ModelCode 2010 as the available evidence suggests that the additional links are of little benefit. Fig. 11 comparesstrengths of compression laps with and without links
Load
Reaction
Load
Reaction
‘Direct Support’ ‘Indirect Support’
Fig. 8. Direct and indirect support arrangements, Magnusson’s tests [18], redrawn
Fig. 9. Coefficients for proportion lapped in various codes
0
50
100
150
200
250
300
350
400
450
0% 20% 40% 60% 80% 100% 120%
Lap
Str
engt
h (M
Pa)
Propor�on lapped
Fig. 10. How proportion of bars lapped influences strength [20]
0.0
0.2
0.4
0.6
0.8
1.0
1.2
1.4
0 1 2 3
Ra�o
mea
sure
d/es
�mat
ed la
p st
reng
t
No. transverse bars within 3 diameters of ends
Fig. 11. Influence of number of links located close to ends of compressionlap [5]
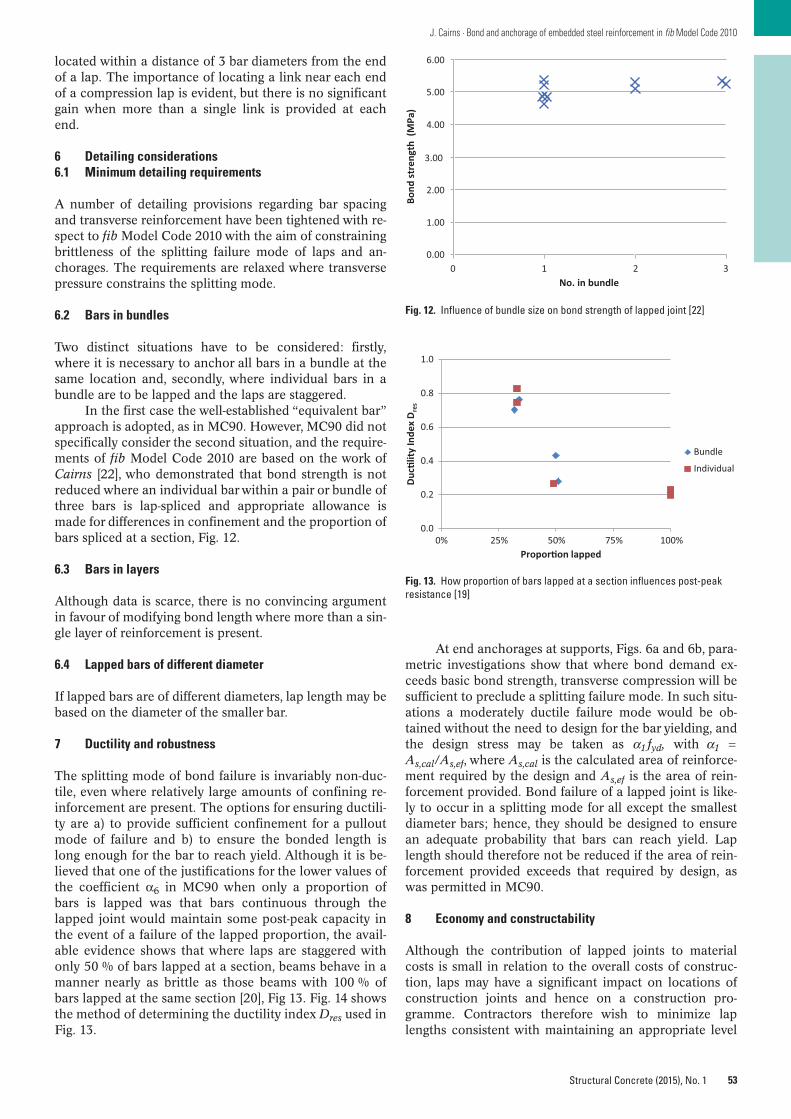
53
J. Cairns · Bond and anchorage of embedded steel reinforcement in fib Model Code 2010
Structural Concrete (2015), No. 1
located within a distance of 3 bar diameters from the endof a lap. The importance of locating a link near each endof a compression lap is evident, but there is no significantgain when more than a single link is provided at each end.
6 Detailing considerations6.1 Minimum detailing requirements
A number of detailing provisions regarding bar spacingand transverse reinforcement have been tightened with re-spect to fib Model Code 2010 with the aim of constrainingbrittleness of the splitting failure mode of laps and an-chorages. The requirements are relaxed where transversepressure constrains the splitting mode.
6.2 Bars in bundles
Two distinct situations have to be considered: firstly,where it is necessary to anchor all bars in a bundle at thesame location and, secondly, where individual bars in abundle are to be lapped and the laps are staggered.
In the first case the well-established “equivalent bar”approach is adopted, as in MC90. However, MC90 did notspecifically consider the second situation, and the require-ments of fib Model Code 2010 are based on the work ofCairns [22], who demonstrated that bond strength is notreduced where an individual bar within a pair or bundle ofthree bars is lap-spliced and appropriate allowance ismade for differences in confinement and the proportion ofbars spliced at a section, Fig. 12.
6.3 Bars in layers
Although data is scarce, there is no convincing argumentin favour of modifying bond length where more than a sin-gle layer of reinforcement is present.
6.4 Lapped bars of different diameter
If lapped bars are of different diameters, lap length may bebased on the diameter of the smaller bar.
7 Ductility and robustness
The splitting mode of bond failure is invariably non-duc-tile, even where relatively large amounts of confining re-inforcement are present. The options for ensuring ductili-ty are a) to provide sufficient confinement for a pulloutmode of failure and b) to ensure the bonded length islong enough for the bar to reach yield. Although it is be-lieved that one of the justifications for the lower values ofthe coefficient α6 in MC90 when only a proportion ofbars is lapped was that bars continuous through thelapped joint would maintain some post-peak capacity inthe event of a failure of the lapped proportion, the avail-able evidence shows that where laps are staggered withonly 50 % of bars lapped at a section, beams behave in amanner nearly as brittle as those beams with 100 % ofbars lapped at the same section [20], Fig 13. Fig. 14 showsthe method of determining the ductility index Dres used inFig. 13.
At end anchorages at supports, Figs. 6a and 6b, para-metric investigations show that where bond demand ex-ceeds basic bond strength, transverse compression will besufficient to preclude a splitting failure mode. In such situ-ations a moderately ductile failure mode would be ob-tained without the need to design for the bar yielding, andthe design stress may be taken as α1.fyd, with α1 =As,cal/As,ef, where As,cal is the calculated area of reinforce-ment required by the design and As,ef is the area of rein-forcement provided. Bond failure of a lapped joint is like-ly to occur in a splitting mode for all except the smallestdiameter bars; hence, they should be designed to ensurean adequate probability that bars can reach yield. Laplength should therefore not be reduced if the area of rein-forcement provided exceeds that required by design, aswas permitted in MC90.
8 Economy and constructability
Although the contribution of lapped joints to materialcosts is small in relation to the overall costs of construc-tion, laps may have a significant impact on locations ofconstruction joints and hence on a construction pro-gramme. Contractors therefore wish to minimize laplengths consistent with maintaining an appropriate level
0 1 2 3
6.00
5.00
4.00
3.00
2.00
1.00
0.00
Bond
str
engt
h (M
Pa)
No. in bundle
Fig. 12. Influence of bundle size on bond strength of lapped joint [22]
0.0
0.2
0.4
0.6
0.8
1.0
0% 25% 50% 75% 100%
Duc
�lit
y In
dex
Dre
s
Propor�on lapped
Bundle
Individual
Fig. 13. How proportion of bars lapped at a section influences post-peakresistance [19]
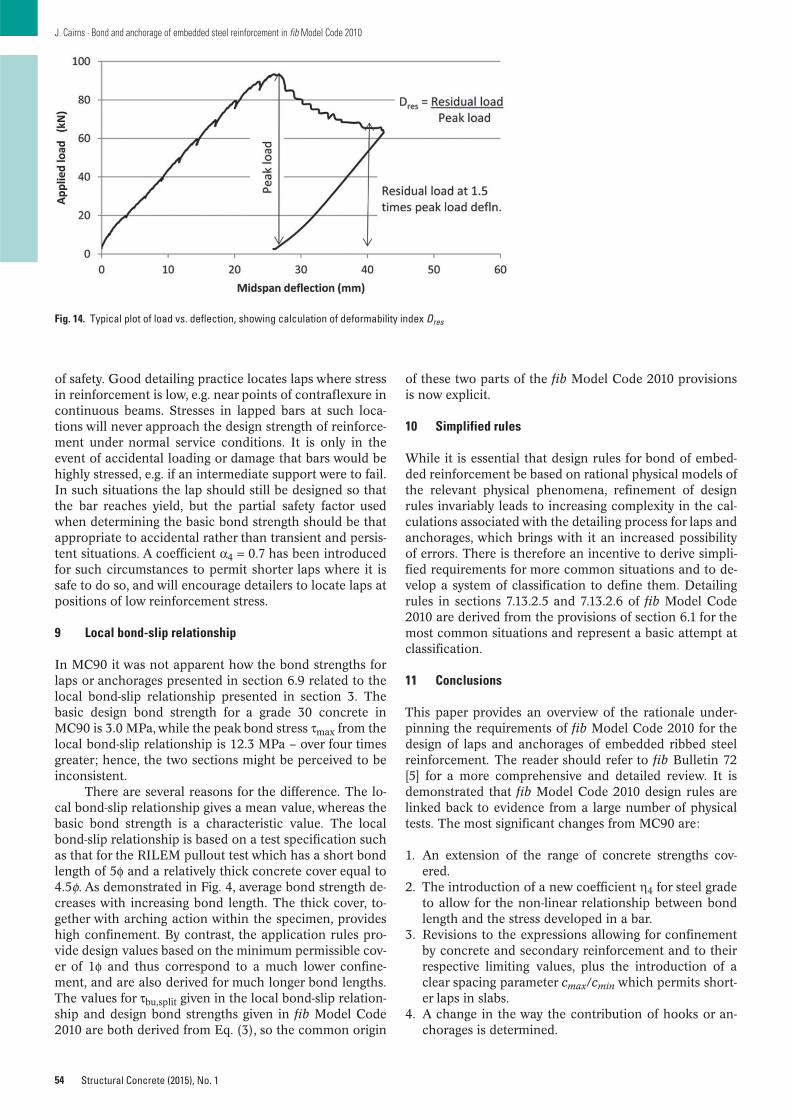
of safety. Good detailing practice locates laps where stressin reinforcement is low, e.g. near points of contraflexure incontinuous beams. Stresses in lapped bars at such loca-tions will never approach the design strength of reinforce-ment under normal service conditions. It is only in theevent of accidental loading or damage that bars would behighly stressed, e.g. if an intermediate support were to fail.In such situations the lap should still be designed so thatthe bar reaches yield, but the partial safety factor usedwhen determining the basic bond strength should be thatappropriate to accidental rather than transient and persis-tent situations. A coefficient α4 = 0.7 has been introducedfor such circumstances to permit shorter laps where it issafe to do so, and will encourage detailers to locate laps atpositions of low reinforcement stress.
9 Local bond-slip relationship
In MC90 it was not apparent how the bond strengths forlaps or anchorages presented in section 6.9 related to thelocal bond-slip relationship presented in section 3. Thebasic design bond strength for a grade 30 concrete inMC90 is 3.0 MPa, while the peak bond stress τmax from thelocal bond-slip relationship is 12.3 MPa – over four timesgreater; hence, the two sections might be perceived to beinconsistent.
There are several reasons for the difference. The lo-cal bond-slip relationship gives a mean value, whereas thebasic bond strength is a characteristic value. The localbond-slip relationship is based on a test specification suchas that for the RILEM pullout test which has a short bondlength of 5φ and a relatively thick concrete cover equal to4.5φ. As demonstrated in Fig. 4, average bond strength de-creases with increasing bond length. The thick cover, to-gether with arching action within the specimen, provideshigh confinement. By contrast, the application rules pro-vide design values based on the minimum permissible cov-er of 1φ and thus correspond to a much lower confine-ment, and are also derived for much longer bond lengths.The values for τbu,split given in the local bond-slip relation-ship and design bond strengths given in fib Model Code2010 are both derived from Eq. (3), so the common origin
54
J. Cairns · Bond and anchorage of embedded steel reinforcement in fib Model Code 2010
Structural Concrete (2015), No. 1
of these two parts of the fib Model Code 2010 provisionsis now explicit.
10 Simplified rules
While it is essential that design rules for bond of embed-ded reinforcement be based on rational physical models ofthe relevant physical phenomena, refinement of designrules invariably leads to increasing complexity in the cal-culations associated with the detailing process for laps andanchorages, which brings with it an increased possibilityof errors. There is therefore an incentive to derive simpli-fied requirements for more common situations and to de-velop a system of classification to define them. Detailingrules in sections 7.13.2.5 and 7.13.2.6 of fib Model Code2010 are derived from the provisions of section 6.1 for themost common situations and represent a basic attempt atclassification.
11 Conclusions
This paper provides an overview of the rationale under-pinning the requirements of fib Model Code 2010 for thedesign of laps and anchorages of embedded ribbed steelreinforcement. The reader should refer to fib Bulletin 72[5] for a more comprehensive and detailed review. It isdemonstrated that fib Model Code 2010 design rules arelinked back to evidence from a large number of physicaltests. The most significant changes from MC90 are:
1. An extension of the range of concrete strengths cov-ered.
2. The introduction of a new coefficient η4 for steel gradeto allow for the non-linear relationship between bondlength and the stress developed in a bar.
3. Revisions to the expressions allowing for confinementby concrete and secondary reinforcement and to theirrespective limiting values, plus the introduction of aclear spacing parameter cmax/cmin which permits short-er laps in slabs.
4. A change in the way the contribution of hooks or an-chorages is determined.
Fig. 14. Typical plot of load vs. deflection, showing calculation of deformability index Dres
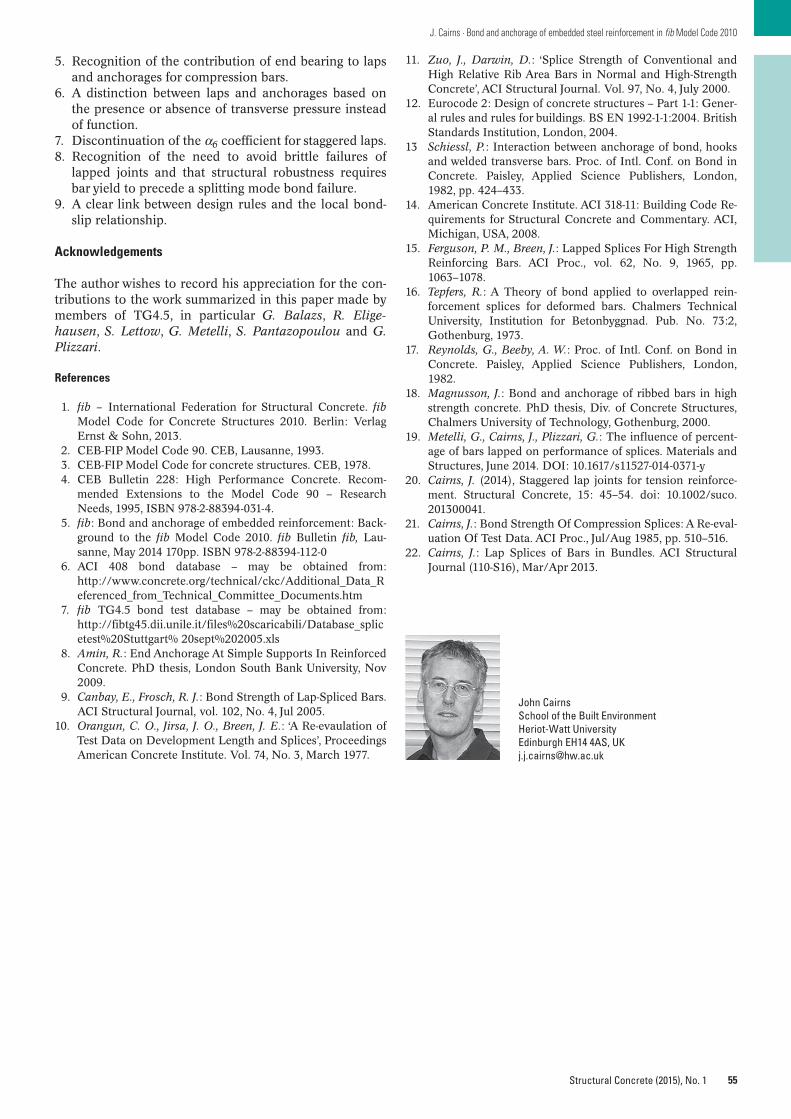
55
J. Cairns · Bond and anchorage of embedded steel reinforcement in fib Model Code 2010
Structural Concrete (2015), No. 1
5. Recognition of the contribution of end bearing to lapsand anchorages for compression bars.
6. A distinction between laps and anchorages based onthe presence or absence of transverse pressure insteadof function.
7. Discontinuation of the α6 coefficient for staggered laps.8. Recognition of the need to avoid brittle failures of
lapped joints and that structural robustness requiresbar yield to precede a splitting mode bond failure.
9. A clear link between design rules and the local bond-slip relationship.
Acknowledgements
The author wishes to record his appreciation for the con-tributions to the work summarized in this paper made bymembers of TG4.5, in particular G. Balazs, R. Elige-hausen, S. Lettow, G. Metelli, S. Pantazopoulou and G.Plizzari.
References
1. fib – International Federation for Structural Concrete. fibModel Code for Concrete Structures 2010. Berlin: VerlagErnst & Sohn, 2013.
2. CEB-FIP Model Code 90. CEB, Lausanne, 1993.3. CEB-FIP Model Code for concrete structures. CEB, 1978.4. CEB Bulletin 228: High Performance Concrete. Recom-
mended Extensions to the Model Code 90 – ResearchNeeds, 1995, ISBN 978-2-88394-031-4.
5. fib: Bond and anchorage of embedded reinforcement: Back-ground to the fib Model Code 2010. fib Bulletin fib, Lau-sanne, May 2014 170pp. ISBN 978-2-88394-112-0
6. ACI 408 bond database – may be obtained from:http://www.concrete.org/technical/ckc/Additional_Data_Referenced_from_Technical_Committee_Documents.htm
7. fib TG4.5 bond test database – may be obtained from:http://fibtg45.dii.unile.it/files%20scaricabili/Database_splicetest%20Stuttgart% 20sept%202005.xls
8. Amin, R.: End Anchorage At Simple Supports In ReinforcedConcrete. PhD thesis, London South Bank University, Nov2009.
9. Canbay, E., Frosch, R. J.: Bond Strength of Lap-Spliced Bars.ACI Structural Journal, vol. 102, No. 4, Jul 2005.
10. Orangun, C. O., Jirsa, J. O., Breen, J. E.: ‘A Re-evaulation ofTest Data on Development Length and Splices’, ProceedingsAmerican Concrete Institute. Vol. 74, No. 3, March 1977.
11. Zuo, J., Darwin, D.: ‘Splice Strength of Conventional andHigh Relative Rib Area Bars in Normal and High-StrengthConcrete’, ACI Structural Journal. Vol. 97, No. 4, July 2000.
12. Eurocode 2: Design of concrete structures – Part 1-1: Gener-al rules and rules for buildings. BS EN 1992-1-1:2004. BritishStandards Institution, London, 2004.
13 Schiessl, P.: Interaction between anchorage of bond, hooksand welded transverse bars. Proc. of Intl. Conf. on Bond inConcrete. Paisley, Applied Science Publishers, London,1982, pp. 424–433.
14. American Concrete Institute. ACI 318-11: Building Code Re-quirements for Structural Concrete and Commentary. ACI,Michigan, USA, 2008.
15. Ferguson, P. M., Breen, J.: Lapped Splices For High StrengthReinforcing Bars. ACI Proc., vol. 62, No. 9, 1965, pp.1063–1078.
16. Tepfers, R.: A Theory of bond applied to overlapped rein-forcement splices for deformed bars. Chalmers TechnicalUniversity, Institution for Betonbyggnad. Pub. No. 73:2,Gothenburg, 1973.
17. Reynolds, G., Beeby, A. W.: Proc. of Intl. Conf. on Bond inConcrete. Paisley, Applied Science Publishers, London,1982.
18. Magnusson, J.: Bond and anchorage of ribbed bars in highstrength concrete. PhD thesis, Div. of Concrete Structures,Chalmers University of Technology, Gothenburg, 2000.
19. Metelli, G., Cairns, J., Plizzari, G.: The influence of percent-age of bars lapped on performance of splices. Materials andStructures, June 2014. DOI: 10.1617/s11527-014-0371-y
20. Cairns, J. (2014), Staggered lap joints for tension reinforce-ment. Structural Concrete, 15: 45–54. doi: 10.1002/suco.201300041.
21. Cairns, J.: Bond Strength Of Compression Splices: A Re-eval-uation Of Test Data. ACI Proc., Jul/Aug 1985, pp. 510–516.
22. Cairns, J.: Lap Splices of Bars in Bundles. ACI StructuralJournal (110-S16), Mar/Apr 2013.
John CairnsSchool of the Built EnvironmentHeriot-Watt UniversityEdinburgh EH14 4AS, [email protected]
56 © 2015 Ernst & Sohn Verlag für Architektur und technische Wissenschaften GmbH & Co. KG, Berlin · Structural Concrete (2015), No. 1
Technical Paper
DOI: 10.1002/suco.201300101
The effect of concrete grade on the bond between 12 mm diame-ter deformed steel bars and recycled aggregate concrete (RAC)has been investigated with the help of 45 pullout tests with con-centric rebar placement for coarse recycled concrete aggregate(RCA) replacement levels of 25, 50, 75 and 100 %. For all the threeconcrete grades, the measured bond-slip relationships indicatesimilar mechanisms of bond resistance in the RAC and the natur-al aggregate (NA) concrete. The most accurate and least conser-vative predictions of the measured bond strengths were obtainedfrom the local bond-slip model in the fib Model Code for ConcreteStructures 2010. Bond strength normalized to fc
(3/4) resulted in animproved match with test data and increased with an increase inthe RCA replacement levels and decreased with an increase incompressive strength. An attempt to explain this behaviour hasbeen sought in terms of brittleness index, an analogous parame-ter from rock mechanics. An empirical bond stress versus slip re-lationship has been proposed for the 12 mm diameter bar and it isconservatively suggested that similar anchorage lengths for thisbar in all three concrete grades can be adopted for the RAC andthe NA concretes.
Keywords: coarse recycled concrete aggregate, replacement level, naturalcoarse aggregate, bond, pullout failure, normalized bond strength
1 Introduction
Traditionally, bond strength between steel bars and con-ventional concrete (made with natural coarse aggregates)has been normalized to the square root of the concretecompressive strength fc [1–7], although this practice hasnot been universal. Zsutty [8], for example, found that fc1/3
provided a better match with data compared with fc1/2.Onthe basis of a review of a large number of bond test resultsof concretes with strengths between 17 and 110 MPa, Dar-win et al. [9] and Zuo and Darwin [10] have reported thatthe effect of concrete grade on splice strength for normal-strength as well as high-strength concrete is more accu-rately represented if the bond strength data are normal-ized to fc1/4. The bond test results of Harajli and Al-Hajj[11] show that as the compressive strength of concrete in-creased from about 28 MPa to about 55 MPa, the local
splice strength increased in proportion to fcp, with p > 1/2.
These authors found that for all the parameters they inves-tigated, whenever the local splice strengths were normal-ized to fc1/2, the results of high-strength concrete wereabout 23 % higher than those of normal-strength concrete.On the other hand, according to Azizinamini et al. [12],the normalized average bond strength at failure in high-strength concrete reduces relative to normal-strength con-crete, and this reduction in bond strength increases withan increase in splice length. In contrast to the results ofAzizinamini et al. [12], Esfahani and Rangan [13] foundthat the average bond stress at failure normalized with re-spect to fc1/2 is higher for high-strength concrete than fornormal-strength concrete. According to the literature, fc1/2
does not accurately represent the effect of concretestrength on bond, and ACI Committee 408 [14] states that“when bond strengths are normalized with respect to fc1/2,the effect of concrete strength is exaggerated, resulting inan overestimation of bond strength for higher strengthconcretes”.
The brief review presented above indicates the com-plexity of the relationship between local bond strength ofdeformed steel bars and grade of concrete (made with nat-ural coarse aggregates). In recent years, considerable ef-fort has been directed towards investigating the possibilityof using coarse recycled concrete aggregate (RCA) as asubstitute for natural coarse aggregate (NCA) in concreteconstruction. Although the bond behaviour between NCAconcrete and steel rebars has been extensively studied[14–16], only a few investigations have looked at the bondbetween RCA concrete and steel reinforcement [17–21].This situation is further compounded by the fact that evenless information is available in the literature on the bondstrength of deformed steel bars embedded in high-strengthrecycled aggregate concrete (RAC). Since bond behaviouris heavily influenced by the tensile strength and fractureenergy of concrete, which besides other parameters alsodepends upon the characteristics of the coarse aggregatesin the concrete, there is the possibility that bond strengthand its variation with concrete grade in RAC made withthe relatively porous and softer coarse recycled concreteaggregates may be significantly different or even inferior tothat of conventional concrete made with natural coarseaggregates.
The objective of this experimental study has been toinvestigate the effect of the grade of recycled aggregate
Bond behaviour of normal- and high-strengthrecycled aggregate concrete
M. John Robert PrinceBhupinder Singh*
DOI: 10.1002/suco.201300101
* Corresponding author: [email protected]
Submitted for review: 11 December 2013Revised: 7 May 2014Accepted for publication: 28 May 2014
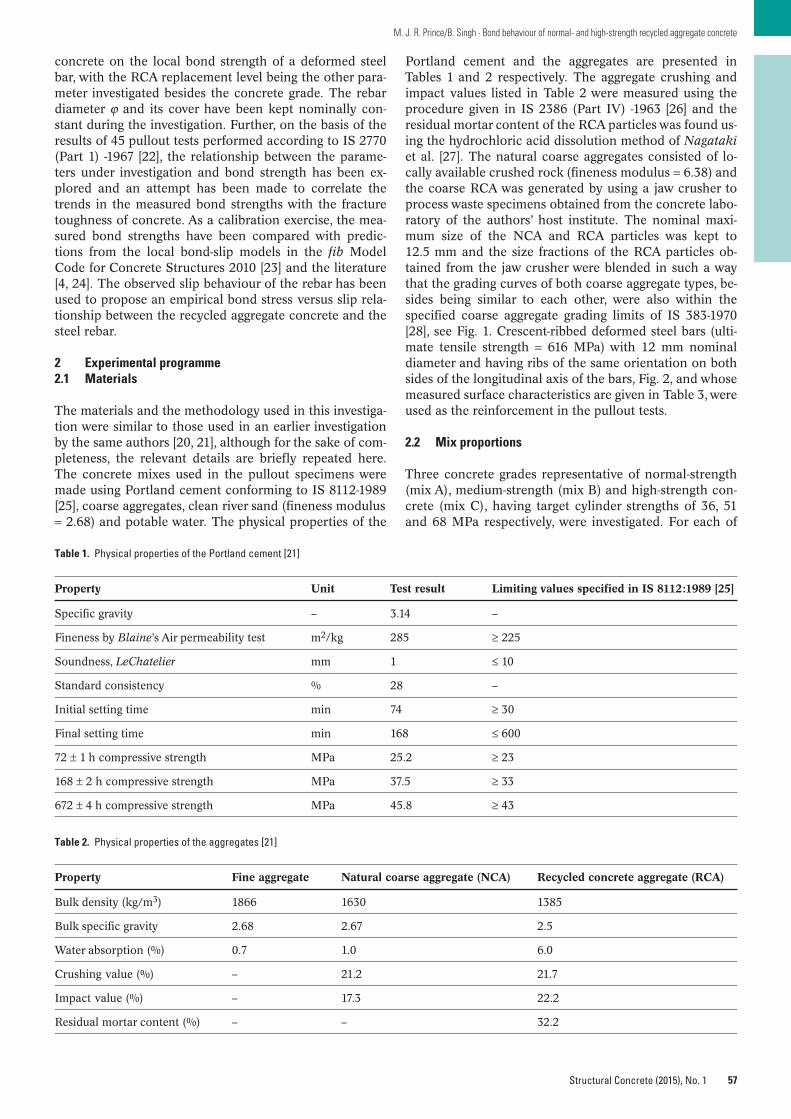
57
M. J. R. Prince/B. Singh · Bond behaviour of normal- and high-strength recycled aggregate concrete
Structural Concrete (2015), No. 1
concrete on the local bond strength of a deformed steelbar, with the RCA replacement level being the other para-meter investigated besides the concrete grade. The rebardiameter ϕ and its cover have been kept nominally con-stant during the investigation. Further, on the basis of theresults of 45 pullout tests performed according to IS 2770(Part 1) -1967 [22], the relationship between the parame-ters under investigation and bond strength has been ex-plored and an attempt has been made to correlate thetrends in the measured bond strengths with the fracturetoughness of concrete. As a calibration exercise, the mea-sured bond strengths have been compared with predic-tions from the local bond-slip models in the fib ModelCode for Concrete Structures 2010 [23] and the literature[4, 24]. The observed slip behaviour of the rebar has beenused to propose an empirical bond stress versus slip rela-tionship between the recycled aggregate concrete and thesteel rebar.
2 Experimental programme2.1 Materials
The materials and the methodology used in this investiga-tion were similar to those used in an earlier investigationby the same authors [20, 21], although for the sake of com-pleteness, the relevant details are briefly repeated here.The concrete mixes used in the pullout specimens weremade using Portland cement conforming to IS 8112-1989[25], coarse aggregates, clean river sand (fineness modulus= 2.68) and potable water. The physical properties of the
Portland cement and the aggregates are presented in Tables 1 and 2 respectively. The aggregate crushing andimpact values listed in Table 2 were measured using theprocedure given in IS 2386 (Part IV) -1963 [26] and theresidual mortar content of the RCA particles was found us-ing the hydrochloric acid dissolution method of Nagatakiet al. [27]. The natural coarse aggregates consisted of lo-cally available crushed rock (fineness modulus = 6.38) andthe coarse RCA was generated by using a jaw crusher toprocess waste specimens obtained from the concrete labo-ratory of the authors’ host institute. The nominal maxi-mum size of the NCA and RCA particles was kept to12.5 mm and the size fractions of the RCA particles ob-tained from the jaw crusher were blended in such a waythat the grading curves of both coarse aggregate types, be-sides being similar to each other, were also within thespecified coarse aggregate grading limits of IS 383-1970[28], see Fig. 1. Crescent-ribbed deformed steel bars (ulti-mate tensile strength = 616 MPa) with 12 mm nominal diameter and having ribs of the same orientation on bothsides of the longitudinal axis of the bars, Fig. 2, and whosemeasured surface characteristics are given in Table 3, wereused as the reinforcement in the pullout tests.
2.2 Mix proportions
Three concrete grades representative of normal-strength(mix A), medium-strength (mix B) and high-strength con-crete (mix C), having target cylinder strengths of 36, 51and 68 MPa respectively, were investigated. For each of
Table 1. Physical properties of the Portland cement [21]
Property Unit Test result Limiting values specified in IS 8112:1989 [25]
Specific gravity – 3.14 –
Fineness by Blaine’s Air permeability test m2/kg 285 ≥ 225
Soundness, LeChatelier mm 1 ≤ 10
Standard consistency % 28 –
Initial setting time min 74 ≥ 30
Final setting time min 168 ≤ 600
72 ± 1 h compressive strength MPa 25.2 ≥ 23
168 ± 2 h compressive strength MPa 37.5 ≥ 33
672 ± 4 h compressive strength MPa 45.8 ≥ 43
Table 2. Physical properties of the aggregates [21]
Property Fine aggregate Natural coarse aggregate (NCA) Recycled concrete aggregate (RCA)
Bulk density (kg/m3) 1866 1630 1385
Bulk specific gravity 2.68 2.67 2.5
Water absorption (%) 0.7 1.0 6.0
Crushing value (%) – 21.2 21.7
Impact value (%) – 17.3 22.2
Residual mortar content (%) – – 32.2
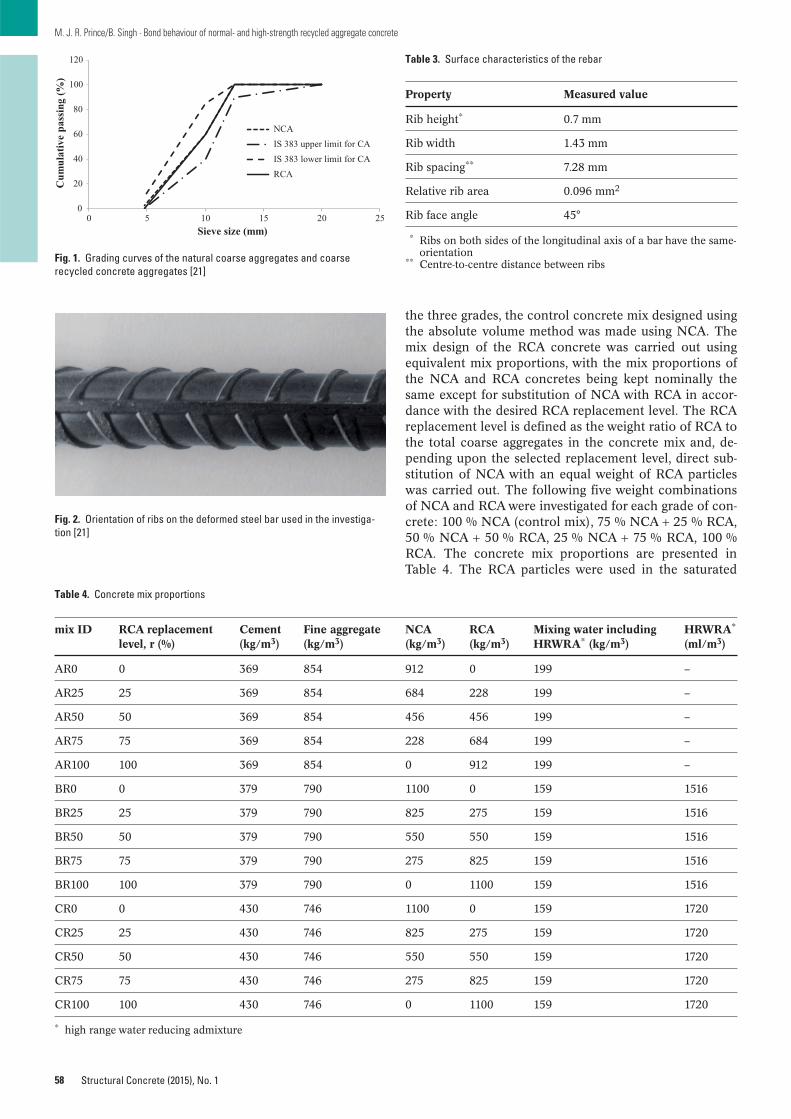
58
M. J. R. Prince/B. Singh · Bond behaviour of normal- and high-strength recycled aggregate concrete
Structural Concrete (2015), No. 1
the three grades, the control concrete mix designed usingthe absolute volume method was made using NCA. Themix design of the RCA concrete was carried out usingequivalent mix proportions, with the mix proportions ofthe NCA and RCA concretes being kept nominally thesame except for substitution of NCA with RCA in accor-dance with the desired RCA replacement level. The RCAreplacement level is defined as the weight ratio of RCA tothe total coarse aggregates in the concrete mix and, de-pending upon the selected replacement level, direct sub-stitution of NCA with an equal weight of RCA particleswas carried out. The following five weight combinationsof NCA and RCA were investigated for each grade of con-crete: 100 % NCA (control mix), 75 % NCA + 25 % RCA,50 % NCA + 50 % RCA, 25 % NCA + 75 % RCA, 100 %RCA. The concrete mix proportions are presented inTable 4. The RCA particles were used in the saturated
0
20
40
60
80
100
120
0 5 10 15 20 25
Cum
ulat
ive
pass
ing
(%)
Sieve size (mm)
NCAIS 383 upper limit for CAIS 383 lower limit for CARCA
Fig. 1. Grading curves of the natural coarse aggregates and coarse recycled concrete aggregates [21]
Fig. 2. Orientation of ribs on the deformed steel bar used in the investiga-tion [21]
Table 3. Surface characteristics of the rebar
Property Measured value
Rib height* 0.7 mm
Rib width 1.43 mm
Rib spacing** 7.28 mm
Relative rib area 0.096 mm2
Rib face angle 45°
** Ribs on both sides of the longitudinal axis of a bar have the same-orientation
** Centre-to-centre distance between ribs
Table 4. Concrete mix proportions
mix ID RCA replacement Cement Fine aggregate NCA RCA Mixing water including HRWRA*
level, r (%) (kg/m3) (kg/m3) (kg/m3) (kg/m3) HRWRA* (kg/m3) (ml/m3)
AR0 0 369 854 912 0 199 –
AR25 25 369 854 684 228 199 –
AR50 50 369 854 456 456 199 –
AR75 75 369 854 228 684 199 –
AR100 100 369 854 0 912 199 –
BR0 0 379 790 1100 0 159 1516
BR25 25 379 790 825 275 159 1516
BR50 50 379 790 550 550 159 1516
BR75 75 379 790 275 825 159 1516
BR100 100 379 790 0 1100 159 1516
CR0 0 430 746 1100 0 159 1720
CR25 25 430 746 825 275 159 1720
CR50 50 430 746 550 550 159 1720
CR75 75 430 746 275 825 159 1720
CR100 100 430 746 0 1100 159 1720
* high range water reducing admixture

59
M. J. R. Prince/B. Singh · Bond behaviour of normal- and high-strength recycled aggregate concrete
Structural Concrete (2015), No. 1
Tabl
e 5.
Expe
rim
enta
l res
ults
of p
ullo
ut s
peci
men
s (r
epor
ted
valu
es a
re a
vera
ges
of m
easu
red
resu
lts o
f thr
ee n
omin
ally
iden
tical
rep
licat
e sp
ecim
ens)
Spec
imen
ID
*C
ylin
der
com
pre
ssiv
e In
itia
l sl
um
pSplitt
ing
tensi
le
Ult
imat
e bo
nd
Coe
ffic
ient
Unlo
aded
end s
lip
Bri
ttle
nes
s in
dex
Nor
mal
ized
bon
d
stre
ngt
h o
f co
ncr
ete,
st
rengt
h o
f co
ncr
ete,
st
ress
, fbu
of v
aria
tion
, at
ult
imat
e lo
ad, s
ust
rengt
h, f
bun
f c(M
Pa)
(mm
)f c
t,sp
(MP
a)(M
Pa)
f bu
(%)
(mm
)(M
Pa(
3/4)
)
A12
R0
36.9
170
2.83
18.6
84.
390.
561
13.0
41.
25
A12
R25
28.8
870
2.96
19.5
41.
770.
651
9.76
1.57
A12
R50
24.0
465
2.99
18.8
73.
840.
657
8.04
1.74
A12
R75
26.1
680
2.85
19.0
115
.17
0.71
09.
181.
64
A12
R10
024
.71
523.
3419
.11
3.01
0.63
67.
401.
72
B12
R0
51.1
470
3.74
19.7
87.
230.
456
13.6
71.
03
B12
R25
46.7
060
3.87
20.3
88.
740.
475
12.0
71.
14
B12
R50
41.9
640
3.80
16.9
110
.18
0.43
211
.04
1.03
B12
R75
36.9
755
3.81
21.1
910
.55
0.54
39.
701.
41
B12
R10
035
.58
454.
2319
.56
6.88
0.49
78.
411.
34
C12
R0
68.6
570
4.47
26.0
87.
120.
464
15.3
61.
09
C12
R25
65.6
060
4.79
26.1
99.
480.
481
13.7
01.
14
C12
R50
57.5
435
4.89
23.4
810
.52
0.41
811
.77
1.12
C12
R75
54.2
040
4.89
22.6
211
.04
0.39
411
.08
1.13
C12
R10
050
.30
455.
3122
.12
9.44
0.44
39.
471.
17
* S
pec
imen
ID
: T
he
firs
t le
tter
repre
sen
ts c
on
cret
e gr
ade
(A: n
orm
al-s
tren
gth
, B: m
ediu
m-s
tren
gth
, C: h
igh
-str
engt
h),
th
e n
ext
two n
um
eral
s re
pre
sen
t th
e n
om
inal
reb
ar d
iam
eter
(12
mm
) an
d t
he
rem
ain
-in
g ch
arac
ters
rep
rese
nt
the
RC
A r
epla
cem
ent
leve
ls (
0: 0
%; 25
: 25
%; 50
: 50
%; 75
: 75
% a
nd 1
00: 10
0 %
).N
ote
: P
ullout
failure
in
duce
d b
y th
rough
-splitt
ing
was
obs
erve
d in
all t
he
spec
imen
s.
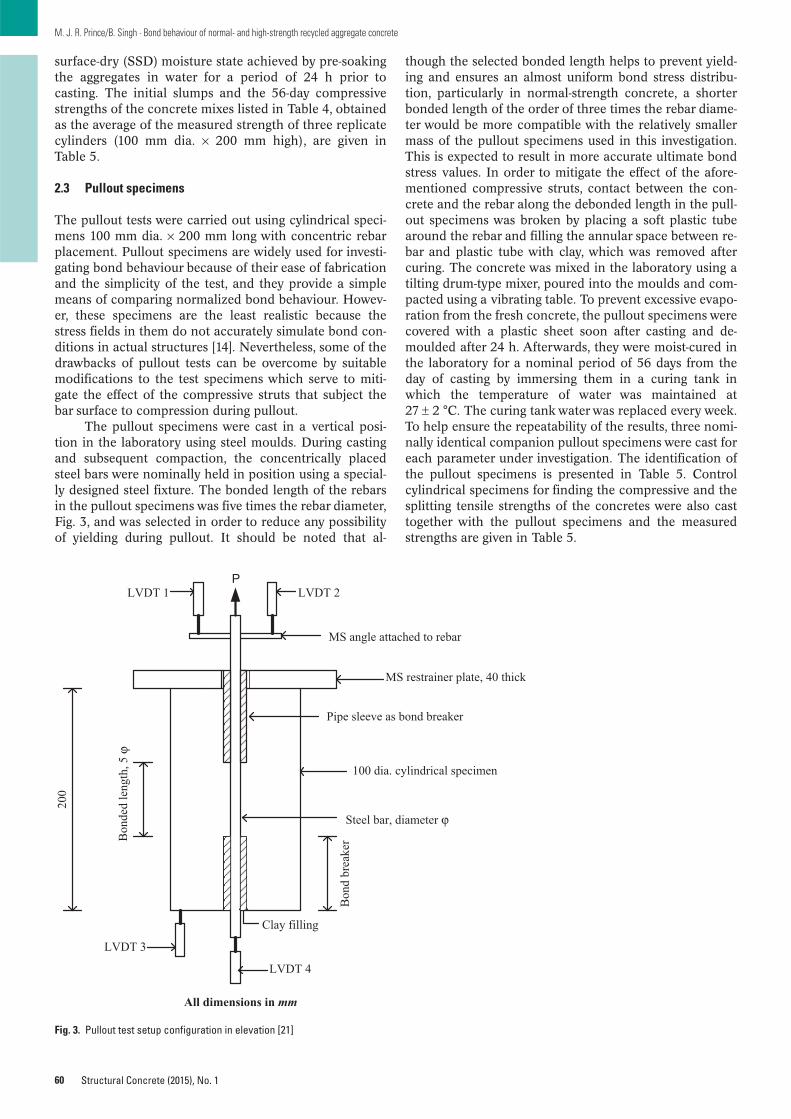
60
M. J. R. Prince/B. Singh · Bond behaviour of normal- and high-strength recycled aggregate concrete
Structural Concrete (2015), No. 1
surface-dry (SSD) moisture state achieved by pre-soakingthe aggregates in water for a period of 24 h prior to casting. The initial slumps and the 56-day compressivestrengths of the concrete mixes listed in Table 4, obtainedas the average of the measured strength of three replicatecylinders (100 mm dia. × 200 mm high), are given inTable 5.
2.3 Pullout specimens
The pullout tests were carried out using cylindrical speci-mens 100 mm dia. × 200 mm long with concentric rebarplacement. Pullout specimens are widely used for investi-gating bond behaviour because of their ease of fabricationand the simplicity of the test, and they provide a simplemeans of comparing normalized bond behaviour. Howev-er, these specimens are the least realistic because thestress fields in them do not accurately simulate bond con-ditions in actual structures [14]. Nevertheless, some of thedrawbacks of pullout tests can be overcome by suitablemodifications to the test specimens which serve to miti-gate the effect of the compressive struts that subject thebar surface to compression during pullout.
The pullout specimens were cast in a vertical posi-tion in the laboratory using steel moulds. During castingand subsequent compaction, the concentrically placedsteel bars were nominally held in position using a special-ly designed steel fixture. The bonded length of the rebarsin the pullout specimens was five times the rebar diameter,Fig. 3, and was selected in order to reduce any possibilityof yielding during pullout. It should be noted that al-
though the selected bonded length helps to prevent yield-ing and ensures an almost uniform bond stress distribu-tion, particularly in normal-strength concrete, a shorterbonded length of the order of three times the rebar diame-ter would be more compatible with the relatively smallermass of the pullout specimens used in this investigation.This is expected to result in more accurate ultimate bondstress values. In order to mitigate the effect of the afore-mentioned compressive struts, contact between the con-crete and the rebar along the debonded length in the pull-out specimens was broken by placing a soft plastic tubearound the rebar and filling the annular space between re-bar and plastic tube with clay, which was removed aftercuring. The concrete was mixed in the laboratory using atilting drum-type mixer, poured into the moulds and com-pacted using a vibrating table. To prevent excessive evapo-ration from the fresh concrete, the pullout specimens werecovered with a plastic sheet soon after casting and de-moulded after 24 h. Afterwards, they were moist-cured inthe laboratory for a nominal period of 56 days from theday of casting by immersing them in a curing tank inwhich the temperature of water was maintained at27 ± 2 °C. The curing tank water was replaced every week.To help ensure the repeatability of the results, three nomi-nally identical companion pullout specimens were cast foreach parameter under investigation. The identification ofthe pullout specimens is presented in Table 5. Controlcylindrical specimens for finding the compressive and thesplitting tensile strengths of the concretes were also casttogether with the pullout specimens and the measuredstrengths are given in Table 5.
LVDT 2P
LVDT 1
MS angle attached to rebar
MS restrainer plate, 40 thick
100 dia. cylindrical specimen
Pipe sleeve as bond breaker
Steel bar, diameter ϕ
Bon
d br
eake
r
htgnel dednoB
, 5 ϕ
LVDT 3
LVDT 4
Clay filling
200
All dimensions in mm
Fig. 3. Pullout test setup configuration in elevation [21]
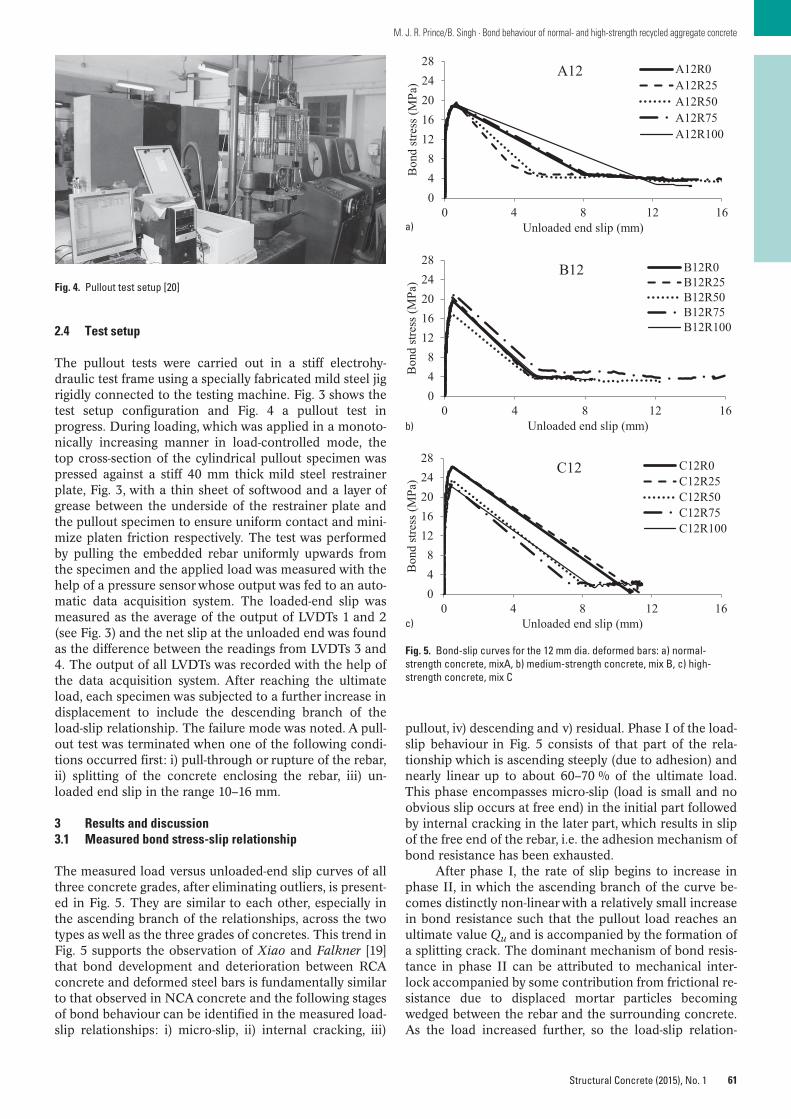
61
M. J. R. Prince/B. Singh · Bond behaviour of normal- and high-strength recycled aggregate concrete
Structural Concrete (2015), No. 1
2.4 Test setup
The pullout tests were carried out in a stiff electrohy-draulic test frame using a specially fabricated mild steel jigrigidly connected to the testing machine. Fig. 3 shows thetest setup configuration and Fig. 4 a pullout test inprogress. During loading, which was applied in a monoto-nically increasing manner in load-controlled mode, thetop cross-section of the cylindrical pullout specimen waspressed against a stiff 40 mm thick mild steel restrainerplate, Fig. 3, with a thin sheet of softwood and a layer ofgrease between the underside of the restrainer plate andthe pullout specimen to ensure uniform contact and mini-mize platen friction respectively. The test was performedby pulling the embedded rebar uniformly upwards fromthe specimen and the applied load was measured with thehelp of a pressure sensor whose output was fed to an auto-matic data acquisition system. The loaded-end slip wasmeasured as the average of the output of LVDTs 1 and 2(see Fig. 3) and the net slip at the unloaded end was foundas the difference between the readings from LVDTs 3 and4. The output of all LVDTs was recorded with the help ofthe data acquisition system. After reaching the ultimateload, each specimen was subjected to a further increase indisplacement to include the descending branch of theload-slip relationship. The failure mode was noted. A pull-out test was terminated when one of the following condi-tions occurred first: i) pull-through or rupture of the rebar,ii) splitting of the concrete enclosing the rebar, iii) un-loaded end slip in the range 10–16 mm.
3 Results and discussion3.1 Measured bond stress-slip relationship
The measured load versus unloaded-end slip curves of allthree concrete grades, after eliminating outliers, is present-ed in Fig. 5. They are similar to each other, especially inthe ascending branch of the relationships, across the twotypes as well as the three grades of concretes. This trend inFig. 5 supports the observation of Xiao and Falkner [19]that bond development and deterioration between RCAconcrete and deformed steel bars is fundamentally similarto that observed in NCA concrete and the following stagesof bond behaviour can be identified in the measured load-slip relationships: i) micro-slip, ii) internal cracking, iii)
pullout, iv) descending and v) residual. Phase I of the load-slip behaviour in Fig. 5 consists of that part of the rela-tionship which is ascending steeply (due to adhesion) andnearly linear up to about 60–70 % of the ultimate load.This phase encompasses micro-slip (load is small and noobvious slip occurs at free end) in the initial part followedby internal cracking in the later part, which results in slipof the free end of the rebar, i.e. the adhesion mechanism ofbond resistance has been exhausted.
After phase I, the rate of slip begins to increase inphase II, in which the ascending branch of the curve be-comes distinctly non-linear with a relatively small increasein bond resistance such that the pullout load reaches anultimate value Qu and is accompanied by the formation ofa splitting crack. The dominant mechanism of bond resis-tance in phase II can be attributed to mechanical inter-lock accompanied by some contribution from frictional re-sistance due to displaced mortar particles becomingwedged between the rebar and the surrounding concrete.As the load increased further, so the load-slip relation-
Fig. 4. Pullout test setup [20]
048
1216202428
0 4 8 12 16
Bon
d st
ress
(MPa
)
Unloaded end slip (mm)
A12 A12R0A12R25A12R50A12R75A12R100
048
1216202428
0 4 8 12 16B
ond
stre
ss (M
Pa)
Unloaded end slip (mm)
B12 B12R0B12R25B12R50B12R75B12R100
048
1216202428
0 4 8 12 16
Bon
d st
ress
(MPa
)
Unloaded end slip (mm)
C12 C12R0C12R25C12R50C12R75C12R100
Fig. 5. Bond-slip curves for the 12 mm dia. deformed bars: a) normal-strength concrete, mixA, b) medium-strength concrete, mix B, c) high-strength concrete, mix C
a)
b)
c)
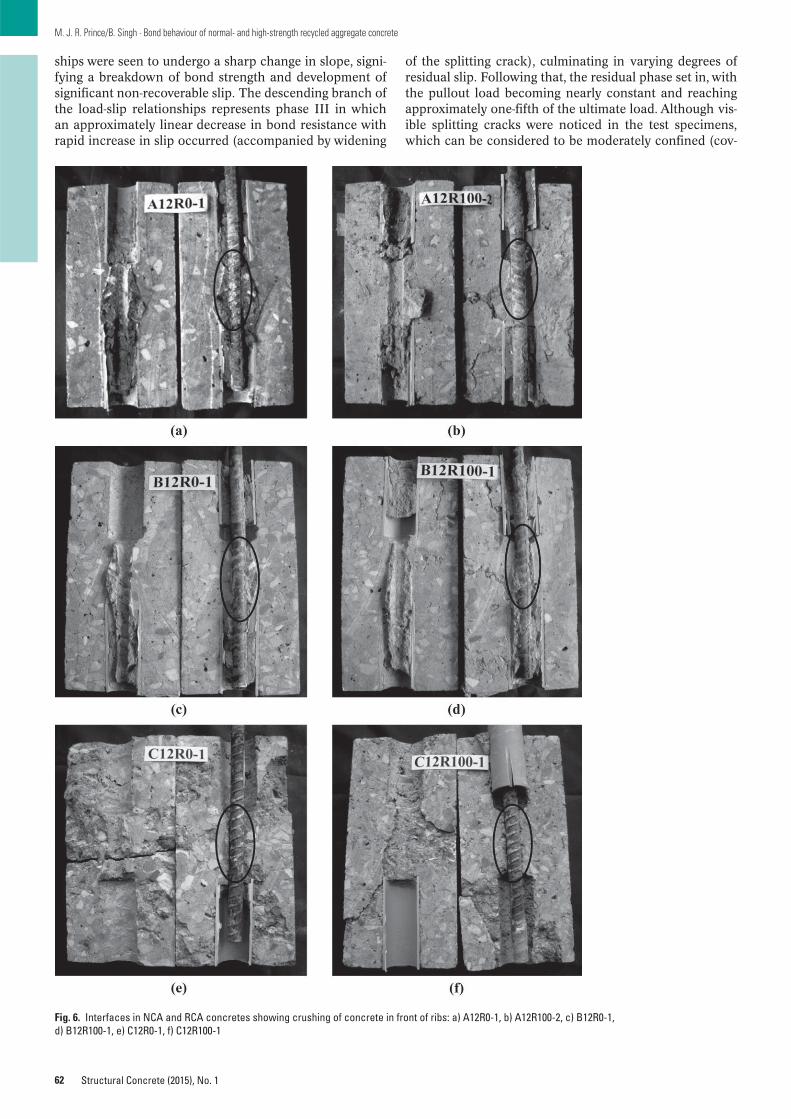
62
M. J. R. Prince/B. Singh · Bond behaviour of normal- and high-strength recycled aggregate concrete
Structural Concrete (2015), No. 1
of the splitting crack), culminating in varying degrees ofresidual slip. Following that, the residual phase set in, withthe pullout load becoming nearly constant and reachingapproximately one-fifth of the ultimate load. Although vis-ible splitting cracks were noticed in the test specimens,which can be considered to be moderately confined (cov-
ships were seen to undergo a sharp change in slope, signi-fying a breakdown of bond strength and development ofsignificant non-recoverable slip. The descending branch ofthe load-slip relationships represents phase III in whichan approximately linear decrease in bond resistance withrapid increase in slip occurred (accompanied by widening
Fig. 6. Interfaces in NCA and RCA concretes showing crushing of concrete in front of ribs: a) A12R0-1, b) A12R100-2, c) B12R0-1, d) B12R100-1, e) C12R0-1, f) C12R100-1
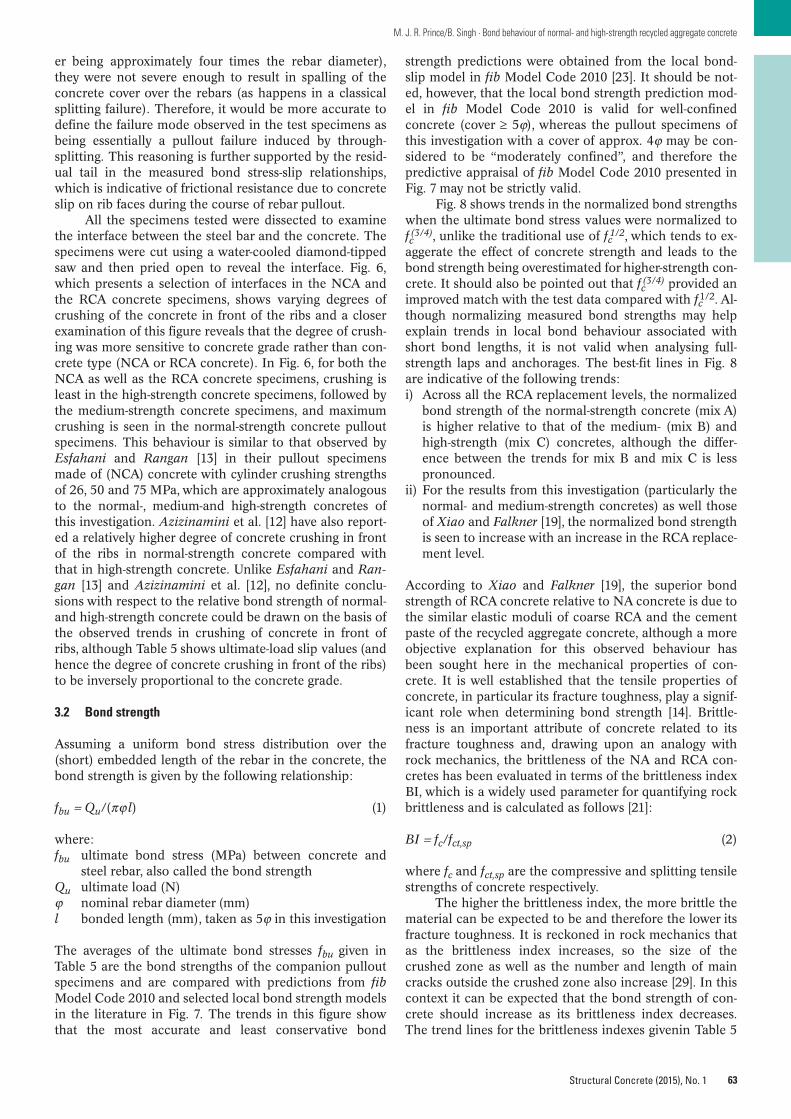
63
M. J. R. Prince/B. Singh · Bond behaviour of normal- and high-strength recycled aggregate concrete
Structural Concrete (2015), No. 1
er being approximately four times the rebar diameter),they were not severe enough to result in spalling of theconcrete cover over the rebars (as happens in a classicalsplitting failure). Therefore, it would be more accurate todefine the failure mode observed in the test specimens asbeing essentially a pullout failure induced by through-splitting. This reasoning is further supported by the resid-ual tail in the measured bond stress-slip relationships,which is indicative of frictional resistance due to concreteslip on rib faces during the course of rebar pullout.
All the specimens tested were dissected to examinethe interface between the steel bar and the concrete. Thespecimens were cut using a water-cooled diamond-tippedsaw and then pried open to reveal the interface. Fig. 6,which presents a selection of interfaces in the NCA andthe RCA concrete specimens, shows varying degrees ofcrushing of the concrete in front of the ribs and a closerexamination of this figure reveals that the degree of crush-ing was more sensitive to concrete grade rather than con-crete type (NCA or RCA concrete). In Fig. 6, for both theNCA as well as the RCA concrete specimens, crushing isleast in the high-strength concrete specimens, followed bythe medium-strength concrete specimens, and maximumcrushing is seen in the normal-strength concrete pulloutspecimens. This behaviour is similar to that observed byEsfahani and Rangan [13] in their pullout specimensmade of (NCA) concrete with cylinder crushing strengthsof 26, 50 and 75 MPa, which are approximately analogousto the normal-, medium-and high-strength concretes ofthis investigation. Azizinamini et al. [12] have also report-ed a relatively higher degree of concrete crushing in frontof the ribs in normal-strength concrete compared withthat in high-strength concrete. Unlike Esfahani and Ran-gan [13] and Azizinamini et al. [12], no definite conclu-sions with respect to the relative bond strength of normal-and high-strength concrete could be drawn on the basis ofthe observed trends in crushing of concrete in front ofribs, although Table 5 shows ultimate-load slip values (andhence the degree of concrete crushing in front of the ribs)to be inversely proportional to the concrete grade.
3.2 Bond strength
Assuming a uniform bond stress distribution over the(short) embedded length of the rebar in the concrete, thebond strength is given by the following relationship:
fbu = Qu/(πϕ l) (1)
where:fbu ultimate bond stress (MPa) between concrete and
steel rebar, also called the bond strengthQu ultimate load (N)ϕ nominal rebar diameter (mm)l bonded length (mm), taken as 5ϕ in this investigation
The averages of the ultimate bond stresses fbu given inTable 5 are the bond strengths of the companion pulloutspecimens and are compared with predictions from fibModel Code 2010 and selected local bond strength modelsin the literature in Fig. 7. The trends in this figure showthat the most accurate and least conservative bond
strength predictions were obtained from the local bond-slip model in fib Model Code 2010 [23]. It should be not-ed, however, that the local bond strength prediction mod-el in fib Model Code 2010 is valid for well-confinedconcrete (cover ≥ 5ϕ), whereas the pullout specimens ofthis investigation with a cover of approx. 4ϕ may be con-sidered to be “moderately confined”, and therefore thepredictive appraisal of fib Model Code 2010 presented inFig. 7 may not be strictly valid.
Fig. 8 shows trends in the normalized bond strengthswhen the ultimate bond stress values were normalized tofc(3/4), unlike the traditional use of fc1/2, which tends to ex-
aggerate the effect of concrete strength and leads to thebond strength being overestimated for higher-strength con-crete. It should also be pointed out that fc
(3/4) provided animproved match with the test data compared with fc1/2. Al-though normalizing measured bond strengths may helpexplain trends in local bond behaviour associated withshort bond lengths, it is not valid when analysing full-strength laps and anchorages. The best-fit lines in Fig. 8are indicative of the following trends:i) Across all the RCA replacement levels, the normalized
bond strength of the normal-strength concrete (mix A)is higher relative to that of the medium- (mix B) andhigh-strength (mix C) concretes, although the differ-ence between the trends for mix B and mix C is lesspronounced.
ii) For the results from this investigation (particularly thenormal- and medium-strength concretes) as well thoseof Xiao and Falkner [19], the normalized bond strengthis seen to increase with an increase in the RCA replace-ment level.
According to Xiao and Falkner [19], the superior bondstrength of RCA concrete relative to NA concrete is due tothe similar elastic moduli of coarse RCA and the cementpaste of the recycled aggregate concrete, although a moreobjective explanation for this observed behaviour hasbeen sought here in the mechanical properties of con-crete. It is well established that the tensile properties ofconcrete, in particular its fracture toughness, play a signif-icant role when determining bond strength [14]. Brittle-ness is an important attribute of concrete related to itsfracture toughness and, drawing upon an analogy withrock mechanics, the brittleness of the NA and RCA con-cretes has been evaluated in terms of the brittleness indexBI, which is a widely used parameter for quantifying rockbrittleness and is calculated as follows [21]:
BI = fc/fct,sp (2)
where fc and fct,sp are the compressive and splitting tensilestrengths of concrete respectively.
The higher the brittleness index, the more brittle thematerial can be expected to be and therefore the lower itsfracture toughness. It is reckoned in rock mechanics thatas the brittleness index increases, so the size of thecrushed zone as well as the number and length of maincracks outside the crushed zone also increase [29]. In thiscontext it can be expected that the bond strength of con-crete should increase as its brittleness index decreases.The trend lines for the brittleness indexes givenin Table 5

64
M. J. R. Prince/B. Singh · Bond behaviour of normal- and high-strength recycled aggregate concrete
Structural Concrete (2015), No. 1
as well as those obtained from the data of Kim and Yun[30] are plotted in Fig. 9, which shows a steady decrease inbrittleness index with the increase in RCA replacementlevel. On the basis of the fracture toughness hypothesispostulated above, the trends in Fig. 9 are indicative of anincrease in bond strength with increase in RCA replace-ment level, which lends support to the trends in the nor-malized bond strength observed in Fig. 8. It should also benoted in Fig. 9 that across all the RCA replacement levels,the lowest BI values were obtained for the normal-strength
concrete and the highest for the high-strength concrete,with the values for medium-strength concrete lying in be-tween; this agrees with the known trends for these gradesof concrete. These observations suggest that brittleness in-dex may be a valid predictor of bond strength vis-à-visconcrete grade and RCA replacement level.
An attempt has been made to derive some measureof the brittleness of bond behaviour from the measured lo-cal bond stress-slip relationship. To this end, the parame-ter “(normalized) toughness in bond”, taken as the area
0
4
8
12
16
20
24
0 25 50 75 100
Bon
d St
ress
(MPa
)
RCA replacement percentage (%)
A12
Test
fib MC2010
Kim et al. [24]
Esfahani and Rangan [4]
0
4
8
12
16
20
24
0 25 50 75 100
Bon
d St
ress
(MPa
)
RCA replacement percentage (%)
B12
Test
fib MC2010
Kim et al. [24]
Esfahani and Rangan [4]
0
4
8
12
16
20
24
28
0 25 50 75 100
Bon
d St
ress
(MPa
)
RCA replacement percentage (%)
C12
Test
fib MC2010
Kim et al. [24]
Esfahani and Rangan [4]
Fig. 7. Comparison of measured and predicted bond stress values: a) normal-strength concrete, mix A, b) medium-strength concrete,mix B, c) high-strength concrete, mix C
a)
b)
c)

65
M. J. R. Prince/B. Singh · Bond behaviour of normal- and high-strength recycled aggregate concrete
Structural Concrete (2015), No. 1
under the local bond stress-slip relationship up to the be-ginning of the residual tail normalized to fc
(3/4), has beencalculated and plotted against the RCA replacement levelfor all three concrete grades in Fig. 10, which also includesthe trend lines for the variation in the brittleness indexescalculated using Eq. (2). Fig. 10 shows that the trends forthe normalized toughness and the brittleness index com-plement each other in the case of the normal- (mix A) andthe medium-strength (mix B) concrete, although they wasdisagreement in the case of the high-strength concrete(mix C).
3.3 Modelling the bond-slip relationship
Modelling of bond behaviour at the steel-concrete inter-face is necessary for the numerical analysis of reinforcedRCA concrete members. To this end, a normalized bond-slip relationship is proposed in terms of the following di-mensionless parameters of Xiao and Falkner [19]:
(3)
where su is the slip corresponding to ultimate bond stressfbu.
A model for the ascending and descending branches ofthe measured bond stress-slip relationships is presented inthe following equations. The ascending branch has beenmodelled by estimating, on the basis of a regression analysisof test data, the constant a in the following constitutive equa-tion for normal-strength concrete proposed by Harajli [31]:
(4)
where a is a function of the slope of the ascending branchof the measured bond stress-slip relationship. The de-
,fff
s ssb
b
bu u
1
1 0.15 1f
s s
sf s
b
a
bu
R² = 0,6598
R² = 0,6227
R² = 0,737
R² = 0,9774
0,0
0,2
0,4
0,6
0,8
1,0
1,2
1,4
1,6
1,8
2,0
0 25 50 75 100
Nor
mal
ised
bon
d st
reng
th [τmax/{(f c’)(3/4) }]
RCA replacement level (%)
Mix A
Mix B
Mix C
Xiao and Falkner [19]
Linear, Mix A
Linear, Mix B
Linear, Mix C
Linear, Xiao and Falkner [19]
Fig. 8. Normalized bond strengths for various RCA replacement levels (mixA – normal-strength concrete; mix B – medium-strength concrete; mix C – high-strength concrete)
R² = 0,731R² = 0,9966
R² = 0,9828
R² = 0,8274
0
4
8
12
16
20
0 25 50 75 100
Bri
ttle
ness
Inde
x (fc'/f t
)
RCA replacement level (%)
Mix A
Mix B
Mix C
Kim and Yun [30]
Linear (Mix A)
Linear (Mix B)
Linear (Mix C)
Linear (Kim and Yun [30])
Fig. 9. Variation inbrittleness index with RCA replacement levels
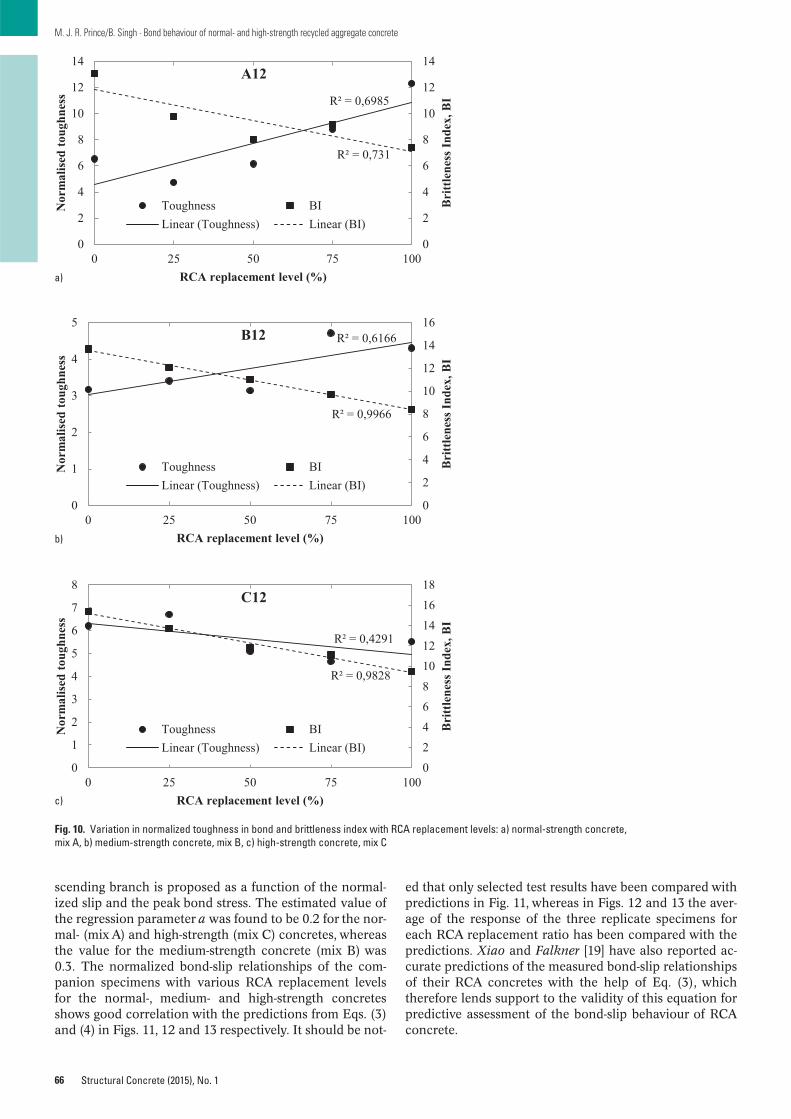
66
M. J. R. Prince/B. Singh · Bond behaviour of normal- and high-strength recycled aggregate concrete
Structural Concrete (2015), No. 1
scending branch is proposed as a function of the normal-ized slip and the peak bond stress. The estimated value ofthe regression parameter a was found to be 0.2 for the nor-mal- (mix A) and high-strength (mix C) concretes, whereasthe value for the medium-strength concrete (mix B) was0.3. The normalized bond-slip relationships of the com-panion specimens with various RCA replacement levelsfor the normal-, medium- and high-strength concretesshows good correlation with the predictions from Eqs. (3)and (4) in Figs. 11, 12 and 13 respectively. It should be not-
ed that only selected test results have been compared withpredictions in Fig. 11, whereas in Figs. 12 and 13 the aver-age of the response of the three replicate specimens foreach RCA replacement ratio has been compared with thepredictions. Xiao and Falkner [19] have also reported ac-curate predictions of the measured bond-slip relationshipsof their RCA concretes with the help of Eq. (3), whichtherefore lends support to the validity of this equation forpredictive assessment of the bond-slip behaviour of RCAconcrete.
R² = 0,6985
R² = 0,731
0
2
4
6
8
10
12
14
0
2
4
6
8
10
12
14
0 25 50 75 100
Bri
ttle
ness
Inde
x, B
I
Nor
mal
ised
toug
hnes
s
RCA replacement level (%)
A12
Toughness BILinear (Toughness) Linear (BI)
R² = 0,6166
R² = 0,9966
0
2
4
6
8
10
12
14
16
0
1
2
3
4
5
0 25 50 75 100
Bri
ttle
ness
Inde
x, B
I
Nor
mal
ised
toug
hnes
s
RCA replacement level (%)
B12
Toughness BILinear (Toughness) Linear (BI)
R² = 0,4291
R² = 0,9828
024681012141618
0
1
2
3
4
5
6
7
8
0 25 50 75 100
Bri
ttle
ness
Inde
x, B
I
Nor
mal
ised
toug
hnes
s
RCA replacement level (%)
C12
Toughness BILinear (Toughness) Linear (BI)
Fig. 10. Variation in normalized toughness in bond and brittleness index with RCA replacement levels: a) normal-strength concrete, mix A, b) medium-strength concrete, mix B, c) high-strength concrete, mix C
a)
b)
c)

67
M. J. R. Prince/B. Singh · Bond behaviour of normal- and high-strength recycled aggregate concrete
Structural Concrete (2015), No. 1
0
0.2
0.4
0.6
0.8
1
1.2
0 5 10 15 20 25
τ/τ m
ax
s/smax
A12R0-2 TestPredicted
0
0.2
0.4
0.6
0.8
1
1.2
0 5 10 15 20 25
τ/τ m
ax
s/smax
A12R50-3 TestPredicted
0
0.2
0.4
0.6
0.8
1
1.2
0 5 10 15 20 25
τ/τ m
ax
s/smax
A12R25-3 TestPredicted
0
0.2
0.4
0.6
0.8
1
1.2
0 5 10 15 20 25
τ/τ m
ax
s/smax
A12R75-2 TestPredicted
0
0.2
0.4
0.6
0.8
1
1.2
0 5 10 15 20 25
τ/τ m
ax
s/smax
A12R100-1 TestPredicted
Fig. 11. Measured vs. predicted bond-slip relationships for the 12 mm dia.deformed bars: a) A12R0, b) A12R25, c) A12R50, d) A12R75, e) A12R100 [21]
a)
b)
c)
d)
e)
0
0.2
0.4
0.6
0.8
1
1.2
0 2 4 6 8 10 12 14 16
τ/τ m
ax
s/smax
B12R0 TestPredicted
0
0.2
0.4
0.6
0.8
1
1.2
0 2 4 6 8 10 12 14 16τ/
τ max
s/smax
B12R25 TestPredicted
0
0.2
0.4
0.6
0.8
1
1.2
0 2 4 6 8 10 12 14 16
τ/τ m
ax
s/smax
B12R50 TestPredicted
0
0.2
0.4
0.6
0.8
1
1.2
0 2 4 6 8 10 12 14 16
τ/τ m
ax
s/smax
B12R75 TestPredicted
0
0.2
0.4
0.6
0.8
1
1.2
0 2 4 6 8 10 12 14 16
τ/τ m
ax
s/smax
B12R100 TestPredicted
Fig. 12. Measured vs. predicted bond-slip relationships for the 12 mm dia.deformed bars: a) B12R0, b) B12R25, c) B12R50, d) B12R75, e) B12R100
a)
b)
c)
d)
e)
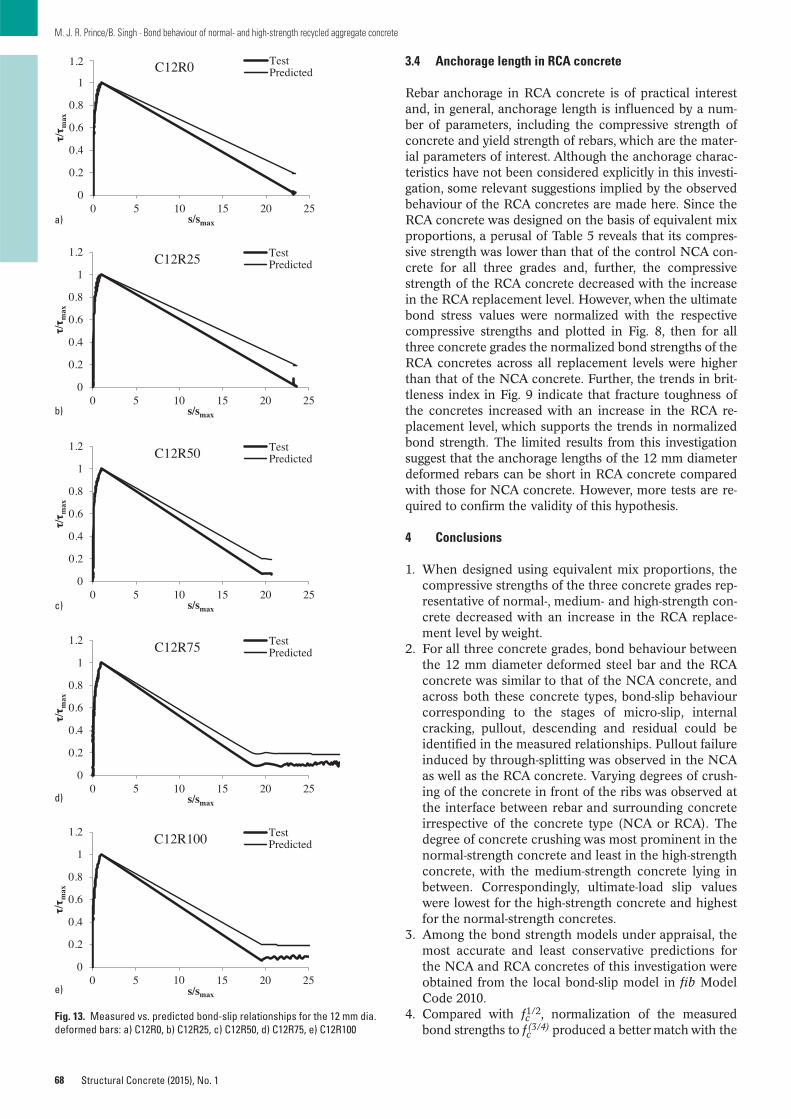
68
M. J. R. Prince/B. Singh · Bond behaviour of normal- and high-strength recycled aggregate concrete
Structural Concrete (2015), No. 1
3.4 Anchorage length in RCA concrete
Rebar anchorage in RCA concrete is of practical interestand, in general, anchorage length is influenced by a num-ber of parameters, including the compressive strength ofconcrete and yield strength of rebars, which are the mater-ial parameters of interest. Although the anchorage charac-teristics have not been considered explicitly in this investi-gation, some relevant suggestions implied by the observedbehaviour of the RCA concretes are made here. Since theRCA concrete was designed on the basis of equivalent mixproportions, a perusal of Table 5 reveals that its compres-sive strength was lower than that of the control NCA con-crete for all three grades and, further, the compressivestrength of the RCA concrete decreased with the increasein the RCA replacement level. However, when the ultimatebond stress values were normalized with the respectivecompressive strengths and plotted in Fig. 8, then for allthree concrete grades the normalized bond strengths of theRCA concretes across all replacement levels were higherthan that of the NCA concrete. Further, the trends in brit-tleness index in Fig. 9 indicate that fracture toughness ofthe concretes increased with an increase in the RCA re-placement level, which supports the trends in normalizedbond strength. The limited results from this investigationsuggest that the anchorage lengths of the 12 mm diameterdeformed rebars can be short in RCA concrete comparedwith those for NCA concrete. However, more tests are re-quired to confirm the validity of this hypothesis.
4 Conclusions
1. When designed using equivalent mix proportions, thecompressive strengths of the three concrete grades rep-resentative of normal-, medium- and high-strength con-crete decreased with an increase in the RCA replace-ment level by weight.
2. For all three concrete grades, bond behaviour betweenthe 12 mm diameter deformed steel bar and the RCAconcrete was similar to that of the NCA concrete, andacross both these concrete types, bond-slip behaviourcorresponding to the stages of micro-slip, internalcracking, pullout, descending and residual could beidentified in the measured relationships. Pullout failureinduced by through-splitting was observed in the NCAas well as the RCA concrete. Varying degrees of crush-ing of the concrete in front of the ribs was observed atthe interface between rebar and surrounding concreteirrespective of the concrete type (NCA or RCA). Thedegree of concrete crushing was most prominent in thenormal-strength concrete and least in the high-strengthconcrete, with the medium-strength concrete lying inbetween. Correspondingly, ultimate-load slip valueswere lowest for the high-strength concrete and highestfor the normal-strength concretes.
3. Among the bond strength models under appraisal, themost accurate and least conservative predictions forthe NCA and RCA concretes of this investigation wereobtained from the local bond-slip model in fib ModelCode 2010.
4. Compared with fc1/2, normalization of the measuredbond strengths to fc
(3/4) produced a better match with the
0
0.2
0.4
0.6
0.8
1
1.2
0 5 10 15 20 25
τ/τ m
ax
s/smax
C12R0 TestPredicted
0
0.2
0.4
0.6
0.8
1
1.2
0 5 10 15 20 25
τ/τ m
ax
s/smax
C12R25 TestPredicted
0
0.2
0.4
0.6
0.8
1
1.2
0 5 10 15 20 25
τ/τ m
ax
s/smax
C12R50 TestPredicted
0
0.2
0.4
0.6
0.8
1
1.2
0 5 10 15 20 25
τ/τ m
ax
s/smax
C12R75 TestPredicted
0
0.2
0.4
0.6
0.8
1
1.2
0 5 10 15 20 25
τ/τ m
ax
s/smax
C12R100 TestPredicted
Fig. 13. Measured vs. predicted bond-slip relationships for the 12 mm dia.deformed bars: a) C12R0, b) C12R25, c) C12R50, d) C12R75, e) C12R100
a)
b)
c)
d)
e)
69
M. J. R. Prince/B. Singh · Bond behaviour of normal- and high-strength recycled aggregate concrete
Structural Concrete (2015), No. 1
test data. The normalized bond strengths across all RCAreplacement levels were highest for the normal-strengthconcrete and lowest for the high-strength concrete (be-yond RCA replacement levels of 25 %), with the resultsfor the medium-strength concrete lying in between.
5. For the normal- and medium-strength concretes in par-ticular, the normalized bond strengths across all RCA re-placement levels were higher than the correspondingvalues for the NA concretes. These bond strengths wereobserved to increase with an increase in the RCA re-placement level such that the highest values of this para-meter were obtained when all the natural coarse aggre-gate in the concrete was replaced with coarse recycledconcrete aggregate particles in the saturated surface-drymoisture condition. However, such a trend was not evi-dent in the case of the high-strength concrete.
6. The fracture toughness of concrete has been character-ized in terms of the brittleness index calculated as the ra-tio of the compressive and the splitting tensile strengths.It has been shown in terms of this parameter that for allthree concrete grades, the fracture toughness of the RCAconcretes of this investigation was higher than that of theNA concretes and increased with an increase in the RCAreplacement level. The normal-strength concrete hasbeen shown to be the least brittle, followed by the medi-um- and high-strength concretes. These observationslend support to the recorded trends in the normalizedbond strength vis-à-vis concrete grade and RCA replace-ment level and suggest that brittleness index may be avalid predictor of bond strength vis-à-vis concrete gradeand RCA replacement level.
7. Accurate predictions of the bond-slip relationships ofthe 12 mm diameter deformed steel bars embedded inboth concrete types were obtained by empirically se-lecting the constants in a constitutive model for con-crete available in the literature.
8. It is suggested that for all three concrete grades, the an-chorage lengths of the 12 mm diameter rebars embed-ded in the RCA concretes can be conservatively takento be equal to those for NCA concrete.
Acknowledgements
The support and cooperation of the staff of the concretelaboratory at the Department of Civil Engineering, IndianInstitute of Technology (I.I.T.) Roorkee, Roorkee, in thisexperimental investigation is gratefully acknowledged.
Notation
ϕ nominal rebar diameterl embedded lengthfc cylinder compressive strength of concretefct,sp splitting tensile strength of concreteQu ultimate loadfbu ultimate bond stressfbun normalized bond strength
References
1. Tepfers, R.: A Theory of Bond Applied to Overlapping Ten-sile Reinforcement Splices for Deformed Bars. Thesis, Divi-
sion of Concrete Structures, Chalmers University of Tech-nology, Pub. 73:2, Gothenburg, Sweden, May 1973.
2. Orangun, C. O., Jirsa, J. O., Breen, J. E.: A revaluation of testdata on development length and splices. ACI Journal, 1977,vol. 74, No. 3, pp. 114–122.
3. Darwin, D., McCabe, S. L., Idun, E. K., Schoenekase, S. P.:Development length criteria: Bars not confined by trans-verse reinforcement. ACI Structural Journal, 1992, vol. 89,No. 6, pp. 709–720.
4. Esfahani, M. R., Rangan, V. B.: Local bond strength of rein-forcing bars in normal-strength and high-strength concrete(HSC). ACI Structural Journal, 1998, vol. 95, No. 2, pp.96–106.
5. Esfahani, M. R., Rangan, V. B.: Bond between normal-strength and high-strength concrete (HSC) and reinforcingbars in splices in beams. ACI Structural Journal, 1998, vol.95, No. 3, pp. 272–280.
6. ACI Committee 318: ACI 318-08. Building Code Require-ments for Structural Concrete and Commentary. FarmingtonHills (MI), 2008.
7. Harajli, M. H.: Comparison of bond strength of steel bars innormal- and high-strength concrete. Journal of Materials inCivil Engineering, 2005, vol. 16, No. 4, pp. 365–374.
8. Zsutty, T.: Empirical study of bar development behavior.Journal of Structural Engineering, ASCE, 1985, vol. 111, No.1, pp. 205–219.
9. Darwin, D., Zuo, J., Tholen, M. L., Idun, E. K.: Developmentlength criteria for conventional and high relative rib area re-inforcing bars. ACI Structural Journal, 1996, vol. 93, No. 3,pp. 347–359.
10. Zuo, J., Darwin, D.: Splice strength of conventional and highrelative rib area bars in normal-and high-strength concrete.ACI Structural Journal, 2000, vol. 97, No. 4, pp. 630–641.
11. Harajli, M., Al-Hajj, J.: Bond–slip response of reinforcingbars embedded in high-strength concrete. Proc. of Int. Sym-posium “Bond in concrete – From Research to Standards”,Budapest University of Technology & Economics, Budapest,Hungary, 2002.
12. Azizinamini, A., Stark, M., Roller, J. J., Ghosh, S. K.: Bondperformance of reinforcing bars embedded in high-strengthconcrete. ACI Structural Journal, 1993, vol. 90, No. 5, pp.554–561.
13. Esfahani, M. R., Rangan, V. B.: Studies on bond betweenconcrete and reinforcing bars. School of Civil Engineering,Curtin University of Technology, Perth, Western Australia,1996.
14. ACI Committee 408: ACI 408R-03. Bond and developmentof straight reinforcing bars in tension. Farmington Hills(MI), 2003.
15. ACI Committee 408: Bond stress – the stateoftheart. ACIJournal, 1966, vol. 63, No. 11, pp. 1161–1190.
16. ACI Committee 408: Opportunities in bond research. ACIJournal, 1970, vol. 67, No. 11, pp. 857–867.
17. Mukai, T., Kikuchi, M.: Fundamental study on bond proper-ties between recycled aggregate concrete and steel bars. Ce-ment Association of Japan, 1978, 32nd review.
18. Roos, F.: Beitrag zur Bemessung von Beton mit Zuschag ausrezyklierter Gesteinskörnung nach DIN 1045-1(Contribu-tion to design of concrete with additive of recycled aggregateaccording to DIN 1045-1), Thesis, TU Munich, 2002 (in Ger-man).
19. Xiao, J., Falkner,H.: Bond behaviour between recycled ag-gregate concrete and steel rebars. Construction and BuildingMaterials, 2007, vol. 21, pp. 395–401.
20. Prince, M. J. R., Singh, B.: Bond behaviour between recycledaggregate concrete and deformed steel bars. Materials andStructures, 2014, vol. 47, pp. 503–516.
70
M. J. R. Prince/B. Singh · Bond behaviour of normal- and high-strength recycled aggregate concrete
Structural Concrete (2015), No. 1
21. Prince, M. J. R., Singh, B. (2014): Investigation of bond be-haviour between recycled aggregate concrete and deformedsteel bars. Structural Concrete, 15: 154–168. doi: 10.1002/ suco. 201300042.
22. Bureau of Indian Standards: IS 2770 (Part I) -1967 (reaf-firmed 2002). Methods of Testing Bond in Reinforced Con-crete Part I Pullout Test. New Delhi, India, 1967.
23. fib: Model Code for Concrete Structures 2010. Ernst &Sohn, Berlin, 2013.
24. Kim, Y., Sim, J., Park, C.: Mechanical properties of recycledaggregate concrete with deformed steel re-bar. Journal of Marine Science and Technology, 2012, vol. 20, No. 3, pp.274–280.
25. Bureau of Indian Standards: IS 8112-1989 (reaffirmed 2005).43 Grade Ordinary Portland CementSpecification. New Del-hi, India, 1989.
26. Bureau of Indian Standards: IS 2386 (Part IV) – 1963 (Reaf-firmed 2007). Methods of test for aggregates for concrete.Part IV Mechanical properties. New Delhi, India 1963.
27. Nagataki, S., Saeki, T., Iida, K.: Recycled Concrete as Aggre-gate. CANMET/ACI International Symposium on Sustain-able Development of the Cement and Concrete Industry, Ot-tawa, Canada, 1998, pp. 131–146.
28. Bureau of Indian Standards: IS 383-1970 (reaffirmed 2002).Specification for Coarse and Fine Aggregate from NaturalSources for Concrete. New Delhi, India, 1970.
29. Perera, S. V. T. J., Mutsuyoshi, H.: Shear behavior of rein-forced high-strength concrete beams. ACI Structural Journal,2013, vol. 110, No. 1, pp. 43–52.
30. Kim, S. W., Yun. H. D.: Influence of recycled coarse aggre-gates on the bond behavior of deformed bars in concrete.Engineering Structures, 2013, vol. 48, pp. 133–143.
31. Harajli, M. H.: Development/splice strength of reinforcingbars embedded in plain and fibre reinforced concrete. ACIJournal, 1994, vol. 91, No. 5, pp. 511–520.
M. John Robert Prince, M.Engg.Research ScholarDepartment of Civil EngineeringIndian Institute of Technology RoorkeeRoorkee 247 667, IndiaTel: +91 [email protected]
Bhupinder Singh, PhD (corresponding author)Associate ProfessorDepartment of Civil EngineeringIndian Institute of Technology RoorkeeRoorkee 247 667, IndiaTelefax: +91 1332 [email protected], [email protected]
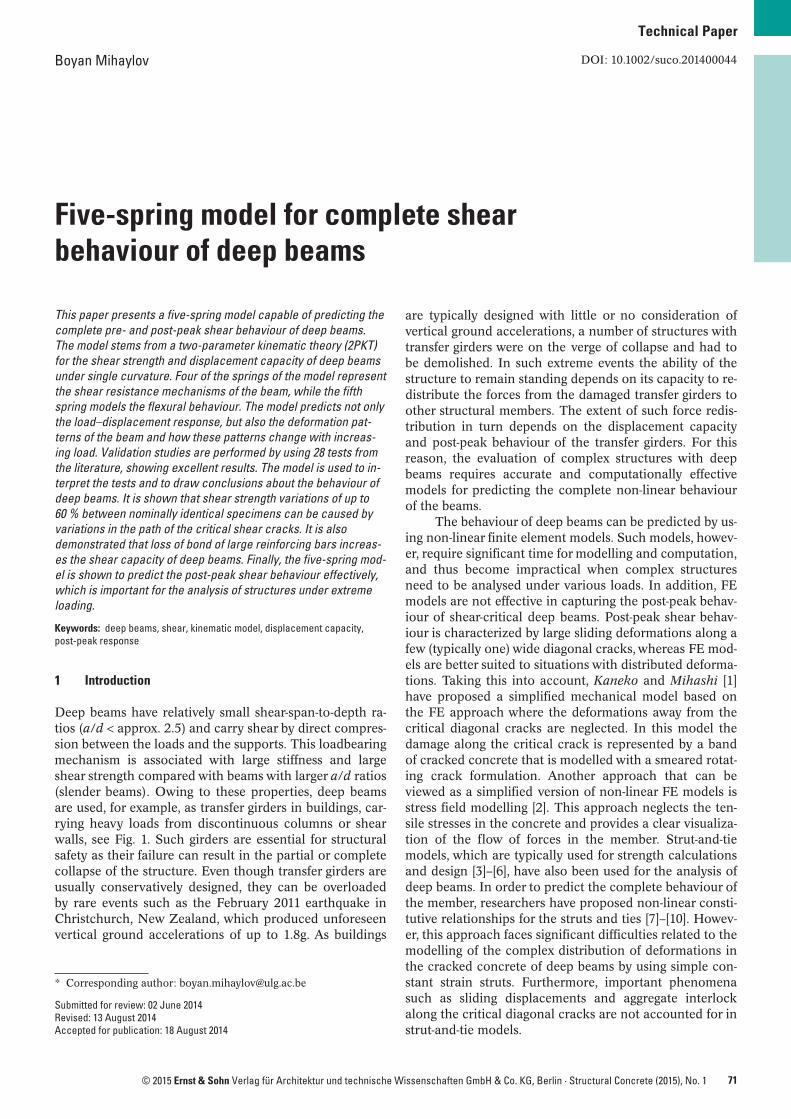
71© 2015 Ernst & Sohn Verlag für Architektur und technische Wissenschaften GmbH & Co. KG, Berlin · Structural Concrete (2015), No. 1
Technical Paper
DOI: 10.1002/suco.201400044
This paper presents a five-spring model capable of predicting thecomplete pre- and post-peak shear behaviour of deep beams.The model stems from a two-parameter kinematic theory (2PKT)for the shear strength and displacement capacity of deep beamsunder single curvature. Four of the springs of the model representthe shear resistance mechanisms of the beam, while the fifthspring models the flexural behaviour. The model predicts not onlythe load–displacement response, but also the deformation pat-terns of the beam and how these patterns change with increas-ing load. Validation studies are performed by using 28 tests fromthe literature, showing excellent results. The model is used to in-terpret the tests and to draw conclusions about the behaviour ofdeep beams. It is shown that shear strength variations of up to60 % between nominally identical specimens can be caused byvariations in the path of the critical shear cracks. It is alsodemonstrated that loss of bond of large reinforcing bars increas-es the shear capacity of deep beams. Finally, the five-spring mod-el is shown to predict the post-peak shear behaviour effectively,which is important for the analysis of structures under extremeloading.
Keywords: deep beams, shear, kinematic model, displacement capacity,post-peak response
1 Introduction
Deep beams have relatively small shear-span-to-depth ra-tios (a/d < approx. 2.5) and carry shear by direct compres-sion between the loads and the supports. This loadbearingmechanism is associated with large stiffness and largeshear strength compared with beams with larger a/d ratios(slender beams). Owing to these properties, deep beamsare used, for example, as transfer girders in buildings, car-rying heavy loads from discontinuous columns or shearwalls, see Fig. 1. Such girders are essential for structuralsafety as their failure can result in the partial or completecollapse of the structure. Even though transfer girders areusually conservatively designed, they can be overloadedby rare events such as the February 2011 earthquake inChristchurch, New Zealand, which produced unforeseenvertical ground accelerations of up to 1.8g. As buildings
are typically designed with little or no consideration ofvertical ground accelerations, a number of structures withtransfer girders were on the verge of collapse and had tobe demolished. In such extreme events the ability of thestructure to remain standing depends on its capacity to re-distribute the forces from the damaged transfer girders toother structural members. The extent of such force redis-tribution in turn depends on the displacement capacityand post-peak behaviour of the transfer girders. For thisreason, the evaluation of complex structures with deepbeams requires accurate and computationally effectivemodels for predicting the complete non-linear behaviourof the beams.
The behaviour of deep beams can be predicted by us-ing non-linear finite element models. Such models, howev-er, require significant time for modelling and computation,and thus become impractical when complex structuresneed to be analysed under various loads. In addition, FEmodels are not effective in capturing the post-peak behav-iour of shear-critical deep beams. Post-peak shear behav-iour is characterized by large sliding deformations along afew (typically one) wide diagonal cracks, whereas FE mod-els are better suited to situations with distributed deforma-tions. Taking this into account, Kaneko and Mihashi [1]have proposed a simplified mechanical model based onthe FE approach where the deformations away from thecritical diagonal cracks are neglected. In this model thedamage along the critical crack is represented by a bandof cracked concrete that is modelled with a smeared rotat-ing crack formulation. Another approach that can beviewed as a simplified version of non-linear FE models isstress field modelling [2]. This approach neglects the ten-sile stresses in the concrete and provides a clear visualiza-tion of the flow of forces in the member. Strut-and-tiemodels, which are typically used for strength calculationsand design [3]–[6], have also been used for the analysis ofdeep beams. In order to predict the complete behaviour ofthe member, researchers have proposed non-linear consti-tutive relationships for the struts and ties [7]–[10]. Howev-er, this approach faces significant difficulties related to themodelling of the complex distribution of deformations inthe cracked concrete of deep beams by using simple con-stant strain struts. Furthermore, important phenomenasuch as sliding displacements and aggregate interlockalong the critical diagonal cracks are not accounted for instrut-and-tie models.
Five-spring model for complete shearbehaviour of deep beams
Boyan Mihaylov
* Corresponding author: [email protected]
Submitted for review: 02 June 2014Revised: 13 August 2014Accepted for publication: 18 August 2014
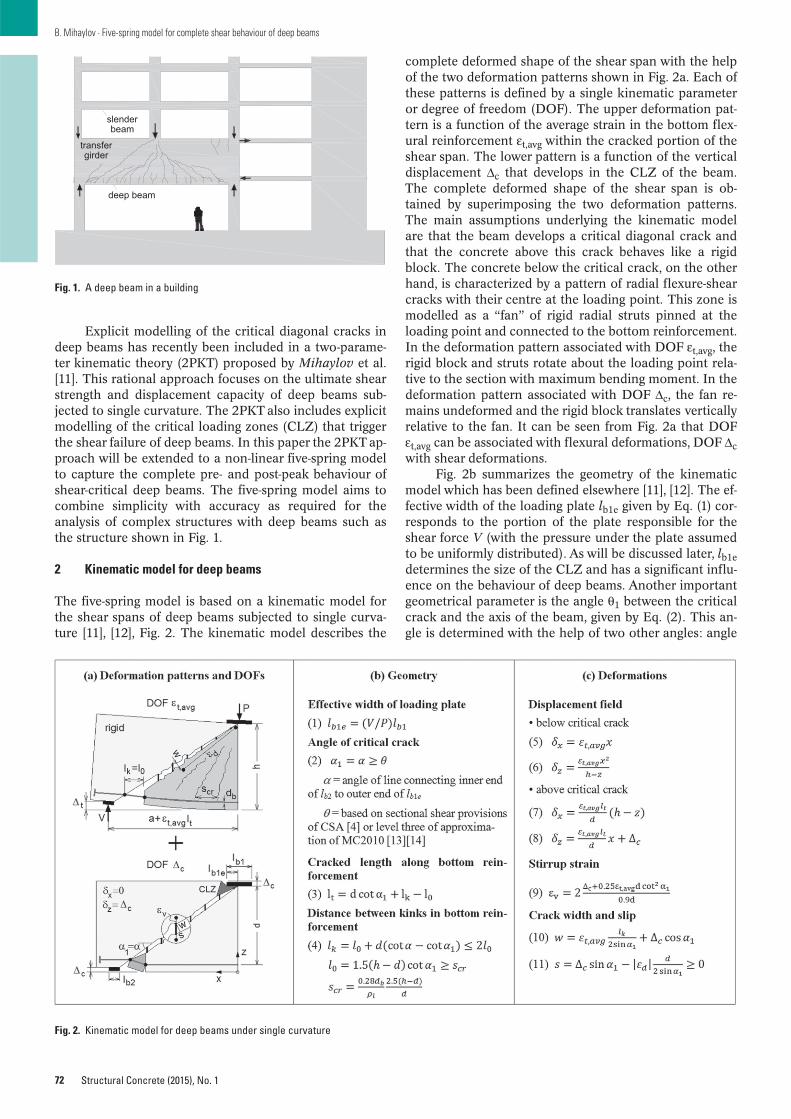
72
B. Mihaylov · Five-spring model for complete shear behaviour of deep beams
Structural Concrete (2015), No. 1
Explicit modelling of the critical diagonal cracks indeep beams has recently been included in a two-parame-ter kinematic theory (2PKT) proposed by Mihaylov et al.[11]. This rational approach focuses on the ultimate shearstrength and displacement capacity of deep beams sub-jected to single curvature. The 2PKT also includes explicitmodelling of the critical loading zones (CLZ) that triggerthe shear failure of deep beams. In this paper the 2PKT ap-proach will be extended to a non-linear five-spring modelto capture the complete pre- and post-peak behaviour ofshear-critical deep beams. The five-spring model aims tocombine simplicity with accuracy as required for theanalysis of complex structures with deep beams such asthe structure shown in Fig. 1.
2 Kinematic model for deep beams
The five-spring model is based on a kinematic model forthe shear spans of deep beams subjected to single curva-ture [11], [12], Fig. 2. The kinematic model describes the
complete deformed shape of the shear span with the helpof the two deformation patterns shown in Fig. 2a. Each ofthese patterns is defined by a single kinematic parameteror degree of freedom (DOF). The upper deformation pat-tern is a function of the average strain in the bottom flex-ural reinforcement εt,avg within the cracked portion of theshear span. The lower pattern is a function of the verticaldisplacement Δc that develops in the CLZ of the beam.The complete deformed shape of the shear span is ob-tained by superimposing the two deformation patterns.The main assumptions underlying the kinematic modelare that the beam develops a critical diagonal crack andthat the concrete above this crack behaves like a rigidblock. The concrete below the critical crack, on the otherhand, is characterized by a pattern of radial flexure-shearcracks with their centre at the loading point. This zone ismodelled as a “fan” of rigid radial struts pinned at theloading point and connected to the bottom reinforcement.In the deformation pattern associated with DOF εt,avg, therigid block and struts rotate about the loading point rela-tive to the section with maximum bending moment. In thedeformation pattern associated with DOF Δc, the fan re-mains undeformed and the rigid block translates verticallyrelative to the fan. It can be seen from Fig. 2a that DOFεt,avg can be associated with flexural deformations, DOF Δcwith shear deformations.
Fig. 2b summarizes the geometry of the kinematicmodel which has been defined elsewhere [11], [12]. The ef-fective width of the loading plate lb1e given by Eq. (1) cor-responds to the portion of the plate responsible for theshear force V (with the pressure under the plate assumedto be uniformly distributed). As will be discussed later, lb1edetermines the size of the CLZ and has a significant influ-ence on the behaviour of deep beams. Another importantgeometrical parameter is the angle θ1 between the criticalcrack and the axis of the beam, given by Eq. (2). This an-gle is determined with the help of two other angles: angle
deep beam
slenderbeam
transfergirder
Fig. 1. A deep beam in a building
Fig. 2. Kinematic model for deep beams under single curvature
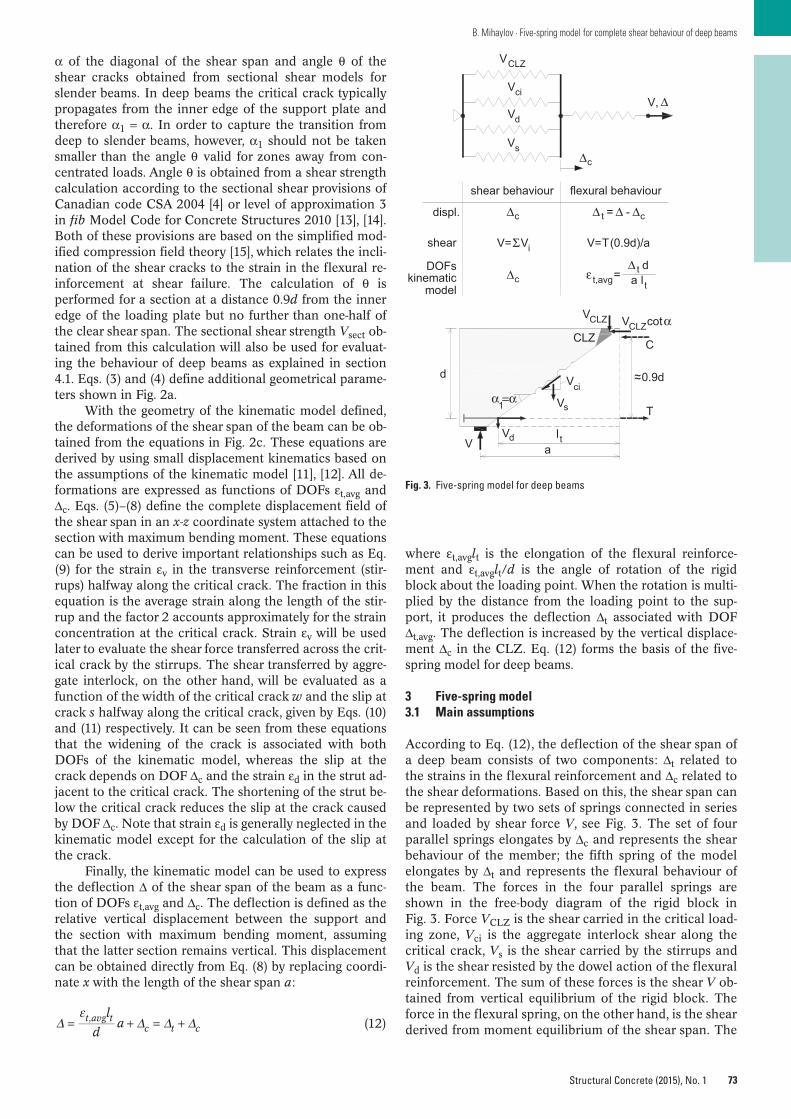
73
B. Mihaylov · Five-spring model for complete shear behaviour of deep beams
Structural Concrete (2015), No. 1
α of the diagonal of the shear span and angle θ of theshear cracks obtained from sectional shear models forslender beams. In deep beams the critical crack typicallypropagates from the inner edge of the support plate andtherefore α1 = α. In order to capture the transition fromdeep to slender beams, however, α1 should not be takensmaller than the angle θ valid for zones away from con-centrated loads. Angle θ is obtained from a shear strengthcalculation according to the sectional shear provisions ofCanadian code CSA 2004 [4] or level of approximation 3in fib Model Code for Concrete Structures 2010 [13], [14].Both of these provisions are based on the simplified mod-ified compression field theory [15], which relates the incli-nation of the shear cracks to the strain in the flexural re-inforcement at shear failure. The calculation of θ isperformed for a section at a distance 0.9d from the inneredge of the loading plate but no further than one-half ofthe clear shear span. The sectional shear strength Vsect ob-tained from this calculation will also be used for evaluat-ing the behaviour of deep beams as explained in section4.1. Eqs. (3) and (4) define additional geometrical parame-ters shown in Fig. 2a.
With the geometry of the kinematic model defined,the deformations of the shear span of the beam can be ob-tained from the equations in Fig. 2c. These equations arederived by using small displacement kinematics based onthe assumptions of the kinematic model [11], [12]. All de-formations are expressed as functions of DOFs εt,avg andΔc. Eqs. (5)–(8) define the complete displacement field ofthe shear span in an x-z coordinate system attached to thesection with maximum bending moment. These equationscan be used to derive important relationships such as Eq.(9) for the strain εv in the transverse reinforcement (stir-rups) halfway along the critical crack. The fraction in thisequation is the average strain along the length of the stir-rup and the factor 2 accounts approximately for the strainconcentration at the critical crack. Strain εv will be usedlater to evaluate the shear force transferred across the crit-ical crack by the stirrups. The shear transferred by aggre-gate interlock, on the other hand, will be evaluated as afunction of the width of the critical crack w and the slip atcrack s halfway along the critical crack, given by Eqs. (10)and (11) respectively. It can be seen from these equationsthat the widening of the crack is associated with bothDOFs of the kinematic model, whereas the slip at thecrack depends on DOF Δc and the strain εd in the strut ad-jacent to the critical crack. The shortening of the strut be-low the critical crack reduces the slip at the crack causedby DOF Δc. Note that strain εd is generally neglected in thekinematic model except for the calculation of the slip atthe crack.
Finally, the kinematic model can be used to expressthe deflection Δ of the shear span of the beam as a func-tion of DOFs εt,avg and Δc. The deflection is defined as therelative vertical displacement between the support andthe section with maximum bending moment, assumingthat the latter section remains vertical. This displacementcan be obtained directly from Eq. (8) by replacing coordi-nate x with the length of the shear span a:
(12)l
dat avg t
c t c,
where εt,avglt is the elongation of the flexural reinforce-ment and εt,avglt/d is the angle of rotation of the rigidblock about the loading point. When the rotation is multi-plied by the distance from the loading point to the sup-port, it produces the deflection Δt associated with DOFΔt,avg. The deflection is increased by the vertical displace-ment Δc in the CLZ. Eq. (12) forms the basis of the five-spring model for deep beams.
3 Five-spring model3.1 Main assumptions
According to Eq. (12), the deflection of the shear span ofa deep beam consists of two components: Δt related tothe strains in the flexural reinforcement and Δc related tothe shear deformations. Based on this, the shear span canbe represented by two sets of springs connected in seriesand loaded by shear force V, see Fig. 3. The set of fourparallel springs elongates by Δc and represents the shearbehaviour of the member; the fifth spring of the modelelongates by Δt and represents the flexural behaviour ofthe beam. The forces in the four parallel springs areshown in the free-body diagram of the rigid block inFig. 3. Force VCLZ is the shear carried in the critical load-ing zone, Vci is the aggregate interlock shear along thecritical crack, Vs is the shear carried by the stirrups andVd is the shear resisted by the dowel action of the flexuralreinforcement. The sum of these forces is the shear V ob-tained from vertical equilibrium of the rigid block. Theforce in the flexural spring, on the other hand, is the shearderived from moment equilibrium of the shear span. The
VCLZ
V,Vci
Vd
Vs
Δ
Δc
VdV
VCLZ
Vcid
a
Vs T
0.9d
Δc
shear behaviour flexural behaviour
Δdispl.
tl
Δ t Δc= -
~~
CCLZ
α =α1
VCLZcotα
V= iΣV V=Tshear (0.9d)/a
DOFsΔc ε t,avg=
Δ ta
d
tlkinematicmodel
Fig. 3. Five-spring model for deep beams
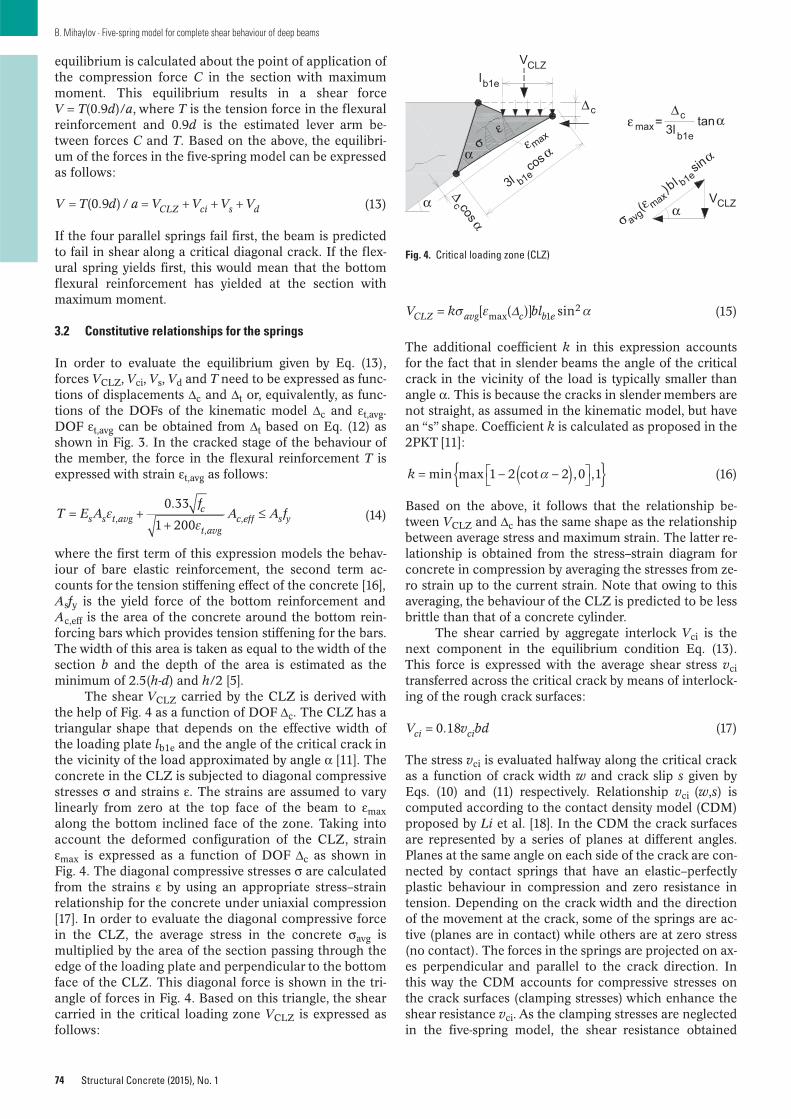
74
B. Mihaylov · Five-spring model for complete shear behaviour of deep beams
Structural Concrete (2015), No. 1
equilibrium is calculated about the point of application ofthe compression force C in the section with maximummoment. This equilibrium results in a shear forceV = T(0.9d)/a, where T is the tension force in the flexuralreinforcement and 0.9d is the estimated lever arm be-tween forces C and T. Based on the above, the equilibri-um of the forces in the five-spring model can be expressedas follows:
(13)
If the four parallel springs fail first, the beam is predictedto fail in shear along a critical diagonal crack. If the flex-ural spring yields first, this would mean that the bottomflexural reinforcement has yielded at the section withmaximum moment.
3.2 Constitutive relationships for the springs
In order to evaluate the equilibrium given by Eq. (13),forces VCLZ, Vci, Vs, Vd and T need to be expressed as func-tions of displacements Δc and Δt or, equivalently, as func-tions of the DOFs of the kinematic model Δc and εt,avg.DOF εt,avg can be obtained from Δt based on Eq. (12) asshown in Fig. 3. In the cracked stage of the behaviour ofthe member, the force in the flexural reinforcement T isexpressed with strain εt,avg as follows:
(14)
where the first term of this expression models the behav-iour of bare elastic reinforcement, the second term ac-counts for the tension stiffening effect of the concrete [16],Asfy is the yield force of the bottom reinforcement andAc,eff is the area of the concrete around the bottom rein-forcing bars which provides tension stiffening for the bars.The width of this area is taken as equal to the width of thesection b and the depth of the area is estimated as theminimum of 2.5(h-d) and h/2 [5].
The shear VCLZ carried by the CLZ is derived withthe help of Fig. 4 as a function of DOF Δc. The CLZ has atriangular shape that depends on the effective width ofthe loading plate lb1e and the angle of the critical crack inthe vicinity of the load approximated by angle α [11]. Theconcrete in the CLZ is subjected to diagonal compressivestresses σ and strains ε. The strains are assumed to varylinearly from zero at the top face of the beam to εmaxalong the bottom inclined face of the zone. Taking intoaccount the deformed configuration of the CLZ, strainεmax is expressed as a function of DOF Δc as shown inFig. 4. The diagonal compressive stresses σ are calculatedfrom the strains ε by using an appropriate stress–strain relationship for the concrete under uniaxial compression[17]. In order to evaluate the diagonal compressive forcein the CLZ, the average stress in the concrete σavg is multiplied by the area of the section passing through theedge of the loading plate and perpendicular to the bottomface of the CLZ. This diagonal force is shown in the tri-angle of forces in Fig. 4. Based on this triangle, the shearcarried in the critical loading zone VCLZ is expressed asfollows:
T E Af
A A f0.33
1 200s s t avg
c
t avgc eff s y,
,,
V T d a V V V V(0.9 ) / CLZ ci s d
(15)
The additional coefficient k in this expression accountsfor the fact that in slender beams the angle of the criticalcrack in the vicinity of the load is typically smaller thanangle α. This is because the cracks in slender members arenot straight, as assumed in the kinematic model, but havean “s” shape. Coefficient k is calculated as proposed in the2PKT [11]:
(16)
Based on the above, it follows that the relationship be-tween VCLZ and Δc has the same shape as the relationshipbetween average stress and maximum strain. The latter re-lationship is obtained from the stress–strain diagram forconcrete in compression by averaging the stresses from ze-ro strain up to the current strain. Note that owing to thisaveraging, the behaviour of the CLZ is predicted to be lessbrittle than that of a concrete cylinder.
The shear carried by aggregate interlock Vci is thenext component in the equilibrium condition Eq. (13).This force is expressed with the average shear stress vcitransferred across the critical crack by means of interlock-ing of the rough crack surfaces:
(17)
The stress vci is evaluated halfway along the critical crackas a function of crack width w and crack slip s given byEqs. (10) and (11) respectively. Relationship vci (w,s) iscomputed according to the contact density model (CDM)proposed by Li et al. [18]. In the CDM the crack surfacesare represented by a series of planes at different angles.Planes at the same angle on each side of the crack are con-nected by contact springs that have an elastic–perfectlyplastic behaviour in compression and zero resistance intension. Depending on the crack width and the directionof the movement at the crack, some of the springs are ac-tive (planes are in contact) while others are at zero stress(no contact). The forces in the springs are projected on ax-es perpendicular and parallel to the crack direction. Inthis way the CDM accounts for compressive stresses onthe crack surfaces (clamping stresses) which enhance theshear resistance vci. As the clamping stresses are neglectedin the five-spring model, the shear resistance obtained
V v bd0.18ci ci
k min max 1 2 cot 2 ,0 ,1
V k bl[ ( )] sinCLZ avg c b emax 12
b1e3l
cosα
VCLZ
ε
b1el
Δc cosα
Δc
αavg
l b1esinα
α
bCLZV
ε max
α
εmax
(ε max)
=Δc
b1e3ltanα
σ
σ
Fig. 4. Critical loading zone (CLZ)
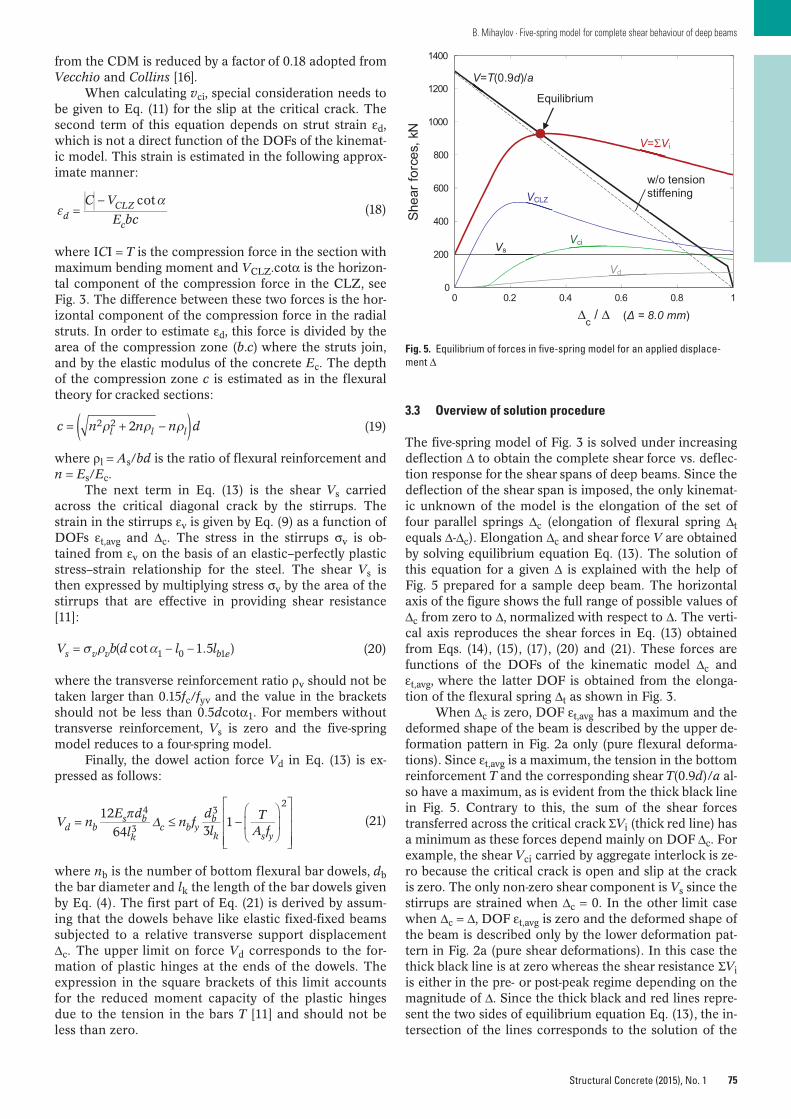
75
B. Mihaylov · Five-spring model for complete shear behaviour of deep beams
Structural Concrete (2015), No. 1
from the CDM is reduced by a factor of 0.18 adopted fromVecchio and Collins [16].
When calculating vci, special consideration needs tobe given to Eq. (11) for the slip at the critical crack. Thesecond term of this equation depends on strut strain εd,which is not a direct function of the DOFs of the kinemat-ic model. This strain is estimated in the following approx-imate manner:
(18)
where ICI = T is the compression force in the section withmaximum bending moment and VCLZ.cotα is the horizon-tal component of the compression force in the CLZ, seeFig. 3. The difference between these two forces is the hor-izontal component of the compression force in the radialstruts. In order to estimate εd, this force is divided by thearea of the compression zone (b.c) where the struts join,and by the elastic modulus of the concrete Ec. The depthof the compression zone c is estimated as in the flexuraltheory for cracked sections:
(19)
where ρl = As/bd is the ratio of flexural reinforcement andn = Es/Ec.
The next term in Eq. (13) is the shear Vs carriedacross the critical diagonal crack by the stirrups. Thestrain in the stirrups εv is given by Eq. (9) as a function ofDOFs εt,avg and Δc. The stress in the stirrups σv is ob-tained from εv on the basis of an elastic–perfectly plasticstress–strain relationship for the steel. The shear Vs isthen expressed by multiplying stress σv by the area of thestirrups that are effective in providing shear resistance[11]:
(20)
where the transverse reinforcement ratio ρv should not betaken larger than 0.15fc/fyv and the value in the bracketsshould not be less than 0.5dcotα1. For members withouttransverse reinforcement, Vs is zero and the five-springmodel reduces to a four-spring model.
Finally, the dowel action force Vd in Eq. (13) is ex-pressed as follows:
(21)
where nb is the number of bottom flexural bar dowels, dbthe bar diameter and lk the length of the bar dowels givenby Eq. (4). The first part of Eq. (21) is derived by assum-ing that the dowels behave like elastic fixed-fixed beamssubjected to a relative transverse support displacementΔc. The upper limit on force Vd corresponds to the for-mation of plastic hinges at the ends of the dowels. Theexpression in the square brackets of this limit accountsfor the reduced moment capacity of the plastic hingesdue to the tension in the bars T [11] and should not beless than zero.
V b d l l( cot 1.5 )s v v b e1 0 1
c n n n d2l l l2 2
C V
E bc
cotd
CLZ
c
V nE d
ln f
dl
TA f
12
64 31d b
s b
kc b y
b
k s y
4
3
32
3.3 Overview of solution procedure
The five-spring model of Fig. 3 is solved under increasingdeflection Δ to obtain the complete shear force vs. deflec-tion response for the shear spans of deep beams. Since thedeflection of the shear span is imposed, the only kinemat-ic unknown of the model is the elongation of the set offour parallel springs Δc (elongation of flexural spring Δtequals Δ-Δc). Elongation Δc and shear force V are obtainedby solving equilibrium equation Eq. (13). The solution ofthis equation for a given Δ is explained with the help ofFig. 5 prepared for a sample deep beam. The horizontalaxis of the figure shows the full range of possible values ofΔc from zero to Δ, normalized with respect to Δ. The verti-cal axis reproduces the shear forces in Eq. (13) obtainedfrom Eqs. (14), (15), (17), (20) and (21). These forces arefunctions of the DOFs of the kinematic model Δc andεt,avg, where the latter DOF is obtained from the elonga-tion of the flexural spring Δt as shown in Fig. 3.
When Δc is zero, DOF εt,avg has a maximum and thedeformed shape of the beam is described by the upper de-formation pattern in Fig. 2a only (pure flexural deforma-tions). Since εt,avg is a maximum, the tension in the bottomreinforcement T and the corresponding shear T(0.9d)/a al-so have a maximum, as is evident from the thick black linein Fig. 5. Contrary to this, the sum of the shear forcestransferred across the critical crack ΣVi (thick red line) hasa minimum as these forces depend mainly on DOF Δc. Forexample, the shear Vci carried by aggregate interlock is ze-ro because the critical crack is open and slip at the crackis zero. The only non-zero shear component is Vs since thestirrups are strained when Δc = 0. In the other limit casewhen Δc = Δ, DOF εt,avg is zero and the deformed shape ofthe beam is described only by the lower deformation pat-tern in Fig. 2a (pure shear deformations). In this case thethick black line is at zero whereas the shear resistance ΣViis either in the pre- or post-peak regime depending on themagnitude of Δ. Since the thick black and red lines repre-sent the two sides of equilibrium equation Eq. (13), the in-tersection of the lines corresponds to the solution of the
0 0.2 0.4 0.6 0.8 10
200
400
600
800
1000
1200
1400
Δc / Δ
Shea
r for
ces,
kN
(Δ = 8.0 mm)
Equilibrium
VCLZ
VciVs
Vd
V=ΣVi
V=T(0.9d)/a
w/o tensionstiffening
Fig. 5. Equilibrium of forces in five-spring model for an applied displace-ment Δ
76
B. Mihaylov · Five-spring model for complete shear behaviour of deep beams
Structural Concrete (2015), No. 1
equation. The intersection is found iteratively by using thebisection method. The ordinate of the intersection point isthe shear force V corresponding to the imposed deflectionΔ. The bisection method is applied with increasing valuesof Δ to compute the complete V-Δ response of the mem-ber.
4 Comparisons of predicted and measured behaviour4.1 Specimens S1M and S1C
The five-spring model is used to predict the behaviour oftwo deep beam specimens, S1M and S1C, tested to failureat the University of Toronto [19]. These beams were sim-ply supported and loaded with a point load in the middleof the span. The only difference between the two tests wasthat specimen S1M was loaded monotonically whereasS1C was subjected to reversed cyclic loading. The effectivedepth of the section was d = 1095 mm (h = 1200 mm) andthe shear-span-to-depth ratio a/d was 1.55. The beams hadsymmetrical top and bottom longitudinal reinforcementwith a ratio ρl = 0.70 % and stirrups with a ratio ρv =0.10 %. The compressive strength of the concrete on theday of beam testing was fc = 33.0 MPa. Table 1 summarizesthe properties of the specimens as well as the measuredand predicted failure loads. Both specimens failed in shearalong critical diagonal cracks prior to yielding of the flex-ural reinforcement. As the beams were symmetrical, thefive-spring model is used to model one-half of the beams(one shear span).
The upper plot in Fig. 6 shows the measured and pre-dicted responses of specimens S1M and S1C. The hori-zontal axis is the midspan deflection of the beams, the ver-tical axis is the shear force. It can be seen that the twogreen curves, which represent the envelopes of the mea-sured responses, almost overlap. This shows that the loadreversals applied to specimen S1C did not cause signifi-cant strength or stiffness degradation. It can also be seenthat the red prediction curve matches the experimentalcurves well in both the pre-peak and post-peak regimes.The prediction curve consists of a non-linear part pro-duced by the five-spring model and a tri-linear curve forthe initial response. The latter curve models the behaviourprior to the development of the deformation patterns as-sumed in the kinematic model. The first point along thiscurve corresponds to the flexural cracking at the sectionwith maximum moment (shear Vcr,fl). This point is ob-tained based on flexural beam theory by using trans-formed sectional properties. The cracking is assumed tooccur when the stress in the concrete at the bottom of thesection reaches 0.63√⎯fc [6]. The flexural cracking is fol-lowed by the propagation of the first radial flexure-shearcrack at a distance scr from the midspan section along thebottom reinforcement, see Fig. 2a. Further load incre-ments result in the propagation of more radial cracksaway from the flexural crack until the critical diagonalcrack forms under a shear force Vcr,sh. This load level cor-responds to the second point in the initial tri-linear re-sponse. The radial cracks and the critical crack initiate atthe bottom of the section in the zone influenced by theflexural reinforcement. In beams without web reinforce-ment, these cracks propagate almost instantaneously tothe vicinity of the load. Therefore, it is assumed that the
shear at diagonal cracking Vcr,sh is proportional to thecracking force Ncr of the zone influenced by the bottomreinforcement:
(22)
where
(23)
The factor of 1.5 in Eq. (22) accounts approximately forthe load increase between the occurrence of the first radi-al crack and the propagation of the critical diagonal crack.The deflection Δcr,sh under shear Vcr,sh is obtained fromEq. (12) of the kinematic model by taking Δc = 0 and as-suming a shorter cracked length along the bottom rein-forcement:
(24)
The last point from the initial tri-linear response corre-sponds to the breakdown of beam action and the transi-tion to the deformation patterns assumed in the five-spring model. This point is defined by the sectional shearcapacity Vsect obtained from the Canadian code or fibModel Code 2010 [4], [13]. If Vsect is larger than the peakresistance obtained from the five-spring model, the beamis considered slender and the five-spring model is not ap-plicable. It can be seen from the plot that the tri-linearcurve matches the initial response of specimens S1M/S1Cwell.
The upper plot in Fig. 6 also shows the predictedshear resistance mechanisms and how they vary with in-creasing deflection. The main contribution to the shear re-sistance is provided by the critical loading zone (VCLZ)whose failure is predicted to trigger the shear failure of thebeam. This result is consistent with the main assumptionunderlying the 2PKT: the peak shear response of the mem-ber coincides with the peak response of the CLZ. Signifi-cant shear resistance is also provided by the stirrups(shear Vs), which are predicted to yield at a deflection ofabout 3.5 mm. The aggregate interlock mechanism Vcireaches its maximum when the member is in the post-peakregime, and vanishes at a deflection of about 14.5 mm. Atthis deflection the critical crack is very wide (w ≈ 10 mm)and thus the crack surfaces are not in contact any more,regardless of the large slip at the crack (s ≈ 7 mm). Finally,the dowel action shear Vd is predicted to have an effectmainly on the post-peak behaviour of beams S1M andS1C.
The lower plot in Fig. 6 shows the evolution of thedeflections in specimens S1M and S1C associated withthe two deformation patterns of the kinematic model. Ra-tio Δt/Δ shows the portion of the deflection due to theflexural deformation pattern, whereas Δc/Δ is the portiondue to the shear pattern. It can be seen from the predic-tion line that, initially, the deformations are mostly flexur-al. The shear deformations begin to develop rapidly justprior to shear failure, and at the end of the test they ac-count for almost 90 % of the total deflection. It can also be
V N da
1.5 0.9cr sh cr,
N A n A f[ ( 1) ]0.63cr c eff s c,
l l s
dacr sh
t avg t k cr,
,
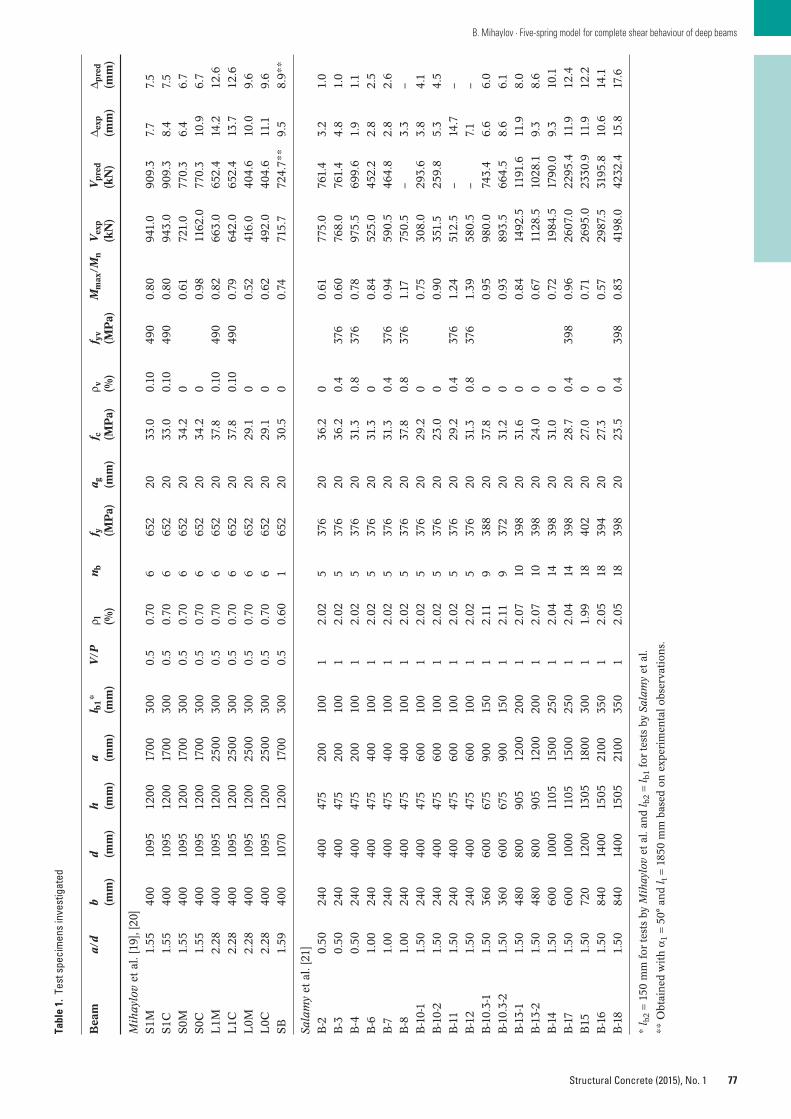
77
B. Mihaylov · Five-spring model for complete shear behaviour of deep beams
Structural Concrete (2015), No. 1
Tabl
e 1.
Test
spe
cim
ens
inve
stig
ated
Bea
ma/
db
dh
al b
1*V
/Pρ l
nb
f ya g
f cρ v
f yv
Mm
ax/M
nV
exp
Vpre
dΔ e
xpΔ p
red
(mm
)(m
m)
(mm
)(m
m)
(mm
)(%
)(M
Pa)
(mm
)(M
Pa)
(%)
(MP
a)(k
N)
(kN
)(m
m)
(mm
)
Mih
aylo
vet
al.
[19]
, [20
]
S1M
1.55
400
1095
1200
1700
300
0.5
0.70
665
220
33.0
0.10
490
0.80
941.
090
9.3
7.7
7.5
S1C
1.55
400
1095
1200
1700
300
0.5
0.70
665
220
33.0
0.10
490
0.80
943.
090
9.3
8.4
7.5
S0M
1.55
400
1095
1200
1700
300
0.5
0.70
665
220
34.2
00.
6172
1.0
770.
36.
46.
7
S0C
1.55
400
1095
1200
1700
300
0.5
0.70
665
220
34.2
00.
9811
62.0
770.
310
.96.
7
L1M
2.28
400
1095
1200
2500
300
0.5
0.70
665
220
37.8
0.10
490
0.82
663.
065
2.4
14.2
12.6
L1C
2.28
400
1095
1200
2500
300
0.5
0.70
665
220
37.8
0.10
490
0.79
642.
065
2.4
13.7
12.6
L0M
2.28
400
1095
1200
2500
300
0.5
0.70
665
220
29.1
00.
5241
6.0
404.
610
.09.
6
L0C
2.28
400
1095
1200
2500
300
0.5
0.70
665
220
29.1
00.
6249
2.0
404.
611
.19.
6
SB
1.59
400
1070
1200
1700
300
0.5
0.60
165
220
30.5
00.
7471
5.7
724.
7**
9.5
8.9*
*
Sala
my
et a
l. [2
1]
B-2
0.50
240
400
475
200
100
12.
025
376
2036
.20
0.61
775.
076
1.4
3.2
1.0
B-3
0.50
240
400
475
200
100
12.
025
376
2036
.20.
437
60.
6076
8.0
761.
44.
81.
0
B-4
0.50
240
400
475
200
100
12.
025
376
2031
.30.
837
60.
7897
5.5
699.
61.
91.
1
B-6
1.00
240
400
475
400
100
12.
025
376
2031
.30
0.84
525.
045
2.2
2.8
2.5
B-7
1.00
240
400
475
400
100
12.
025
376
2031
.30.
437
60.
9459
0.5
464.
82.
82.
6
B-8
1.00
240
400
475
400
100
12.
025
376
2037
.80.
837
61.
1775
0.5
–3.
3–
B-1
0-1
1.50
240
400
475
600
100
12.
025
376
2029
.20
0.75
308.
029
3.6
3.8
4.1
B-1
0-2
1.50
240
400
475
600
100
12.
025
376
2023
.00
0.90
351.
525
9.8
5.3
4.5
B-1
11.
5024
040
047
560
010
01
2.02
537
620
29.2
0.4
376
1.24
512.
5–
14.7
–
B-1
21.
5024
040
047
560
010
01
2.02
537
620
31.3
0.8
376
1.39
580.
5–
7.1
–
B-1
0.3-
11.
5036
060
067
590
015
01
2.11
938
820
37.8
00.
9598
0.0
743.
46.
66.
0
B-1
0.3-
21.
5036
060
067
590
015
01
2.11
937
220
31.2
00.
9389
3.5
664.
58.
66.
1
B-1
3-1
1.50
480
800
905
1200
200
12.
0710
398
2031
.60
0.84
1492
.511
91.6
11.9
8.0
B-1
3-2
1.50
480
800
905
1200
200
12.
0710
398
2024
.00
0.67
1128
.510
28.1
9.3
8.6
B-1
41.
5060
010
0011
0515
0025
01
2.04
1439
820
31.0
00.
7219
84.5
1790
.09.
310
.1
B-1
71.
5060
010
0011
0515
0025
01
2.04
1439
820
28.7
0.4
398
0.96
2607
.022
95.4
11.9
12.4
B15
1.50
720
1200
1305
1800
300
11.
9918
402
2027
.00
0.71
2695
.023
30.9
11.9
12.2
B-1
61.
5084
014
0015
0521
0035
01
2.05
1839
420
27.3
00.
5729
87.5
3195
.810
.614
.1
B-1
81.
5084
014
0015
0521
0035
01
2.05
1839
820
23.5
0.4
398
0.83
4198
.042
32.4
15.8
17.6
* l b
2=
150
mm
for
test
s by
Mih
aylo
vet
al.
and l
b2=
l b1
for
test
s by
Sal
amy
et a
l.
** O
btai
ned
wit
h α
1=
50°
and l
t=
1850
mm
bas
ed o
n e
xper
imen
tal obs
erva
tion
s.
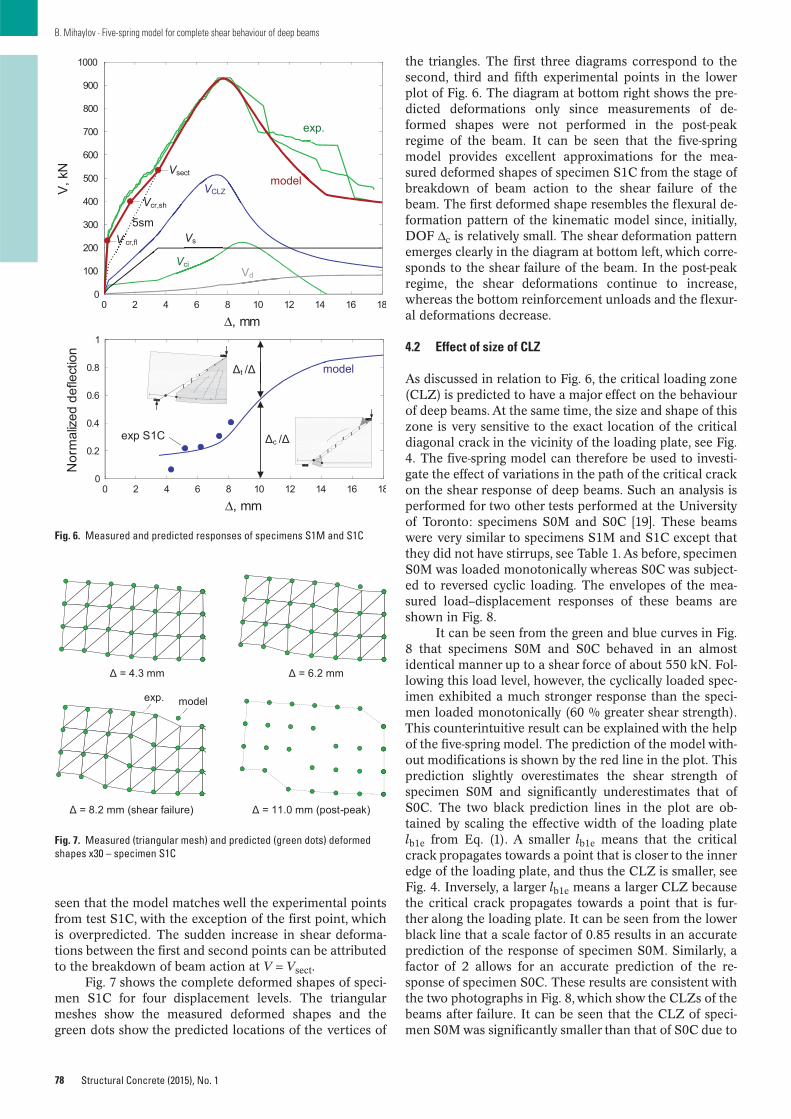
78
B. Mihaylov · Five-spring model for complete shear behaviour of deep beams
Structural Concrete (2015), No. 1
seen that the model matches well the experimental pointsfrom test S1C, with the exception of the first point, whichis overpredicted. The sudden increase in shear deforma-tions between the first and second points can be attributedto the breakdown of beam action at V = Vsect.
Fig. 7 shows the complete deformed shapes of speci-men S1C for four displacement levels. The triangularmeshes show the measured deformed shapes and thegreen dots show the predicted locations of the vertices of
the triangles. The first three diagrams correspond to thesecond, third and fifth experimental points in the lowerplot of Fig. 6. The diagram at bottom right shows the pre-dicted deformations only since measurements of de-formed shapes were not performed in the post-peakregime of the beam. It can be seen that the five-springmodel provides excellent approximations for the mea-sured deformed shapes of specimen S1C from the stage ofbreakdown of beam action to the shear failure of thebeam. The first deformed shape resembles the flexural de-formation pattern of the kinematic model since, initially,DOF Δc is relatively small. The shear deformation patternemerges clearly in the diagram at bottom left, which corre-sponds to the shear failure of the beam. In the post-peakregime, the shear deformations continue to increase,whereas the bottom reinforcement unloads and the flexur-al deformations decrease.
4.2 Effect of size of CLZ
As discussed in relation to Fig. 6, the critical loading zone(CLZ) is predicted to have a major effect on the behaviourof deep beams. At the same time, the size and shape of thiszone is very sensitive to the exact location of the criticaldiagonal crack in the vicinity of the loading plate, see Fig.4. The five-spring model can therefore be used to investi-gate the effect of variations in the path of the critical crackon the shear response of deep beams. Such an analysis isperformed for two other tests performed at the Universityof Toronto: specimens S0M and S0C [19]. These beamswere very similar to specimens S1M and S1C except thatthey did not have stirrups, see Table 1. As before, specimenS0M was loaded monotonically whereas S0C was subject-ed to reversed cyclic loading. The envelopes of the mea-sured load–displacement responses of these beams areshown in Fig. 8.
It can be seen from the green and blue curves in Fig.8 that specimens S0M and S0C behaved in an almostidentical manner up to a shear force of about 550 kN. Fol-lowing this load level, however, the cyclically loaded spec-imen exhibited a much stronger response than the speci-men loaded monotonically (60 % greater shear strength).This counterintuitive result can be explained with the helpof the five-spring model. The prediction of the model with-out modifications is shown by the red line in the plot. Thisprediction slightly overestimates the shear strength ofspecimen S0M and significantly underestimates that ofS0C. The two black prediction lines in the plot are ob-tained by scaling the effective width of the loading platelb1e from Eq. (1). A smaller lb1e means that the criticalcrack propagates towards a point that is closer to the inneredge of the loading plate, and thus the CLZ is smaller, seeFig. 4. Inversely, a larger lb1e means a larger CLZ becausethe critical crack propagates towards a point that is fur-ther along the loading plate. It can be seen from the lowerblack line that a scale factor of 0.85 results in an accurateprediction of the response of specimen S0M. Similarly, afactor of 2 allows for an accurate prediction of the re-sponse of specimen S0C. These results are consistent withthe two photographs in Fig. 8, which show the CLZs of thebeams after failure. It can be seen that the CLZ of speci-men S0M was significantly smaller than that of S0C due to
0 2 4 6 8 10 12 14 16 180
0.2
0.4
0.6
0.8
1
Δ, mm
Nor
mal
ized
defle
ctio
n
0 2 4 6 8 10 12 14 16 180
100
200
300
400
500
600
700
800
900
1000
Δ, mm
V, k
N
Δt /Δ
Δc /Δ
model
exp S1C
VCLZ
Vci
Vs
Vd
model
exp.
Vsect
Vcr,sh
V cr,fl
5sm
Fig. 6. Measured and predicted responses of specimens S1M and S1C
Δ = 4.3 mm Δ = 6.2 mm
Δ = 8.2 mm (shear failure) Δ = 11.0 mm (post-peak)
exp. model
Fig. 7. Measured (triangular mesh) and predicted (green dots) deformedshapes x30 – specimen S1C

79
B. Mihaylov · Five-spring model for complete shear behaviour of deep beams
Structural Concrete (2015), No. 1
the different paths of the critical cracks in the vicinity ofthe loading plates. This difference cannot be attributed tothe load reversals in test S0C because the reversals wereperformed after the critical diagonal crack had fully prop-agated. The difference is instead explained by local varia-tions in the concrete properties which affected the path ofthe critical cracks. By comparing the curves in Figs. 8 and6, it can be concluded that the addition of 0.10 % of stir-rups in specimens S1M and S1C effectively eliminatedthis effect.
4.3 Effect of span-to-depth and transverse reinforcementratios
Specimens S0M/C and S1M/C were part of a larger ex-perimental programme that involved nine shear-criticaldeep beam specimens, see Table 1. The first eight of thesespecimens were designed to study the effect of loading his-tory (monotonic vs. reversed cyclic loading), amount oftransverse reinforcement (no stirrups vs. ρv = 0.10 %) andeffect of shear-span-to-depth ratio (a/d = 1.55 vs. 2.28)[19]. The envelopes of the measured load–displacement re-sponses of these beams (except for S0C) are shown by thinlines in Fig. 9, whereas the predictions of the five-springmodel are shown by thick lines. The red and green curveswere already discussed in reference to Figs. 6 and 8 re-spectively. By comparing these curves once again, it canbe seen that the stirrups in specimens S1M/C resulted in asignificant increase in shear strength, also slightly less brit-tle post-peak behaviour. Specimens L1M and L1C were
similar to S1M and S1C but had a longer shear span a.These members with a/d = 2.28 can be considered as be-ing in the transition zone between deep and slenderbeams. The five-spring model provides excellent predic-tions for the pre-peak behaviour of the two beams but un-derestimates their post-peak resistance. This conservativeprediction is attributed to the modelling of the shear resis-tance provided by the transverse reinforcement. The largedeformations in the post-peak regime of slender beams re-sult in the activation of more stirrups along the shear spanthan assumed in Eq. (20). Specimens L0M and L0C, onthe other hand, had no stirrups and exhibited a more brit-tle response, captured by the five-spring model. Similarlyto specimens S0M/C, the two longer beams without stir-rups had significantly different shear strengths, whichwere attributed to variations in the path of the critical di-agonal cracks.
4.4 Effect of bond between flexural reinforcement andconcrete
The last specimen from the Toronto series discussed inthis paper is specimen SB [20], see Table 1. This beam hadthe same overall dimensions as specimens S0M/C but wasreinforced with a single #18 (57 mm dia.) headed barplaced 130 mm from the bottom of the section. Fig. 10shows the load–displacement response of the specimenand the measured crack pattern of the beam at shear fail-ure. The big bar caused splitting of the concrete cover onthe bottom face of the beam, which resulted in an almostcomplete loss of bond between bar and concrete. This wasconfirmed by strain gauge measurements along the barwhich showed a nearly constant strain profile from an-chor head to anchor head prior to failure. Owing to theloss of bond, the beam did not develop diagonal cracksbut only two steep flexure-shear cracks, one on each sideof the midspan section. The shear failure occurred alongone of these cracks, with crushing of the concrete in theCLZ.
0 2 4 6 8 10 12 14 16 180
200
400
600
800
1000
1200
Δ, mm
V, k
N model1 lb1e
model2 lb1e
model0.85 lb1e
exp.S0M
exp.S0C
Fig. 8. Effect of size of critical loading zone (CLZ) lb1e on shear behaviour ofdeep beams
0 2 4 6 8 10 12 14 16 18 200
100
200
300
400
500
600
700
800
900
1000
Δ, mm
V, k
N
thin lines = experimentthick lines = five-spring model
S1M/Ca/d=1.55, ρv=0.1%
S0Ma/d=1.55,
ρv=0
L0M/Ca/d=2.28,
ρv=0
L1M/Ca/d=2.28, ρv=0.1%
Fig. 9. Measured and predicted V-Δ responses of Toronto test series
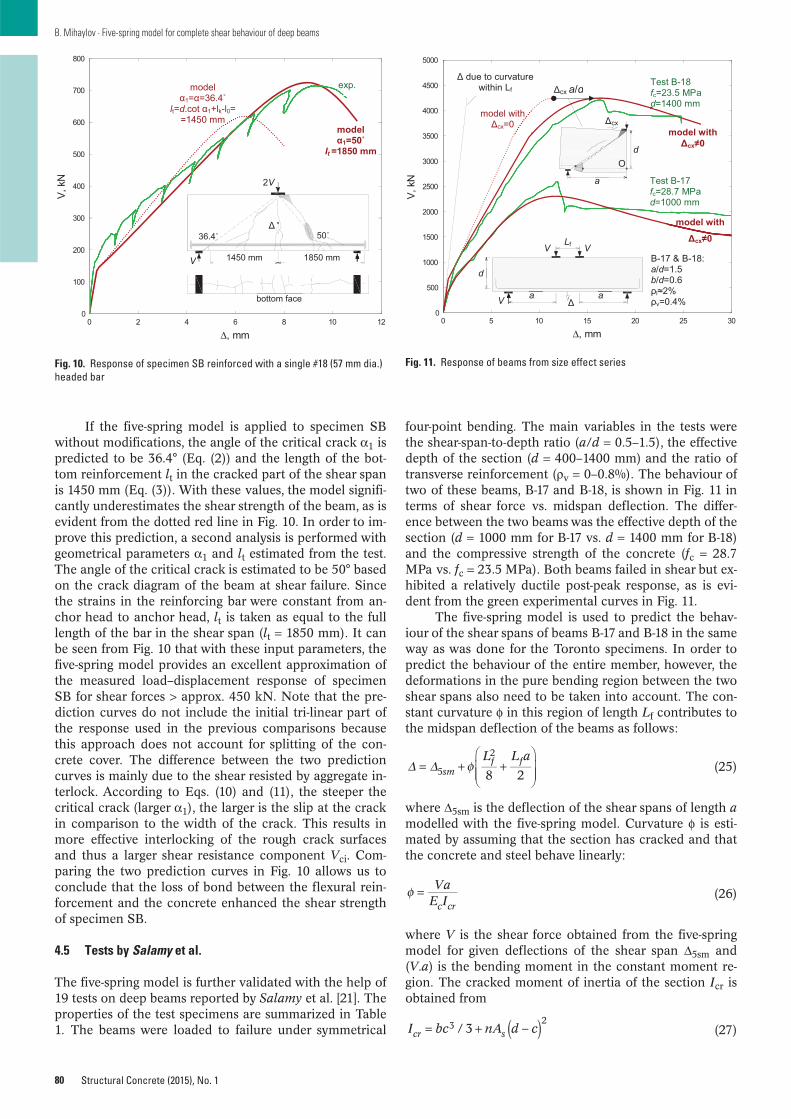
80
B. Mihaylov · Five-spring model for complete shear behaviour of deep beams
Structural Concrete (2015), No. 1
If the five-spring model is applied to specimen SBwithout modifications, the angle of the critical crack α1 ispredicted to be 36.4° (Eq. (2)) and the length of the bot-tom reinforcement lt in the cracked part of the shear spanis 1450 mm (Eq. (3)). With these values, the model signifi-cantly underestimates the shear strength of the beam, as isevident from the dotted red line in Fig. 10. In order to im-prove this prediction, a second analysis is performed withgeometrical parameters α1 and lt estimated from the test.The angle of the critical crack is estimated to be 50° basedon the crack diagram of the beam at shear failure. Sincethe strains in the reinforcing bar were constant from an-chor head to anchor head, lt is taken as equal to the fulllength of the bar in the shear span (lt = 1850 mm). It canbe seen from Fig. 10 that with these input parameters, thefive-spring model provides an excellent approximation ofthe measured load–displacement response of specimenSB for shear forces > approx. 450 kN. Note that the pre-diction curves do not include the initial tri-linear part ofthe response used in the previous comparisons becausethis approach does not account for splitting of the con-crete cover. The difference between the two predictioncurves is mainly due to the shear resisted by aggregate in-terlock. According to Eqs. (10) and (11), the steeper thecritical crack (larger α1), the larger is the slip at the crackin comparison to the width of the crack. This results inmore effective interlocking of the rough crack surfacesand thus a larger shear resistance component Vci. Com-paring the two prediction curves in Fig. 10 allows us toconclude that the loss of bond between the flexural rein-forcement and the concrete enhanced the shear strengthof specimen SB.
4.5 Tests by Salamy et al.
The five-spring model is further validated with the help of19 tests on deep beams reported by Salamy et al. [21]. Theproperties of the test specimens are summarized in Table1. The beams were loaded to failure under symmetrical
four-point bending. The main variables in the tests werethe shear-span-to-depth ratio (a/d = 0.5–1.5), the effectivedepth of the section (d = 400–1400 mm) and the ratio oftransverse reinforcement (ρv = 0–0.8%). The behaviour oftwo of these beams, B-17 and B-18, is shown in Fig. 11 interms of shear force vs. midspan deflection. The differ-ence between the two beams was the effective depth of thesection (d = 1000 mm for B-17 vs. d = 1400 mm for B-18)and the compressive strength of the concrete (fc = 28.7MPa vs. fc = 23.5 MPa). Both beams failed in shear but ex-hibited a relatively ductile post-peak response, as is evi-dent from the green experimental curves in Fig. 11.
The five-spring model is used to predict the behav-iour of the shear spans of beams B-17 and B-18 in the sameway as was done for the Toronto specimens. In order topredict the behaviour of the entire member, however, thedeformations in the pure bending region between the twoshear spans also need to be taken into account. The con-stant curvature φ in this region of length Lf contributes tothe midspan deflection of the beams as follows:
(25)
where Δ5sm is the deflection of the shear spans of length amodelled with the five-spring model. Curvature φ is esti-mated by assuming that the section has cracked and thatthe concrete and steel behave linearly:
(26)
where V is the shear force obtained from the five-springmodel for given deflections of the shear span Δ5sm and(V.a) is the bending moment in the constant moment re-gion. The cracked moment of inertia of the section Icr isobtained from
(27)
VaE Ic cr
L L a
8 2smf f
5
2
I bc nA d c/ 3cr s3 2
0 2 4 6 8 10 120
100
200
300
400
500
600
700
800
Δ, mm
V, k
N
modelα1=50˚
lt =1850 mm
modelα1=α=36.4˚
lt=d.cot α1+lk-l0==1450 mm
exp.
36.4˚ 50˚
1850 mm1450 mmV
2V
bottom face
Δ
Fig. 10. Response of specimen SB reinforced with a single #18 (57 mm dia.)headed bar
0 5 10 15 20 25 300
500
1000
1500
2000
2500
3000
3500
4000
4500
5000
Δ, mm
V, k
N
V
VV
Δ
d
a a
Lf
Δcx a/d
O
Δcx
a
d
Test B-18fc=23.5 MPad=1400 mm
B-17 & B-18:a/d=1.5b/d=0.6ρl≈2%ρv=0.4%
model withΔcx≠0
Test B-17fc=28.7 MPad=1000 mm
model withΔcx=0
model with
Δcx≠0
Δ due to curvature within Lf
Fig. 11. Response of beams from size effect series
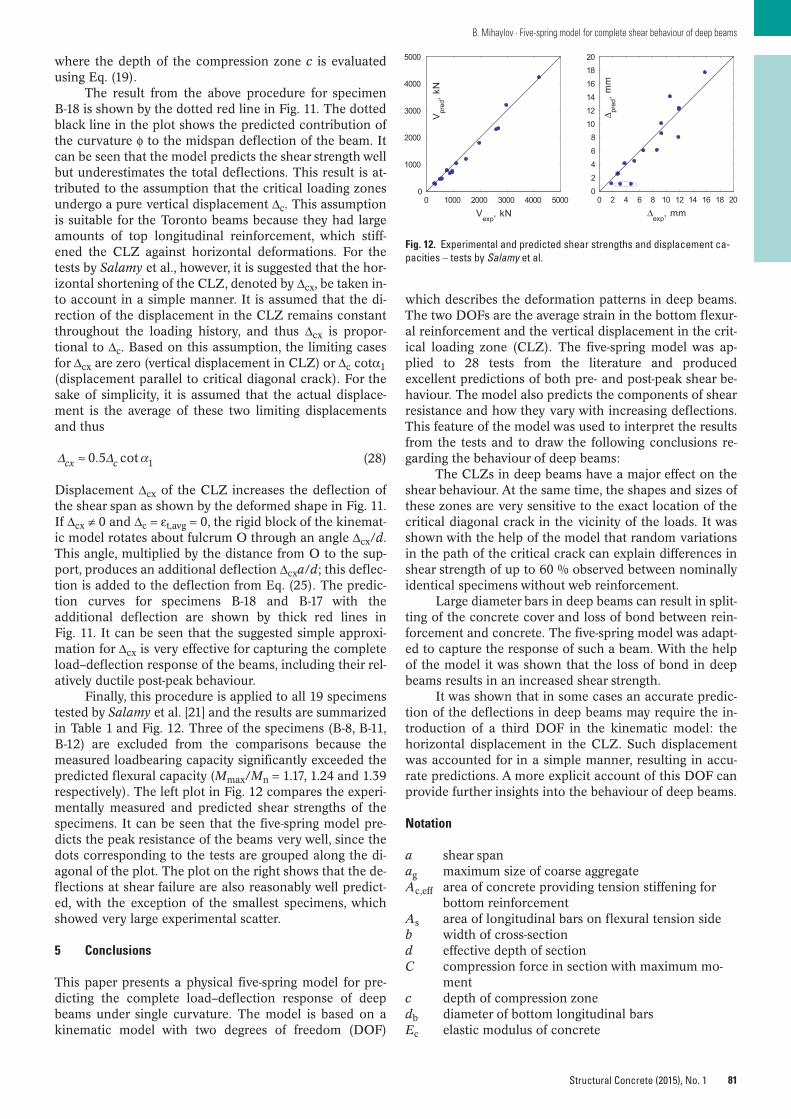
81
B. Mihaylov · Five-spring model for complete shear behaviour of deep beams
Structural Concrete (2015), No. 1
where the depth of the compression zone c is evaluatedusing Eq. (19).
The result from the above procedure for specimenB-18 is shown by the dotted red line in Fig. 11. The dottedblack line in the plot shows the predicted contribution ofthe curvature φ to the midspan deflection of the beam. Itcan be seen that the model predicts the shear strength wellbut underestimates the total deflections. This result is at-tributed to the assumption that the critical loading zonesundergo a pure vertical displacement Δc. This assumptionis suitable for the Toronto beams because they had largeamounts of top longitudinal reinforcement, which stiff-ened the CLZ against horizontal deformations. For thetests by Salamy et al., however, it is suggested that the hor-izontal shortening of the CLZ, denoted by Δcx, be taken in-to account in a simple manner. It is assumed that the di-rection of the displacement in the CLZ remains constantthroughout the loading history, and thus Δcx is propor-tional to Δc. Based on this assumption, the limiting casesfor Δcx are zero (vertical displacement in CLZ) or Δc cotα1(displacement parallel to critical diagonal crack). For thesake of simplicity, it is assumed that the actual displace-ment is the average of these two limiting displacementsand thus
(28)
Displacement Δcx of the CLZ increases the deflection ofthe shear span as shown by the deformed shape in Fig. 11.If Δcx ≠ 0 and Δc = εt,avg = 0, the rigid block of the kinemat-ic model rotates about fulcrum O through an angle Δcx/d.This angle, multiplied by the distance from O to the sup-port, produces an additional deflection Δcxa/d; this deflec-tion is added to the deflection from Eq. (25). The predic-tion curves for specimens B-18 and B-17 with theadditional deflection are shown by thick red lines inFig. 11. It can be seen that the suggested simple approxi-mation for Δcx is very effective for capturing the completeload–deflection response of the beams, including their rel-atively ductile post-peak behaviour.
Finally, this procedure is applied to all 19 specimenstested by Salamy et al. [21] and the results are summarizedin Table 1 and Fig. 12. Three of the specimens (B-8, B-11,B-12) are excluded from the comparisons because themeasured loadbearing capacity significantly exceeded thepredicted flexural capacity (Mmax/Mn = 1.17, 1.24 and 1.39respectively). The left plot in Fig. 12 compares the experi-mentally measured and predicted shear strengths of thespecimens. It can be seen that the five-spring model pre-dicts the peak resistance of the beams very well, since thedots corresponding to the tests are grouped along the di-agonal of the plot. The plot on the right shows that the de-flections at shear failure are also reasonably well predict-ed, with the exception of the smallest specimens, whichshowed very large experimental scatter.
5 Conclusions
This paper presents a physical five-spring model for pre-dicting the complete load–deflection response of deepbeams under single curvature. The model is based on akinematic model with two degrees of freedom (DOF)
0.5 cotcx c 1
which describes the deformation patterns in deep beams.The two DOFs are the average strain in the bottom flexur-al reinforcement and the vertical displacement in the crit-ical loading zone (CLZ). The five-spring model was ap-plied to 28 tests from the literature and producedexcellent predictions of both pre- and post-peak shear be-haviour. The model also predicts the components of shearresistance and how they vary with increasing deflections.This feature of the model was used to interpret the resultsfrom the tests and to draw the following conclusions re-garding the behaviour of deep beams:
The CLZs in deep beams have a major effect on theshear behaviour. At the same time, the shapes and sizes ofthese zones are very sensitive to the exact location of thecritical diagonal crack in the vicinity of the loads. It wasshown with the help of the model that random variationsin the path of the critical crack can explain differences inshear strength of up to 60 % observed between nominallyidentical specimens without web reinforcement.
Large diameter bars in deep beams can result in split-ting of the concrete cover and loss of bond between rein-forcement and concrete. The five-spring model was adapt-ed to capture the response of such a beam. With the helpof the model it was shown that the loss of bond in deepbeams results in an increased shear strength.
It was shown that in some cases an accurate predic-tion of the deflections in deep beams may require the in-troduction of a third DOF in the kinematic model: thehorizontal displacement in the CLZ. Such displacementwas accounted for in a simple manner, resulting in accu-rate predictions. A more explicit account of this DOF canprovide further insights into the behaviour of deep beams.
Notation
a shear spanag maximum size of coarse aggregateAc,eff area of concrete providing tension stiffening for
bottom reinforcementAs area of longitudinal bars on flexural tension sideb width of cross-sectiond effective depth of sectionC compression force in section with maximum mo-
mentc depth of compression zonedb diameter of bottom longitudinal barsEc elastic modulus of concrete
0 1000 2000 3000 4000 50000
1000
2000
3000
4000
5000
Vexp
, kN
Vpr
ed, k
N
0 2 4 6 8 10 12 14 16 18 2002468
101214161820
Δexp
, mm
Δ pred
, mm
Fig. 12. Experimental and predicted shear strengths and displacement ca-pacities – tests by Salamy et al.
82
B. Mihaylov · Five-spring model for complete shear behaviour of deep beams
Structural Concrete (2015), No. 1
Es elastic modulus of steelfc concrete cylinder strengthfy yield strength of bottom longitudinal barsfyv yield strength of stirrupsh total depth of sectionIcr moment of inertia of cracked sectionk crack shape factor Lf length of pure flexure regionl0 length of heavily cracked zone at bottom of critical
diagonal cracklb1 width of loading plate parallel to longitudinal axis
of memberlb1e effective width of loading plate parallel to longitu-
dinal axis of memberlb2 width of support plate parallel to longitudinal axis
of memberlk length of dowels provided by bottom longitudinal
reinforcementlt length of bottom reinforcement within cracked
part of shear spanMmax maximum bending moment in beam correspond-
ing to measured shear strengthMn predicted flexural capacity of sectionNcr cracking force of zone influenced by bottom rein-
forcementn ratio of elastic moduli of steel and concretenb number of bottom longitudinal barsP applied concentrated loads slip displacement in critical diagonal crackscr distance between radial cracks along bottom longi-
tudinal reinforcementT tensile force in bottom reinforcementV shear forceVexp measured shear strengthVpred predicted shear strengthVcr,fl shear corresponding to flexural crackingVcr,sh shear corresponding to the propagation of critical
diagonal crackVsect sectional shear strengthVCLZ shear resisted by CLZVci shear resisted by aggregate interlockvci aggregate interlock shear stressVd shear resisted by dowel actionVs shear resisted by stirrupsw width of critical diagonal crack halfway along
crackα angle of line extending from inner edge of support
plate to far edge of tributary area of loading plateresponsible for shear force V
α1 angle of critical diagonal crackδx displacement along x axisδz displacement along z axisφ curvature in pure flexure regionθ angle of diagonal cracks in uniform stress fieldΔ midspan deflection of beamΔexp measured midspan deflection at shear failureΔpred predicted midspan deflection at shear failureΔcr,sh midspan deflection corresponding to Vcr,shΔ5sm deflection of shear span given by five-spring modelΔc transverse displacement of CLZΔt deflection of shear span due to elongation of bot-
tom longitudinal reinforcement
ε diagonal compressive strains in CLZεmax maximum diagonal compressive strain in CLZεd average compressive strain along radial strut adja-
cent to critical diagonal crackεt,avg average strain in bottom longitudinal reinforce-
mentεv strain in transverse reinforcement in critical diago-
nal crack halfway along crackρl ratio of bottom longitudinal reinforcementρv ratio of transverse reinforcementσ diagonal compressive stress in CLZσavg average diagonal compressive stress in CLZσv stress in transverse reinforcement
References
1. Kaneko, Y., Mihashi, H.: Shear Softening Characteristics ofReinforced Concrete Deep Beams. Finite Element Analysisof RC Structures, American Concrete Institute, SP-237-14,2006, pp. 205–225.
2. Ruiz, M. F., Muttoni, A.: On Development of Suitable StressFields for Structural Concrete. ACI Structural Journal, vol.104, No. 4, 2007, pp. 495–502.
3. Schlaich, J., Schäfer, K., Jennewein, M.: Toward a ConsistentDesign of Structural Concrete. PCI Journal, vol. 32, No. 3,1987, pp. 74–150.
4. CSA Committee A23.3.: Design of Concrete Structures,Canadian Standards Association, Mississauga, Ontario,2005.
5. European Committee for Standardization: EN 1992-1-1 Eu-rocode 2: Design of Concrete Structures – Part 1-1: GeneralRules and Rules for Buildings. CEN, Brussels, 2004.
6. ACI Committee 318: Building Code Requirements for Rein-forced Concrete (ACI 318-08) and Commentary (318R-08).American Concrete Institute, Farmington Hills, Mich., 2008.
7. Salem, H. M., Maekawa, K.: Computer-Aided Analysis of Re-inforced Concrete Using a Refined Nonlinear Strut and TieModel Approach. Journal of Advanced Concrete Technolo-gy, vol. 4, No. 2, 2006, pp. 325–336.
8. Eom, T. S., Park, H. G.: Secant Stiffness Method for InelasticDesign of Strut-and-Tie Model. ACI Structural Journal, vol.107, No. 6, 2010, pp. 689–698.
9. Scott, R. M., Mander, J. B., Bracci, J. M.: Compatibility Strut-and-Tie Modeling: Part I – Formulation. ACI Structural Jour-nal, vol. 109, No. 5, 2012, pp. 635–644.
10. Barbachyn, S. M., Kurama, Y. C., Novak, L. C.: AnalyticalEvaluation of Diagonally Reinforced Concrete CouplingBeams under Lateral Loads. ACI Structural Journal, vol. 109,No. 4, 2012, pp. 497–507.
11. Mihaylov, B. I., Bentz, E. C., Collins, M. P.: Two-ParameterKinematic Theory for Shear Behavior of Deep Beams. ACIStructural Journal, vol. 110, No. 3, 2013, pp. 447–456.
12. Mihaylov, B. I., Bentz, E. C., Collins, M. P.: A Two Degree ofFreedom Kinematic Model for Predicting the Deformationsof Deep Beams. CSCE 2nd Intl. Engineering Mechanics &Materials Specialty Conf., Jun 2011.
13. fib - International Federation for Structural Concrete. fibModel Code for Concrete Structures 2010. Berlin: VerlagErnst & Sohn, 2013.
14. Sigrist, V., Bentz, E. C., Ruiz, M. F., Foster, S., Muttoni, A.:Background to the fib Model Code 2010 Shear Provisions –Part I: Beams and Slabs. Structural Concrete, vol. 14, No. 3,2013, pp. 195–203.
15. Bentz, E. C., Vecchio, F. J., Collins, M. P.: Simplified Modi-fied Compression Field Theory for Calculating Shear

83
B. Mihaylov · Five-spring model for complete shear behaviour of deep beams
Structural Concrete (2015), No. 1
Strength of Reinforced Concrete Elements. ACI StructuralJournal, vol. 103, No. 4, 2006, pp. 614–624.
16. Vecchio, F. J., Collins, M. P.: The Modified Compression-Field Theory for Reinforced Concrete Elements Subjected toShear. ACI Structural Journal, vol. 83, No. 2, 1986, pp.219–231.
17. Popovics, S.: A Review of Stress–strain Relationships forConcrete. ACI Journal, vol. 67, No. 3, 1970, pp. 243–248.
18. Li, B., Maekawa, K., Okamura, H.: Contact Density Modelfor Stress Transfer Across Cracks in Concrete. J. FacultyEng., University of Tokyo (B), vol. 40, No. 1, 1989, pp. 9–52.
19. Mihaylov, B. I., Bentz, E. C., Collins, M. P.: Behavior ofLarge Deep Beam Subjected to Monotonic and ReversedCyclic Shear. ACI Structural Journal, vol. 107, No. 6, 2010,pp. 726–734.
20. Mihaylov, B. I., Bentz, E. C., Collins, M. P.: Behavior ofDeep Beams with Large Headed Bars. ACI Structural Jour-nal, vol. 110, No. 6, 2013, pp. 1013–1021.
21. Salamy, M. R., Kobayashi, H., Unjoh, S.: Experimental andAnalytical Study on RC Deep Beams. Asian Journal of CivilEngineering (AJCE), vol. 6, No. 5, 2005, pp. 409–422.
Boyan Mihaylov, PhDAssistant ProfessorUniversity of LiegeDepartment of ArGEnCoBuilding B52, Room +1/417Chemin des Chevreuils, 1B-4000 Liège, [email protected]
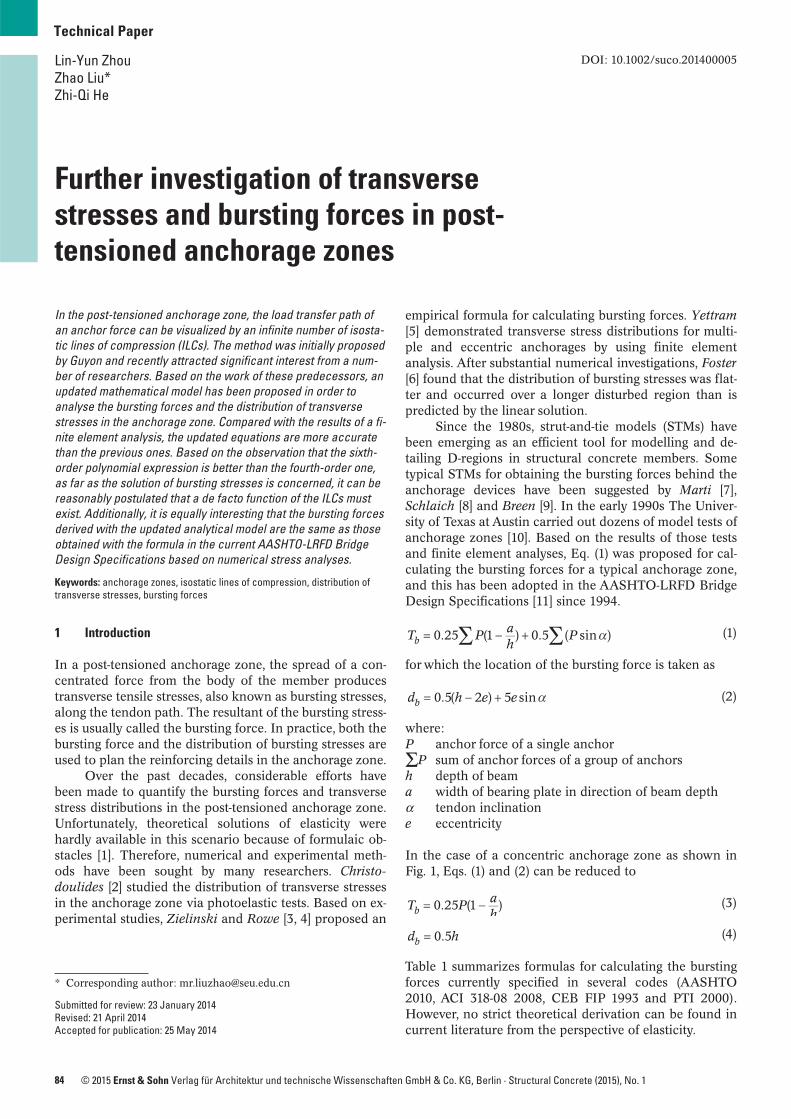
84 © 2015 Ernst & Sohn Verlag für Architektur und technische Wissenschaften GmbH & Co. KG, Berlin · Structural Concrete (2015), No. 1
Technical Paper
DOI: 10.1002/suco.201400005
In the post-tensioned anchorage zone, the load transfer path ofan anchor force can be visualized by an infinite number of isosta-tic lines of compression (ILCs). The method was initially proposedby Guyon and recently attracted significant interest from a num-ber of researchers. Based on the work of these predecessors, anupdated mathematical model has been proposed in order toanalyse the bursting forces and the distribution of transversestresses in the anchorage zone. Compared with the results of a fi-nite element analysis, the updated equations are more accuratethan the previous ones. Based on the observation that the sixth-order polynomial expression is better than the fourth-order one,as far as the solution of bursting stresses is concerned, it can bereasonably postulated that a de facto function of the ILCs mustexist. Additionally, it is equally interesting that the bursting forcesderived with the updated analytical model are the same as thoseobtained with the formula in the current AASHTO-LRFD BridgeDesign Specifications based on numerical stress analyses.
Keywords: anchorage zones, isostatic lines of compression, distribution oftransverse stresses, bursting forces
1 Introduction
In a post-tensioned anchorage zone, the spread of a con-centrated force from the body of the member producestransverse tensile stresses, also known as bursting stresses,along the tendon path. The resultant of the bursting stress-es is usually called the bursting force. In practice, both thebursting force and the distribution of bursting stresses areused to plan the reinforcing details in the anchorage zone.
Over the past decades, considerable efforts havebeen made to quantify the bursting forces and transversestress distributions in the post-tensioned anchorage zone.Unfortunately, theoretical solutions of elasticity werehardly available in this scenario because of formulaic ob-stacles [1]. Therefore, numerical and experimental meth-ods have been sought by many researchers. Christo -doulides [2] studied the distribution of transverse stressesin the anchorage zone via photoelastic tests. Based on ex-perimental studies, Zielinski and Rowe [3, 4] proposed an
empirical formula for calculating bursting forces. Yettram[5] demonstrated transverse stress distributions for multi-ple and eccentric anchorages by using finite elementanalysis. After substantial numerical investigations, Foster[6] found that the distribution of bursting stresses was flat-ter and occurred over a longer disturbed region than ispredicted by the linear solution.
Since the 1980s, strut-and-tie models (STMs) havebeen emerging as an efficient tool for modelling and de-tailing D-regions in structural concrete members. Sometypical STMs for obtaining the bursting forces behind theanchorage devices have been suggested by Marti [7],Schlaich [8] and Breen [9]. In the early 1990s The Univer-sity of Texas at Austin carried out dozens of model tests ofanchorage zones [10]. Based on the results of those testsand finite element analyses, Eq. (1) was proposed for cal-culating the bursting forces for a typical anchorage zone,and this has been adopted in the AASHTO-LRFD BridgeDesign Specifications [11] since 1994.
(1)
for which the location of the bursting force is taken as
(2)
where:P anchor force of a single anchor
ΣP sum of anchor forces of a group of anchorsh depth of beama width of bearing plate in direction of beam depthα tendon inclinatione eccentricity
In the case of a concentric anchorage zone as shown inFig. 1, Eqs. (1) and (2) can be reduced to
(3)
(4)
Table 1 summarizes formulas for calculating the burstingforces currently specified in several codes (AASHTO2010, ACI 318-08 2008, CEB FIP 1993 and PTI 2000).However, no strict theoretical derivation can be found incurrent literature from the perspective of elasticity.
0.25 (1 ) 0.5 ( sin )T P ah
Pb
0.5( 2 ) 5 sind h e eb
0.25 (1 )T P ahb
0.5d hb
Further investigation of transversestresses and bursting forces in post-tensioned anchorage zones
Lin-Yun ZhouZhao Liu*Zhi-Qi He
* Corresponding author: [email protected]
Submitted for review: 23 January 2014Revised: 21 April 2014Accepted for publication: 25 May 2014
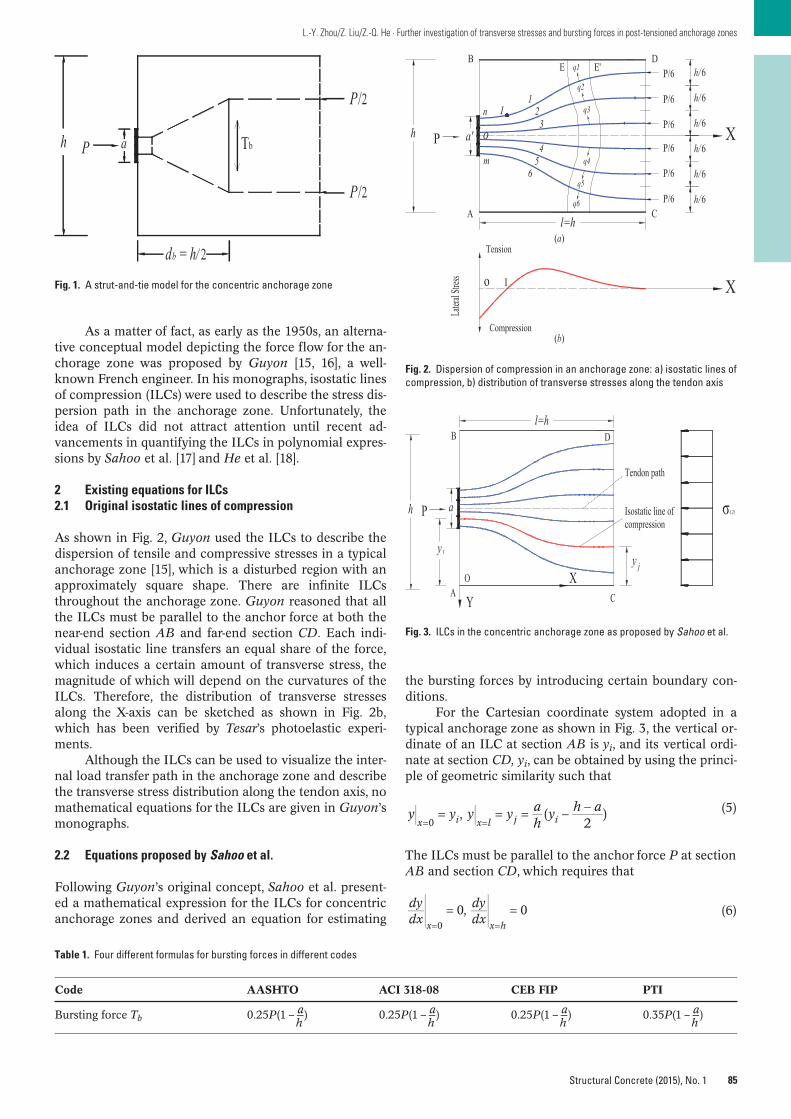
85
L.-Y. Zhou/Z. Liu/Z.-Q. He · Further investigation of transverse stresses and bursting forces in post-tensioned anchorage zones
Structural Concrete (2015), No. 1
the bursting forces by introducing certain boundary con-ditions.
For the Cartesian coordinate system adopted in atypical anchorage zone as shown in Fig. 3, the vertical or-dinate of an ILC at section AB is yi, and its vertical ordi-nate at section CD, yi, can be obtained by using the princi-ple of geometric similarity such that
(5)
The ILCs must be parallel to the anchor force P at sectionAB and section CD, which requires that
(6)
, (2
)0
y y y y ah
y h ax i x l j i
0, 00
dydx
dydxx x h
As a matter of fact, as early as the 1950s, an alterna-tive conceptual model depicting the force flow for the an-chorage zone was proposed by Guyon [15, 16], a well-known French engineer. In his monographs, isostatic linesof compression (ILCs) were used to describe the stress dis-persion path in the anchorage zone. Unfortunately, theidea of ILCs did not attract attention until recent ad-vancements in quantifying the ILCs in polynomial expres-sions by Sahoo et al. [17] and He et al. [18].
2 Existing equations for ILCs2.1 Original isostatic lines of compression
As shown in Fig. 2, Guyon used the ILCs to describe thedispersion of tensile and compressive stresses in a typicalanchorage zone [15], which is a disturbed region with anapproximately square shape. There are infinite ILCsthroughout the anchorage zone. Guyon reasoned that allthe ILCs must be parallel to the anchor force at both thenear-end section AB and far-end section CD. Each indi-vidual isostatic line transfers an equal share of the force,which induces a certain amount of transverse stress, themagnitude of which will depend on the curvatures of theILCs. Therefore, the distribution of transverse stressesalong the X-axis can be sketched as shown in Fig. 2b,which has been verified by Tesar’s photoelastic experi-ments.
Although the ILCs can be used to visualize the inter-nal load transfer path in the anchorage zone and describethe transverse stress distribution along the tendon axis, nomathematical equations for the ILCs are given in Guyon’smonographs.
2.2 Equations proposed by Sahoo et al.
Following Guyon’s original concept, Sahoo et al. present-ed a mathematical expression for the ILCs for concentricanchorage zones and derived an equation for estimating
Fig. 1. A strut-and-tie model for the concentric anchorage zone
Table 1. Four different formulas for bursting forces in different codes
Code AASHTO ACI 318-08 CEB FIP PTI
Bursting force Tb 0.25P(1 – a–h
) 0.25P(1 – a–h
) 0.25P(1 – a–h
) 0.35P(1 – a–h
)
Fig. 2. Dispersion of compression in an anchorage zone: a) isostatic lines ofcompression, b) distribution of transverse stresses along the tendon axis
Fig. 3. ILCs in the concentric anchorage zone as proposed by Sahoo et al.
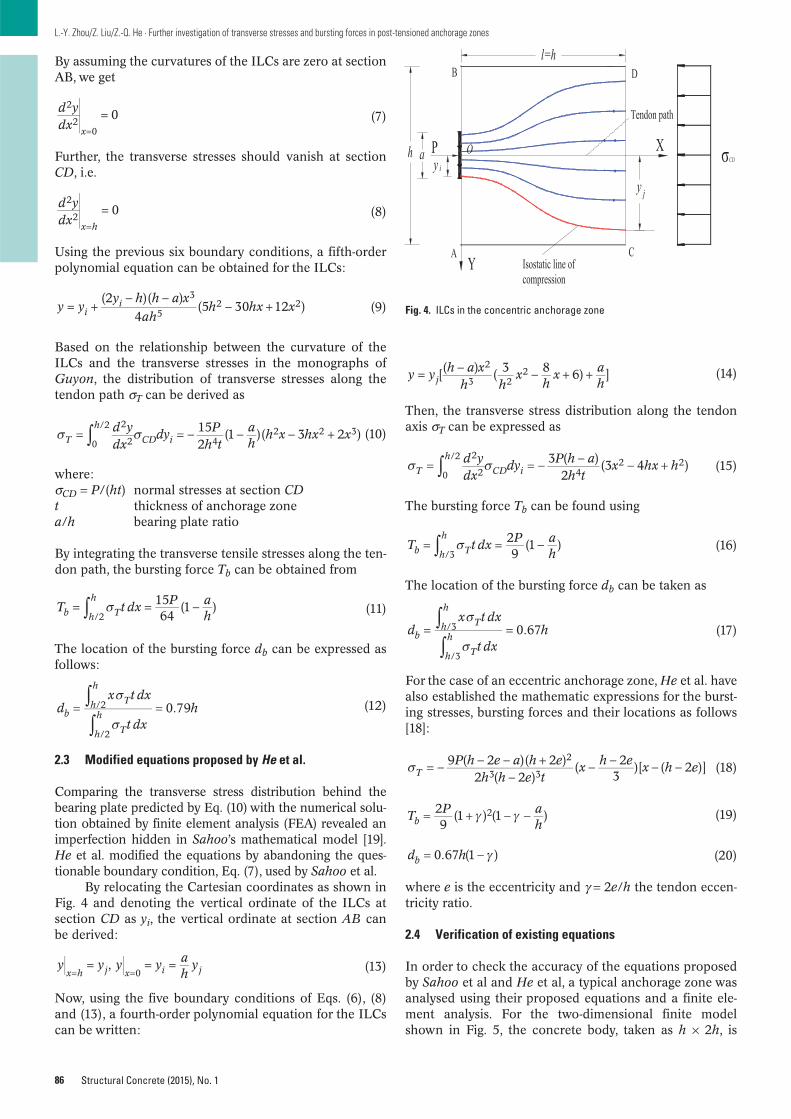
86
L.-Y. Zhou/Z. Liu/Z.-Q. He · Further investigation of transverse stresses and bursting forces in post-tensioned anchorage zones
Structural Concrete (2015), No. 1
By assuming the curvatures of the ILCs are zero at sectionAB, we get
(7)
Further, the transverse stresses should vanish at sectionCD, i.e.
(8)
Using the previous six boundary conditions, a fifth-orderpolynomial equation can be obtained for the ILCs:
(9)
Based on the relationship between the curvature of theILCs and the transverse stresses in the monographs ofGuyon, the distribution of transverse stresses along thetendon path σT can be derived as
(10)
where:σCD = P/(ht) normal stresses at section CDt thickness of anchorage zonea/h bearing plate ratio
By integrating the transverse tensile stresses along the ten-don path, the bursting force Tb can be obtained from
(11)
The location of the bursting force db can be expressed asfollows:
(12)
2.3 Modified equations proposed by He et al.
Comparing the transverse stress distribution behind thebearing plate predicted by Eq. (10) with the numerical solu-tion obtained by finite element analysis (FEA) revealed animperfection hidden in Sahoo’s mathematical model [19].He et al. modified the equations by abandoning the ques-tionable boundary condition, Eq. (7), used by Sahoo et al.
By relocating the Cartesian coordinates as shown inFig. 4 and denoting the vertical ordinate of the ILCs atsection CD as yi, the vertical ordinate at section AB canbe derived:
(13)
Now, using the five boundary conditions of Eqs. (6), (8)and (13), a fourth-order polynomial equation for the ILCscan be written:
0.79/2
/2
dx t dx
t dxhb
Th
h
Th
h
152
(1 )( 3 2 )2
20
/2
42 2 3d y
dxdy P
h tah
h x hx xT
h
CD i
1564
(1 )/2
T t dx P ahb Th
h
(2 )( )
4(5 30 12 )
3
52 2y y
y h h a xah
h hx xii
02
20
d ydx x
02
2d ydx x h
,0
y y y y ah
yx h j x i j
(14)
Then, the transverse stress distribution along the tendonaxis σT can be expressed as
(15)
The bursting force Tb can be found using
(16)
The location of the bursting force db can be taken as
(17)
For the case of an eccentric anchorage zone, He et al. havealso established the mathematic expressions for the burst-ing stresses, bursting forces and their locations as follows[18]:
(18)
(19)
(20)
where e is the eccentricity and γ = 2e/h the tendon eccen-tricity ratio.
2.4 Verification of existing equations
In order to check the accuracy of the equations proposedby Sahoo et al and He et al, a typical anchorage zone wasanalysed using their proposed equations and a finite ele-ment analysis. For the two-dimensional finite modelshown in Fig. 5, the concrete body, taken as h × 2h, is
0.67/3
/3
dx t dx
t dxhb
Th
h
Th
h
9 ( 2 )( 2 )2 ( 2 )
( 23
)[ ( 2 )]2
3 3P h e a h e
h h e tx h e x h eT
29
(1 ) (1 )2T P ahb
0.67 (1 )d hb
29
(1 )/3
T t dx P ahb Th
h
[( ) ( 3 8 6) ]2
3 22y y h a x
h hx
hx a
hj
3 ( )2
(3 4 )2
20
/2
42 2d y
dxdy P h a
h tx hx hT
h
CD i
Fig. 4. ILCs in the concentric anchorage zone
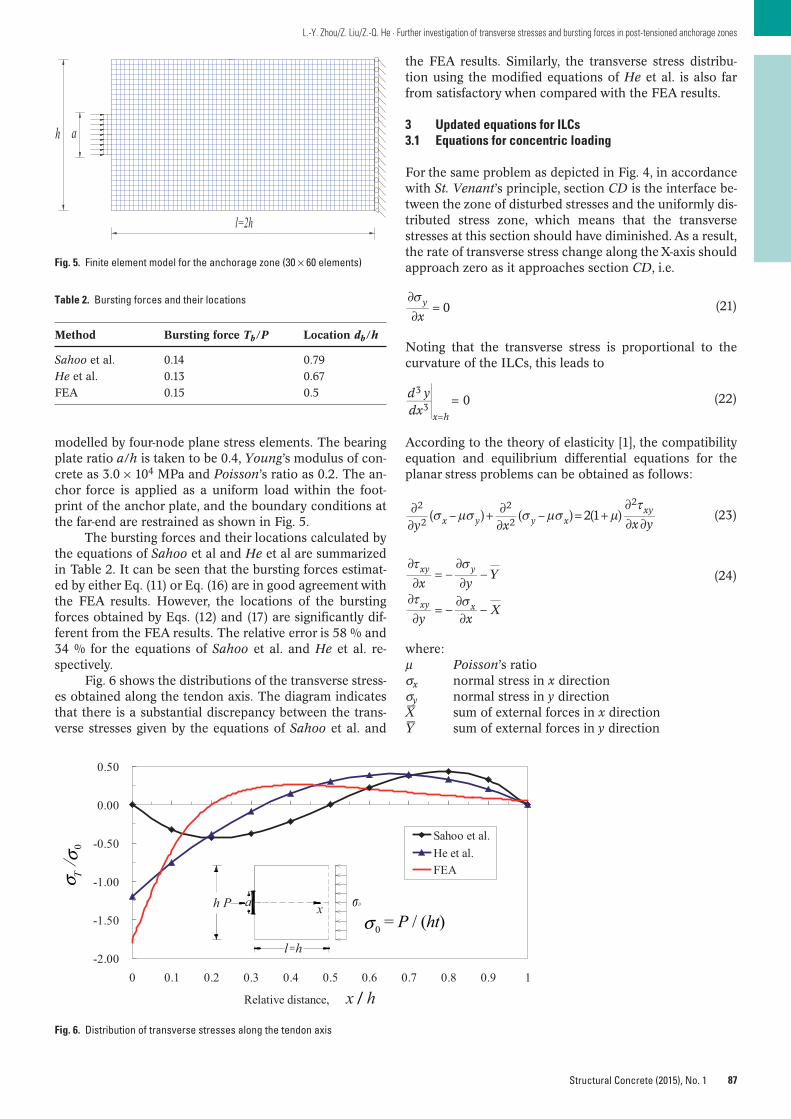
87
L.-Y. Zhou/Z. Liu/Z.-Q. He · Further investigation of transverse stresses and bursting forces in post-tensioned anchorage zones
Structural Concrete (2015), No. 1
the FEA results. Similarly, the transverse stress distribu-tion using the modified equations of He et al. is also farfrom satisfactory when compared with the FEA results.
3 Updated equations for ILCs3.1 Equations for concentric loading
For the same problem as depicted in Fig. 4, in accordancewith St. Venant’s principle, section CD is the interface be-tween the zone of disturbed stresses and the uniformly dis-tributed stress zone, which means that the transversestresses at this section should have diminished. As a result,the rate of transverse stress change along the X-axis shouldapproach zero as it approaches section CD, i.e.
(21)
Noting that the transverse stress is proportional to thecurvature of the ILCs, this leads to
(22)
According to the theory of elasticity [1], the compatibilityequation and equilibrium differential equations for theplanar stress problems can be obtained as follows:
(23)
(24)
where:μ Poisson’s ratioσx normal stress in x directionσy normal stress in y directionX– sum of external forces in x directionY– sum of external forces in y direction
03
3d ydx x h
0xy
( – ) ( – ) 2(1 )2
2
2
2
2
y x x yx y y xxy
x yY
y xX
xy y
xy x
modelled by four-node plane stress elements. The bearingplate ratio a/h is taken to be 0.4, Young’s modulus of con-crete as 3.0 × 10⁴ MPa and Poisson’s ratio as 0.2. The an-chor force is applied as a uniform load within the foot-print of the anchor plate, and the boundary conditions atthe far-end are restrained as shown in Fig. 5.
The bursting forces and their locations calculated bythe equations of Sahoo et al and He et al are summarizedin Table 2. It can be seen that the bursting forces estimat-ed by either Eq. (11) or Eq. (16) are in good agreement withthe FEA results. However, the locations of the burstingforces obtained by Eqs. (12) and (17) are significantly dif-ferent from the FEA results. The relative error is 58 % and34 % for the equations of Sahoo et al. and He et al. re-spectively.
Fig. 6 shows the distributions of the transverse stress-es obtained along the tendon axis. The diagram indicatesthat there is a substantial discrepancy between the trans-verse stresses given by the equations of Sahoo et al. and
Fig. 5. Finite element model for the anchorage zone (30 × 60 elements)
Table 2. Bursting forces and their locations
Method Bursting force Tb/P Location db/h
Sahoo et al. 0.14 0.79
He et al. 0.13 0.67
FEA 0.15 0.5
-2.00
-1.50
-1.00
-0.50
0.00
0.50
0 0.1 0.2 0.3 0.4 0.5 0.6 0.7 0.8 0.9 1
Relative distance,
Sahoo et al.He et al.FEA
x / h
0 = P / (ht)σ
σ T / σ
0
h P a x
l h
Fig. 6. Distribution of transverse stresses along the tendon axis
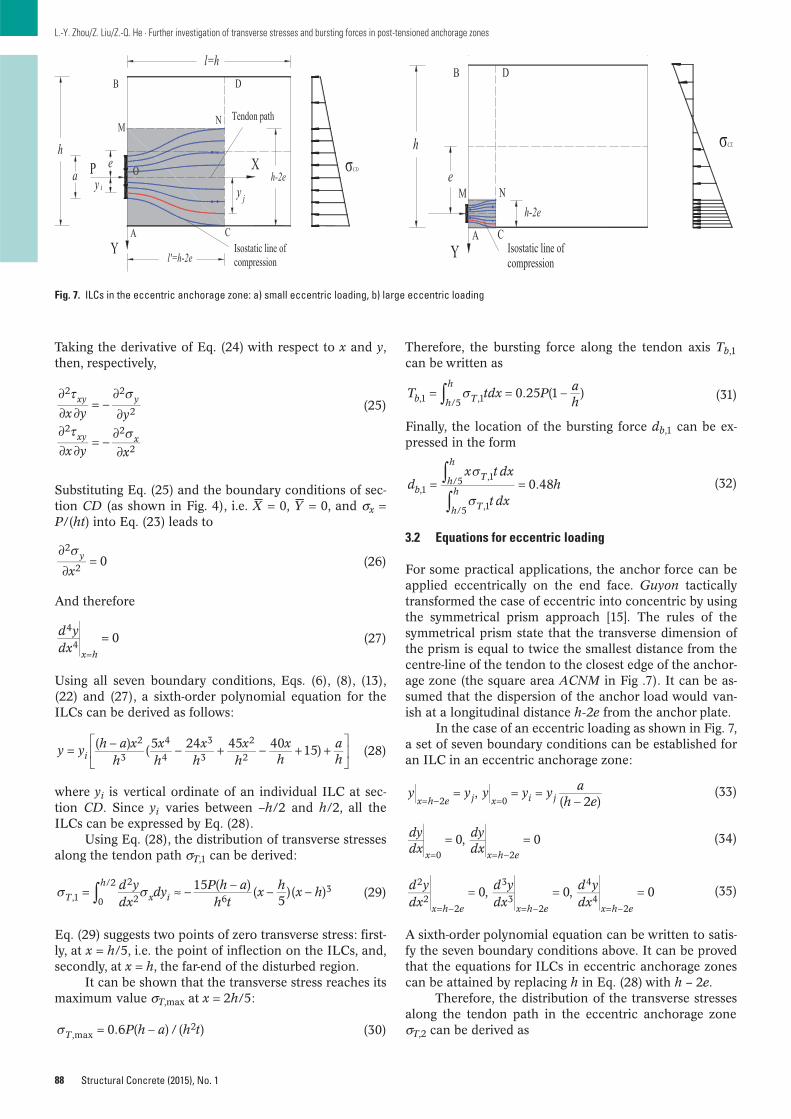
88
L.-Y. Zhou/Z. Liu/Z.-Q. He · Further investigation of transverse stresses and bursting forces in post-tensioned anchorage zones
Structural Concrete (2015), No. 1
Taking the derivative of Eq. (24) with respect to x and y,then, respectively,
(25)
Substituting Eq. (25) and the boundary conditions of sec-tion CD (as shown in Fig. 4), i.e. X– = 0, Y– = 0, and σx =P/(ht) into Eq. (23) leads to
(26)
And therefore
(27)
Using all seven boundary conditions, Eqs. (6), (8), (13),(22) and (27), a sixth-order polynomial equation for theILCs can be derived as follows:
(28)
where yi is vertical ordinate of an individual ILC at sec-tion CD. Since yi varies between –h/2 and h/2, all theILCs can be expressed by Eq. (28).
Using Eq. (28), the distribution of transverse stressesalong the tendon path σT,1 can be derived:
(29)
Eq. (29) suggests two points of zero transverse stress: first-ly, at x = h/5, i.e. the point of inflection on the ILCs, and,secondly, at x = h, the far-end of the disturbed region.
It can be shown that the transverse stress reaches itsmaximum value σT,max at x = 2h/5:
(30)
15 ( ) (5
)( ),1
2
20
/2
63d y
dxdy P h a
h tx h x hT
h
x i
04
4d ydx x h
( ) (5 24 45 40 15)2
3
4
4
3
3
2
2y y h a x
hxh
xh
xh
xh
ahi
02
2xy
2 2
2
2 2
2
x y y
x y x
xy y
xy x
0.6 ( ) / ( ),max2P h a h tT
Therefore, the bursting force along the tendon axis Tb,1can be written as
(31)
Finally, the location of the bursting force db,1 can be ex-pressed in the form
(32)
3.2 Equations for eccentric loading
For some practical applications, the anchor force can beapplied eccentrically on the end face. Guyon tacticallytransformed the case of eccentric into concentric by usingthe symmetrical prism approach [15]. The rules of thesymmetrical prism state that the transverse dimension ofthe prism is equal to twice the smallest distance from thecentre-line of the tendon to the closest edge of the anchor-age zone (the square area ACNM in Fig .7). It can be as-sumed that the dispersion of the anchor load would van-ish at a longitudinal distance h-2e from the anchor plate.
In the case of an eccentric loading as shown in Fig. 7,a set of seven boundary conditions can be established foran ILC in an eccentric anchorage zone:
(33)
(34)
(35)
A sixth-order polynomial equation can be written to satis-fy the seven boundary conditions above. It can be provedthat the equations for ILCs in eccentric anchorage zonescan be attained by replacing h in Eq. (28) with h – 2e.
Therefore, the distribution of the transverse stressesalong the tendon path in the eccentric anchorage zoneσT,2 can be derived as
0, 0, 02
22
3
32
4
42
d ydx
d ydx
d ydxx h e x h e x h e
,( 2 )2 0
y y y y y ah ex h e j x i j
0, 00 2
dydx
dydxx x h e
0.25 (1 ),1 ,1/5T tdx P a
hb Th
h
0.48,1,1/5
,1/5
dx t dx
t dxhb
Th
h
Th
h
Fig. 7. ILCs in the eccentric anchorage zone: a) small eccentric loading, b) large eccentric loading
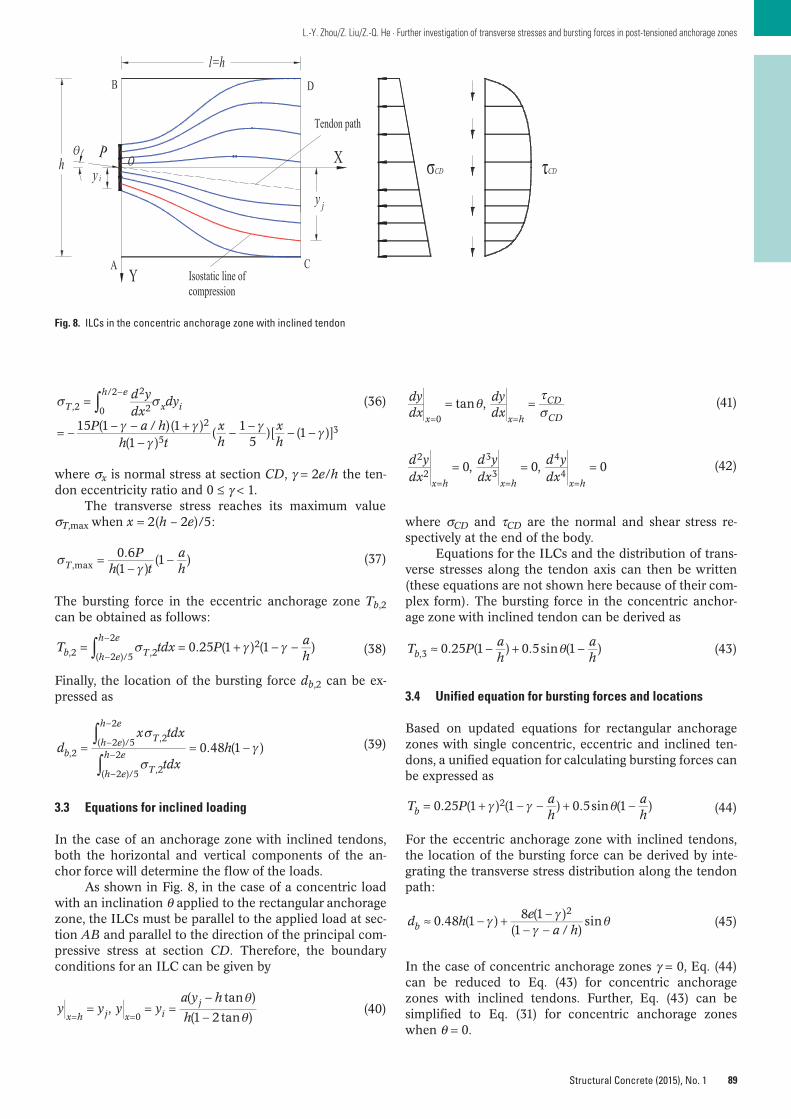
89
L.-Y. Zhou/Z. Liu/Z.-Q. He · Further investigation of transverse stresses and bursting forces in post-tensioned anchorage zones
Structural Concrete (2015), No. 1
(41)
(42)
where σCD and τCD are the normal and shear stress re-spectively at the end of the body.
Equations for the ILCs and the distribution of trans-verse stresses along the tendon axis can then be written(these equations are not shown here because of their com-plex form). The bursting force in the concentric anchor-age zone with inclined tendon can be derived as
(43)
3.4 Unified equation for bursting forces and locations
Based on updated equations for rectangular anchoragezones with single concentric, eccentric and inclined ten-dons, a unified equation for calculating bursting forces canbe expressed as
(44)
For the eccentric anchorage zone with inclined tendons,the location of the bursting force can be derived by inte-grating the transverse stress distribution along the tendonpath:
(45)
In the case of concentric anchorage zones γ = 0, Eq. (44)can be reduced to Eq. (43) for concentric anchoragezones with inclined tendons. Further, Eq. (43) can be simplified to Eq. (31) for concentric anchorage zoneswhen θ = 0.
0.48 (1 ) 8 (1 )(1 / )
sin2
d h ea hb
0.25 (1 ) (1 ) 0.5sin (1 )2T P ah
ahb
tan ,0
dydx
dydxx x h
CD
CD
0, 0, 02
2
3
3
4
4d ydx
d ydx
d ydxx h x h x h
0.25 (1 ) 0.5sin (1 ),3T P ah
ahb
(36)
where σx is normal stress at section CD, γ = 2e/h the ten-don eccentricity ratio and 0 ≤ γ < 1.
The transverse stress reaches its maximum valueσT,max when x = 2(h – 2e)/5:
(37)
The bursting force in the eccentric anchorage zone Tb,2can be obtained as follows:
(38)
Finally, the location of the bursting force db,2 can be ex-pressed as
(39)
3.3 Equations for inclined loading
In the case of an anchorage zone with inclined tendons,both the horizontal and vertical components of the an-chor force will determine the flow of the loads.
As shown in Fig. 8, in the case of a concentric loadwith an inclination θ applied to the rectangular anchoragezone, the ILCs must be parallel to the applied load at sec-tion AB and parallel to the direction of the principal com-pressive stress at section CD. Therefore, the boundaryconditions for an ILC can be given by
(40),( tan )
(1 2 tan )0y y y y
a y h
hx h j x ij
0.25 (1 ) (1 ),2 ,2( 2 )/5
22T tdx P a
hb Th e
h e
0.48 (1 ),2
,2( 2 )/5
2
,2( 2 )/5
2d
x tdx
tdxhb
Th e
h e
Th e
h e
15 (1 / )(1 )(1 )
( 15
)[ (1 )]
,2
2
20
/2
2
53
d ydx
dy
P a hh t
xh
xh
T
h e
x i
0.6(1 )
(1 ),maxP
h tahT
Fig. 8. ILCs in the concentric anchorage zone with inclined tendon
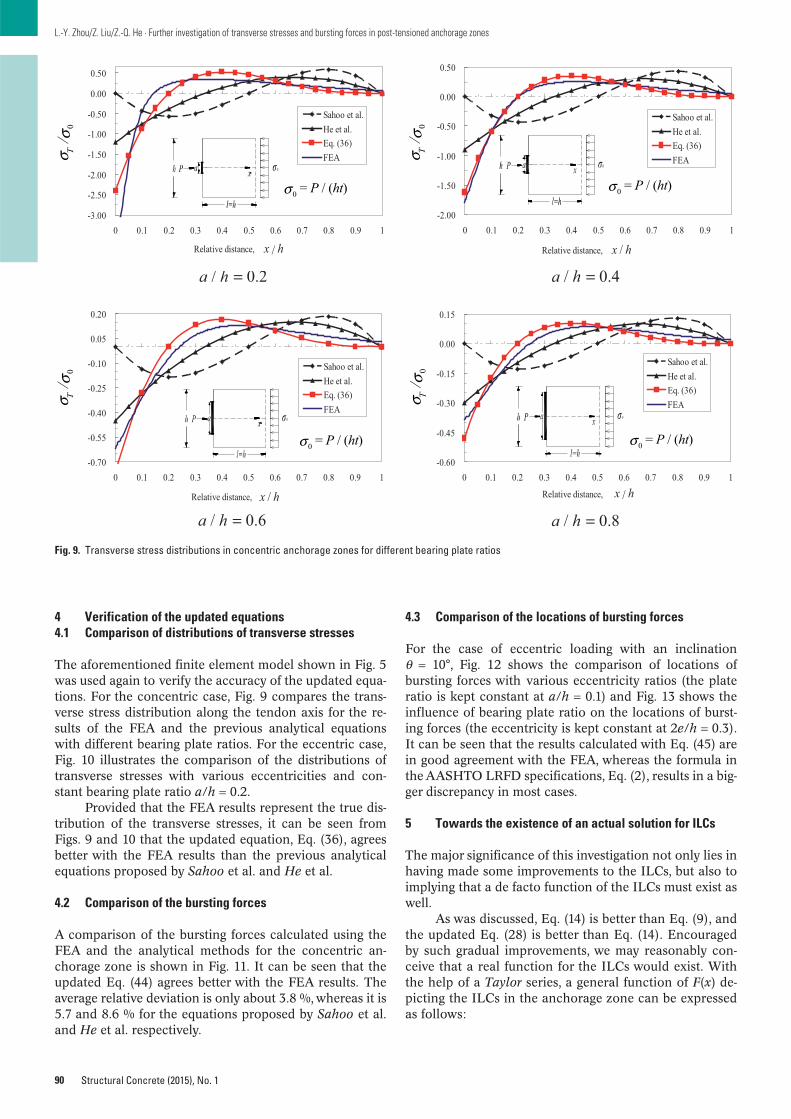
90
L.-Y. Zhou/Z. Liu/Z.-Q. He · Further investigation of transverse stresses and bursting forces in post-tensioned anchorage zones
Structural Concrete (2015), No. 1
4.3 Comparison of the locations of bursting forces
For the case of eccentric loading with an inclinationθ = 10°, Fig. 12 shows the comparison of locations ofbursting forces with various eccentricity ratios (the plateratio is kept constant at a/h = 0.1) and Fig. 13 shows theinfluence of bearing plate ratio on the locations of burst-ing forces (the eccentricity is kept constant at 2e/h = 0.3).It can be seen that the results calculated with Eq. (45) arein good agreement with the FEA, whereas the formula inthe AASHTO LRFD specifications, Eq. (2), results in a big-ger discrepancy in most cases.
5 Towards the existence of an actual solution for ILCs
The major significance of this investigation not only lies inhaving made some improvements to the ILCs, but also toimplying that a de facto function of the ILCs must exist aswell.
As was discussed, Eq. (14) is better than Eq. (9), andthe updated Eq. (28) is better than Eq. (14). Encouragedby such gradual improvements, we may reasonably con-ceive that a real function for the ILCs would exist. Withthe help of a Taylor series, a general function of F(x) de-picting the ILCs in the anchorage zone can be expressedas follows:
4 Verification of the updated equations4.1 Comparison of distributions of transverse stresses
The aforementioned finite element model shown in Fig. 5was used again to verify the accuracy of the updated equa-tions. For the concentric case, Fig. 9 compares the trans-verse stress distribution along the tendon axis for the re-sults of the FEA and the previous analytical equationswith different bearing plate ratios. For the eccentric case,Fig. 10 illustrates the comparison of the distributions oftransverse stresses with various eccentricities and con-stant bearing plate ratio a/h = 0.2.
Provided that the FEA results represent the true dis-tribution of the transverse stresses, it can be seen fromFigs. 9 and 10 that the updated equation, Eq. (36), agreesbetter with the FEA results than the previous analyticalequations proposed by Sahoo et al. and He et al.
4.2 Comparison of the bursting forces
A comparison of the bursting forces calculated using theFEA and the analytical methods for the concentric an-chorage zone is shown in Fig. 11. It can be seen that theupdated Eq. (44) agrees better with the FEA results. Theaverage relative deviation is only about 3.8 %, whereas it is5.7 and 8.6 % for the equations proposed by Sahoo et al.and He et al. respectively.
-3.00
-2.50
-2.00
-1.50
-1.00
-0.50
0.00
0.50
0 0.1 0.2 0.3 0.4 0.5 0.6 0.7 0.8 0.9 1
Relative distance,
Sahoo et al.He et al.Eq. (36)FEA
/x h
-2.00
-1.50
-1.00
-0.50
0.00
0.50
0 0.1 0.2 0.3 0.4 0.5 0.6 0.7 0.8 0.9 1
Relative distance,
Sahoo et al.He et al.Eq. (36)FEA
/x h
/ 0.2a h = / 0.4a h =
-0.70
-0.55
-0.40
-0.25
-0.10
0.05
0.20
0 0.1 0.2 0.3 0.4 0.5 0.6 0.7 0.8 0.9 1
Relative distance,
Sahoo et al.He et al.Eq. (36)FEA
/x h
-0.60
-0.45
-0.30
-0.15
0.00
0.15
0 0.1 0.2 0.3 0.4 0.5 0.6 0.7 0.8 0.9 1
Relative distance,
Sahoo et al.He et al.Eq. (36)FEA
/x h
/ 0.6a h = / 0.8a h =
σ T / σ
0σ T
/ σ0
σ T / σ
0σ T
/ σ0
0 = P / (ht)σ 0 = P / (ht)σ
0 = P / (ht)σ 0 = P / (ht)σ
Fig. 9. Transverse stress distributions in concentric anchorage zones for different bearing plate ratios
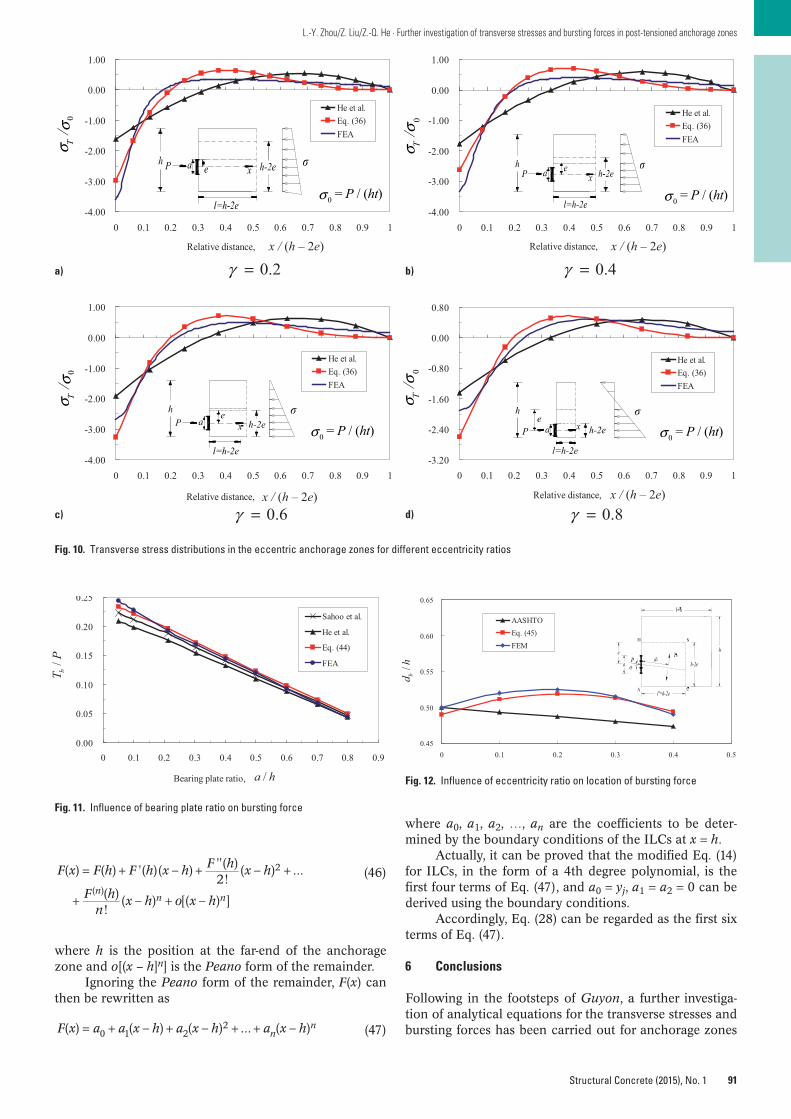
91
L.-Y. Zhou/Z. Liu/Z.-Q. He · Further investigation of transverse stresses and bursting forces in post-tensioned anchorage zones
Structural Concrete (2015), No. 1
(46)
where h is the position at the far-end of the anchoragezone and o[(x – h]n] is the Peano form of the remainder.
Ignoring the Peano form of the remainder, F(x) canthen be rewritten as
(47)
( ) ( ) '( )( ) ''( )2!
( ) ...
( )!
( ) [( ) ]
2
( )
F x F h F h x h F h x h
F hn
x h o x hn
n n
( ) ( ) ( ) ... ( )0 1 22F x a a x h a x h a x hn
n
where a0, a1, a2, …, an are the coefficients to be deter-mined by the boundary conditions of the ILCs at x = h.
Actually, it can be proved that the modified Eq. (14)for ILCs, in the form of a 4th degree polynomial, is thefirst four terms of Eq. (47), and a0 = yj, a1 = a2 = 0 can bederived using the boundary conditions.
Accordingly, Eq. (28) can be regarded as the first sixterms of Eq. (47).
6 Conclusions
Following in the footsteps of Guyon, a further investiga-tion of analytical equations for the transverse stresses andbursting forces has been carried out for anchorage zones
-4.00
-3.00
-2.00
-1.00
0.00
1.00
0 0.1 0.2 0.3 0.4 0.5 0.6 0.7 0.8 0.9 1
Relative distance,
He et al.Eq. (36)FEA
x / (h – 2e) x / (h – 2e)
-4.00
-3.00
-2.00
-1.00
0.00
1.00
0 0.1 0.2 0.3 0.4 0.5 0.6 0.7 0.8 0.9 1
Relative distance,
He et al.Eq. (36)FEA
0.2γ = 0.4γ =
-4.00
-3.00
-2.00
-1.00
0.00
1.00
0 0.1 0.2 0.3 0.4 0.5 0.6 0.7 0.8 0.9 1
Relative distance,
He et al.Eq. (36)FEA
-3.20
-2.40
-1.60
-0.80
0.00
0.80
0 0.1 0.2 0.3 0.4 0.5 0.6 0.7 0.8 0.9 1
Relative distance,
He et al.Eq. (36)FEA
0.6γ = 0.8γ = x / (h – 2e) x / (h – 2e)
0 = P / (ht)σ
0 = P / (ht)σ 0 = P / (ht)σ
0 = P / (ht)σ
σ T / σ
0
σ T / σ
0
σ T / σ
0
σ T / σ
0
Fig. 10. Transverse stress distributions in the eccentric anchorage zones for different eccentricity ratios
0.00
0.05
0.10
0.15
0.20
0.25
0 0.1 0.2 0.3 0.4 0.5 0.6 0.7 0.8 0.9
Bearing plate ratio,
Sahoo et al.
He et al.
Eq. (44)
FEA/bT
P
/a h
Fig. 11. Influence of bearing plate ratio on bursting force
0.45
0.50
0.55
0.60
0.65
0 0.1 0.2 0.3 0.4 0.5
AASHTOEq. (45)FEM
/bd
h
Fig. 12. Influence of eccentricity ratio on location of bursting force
a) b)
c) d)
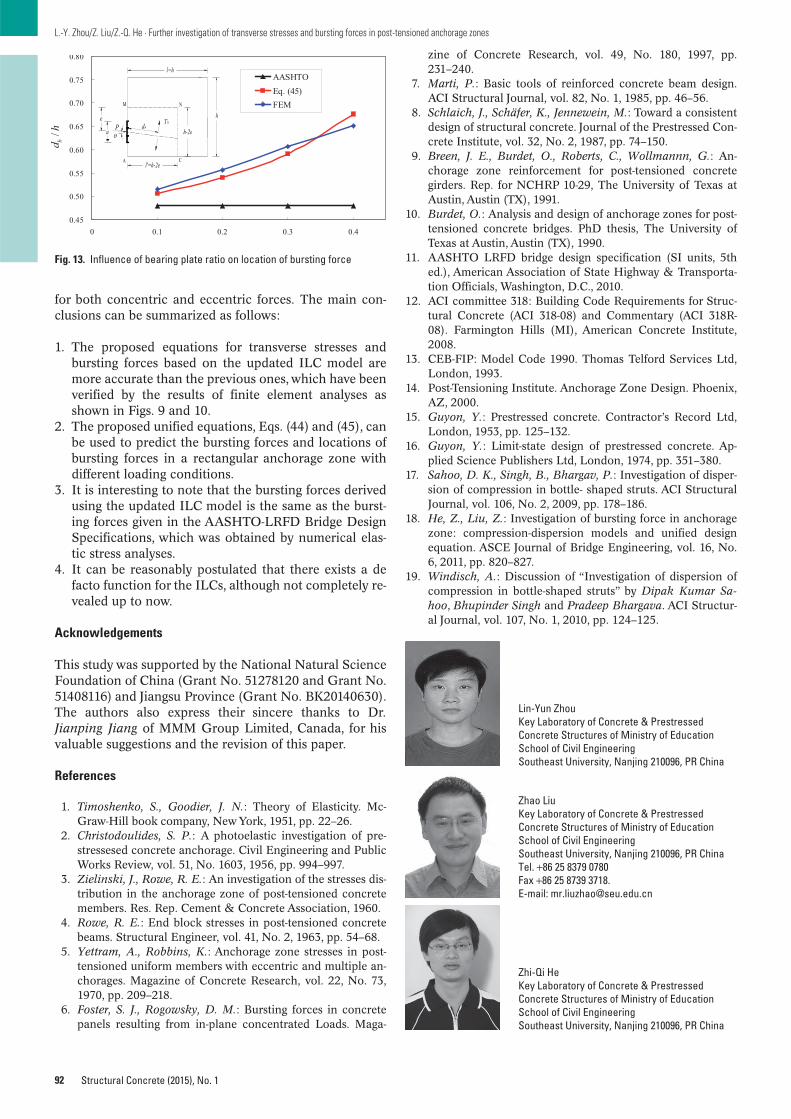
92
L.-Y. Zhou/Z. Liu/Z.-Q. He · Further investigation of transverse stresses and bursting forces in post-tensioned anchorage zones
Structural Concrete (2015), No. 1
for both concentric and eccentric forces. The main con-clusions can be summarized as follows:
1. The proposed equations for transverse stresses andbursting forces based on the updated ILC model aremore accurate than the previous ones, which have beenverified by the results of finite element analyses asshown in Figs. 9 and 10.
2. The proposed unified equations, Eqs. (44) and (45), canbe used to predict the bursting forces and locations ofbursting forces in a rectangular anchorage zone withdifferent loading conditions.
3. It is interesting to note that the bursting forces derivedusing the updated ILC model is the same as the burst-ing forces given in the AASHTO-LRFD Bridge DesignSpecifications, which was obtained by numerical elas-tic stress analyses.
4. It can be reasonably postulated that there exists a defacto function for the ILCs, although not completely re-vealed up to now.
Acknowledgements
This study was supported by the National Natural ScienceFoundation of China (Grant No. 51278120 and Grant No.51408116) and Jiangsu Province (Grant No. BK20140630).The authors also express their sincere thanks to Dr. Jianping Jiang of MMM Group Limited, Canada, for hisvaluable suggestions and the revision of this paper.
References
1. Timoshenko, S., Goodier, J. N.: Theory of Elasticity. Mc-Graw-Hill book company, New York, 1951, pp. 22–26.
2. Christodoulides, S. P.: A photoelastic investigation of pre-stressesed concrete anchorage. Civil Engineering and PublicWorks Review, vol. 51, No. 1603, 1956, pp. 994–997.
3. Zielinski, J., Rowe, R. E.: An investigation of the stresses dis-tribution in the anchorage zone of post-tensioned concretemembers. Res. Rep. Cement & Concrete Association, 1960.
4. Rowe, R. E.: End block stresses in post-tensioned concretebeams. Structural Engineer, vol. 41, No. 2, 1963, pp. 54–68.
5. Yettram, A., Robbins, K.: Anchorage zone stresses in post-tensioned uniform members with eccentric and multiple an-chorages. Magazine of Concrete Research, vol. 22, No. 73,1970, pp. 209–218.
6. Foster, S. J., Rogowsky, D. M.: Bursting forces in concretepanels resulting from in-plane concentrated Loads. Maga-
zine of Concrete Research, vol. 49, No. 180, 1997, pp.231–240.
7. Marti, P.: Basic tools of reinforced concrete beam design.ACI Structural Journal, vol. 82, No. 1, 1985, pp. 46–56.
8. Schlaich, J., Schäfer, K., Jennewein, M.: Toward a consistentdesign of structural concrete. Journal of the Prestressed Con-crete Institute, vol. 32, No. 2, 1987, pp. 74–150.
9. Breen, J. E., Burdet, O., Roberts, C., Wollmannn, G.: An-chorage zone reinforcement for post-tensioned concretegirders. Rep. for NCHRP 10-29, The University of Texas atAustin, Austin (TX), 1991.
10. Burdet, O.: Analysis and design of anchorage zones for post-tensioned concrete bridges. PhD thesis, The University ofTexas at Austin, Austin (TX), 1990.
11. AASHTO LRFD bridge design specification (SI units, 5thed.), American Association of State Highway & Transporta-tion Officials, Washington, D.C., 2010.
12. ACI committee 318: Building Code Requirements for Struc-tural Concrete (ACI 318-08) and Commentary (ACI 318R-08). Farmington Hills (MI), American Concrete Institute,2008.
13. CEB-FIP: Model Code 1990. Thomas Telford Services Ltd,London, 1993.
14. Post-Tensioning Institute. Anchorage Zone Design. Phoenix,AZ, 2000.
15. Guyon, Y.: Prestressed concrete. Contractor’s Record Ltd,London, 1953, pp. 125–132.
16. Guyon, Y.: Limit-state design of prestressed concrete. Ap-plied Science Publishers Ltd, London, 1974, pp. 351–380.
17. Sahoo, D. K., Singh, B., Bhargav, P.: Investigation of disper-sion of compression in bottle- shaped struts. ACI StructuralJournal, vol. 106, No. 2, 2009, pp. 178–186.
18. He, Z., Liu, Z.: Investigation of bursting force in anchoragezone: compression-dispersion models and unified designequation. ASCE Journal of Bridge Engineering, vol. 16, No.6, 2011, pp. 820–827.
19. Windisch, A.: Discussion of “Investigation of dispersion ofcompression in bottle-shaped struts” by Dipak Kumar Sa-hoo, Bhupinder Singh and Pradeep Bhargava. ACI Structur-al Journal, vol. 107, No. 1, 2010, pp. 124–125.
Lin-Yun ZhouKey Laboratory of Concrete & PrestressedConcrete Structures of Ministry of EducationSchool of Civil EngineeringSoutheast University, Nanjing 210096, PR China
Zhao LiuKey Laboratory of Concrete & PrestressedConcrete Structures of Ministry of EducationSchool of Civil EngineeringSoutheast University, Nanjing 210096, PR ChinaTel. +86 25 8379 0780Fax +86 25 8739 3718.E-mail: [email protected]
Zhi-Qi HeKey Laboratory of Concrete & PrestressedConcrete Structures of Ministry of EducationSchool of Civil EngineeringSoutheast University, Nanjing 210096, PR China
0.45
0.50
0.55
0.60
0.65
0.70
0.75
0.80
0 0.1 0.2 0.3 0.4
AASHTOEq. (45)FEM
/bd
h
Fig. 13. Influence of bearing plate ratio on location of bursting force
93© 2015 Ernst & Sohn Verlag für Architektur und technische Wissenschaften GmbH & Co. KG, Berlin · Structural Concrete (2015)
The material characterization of steel fibre-reinforced concrete(SFRC), which is required for its implementation in design codes,should be based on nominal properties that describe its post-cracking strength in tension. In the case of brittle and quasi-brit-tle materials, such as concrete, the tensile parameters are oftenderived indirectly. However, for materials with more ductility,such as SFRC, there is conjecture as to whether or not an indirectmeasure may be used to establish the stress versus crack open-ing displacement relationship, such as the use of a three- or four-point prism test combined with an inverse analysis. In this papera simple and efficient inverse analysis technique is developedand shown to compare well with data obtained from direct ten-sion tests. Furthermore, the methodology proposed by the fibModel Code for Concrete Structures 2010 has been investigatedand recommendations made to improve its accuracy.
Keywords: steel fibre, concrete, inverse analysis, bending, uniaxial tension
1 Introduction
Research in steel fibre-reinforced concrete has a history ofabout 50 years [1] and its adoption in practice is develop-ing. It is well established that the strength of unreinforcedconcrete in tension reduces quickly to zero after cracking.In steel fibre-reinforced concrete (SFRC) the fibres are ca-pable of bridging cracks and transmitting tensile forceacross them to enhance the post-cracking tensile behav-iour.
One limitation in developing rational design modelsfor SFRC in members and structures is the complexity ofthe test needed to characterize the fundamental tensilestrength properties of the material, i.e. determining itspost-cracking, or residual, tensile strength. Prior to crack-ing, the characteristic behaviour of SFRC in tension is typ-ically represented by its stress-strain response. After crack-ing, behaviour is described by the stress versus crackopening displacement (σ-w) relationship (Fig. 1). The σ-wresponse can be obtained through a uniaxial tension testor possibly by an indirect method using three- or four-point bending tests on prism beam specimens in conjunc-tion with an inverse analysis that assumes some prede-
fined deterministic relationship. This is summarized inFig. 2, where CMOD is the crack mouth opening displace-ment as measured across the notch at the extreme tensilefibre in a flexural prism test.
Although a direct tensile test is the most reliablemethod for determining the residual (post-cracking) prop-erties of SFRC [2–4], it is expensive. It requires specializedtesting machines and can be time-consuming in its prepa-ration. For this reason, extensive efforts have been madeto find a reliable model for obtaining the post-cracking be-haviour based on an inverse analysis of data obtainedfrom either notched or unnotched prism bending tests[5–8]. However, although this methodology has been in-corporated in the fib Model Code for Concrete Structures2010 [8–10], the test data available at the time for full vali-dation was somewhat limited [11].
Technical Paper
Derivation of the σ-w relationship for SFRC from prism bending tests
Ali AminStephen J. Foster*Aurelio Muttoni
DOI: 10.1002/suco.201400018
* Corresponding author: [email protected]
Submitted for review: 27 February 2014Accepted for publication: 14 July 2014
σ
matrix + fibres
matrix
fibres
fct
COD (w)
f (w)
wT
Fig. 1. Stress versus crack COD (w) for SFRC
P
w
FF
σ
w
InverseAnalysis
DirectP
P
CMOD
Fig. 2. Approaches to determine the tensile properties of SFRC
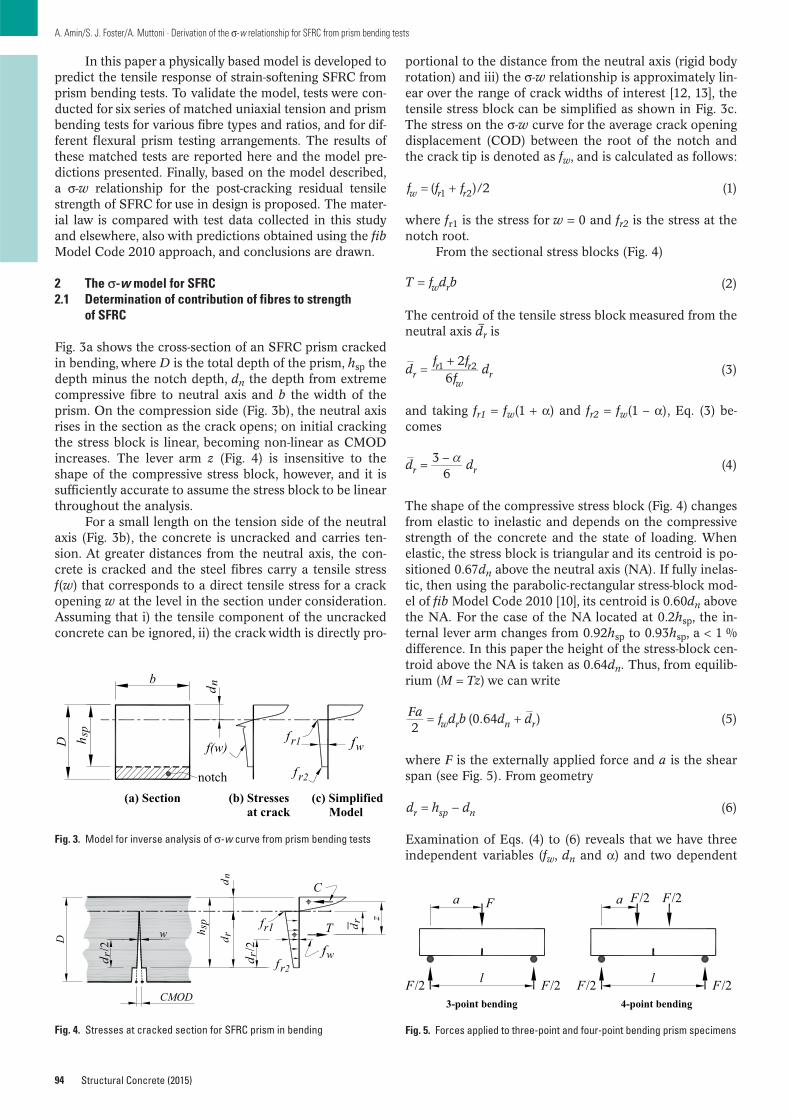
In this paper a physically based model is developed topredict the tensile response of strain-softening SFRC fromprism bending tests. To validate the model, tests were con-ducted for six series of matched uniaxial tension and prismbending tests for various fibre types and ratios, and for dif-ferent flexural prism testing arrangements. The results ofthese matched tests are reported here and the model pre-dictions presented. Finally, based on the model described,a σ-w relationship for the post-cracking residual tensilestrength of SFRC for use in design is proposed. The mater-ial law is compared with test data collected in this studyand elsewhere, also with predictions obtained using the fibModel Code 2010 approach, and conclusions are drawn.
2 The σ-w model for SFRC2.1 Determination of contribution of fibres to strength
of SFRC
Fig. 3a shows the cross-section of an SFRC prism crackedin bending, where D is the total depth of the prism, hsp thedepth minus the notch depth, dn the depth from extremecompressive fibre to neutral axis and b the width of theprism. On the compression side (Fig. 3b), the neutral axisrises in the section as the crack opens; on initial crackingthe stress block is linear, becoming non-linear as CMODincreases. The lever arm z (Fig. 4) is insensitive to theshape of the compressive stress block, however, and it issufficiently accurate to assume the stress block to be linearthroughout the analysis.
For a small length on the tension side of the neutralaxis (Fig. 3b), the concrete is uncracked and carries ten-sion. At greater distances from the neutral axis, the con-crete is cracked and the steel fibres carry a tensile stressf(w) that corresponds to a direct tensile stress for a crackopening w at the level in the section under consideration.Assuming that i) the tensile component of the uncrackedconcrete can be ignored, ii) the crack width is directly pro-
94
A. Amin/S. J. Foster/A. Muttoni · Derivation of the σ-w relationship for SFRC from prism bending tests
Structural Concrete (2015)
portional to the distance from the neutral axis (rigid bodyrotation) and iii) the σ-w relationship is approximately lin-ear over the range of crack widths of interest [12, 13], thetensile stress block can be simplified as shown in Fig. 3c.The stress on the σ-w curve for the average crack openingdisplacement (COD) between the root of the notch andthe crack tip is denoted as fw, and is calculated as follows:
(1)
where fr1 is the stress for w = 0 and fr2 is the stress at thenotch root.
From the sectional stress blocks (Fig. 4)
(2)
The centroid of the tensile stress block measured from theneutral axis d
–r is
(3)
and taking fr1 = fw(1 + α) and fr2 = fw(1 – α), Eq. (3) be-comes
(4)
The shape of the compressive stress block (Fig. 4) changesfrom elastic to inelastic and depends on the compressivestrength of the concrete and the state of loading. Whenelastic, the stress block is triangular and its centroid is po-sitioned 0.67dn above the neutral axis (NA). If fully inelas-tic, then using the parabolic-rectangular stress-block mod-el of fib Model Code 2010 [10], its centroid is 0.60dn abovethe NA. For the case of the NA located at 0.2hsp, the in-ternal lever arm changes from 0.92hsp to 0.93hsp, a < 1 %difference. In this paper the height of the stress-block cen-troid above the NA is taken as 0.64dn. Thus, from equilib-rium (M = Tz) we can write
(5)
where F is the externally applied force and a is the shearspan (see Fig. 5). From geometry
(6)
Examination of Eqs. (4) to (6) reveals that we have threeindependent variables (fw, dn and α) and two dependent
2(0.64 )Fa f d b d dw r n r
36
d dr r
T f d bw r
26
1 2df f
fdr
r r
wr
( )/21 2f f fw r r
d h dr sp n
D
b
h sp
notch f r2
fr1 fwf(w)
(b) Stresses at crack
deifilpmiS )c(noitceS )a( Model
nd
Fig. 3. Model for inverse analysis of σ-w curve from prism bending tests
f r2
fr1
fw
T
C
z
dd
rn
rd /2
d r
CMOD
h sp
w
rd /2
D
Fig. 4. Stresses at cracked section for SFRC prism in bending
F
F/2 F/2
a
l F/2 F/2
a
l
F/2F/2
3-point bending 4-point bending
Fig. 5. Forces applied to three-point and four-point bending prism specimens
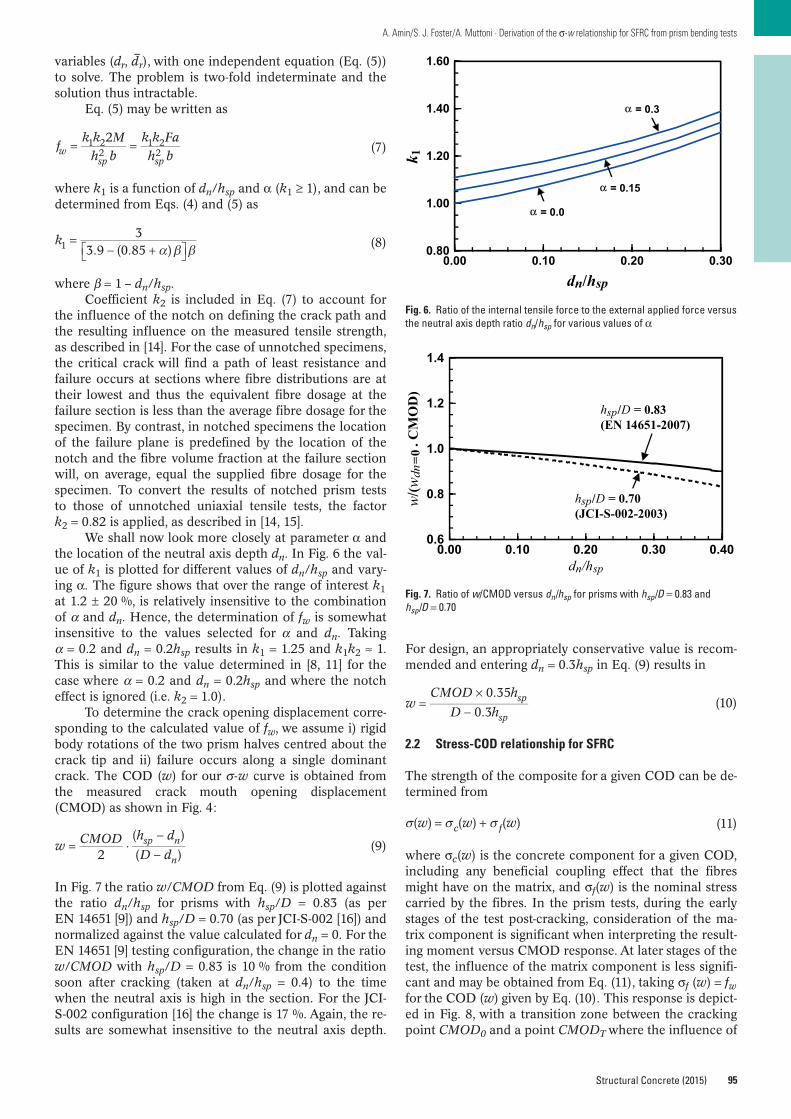
95
A. Amin/S. J. Foster/A. Muttoni · Derivation of the σ-w relationship for SFRC from prism bending tests
Structural Concrete (2015)
variables (dr, d–r), with one independent equation (Eq. (5))
to solve. The problem is two-fold indeterminate and thesolution thus intractable.
Eq. (5) may be written as
(7)
where k1 is a function of dn/hsp and α (k1 ≥ 1), and can bedetermined from Eqs. (4) and (5) as
(8)
where β = 1 – dn/hsp.Coefficient k2 is included in Eq. (7) to account for
the influence of the notch on defining the crack path andthe resulting influence on the measured tensile strength,as described in [14]. For the case of unnotched specimens,the critical crack will find a path of least resistance andfailure occurs at sections where fibre distributions are attheir lowest and thus the equivalent fibre dosage at thefailure section is less than the average fibre dosage for thespecimen. By contrast, in notched specimens the locationof the failure plane is predefined by the location of thenotch and the fibre volume fraction at the failure sectionwill, on average, equal the supplied fibre dosage for thespecimen. To convert the results of notched prism teststo those of unnotched uniaxial tensile tests, the factork2 = 0.82 is applied, as described in [14, 15].
We shall now look more closely at parameter α andthe location of the neutral axis depth dn. In Fig. 6 the val-ue of k1 is plotted for different values of dn/hsp and vary-ing α. The figure shows that over the range of interest k1at 1.2 ± 20 %, is relatively insensitive to the combinationof α and dn. Hence, the determination of fw is somewhatinsensitive to the values selected for α and dn. Takingα = 0.2 and dn = 0.2hsp results in k1 = 1.25 and k1k2 ≈ 1.This is similar to the value determined in [8, 11] for thecase where α = 0.2 and dn = 0.2hsp and where the notch effect is ignored (i.e. k2 = 1.0).
To determine the crack opening displacement corre-sponding to the calculated value of fw, we assume i) rigidbody rotations of the two prism halves centred about thecrack tip and ii) failure occurs along a single dominantcrack. The COD (w) for our σ-w curve is obtained fromthe measured crack mouth opening displacement(CMOD) as shown in Fig. 4:
(9)
In Fig. 7 the ratio w/CMOD from Eq. (9) is plotted againstthe ratio dn/hsp for prisms with hsp/D = 0.83 (as perEN 14651 [9]) and hsp/D = 0.70 (as per JCI-S-002 [16]) andnormalized against the value calculated for dn = 0. For theEN 14651 [9] testing configuration, the change in the ratiow/CMOD with hsp/D = 0.83 is 10 % from the conditionsoon after cracking (taken at dn/hsp = 0.4) to the timewhen the neutral axis is high in the section. For the JCI-S-002 configuration [16] the change is 17 %. Again, the re-sults are somewhat insensitive to the neutral axis depth.
33.9 (0.85 )1k
21 22
1 22
fk k M
h bk k Fah bw
sp sp
2
( )
( )w CMOD h d
D dsp n
n
For design, an appropriately conservative value is recom-mended and entering dn = 0.3hsp in Eq. (9) results in
(10)
2.2 Stress-COD relationship for SFRC
The strength of the composite for a given COD can be de-termined from
(11)
where σc(w) is the concrete component for a given COD,including any beneficial coupling effect that the fibresmight have on the matrix, and σf(w) is the nominal stresscarried by the fibres. In the prism tests, during the earlystages of the test post-cracking, consideration of the ma-trix component is significant when interpreting the result-ing moment versus CMOD response. At later stages of thetest, the influence of the matrix component is less signifi-cant and may be obtained from Eq. (11), taking σf (w) = fwfor the COD (w) given by Eq. (10). This response is depict-ed in Fig. 8, with a transition zone between the crackingpoint CMOD0 and a point CMODT where the influence of
0.35
0.3w
CMOD h
D hsp
sp
( ) ( ) ( )w w wc f
0.00 0.10 0.20 0.30
dn/hsp
0.80
1.00
1.20
1.40
1.60
k 1
α = 0.3
α = 0.0
α = 0.15
Fig. 6. Ratio of the internal tensile force to the external applied force versusthe neutral axis depth ratio dn/hsp for various values of α
0.00 0.10 0.20 0.30 0.40dn/hsp
0.6
0.8
1.0
1.2
1.4
w/( w
dn=0
. C
MO
D)
hsp/D = 0.83(EN 14651-2007)
hsp/D = 0.70(JCI-S-002-2003)
Fig. 7. Ratio of w/CMOD versus dn/hsp for prisms with hsp/D = 0.83 andhsp/D = 0.70
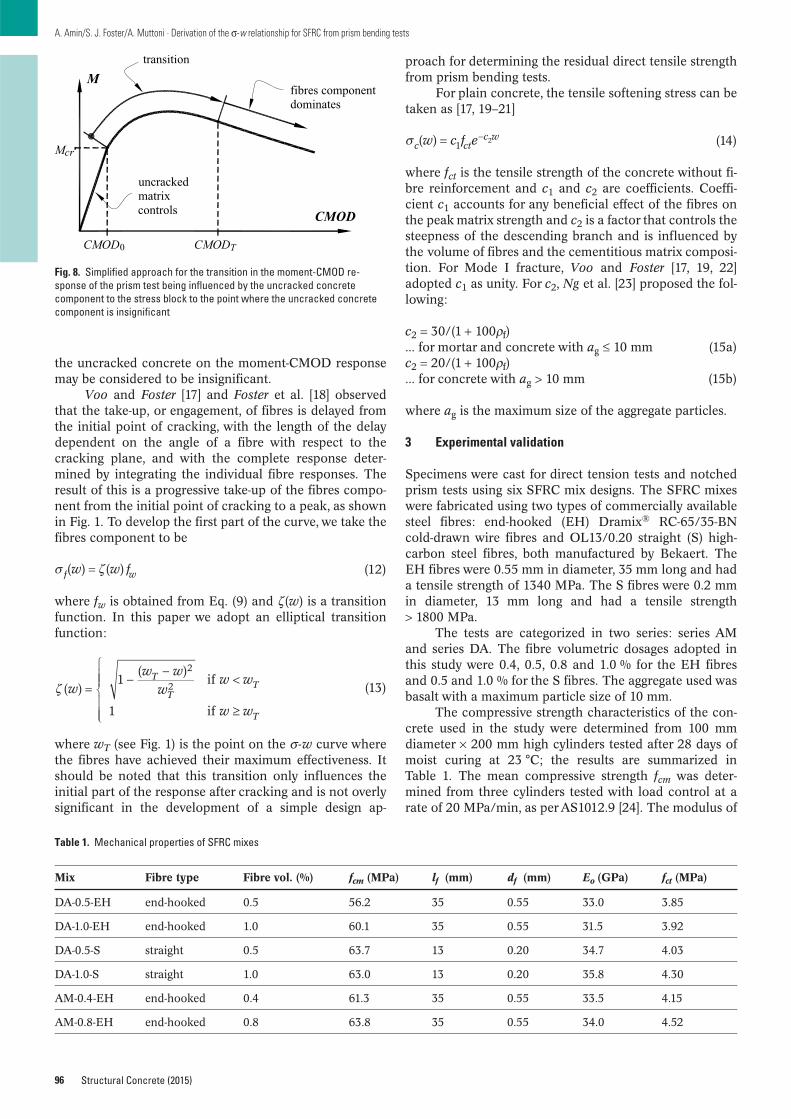
the uncracked concrete on the moment-CMOD responsemay be considered to be insignificant.
Voo and Foster [17] and Foster et al. [18] observedthat the take-up, or engagement, of fibres is delayed fromthe initial point of cracking, with the length of the delaydependent on the angle of a fibre with respect to thecracking plane, and with the complete response deter-mined by integrating the individual fibre responses. Theresult of this is a progressive take-up of the fibres compo-nent from the initial point of cracking to a peak, as shownin Fig. 1. To develop the first part of the curve, we take thefibres component to be
(12)
where fw is obtained from Eq. (9) and ζ(w) is a transitionfunction. In this paper we adopt an elliptical transitionfunction:
(13)
where wT (see Fig. 1) is the point on the σ-w curve wherethe fibres have achieved their maximum effectiveness. Itshould be noted that this transition only influences theinitial part of the response after cracking and is not overlysignificant in the development of a simple design ap-
( )1
( )if
1 if
2
2ww w
ww w
w w
T
TT
T
( ) ( )w w ff w
96
A. Amin/S. J. Foster/A. Muttoni · Derivation of the σ-w relationship for SFRC from prism bending tests
Structural Concrete (2015)
proach for determining the residual direct tensile strengthfrom prism bending tests.
For plain concrete, the tensile softening stress can betaken as [17, 19–21]
(14)
where fct is the tensile strength of the concrete without fi-bre reinforcement and c1 and c2 are coefficients. Coeffi-cient c1 accounts for any beneficial effect of the fibres onthe peak matrix strength and c2 is a factor that controls thesteepness of the descending branch and is influenced bythe volume of fibres and the cementitious matrix composi-tion. For Mode I fracture, Voo and Foster [17, 19, 22]adopted c1 as unity. For c2, Ng et al. [23] proposed the fol-lowing:
c2 = 30/(1 + 100ρf) ... for mortar and concrete with ag ≤ 10 mm (15a)c2 = 20/(1 + 100ρf) ... for concrete with ag > 10 mm (15b)
where ag is the maximum size of the aggregate particles.
3 Experimental validation
Specimens were cast for direct tension tests and notchedprism tests using six SFRC mix designs. The SFRC mixeswere fabricated using two types of commercially availablesteel fibres: end-hooked (EH) Dramix® RC-65/35-BNcold-drawn wire fibres and OL13/0.20 straight (S) high-carbon steel fibres, both manufactured by Bekaert. TheEH fibres were 0.55 mm in diameter, 35 mm long and hada tensile strength of 1340 MPa. The S fibres were 0.2 mmin diameter, 13 mm long and had a tensile strength> 1800 MPa.
The tests are categorized in two series: series AMand series DA. The fibre volumetric dosages adopted inthis study were 0.4, 0.5, 0.8 and 1.0 % for the EH fibresand 0.5 and 1.0 % for the S fibres. The aggregate used wasbasalt with a maximum particle size of 10 mm.
The compressive strength characteristics of the con-crete used in the study were determined from 100 mm diameter × 200 mm high cylinders tested after 28 days ofmoist curing at 23 °C; the results are summarized inTable 1. The mean compressive strength fcm was deter-mined from three cylinders tested with load control at arate of 20 MPa/min, as per AS1012.9 [24]. The modulus of
( ) 12w c f ec ct
c w
CMOD0 CMODT
M
CMOD
Mcr
transition
fibres componentdominates
uncrackedmatrixcontrols
Fig. 8. Simplified approach for the transition in the moment-CMOD re-sponse of the prism test being influenced by the uncracked concrete component to the stress block to the point where the uncracked concretecomponent is insignificant
Table 1. Mechanical properties of SFRC mixes
Mix Fibre type Fibre vol. (%) fcm (MPa) lf (mm) df (mm) Eo (GPa) fct (MPa)
DA-0.5-EH end-hooked 0.5 56.2 35 0.55 33.0 3.85
DA-1.0-EH end-hooked 1.0 60.1 35 0.55 31.5 3.92
DA-0.5-S straight 0.5 63.7 13 0.20 34.7 4.03
DA-1.0-S straight 1.0 63.0 13 0.20 35.8 4.30
AM-0.4-EH end-hooked 0.4 61.3 35 0.55 33.5 4.15
AM-0.8-EH end-hooked 0.8 63.8 35 0.55 34.0 4.52
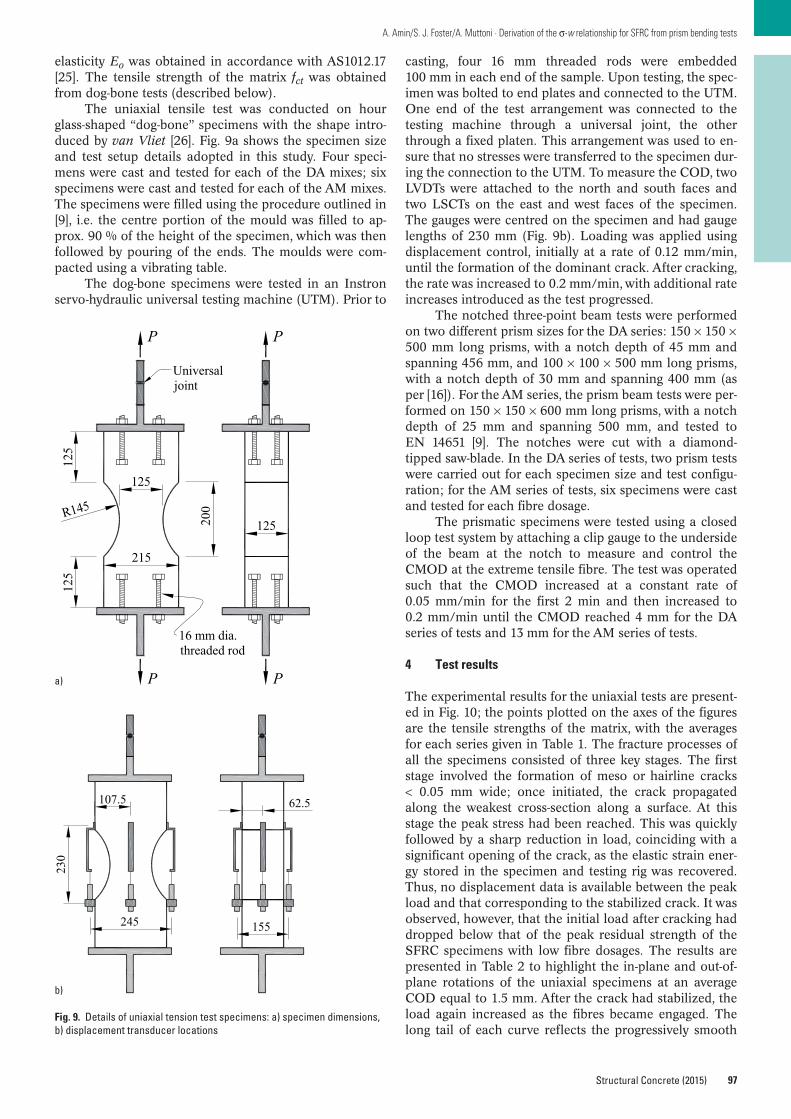
97
A. Amin/S. J. Foster/A. Muttoni · Derivation of the σ-w relationship for SFRC from prism bending tests
Structural Concrete (2015)
elasticity Eo was obtained in accordance with AS1012.17[25]. The tensile strength of the matrix fct was obtainedfrom dog-bone tests (described below).
The uniaxial tensile test was conducted on hourglass-shaped “dog-bone” specimens with the shape intro-duced by van Vliet [26]. Fig. 9a shows the specimen sizeand test setup details adopted in this study. Four speci-mens were cast and tested for each of the DA mixes; sixspecimens were cast and tested for each of the AM mixes.The specimens were filled using the procedure outlined in[9], i.e. the centre portion of the mould was filled to ap-prox. 90 % of the height of the specimen, which was thenfollowed by pouring of the ends. The moulds were com-pacted using a vibrating table.
The dog-bone specimens were tested in an Instronservo-hydraulic universal testing machine (UTM). Prior to
casting, four 16 mm threaded rods were embedded100 mm in each end of the sample. Upon testing, the spec-imen was bolted to end plates and connected to the UTM.One end of the test arrangement was connected to thetesting machine through a universal joint, the otherthrough a fixed platen. This arrangement was used to en-sure that no stresses were transferred to the specimen dur-ing the connection to the UTM. To measure the COD, twoLVDTs were attached to the north and south faces andtwo LSCTs on the east and west faces of the specimen.The gauges were centred on the specimen and had gaugelengths of 230 mm (Fig. 9b). Loading was applied usingdisplacement control, initially at a rate of 0.12 mm/min,until the formation of the dominant crack. After cracking,the rate was increased to 0.2 mm/min, with additional rateincreases introduced as the test progressed.
The notched three-point beam tests were performedon two different prism sizes for the DA series: 150 × 150 ×500 mm long prisms, with a notch depth of 45 mm andspanning 456 mm, and 100 × 100 × 500 mm long prisms,with a notch depth of 30 mm and spanning 400 mm (asper [16]). For the AM series, the prism beam tests were per-formed on 150 × 150 × 600 mm long prisms, with a notchdepth of 25 mm and spanning 500 mm, and tested toEN 14651 [9]. The notches were cut with a diamond-tipped saw-blade. In the DA series of tests, two prism testswere carried out for each specimen size and test configu-ration; for the AM series of tests, six specimens were castand tested for each fibre dosage.
The prismatic specimens were tested using a closedloop test system by attaching a clip gauge to the undersideof the beam at the notch to measure and control theCMOD at the extreme tensile fibre. The test was operatedsuch that the CMOD increased at a constant rate of0.05 mm/min for the first 2 min and then increased to0.2 mm/min until the CMOD reached 4 mm for the DA series of tests and 13 mm for the AM series of tests.
4 Test results
The experimental results for the uniaxial tests are present-ed in Fig. 10; the points plotted on the axes of the figuresare the tensile strengths of the matrix, with the averagesfor each series given in Table 1. The fracture processes ofall the specimens consisted of three key stages. The firststage involved the formation of meso or hairline cracks< 0.05 mm wide; once initiated, the crack propagatedalong the weakest cross-section along a surface. At thisstage the peak stress had been reached. This was quicklyfollowed by a sharp reduction in load, coinciding with asignificant opening of the crack, as the elastic strain ener-gy stored in the specimen and testing rig was recovered.Thus, no displacement data is available between the peakload and that corresponding to the stabilized crack. It wasobserved, however, that the initial load after cracking haddropped below that of the peak residual strength of theSFRC specimens with low fibre dosages. The results arepresented in Table 2 to highlight the in-plane and out-of-plane rotations of the uniaxial specimens at an averageCOD equal to 1.5 mm. After the crack had stabilized, theload again increased as the fibres became engaged. Thelong tail of each curve reflects the progressively smooth
125
R14512520
0
125
Universaljoint
215
125
P
P
P
P
16 mm dia.threaded rod
230
245
107.5
155
62.5
Fig. 9. Details of uniaxial tension test specimens: a) specimen dimensions,b) displacement transducer locations
a)
b)
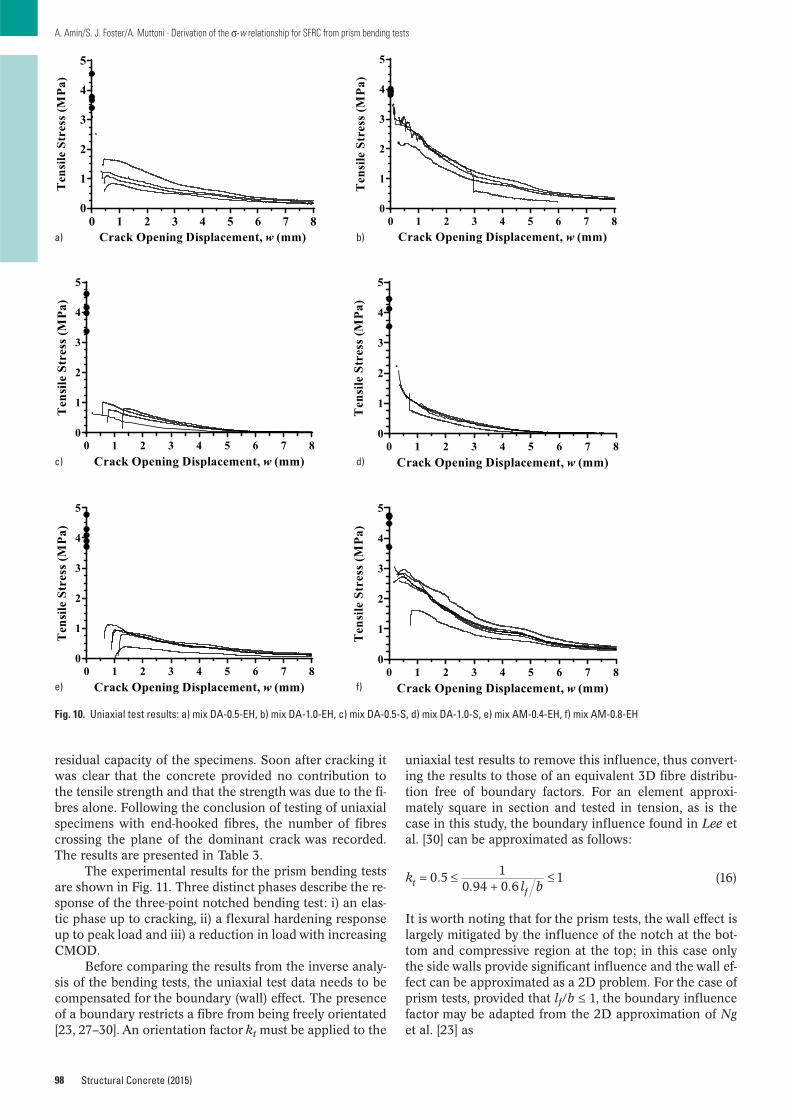
residual capacity of the specimens. Soon after cracking itwas clear that the concrete provided no contribution tothe tensile strength and that the strength was due to the fi-bres alone. Following the conclusion of testing of uniaxialspecimens with end-hooked fibres, the number of fibrescrossing the plane of the dominant crack was recorded.The results are presented in Table 3.
The experimental results for the prism bending testsare shown in Fig. 11. Three distinct phases describe the re-sponse of the three-point notched bending test: i) an elas-tic phase up to cracking, ii) a flexural hardening responseup to peak load and iii) a reduction in load with increasingCMOD.
Before comparing the results from the inverse analy-sis of the bending tests, the uniaxial test data needs to becompensated for the boundary (wall) effect. The presenceof a boundary restricts a fibre from being freely orientated[23, 27–30]. An orientation factor kt must be applied to the
98
A. Amin/S. J. Foster/A. Muttoni · Derivation of the σ-w relationship for SFRC from prism bending tests
Structural Concrete (2015)
uniaxial test results to remove this influence, thus convert-ing the results to those of an equivalent 3D fibre distribu-tion free of boundary factors. For an element approxi-mately square in section and tested in tension, as is thecase in this study, the boundary influence found in Lee etal. [30] can be approximated as follows:
(16)
It is worth noting that for the prism tests, the wall effect islargely mitigated by the influence of the notch at the bot-tom and compressive region at the top; in this case onlythe side walls provide significant influence and the wall ef-fect can be approximated as a 2D problem. For the case ofprism tests, provided that lf/b ≤ 1, the boundary influencefactor may be adapted from the 2D approximation of Nget al. [23] as
0.5 10.94 0.6
1kl btf
Crack Opening Displacement, w (mm)
Ten
sile
Str
ess (
MPa
)
0 1 2 3 4 5 6 7 80
1
2
3
4
5
Crack Opening Displacement, w (mm)
Ten
sile
Str
ess (
MPa
)
0 1 2 3 4 5 6 7 80
1
2
3
4
5
Crack Opening Displacement, w (mm)
Ten
sile
Str
ess (
MPa
)
0 1 2 3 4 5 6 7 80
1
2
3
4
5
Crack Opening Displacement, w (mm)
Ten
sile
Str
ess (
MPa
)
0 1 2 3 4 5 6 7 80
1
2
3
4
5
Crack Opening Displacement, w (mm)
Ten
sile
Str
ess (
MPa
)
0 1 2 3 4 5 6 7 80
1
2
3
4
5
Crack Opening Displacement, w (mm)
Ten
sile
Str
ess (
MPa
)
0 1 2 3 4 5 6 7 80
1
2
3
4
5
Fig. 10. Uniaxial test results: a) mix DA-0.5-EH, b) mix DA-1.0-EH, c) mix DA-0.5-S, d) mix DA-1.0-S, e) mix AM-0.4-EH, f) mix AM-0.8-EH
a) b)
c) d)
e) f)
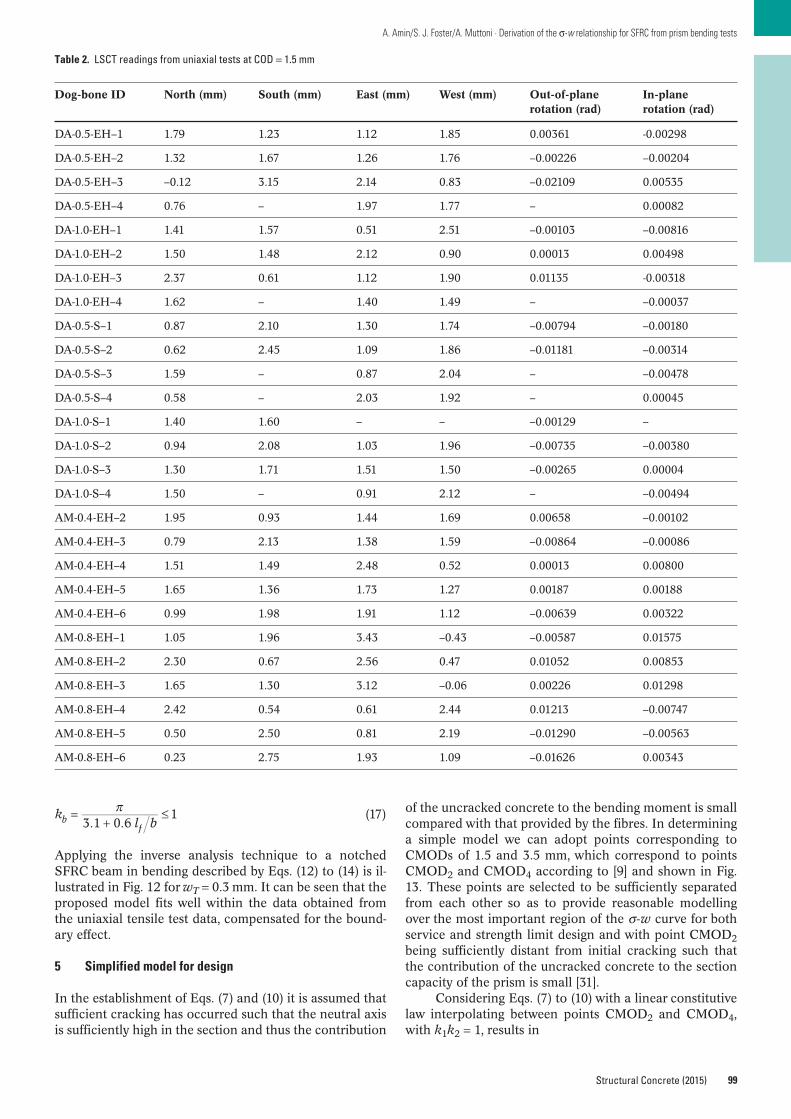
99
A. Amin/S. J. Foster/A. Muttoni · Derivation of the σ-w relationship for SFRC from prism bending tests
Structural Concrete (2015)
(17)
Applying the inverse analysis technique to a notchedSFRC beam in bending described by Eqs. (12) to (14) is il-lustrated in Fig. 12 for wT = 0.3 mm. It can be seen that theproposed model fits well within the data obtained fromthe uniaxial tensile test data, compensated for the bound-ary effect.
5 Simplified model for design
In the establishment of Eqs. (7) and (10) it is assumed thatsufficient cracking has occurred such that the neutral axisis sufficiently high in the section and thus the contribution
3.1 0.61k
l bbf
of the uncracked concrete to the bending moment is smallcompared with that provided by the fibres. In determininga simple model we can adopt points corresponding toCMODs of 1.5 and 3.5 mm, which correspond to pointsCMOD2 and CMOD4 according to [9] and shown in Fig.13. These points are selected to be sufficiently separatedfrom each other so as to provide reasonable modellingover the most important region of the σ-w curve for bothservice and strength limit design and with point CMOD2being sufficiently distant from initial cracking such thatthe contribution of the uncracked concrete to the sectioncapacity of the prism is small [31].
Considering Eqs. (7) to (10) with a linear constitutivelaw interpolating between points CMOD2 and CMOD4,with k1k2 = 1, results in
Table 2. LSCT readings from uniaxial tests at COD = 1.5 mm
Dog-bone ID North (mm) South (mm) East (mm) West (mm) Out-of-plane In-plane rotation (rad) rotation (rad)
DA-0.5-EH–1 1.79 1.23 1.12 1.85 0.00361 -0.00298
DA-0.5-EH–2 1.32 1.67 1.26 1.76 –0.00226 –0.00204
DA-0.5-EH–3 –0.12 3.15 2.14 0.83 –0.02109 0.00535
DA-0.5-EH–4 0.76 – 1.97 1.77 – 0.00082
DA-1.0-EH–1 1.41 1.57 0.51 2.51 –0.00103 –0.00816
DA-1.0-EH–2 1.50 1.48 2.12 0.90 0.00013 0.00498
DA-1.0-EH–3 2.37 0.61 1.12 1.90 0.01135 -0.00318
DA-1.0-EH–4 1.62 – 1.40 1.49 – –0.00037
DA-0.5-S–1 0.87 2.10 1.30 1.74 –0.00794 –0.00180
DA-0.5-S–2 0.62 2.45 1.09 1.86 –0.01181 –0.00314
DA-0.5-S–3 1.59 – 0.87 2.04 – –0.00478
DA-0.5-S–4 0.58 – 2.03 1.92 – 0.00045
DA-1.0-S–1 1.40 1.60 – – –0.00129 –
DA-1.0-S–2 0.94 2.08 1.03 1.96 –0.00735 –0.00380
DA-1.0-S–3 1.30 1.71 1.51 1.50 –0.00265 0.00004
DA-1.0-S–4 1.50 – 0.91 2.12 – –0.00494
AM-0.4-EH–2 1.95 0.93 1.44 1.69 0.00658 –0.00102
AM-0.4-EH–3 0.79 2.13 1.38 1.59 –0.00864 –0.00086
AM-0.4-EH–4 1.51 1.49 2.48 0.52 0.00013 0.00800
AM-0.4-EH–5 1.65 1.36 1.73 1.27 0.00187 0.00188
AM-0.4-EH–6 0.99 1.98 1.91 1.12 –0.00639 0.00322
AM-0.8-EH–1 1.05 1.96 3.43 –0.43 –0.00587 0.01575
AM-0.8-EH–2 2.30 0.67 2.56 0.47 0.01052 0.00853
AM-0.8-EH–3 1.65 1.30 3.12 –0.06 0.00226 0.01298
AM-0.8-EH–4 2.42 0.54 0.61 2.44 0.01213 –0.00747
AM-0.8-EH–5 0.50 2.50 0.81 2.19 –0.01290 –0.00563
AM-0.8-EH–6 0.23 2.75 1.93 1.09 –0.01626 0.00343
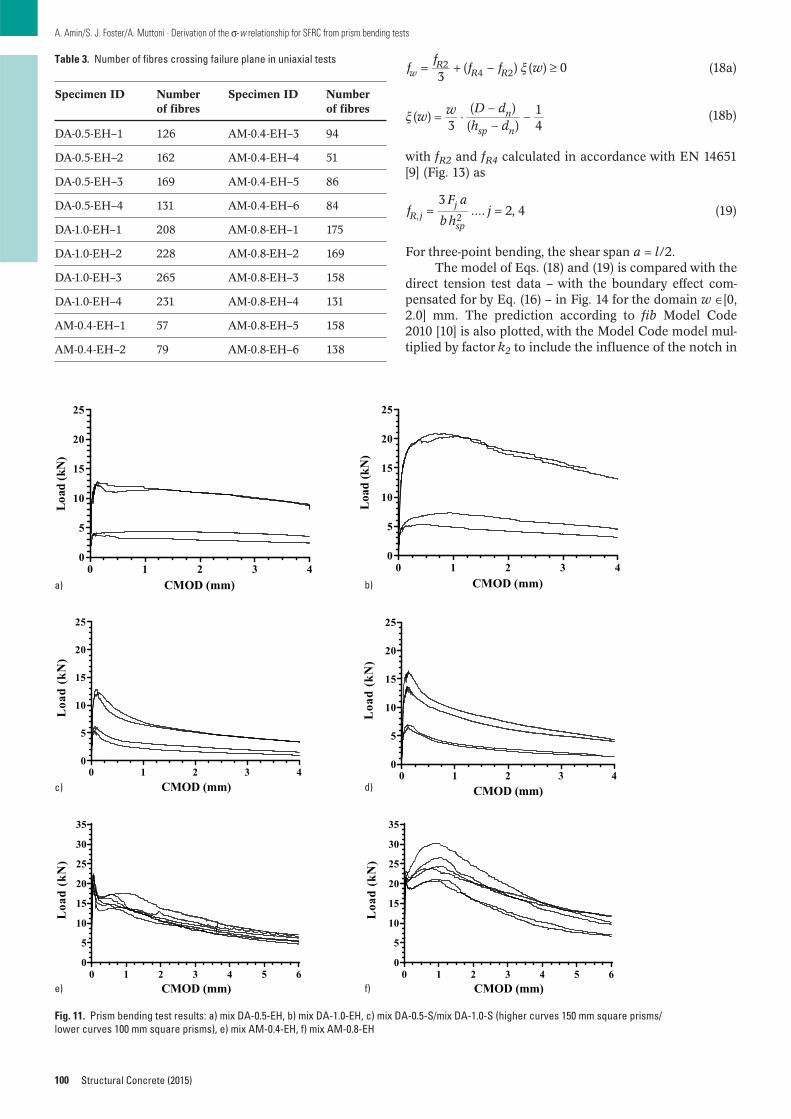
100
A. Amin/S. J. Foster/A. Muttoni · Derivation of the σ-w relationship for SFRC from prism bending tests
Structural Concrete (2015)
(18a)
(18b)
with fR2 and fR4 calculated in accordance with EN 14651[9] (Fig. 13) as
(19)
For three-point bending, the shear span a = l/2.The model of Eqs. (18) and (19) is compared with the
direct tension test data – with the boundary effect com-pensated for by Eq. (16) – in Fig. 14 for the domain w ∈[0,2.0] mm. The prediction according to fib Model Code2010 [10] is also plotted, with the Model Code model mul-tiplied by factor k2 to include the influence of the notch in
3( ) ( ) 02
4 2ff
f f wwR
R R
( )3
( )( )
14
w w D dh d
n
sp n
3.... 2, 4, 2
fF a
bhjR j
j
sp
Table 3. Number of fibres crossing failure plane in uniaxial tests
Specimen ID Number Specimen ID Number of fibres of fibres
DA-0.5-EH–1 126 AM-0.4-EH–3 94
DA-0.5-EH–2 162 AM-0.4-EH–4 51
DA-0.5-EH–3 169 AM-0.4-EH–5 86
DA-0.5-EH–4 131 AM-0.4-EH–6 84
DA-1.0-EH–1 208 AM-0.8-EH–1 175
DA-1.0-EH–2 228 AM-0.8-EH–2 169
DA-1.0-EH–3 265 AM-0.8-EH–3 158
DA-1.0-EH–4 231 AM-0.8-EH–4 131
AM-0.4-EH–1 57 AM-0.8-EH–5 158
AM-0.4-EH–2 79 AM-0.8-EH–6 138
CMOD (mm)
Load
(kN
)
0 1 2 3 40
5
10
15
20
25
CMOD (mm)
Loa
d (k
N)
0 1 2 3 40
5
10
15
20
25
CMOD (mm)
Loa
d (k
N)
0 1 2 3 40
5
10
15
20
25
CMOD (mm)
Loa
d (k
N)
0 1 2 3 40
5
10
15
20
25
CMOD (mm)
Loa
d (k
N)
0 1 2 3 4 5 60
5
10
15
20
25
30
35
CMOD (mm)
Loa
d (k
N)
0 1 2 3 4 5 60
5
10
15
20
25
30
35
Fig. 11. Prism bending test results: a) mix DA-0.5-EH, b) mix DA-1.0-EH, c) mix DA-0.5-S/mix DA-1.0-S (higher curves 150 mm square prisms/lower curves 100 mm square prisms), e) mix AM-0.4-EH, f) mix AM-0.8-EH
a) b)
c) d)
e) f)
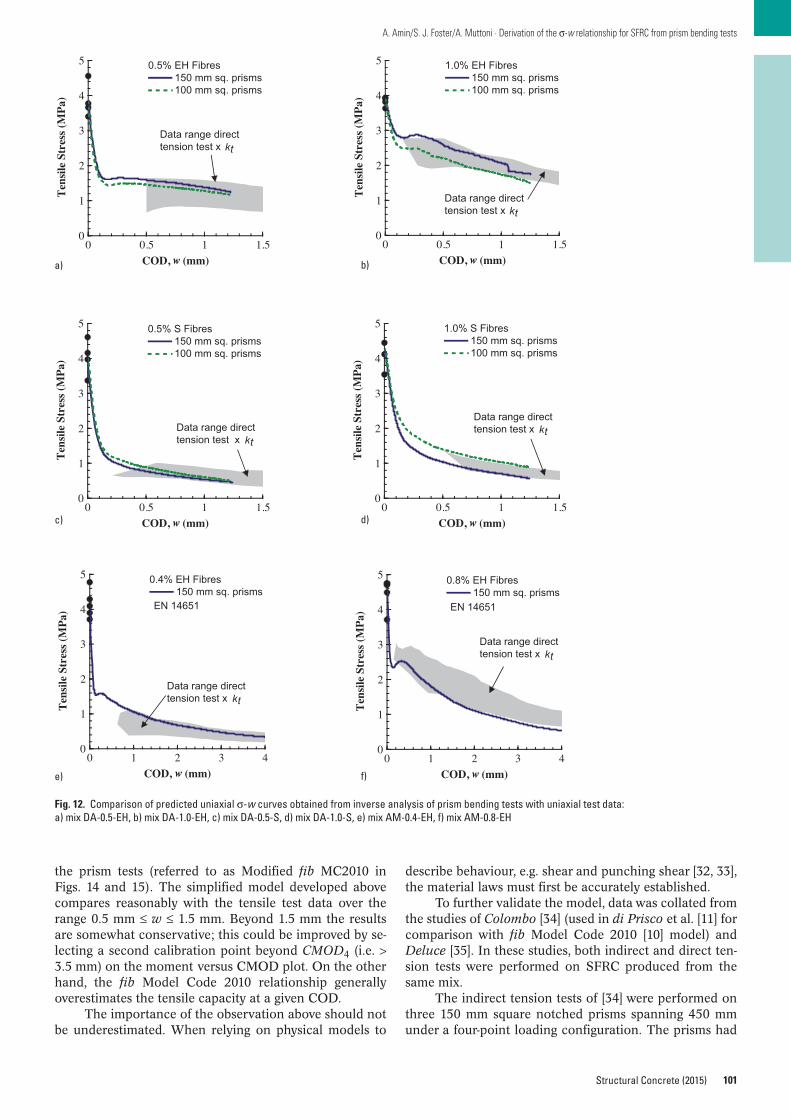
101
A. Amin/S. J. Foster/A. Muttoni · Derivation of the σ-w relationship for SFRC from prism bending tests
Structural Concrete (2015)
the prism tests (referred to as Modified fib MC2010 inFigs. 14 and 15). The simplified model developed abovecompares reasonably with the tensile test data over therange 0.5 mm ≤ w ≤ 1.5 mm. Beyond 1.5 mm the resultsare somewhat conservative; this could be improved by se-lecting a second calibration point beyond CMOD4 (i.e. >3.5 mm) on the moment versus CMOD plot. On the otherhand, the fib Model Code 2010 relationship generallyoverestimates the tensile capacity at a given COD.
The importance of the observation above should notbe underestimated. When relying on physical models to
describe behaviour, e.g. shear and punching shear [32, 33],the material laws must first be accurately established.
To further validate the model, data was collated fromthe studies of Colombo [34] (used in di Prisco et al. [11] forcomparison with fib Model Code 2010 [10] model) andDeluce [35]. In these studies, both indirect and direct ten-sion tests were performed on SFRC produced from thesame mix.
The indirect tension tests of [34] were performed onthree 150 mm square notched prisms spanning 450 mmunder a four-point loading configuration. The prisms had
0 0.5 1 1.5
COD, w (mm)
0
1
2
3
4
5T
ensi
le S
tres
s (M
Pa)
0.5% EH Fibres150 mm sq. prisms100 mm sq. prisms
Data range directtension test x kt
0 0.5 1 1.5
COD, w (mm)
0
1
2
3
4
5
Ten
sile
Str
ess
(MP
a)
1.0% EH Fibres150 mm sq. prisms100 mm sq. prisms
Data range direct tension test x kt
0 0.5 1 1.5
COD, w (mm)
0
1
2
3
4
5
Ten
sile
Str
ess
(MP
a)
0.5% S Fibres150 mm sq. prisms100 mm sq. prisms
Data range direct tension test x kt
0 0.5 1 1.5
COD, w (mm)
0
1
2
3
4
5
Ten
sile
Str
ess
(MP
a)
1.0% S Fibres150 mm sq. prisms100 mm sq. prisms
Data range directtension test x kt
0 1 2 3 4
COD, w (mm)
0
1
2
3
4
5
Ten
sile
Str
ess
(MP
a)
0.4% EH Fibres150 mm sq. prisms
Data range directtension test x kt
EN 14651
0 1 2 3 4
COD, w (mm)
0
1
2
3
4
5
Ten
sile
Str
ess
(MP
a)
0.8% EH Fibres150 mm sq. prisms
Data range directtension test x kt
EN 14651
Fig. 12. Comparison of predicted uniaxial σ-w curves obtained from inverse analysis of prism bending tests with uniaxial test data: a) mix DA-0.5-EH, b) mix DA-1.0-EH, c) mix DA-0.5-S, d) mix DA-1.0-S, e) mix AM-0.4-EH, f) mix AM-0.8-EH
a) b)
c) d)
e) f)
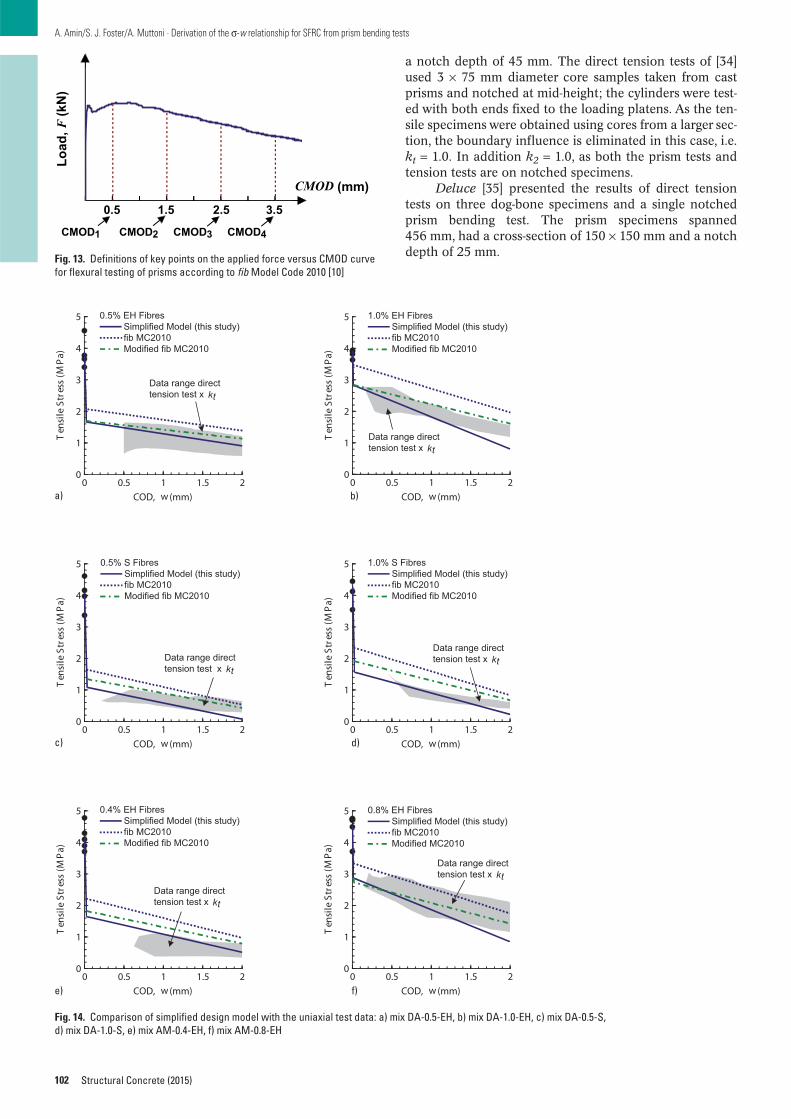
102
A. Amin/S. J. Foster/A. Muttoni · Derivation of the σ-w relationship for SFRC from prism bending tests
Structural Concrete (2015)
a notch depth of 45 mm. The direct tension tests of [34]used 3 × 75 mm diameter core samples taken from castprisms and notched at mid-height; the cylinders were test-ed with both ends fixed to the loading platens. As the ten-sile specimens were obtained using cores from a larger sec-tion, the boundary influence is eliminated in this case, i.e.kt = 1.0. In addition k2 = 1.0, as both the prism tests andtension tests are on notched specimens.
Deluce [35] presented the results of direct tensiontests on three dog-bone specimens and a single notchedprism bending test. The prism specimens spanned456 mm, had a cross-section of 150 × 150 mm and a notchdepth of 25 mm.
0 0.5 1 1.5 2
COD, w (mm)
0
1
2
3
4
5
Ten
sile
Str
ess
(MP
a)
0.5% EH FibresSimplified Model (this study)fib MC2010Modified fib MC2010
Data range directtension test x kt
0 0.5 1 1.5 2
COD, w (mm)
0
1
2
3
4
5T
ensi
le S
tres
s (M
Pa)
1.0% EH FibresSimplified Model (this study)fib MC2010Modified fib MC2010
Data range direct tension test x kt
0 0.5 1 1.5 2
COD, w (mm)
0
1
2
3
4
5
Ten
sile
Str
ess
(MP
a)
0.5% S FibresSimplified Model (this study)fib MC2010Modified fib MC2010
Data range direct tension test x kt
0 0.5 1 1.5 2
COD, w (mm)
0
1
2
3
4
5
Ten
sile
Str
ess
(MP
a)
1.0% S FibresSimplified Model (this study)fib MC2010Modified fib MC2010
Data range directtension test x kt
0 0.5 1 1.5 2
COD, w (mm)
0
1
2
3
4
5
Ten
sile
Str
ess
(MP
a)
0.4% EH FibresSimplified Model (this study)fib MC2010Modified fib MC2010
Data range directtension test x kt
0 0.5 1 1.5 2
COD, w (mm)
0
1
2
3
4
5
Ten
sile
Str
ess
(MP
a)
0.8% EH FibresSimplified Model (this study)fib MC2010Modified MC2010
Data range directtension test x kt
Fig. 14. Comparison of simplified design model with the uniaxial test data: a) mix DA-0.5-EH, b) mix DA-1.0-EH, c) mix DA-0.5-S, d) mix DA-1.0-S, e) mix AM-0.4-EH, f) mix AM-0.8-EH
a) b)
c) d)
e) f)
Load
, F (k
)N
CMOD (mm)
CMOD1 CMOD2 CMOD3 CMOD4
0.5 1.5 2.5 3.5
Fig. 13. Definitions of key points on the applied force versus CMOD curvefor flexural testing of prisms according to fib Model Code 2010 [10]
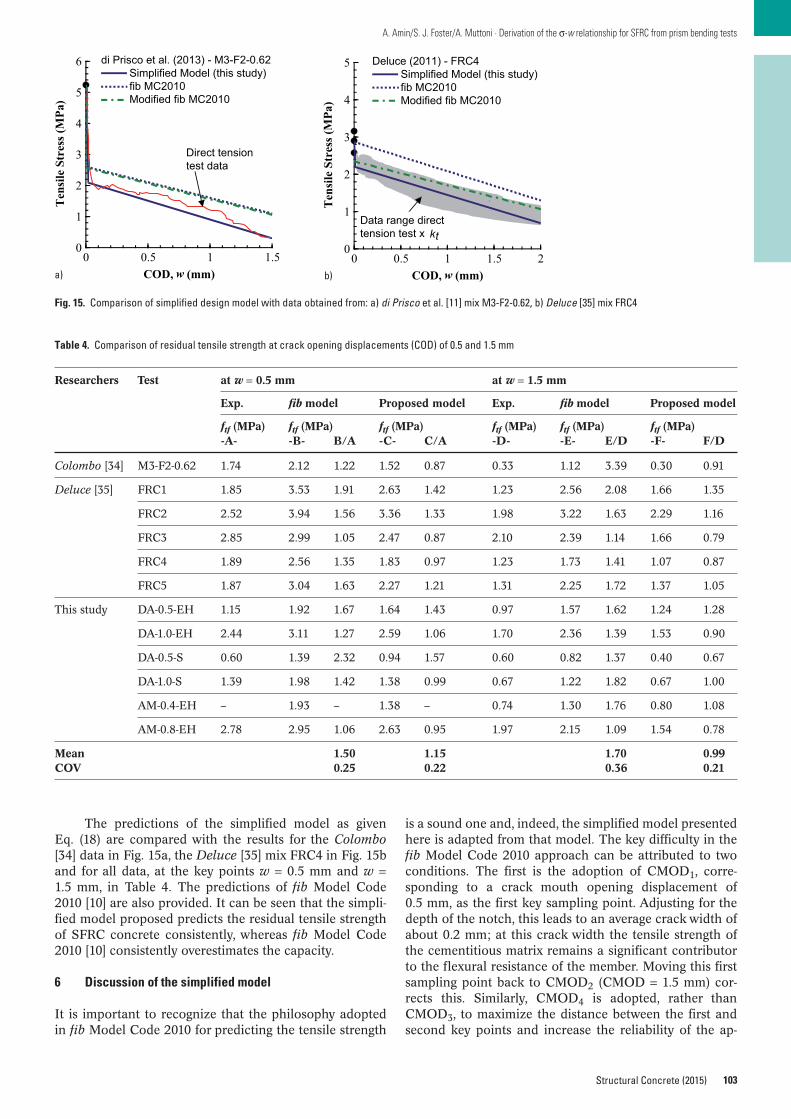
103
A. Amin/S. J. Foster/A. Muttoni · Derivation of the σ-w relationship for SFRC from prism bending tests
Structural Concrete (2015)
The predictions of the simplified model as givenEq. (18) are compared with the results for the Colombo[34] data in Fig. 15a, the Deluce [35] mix FRC4 in Fig. 15band for all data, at the key points w = 0.5 mm and w =1.5 mm, in Table 4. The predictions of fib Model Code2010 [10] are also provided. It can be seen that the simpli-fied model proposed predicts the residual tensile strengthof SFRC concrete consistently, whereas fib Model Code2010 [10] consistently overestimates the capacity.
6 Discussion of the simplified model
It is important to recognize that the philosophy adoptedin fib Model Code 2010 for predicting the tensile strength
is a sound one and, indeed, the simplified model presentedhere is adapted from that model. The key difficulty in thefib Model Code 2010 approach can be attributed to twoconditions. The first is the adoption of CMOD1, corre-sponding to a crack mouth opening displacement of0.5 mm, as the first key sampling point. Adjusting for thedepth of the notch, this leads to an average crack width ofabout 0.2 mm; at this crack width the tensile strength ofthe cementitious matrix remains a significant contributorto the flexural resistance of the member. Moving this firstsampling point back to CMOD2 (CMOD = 1.5 mm) cor-rects this. Similarly, CMOD4 is adopted, rather thanCMOD3, to maximize the distance between the first andsecond key points and increase the reliability of the ap-
0 0.5 1 1.5COD, w (mm)
0
1
2
3
4
5
6T
ensi
le S
tres
s (M
Pa)
di Prisco et al. (2013) - M3-F2-0.62Simplified Model (this study)fib MC2010Modified fib MC2010
Direct tension test data
0 0.5 1 1.5 2COD, w (mm)
0
1
2
3
4
5
Ten
sile
Str
ess (
MPa
)
Deluce (2011) - FRC4Simplified Model (this study)fib MC2010Modified fib MC2010
Data range direct tension test x kt
Fig. 15. Comparison of simplified design model with data obtained from: a) di Prisco et al. [11] mix M3-F2-0.62, b) Deluce [35] mix FRC4
a) b)
Table 4. Comparison of residual tensile strength at crack opening displacements (COD) of 0.5 and 1.5 mm
Researchers Test at w = 0.5 mm at w = 1.5 mm
Exp. fib model Proposed model Exp. fib model Proposed model
ftf (MPa) ftf (MPa) ftf (MPa) ftf (MPa) ftf (MPa) ftf (MPa)-A- -B- B/A -C- C/A -D- -E- E/D -F- F/D
Colombo [34] M3-F2-0.62 1.74 2.12 1.22 1.52 0.87 0.33 1.12 3.39 0.30 0.91
Deluce [35] FRC1 1.85 3.53 1.91 2.63 1.42 1.23 2.56 2.08 1.66 1.35
FRC2 2.52 3.94 1.56 3.36 1.33 1.98 3.22 1.63 2.29 1.16
FRC3 2.85 2.99 1.05 2.47 0.87 2.10 2.39 1.14 1.66 0.79
FRC4 1.89 2.56 1.35 1.83 0.97 1.23 1.73 1.41 1.07 0.87
FRC5 1.87 3.04 1.63 2.27 1.21 1.31 2.25 1.72 1.37 1.05
This study DA-0.5-EH 1.15 1.92 1.67 1.64 1.43 0.97 1.57 1.62 1.24 1.28
DA-1.0-EH 2.44 3.11 1.27 2.59 1.06 1.70 2.36 1.39 1.53 0.90
DA-0.5-S 0.60 1.39 2.32 0.94 1.57 0.60 0.82 1.37 0.40 0.67
DA-1.0-S 1.39 1.98 1.42 1.38 0.99 0.67 1.22 1.82 0.67 1.00
AM-0.4-EH – 1.93 – 1.38 – 0.74 1.30 1.76 0.80 1.08
AM-0.8-EH 2.78 2.95 1.06 2.63 0.95 1.97 2.15 1.09 1.54 0.78
Mean 1.50 1.15 1.70 0.99COV 0.25 0.22 0.36 0.21
proach. The second condition is the influence of testingon notched specimens, where the failure section is definedby the location of the notch and not by probabilities relat-ed to fibre distributions and scatter. When tested againstthe available data collected in this study and elsewhere, atthe key point w = 1.5 mm (Table 4), the model predictionto experimental ratio is 0.99 and has a COV of 0.21.
7 Conclusions
In order to increase the utilization of SFRC in structuralapplications, it is important to establish the post-cracking,or residual, tensile strength of SFRC correctly. The post-cracking behaviour of SFRC can be obtained directly fromuniaxial tensile tests or indirectly, following an inverseanalysis of notched beams in bending. Consequently, reli-able methods to attain these results are required.
Following an experimental investigation of six soft-ening SFRC mixes and a subsequent analysis that exam-ined the applicability of inverse analysis techniques foundin the literature, i.e. ones that led to the approach adoptedin fib Model Code 2010 [10], it was found that the fib Model Code 2010 results might overestimate the residualtensile strength that forms the basis of physical models forSFRC.
To address this, a simple yet effective inverse analysisprocedure was derived to find the σ-w relationship forSFRC from prism bending tests. The model considers theinfluence of fibres on the moment carried by the specimenfrom the point in the test where the uncracked concretehas little influence on its capacity and considers rigidbody rotations.
In the development of the model it is important tonote that the measurement point for the CMOD is not atthe notch root (i.e. the location of the true crack mouth)but at a certain distance from it. Using this observation, arational model is derived which is independent of speci-men geometry, testing span and method of testing, i.e.three- or four-point bending.
The model was validated against experimental dataobtained from direct tension tests on six SFRC mixes car-ried out in this study and six SFRC mixes obtained fromresults presented in the literature. For all 12 mixes tested,each of varying fibre type and dosage, and for five differ-ent prism geometries tested, the model predicted the re-sults well and generally within the range of scatter of thecollected data.
References
1. Romualdi, J. P., Batson. G. B.: Behaviour of reinforced con-crete beams with closely spaced reinforcement. Proc., ACIJournal, 60 (6), 1963, pp. 775–789.
2. van Mier, J. G. M.: Concrete Fracture: a Multiscale Ap-proach. CRC Press, Boca Raton, Florida, USA, 2013.
3. van Vliet, M. R. A., van Mier, J. G. M.: Effect of strain gradi-ents on the size effect of concrete in uniaxial tension. Inter-national Journal of Fracture, 95, 1999, pp. 195–219.
4. van Mier, J. G. M., van Vliet, M. R. A.: Uniaxial tension testfor the determination of fracture parameters of concrete:state of the art. Engineering Fracture Mechanics, 69, 2002,pp. 235 –247.
104
A. Amin/S. J. Foster/A. Muttoni · Derivation of the σ-w relationship for SFRC from prism bending tests
Structural Concrete (2015)
5. Zhang, J., Stang. H.: Application of stress crack width rela-tionship in predicting the flexural behavior of fiber rein-forced concrete. Journal of Cement and Concrete Research,28 (3), 1998, pp. 439–452.
6. Planas, J., Guinea, G. V., Elices, M.: Size effect and inverseanalysis in concrete fracture. International Journal of Frac-ture, 95, 1999, pp. 367–378.
7. de Oliveira e Sousa, J. L. A., Gettu, R., Barragán, B. E.: In-verse analysis of the notched beam response for determiningthe σ-w curve for plain and fiber reinforced concretes. Analesde Mecánica de la Fractura, 19, 2002, pp. 393–398.
8. di Prisco, M., Plizzari, G., Vandewalle, L.: Fibre reinforcedconcrete: new design perspectives. Materials and Structures,42, 2009, pp. 1261–1281.
9. EN 14651:2007: Test Method for Metallic Fibre Concrete –Measuring the Flexural Tensile Strength (Limit of Propor-tionality (LOP), Residual). European Committee for Stan-dardization.
10. fib – International Federation for Structural Concrete. fibModel Code for Concrete Structures 2010. Berlin: VerlagErnst & Sohn, 2013.
11. di Prisco, M., Colombo, M., Dozio, D. (2013): Fibre-rein-forced concrete in fib Model Code 2010: principles, modelsand test validation. Structural Concrete, 14, pp. 342–361.
12. Zhu, Y.: The Flexural Strength Function for ConcreteBeams: A Closed Form Solution Based on the FictitiousCrack Model. Bulletin No. 157, Department of StructuralMechanics & Engineering, The Royal Institute of Technolo-gy, Stockholm, Sweden, 1991, pp. B2–B23.
13. Sigrist, V.: Zum Verformungsvermögen von Stahlbeton-trägern (On the Deformation Capacity of Reinforced Con-crete Beams). PhD dissertation, IBK Report No.210, SwissFederal Institute of Technology, Switzerland, 1995 (in Ger-man).
14. Foster, S. J, Htut, T. N. S., Ng, T. S.: High Performance FibreReinforced Concrete: Fundamental Behaviour and Model-ling. Proc. of 8th Int. Conf. on Fracture Mechanics Concreteand Concrete Structures (FraMCoS-8), Toledo, Spain, 10–14Mar 2013, pp. 69–78.
15. Htut, T. N. S.: Fracture processes in steel fibre reinforcedconcrete. PhD dissertation, School of Civil & Environmen-tal Engineering, The University of New South Wales, Aus-tralia, 2010.
16. JCI-S-002-2003: Method of test for load-displacement curveof fiber reinforced concrete by use of notched beam. JapanConcrete Institute, 2003.
17. Voo, J. Y. L., Foster, S. J.: Tensile fracture of fibre reinforcedconcrete: variable engagement model. In: di Prisco, M., Felicett, R. Plizzari, G.A. (eds.), 6th Rilem Symposium on Fibre-reinforced Concrete (FRC), Varenna, Italy, 20–22 Sept2004, pp. 875–884.
18. Foster, S. J., Voo, Y. L. Chong, K. T.: Analysis of Steel FiberReinforced Concrete Beams Failing in Shear: Variable En-gagement Model, chap. 5: Finite Element Analysis of Rein-forced Concrete Structures, Lowes, L., Filippou, F. (eds.),ACI SP-237, 2006, pp. 55–70 (CD-ROM).
19. Voo, Y. L., Foster, S. J.: Reactive powder concrete: analysisand design of RPC girders. Lambert Academic Publishing,2009, ISBN 978-3-8383-2406-7.
20. Lee, G. G., Foster, S. J.: Behaviour of steel fibre reinforcedmortar III: variable engagement model II. UNICIV report R-448, School of Civil & Environmental Engineering, The Uni-versity of New South Wales, Australia, 2007.
21. Lee, G. G., Foster, S. J.: Modelling of shear-fracture of fibre-reinforced concrete. Int. fib Symposium, CRC Press, 2008,pp. 493–499.
22. Voo, J. Y. L., Foster, S. J.: Variable engagement model for fibre-reinforced concrete in tension. UNICIV report R-420,
105
A. Amin/S. J. Foster/A. Muttoni · Derivation of the σ-w relationship for SFRC from prism bending tests
Structural Concrete (2015)
School of Civil & Environmental Engineering, The Univer -sity of New South Wales, Australia, 2003.
23. Ng, T. S., Htut, T. N. S., Foster, S. J.: Fracture of steel fibre-re-inforced concrete – the unified variable engagement model.UNICIV report R-460, School of Civil & Environmental En-gineering, The University of New South Wales, Australia,2012.
24. AS1012.9: Methods of Testing Concrete – Determination ofthe compressive strength of concrete specimens. StandardsAustralia, 1999.
25. AS1012.17: Methods of Testing Concrete – Determination ofthe static chord modulus of elasticity and Poisson’s ratio ofconcrete specimens. Standards Australia, 1997.
26. van Vliet, M. R. A.: Size effect in tensile fracture of concreteand rock. PhD dissertation, Delft University, The Nether-lands, 2000.
27. Romualdi, J. P., Mandel, J. A.: Tensile strength of concreteaffected by uniformly distributed and closely spaced shortlength wire reinforcement. Journal of American Concrete In-stitute Proc., 61 (6), 1964, pp. 657–671.
28. Aveston, J., Kelly, A.: Theory of multiple fracture of fibrouscomposites. Journal of Materials Science, 8 (3), 1973, pp.352–362.
29. Stroeven, P.: Stereological principles of spatial modelling ap-plied to steel fibre-reinforced concrete in tension. ACI Mate-rials Journal, 106 (3), 2009, pp. 213–222.
30. Lee, S. C., Cho, J., Vecchio, F. J.: Diverse embedment modelfor steel fibre-reinforced concrete in tension: model develop-ment. ACI Materials Journal, 108 (5), 2011, pp. 516–525.
31. Amin, A., Foster, S. J., Muttoni, A.: Evaluation of The Ten-sile Strength of SFRC as derived from Inverse Analysis ofNotched Bending Test. Proc. of 8th Int. Conf. on FractureMechanics Concrete & Concrete Structures (FraMCoS-8),Toledo, Spain, 10–14 Mar 2013, pp. 1049–1057.
32. Foster, S. J.: Design of FRC Beams for Shear using the VEMand the Draft Model Code Approach, chapter 12: Recent Developments on Shear and Punching Shear on RC andFRC Elements, Minelli, F., Plizzari, G. (eds.), fib Bulletin 57,Fédération Internationale du Béton, Lausanne, Switzerland,2010.
33. Maya, L. F., Fernández Ruiz, M., Muttoni, A., Foster, S. J.:Punching shear strength of steel fibre-reinforced concreteslabs. Engineering Structures, 40, 2012, pp. 83–94.
34. Colombo, M.: FRC Bending Behaviour: a Damage Model forHigh Temperatures. PhD dissertation, Politecnico di Milano,Italy, 2006.
35. Deluce, J.: Cracking Behaviour of Steel Fibre-reinforcedConcrete Containing Conventional Steel Reinforcement.MASc dissertation, The University of Toronto, Canada, 2011.
Aurelio Muttoni, ProfessorSchool of ArchitectureCivil & Environmental EngineeringÉcole Polytechnique Fédérale de Lausanne,CH-1015 Lausanne, Switzerland
Stephen J. Foster, Professor, Head of SchoolCivil & Environmental EngineeringThe University of New South WalesSydney NSW 2052, AustraliaPhone +61 2 9385 [email protected]
Ali Amin, Research StudentCentre for Infrastructure Engineering & SafetySchool of Civil & Environmental EngineeringThe University of New South WalesSydney NSW 2052, [email protected]
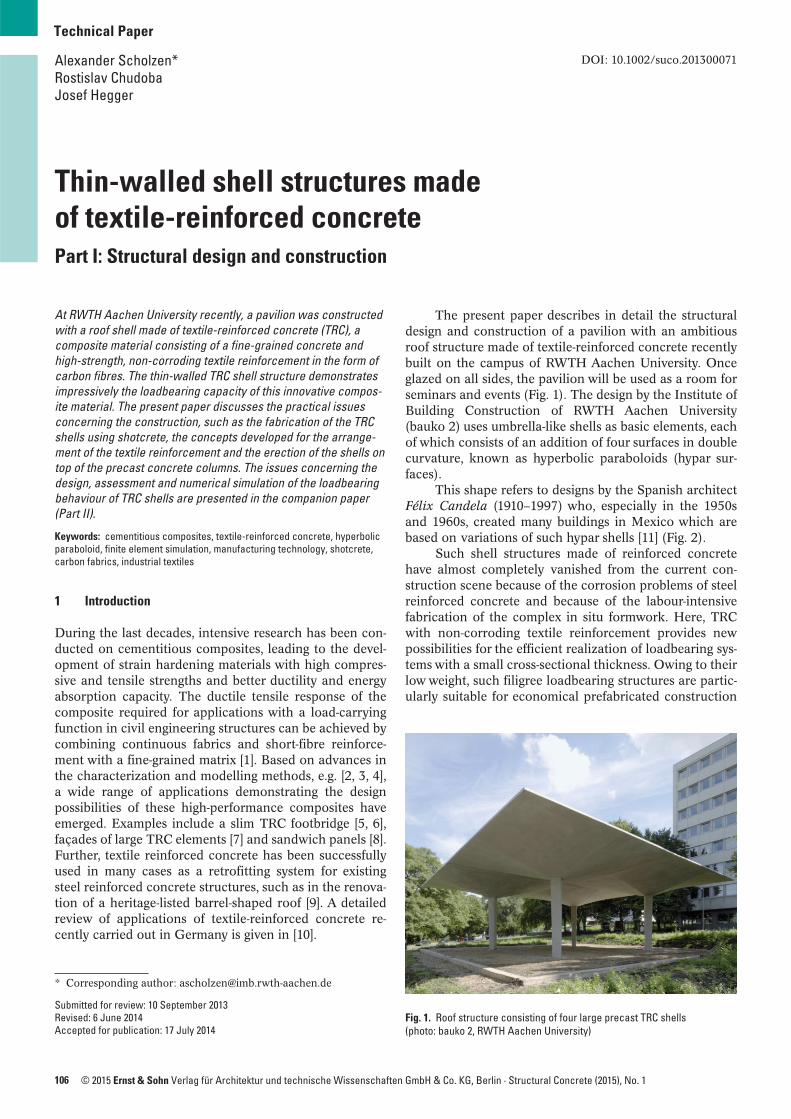
106 © 2015 Ernst & Sohn Verlag für Architektur und technische Wissenschaften GmbH & Co. KG, Berlin · Structural Concrete (2015), No. 1
Technical Paper
DOI: 10.1002/suco.201300071
At RWTH Aachen University recently, a pavilion was constructedwith a roof shell made of textile-reinforced concrete (TRC), acomposite material consisting of a fine-grained concrete andhigh-strength, non-corroding textile reinforcement in the form ofcarbon fibres. The thin-walled TRC shell structure demonstratesimpressively the loadbearing capacity of this innovative compos-ite material. The present paper discusses the practical issuesconcerning the construction, such as the fabrication of the TRCshells using shotcrete, the concepts developed for the arrange-ment of the textile reinforcement and the erection of the shells ontop of the precast concrete columns. The issues concerning thedesign, assessment and numerical simulation of the loadbearingbehaviour of TRC shells are presented in the companion paper(Part II).
Keywords: cementitious composites, textile-reinforced concrete, hyperbolicparaboloid, finite element simulation, manufacturing technology, shotcrete,carbon fabrics, industrial textiles
1 Introduction
During the last decades, intensive research has been con-ducted on cementitious composites, leading to the devel-opment of strain hardening materials with high compres-sive and tensile strengths and better ductility and energyabsorption capacity. The ductile tensile response of thecomposite required for applications with a load-carryingfunction in civil engineering structures can be achieved bycombining continuous fabrics and short-fibre reinforce-ment with a fine-grained matrix [1]. Based on advances inthe characterization and modelling methods, e.g. [2, 3, 4],a wide range of applications demonstrating the designpossibilities of these high-performance composites haveemerged. Examples include a slim TRC footbridge [5, 6],façades of large TRC elements [7] and sandwich panels [8].Further, textile reinforced concrete has been successfullyused in many cases as a retrofitting system for existingsteel reinforced concrete structures, such as in the renova-tion of a heritage-listed barrel-shaped roof [9]. A detailedreview of applications of textile-reinforced concrete re-cently carried out in Germany is given in [10].
The present paper describes in detail the structuraldesign and construction of a pavilion with an ambitiousroof structure made of textile-reinforced concrete recentlybuilt on the campus of RWTH Aachen University. Onceglazed on all sides, the pavilion will be used as a room forseminars and events (Fig. 1). The design by the Institute ofBuilding Construction of RWTH Aachen University(bauko 2) uses umbrella-like shells as basic elements, eachof which consists of an addition of four surfaces in doublecurvature, known as hyperbolic paraboloids (hypar sur-faces).
This shape refers to designs by the Spanish architectFélix Candela (1910–1997) who, especially in the 1950sand 1960s, created many buildings in Mexico which arebased on variations of such hypar shells [11] (Fig. 2).
Such shell structures made of reinforced concretehave almost completely vanished from the current con-struction scene because of the corrosion problems of steelreinforced concrete and because of the labour-intensivefabrication of the complex in situ formwork. Here, TRCwith non-corroding textile reinforcement provides newpossibilities for the efficient realization of loadbearing sys-tems with a small cross-sectional thickness. Owing to theirlow weight, such filigree loadbearing structures are partic-ularly suitable for economical prefabricated construction
Thin-walled shell structures made of textile-reinforced concretePart I: Structural design and construction
Alexander Scholzen*Rostislav ChudobaJosef Hegger
* Corresponding author: [email protected]
Submitted for review: 10 September 2013Revised: 6 June 2014Accepted for publication: 17 July 2014
Fig. 1. Roof structure consisting of four large precast TRC shells (photo: bauko 2, RWTH Aachen University)
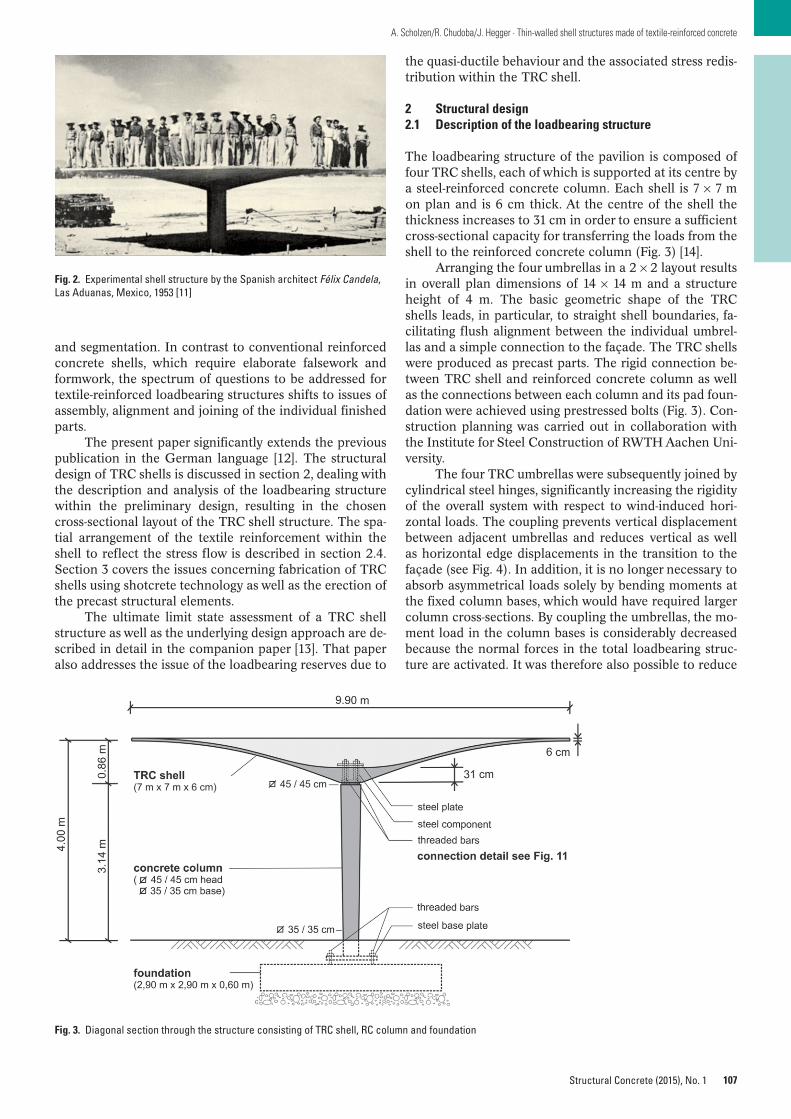
107
A. Scholzen/R. Chudoba/J. Hegger · Thin-walled shell structures made of textile-reinforced concrete
Structural Concrete (2015), No. 1
and segmentation. In contrast to conventional reinforcedconcrete shells, which require elaborate falsework andformwork, the spectrum of questions to be addressed fortextile-reinforced loadbearing structures shifts to issues ofassembly, alignment and joining of the individual finishedparts.
The present paper significantly extends the previouspublication in the German language [12]. The structuraldesign of TRC shells is discussed in section 2, dealing withthe description and analysis of the loadbearing structurewithin the preliminary design, resulting in the chosencross-sectional layout of the TRC shell structure. The spa-tial arrangement of the textile reinforcement within theshell to reflect the stress flow is described in section 2.4.Section 3 covers the issues concerning fabrication of TRCshells using shotcrete technology as well as the erection ofthe precast structural elements.
The ultimate limit state assessment of a TRC shellstructure as well as the underlying design approach are de-scribed in detail in the companion paper [13]. That paperalso addresses the issue of the loadbearing reserves due to
the quasi-ductile behaviour and the associated stress redis-tribution within the TRC shell.
2 Structural design2.1 Description of the loadbearing structure
The loadbearing structure of the pavilion is composed offour TRC shells, each of which is supported at its centre bya steel-reinforced concrete column. Each shell is 7 × 7 mon plan and is 6 cm thick. At the centre of the shell thethickness increases to 31 cm in order to ensure a sufficientcross-sectional capacity for transferring the loads from theshell to the reinforced concrete column (Fig. 3) [14].
Arranging the four umbrellas in a 2 × 2 layout resultsin overall plan dimensions of 14 × 14 m and a structureheight of 4 m. The basic geometric shape of the TRCshells leads, in particular, to straight shell boundaries, fa-cilitating flush alignment between the individual umbrel-las and a simple connection to the façade. The TRC shellswere produced as precast parts. The rigid connection be-tween TRC shell and reinforced concrete column as wellas the connections between each column and its pad foun-dation were achieved using prestressed bolts (Fig. 3). Con-struction planning was carried out in collaboration withthe Institute for Steel Construction of RWTH Aachen Uni-versity.
The four TRC umbrellas were subsequently joined bycylindrical steel hinges, significantly increasing the rigidityof the overall system with respect to wind-induced hori-zontal loads. The coupling prevents vertical displacementbetween adjacent umbrellas and reduces vertical as wellas horizontal edge displacements in the transition to thefaçade (see Fig. 4). In addition, it is no longer necessary toabsorb asymmetrical loads solely by bending moments atthe fixed column bases, which would have required largercolumn cross-sections. By coupling the umbrellas, the mo-ment load in the column bases is considerably decreasedbecause the normal forces in the total loadbearing struc-ture are activated. It was therefore also possible to reduce
Fig. 2. Experimental shell structure by the Spanish architect Félix Candela,Las Aduanas, Mexico, 1953 [11]
Fig. 3. Diagonal section through the structure consisting of TRC shell, RC column and foundation
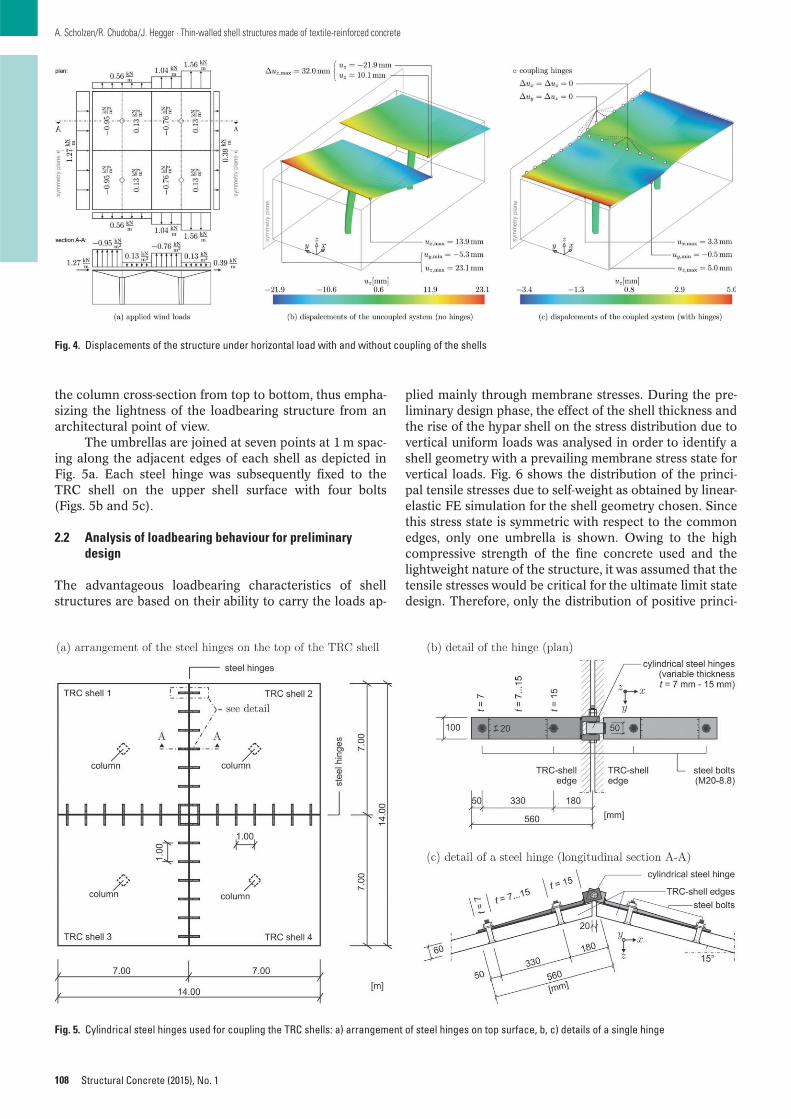
108
A. Scholzen/R. Chudoba/J. Hegger · Thin-walled shell structures made of textile-reinforced concrete
Structural Concrete (2015), No. 1
the column cross-section from top to bottom, thus empha-sizing the lightness of the loadbearing structure from anarchitectural point of view.
The umbrellas are joined at seven points at 1 m spac-ing along the adjacent edges of each shell as depicted inFig. 5a. Each steel hinge was subsequently fixed to theTRC shell on the upper shell surface with four bolts(Figs. 5b and 5c).
2.2 Analysis of loadbearing behaviour for preliminarydesign
The advantageous loadbearing characteristics of shellstructures are based on their ability to carry the loads ap-
plied mainly through membrane stresses. During the pre-liminary design phase, the effect of the shell thickness andthe rise of the hypar shell on the stress distribution due tovertical uniform loads was analysed in order to identify ashell geometry with a prevailing membrane stress state forvertical loads. Fig. 6 shows the distribution of the princi-pal tensile stresses due to self-weight as obtained by linear-elastic FE simulation for the shell geometry chosen. Sincethis stress state is symmetric with respect to the commonedges, only one umbrella is shown. Owing to the highcompressive strength of the fine concrete used and thelightweight nature of the structure, it was assumed that thetensile stresses would be critical for the ultimate limit statedesign. Therefore, only the distribution of positive princi-
Fig. 4. Displacements of the structure under horizontal load with and without coupling of the shells
Fig. 5. Cylindrical steel hinges used for coupling the TRC shells: a) arrangement of steel hinges on top surface, b, c) details of a single hinge
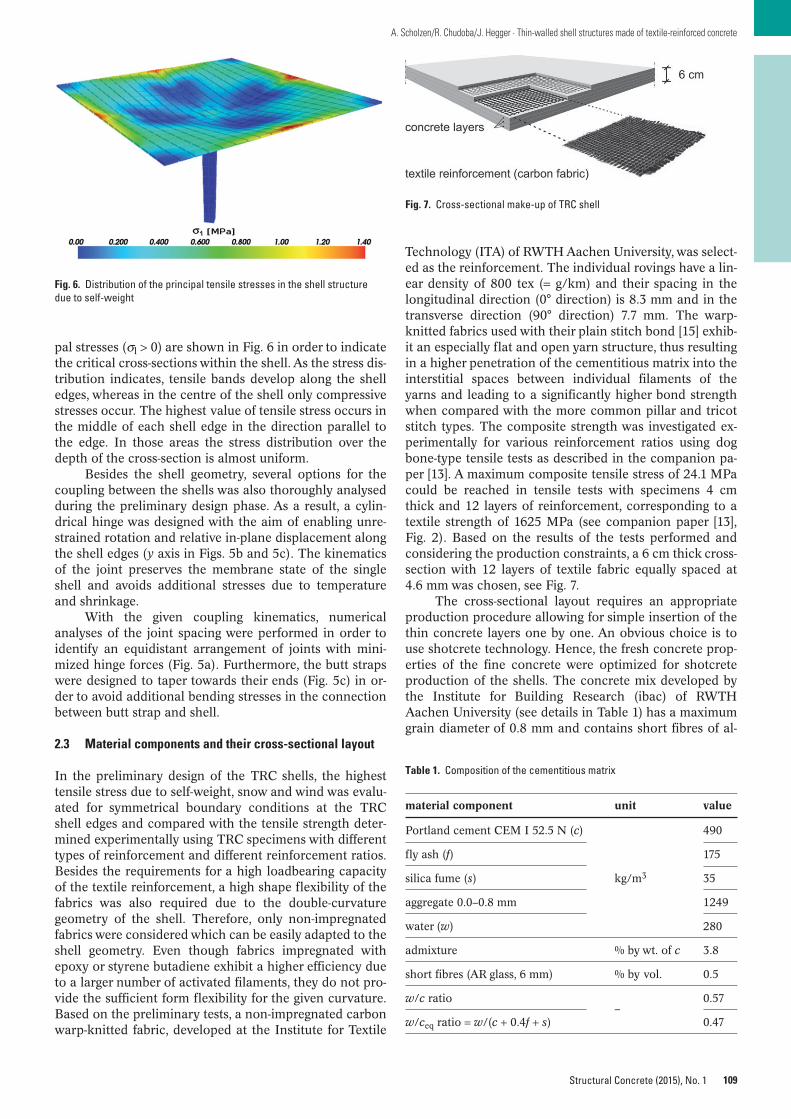
109
A. Scholzen/R. Chudoba/J. Hegger · Thin-walled shell structures made of textile-reinforced concrete
Structural Concrete (2015), No. 1
pal stresses (σl > 0) are shown in Fig. 6 in order to indicatethe critical cross-sections within the shell. As the stress dis-tribution indicates, tensile bands develop along the shelledges, whereas in the centre of the shell only compressivestresses occur. The highest value of tensile stress occurs inthe middle of each shell edge in the direction parallel tothe edge. In those areas the stress distribution over thedepth of the cross-section is almost uniform.
Besides the shell geometry, several options for thecoupling between the shells was also thoroughly analysedduring the preliminary design phase. As a result, a cylin-drical hinge was designed with the aim of enabling unre-strained rotation and relative in-plane displacement alongthe shell edges (y axis in Figs. 5b and 5c). The kinematicsof the joint preserves the membrane state of the singleshell and avoids additional stresses due to temperatureand shrinkage.
With the given coupling kinematics, numericalanalyses of the joint spacing were performed in order toidentify an equidistant arrangement of joints with mini-mized hinge forces (Fig. 5a). Furthermore, the butt strapswere designed to taper towards their ends (Fig. 5c) in or-der to avoid additional bending stresses in the connectionbetween butt strap and shell.
2.3 Material components and their cross-sectional layout
In the preliminary design of the TRC shells, the highesttensile stress due to self-weight, snow and wind was evalu-ated for symmetrical boundary conditions at the TRCshell edges and compared with the tensile strength deter-mined experimentally using TRC specimens with differenttypes of reinforcement and different reinforcement ratios.Besides the requirements for a high loadbearing capacityof the textile reinforcement, a high shape flexibility of thefabrics was also required due to the double-curvaturegeometry of the shell. Therefore, only non-impregnatedfabrics were considered which can be easily adapted to theshell geometry. Even though fabrics impregnated withepoxy or styrene butadiene exhibit a higher efficiency dueto a larger number of activated filaments, they do not pro-vide the sufficient form flexibility for the given curvature.Based on the preliminary tests, a non-impregnated carbonwarp-knitted fabric, developed at the Institute for Textile
Technology (ITA) of RWTH Aachen University, was select-ed as the reinforcement. The individual rovings have a lin-ear density of 800 tex (= g/km) and their spacing in thelongitudinal direction (0° direction) is 8.3 mm and in thetransverse direction (90° direction) 7.7 mm. The warp-knitted fabrics used with their plain stitch bond [15] exhib-it an especially flat and open yarn structure, thus resultingin a higher penetration of the cementitious matrix into theinterstitial spaces between individual filaments of theyarns and leading to a significantly higher bond strengthwhen compared with the more common pillar and tricotstitch types. The composite strength was investigated ex-perimentally for various reinforcement ratios using dogbone-type tensile tests as described in the companion pa-per [13]. A maximum composite tensile stress of 24.1 MPacould be reached in tensile tests with specimens 4 cmthick and 12 layers of reinforcement, corresponding to atextile strength of 1625 MPa (see companion paper [13],Fig. 2). Based on the results of the tests performed andconsidering the production constraints, a 6 cm thick cross-section with 12 layers of textile fabric equally spaced at4.6 mm was chosen, see Fig. 7.
The cross-sectional layout requires an appropriateproduction procedure allowing for simple insertion of thethin concrete layers one by one. An obvious choice is touse shotcrete technology. Hence, the fresh concrete prop-erties of the fine concrete were optimized for shotcreteproduction of the shells. The concrete mix developed bythe Institute for Building Research (ibac) of RWTHAachen University (see details in Table 1) has a maximumgrain diameter of 0.8 mm and contains short fibres of al-
Table 1. Composition of the cementitious matrix
material component unit value
Portland cement CEM I 52.5 N (c) 490
fly ash (f) 175
silica fume (s) kg/m3 35
aggregate 0.0–0.8 mm 1249
water (w) 280
admixture % by wt. of c 3.8
short fibres (AR glass, 6 mm) % by vol. 0.5
w/c ratio–
0.57
w/ceq ratio = w/(c + 0.4f + s) 0.47
Fig. 6. Distribution of the principal tensile stresses in the shell structuredue to self-weight
Fig. 7. Cross-sectional make-up of TRC shell
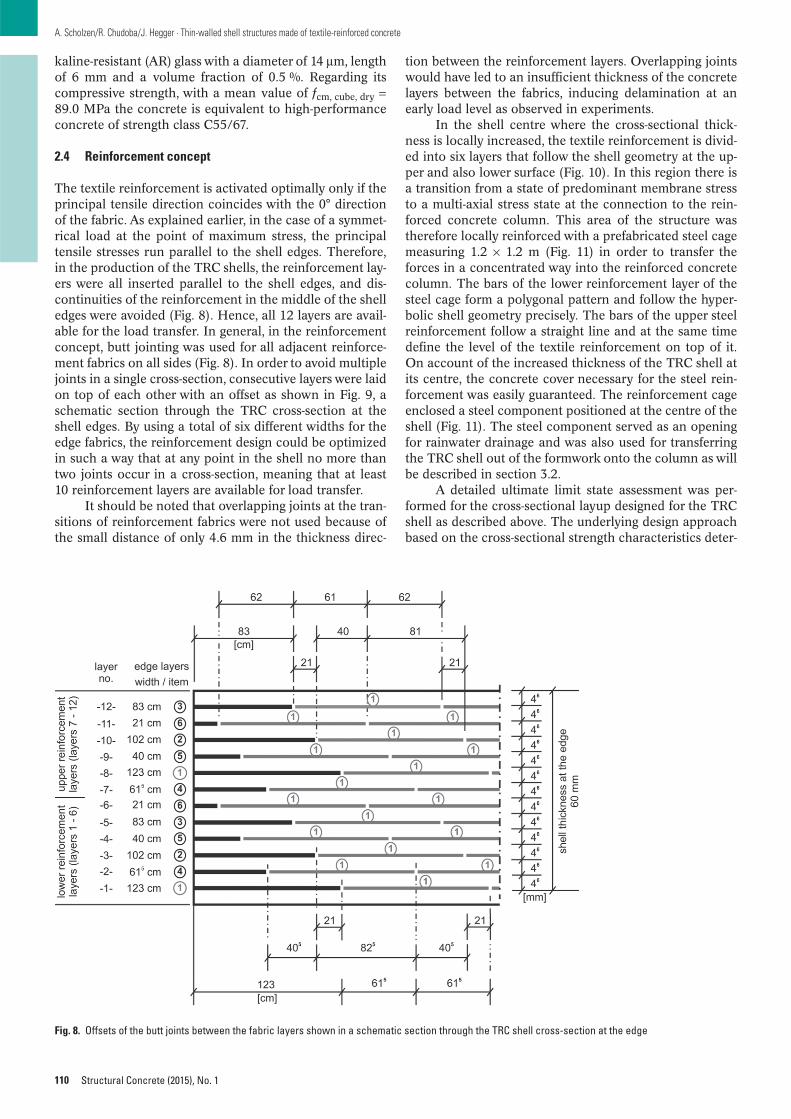
110
A. Scholzen/R. Chudoba/J. Hegger · Thin-walled shell structures made of textile-reinforced concrete
Structural Concrete (2015), No. 1
tion between the reinforcement layers. Overlapping jointswould have led to an insufficient thickness of the concretelayers between the fabrics, inducing delamination at anearly load level as observed in experiments.
In the shell centre where the cross-sectional thick-ness is locally increased, the textile reinforcement is divid-ed into six layers that follow the shell geometry at the up-per and also lower surface (Fig. 10). In this region there isa transition from a state of predominant membrane stressto a multi-axial stress state at the connection to the rein-forced concrete column. This area of the structure wastherefore locally reinforced with a prefabricated steel cagemeasuring 1.2 × 1.2 m (Fig. 11) in order to transfer theforces in a concentrated way into the reinforced concretecolumn. The bars of the lower reinforcement layer of thesteel cage form a polygonal pattern and follow the hyper-bolic shell geometry precisely. The bars of the upper steelreinforcement follow a straight line and at the same timedefine the level of the textile reinforcement on top of it.On account of the increased thickness of the TRC shell atits centre, the concrete cover necessary for the steel rein-forcement was easily guaranteed. The reinforcement cageenclosed a steel component positioned at the centre of theshell (Fig. 11). The steel component served as an openingfor rainwater drainage and was also used for transferringthe TRC shell out of the formwork onto the column as willbe described in section 3.2.
A detailed ultimate limit state assessment was per-formed for the cross-sectional layup designed for the TRCshell as described above. The underlying design approachbased on the cross-sectional strength characteristics deter-
kaline-resistant (AR) glass with a diameter of 14 μm, lengthof 6 mm and a volume fraction of 0.5 %. Regarding itscompressive strength, with a mean value of fcm, cube, dry =89.0 MPa the concrete is equivalent to high-performanceconcrete of strength class C55/67.
2.4 Reinforcement concept
The textile reinforcement is activated optimally only if theprincipal tensile direction coincides with the 0° directionof the fabric. As explained earlier, in the case of a symmet-rical load at the point of maximum stress, the principaltensile stresses run parallel to the shell edges. Therefore,in the production of the TRC shells, the reinforcement lay-ers were all inserted parallel to the shell edges, and dis-continuities of the reinforcement in the middle of the shelledges were avoided (Fig. 8). Hence, all 12 layers are avail-able for the load transfer. In general, in the reinforcementconcept, butt jointing was used for all adjacent reinforce-ment fabrics on all sides (Fig. 8). In order to avoid multiplejoints in a single cross-section, consecutive layers were laidon top of each other with an offset as shown in Fig. 9, aschematic section through the TRC cross-section at theshell edges. By using a total of six different widths for theedge fabrics, the reinforcement design could be optimizedin such a way that at any point in the shell no more thantwo joints occur in a cross-section, meaning that at least10 reinforcement layers are available for load transfer.
It should be noted that overlapping joints at the tran-sitions of reinforcement fabrics were not used because ofthe small distance of only 4.6 mm in the thickness direc-
Fig. 8. Offsets of the butt joints between the fabric layers shown in a schematic section through the TRC shell cross-section at the edge
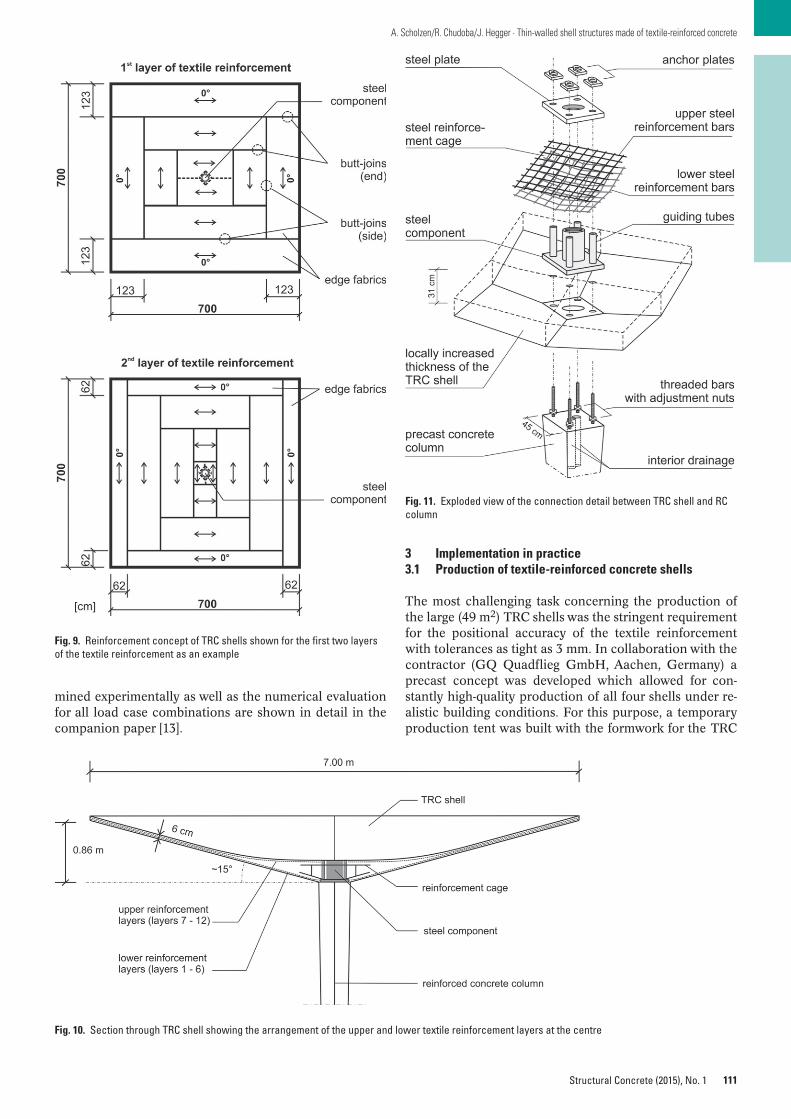
111
A. Scholzen/R. Chudoba/J. Hegger · Thin-walled shell structures made of textile-reinforced concrete
Structural Concrete (2015), No. 1
mined experimentally as well as the numerical evaluationfor all load case combinations are shown in detail in thecompanion paper [13].
3 Implementation in practice3.1 Production of textile-reinforced concrete shells
The most challenging task concerning the production ofthe large (49 m2) TRC shells was the stringent requirementfor the positional accuracy of the textile reinforcementwith tolerances as tight as 3 mm. In collaboration with thecontractor (GQ Quadflieg GmbH, Aachen, Germany) aprecast concept was developed which allowed for con-stantly high-quality production of all four shells under re-alistic building conditions. For this purpose, a temporaryproduction tent was built with the formwork for the TRC
Fig. 9. Reinforcement concept of TRC shells shown for the first two layersof the textile reinforcement as an example
Fig. 10. Section through TRC shell showing the arrangement of the upper and lower textile reinforcement layers at the centre
Fig. 11. Exploded view of the connection detail between TRC shell and RCcolumn
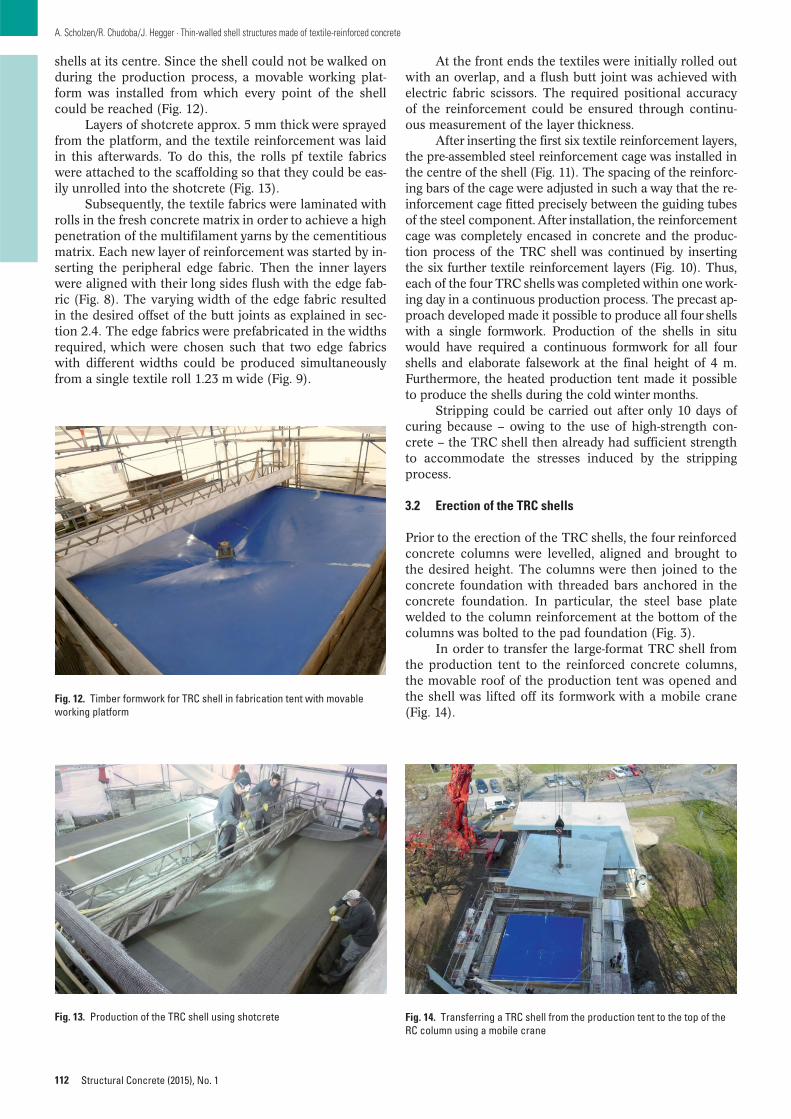
112
A. Scholzen/R. Chudoba/J. Hegger · Thin-walled shell structures made of textile-reinforced concrete
Structural Concrete (2015), No. 1
shells at its centre. Since the shell could not be walked onduring the production process, a movable working plat-form was installed from which every point of the shellcould be reached (Fig. 12).
Layers of shotcrete approx. 5 mm thick were sprayedfrom the platform, and the textile reinforcement was laidin this afterwards. To do this, the rolls pf textile fabricswere attached to the scaffolding so that they could be eas-ily unrolled into the shotcrete (Fig. 13).
Subsequently, the textile fabrics were laminated withrolls in the fresh concrete matrix in order to achieve a highpenetration of the multifilament yarns by the cementitiousmatrix. Each new layer of reinforcement was started by in-serting the peripheral edge fabric. Then the inner layerswere aligned with their long sides flush with the edge fab-ric (Fig. 8). The varying width of the edge fabric resultedin the desired offset of the butt joints as explained in sec-tion 2.4. The edge fabrics were prefabricated in the widthsrequired, which were chosen such that two edge fabricswith different widths could be produced simultaneouslyfrom a single textile roll 1.23 m wide (Fig. 9).
At the front ends the textiles were initially rolled outwith an overlap, and a flush butt joint was achieved withelectric fabric scissors. The required positional accuracyof the reinforcement could be ensured through continu-ous measurement of the layer thickness.
After inserting the first six textile reinforcement layers,the pre-assembled steel reinforcement cage was installed inthe centre of the shell (Fig. 11). The spacing of the reinforc-ing bars of the cage were adjusted in such a way that the re-inforcement cage fitted precisely between the guiding tubesof the steel component. After installation, the reinforcementcage was completely encased in concrete and the produc-tion process of the TRC shell was continued by insertingthe six further textile reinforcement layers (Fig. 10). Thus,each of the four TRC shells was completed within one work-ing day in a continuous production process. The precast ap-proach developed made it possible to produce all four shellswith a single formwork. Production of the shells in situwould have required a continuous formwork for all fourshells and elaborate falsework at the final height of 4 m.Furthermore, the heated production tent made it possibleto produce the shells during the cold winter months.
Stripping could be carried out after only 10 days ofcuring because – owing to the use of high-strength con-crete – the TRC shell then already had sufficient strengthto accommodate the stresses induced by the strippingprocess.
3.2 Erection of the TRC shells
Prior to the erection of the TRC shells, the four reinforcedconcrete columns were levelled, aligned and brought tothe desired height. The columns were then joined to theconcrete foundation with threaded bars anchored in theconcrete foundation. In particular, the steel base platewelded to the column reinforcement at the bottom of thecolumns was bolted to the pad foundation (Fig. 3).
In order to transfer the large-format TRC shell fromthe production tent to the reinforced concrete columns,the movable roof of the production tent was opened andthe shell was lifted off its formwork with a mobile crane(Fig. 14).
Fig. 13. Production of the TRC shell using shotcrete Fig. 14. Transferring a TRC shell from the production tent to the top of theRC column using a mobile crane
Fig. 12. Timber formwork for TRC shell in fabrication tent with movableworking platform
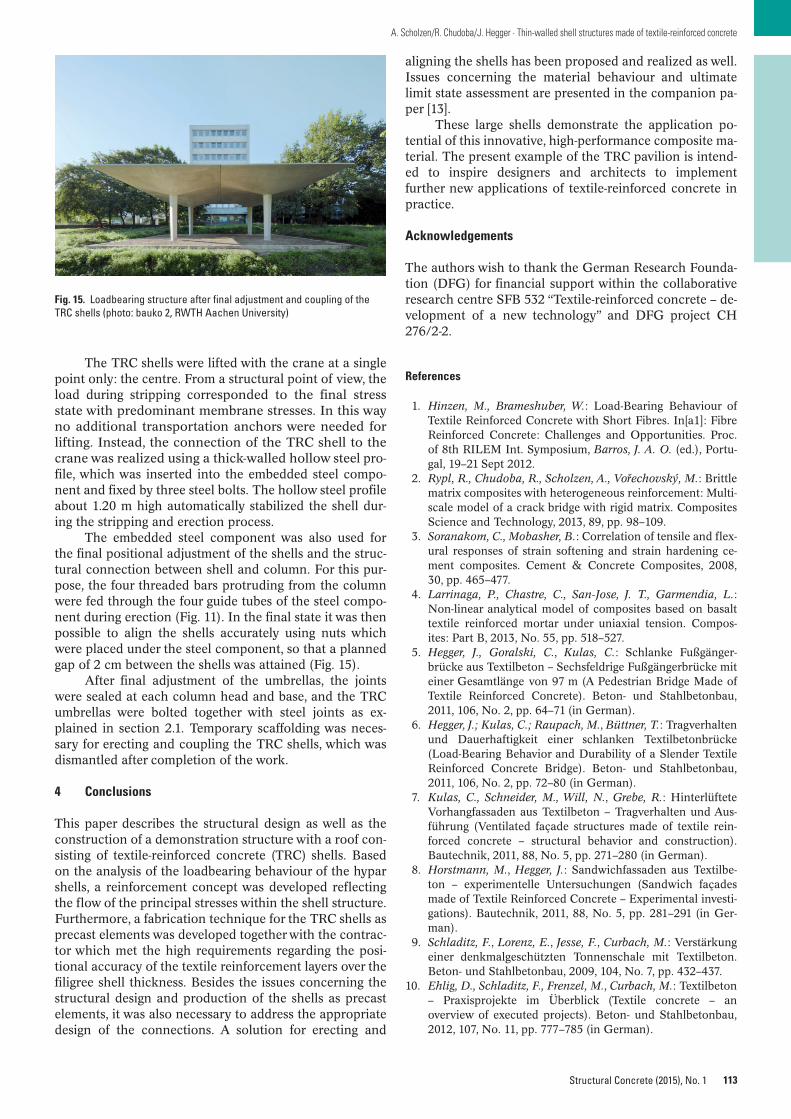
113
A. Scholzen/R. Chudoba/J. Hegger · Thin-walled shell structures made of textile-reinforced concrete
Structural Concrete (2015), No. 1
The TRC shells were lifted with the crane at a singlepoint only: the centre. From a structural point of view, theload during stripping corresponded to the final stressstate with predominant membrane stresses. In this wayno additional transportation anchors were needed forlifting. Instead, the connection of the TRC shell to thecrane was realized using a thick-walled hollow steel pro-file, which was inserted into the embedded steel compo-nent and fixed by three steel bolts. The hollow steel profileabout 1.20 m high automatically stabilized the shell dur-ing the stripping and erection process.
The embedded steel component was also used forthe final positional adjustment of the shells and the struc-tural connection between shell and column. For this pur-pose, the four threaded bars protruding from the columnwere fed through the four guide tubes of the steel compo-nent during erection (Fig. 11). In the final state it was thenpossible to align the shells accurately using nuts whichwere placed under the steel component, so that a plannedgap of 2 cm between the shells was attained (Fig. 15).
After final adjustment of the umbrellas, the jointswere sealed at each column head and base, and the TRCumbrellas were bolted together with steel joints as ex-plained in section 2.1. Temporary scaffolding was neces-sary for erecting and coupling the TRC shells, which wasdismantled after completion of the work.
4 Conclusions
This paper describes the structural design as well as theconstruction of a demonstration structure with a roof con-sisting of textile-reinforced concrete (TRC) shells. Basedon the analysis of the loadbearing behaviour of the hyparshells, a reinforcement concept was developed reflectingthe flow of the principal stresses within the shell structure.Furthermore, a fabrication technique for the TRC shells asprecast elements was developed together with the contrac-tor which met the high requirements regarding the posi-tional accuracy of the textile reinforcement layers over thefiligree shell thickness. Besides the issues concerning thestructural design and production of the shells as precastelements, it was also necessary to address the appropriatedesign of the connections. A solution for erecting and
aligning the shells has been proposed and realized as well.Issues concerning the material behaviour and ultimatelimit state assessment are presented in the companion pa-per [13].
These large shells demonstrate the application po-tential of this innovative, high-performance composite ma-terial. The present example of the TRC pavilion is intend-ed to inspire designers and architects to implementfurther new applications of textile-reinforced concrete inpractice.
Acknowledgements
The authors wish to thank the German Research Founda-tion (DFG) for financial support within the collaborativeresearch centre SFB 532 “Textile-reinforced concrete – de-velopment of a new technology” and DFG project CH276/2-2.
References
1. Hinzen, M., Brameshuber, W.: Load-Bearing Behaviour ofTextile Reinforced Concrete with Short Fibres. In[a1]: FibreReinforced Concrete: Challenges and Opportunities. Proc.of 8th RILEM Int. Symposium, Barros, J. A. O. (ed.), Portu-gal, 19–21 Sept 2012.
2. Rypl, R., Chudoba, R., Scholzen, A., Vorechovsky, M.: Brittlematrix composites with heterogeneous reinforcement: Multi-scale model of a crack bridge with rigid matrix. CompositesScience and Technology, 2013, 89, pp. 98–109.
3. Soranakom, C., Mobasher, B.: Correlation of tensile and flex-ural responses of strain softening and strain hardening ce-ment composites. Cement & Concrete Composites, 2008,30, pp. 465–477.
4. Larrinaga, P., Chastre, C., San-Jose, J. T., Garmendia, L.:Non-linear analytical model of composites based on basalttextile reinforced mortar under uniaxial tension. Compos-ites: Part B, 2013, No. 55, pp. 518–527.
5. Hegger, J., Goralski, C., Kulas, C.: Schlanke Fußgänger-brücke aus Textilbeton – Sechsfeldrige Fußgängerbrücke miteiner Gesamtlänge von 97 m (A Pedestrian Bridge Made ofTextile Reinforced Concrete). Beton- und Stahlbetonbau,2011, 106, No. 2, pp. 64–71 (in German).
6. Hegger, J.; Kulas, C.; Raupach, M., Büttner, T.: Tragverhaltenund Dauerhaftigkeit einer schlanken Textilbetonbrücke(Load-Bearing Behavior and Durability of a Slender TextileReinforced Concrete Bridge). Beton- und Stahlbetonbau,2011, 106, No. 2, pp. 72–80 (in German).
7. Kulas, C., Schneider, M., Will, N., Grebe, R.: HinterlüfteteVorhangfassaden aus Textilbeton – Tragverhalten und Aus-führung (Ventilated façade structures made of textile rein-forced concrete – structural behavior and construction).Bautechnik, 2011, 88, No. 5, pp. 271–280 (in German).
8. Horstmann, M., Hegger, J.: Sandwichfassaden aus Textilbe-ton – experimentelle Untersuchungen (Sandwich façadesmade of Textile Reinforced Concrete – Experimental investi-gations). Bautechnik, 2011, 88, No. 5, pp. 281–291 (in Ger-man).
9. Schladitz, F., Lorenz, E., Jesse, F., Curbach, M.: Verstärkungeiner denkmalgeschützten Tonnenschale mit Textilbeton.Beton- und Stahlbetonbau, 2009, 104, No. 7, pp. 432–437.
10. Ehlig, D., Schladitz, F., Frenzel, M., Curbach, M.: Textilbeton– Praxisprojekte im Überblick (Textile concrete – anoverview of executed projects). Beton- und Stahlbetonbau,2012, 107, No. 11, pp. 777–785 (in German).
Fig. 15. Loadbearing structure after final adjustment and coupling of theTRC shells (photo: bauko 2, RWTH Aachen University)
114
A. Scholzen/R. Chudoba/J. Hegger · Thin-walled shell structures made of textile-reinforced concrete
Structural Concrete (2015), No. 1
11. Cassinello, P., Schlaich, M., Torroja, J. A.: Félix Candela. Inmemoriam (1910–1997). From thin concrete shells to the21st century lightweight structures. Informes de la Construc-ctión, 2010, 62, No. 519, pp. 5–26.
12. Scholzen, A., Chudoba, R., Hegger, J.: Dünnwandiges Scha-lentragwerk aus Textilbeton: Entwurf, Bemessung undbaupraktische Umsetzung. Beton- und Stahlbetonbau, 2012,107, No. 11, pp. 767–776.
13. Scholzen, A., Chudoba, R., Hegger, J. (2015): Thin-walledshell structures made of textile-reinforced concrete – Part II:Experimental characterization, ultimate limit state assess-ment and numerical simulation. Structural Concrete, 16:115–124. doi: 10.1002/suco.201400046.
14. Schätzke, C., Schneider, H. N., Joachim, T., Feldmann, M.,Pak, D., Geßler, A.; Hegger, J., Scholzen, A.: Doppeltgekrümmte Schalen und Gitterschalen aus Textilbeton. In:Proc. of 6th Colloquium on Textile Reinforced Structures,Curbach, M., Ortlepp, R. (eds.), Berlin, 2011, pp. 315–328.
15. Schnabel, A., Grieß, T.: Production of non-crimp fabrics forcomposites. In: Non-crimp fabric composites: manufactur-ing, properties and applications, Lomov, S. V. (ed.), Wood-head Publishing Series in Composites Science and Engineer-ing, No. 35, Woodhead, Oxford, 2011.
Prof. Dr.-Ing. Josef HeggerRWTH Aachen UniversityInstitute of Structural Concrete (IMB)Mies-van-der-Rohe-Str. 152074 [email protected]
Dr.-Ing. Rostislav ChudobaRWTH Aachen UniversityInstitute of Structural Concrete (IMB)Mies-van-der-Rohe-Str. 152074 [email protected]
Dipl.-Ing. Alexander ScholzenRWTH Aachen UniversityInstitute of Structural Concrete (IMB)Mies-van-der-Rohe-Str. 152074 [email protected]
115© 2015 Ernst & Sohn Verlag für Architektur und technische Wissenschaften GmbH & Co. KG, Berlin · Structural Concrete (2015), No. 1
The present paper describes a design approach for textile-rein-forced concrete (TRC) shells which reflects the interaction be-tween normal forces and bending moments based on the cross-sectional strength characteristics of the material determinedexperimentally. The influence of oblique loading on the compositestrength of TRC elements with flexible reinforcement is includedin a normalized interaction diagram for combined loading. As anexample, the design approach is applied to the ultimate limit stateassessment of a TRC shell in double curvature. Furthermore, thegeneral applicability of the design approach is discussed in thelight of the non-linear loadbearing behaviour of TRC. Due to itsstrain-hardening tensile response, stress redistributions withinthe shell result in loadbearing reserves. Details of the structuraldesign and production solutions developed and applied duringthe realization of the TRC shell structure are described in thecompanion paper (Part I).
Keywords: cementitious composites, strain-hardening composites, textile-reinforced concrete, hypar shells, design of concrete shells, numericallybased assessment, anisotropic damage model
1 Introduction
Assessment rules are needed for the design of textile-rein-forced concrete (TRC) shell structures in order to intro-duce this innovative composite material successfully intoengineering practice. Engineering models that reflect thetensile, bending and shear strength of TRC elements havealready been developed in recent years in analogy to thosefor conventional steel reinforced concrete structures.Cross-sectional idealizations for design have been provid-ed for loadbearing TRC beam elements [1, 2, 3], steel rein-forced concrete structures retrofitted with TRC [4] andTRC sandwich panels [5].
Whereas steel-reinforced concrete cross-sections canbe designed and dimensioned solely based on the materiallaws for steel and concrete, the direct design of TRC cross-sections using the component characteristics is not yetpossible. The reason or this is the existence of a wide vari-
ety of textile fabrics [6] differing in material, type of weaveand coating, which affect the stress-strain response of thecomposite quite significantly. Therefore, the cross-section-al strength characteristics of TRC have to be determinedexperimentally for each material combination considered.For this purpose, several types of test setup have been de-veloped recently [3, 7, 8, 9].
The existing engineering models for TRC [1, 2, 3]have been derived mostly for relevant uniaxial stressstates, e.g. for TRC beam or truss elements. However, asdocumented in [10], by using simple linear finite elementanalyses, it is possible to exploit the high potential of thiscomposite material, especially in thin shell structures.However, engineering models and design tools for TRCshell structures are still lacking. In this paper, we proposea systematic approach to the ultimate limit state assess-ment of spatial TRC structures with complex loading sce-narios. Compared with the engineering models men-tioned, two additional important effects are included inthe design approach: i) simultaneous action of normalforces and bending moments on a TRC shell cross-sectionand ii) a strength reduction due to the direction of loadingnot being aligned with the orientation of the textile fab-rics.
The paper starts with a review of the test setups usedfor deriving the strength characteristics of the TRC cross-section (section 2.1). This is followed by a brief discussionof the test data interpretation (section 2.2). A simplifiedn-m interaction diagram for combined loading is intro-duced in section 3.1 and extended with the effect ofoblique loading and butt joints between the fabrics in sections 3.2 and 3.3 respectively. The general assessmentcriterion is then given in section 3.4. The proposed automated assessment procedure accounting for theanisotropy of the TRC shell exposed to general loadingconditions is described in section 3.5. An example of theapplication of the assessment procedure is given in sec-tion 4 for a roof structure in double curvature, includingthe evaluation of the cross-sectional strength characteris-tics in section 4.1 and the evaluation of the utilization ra-tio in section 4.2. The non-linear loadbearing behaviourof TRC and the structural reserves available due to stressredistributions within the shell are studied numerically insection 4.3. The present paper extends and generalizesthe concepts originally published in the German lan-guage [11].
Technical Paper
Thin-walled shell structures made of textile-reinforced concretePart II: Experimental characterization, ultimate limit state assessment and numerical simulation
Alexander Scholzen*Rostislav ChudobaJosef Hegger
DOI: 10.1002/suco.201400046
* Corresponding author: [email protected]
Submitted for review: 6 June 2014Accepted for publication: 17 July 2014
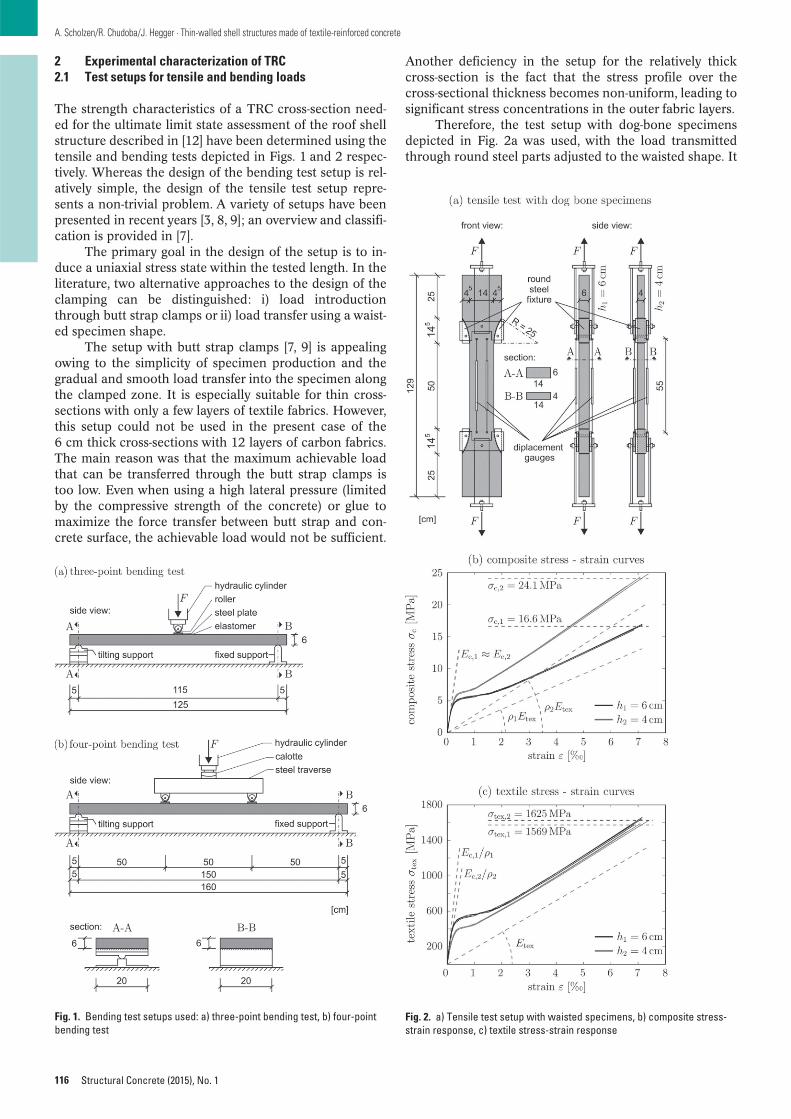
2 Experimental characterization of TRC2.1 Test setups for tensile and bending loads
The strength characteristics of a TRC cross-section need-ed for the ultimate limit state assessment of the roof shellstructure described in [12] have been determined using thetensile and bending tests depicted in Figs. 1 and 2 respec-tively. Whereas the design of the bending test setup is rel-atively simple, the design of the tensile test setup repre-sents a non-trivial problem. A variety of setups have beenpresented in recent years [3, 8, 9]; an overview and classifi-cation is provided in [7].
The primary goal in the design of the setup is to in-duce a uniaxial stress state within the tested length. In theliterature, two alternative approaches to the design of theclamping can be distinguished: i) load introductionthrough butt strap clamps or ii) load transfer using a waist-ed specimen shape.
The setup with butt strap clamps [7, 9] is appealingowing to the simplicity of specimen production and thegradual and smooth load transfer into the specimen alongthe clamped zone. It is especially suitable for thin cross-sections with only a few layers of textile fabrics. However,this setup could not be used in the present case of the6 cm thick cross-sections with 12 layers of carbon fabrics.The main reason was that the maximum achievable loadthat can be transferred through the butt strap clamps istoo low. Even when using a high lateral pressure (limitedby the compressive strength of the concrete) or glue tomaximize the force transfer between butt strap and con-crete surface, the achievable load would not be sufficient.
116
A. Scholzen/R. Chudoba/J. Hegger · Thin-walled shell structures made of textile-reinforced concrete
Structural Concrete (2015), No. 1
Another deficiency in the setup for the relatively thickcross-section is the fact that the stress profile over thecross-sectional thickness becomes non-uniform, leading tosignificant stress concentrations in the outer fabric layers.
Therefore, the test setup with dog-bone specimensdepicted in Fig. 2a was used, with the load transmittedthrough round steel parts adjusted to the waisted shape. It
Fig. 1. Bending test setups used: a) three-point bending test, b) four-pointbending test
Fig. 2. a) Tensile test setup with waisted specimens, b) composite stress-strain response, c) textile stress-strain response
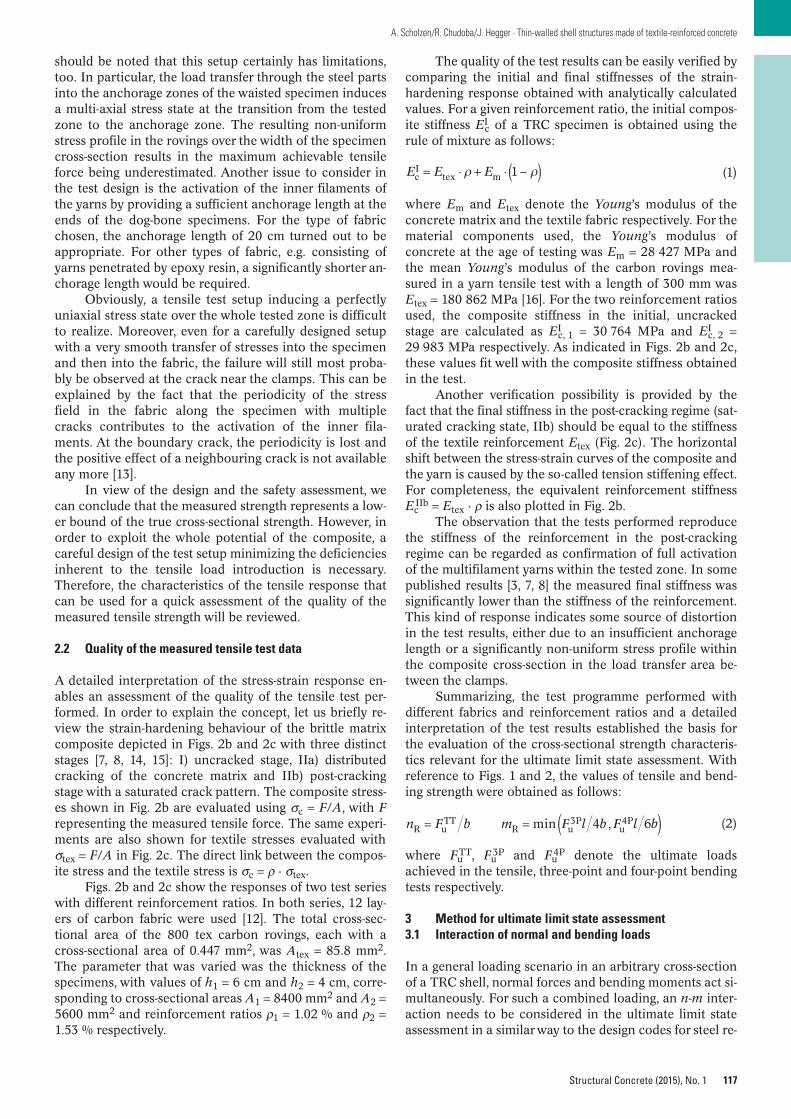
117
A. Scholzen/R. Chudoba/J. Hegger · Thin-walled shell structures made of textile-reinforced concrete
Structural Concrete (2015), No. 1
should be noted that this setup certainly has limitations,too. In particular, the load transfer through the steel partsinto the anchorage zones of the waisted specimen inducesa multi-axial stress state at the transition from the testedzone to the anchorage zone. The resulting non-uniformstress profile in the rovings over the width of the specimencross-section results in the maximum achievable tensileforce being underestimated. Another issue to consider inthe test design is the activation of the inner filaments ofthe yarns by providing a sufficient anchorage length at theends of the dog-bone specimens. For the type of fabricchosen, the anchorage length of 20 cm turned out to beappropriate. For other types of fabric, e.g. consisting ofyarns penetrated by epoxy resin, a significantly shorter an-chorage length would be required.
Obviously, a tensile test setup inducing a perfectlyuniaxial stress state over the whole tested zone is difficultto realize. Moreover, even for a carefully designed setupwith a very smooth transfer of stresses into the specimenand then into the fabric, the failure will still most proba-bly be observed at the crack near the clamps. This can beexplained by the fact that the periodicity of the stressfield in the fabric along the specimen with multiplecracks contributes to the activation of the inner fila-ments. At the boundary crack, the periodicity is lost andthe positive effect of a neighbouring crack is not availableany more [13].
In view of the design and the safety assessment, wecan conclude that the measured strength represents a low-er bound of the true cross-sectional strength. However, inorder to exploit the whole potential of the composite, acareful design of the test setup minimizing the deficienciesinherent to the tensile load introduction is necessary.Therefore, the characteristics of the tensile response thatcan be used for a quick assessment of the quality of themeasured tensile strength will be reviewed.
2.2 Quality of the measured tensile test data
A detailed interpretation of the stress-strain response en-ables an assessment of the quality of the tensile test per-formed. In order to explain the concept, let us briefly re-view the strain-hardening behaviour of the brittle matrixcomposite depicted in Figs. 2b and 2c with three distinctstages [7, 8, 14, 15]: I) uncracked stage, IIa) distributedcracking of the concrete matrix and IIb) post-crackingstage with a saturated crack pattern. The composite stress-es shown in Fig. 2b are evaluated using σc = F/A, with Frepresenting the measured tensile force. The same experi-ments are also shown for textile stresses evaluated withσtex = F/A in Fig. 2c. The direct link between the compos-ite stress and the textile stress is σc = ρ · σtex.
Figs. 2b and 2c show the responses of two test serieswith different reinforcement ratios. In both series, 12 lay-ers of carbon fabric were used [12]. The total cross-sec-tional area of the 800 tex carbon rovings, each with across-sectional area of 0.447 mm2, was Atex = 85.8 mm2.The parameter that was varied was the thickness of thespecimens, with values of h1 = 6 cm and h2 = 4 cm, corre-sponding to cross-sectional areas A1 = 8400 mm2 and A2 =5600 mm2 and reinforcement ratios ρ1 = 1.02 % and ρ2 =1.53 % respectively.
The quality of the test results can be easily verified bycomparing the initial and final stiffnesses of the strain-hardening response obtained with analytically calculatedvalues. For a given reinforcement ratio, the initial compos-ite stiffness EI
c of a TRC specimen is obtained using therule of mixture as follows:
(1)
where Em and Etex denote the Young’s modulus of theconcrete matrix and the textile fabric respectively. For thematerial components used, the Young’s modulus of concrete at the age of testing was Em = 28 427 MPa andthe mean Young’s modulus of the carbon rovings mea-sured in a yarn tensile test with a length of 300 mm wasEtex = 180 862 MPa [16]. For the two reinforcement ratiosused, the composite stiffness in the initial, uncrackedstage are calculated as EI
c, 1 = 30 764 MPa and EIc, 2 =
29 983 MPa respectively. As indicated in Figs. 2b and 2c,these values fit well with the composite stiffness obtainedin the test.
Another verification possibility is provided by thefact that the final stiffness in the post-cracking regime (sat-urated cracking state, IIb) should be equal to the stiffnessof the textile reinforcement Etex (Fig. 2c). The horizontalshift between the stress-strain curves of the composite andthe yarn is caused by the so-called tension stiffening effect.For completeness, the equivalent reinforcement stiffnessEc
IIb = Etex · ρ is also plotted in Fig. 2b.The observation that the tests performed reproduce
the stiffness of the reinforcement in the post-crackingregime can be regarded as confirmation of full activationof the multifilament yarns within the tested zone. In somepublished results [3, 7, 8] the measured final stiffness wassignificantly lower than the stiffness of the reinforcement.This kind of response indicates some source of distortionin the test results, either due to an insufficient anchoragelength or a significantly non-uniform stress profile withinthe composite cross-section in the load transfer area be-tween the clamps.
Summarizing, the test programme performed withdifferent fabrics and reinforcement ratios and a detailedinterpretation of the test results established the basis forthe evaluation of the cross-sectional strength characteris-tics relevant for the ultimate limit state assessment. Withreference to Figs. 1 and 2, the values of tensile and bend-ing strength were obtained as follows:
(2)
where FuTT, Fu
3P and Fu4P denote the ultimate loads
achieved in the tensile, three-point and four-point bendingtests respectively.
3 Method for ultimate limit state assessment3.1 Interaction of normal and bending loads
In a general loading scenario in an arbitrary cross-sectionof a TRC shell, normal forces and bending moments act si-multaneously. For such a combined loading, an n-m inter-action needs to be considered in the ultimate limit stateassessment in a similar way to the design codes for steel re-
1cI
tex mE E E
min 4 , 6R uTT
R u3P
u4Pn F b m F l b F l b

inforced concrete [17]. A simplified n-m interaction dia-gram for TRC can be constructed using the strength char-acteristics obtained experimentally for uniaxial tensionnt,Rd [kN/m], uniaxial compression nc,Rd [kN/m] and purebending mRd [kNm/m], assuming linear interpolation be-tween these values in the n-m interaction diagram (seeFig. 3a). Let us remark here that such a simplified linearn-m interaction diagram must represent a lower bound ofthe real non-linear interaction between normal force andbending moment. A more accurate representation of theinteraction diagram can be obtained by using a numericalmodel of a cross-section employing the equilibrium condi-tions of normal forces and bending moments at the ulti-mate limit state. As a thorough presentation of the numer-ical studies performed and the accompanying validationtests with combined tensile and bending loads would gobeyond the scope of this paper, they will be provided in asubsequent publication. Here, only the two most impor-tant conclusions apparent from Fig. 3a are summarized inorder to justify the simplifying assumption:
i) For combined tension and bending, the linear form ofthe n-m interaction diagram can represent the real be-haviour relatively well.
ii) For combined compression and bending, the linear approximation leads to an underestimation of the ultimate cross-sectional strength and is on the safe side.
Based on the proposed n-m interaction diagram in Fig. 3a,the ultimate limit state assessment can be performed byverifying that the design values of the stress resultants nEd[kN/m] and mEd [kNm/m] lie within the admissible range(shaded area in Fig. 3a) for all load cases. For conve-nience, the linear n-m interaction diagram has been trans-formed into a normalized form using the normalizedstress resultants:
(3)| |
ntdEd
t,Rdncd
Ed
c,Rdmd
Ed
Rd
nn
nn
mm
118
A. Scholzen/R. Chudoba/J. Hegger · Thin-walled shell structures made of textile-reinforced concrete
Structural Concrete (2015), No. 1
As apparent from Fig. 3b, the normalized stress resultantsrepresent the utilization ratio of the cross-section with re-spect to the design values of the strength characteristicsfor tension nt,Rd, compression nc,Rd and bending mRd.
Considering the fact that the values of the strengthcharacteristics are all positive, the normalized stress resul-tants attain their ultimate strength values at η(.) = 1.0. Fora combined loading on a cross-section with normal forceand bending moment, the total utilization ratio ηnmd is defined as follows:
(4)
In analogy to Fig. 3a, it must be verified in the ultimatelimit state assessment of the TRC shell that the design val-ues of the total utilization ratio ηnmd for all elements andall load case combinations lie within the admissible rangeηnmd ≤ 1.0 (shaded area in Fig. 3b).
3.2 Strength reduction for oblique loading
In the design procedure described here we tacitly assumeisotropic material properties with cross-sectional strengthcharacteristics nt,Rd, nc,Rd and mRd independent of theloading direction. However, a TRC shell cross-section withorthotropic reinforcement structure exhibits an anisotrop-ic behaviour due to the misfit between the direction of theprincipal tensile stresses given by angle ϕ1 and the orien-tation of the fabrics δ (Fig. 4). In particular, the deviationangle α is equal to
(5)
where ϕ1 is obtained as follows:
(6)
The deviation of the textile reinforcement leads to an in-creased stress concentration in the outer filaments of the
1
max ,nmd ntd ncd md
arctan with | |21
xy
x 21
Fig. 3. Design approach for TRC shell structures based on a simplified n-m interaction diagram
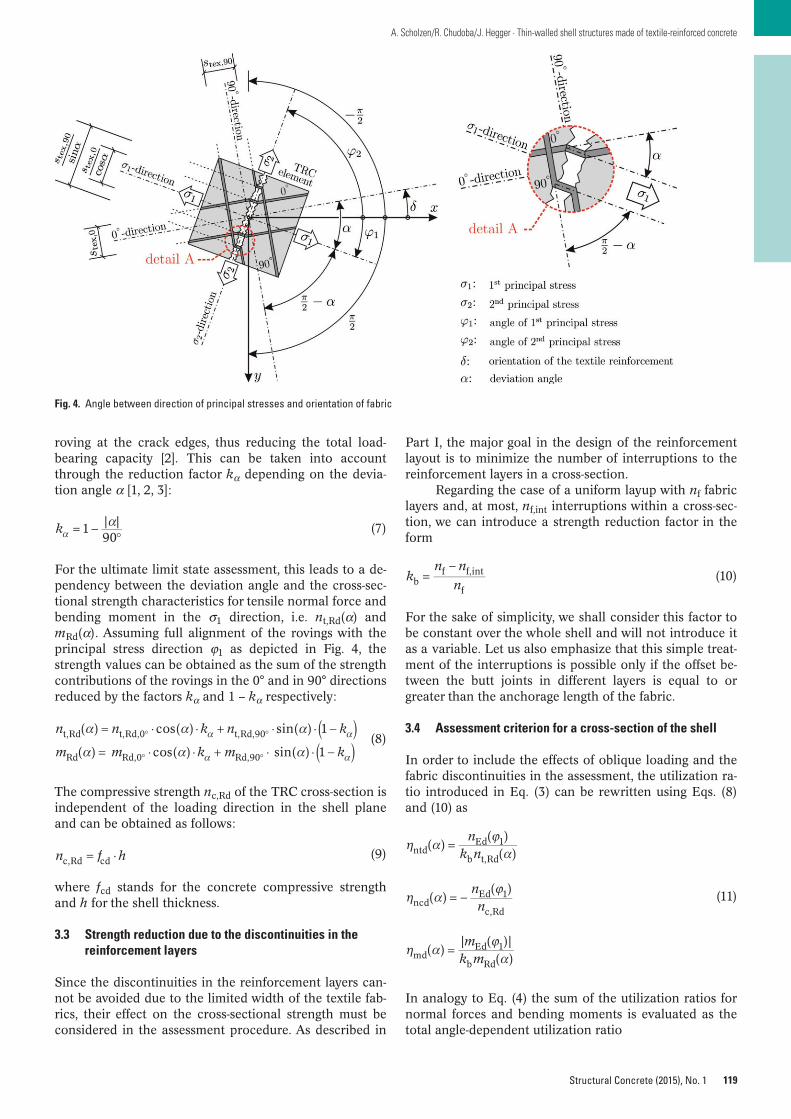
119
A. Scholzen/R. Chudoba/J. Hegger · Thin-walled shell structures made of textile-reinforced concrete
Structural Concrete (2015), No. 1
roving at the crack edges, thus reducing the total load-bearing capacity [2]. This can be taken into accountthrough the reduction factor kα depending on the devia-tion angle α [1, 2, 3]:
(7)
For the ultimate limit state assessment, this leads to a de-pendency between the deviation angle and the cross-sec-tional strength characteristics for tensile normal force andbending moment in the σ1 direction, i.e. nt,Rd(α) andmRd(α). Assuming full alignment of the rovings with theprincipal stress direction ϕ1 as depicted in Fig. 4, thestrength values can be obtained as the sum of the strengthcontributions of the rovings in the 0° and in 90° directionsreduced by the factors kα and 1 – kα respectively:
(8)
The compressive strength nc,Rd of the TRC cross-section isindependent of the loading direction in the shell planeand can be obtained as follows:
(9)
where fcd stands for the concrete compressive strengthand h for the shell thickness.
3.3 Strength reduction due to the discontinuities in thereinforcement layers
Since the discontinuities in the reinforcement layers can-not be avoided due to the limited width of the textile fab-rics, their effect on the cross-sectional strength must beconsidered in the assessment procedure. As described in
1 | |90
k
( ) cos( ) sin( ) 1
( ) cos( ) sin( ) 1
t,Rd t,Rd,0 t,Rd,90
Rd Rd,0 Rd,90
n n k n k
m m k m k
c,Rd cdn f h
Part I, the major goal in the design of the reinforcementlayout is to minimize the number of interruptions to thereinforcement layers in a cross-section.
Regarding the case of a uniform layup with nf fabriclayers and, at most, nf,int interruptions within a cross-sec-tion, we can introduce a strength reduction factor in theform
(10)
For the sake of simplicity, we shall consider this factor tobe constant over the whole shell and will not introduce itas a variable. Let us also emphasize that this simple treat-ment of the interruptions is possible only if the offset be-tween the butt joints in different layers is equal to orgreater than the anchorage length of the fabric.
3.4 Assessment criterion for a cross-section of the shell
In order to include the effects of oblique loading and thefabric discontinuities in the assessment, the utilization ra-tio introduced in Eq. (3) can be rewritten using Eqs. (8)and (10) as
(11)
In analogy to Eq. (4) the sum of the utilization ratios fornormal forces and bending moments is evaluated as thetotal angle-dependent utilization ratio
bf f,int
fk
n n
n
( )( )
( )
( )( )
( )| ( )|
( )
ntdEd 1
b t,Rd
ncdEd 1
c,Rd
mdEd 1
b Rd
nk n
nn
mk m
Fig. 4. Angle between direction of principal stresses and orientation of fabric
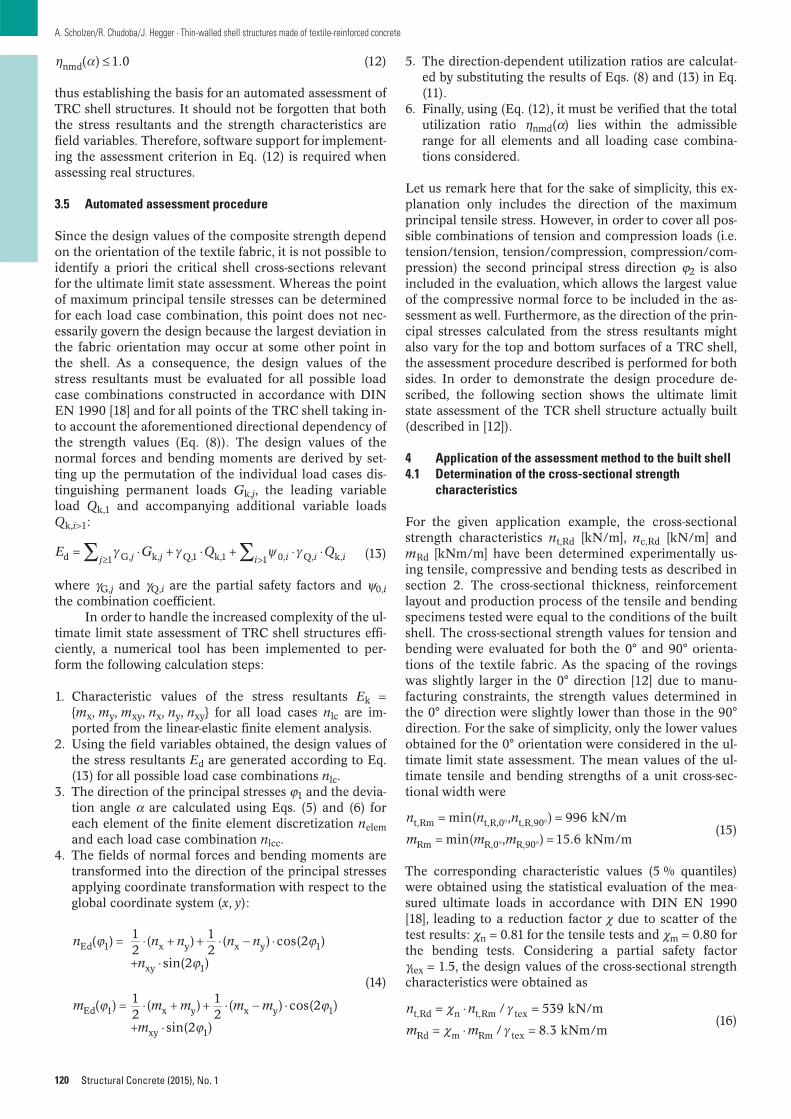
(12)
thus establishing the basis for an automated assessment ofTRC shell structures. It should not be forgotten that boththe stress resultants and the strength characteristics arefield variables. Therefore, software support for implement-ing the assessment criterion in Eq. (12) is required whenassessing real structures.
3.5 Automated assessment procedure
Since the design values of the composite strength dependon the orientation of the textile fabric, it is not possible toidentify a priori the critical shell cross-sections relevantfor the ultimate limit state assessment. Whereas the pointof maximum principal tensile stresses can be determinedfor each load case combination, this point does not nec-essarily govern the design because the largest deviation inthe fabric orientation may occur at some other point inthe shell. As a consequence, the design values of thestress resultants must be evaluated for all possible loadcase combinations constructed in accordance with DINEN 1990 [18] and for all points of the TRC shell taking in-to account the aforementioned directional dependency ofthe strength values (Eq. (8)). The design values of thenormal forces and bending moments are derived by set-ting up the permutation of the individual load cases dis-tinguishing permanent loads Gk,j, the leading variableload Qk,1 and accompanying additional variable loadsQk,i>1:
(13)
where γG,j and γQ,i are the partial safety factors and ψ0,ithe combination coefficient.
In order to handle the increased complexity of the ul-timate limit state assessment of TRC shell structures effi-ciently, a numerical tool has been implemented to per-form the following calculation steps:
1. Characteristic values of the stress resultants Ek ={mx, my, mxy, nx, ny, nxy} for all load cases nlc are im-ported from the linear-elastic finite element analysis.
2. Using the field variables obtained, the design values ofthe stress resultants Ed are generated according to Eq.(13) for all possible load case combinations nlc.
3. The direction of the principal stresses ϕ1 and the devia-tion angle α are calculated using Eqs. (5) and (6) foreach element of the finite element discretization nelemand each load case combination nlcc.
4. The fields of normal forces and bending moments aretransformed into the direction of the principal stressesapplying coordinate transformation with respect to theglobal coordinate system (x, y):
(14)
( ) 1.0nmd
d G, k,1 Q,1 k,1 0, Q, k,1E G Q Qj jj i i ii
( ) 12
( ) 12
( ) cos(2 )
sin(2 )
( ) 12
( ) 12
( ) cos(2 )
sin(2 )
Ed 1 x y x y 1
xy 1
Ed 1 x y x y 1
xy 1
n n n n n
n
m m m m m
m
120
A. Scholzen/R. Chudoba/J. Hegger · Thin-walled shell structures made of textile-reinforced concrete
Structural Concrete (2015), No. 1
5. The direction-dependent utilization ratios are calculat-ed by substituting the results of Eqs. (8) and (13) in Eq.(11).
6. Finally, using (Eq. (12), it must be verified that the totalutilization ratio ηnmd(α) lies within the admissiblerange for all elements and all loading case combina-tions considered.
Let us remark here that for the sake of simplicity, this ex-planation only includes the direction of the maximumprincipal tensile stress. However, in order to cover all pos-sible combinations of tension and compression loads (i.e.tension/tension, tension/compression, compression/com-pression) the second principal stress direction ϕ2 is alsoincluded in the evaluation, which allows the largest valueof the compressive normal force to be included in the as-sessment as well. Furthermore, as the direction of the prin-cipal stresses calculated from the stress resultants mightalso vary for the top and bottom surfaces of a TRC shell,the assessment procedure described is performed for bothsides. In order to demonstrate the design procedure de-scribed, the following section shows the ultimate limitstate assessment of the TCR shell structure actually built(described in [12]).
4 Application of the assessment method to the built shell4.1 Determination of the cross-sectional strength
characteristics
For the given application example, the cross-sectionalstrength characteristics nt,Rd [kN/m], nc,Rd [kN/m] andmRd [kNm/m] have been determined experimentally us-ing tensile, compressive and bending tests as described insection 2. The cross-sectional thickness, reinforcementlayout and production process of the tensile and bendingspecimens tested were equal to the conditions of the builtshell. The cross-sectional strength values for tension andbending were evaluated for both the 0° and 90° orienta-tions of the textile fabric. As the spacing of the rovingswas slightly larger in the 0° direction [12] due to manu-facturing constraints, the strength values determined inthe 0° direction were slightly lower than those in the 90°direction. For the sake of simplicity, only the lower valuesobtained for the 0° orientation were considered in the ul-timate limit state assessment. The mean values of the ul-timate tensile and bending strengths of a unit cross-sec-tional width were
(15)
The corresponding characteristic values (5 % quantiles)were obtained using the statistical evaluation of the mea-sured ultimate loads in accordance with DIN EN 1990[18], leading to a reduction factor χ due to scatter of thetest results: χn = 0.81 for the tensile tests and χm = 0.80 forthe bending tests. Considering a partial safety factorγtex = 1.5, the design values of the cross-sectional strengthcharacteristics were obtained as
(16)
min( , ) 996 kN/m
min( , ) 15.6 kNm/mt,Rm t,R,0 t,R,90
Rm R,0 R,90
n n n
m m m
/ 539 kN/m
/ 8.3 kNm/mt,Rd n t,Rm tex
Rd m Rm tex
n n
m m
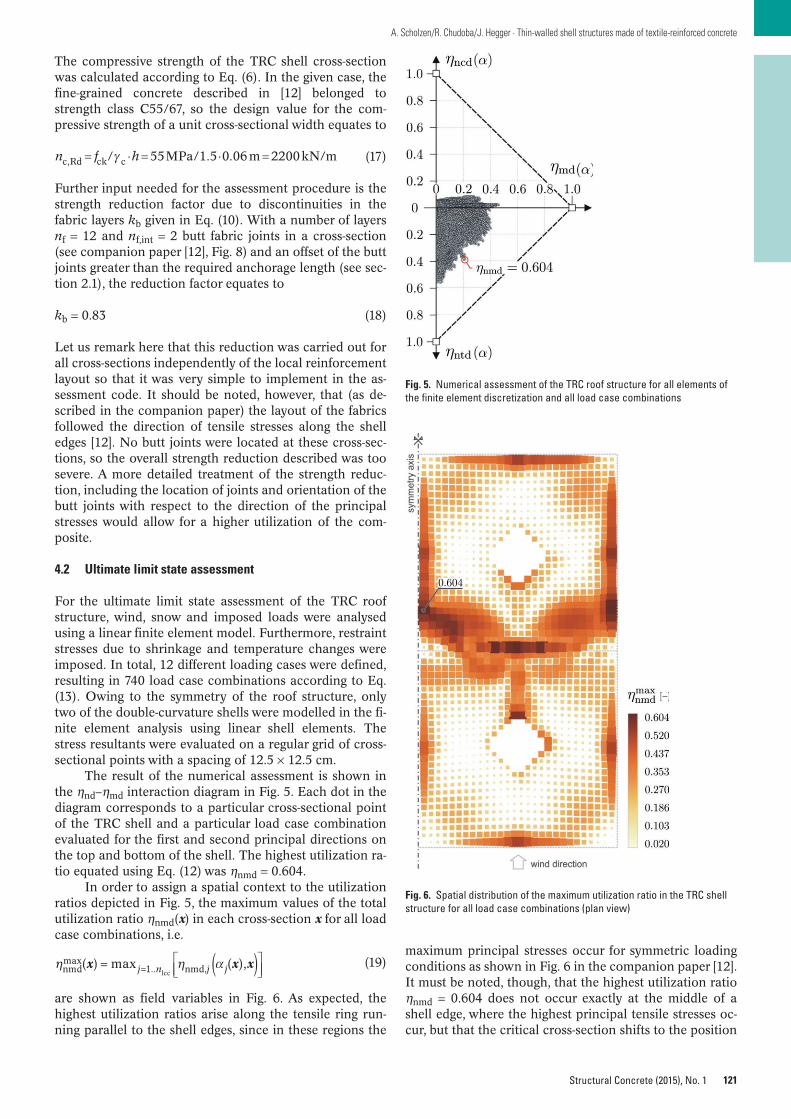
121
A. Scholzen/R. Chudoba/J. Hegger · Thin-walled shell structures made of textile-reinforced concrete
Structural Concrete (2015), No. 1
The compressive strength of the TRC shell cross-sectionwas calculated according to Eq. (6). In the given case, thefine-grained concrete described in [12] belonged tostrength class C55/67, so the design value for the com-pressive strength of a unit cross-sectional width equates to
(17)
Further input needed for the assessment procedure is thestrength reduction factor due to discontinuities in the fabric layers kb given in Eq. (10). With a number of layersnf = 12 and nf,int = 2 butt fabric joints in a cross-section(see companion paper [12], Fig. 8) and an offset of the buttjoints greater than the required anchorage length (see sec-tion 2.1), the reduction factor equates to
kb = 0.83 (18)
Let us remark here that this reduction was carried out forall cross-sections independently of the local reinforcementlayout so that it was very simple to implement in the as-sessment code. It should be noted, however, that (as de-scribed in the companion paper) the layout of the fabricsfollowed the direction of tensile stresses along the shelledges [12]. No butt joints were located at these cross-sec-tions, so the overall strength reduction described was toosevere. A more detailed treatment of the strength reduc-tion, including the location of joints and orientation of thebutt joints with respect to the direction of the principalstresses would allow for a higher utilization of the com-posite.
4.2 Ultimate limit state assessment
For the ultimate limit state assessment of the TRC roofstructure, wind, snow and imposed loads were analysedusing a linear finite element model. Furthermore, restraintstresses due to shrinkage and temperature changes wereimposed. In total, 12 different loading cases were defined,resulting in 740 load case combinations according to Eq.(13). Owing to the symmetry of the roof structure, onlytwo of the double-curvature shells were modelled in the fi-nite element analysis using linear shell elements. Thestress resultants were evaluated on a regular grid of cross-sectional points with a spacing of 12.5 × 12.5 cm.
The result of the numerical assessment is shown inthe ηnd–ηmd interaction diagram in Fig. 5. Each dot in thediagram corresponds to a particular cross-sectional pointof the TRC shell and a particular load case combinationevaluated for the first and second principal directions onthe top and bottom of the shell. The highest utilization ra-tio equated using Eq. (12) was ηnmd = 0.604.
In order to assign a spatial context to the utilizationratios depicted in Fig. 5, the maximum values of the totalutilization ratio ηnmd(x) in each cross-section x for all loadcase combinations, i.e.
(19)
are shown as field variables in Fig. 6. As expected, thehighest utilization ratios arise along the tensile ring run-ning parallel to the shell edges, since in these regions the
/ 55MPa/1.5 0.06 m 2200kN/mc,Rd ck cn f h
( ) max ( ),nmdmax
1.. nmd,lccx x xj n j j
maximum principal stresses occur for symmetric loadingconditions as shown in Fig. 6 in the companion paper [12].It must be noted, though, that the highest utilization ratioηnmd = 0.604 does not occur exactly at the middle of ashell edge, where the highest principal tensile stresses oc-cur, but that the critical cross-section shifts to the position
Fig. 5. Numerical assessment of the TRC roof structure for all elements ofthe finite element discretization and all load case combinations
Fig. 6. Spatial distribution of the maximum utilization ratio in the TRC shellstructure for all load case combinations (plan view)

marked in Fig. 6 due to the assumed strength re duction inthe composite material for oblique loading (Eq. (8)).
4.3 Comparison with the non-linear structural response
Motivated by the need for load case superposition withinload case combinations, the ultimate limit state assess-ment approach described in the previous section wasbased on linear-elastic finite element analysis even thoughthe material behaviour is highly non-linear (section 2.2). Itmust be said that the use of linear-elastic analysis when de-signing TRC composites is on the safe side due to the un-derlying strain-hardening material response in tension. In-deed, stress redistributions within the shell lead to a largerload-carrying capacity than predicted by the linear-elasticanalysis.
In order to investigate the structural redundanciesfor the given TCR roof structure and to provide a realisticprediction of the shell deflections for the serviceabilitylimit state, non-linear simulations were performed for se-lected horizontal and vertical load case combinations. Forthis purpose an anisotropic damage model of the micro-plane type [19, 20], reflecting the evolution of finely dis-tributed, oriented cracks as direction-dependent damagevariables, has been formulated and implemented [21, 22].The material-specific damage function reflecting thestrain-hardening tensile response was calibrated based onthe stress-strain curves obtained from the TRC tensiletests described in section 2.2 (Fig. 2b).
To evaluate the loadbearing reserves of the TRC roofstructure assessed in section 4.2, let us consider a loadcase consisting of only permanent loads, including self-weight of the shell (material density ρ = 0.224 kN/m3), additional load on top of the shell (distributed loadgk = 0.20 kn/m2) and vertical load due to the attachedfaçade (line load gb = 0.35 kN/M). The utilization ratio ob-tained for this load case using the assessment proceduredescribed based on a fine finite element discretization,which includes the stress peak values at the shell edges,equates to ηnmd = 0.27. In the subsequent non-linear analy-sis this load case has been considered as a reference loadwith the load factor λref = 1.0.
Fig. 7 shows the dependency between the increasingload factor λ and the corner deflection w obtained from
122
A. Scholzen/R. Chudoba/J. Hegger · Thin-walled shell structures made of textile-reinforced concrete
Structural Concrete (2015), No. 1
the non-linear simulation. As mentioned above, the para-meters of the anisotropic damage model were identifiedbased on the tensile tests conducted and therefore reflectthe material behaviour corresponding to the mean valuesof the cross-sectional strength characteristics in Eq. (14).Ultimate failure was reached for the load factor λinel =9.08.
For the comparison with the linear analysis, let usfirst determine the load factor corresponding to full uti-lization at the ultimate limit state for the design values ofmaterial strength (Eq. 16), which is λuls = l/ηnmd = 3.7.Further, the load factor corresponding to the meanstrength characteristics (see Eq. (15)) is obtained asλel = γtex/χ · λuls = 1.5/0.81 · 3.7 = 6.85. Comparing thisload factor with the prediction obtained using the non-linear model (λinel = 9.08), the structural reserves due tostress-redistribution within the shell can be evaluated forthe load case considered as λinel/λel = 1.32. Fig. 8 depictsthe spatial distribution of damage calculated using thenon-linear simulation for the load levels specified inFig. 7. The distribution of the maximum value of the micro-plane damage, i.e. max(ω), on the top and bottomsurfaces of the quarter of the shell is depicted for eachload level. The analysis shows that the propagation ofdamage, i.e. matrix cracking, starts in the middle of the
Fig. 7. Evaluation of structural reserves using the non-linear, anisotropicstrain-hardening damage model for increasing vertical loading
Fig. 8. Distribution of the maximum damage within the TRC shell for the four loading levels given in Fig. 7
123
A. Scholzen/R. Chudoba/J. Hegger · Thin-walled shell structures made of textile-reinforced concrete
Structural Concrete (2015), No. 1
shell edges and propagates along the ring of principal tensile stresses obtained using the linear FE analysis(see companion paper [12], Fig. 7). At the ultimate limitstate the damage spreads over a large area of the shell, indicating a high amount of stress redistribution duringthe loading process. These redistributions, not reflectedin the linear-elastic design, are the source of the load-bearing reserves identified using the non-linear simula-tion.
Let us finally remark that the degree of structural re-dundancy depends on the smoothness of the stress fieldinduced by a particular load case. When a concentratedlocal load with highly localized stresses is considered, theeffect of the in-plane stress redistribution might also beless pronounced or even negligible. Furthermore, no re-dundancy can be expected for pure uniaxial bending ofthe shell without any membrane stresses and, thus, nopossibility for the damage to propagate to other zones ofthe shell. Nevertheless, the study performed demon-strates that the linear-elastic design approach used pro-vides a lower bound estimate of the ultimate load level.
5 Further issues addressed in the structural assessment
Due to limitations of space, the present paper could notcover all aspects included in the design and assessment ofthe TRC structure actually built. Special attention hasbeen paid to the design and assessment of joints with theaim of assuring a smooth load transfer between structuralelements. Further, the serviceability limit state assessmentwas performed based on the maximum deflections evalu-ated, also including the effect of creep. Another issue to beconsidered in a general assessment method are zones ex-posed to a significant biaxial tensile loading that mightlead to a strength reduction in one direction due to longi-tudinal cracks induced by the tensile load in the perpen-dicular direction.
6 Conclusions
The present paper introduces a design approach for TRCshell structures based on cross-sectional strength charac-teristics determined experimentally. The description ofthe design focuses on the assessment at the ultimate limitstate considering the interaction between normal forcesand bending moments. In order to take into account allload case combinations and at the same time the orienta-tion of the stress resultants with respect to the orientationof the reinforcing fabrics, an automated assessment toolhas been formulated and implemented. The design ap-proach described has been successfully applied and testedwith respect to its practical feasibility for the TRC pavilionbuilt at RWTH Aachen University.
Acknowledgements
The authors wish to thank the German Research Founda-tion (DFG) for financial support within the collaborativeresearch centre SFB 532 “Textile reinforced concrete – de-velopment of a new technology” and DFG project CH276/2-2.
References
1. Hegger, J., Voss, S.: Investigation of the loadbearing behav-iour and potential of Textile Reinforced Concrete. Engineer-ing Structures, 2008, 30, No. 7, pp. 2050–2056.
2. Hegger, J., Will, N., Bruckermann, O., Voss, S.: Loadbearingbehaviour and simulation of textile reinforced concrete. Ma-terial and Structures, 2006, 39, No. 8, pp. 765–776.
3. Voss, S.: Ingenieurmodelle zum Tragverhalten von textilbe-wehrtem Beton (Design models for the loadbearing behav-iour of textile reinforced concrete). Dissertation, Institute ofStructural Concrete (IMB), RWTH Aachen University, 2008,ISBN 3-939051-03-9, ISSN 0949-7331 (in German).
4. Schladitz, F., Lorenz, E., Curbach, M.: Biegetragfähigkeit vontextilbetonverstärkten Stahlbetonplatten (Bending Capacityof Reinforced Concrete Slabs Strengthened with Textile Re-inforced Concrete). Beton- und Stahlbetonbau, 2011, 106,No. 6, pp. 377–384 (in German).
5. Hegger, J., Horstmann, M.: Sandwichfassaden aus Textilbe-ton – Numerik und Ingenieurmodelle (Sandwich facadesmade of Textile Reinforced Concrete – numerical investiga-tions and engineering models). Bautechnik, 2011, 88, No. 6,pp. 373–384 (in German).
6. Schnabel, A., Grieß, T.: Production of non-crimp fabrics forcomposites; In: Non-crimp fabric composites: manufactur-ing, properties and applications, Lomov, S. V. (ed.), Wood-head Publishing Series in Composites Science and Engineer-ing, No. 35, Woodhead, Oxford, 2011.
7. Hartig, J., Jesse, F., Schicktanz, K., Häußler-Combe, U.: Influ-ence of experimental setup on the apparent uniaxial tensileloadbearing capacity of Textile Reinforced Concrete speci-mens. Materials and Structures, 2012, 45, pp. 433–446.
8. Colombo, I. G.., Magri, A., Zani, G., Colombo, M., di Prisco,M.: Textile Reinforced Concrete: experimental investigationon design parameters. Materials and Structures, 2013, 46, pp.1953–1971.
9. Larrinaga, P., Chastre, C., San-Jose, J. T., Garmendia, L.:Non-linear analytical model of composites based on basalttextile reinforced mortar under uniaxial tension. Compos-ites: Part B, 2013, No. 55, pp. 518–527.
10. Tysmans, T., Adriaenssens, S., Cuypers, H., Wastiels, J.: Struc-tural analysis of small span textile reinforced concrete shellswith double curvature. Composites Science and Technology,2009, 69, pp. 1790–1796.
11. Scholzen, A., Chudoba, R., Hegger, J.: Dünnwandiges Scha-lentragwerk aus Textilbeton: Entwurf, Bemessung undbaupraktische Umsetzung. Beton- und Stahlbetonbau, 2012,107, No. 11, pp, 767–776.
12. Scholzen, A., Chudoba, R., Hegger, J. (2015): Thin-walledshell structures made of textile-reinforced concrete – Part I:Structural design and construction. Structural Concrete, 16:106–114. doi: 10.1002/suco.201300071.
13. Rypl, R., Chudoba, R., Mörschel, U., Stapleton, S. E., Gries,T., Sommer, G.: A novel tensile test device for effective testingof high-modulus multi-filament yarns. Journal of IndustrialTextiles, 2014, published online, doi: 10.1177/1528083714521069.
14. Hinzen, M., Brameshuber, W.: Loadbearing Behaviour ofTextile Reinforced Concrete with Short Fibres. In: Fibre Re-inforced Concrete: Challenges and Opportunities, Proc. of8th RILEM Int. Symposium, Barros, J. A. O., (ed.), Portugal,19–21 Sept 2012.
15. Mobasher, B., Peled, A., Pahilajani, J.: Distributed crackingand stiffness degradation in fabric-cement composites. Mate-rials and Structures, 2006, 39, pp, 317–331.
16. Rypl, R., Chudoba, R., Scholzen, A., Vorechovsky, M.: Brittlematrix composites with heterogeneous reinforcement: Multi-

scale model of a crack bridge with rigid matrix. CompositesScience and Technology, 2013, 89, pp. 98–109.
17. DIN EN 1992-1-1, Eurocode 2: Design of concrete structures– Part 1-1: General rules and rules for buildings; German ver-sion EN 1992-1-1:2004 +AC:2010.
18. DIN EN1990, Eurocode: Basis of structural design; Germanversion EN 1990:2002 +A1:2005 +A1:2005/AC:2010.
19. Jirásek, M.: Comments on microplane theory. Mechanics ofQuasibrittle Materials and Structures, Hermes Science Pub-lications, 1999, pp. 55–77.
20. Carol, I., Jirásek, M., Bazant, Z.: A thermodynamically con-sistent approach to microplane theory. Part I. Free energyand consistent microplane stresses. International Journal ofSolids and Structures, 2001, 38, No. 17, pp. 2921–2931.
21. Scholzen, A., Chudoba, R., Hegger, J.: Damage Based Model-ing of Planar Textile-Reinforced Concrete Structures. In:Proc. of Int. RILEM Conference on Material Science,Brameshuber, W. (ed.), Aachen, 2010, pp. 362–370.
22. Scholzen, A., Chudoba, R., Hegger, J.: Calibration and Valida-tion of a Microplane Damage Model for cement-based Com-posites applied to Textile Reinforced Concrete, In: Proc. ofInt. Conf. on Recent Advances in Nonlinear Models – Struc-tural Concrete Applications, Barros, H. Faria, R., Pina, C.,Ferreira, C. (eds.), ECCOMAS thematic conf., 2011, Coim-bra, pp. 417–427.
124
A. Scholzen/R. Chudoba/J. Hegger · Thin-walled shell structures made of textile-reinforced concrete
Structural Concrete (2015), No. 1
Prof. Dr.-Ing. Josef HeggerRWTH Aachen UniversityInstitute of Structural Concrete (IMB)Mies-van-der-Rohe-Str. 152074 [email protected]
Dr.-Ing. Rostislav ChudobaRWTH Aachen UniversityInstitute of Structural Concrete (IMB)Mies-van-der-Rohe-Str. 152074 [email protected]
Dipl.-Ing. Alexander ScholzenRWTH Aachen UniversityInstitute of Structural Concrete (IMB)Mies-van-der-Rohe-Str. 152074 [email protected]
125© 2015 Ernst & Sohn Verlag für Architektur und technische Wissenschaften GmbH & Co. KG, Berlin · Structural Concrete (2015), No. 1
Non-linear constitutive models for concrete in compression arefrequently defined in design codes. The engineer generally useseither the linear (in SLS) or non-linear (in ULS) compression mod-el. However, a large variety of different approaches exists for de-scribing the behaviour of the cracked concrete tension zone, andthe selection of a corresponding model is usually based on quali-tative engineering judgement. The aim of this paper is to assessthe prediction quality of several concrete material models in or-der to provide a quantitative model selection. Therefore, uncer-tainty analysis is applied in order to investigate the model and pa-rameter uncertainty in the bending stiffness prognosis for flexuralmembers. The total uncertainty is converted into a prognosismodel quality that allows a quantitative comparison between thematerial models considered. The consideration of the reinforcedconcrete in tension is based on the characterization of the ten-sion stiffening effect, which describes the cracking in an averagesense. In the interest of the practical applicability of the modelsconsidered, even for large structures, no discrete crack simula-tions based on fracture mechanics are considered. Finally, theassessment identifies that the prediction quality depends on theloading level and, furthermore, the quality across the models canbe quantitatively similar as well as diverse.
Keywords: model evaluation, model quality, model uncertainty, parameteruncertainty, tension stiffening
1 Introduction
Numerical simulations are commonly used for analysingstructural load-deformation behaviour, particularly in thecase of complex systems with a high number of unknowns,geometrical and material non-linear behaviour, an irregu-lar geometry of the structure and a large number of loadcases and combinations. In the field of structural design, astructural engineer has to decide which phenomena – rep-resented by partial models (PM), e.g. material models, soilmodels, interaction models, load models – should be con-sidered in the numerical simulation of the global structur-al model (GM) under different conditions and load cases.
In general, a high number of analytical and numeri-cal models for each of these partial models are applied in
construction projects and research studies. In addition,new models are being developed with additional knowl-edge according to the “real” phenomena. Therefore, theselecting adequate partial models in the global model isnot a simple and trivial task. The importance of these par-tial models according to the global response of the struc-ture can be quantified using variance-based sensitivityanalysis. In the case that a PM influences the structuralbehaviour, it is necessary to quantify its prediction qualityMQPM and then subsequently combine both sets of infor-mation into the global model quality MQGM for the entirestructure [1].
When analysing the uncertainty in the model output,the quantitative model evaluation poses the question as towhich model should be chosen in comparison to the oth-er models considered. This study considers the uncertain-ties due to the non-deterministic input parameters and al-so uncertainties due to the model prediction error. Thisprobabilistic model evaluation helps to achieve a definitemodel selection in a quantitative manner. Hence, thequestion as to which model is the most adequate of theones considered can be answered by the use of uncertain-ty analysis. This most adequate model with highest predic-tion quality should be used in structural engineering prob-lems in order to achieve a greater confidence in thesimulation results and to ensure a reliable structural de-sign.
Material modelling is a partial model with a poten-tially strong influence on the computational results andreliable prognosis models [2, 3, 4]. For instance, the analy-sis of internal section forces for restraint-sensitive struc-tures, e.g. pavements, bridge decks, walls, industrial floors,constrained slabs or integral and semi-integral bridges, iscrucially dependent on the material model prediction [5].Therefore, the evaluation of the partial model’s quality forreinforced concrete is the focus of this paper. Either pure-ly linear models, non-linear compressive models or non-linear models considering the tension stiffening effect areconsidered in the evaluation.
The uncertainty assessment on a structural level(continuous beams, frames) for the material non-linearsimulation is not exclusively influenced by the partialmodel’s prediction of a certain structural element orcross-section. Owing to concrete cracking and internalforce redistribution, the uncertainty in the structural sim-ulation is mainly influenced by several coupled elements
Technical Paper
Quality assessment of material modelsfor reinforced concrete flexural members
Bastian Jung*Guido MorgenthalDong XuHendrik Schröter
DOI: 10.1002/suco.201300066
* Corresponding author: [email protected]
Submitted for review: 22 August 2013Revised: 2 May 2014Accepted for publication: 28 May 2014
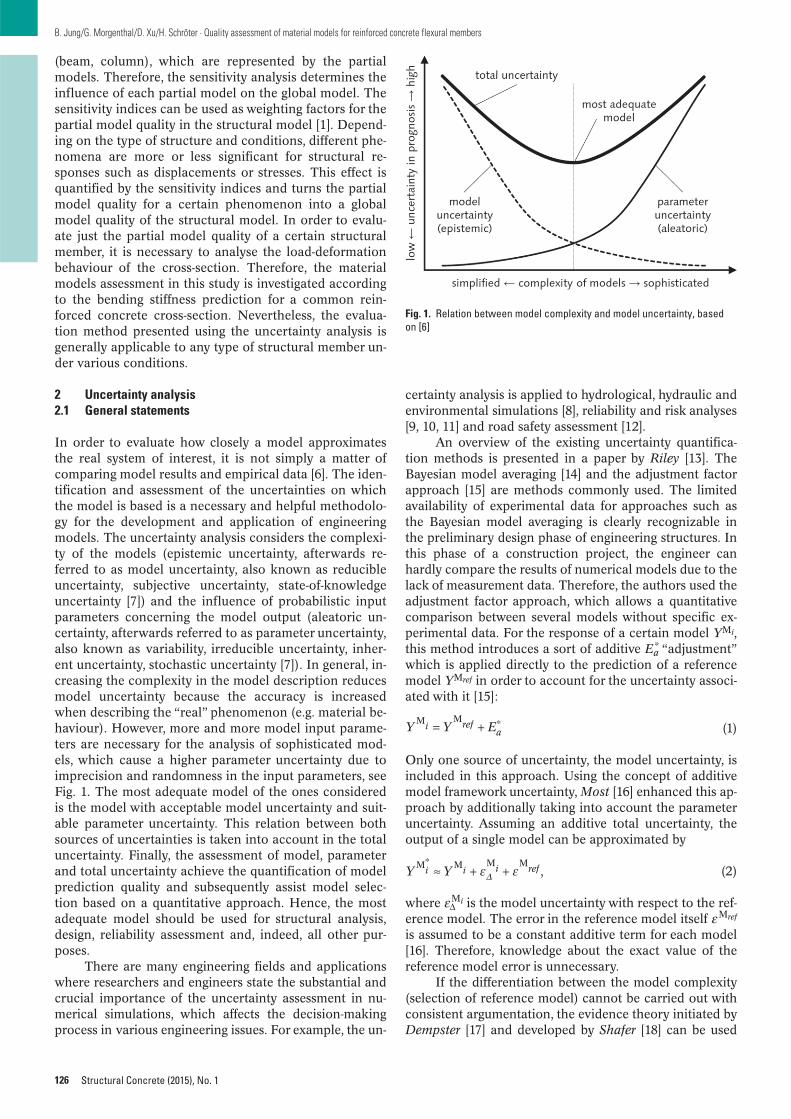
(beam, column), which are represented by the partialmodels. Therefore, the sensitivity analysis determines theinfluence of each partial model on the global model. Thesensitivity indices can be used as weighting factors for thepartial model quality in the structural model [1]. Depend-ing on the type of structure and conditions, different phe-nomena are more or less significant for structural re-sponses such as displacements or stresses. This effect isquantified by the sensitivity indices and turns the partialmodel quality for a certain phenomenon into a globalmodel quality of the structural model. In order to evalu-ate just the partial model quality of a certain structuralmember, it is necessary to analyse the load-deformationbehaviour of the cross-section. Therefore, the materialmodels assessment in this study is investigated accordingto the bending stiffness prediction for a common rein-forced concrete cross-section. Nevertheless, the evalua-tion method presented using the uncertainty analysis isgenerally applicable to any type of structural member un-der various conditions.
2 Uncertainty analysis2.1 General statements
In order to evaluate how closely a model approximatesthe real system of interest, it is not simply a matter ofcomparing model results and empirical data [6]. The iden-tification and assessment of the uncertainties on whichthe model is based is a necessary and helpful methodolo-gy for the development and application of engineeringmodels. The uncertainty analysis considers the complexi-ty of the models (epistemic uncertainty, afterwards re-ferred to as model uncertainty, also known as reducibleuncertainty, subjective uncertainty, state-of-knowledgeuncertainty [7]) and the influence of probabilistic inputparameters concerning the model output (aleatoric un-certainty, afterwards referred to as parameter uncertainty,also known as variability, irreducible uncertainty, inher-ent uncertainty, stochastic uncertainty [7]). In general, in-creasing the complexity in the model description reducesmodel uncertainty because the accuracy is increasedwhen describing the “real” phenomenon (e.g. material be-haviour). However, more and more model input parame-ters are necessary for the analysis of sophisticated mod-els, which cause a higher parameter uncertainty due toimprecision and randomness in the input parameters, seeFig. 1. The most adequate model of the ones consideredis the model with acceptable model uncertainty and suit-able parameter uncertainty. This relation between bothsources of uncertainties is taken into account in the totaluncertainty. Finally, the assessment of model, parameterand total uncertainty achieve the quantification of modelprediction quality and subsequently assist model selec-tion based on a quantitative approach. Hence, the mostadequate model should be used for structural analysis, design, reliability assessment and, indeed, all other pur-poses.
There are many engineering fields and applicationswhere researchers and engineers state the substantial andcrucial importance of the uncertainty assessment in nu-merical simulations, which affects the decision-makingprocess in various engineering issues. For example, the un-
126
B. Jung/G. Morgenthal/D. Xu/H. Schröter · Quality assessment of material models for reinforced concrete flexural members
Structural Concrete (2015), No. 1
certainty analysis is applied to hydrological, hydraulic andenvironmental simulations [8], reliability and risk analyses[9, 10, 11] and road safety assessment [12].
An overview of the existing uncertainty quantifica-tion methods is presented in a paper by Riley [13]. TheBayesian model averaging [14] and the adjustment factorapproach [15] are methods commonly used. The limitedavailability of experimental data for approaches such asthe Bayesian model averaging is clearly recognizable inthe preliminary design phase of engineering structures. Inthis phase of a construction project, the engineer canhardly compare the results of numerical models due to thelack of measurement data. Therefore, the authors used theadjustment factor approach, which allows a quantitativecomparison between several models without specific ex-perimental data. For the response of a certain model YMi,this method introduces a sort of additive Ea
* “adjustment”which is applied directly to the prediction of a referencemodel YMref in order to account for the uncertainty associ-ated with it [15]:
(1)
Only one source of uncertainty, the model uncertainty, isincluded in this approach. Using the concept of additivemodel framework uncertainty, Most [16] enhanced this ap-proach by additionally taking into account the parameteruncertainty. Assuming an additive total uncertainty, theoutput of a single model can be approximated by
(2)
where εΔMi is the model uncertainty with respect to the ref-erence model. The error in the reference model itself εMref
is assumed to be a constant additive term for each model[16]. Therefore, knowledge about the exact value of thereference model error is unnecessary.
If the differentiation between the model complexity(selection of reference model) cannot be carried out withconsistent argumentation, the evidence theory initiated byDempster [17] and developed by Shafer [18] can be used
M M *Y Y Ei refa
,M* M M M
Y Yi i i ref
Fig. 1. Relation between model complexity and model uncertainty, basedon [6]
127
B. Jung/G. Morgenthal/D. Xu/H. Schröter · Quality assessment of material models for reinforced concrete flexural members
Structural Concrete (2015), No. 1
for the uncertainty quantification with the extension byPark and Grandhi [19].
2.2 Aleatoric parameter uncertainty
In general, the parameter uncertainty is quantified by thevariance in each model output caused by the underlyingprobabilistic input parameters. The aleatoric parameteruncertainty is computed from the quotient of the standarddeviation and the mean value, which leads to the dimen-sionless coefficient of variation (CoV). Therefore, the pa-rameter uncertainty is defined as
(3)
In order to analyse the model with the non-deterministicinput parameters, it is necessary to compute a set of prob-abilistic input parameters using a sampling method. Latinhypercube sampling (LHS) [20] is an effective samplingmethod that enables a reliable approximation of the sto-chastic properties – even for a small number of samplesand highly dimensional random variables. Further devel-opment of this method in [21] improves the accurate con-sideration of the correlation between the input parame-ters. This sampling strategy is independent of thedimensions of the random vectors. Furthermore, its inde-pendence is related to the number of random variables in-cluded in the analysis. This significantly reduces the num-ber of simulations required in the uncertainty analysis.Hence, LHS is used in the assessment of aleatoric para-meter uncertainty.
2.3 Epistemic model uncertainty
According to the estimation of the model uncertainty, acertain model is used as the reference model Mref in orderto evaluate the differences in the varying model predic-tions. These different model outputs are caused by thelack of knowledge of the simplified models in relation tothe most complex model considered in the evaluation. Ex-perimental data could be used for this purpose, but no spe-cific measurement data are usually available in the designprocess. Therefore, the most complex model is fixed inthis study as a benchmark. By using the model with thehighest complexity, it is safe to assume that the accuracyof describing the physical phenomena should also be thehighest. The model uncertainty of the other more simpli-fied models Mi is defined as [16]
(4)
(5)
This model uncertainty is computed using the mean re-sponses of the models. The absolute difference betweenthe reference model and the more simplified modelsforms the basis for determining the model uncertainty.
M 2M M
2
V b Y Yi i ref
M
model
M M
MCoV CoV
b Y Y
Y
i i
i ref
ref
M
.parameter
M M
MCoV i i
i
The variance in the model uncertainty is unknown andtherefore it is necessary to make an assumption about theform of the underlying distribution in order to obtain avalid confidence level. In engineering applications, a rea-sonable assumption is that the underlying distribution isnormal, because many simulation results encountered inpractice can be well approximated by this type of distrib-ution [22]. A moderate divergence from normality willhave little effect on the validity of this assumption. Basedon this assumption, factor b in Eq. (5) can be chosen cor-responding to a certain one-sided quantile value (confi-dence bound defined by percentage points tα,ν [22]) as fol-lows:
These assumptions for the model uncertainty quantifica-tion are suitable for the assessment in the range of themean values of the input parameters [16]. Furthermore,theoretical studies as published by Kiureghian andDitlevsen [23] have to be performed for a reliability analy-sis. Owing to the significant influence of the type of distri-bution and the bias on the failure probability, the assump-tions according to the model uncertainty should beredefined in order to quantify a model quality in the fail-ure regions.
2.4 Total uncertainty and partial model quality
The total variance in a certain model considering the pa-rameter uncertainty, model uncertainty and the variancein the error of the reference model itself is approximatelyas follows [16]:
(6)
The total uncertainty defined as the variance is redefinedas the dimensionless coefficient of variation, see Eq. (7).Reformulating the dimensional expression of the uncer-tainty as the dimensionless indication enables a more pre-cise quantification with respect to the relative model re-sponses. Otherwise, the dimensional uncertainty is relatedto the magnitude of the model output:
(7)
The most adequate model of all the models considered isthe one with the smallest sum of the model and parameteruncertainty. This leads to the following definition of themodel quality based on the corresponding total uncertain-ty:
(8)
For high total uncertainties CoVMitotal > 1.0, the model qual-
ity for each partial model can also be related to the mini-mum total uncertainty of all the models [24].
( ) ( ) ( ) ( )M*
total
M
M
parameterM
2M M
2
model
M
M
not considered
V Y V Y b Y Y Vi
CoV i
i
CoV i
i ref
CoV i
ref� �� �� � �� �� � ����� ����� � ��� ���
total
M
parameter
M 2model
M 2CoV CoV CoVi i i
=1PM
M
total
MMQ CoVi i
97.5% 1/ 1/1.960 0.510
95.0% 1/ 1/1.645 0.608
90.0% 1/ 1/1.282 0.780
0.025,
0.050,
0.100,
b t
b t
b t
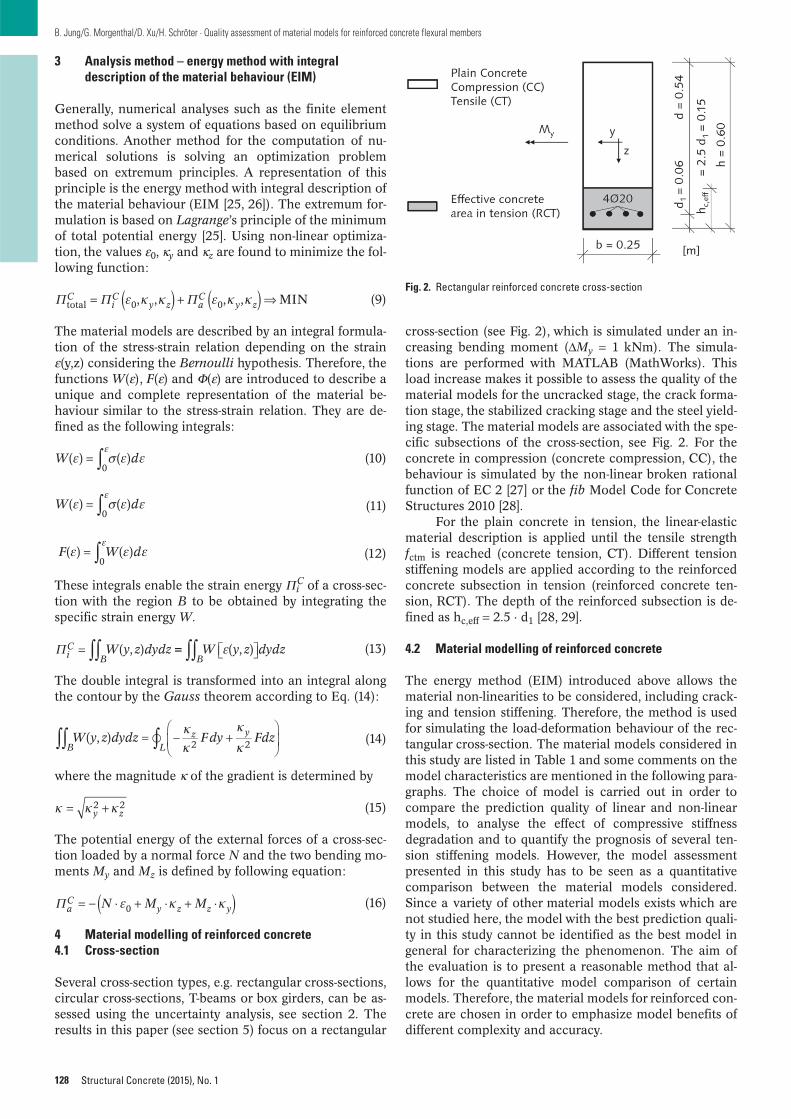
3 Analysis method – energy method with integraldescription of the material behaviour (EIM)
Generally, numerical analyses such as the finite elementmethod solve a system of equations based on equilibriumconditions. Another method for the computation of nu-merical solutions is solving an optimization problembased on extremum principles. A representation of thisprinciple is the energy method with integral description ofthe material behaviour (EIM [25, 26]). The extremum for-mulation is based on Lagrange’s principle of the minimumof total potential energy [25]. Using non-linear optimiza-tion, the values ε0, κy and κz are found to minimize the fol-lowing function:
(9)
The material models are described by an integral formula-tion of the stress-strain relation depending on the strainε(y,z) considering the Bernoulli hypothesis. Therefore, thefunctions W(ε), F(ε) and Φ(ε) are introduced to describe aunique and complete representation of the material be-haviour similar to the stress-strain relation. They are de-fined as the following integrals:
(10)
(11)
(12)
These integrals enable the strain energy Π iC of a cross-sec-
tion with the region B to be obtained by integrating thespecific strain energy W.
(13)
The double integral is transformed into an integral alongthe contour by the Gauss theorem according to Eq. (14):
(14)
where the magnitude κ of the gradient is determined by
(15)
The potential energy of the external forces of a cross-sec-tion loaded by a normal force N and the two bending mo-ments My and Mz is defined by following equation:
(16)
4 Material modelling of reinforced concrete4.1 Cross-section
Several cross-section types, e.g. rectangular cross-sections,circular cross-sections, T-beams or box girders, can be as-sessed using the uncertainty analysis, see section 2. Theresults in this paper (see section 5) focus on a rectangular
( ) ( )0
W d
( ) ( )0
W d
( ) ( )0
F W d
( , ) = ( , )W y z dydz W y z dydziC
B B
( , )2 2
W y z dydz Fdy FdzB L
z y�
2 2y z
0N M MaC
y z z y
, , , , MINtotal 0 0C
iC
y z aC
y z
128
B. Jung/G. Morgenthal/D. Xu/H. Schröter · Quality assessment of material models for reinforced concrete flexural members
Structural Concrete (2015), No. 1
cross-section (see Fig. 2), which is simulated under an in-creasing bending moment (ΔMy = 1 kNm). The simula-tions are performed with MATLAB (MathWorks). Thisload increase makes it possible to assess the quality of thematerial models for the uncracked stage, the crack forma-tion stage, the stabilized cracking stage and the steel yield-ing stage. The material models are associated with the spe-cific subsections of the cross-section, see Fig. 2. For theconcrete in compression (concrete compression, CC), thebehaviour is simulated by the non-linear broken rationalfunction of EC 2 [27] or the fib Model Code for ConcreteStructures 2010 [28].
For the plain concrete in tension, the linear-elasticmaterial description is applied until the tensile strengthfctm is reached (concrete tension, CT). Different tensionstiffening models are applied according to the reinforcedconcrete subsection in tension (reinforced concrete ten-sion, RCT). The depth of the reinforced subsection is de-fined as hc,eff = 2.5 · d1 [28, 29].
4.2 Material modelling of reinforced concrete
The energy method (EIM) introduced above allows thematerial non-linearities to be considered, including crack-ing and tension stiffening. Therefore, the method is usedfor simulating the load-deformation behaviour of the rec-tangular cross-section. The material models considered inthis study are listed in Table 1 and some comments on themodel characteristics are mentioned in the following para-graphs. The choice of model is carried out in order tocompare the prediction quality of linear and non-linearmodels, to analyse the effect of compressive stiffnessdegradation and to quantify the prognosis of several ten-sion stiffening models. However, the model assessmentpresented in this study has to be seen as a quantitativecomparison between the material models considered.Since a variety of other material models exists which arenot studied here, the model with the best prediction quali-ty in this study cannot be identified as the best model ingeneral for characterizing the phenomenon. The aim ofthe evaluation is to present a reasonable method that al-lows for the quantitative model comparison of certainmodels. Therefore, the material models for reinforced con-crete are chosen in order to emphasize model benefits ofdifferent complexity and accuracy.
Fig. 2. Rectangular reinforced concrete cross-section
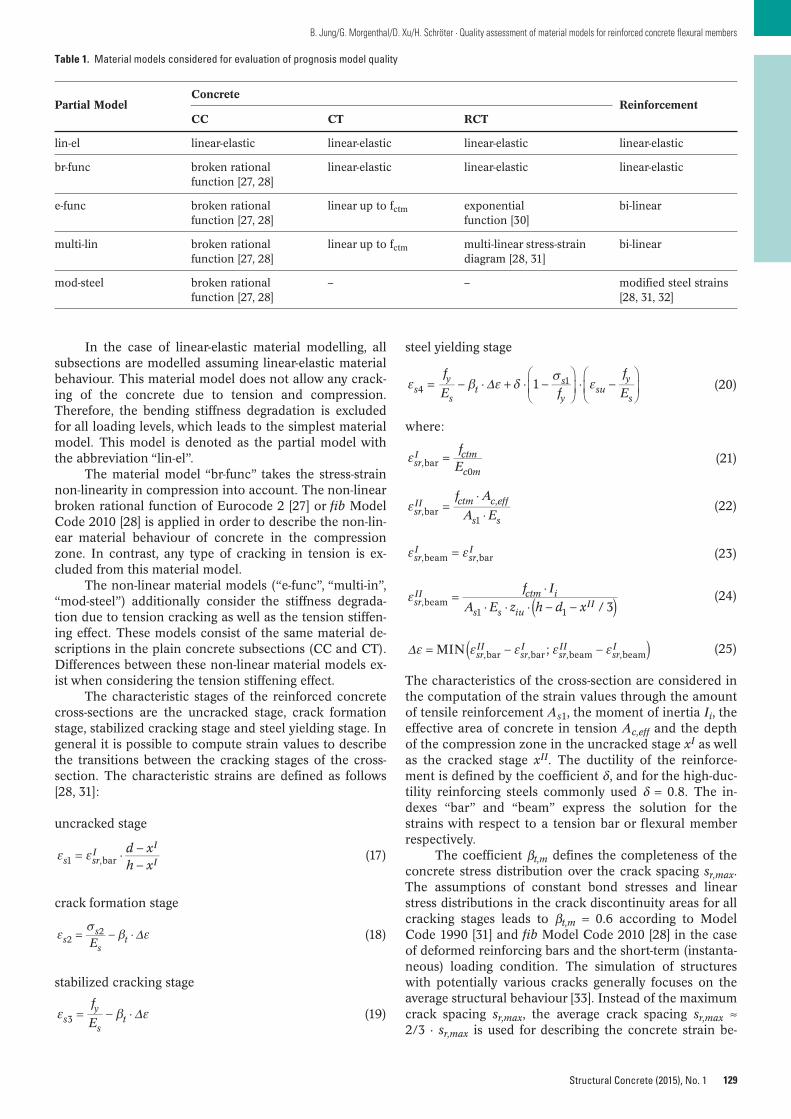
129
B. Jung/G. Morgenthal/D. Xu/H. Schröter · Quality assessment of material models for reinforced concrete flexural members
Structural Concrete (2015), No. 1
In the case of linear-elastic material modelling, allsubsections are modelled assuming linear-elastic materialbehaviour. This material model does not allow any crack-ing of the concrete due to tension and compression.Therefore, the bending stiffness degradation is excludedfor all loading levels, which leads to the simplest materialmodel. This model is denoted as the partial model withthe abbreviation “lin-el”.
The material model “br-func” takes the stress-strainnon-linearity in compression into account. The non-linearbroken rational function of Eurocode 2 [27] or fib ModelCode 2010 [28] is applied in order to describe the non-lin-ear material behaviour of concrete in the compressionzone. In contrast, any type of cracking in tension is ex-cluded from this material model.
The non-linear material models (“e-func”, “multi-in”,“mod-steel”) additionally consider the stiffness degrada-tion due to tension cracking as well as the tension stiffen-ing effect. These models consist of the same material de-scriptions in the plain concrete subsections (CC and CT).Differences between these non-linear material models ex-ist when considering the tension stiffening effect.
The characteristic stages of the reinforced concretecross-sections are the uncracked stage, crack formationstage, stabilized cracking stage and steel yielding stage. Ingeneral it is possible to compute strain values to describethe transitions between the cracking stages of the cross-section. The characteristic strains are defined as follows[28, 31]:
uncracked stage
(17)
crack formation stage
(18)
stabilized cracking stage
(19)
22
Ess
st
3
f
Esy
st
1 ,bard xh xs sr
II
I
steel yielding stage
(20)
where:
(21)
(22)
(23)
(24)
(25)
The characteristics of the cross-section are considered inthe computation of the strain values through the amountof tensile reinforcement As1, the moment of inertia Ii, theeffective area of concrete in tension Ac,eff and the depthof the compression zone in the uncracked stage xI as wellas the cracked stage xII. The ductility of the reinforce-ment is defined by the coefficient δ , and for the high-duc-tility reinforcing steels commonly used δ = 0.8. The in-dexes “bar” and “beam” express the solution for thestrains with respect to a tension bar or flexural memberrespectively.
The coefficient βt,m defines the completeness of theconcrete stress distribution over the crack spacing sr,max.The assumptions of constant bond stresses and linearstress distributions in the crack discontinuity areas for allcracking stages leads to βt,m = 0.6 according to ModelCode 1990 [31] and fib Model Code 2010 [28] in the caseof deformed reinforcing bars and the short-term (instanta-neous) loading condition. The simulation of structureswith potentially various cracks generally focuses on theaverage structural behaviour [33]. Instead of the maximumcrack spacing sr,max, the average crack spacing sr,max ≈2/3 · sr,max is used for describing the concrete strain be-
,bar0
fEsr
I ctm
c m
,bar,
1
f A
A EsrII ctm c eff
s s
,beam ,barsrI
srI
141
f
E f
f
Esy
st
s
ysu
y
s
/ 3,beam1 1
f IA E z h d xsr
II ctm i
s s iuII
MIN ;,bar ,bar ,beam ,beamsrII
srI
srII
srI
Table 1. Material models considered for evaluation of prognosis model quality
Partial ModelConcrete
ReinforcementCC CT RCT
lin-el linear-elastic linear-elastic linear-elastic linear-elastic
br-func broken rational linear-elastic linear-elastic linear-elasticfunction [27, 28]
e-func broken rational linear up to fctm exponential bi-linearfunction [27, 28] function [30]
multi-lin broken rational linear up to fctm multi-linear stress-strain bi-linearfunction [27, 28] diagram [28, 31]
mod-steel broken rational – – modified steel strains function [27, 28] [28, 31, 32]
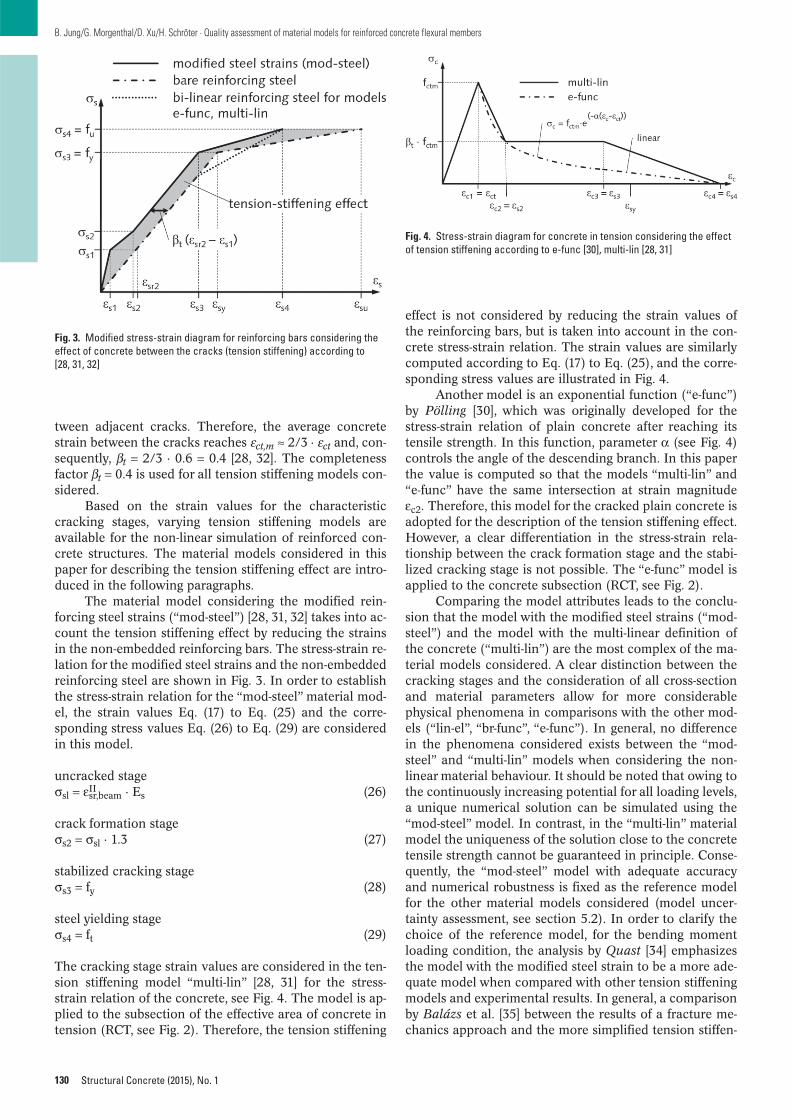
tween adjacent cracks. Therefore, the average concretestrain between the cracks reaches εct,m ≈ 2/3 · εct and, con-sequently, βt = 2/3 · 0.6 = 0.4 [28, 32]. The completenessfactor βt = 0.4 is used for all tension stiffening models con-sidered.
Based on the strain values for the characteristiccracking stages, varying tension stiffening models areavailable for the non-linear simulation of reinforced con-crete structures. The material models considered in thispaper for describing the tension stiffening effect are intro-duced in the following paragraphs.
The material model considering the modified rein-forcing steel strains (“mod-steel”) [28, 31, 32] takes into ac-count the tension stiffening effect by reducing the strainsin the non-embedded reinforcing bars. The stress-strain re-lation for the modified steel strains and the non-embeddedreinforcing steel are shown in Fig. 3. In order to establishthe stress-strain relation for the “mod-steel” material mod-el, the strain values Eq. (17) to Eq. (25) and the corre-sponding stress values Eq. (26) to Eq. (29) are consideredin this model.
uncracked stageσsl = εII
sr,beam · Es (26)
crack formation stageσs2 = σsl · 1.3 (27)
stabilized cracking stageσs3 = fy (28)
steel yielding stageσs4 = ft (29)
The cracking stage strain values are considered in the ten-sion stiffening model “multi-lin” [28, 31] for the stress-strain relation of the concrete, see Fig. 4. The model is ap-plied to the subsection of the effective area of concrete intension (RCT, see Fig. 2). Therefore, the tension stiffening
130
B. Jung/G. Morgenthal/D. Xu/H. Schröter · Quality assessment of material models for reinforced concrete flexural members
Structural Concrete (2015), No. 1
effect is not considered by reducing the strain values ofthe reinforcing bars, but is taken into account in the con-crete stress-strain relation. The strain values are similarlycomputed according to Eq. (17) to Eq. (25), and the corre-sponding stress values are illustrated in Fig. 4.
Another model is an exponential function (“e-func”)by Pölling [30], which was originally developed for thestress-strain relation of plain concrete after reaching itstensile strength. In this function, parameter α (see Fig. 4)controls the angle of the descending branch. In this paperthe value is computed so that the models “multi-lin” and“e-func” have the same intersection at strain magnitudeεc2. Therefore, this model for the cracked plain concrete isadopted for the description of the tension stiffening effect.However, a clear differentiation in the stress-strain rela-tionship between the crack formation stage and the stabi-lized cracking stage is not possible. The “e-func” model isapplied to the concrete subsection (RCT, see Fig. 2).
Comparing the model attributes leads to the conclu-sion that the model with the modified steel strains (“mod-steel”) and the model with the multi-linear definition ofthe concrete (“multi-lin”) are the most complex of the ma-terial models considered. A clear distinction between thecracking stages and the consideration of all cross-sectionand material parameters allow for more considerablephysical phenomena in comparisons with the other mod-els (“lin-el”, “br-func”, “e-func”). In general, no differencein the phenomena considered exists between the “mod-steel” and “multi-lin” models when considering the non-linear material behaviour. It should be noted that owing tothe continuously increasing potential for all loading levels,a unique numerical solution can be simulated using the“mod-steel” model. In contrast, in the “multi-lin” materialmodel the uniqueness of the solution close to the concretetensile strength cannot be guaranteed in principle. Conse-quently, the “mod-steel” model with adequate accuracyand numerical robustness is fixed as the reference modelfor the other material models considered (model uncer-tainty assessment, see section 5.2). In order to clarify thechoice of the reference model, for the bending momentloading condition, the analysis by Quast [34] emphasizesthe model with the modified steel strain to be a more ade-quate model when compared with other tension stiffeningmodels and experimental results. In general, a comparisonby Balázs et al. [35] between the results of a fracture me-chanics approach and the more simplified tension stiffen-
Fig. 3. Modified stress-strain diagram for reinforcing bars considering theeffect of concrete between the cracks (tension stiffening) according to[28, 31, 32]
Fig. 4. Stress-strain diagram for concrete in tension considering the effectof tension stiffening according to e-func [30], multi-lin [28, 31]

131
B. Jung/G. Morgenthal/D. Xu/H. Schröter · Quality assessment of material models for reinforced concrete flexural members
Structural Concrete (2015), No. 1
ing-based models illustrates the generally applicability ofthe simplified models for predicting the average responseof a reinforced concrete member.
4.3 Deterministic load-deformation behaviour
The prediction of the bending stiffness and the stiffnessdegradation due to concrete cracking is an important re-sponse quantity of flexural structural components. Thisphenomenon has a strong effect on the overall structuralresponse of, for example, restraint-sensitive structures [5].Hence, the results according to the model quality evalua-tion for the reinforced concrete material models (see sec-tion 5) are based on the prediction of the cross-sectionbending stiffness. The simulation with the deterministicinput parameters (mean values, see Table 2) according tothe bending stiffness-bending moment relation (see Fig.5a) shows the different prognoses of the partial models.The bending stiffness is simulated with the help of the en-ergy method (EIM) and the optimized solution is relatedto the uncracked analytical solution (EII = Ii · Ec =143.66 MNm2).
In the case where the stiffness ratio EI/EII = 1.0, thepredicted numerical and the analytical uncracked stiff-nesses are equal. This ratio is visible in the range of smallbending moments and, consequently, the numerical solu-tion achieves the analytical initial bending stiffness. Ow-ing to the increasing bending moment, the ratio EI/EII isdecreasing – caused by the concrete cracking, see Fig. 5.
5 Model quality evaluation using uncertainty analysis5.1 Parameter uncertainty
The quantification of the parameter uncertainty is simulat-ed with 1000 samples of the probabilistic concrete and re-inforcing steel material properties according to Table 2.Comparing the model output for 100, 200, 500 and 1000samples indicates accurate results for 1000 input samplesbecause the difference in the uncertainty for 500 and 1000samples is negligible, see Fig. 6c. The probabilistic inputparameters for assessing parameter uncertainty are themean concrete compressive strength fcm, the mean con-crete tensile strength fcm, the secant modulus of elasticity
of the concrete Ecm, the yield strength of the reinforcingsteel fy, the tensile strength of the reinforcing steel ft andthe modulus of elasticity of the reinforcing steel Es. Thesampling of the input parameters for the material modelswith their underlying correlation is performed using LHS[20, 21].
The mean values of the material parameters for concrete class C 30/37 are fcm = 38.0 MN/m2, fctm =2.90 MN/m2, Ec0m = 32,837 MN/m2, and for reinforcingsteel grade B500B Es = 200 000 MN/m2 [29]. The globalsafety concept for non-linear simulations according to Eurocode 2 and the German National Annex [29] definesthe “calculation” material properties (expressed by index“R”) as the mean material properties. Therefore, the meanmaterial properties for concrete C 30/37 are fcR =21.68 MN/m2 and Ec0mR = 29 307 MN/m2. For reinforc-ing steel B500B, the mean material properties are fyR =550 MN/m2 and ftR = 594 MN/m2. More information onthe non-linear safety concept for concrete structures canbe found in Cervenka [36] and Allaix et al. [37].
In the study by Tue et al. [38], the variance in theconcrete compressive strength is analysed for 173 con-struction projects with a total of 5027 test specimens. Thecoefficient of variation for the laboratory compressive testis assessed with
(30)
In general, the characteristic structural strength is approx.85 % of the characteristic cylinder compressive strengthdue to additional uncertainties such as the quality of plac-ing the concrete in the structure or the various effects ofconcrete curing. Therefore, the variance in the compres-sive strength in the structure is increasing and can be de-fined as [38]
(31)
For the given concrete class C 30/37, the coefficient ofvariation is CVfc,str = 0.19 and the variance in all the othermaterial properties is based on the studies [39, 40, 41], seeTable 2.
2.80 / 148.44,
2CoV MN m
ff testck
c
0.091 0.85, ,CoV CVf str f testc c
Fig. 5. Deterministic and probabilistic load-deformation behaviour of a rectangular cross-section
(a) (b)
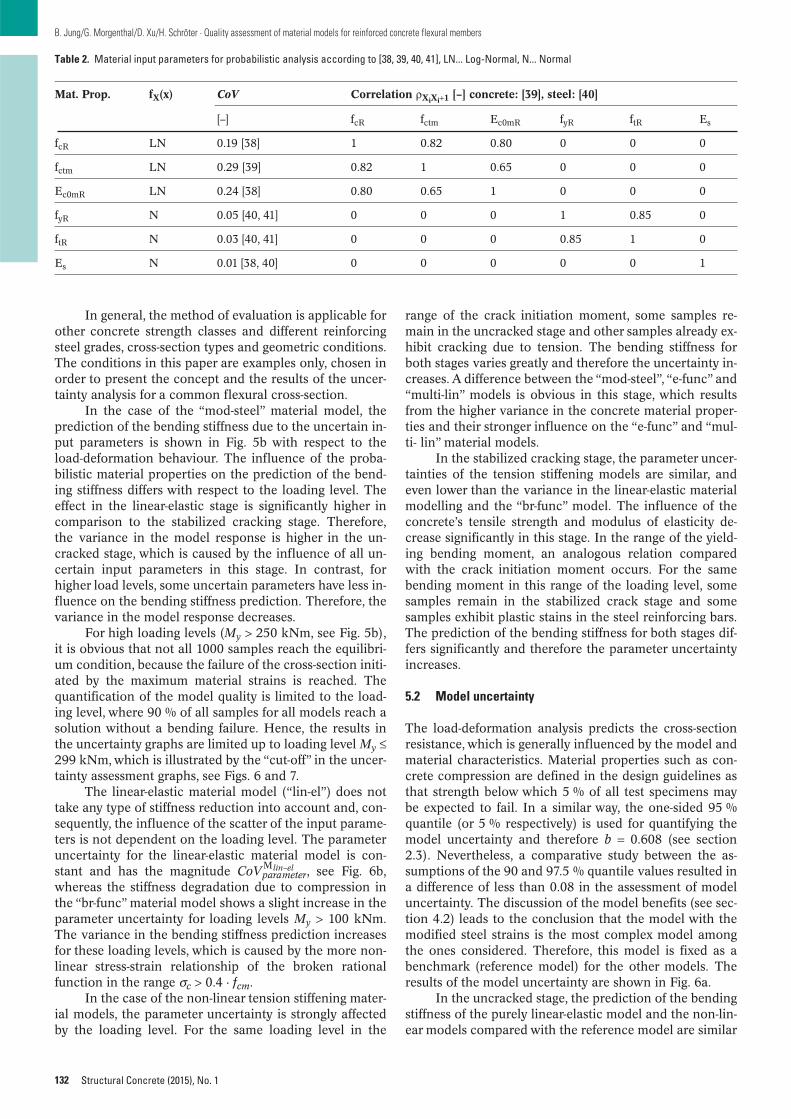
In general, the method of evaluation is applicable forother concrete strength classes and different reinforcingsteel grades, cross-section types and geometric conditions.The conditions in this paper are examples only, chosen inorder to present the concept and the results of the uncer-tainty analysis for a common flexural cross-section.
In the case of the “mod-steel” material model, theprediction of the bending stiffness due to the uncertain in-put parameters is shown in Fig. 5b with respect to theload-deformation behaviour. The influence of the proba-bilistic material properties on the prediction of the bend-ing stiffness differs with respect to the loading level. Theeffect in the linear-elastic stage is significantly higher incomparison to the stabilized cracking stage. Therefore,the variance in the model response is higher in the un-cracked stage, which is caused by the influence of all un-certain input parameters in this stage. In contrast, forhigher load levels, some uncertain parameters have less in-fluence on the bending stiffness prediction. Therefore, thevariance in the model response decreases.
For high loading levels (My > 250 kNm, see Fig. 5b),it is obvious that not all 1000 samples reach the equilibri-um condition, because the failure of the cross-section initi-ated by the maximum material strains is reached. Thequantification of the model quality is limited to the load-ing level, where 90 % of all samples for all models reach asolution without a bending failure. Hence, the results inthe uncertainty graphs are limited up to loading level My ≤299 kNm, which is illustrated by the “cut-off” in the uncer-tainty assessment graphs, see Figs. 6 and 7.
The linear-elastic material model (“lin-el”) does nottake any type of stiffness reduction into account and, con-sequently, the influence of the scatter of the input parame-ters is not dependent on the loading level. The parameteruncertainty for the linear-elastic material model is con-stant and has the magnitude CoVM
paralin–el
meter, see Fig. 6b,whereas the stiffness degradation due to compression inthe “br-func” material model shows a slight increase in theparameter uncertainty for loading levels My > 100 kNm.The variance in the bending stiffness prediction increasesfor these loading levels, which is caused by the more non-linear stress-strain relationship of the broken rationalfunction in the range σc > 0.4 · fcm.
In the case of the non-linear tension stiffening mater-ial models, the parameter uncertainty is strongly affectedby the loading level. For the same loading level in the
132
B. Jung/G. Morgenthal/D. Xu/H. Schröter · Quality assessment of material models for reinforced concrete flexural members
Structural Concrete (2015), No. 1
range of the crack initiation moment, some samples re-main in the uncracked stage and other samples already ex-hibit cracking due to tension. The bending stiffness forboth stages varies greatly and therefore the uncertainty in-creases. A difference between the “mod-steel”, “e-func” and“multi-lin” models is obvious in this stage, which resultsfrom the higher variance in the concrete material proper-ties and their stronger influence on the “e-func” and “mul-ti- lin” material models.
In the stabilized cracking stage, the parameter uncer-tainties of the tension stiffening models are similar, andeven lower than the variance in the linear-elastic materialmodelling and the “br-func” model. The influence of theconcrete’s tensile strength and modulus of elasticity de-crease significantly in this stage. In the range of the yield-ing bending moment, an analogous relation comparedwith the crack initiation moment occurs. For the samebending moment in this range of the loading level, somesamples remain in the stabilized crack stage and somesamples exhibit plastic stains in the steel reinforcing bars.The prediction of the bending stiffness for both stages dif-fers significantly and therefore the parameter uncertaintyincreases.
5.2 Model uncertainty
The load-deformation analysis predicts the cross-sectionresistance, which is generally influenced by the model andmaterial characteristics. Material properties such as con-crete compression are defined in the design guidelines asthat strength below which 5 % of all test specimens maybe expected to fail. In a similar way, the one-sided 95 %quantile (or 5 % respectively) is used for quantifying themodel uncertainty and therefore b = 0.608 (see section2.3). Nevertheless, a comparative study between the as-sumptions of the 90 and 97.5 % quantile values resulted ina difference of less than 0.08 in the assessment of modeluncertainty. The discussion of the model benefits (see sec-tion 4.2) leads to the conclusion that the model with themodified steel strains is the most complex model amongthe ones considered. Therefore, this model is fixed as abenchmark (reference model) for the other models. Theresults of the model uncertainty are shown in Fig. 6a.
In the uncracked stage, the prediction of the bendingstiffness of the purely linear-elastic model and the non-lin-ear models compared with the reference model are similar
Table 2. Material input parameters for probabilistic analysis according to [38, 39, 40, 41], LN... Log-Normal, N... Normal
Mat. Prop. fX(x) CoV Correlation ρXiXi+1 [–] concrete: [39], steel: [40]
[–] fcR fctm Ec0mR fyR ftR Es
fcR LN 0.19 [38] 1 0.82 0.80 0 0 0
fctm LN 0.29 [39] 0.82 1 0.65 0 0 0
Ec0mR LN 0.24 [38] 0.80 0.65 1 0 0 0
fyR N 0.05 [40, 41] 0 0 0 1 0.85 0
ftR N 0.03 [40, 41] 0 0 0 0.85 1 0
Es N 0.01 [38, 40] 0 0 0 0 0 1
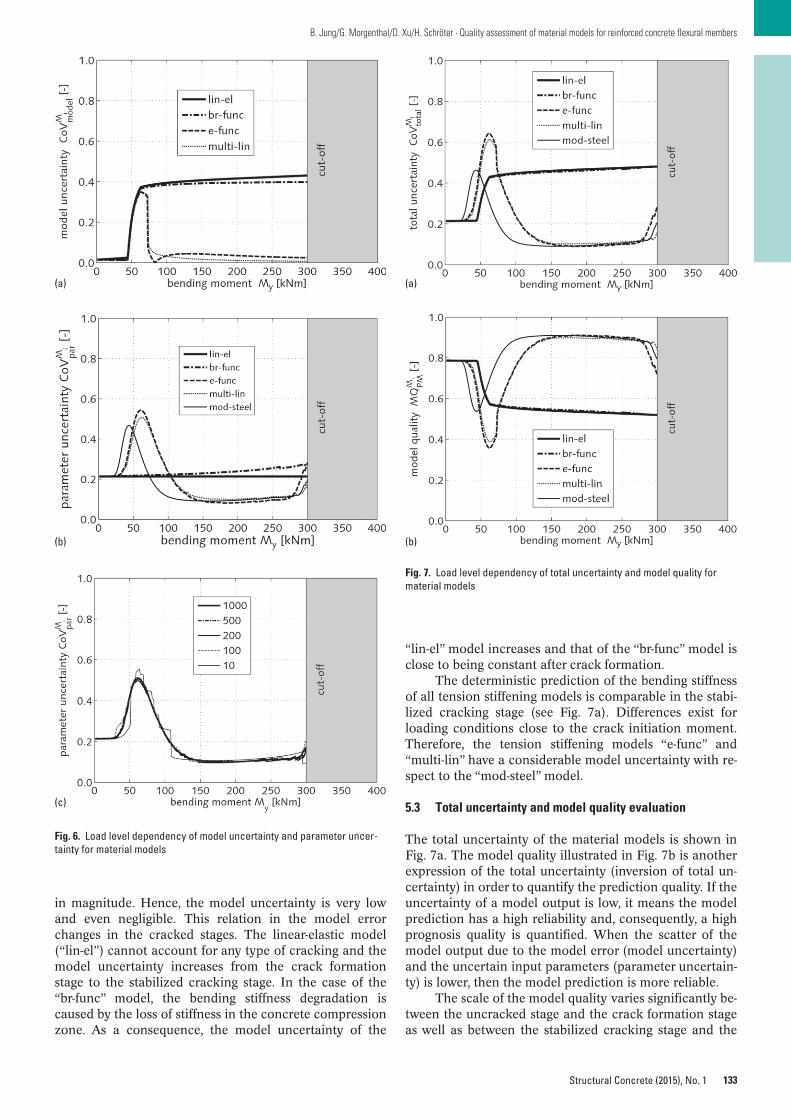
133
B. Jung/G. Morgenthal/D. Xu/H. Schröter · Quality assessment of material models for reinforced concrete flexural members
Structural Concrete (2015), No. 1
in magnitude. Hence, the model uncertainty is very lowand even negligible. This relation in the model errorchanges in the cracked stages. The linear-elastic model(“lin-el”) cannot account for any type of cracking and themodel uncertainty increases from the crack formationstage to the stabilized cracking stage. In the case of the“br-func” model, the bending stiffness degradation iscaused by the loss of stiffness in the concrete compressionzone. As a consequence, the model uncertainty of the
“lin-el” model increases and that of the “br-func” model isclose to being constant after crack formation.
The deterministic prediction of the bending stiffnessof all tension stiffening models is comparable in the stabi-lized cracking stage (see Fig. 7a). Differences exist forloading conditions close to the crack initiation moment.Therefore, the tension stiffening models “e-func” and“multi-lin” have a considerable model uncertainty with re-spect to the “mod-steel” model.
5.3 Total uncertainty and model quality evaluation
The total uncertainty of the material models is shown inFig. 7a. The model quality illustrated in Fig. 7b is anotherexpression of the total uncertainty (inversion of total un-certainty) in order to quantify the prediction quality. If theuncertainty of a model output is low, it means the modelprediction has a high reliability and, consequently, a highprognosis quality is quantified. When the scatter of themodel output due to the model error (model uncertainty)and the uncertain input parameters (parameter uncertain-ty) is lower, then the model prediction is more reliable.
The scale of the model quality varies significantly be-tween the uncracked stage and the crack formation stageas well as between the stabilized cracking stage and the
Fig. 6. Load level dependency of model uncertainty and parameter uncer-tainty for material models
(a)
(b)
(c)
Fig. 7. Load level dependency of total uncertainty and model quality for material models
(a)
(b)
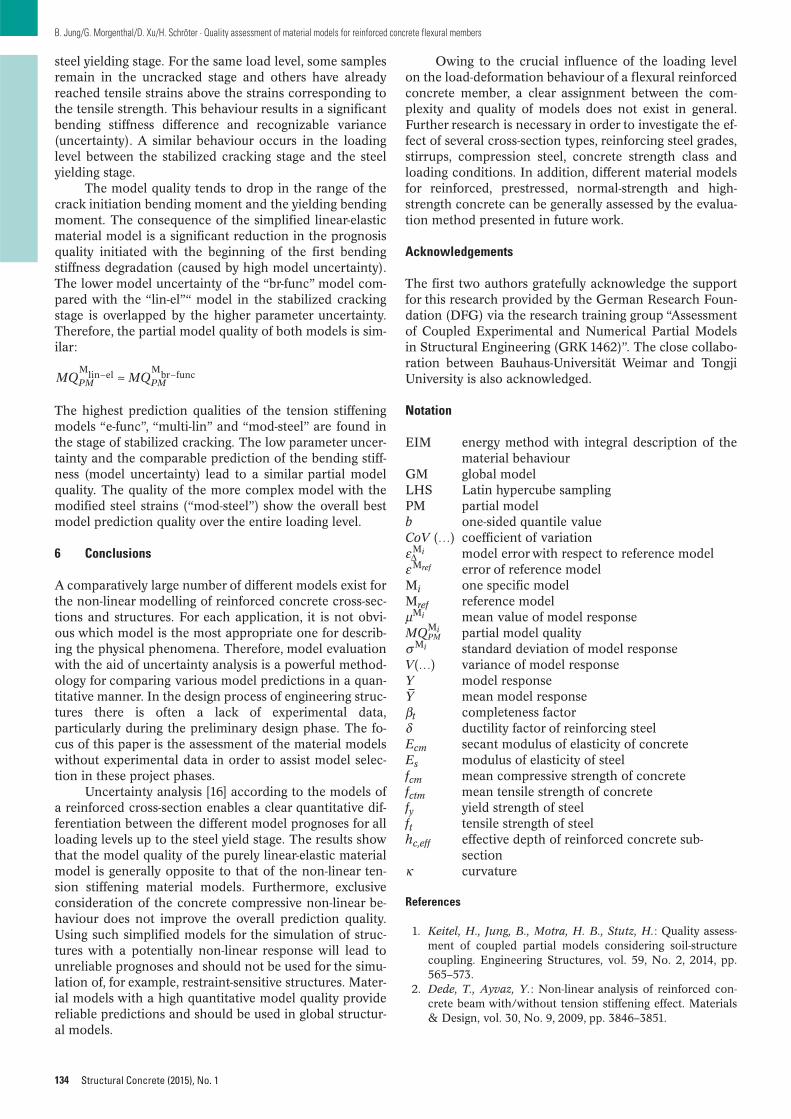
steel yielding stage. For the same load level, some samplesremain in the uncracked stage and others have alreadyreached tensile strains above the strains corresponding tothe tensile strength. This behaviour results in a significantbending stiffness difference and recognizable variance(uncertainty). A similar behaviour occurs in the loadinglevel between the stabilized cracking stage and the steelyielding stage.
The model quality tends to drop in the range of thecrack initiation bending moment and the yielding bendingmoment. The consequence of the simplified linear-elasticmaterial model is a significant reduction in the prognosisquality initiated with the beginning of the first bendingstiffness degradation (caused by high model uncertainty).The lower model uncertainty of the “br-func” model com-pared with the “lin-el”“ model in the stabilized crackingstage is overlapped by the higher parameter uncertainty.Therefore, the partial model quality of both models is sim-ilar:
The highest prediction qualities of the tension stiffeningmodels “e-func”, “multi-lin” and “mod-steel” are found inthe stage of stabilized cracking. The low parameter uncer-tainty and the comparable prediction of the bending stiff-ness (model uncertainty) lead to a similar partial modelquality. The quality of the more complex model with themodified steel strains (“mod-steel”) show the overall bestmodel prediction quality over the entire loading level.
6 Conclusions
A comparatively large number of different models exist forthe non-linear modelling of reinforced concrete cross-sec-tions and structures. For each application, it is not obvi-ous which model is the most appropriate one for describ-ing the physical phenomena. Therefore, model evaluationwith the aid of uncertainty analysis is a powerful method-ology for comparing various model predictions in a quan-titative manner. In the design process of engineering struc-tures there is often a lack of experimental data,particularly during the preliminary design phase. The fo-cus of this paper is the assessment of the material modelswithout experimental data in order to assist model selec-tion in these project phases.
Uncertainty analysis [16] according to the models ofa reinforced cross-section enables a clear quantitative dif-ferentiation between the different model prognoses for allloading levels up to the steel yield stage. The results showthat the model quality of the purely linear-elastic materialmodel is generally opposite to that of the non-linear ten-sion stiffening material models. Furthermore, exclusiveconsideration of the concrete compressive non-linear be-haviour does not improve the overall prediction quality.Using such simplified models for the simulation of struc-tures with a potentially non-linear response will lead tounreliable prognoses and should not be used for the simu-lation of, for example, restraint-sensitive structures. Mater-ial models with a high quantitative model quality providereliable predictions and should be used in global structur-al models.
Mlin el
Mbr funcMQ MQPM PM
134
B. Jung/G. Morgenthal/D. Xu/H. Schröter · Quality assessment of material models for reinforced concrete flexural members
Structural Concrete (2015), No. 1
Owing to the crucial influence of the loading levelon the load-deformation behaviour of a flexural reinforcedconcrete member, a clear assignment between the com-plexity and quality of models does not exist in general.Further research is necessary in order to investigate the ef-fect of several cross-section types, reinforcing steel grades,stirrups, compression steel, concrete strength class andloading conditions. In addition, different material modelsfor reinforced, prestressed, normal-strength and high-strength concrete can be generally assessed by the evalua-tion method presented in future work.
Acknowledgements
The first two authors gratefully acknowledge the supportfor this research provided by the German Research Foun-dation (DFG) via the research training group “Assessmentof Coupled Experimental and Numerical Partial Modelsin Structural Engineering (GRK 1462)”. The close collabo-ration between Bauhaus-Universität Weimar and TongjiUniversity is also acknowledged.
Notation
EIM energy method with integral description of thematerial behaviour
GM global modelLHS Latin hypercube samplingPM partial modelb one-sided quantile valueCoV (…) coefficient of variationεΔMi model error with respect to reference modelεMref error of reference modelMi one specific modelMref reference modelμMi mean value of model responseMQMi
PM partial model qualityσMi standard deviation of model responseV(…) variance of model responseY model responseY–
mean model responseβt completeness factorδ ductility factor of reinforcing steelEcm secant modulus of elasticity of concreteEs modulus of elasticity of steelfcm mean compressive strength of concretefctm mean tensile strength of concretefy yield strength of steelft tensile strength of steelhc,eff effective depth of reinforced concrete sub -
sectionκ curvature
References
1. Keitel, H., Jung, B., Motra, H. B., Stutz, H.: Quality assess-ment of coupled partial models considering soil-structurecoupling. Engineering Structures, vol. 59, No. 2, 2014, pp.565–573.
2. Dede, T., Ayvaz, Y.: Non-linear analysis of reinforced con-crete beam with/without tension stiffening effect. Materials& Design, vol. 30, No. 9, 2009, pp. 3846–3851.
135
B. Jung/G. Morgenthal/D. Xu/H. Schröter · Quality assessment of material models for reinforced concrete flexural members
Structural Concrete (2015), No. 1
3. Tsang, S. W., Chu, L. Y.: An experimental study of the Ten-sion Stiffening effect on the structural stiffness of ReinforcedConcrete Cantilevered Balcony Structures using resonantfrequency measurement approach. Construction and Build-ing Materials, vol. 25, No. 5, 2011, pp. 2690–2699.
4. Wu, H. Q., Gilbert, R. I.: Modeling short-term tension stiff-ening in reinforced concrete prisms using a continuum-based finite element model. Engineering Structures, vol. 31,No. 10, 2009, pp. 2380–2391.
5. Jung, B., Morgenthal, G, Xu, D.: Integrative SensitivityAnalysis Applied to Semi-Integral Concrete Bridges. Journalof Bridge Engineering, vol. 19, No. 6, 04014014, 2014.
6. United States Environmental Protection Agency: Guidanceon the Development, Evaluation, and Application of Envi-ronmental Models. Council for Regulatory EnvironmentalModeling, 2009.
7. Oberkampf, W. L., Helton, J. C., Joslyn, C. A., Wojtkiewicz,S. F., Ferson, S.: Challenge problems: uncertainty in systemresponse given uncertain parameters. Reliability Engineering& System Safety, vol. 85, No. 1–3, 2004, pp. 11–19.
8. Willems, P.: Model uncertainty analysis by variance decom-position. Physics and Chemistry of the Earth, Parts A/B/C,vol. 42–44, 2012, pp. 21–30.
9. Nilson, T., Aven, T.: Models and model uncertainty in thecontext of risk analysis. Reliability Engineering & SystemSafety, vol. 79, 2003, pp. 309–317.
10. Ferson, S., Joslyn, C. A., Helton, J. C., Oberkampf, W. L.,Sentz, K.: Summary from the epistemic uncertainty work-shop: consensus amid diversity. Reliability Engineering &System Safety, vol. 85, No. 1–3, 2004, pp. 355–369.
11. Durga Rao, K., Kushwaha, H. S., Verma, A. K., Srividya, A.K.: Quantification of epistemic and aleatory uncertainties inlevel-1 probabilistic safety assessment studies. Reliability En-gineering & System Safety, vol. 92, No. 7, 2007, pp. 947–956.
12. Hermans, E., van den Bossche, F., Wets, G.: Uncertainty as-sessment of the road safety index. Reliability Engineering &System Safety, vol. 94, No. 7, 2009, pp. 1220–1228.
13. Riley, M. E., Grandhi, R. V.: Quantification of model-formand predictive uncertainty for multi-physics simulation.Computers & Structures, vol. 89, No. 11/12, 2011, pp.1206–1213.
14. Leamer, E. E.: Specification searches: Ad hoc inference withnonexperimental data. Wiley series in probability and math-ematical statistics, Wiley, New York, 1978.
15. Zio, E., Apostolakis, G. E.: Two methods for the structuredassessment of model uncertainty by experts in performanceassessments of radioactive waste repositories. Reliability En-gineering & System Safety, vol. 54, 1996, pp. 225–241.
16. Most, T.: Assessment of structural simulation models by esti-mating uncertainties due to model selection and model sim-plification. Computers & Structures, vol. 89 No. 17/18, 2011,pp. 1664–1672.
17. Dempster, A. P.: A generalization of Bayesian inference.Journal of the Royal Statistical Society, Series B (Method-ological), vol. 30, 1968, pp. 205–247.
18. Shafer, G.: A mathematical theory of evidence. PrincetonUniv. Press, 1976.
19. Park, I., Grandhi, R. V.: Quantification of model-form andparametric uncertainty using evidence theory. StructuralSafety, vol. 39, 2012, pp. 44–51.
20. MacKay, M. D., Beckham, R. J., Conover, W. J.: Comparisonof three Methods for Selecting Values of Input Variables inthe Analysis of Output from a Computer. Technometrics,vol. 21, 1979, pp. 239–245.
21. Iman, R. L., Conover, W. J.: Small sample sensitivity analysistechniques for computer models with an application to riskassessment. Communications in Statistics – Theory andMethods, vol. 17, No. A9, 1980, pp. 1749–1842.
22. Montgomery, D. C., Runger, G. C.: Applied statistics andprobability for engineers, 3rd ed., Wiley, New York/Chich-ester, 2003.
23. Kiureghian, A. D., Ditlevsen, Q.: Aleatory or epistemic?Does it matter? Structural Safety, vol. 31, No. 2, 2009, pp.105–112.
24. Keitel, H.: Evaluation Methods for Prediction Quality ofConcrete Creep Models. PhD thesis, Univ. press, Weimar,2012.
25. Raue, E.: Non-linear analysis of composite cross-sections bynon-linear optimization. Proceedings of Modern BuildingMaterials, Structures and Techniques, Vilnius GediminasTechnical University, 2007.
26. Raue, E.: Nichtlineare Querschnittsanalyse als Optimierung-sproblem (Non-linear analysis of cross-sections as an optimi-sation problem). Bautechnik, vol. 82, No. 11, 2005, pp.796–809 (in German).
27. German Institute for Standardisation: DIN EN 1992-1-1:2011-01: Eurocode 2: Design of concrete structures – Part1-1: General rules and rules for buildings, Beuth, Berlin,2011.
28. International Federation for Structural Concrete: ModelCode 2010, final draft, Bulletin vol. 65/66, International Fed-eration for Structural Concrete, Lausanne, 2012.
29. German Institute for Standardisation: DIN EN 1992-1-1/NA:2011-01: National Annex – Eurocode 2: Design of con-crete structures – Part 1-1: General rules and rules for build-ings, Beuth, Berlin, 2011.
30. Pölling, R.: Eine praxisnahe, schädigungsorientierte Materi-albeschreibung von Stahlbeton für Strukturanalysen, PhDthesis, Ruhr-Universität Bochum, 2001.
31. Comité Euro-International du Béton: CEB-FIP model code1990, design code. Telford, 1993.
32. German Board for Reinforced Concrete: Comments accord-ing DIN 1045-1, 2nd, rev. ed. Beuth, 2010.
33. Zilch, K., Zehetmaier, G.: Bemessung im konstruktiven Be-tonbau: Nach DIN 1045-1 (Fassung 2008) und EN 1992-1-1(Eurocode 2), 2nd ed., Springer, Berlin, 2010.
34. Quast, U.: Zur Auswahl eines geeigneten Verfahrens für dieBerücksichtigung der Mitwirkung des Betons auf Zug (Onthe selection of an adequate method for considering the con-tribution of concrete in tension). Bautechnik, vol. 87, No. 7,2010, pp. 397–403 (in German).
35. Balázs, G. L. et al.: Design for SLS according to fib ModelCode 2010. Structural Concrete, vol. 14, No. 2, 2013, pp.99–123.
36. Cervenka, V.: Reliability-based non-linear analysis accordingto fib Model Code 2010. Structural Concrete, vol. 14, No. 1,2013, pp. 19–28.
37. Allaix, D. L., Carbone, V. I., Mancini, G.: Global safety for-mat for non-linear analysis of reinforced concrete structures.Structural Concrete, vol. 14, No. 1, 2013, pp. 29–42.
38. Tue, N.-T., Schenck, G., Schwarz, J.: Absicherung der statis-tisch erhobenen Festbetonkennwerte für die neue Normen-generation, Fraunhofer-IRB-Verlag, Stuttgart, 2005.
39. Strauss, A., Bergmeister, K., März, S.: Zuverlässigkeitsbetra-chtung exzentrisch belasteter Stahlbetonstützen (ReliabilityAssessment of Eccentric loaded Columns). Beton- undStahlbetonbau, vol. 102, No. 4, 2007, pp. 223–230 (in Ger-man).
40. Faber, M., Vrouwenvelder, T.: Probabilistic Model Code,12th draft, Joint Committee on Structural Safety, 2001.
41. Alavizadeh-Farhang, A.: Concrete structures subjected tocombined mechanical and thermal loading, PhD thesis, Roy-al Institute of Technology, Stockholm, 2000.

Guido Morgenthal, Prof. Dr.Institute of Modelling & Simulation of StructuresBauhaus-Universität WeimarMarinenstr. 13, 99421 Weimar, [email protected]
Bastian Jung, PhD studentResearch Training Group 1462Bauhaus-Universität WeimarBerkaer Str. 9, 99425 Weimar, GermanyTel.: +49 (0) 3643 584107Fax: +49 (0) 3643 [email protected]
136
B. Jung/G. Morgenthal/D. Xu/H. Schröter · Quality assessment of material models for reinforced concrete flexural members
Structural Concrete (2015), No. 1
Dong Xu, Prof. PhDDepartment of Bridge EngineeringTongji UniversityShanghai 200092, 1239 Siping Road, PR [email protected]
Hendrik Schröter, PhD studentInstitute of Modelling & Simulation of StructuresBauhaus-Universität WeimarMarinenstr. 13, 99421 Weimar, [email protected]
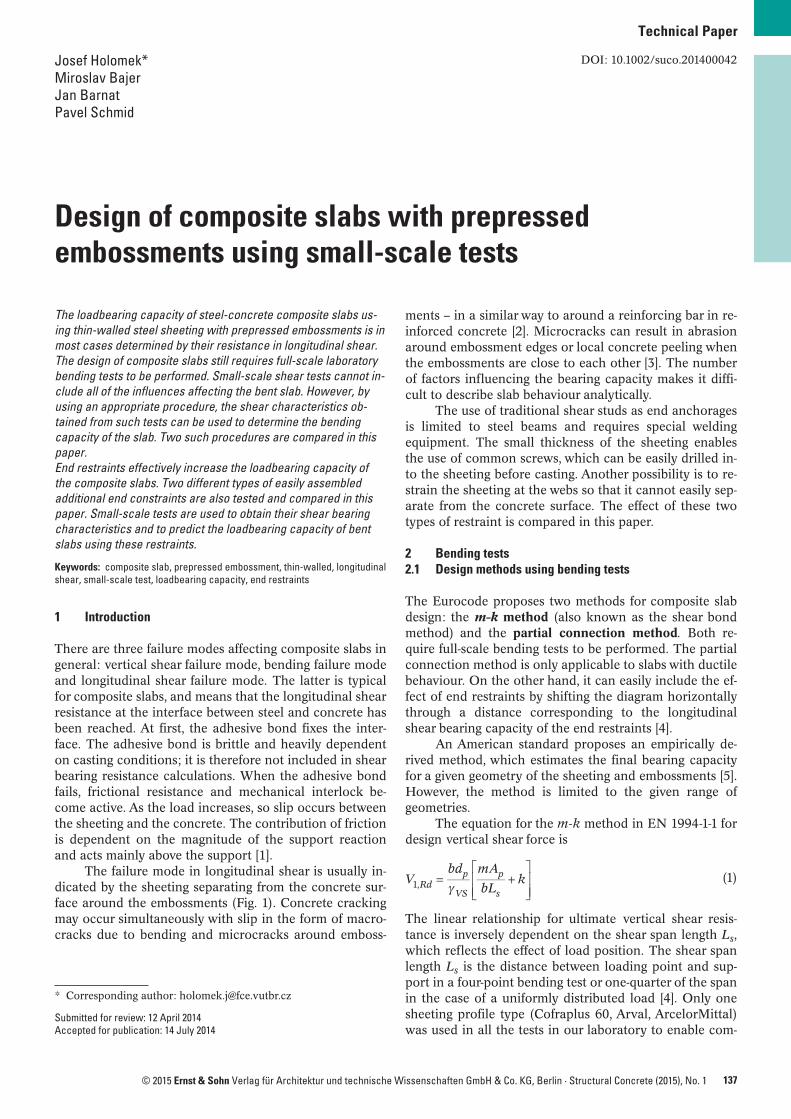
137© 2015 Ernst & Sohn Verlag für Architektur und technische Wissenschaften GmbH & Co. KG, Berlin · Structural Concrete (2015), No. 1
The loadbearing capacity of steel-concrete composite slabs us-ing thin-walled steel sheeting with prepressed embossments is inmost cases determined by their resistance in longitudinal shear.The design of composite slabs still requires full-scale laboratorybending tests to be performed. Small-scale shear tests cannot in-clude all of the influences affecting the bent slab. However, byusing an appropriate procedure, the shear characteristics ob-tained from such tests can be used to determine the bending capacity of the slab. Two such procedures are compared in thispaper.End restraints effectively increase the loadbearing capacity ofthe composite slabs. Two different types of easily assembled additional end constraints are also tested and compared in thispaper. Small-scale tests are used to obtain their shear bearingcharacteristics and to predict the loadbearing capacity of bentslabs using these restraints.
Keywords: composite slab, prepressed embossment, thin-walled, longitudinalshear, small-scale test, loadbearing capacity, end restraints
1 Introduction
There are three failure modes affecting composite slabs ingeneral: vertical shear failure mode, bending failure modeand longitudinal shear failure mode. The latter is typicalfor composite slabs, and means that the longitudinal shearresistance at the interface between steel and concrete hasbeen reached. At first, the adhesive bond fixes the inter-face. The adhesive bond is brittle and heavily dependenton casting conditions; it is therefore not included in shearbearing resistance calculations. When the adhesive bondfails, frictional resistance and mechanical interlock be-come active. As the load increases, so slip occurs betweenthe sheeting and the concrete. The contribution of frictionis dependent on the magnitude of the support reactionand acts mainly above the support [1].
The failure mode in longitudinal shear is usually in-dicated by the sheeting separating from the concrete sur-face around the embossments (Fig. 1). Concrete crackingmay occur simultaneously with slip in the form of macro -cracks due to bending and microcracks around emboss-
ments – in a similar way to around a reinforcing bar in re-inforced concrete [2]. Microcracks can result in abrasionaround embossment edges or local concrete peeling whenthe embossments are close to each other [3]. The numberof factors influencing the bearing capacity makes it diffi-cult to describe slab behaviour analytically.
The use of traditional shear studs as end anchoragesis limited to steel beams and requires special weldingequipment. The small thickness of the sheeting enablesthe use of common screws, which can be easily drilled in-to the sheeting before casting. Another possibility is to re-strain the sheeting at the webs so that it cannot easily sep-arate from the concrete surface. The effect of these twotypes of restraint is compared in this paper.
2 Bending tests2.1 Design methods using bending tests
The Eurocode proposes two methods for composite slabdesign: the m-k method (also known as the shear bondmethod) and the partial connection method. Both re-quire full-scale bending tests to be performed. The partialconnection method is only applicable to slabs with ductilebehaviour. On the other hand, it can easily include the ef-fect of end restraints by shifting the diagram horizontallythrough a distance corresponding to the longitudinalshear bearing capacity of the end restraints [4].
An American standard proposes an empirically de-rived method, which estimates the final bearing capacityfor a given geometry of the sheeting and embossments [5].However, the method is limited to the given range ofgeometries.
The equation for the m-k method in EN 1994-1-1 fordesign vertical shear force is
(1)
The linear relationship for ultimate vertical shear resis-tance is inversely dependent on the shear span length Ls,which reflects the effect of load position. The shear spanlength Ls is the distance between loading point and sup-port in a four-point bending test or one-quarter of the spanin the case of a uniformly distributed load [4]. Only onesheeting profile type (Cofraplus 60, Arval, ArcelorMittal)was used in all the tests in our laboratory to enable com-
1,Vbd mA
bLkRd
p
VS
p
s
Technical Paper
Design of composite slabs with prepressedembossments using small-scale tests
Josef Holomek*Miroslav BajerJan BarnatPavel Schmid
DOI: 10.1002/suco.201400042
* Corresponding author: [email protected]
Submitted for review: 12 April 2014Accepted for publication: 14 July 2014
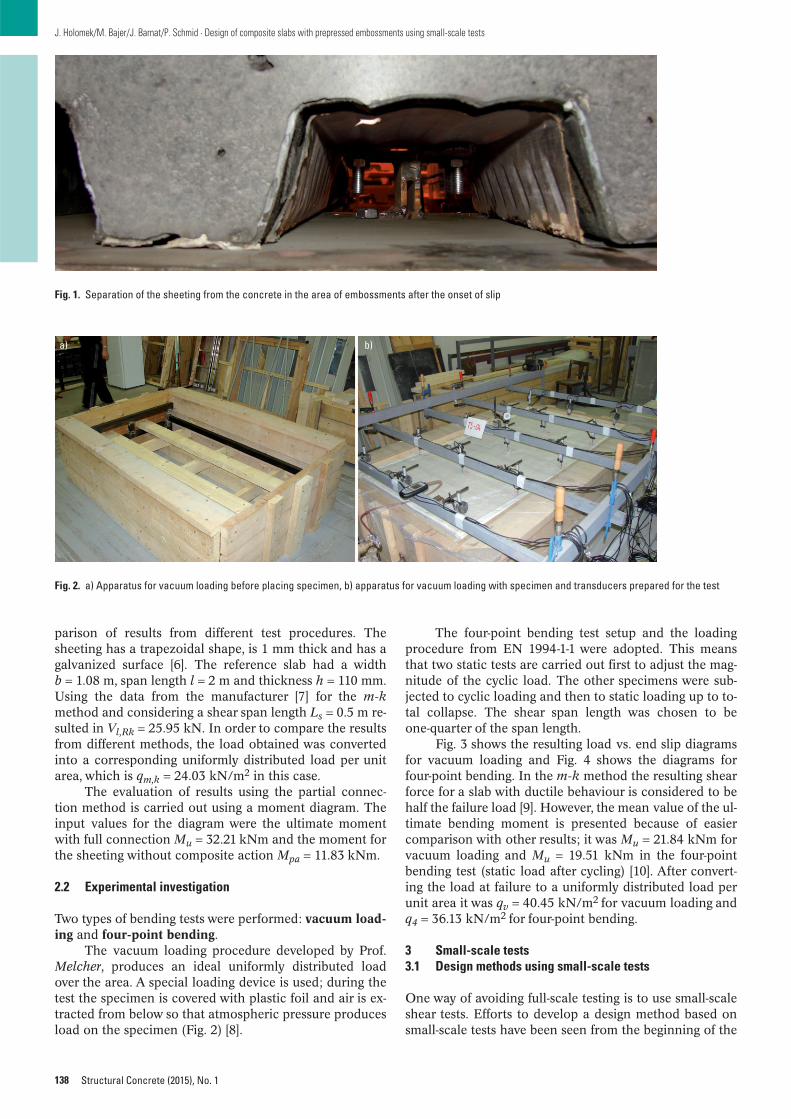
parison of results from different test procedures. Thesheeting has a trapezoidal shape, is 1 mm thick and has agalvanized surface [6]. The reference slab had a widthb = 1.08 m, span length l = 2 m and thickness h = 110 mm.Using the data from the manufacturer [7] for the m-kmethod and considering a shear span length Ls = 0.5 m re-sulted in Vl,Rk = 25.95 kN. In order to compare the resultsfrom different methods, the load obtained was convertedinto a corresponding uniformly distributed load per unitarea, which is qm,k = 24.03 kN/m2 in this case.
The evaluation of results using the partial connec-tion method is carried out using a moment diagram. Theinput values for the diagram were the ultimate momentwith full connection Mu = 32.21 kNm and the moment forthe sheeting without composite action Mpa = 11.83 kNm.
2.2 Experimental investigation
Two types of bending tests were performed: vacuum load-ing and four-point bending.
The vacuum loading procedure developed by Prof.Melcher, produces an ideal uniformly distributed loadover the area. A special loading device is used; during thetest the specimen is covered with plastic foil and air is ex-tracted from below so that atmospheric pressure producesload on the specimen (Fig. 2) [8].
138
J. Holomek/M. Bajer/J. Barnat/P. Schmid · Design of composite slabs with prepressed embossments using small-scale tests
Structural Concrete (2015), No. 1
The four-point bending test setup and the loadingprocedure from EN 1994-1-1 were adopted. This meansthat two static tests are carried out first to adjust the mag-nitude of the cyclic load. The other specimens were sub-jected to cyclic loading and then to static loading up to to-tal collapse. The shear span length was chosen to beone-quarter of the span length.
Fig. 3 shows the resulting load vs. end slip diagramsfor vacuum loading and Fig. 4 shows the diagrams forfour-point bending. In the m-k method the resulting shearforce for a slab with ductile behaviour is considered to behalf the failure load [9]. However, the mean value of the ul-timate bending moment is presented because of easiercomparison with other results; it was Mu = 21.84 kNm forvacuum loading and Mu = 19.51 kNm in the four-pointbending test (static load after cycling) [10]. After convert-ing the load at failure to a uniformly distributed load perunit area it was qv = 40.45 kN/m2 for vacuum loading andq4 = 36.13 kN/m2 for four-point bending.
3 Small-scale tests3.1 Design methods using small-scale tests
One way of avoiding full-scale testing is to use small-scaleshear tests. Efforts to develop a design method based onsmall-scale tests have been seen from the beginning of the
Fig. 1. Separation of the sheeting from the concrete in the area of embossments after the onset of slip
Fig. 2. a) Apparatus for vacuum loading before placing specimen, b) apparatus for vacuum loading with specimen and transducers prepared for the test
a) b)
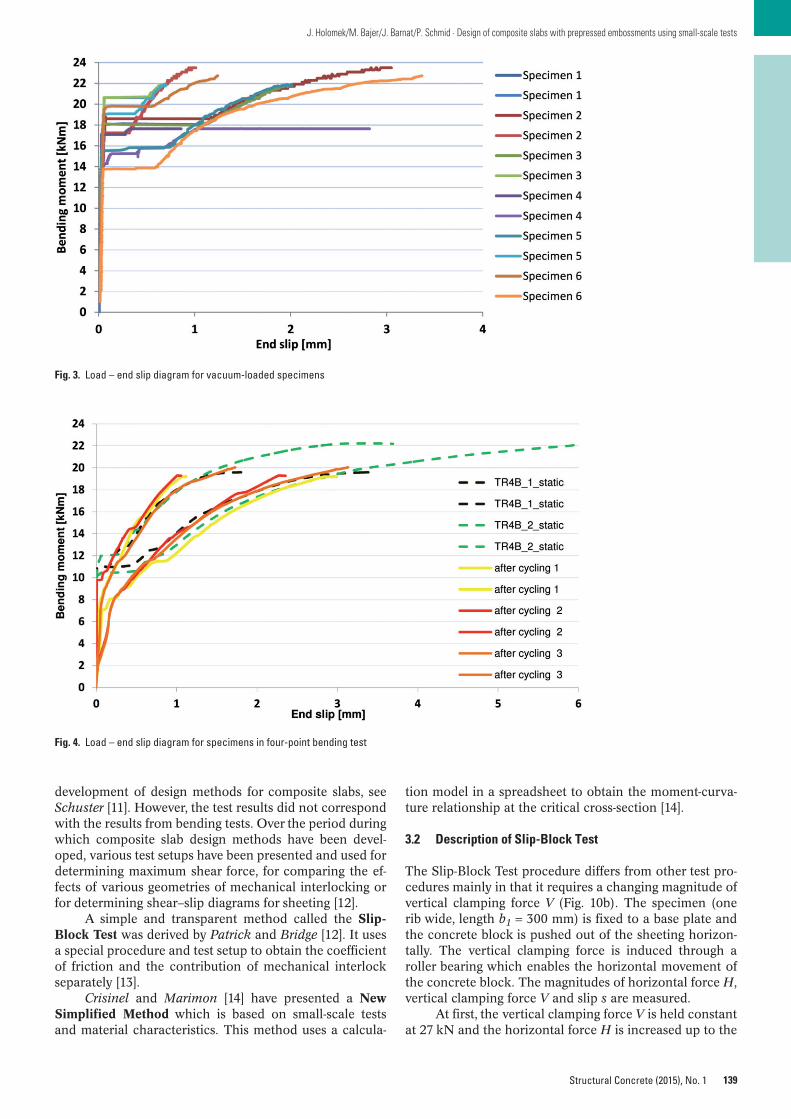
139
J. Holomek/M. Bajer/J. Barnat/P. Schmid · Design of composite slabs with prepressed embossments using small-scale tests
Structural Concrete (2015), No. 1
development of design methods for composite slabs, seeSchuster [11]. However, the test results did not correspondwith the results from bending tests. Over the period duringwhich composite slab design methods have been devel-oped, various test setups have been presented and used fordetermining maximum shear force, for comparing the ef-fects of various geometries of mechanical interlocking orfor determining shear–slip diagrams for sheeting [12].
A simple and transparent method called the Slip-Block Test was derived by Patrick and Bridge [12]. It usesa special procedure and test setup to obtain the coefficientof friction and the contribution of mechanical interlockseparately [13].
Crisinel and Marimon [14] have presented a NewSimplified Method which is based on small-scale testsand material characteristics. This method uses a calcula-
tion model in a spreadsheet to obtain the moment-curva-ture relationship at the critical cross-section [14].
3.2 Description of Slip-Block Test
The Slip-Block Test procedure differs from other test pro-cedures mainly in that it requires a changing magnitude ofvertical clamping force V (Fig. 10b). The specimen (onerib wide, length b1 = 300 mm) is fixed to a base plate andthe concrete block is pushed out of the sheeting horizon-tally. The vertical clamping force is induced through aroller bearing which enables the horizontal movement ofthe concrete block. The magnitudes of horizontal force H,vertical clamping force V and slip s are measured.
At first, the vertical clamping force V is held constantat 27 kN and the horizontal force H is increased up to the
Fig. 3. Load – end slip diagram for vacuum-loaded specimens
Fig. 4. Load – end slip diagram for specimens in four-point bending test
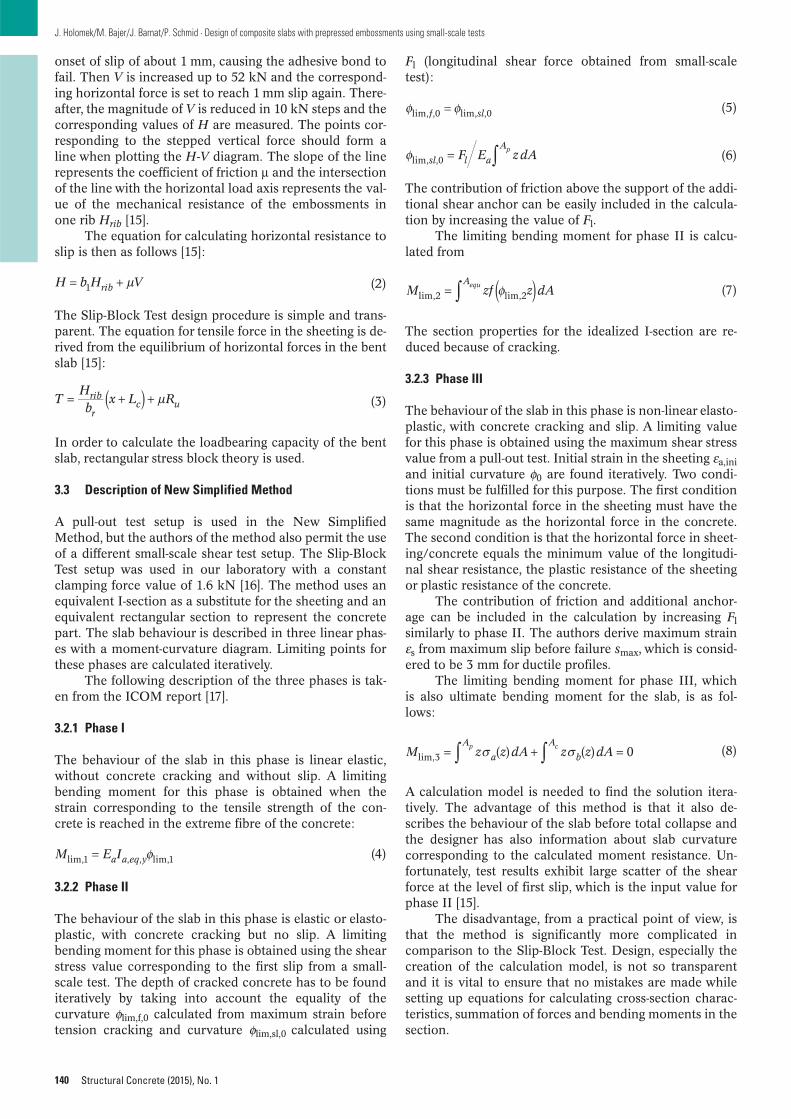
onset of slip of about 1 mm, causing the adhesive bond tofail. Then V is increased up to 52 kN and the correspond-ing horizontal force is set to reach 1 mm slip again. There-after, the magnitude of V is reduced in 10 kN steps and thecorresponding values of H are measured. The points cor-responding to the stepped vertical force should form aline when plotting the H-V diagram. The slope of the linerepresents the coefficient of friction μ and the intersectionof the line with the horizontal load axis represents the val-ue of the mechanical resistance of the embossments inone rib Hrib [15].
The equation for calculating horizontal resistance toslip is then as follows [15]:
(2)
The Slip-Block Test design procedure is simple and trans-parent. The equation for tensile force in the sheeting is de-rived from the equilibrium of horizontal forces in the bentslab [15]:
(3)
In order to calculate the loadbearing capacity of the bentslab, rectangular stress block theory is used.
3.3 Description of New Simplified Method
A pull-out test setup is used in the New SimplifiedMethod, but the authors of the method also permit the useof a different small-scale shear test setup. The Slip-BlockTest setup was used in our laboratory with a constantclamping force value of 1.6 kN [16]. The method uses anequivalent I-section as a substitute for the sheeting and anequivalent rectangular section to represent the concretepart. The slab behaviour is described in three linear phas-es with a moment-curvature diagram. Limiting points forthese phases are calculated iteratively.
The following description of the three phases is tak-en from the ICOM report [17].
3.2.1 Phase I
The behaviour of the slab in this phase is linear elastic,without concrete cracking and without slip. A limitingbending moment for this phase is obtained when thestrain corresponding to the tensile strength of the con-crete is reached in the extreme fibre of the concrete:
(4)
3.2.2 Phase II
The behaviour of the slab in this phase is elastic or elasto-plastic, with concrete cracking but no slip. A limitingbending moment for this phase is obtained using the shearstress value corresponding to the first slip from a small-scale test. The depth of cracked concrete has to be founditeratively by taking into account the equality of the curvature φlim,f,0 calculated from maximum strain beforetension cracking and curvature φlim,sl,0 calculated using
lim,1 , , lim,1M E Ia a eq y
THb
x L Rrib
rc u
1H b H Vrib
140
J. Holomek/M. Bajer/J. Barnat/P. Schmid · Design of composite slabs with prepressed embossments using small-scale tests
Structural Concrete (2015), No. 1
Fl (longitudinal shear force obtained from small-scaletest):
(5)
(6)
The contribution of friction above the support of the addi-tional shear anchor can be easily included in the calcula-tion by increasing the value of Fl.
The limiting bending moment for phase II is calcu-lated from
(7)
The section properties for the idealized I-section are re-duced because of cracking.
3.2.3 Phase III
The behaviour of the slab in this phase is non-linear elasto-plastic, with concrete cracking and slip. A limiting valuefor this phase is obtained using the maximum shear stressvalue from a pull-out test. Initial strain in the sheeting εa,iniand initial curvature φ0 are found iteratively. Two condi-tions must be fulfilled for this purpose. The first conditionis that the horizontal force in the sheeting must have thesame magnitude as the horizontal force in the concrete.The second condition is that the horizontal force in sheet-ing/concrete equals the minimum value of the longitudi-nal shear resistance, the plastic resistance of the sheetingor plastic resistance of the concrete.
The contribution of friction and additional anchor-age can be included in the calculation by increasing Flsimilarly to phase II. The authors derive maximum strainεs from maximum slip before failure smax, which is consid-ered to be 3 mm for ductile profiles.
The limiting bending moment for phase III, whichis also ultimate bending moment for the slab, is as fol-lows:
(8)
A calculation model is needed to find the solution itera-tively. The advantage of this method is that it also de-scribes the behaviour of the slab before total collapse andthe designer has also information about slab curvaturecorresponding to the calculated moment resistance. Un-fortunately, test results exhibit large scatter of the shearforce at the level of first slip, which is the input value forphase II [15].
The disadvantage, from a practical point of view, isthat the method is significantly more complicated in comparison to the Slip-Block Test. Design, especially thecreation of the calculation model, is not so transparentand it is vital to ensure that no mistakes are made whilesetting up equations for calculating cross-section charac-teristics, summation of forces and bending moments in thesection.
( ) ( ) 0lim,3M z z dA z z dAa
A
b
Ap c
lim,2 lim,2M zf z dAAequ
lim, ,0 F E zdAsl l a
Ap
lim, ,0 lim, ,0f sl
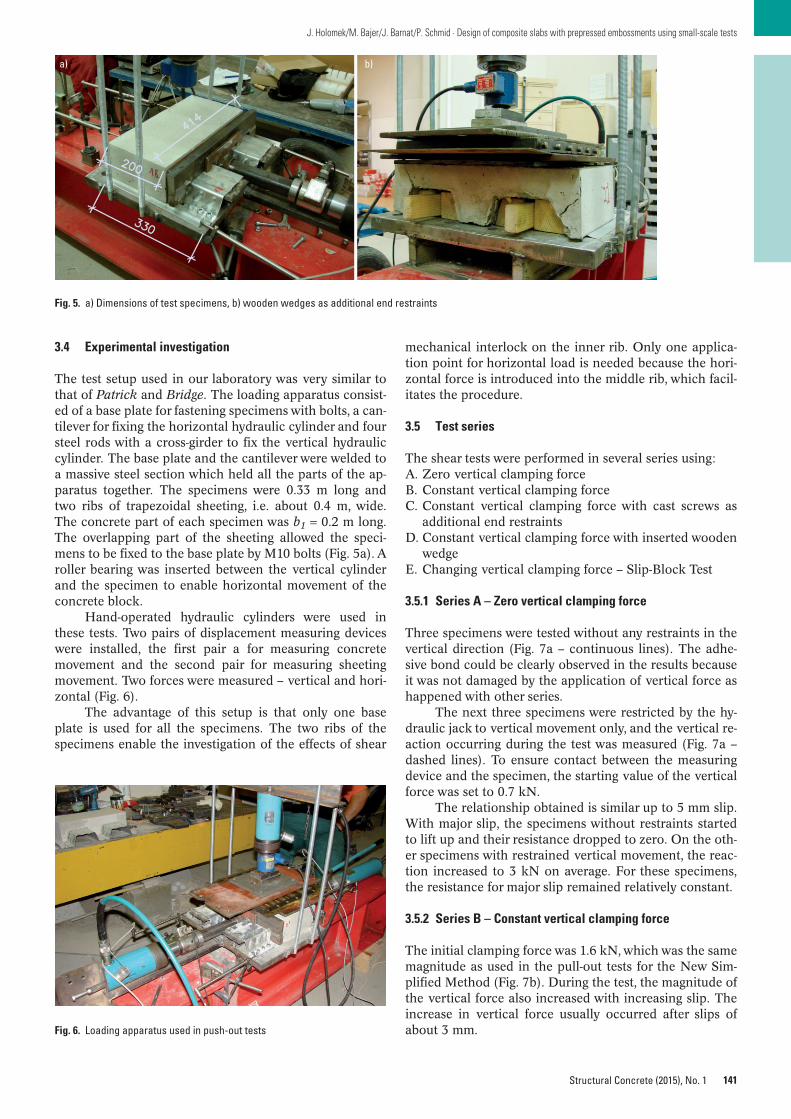
141
J. Holomek/M. Bajer/J. Barnat/P. Schmid · Design of composite slabs with prepressed embossments using small-scale tests
Structural Concrete (2015), No. 1
3.4 Experimental investigation
The test setup used in our laboratory was very similar tothat of Patrick and Bridge. The loading apparatus consist-ed of a base plate for fastening specimens with bolts, a can-tilever for fixing the horizontal hydraulic cylinder and foursteel rods with a cross-girder to fix the vertical hydrauliccylinder. The base plate and the cantilever were welded toa massive steel section which held all the parts of the ap-paratus together. The specimens were 0.33 m long andtwo ribs of trapezoidal sheeting, i.e. about 0.4 m, wide.The concrete part of each specimen was b1 = 0.2 m long.The overlapping part of the sheeting allowed the speci-mens to be fixed to the base plate by M10 bolts (Fig. 5a). Aroller bearing was inserted between the vertical cylinderand the specimen to enable horizontal movement of theconcrete block.
Hand-operated hydraulic cylinders were used inthese tests. Two pairs of displacement measuring deviceswere installed, the first pair a for measuring concretemovement and the second pair for measuring sheetingmovement. Two forces were measured – vertical and hori-zontal (Fig. 6).
The advantage of this setup is that only one baseplate is used for all the specimens. The two ribs of thespecimens enable the investigation of the effects of shear
mechanical interlock on the inner rib. Only one applica-tion point for horizontal load is needed because the hori-zontal force is introduced into the middle rib, which facil-itates the procedure.
3.5 Test series
The shear tests were performed in several series using:A. Zero vertical clamping forceB. Constant vertical clamping forceC. Constant vertical clamping force with cast screws as
additional end restraintsD. Constant vertical clamping force with inserted wooden
wedgeE. Changing vertical clamping force – Slip-Block Test
3.5.1 Series A – Zero vertical clamping force
Three specimens were tested without any restraints in thevertical direction (Fig. 7a – continuous lines). The adhe-sive bond could be clearly observed in the results becauseit was not damaged by the application of vertical force ashappened with other series.
The next three specimens were restricted by the hy-draulic jack to vertical movement only, and the vertical re-action occurring during the test was measured (Fig. 7a –dashed lines). To ensure contact between the measuringdevice and the specimen, the starting value of the verticalforce was set to 0.7 kN.
The relationship obtained is similar up to 5 mm slip.With major slip, the specimens without restraints startedto lift up and their resistance dropped to zero. On the oth-er specimens with restrained vertical movement, the reac-tion increased to 3 kN on average. For these specimens,the resistance for major slip remained relatively constant.
3.5.2 Series B – Constant vertical clamping force
The initial clamping force was 1.6 kN, which was the samemagnitude as used in the pull-out tests for the New Sim-plified Method (Fig. 7b). During the test, the magnitude ofthe vertical force also increased with increasing slip. Theincrease in vertical force usually occurred after slips ofabout 3 mm.
Fig. 5. a) Dimensions of test specimens, b) wooden wedges as additional end restraints
a) b)
Fig. 6. Loading apparatus used in push-out tests
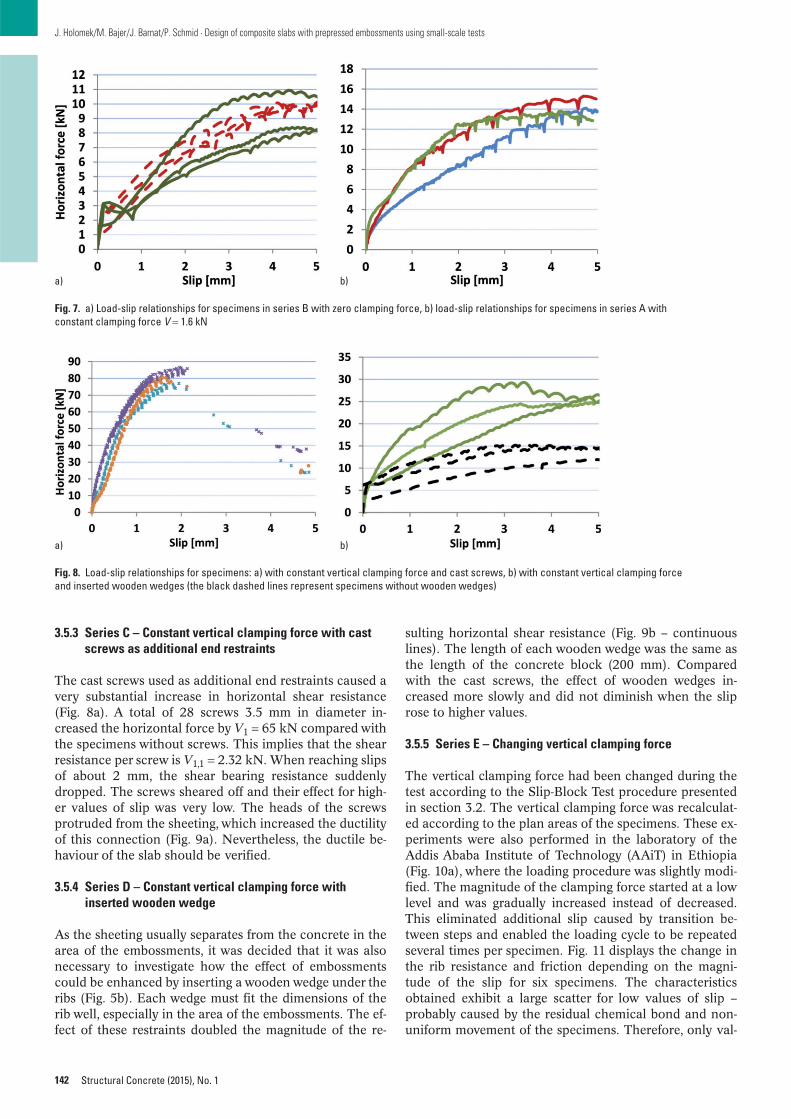
3.5.3 Series C – Constant vertical clamping force with castscrews as additional end restraints
The cast screws used as additional end restraints caused avery substantial increase in horizontal shear resistance(Fig. 8a). A total of 28 screws 3.5 mm in diameter in-creased the horizontal force by V1 = 65 kN compared withthe specimens without screws. This implies that the shearresistance per screw is V1,1 = 2.32 kN. When reaching slipsof about 2 mm, the shear bearing resistance suddenlydropped. The screws sheared off and their effect for high-er values of slip was very low. The heads of the screwsprotruded from the sheeting, which increased the ductilityof this connection (Fig. 9a). Nevertheless, the ductile be-haviour of the slab should be verified.
3.5.4 Series D – Constant vertical clamping force withinserted wooden wedge
As the sheeting usually separates from the concrete in thearea of the embossments, it was decided that it was alsonecessary to investigate how the effect of embossmentscould be enhanced by inserting a wooden wedge under theribs (Fig. 5b). Each wedge must fit the dimensions of therib well, especially in the area of the embossments. The ef-fect of these restraints doubled the magnitude of the re-
142
J. Holomek/M. Bajer/J. Barnat/P. Schmid · Design of composite slabs with prepressed embossments using small-scale tests
Structural Concrete (2015), No. 1
sulting horizontal shear resistance (Fig. 9b – continuouslines). The length of each wooden wedge was the same asthe length of the concrete block (200 mm). Comparedwith the cast screws, the effect of wooden wedges in-creased more slowly and did not diminish when the sliprose to higher values.
3.5.5 Series E – Changing vertical clamping force
The vertical clamping force had been changed during thetest according to the Slip-Block Test procedure presentedin section 3.2. The vertical clamping force was recalculat-ed according to the plan areas of the specimens. These ex-periments were also performed in the laboratory of theAddis Ababa Institute of Technology (AAiT) in Ethiopia(Fig. 10a), where the loading procedure was slightly modi-fied. The magnitude of the clamping force started at a lowlevel and was gradually increased instead of decreased.This eliminated additional slip caused by transition be-tween steps and enabled the loading cycle to be repeatedseveral times per specimen. Fig. 11 displays the change inthe rib resistance and friction depending on the magni-tude of the slip for six specimens. The characteristics obtained exhibit a large scatter for low values of slip –probably caused by the residual chemical bond and non-uniform movement of the specimens. Therefore, only val-
Fig. 7. a) Load-slip relationships for specimens in series B with zero clamping force, b) load-slip relationships for specimens in series A with constant clamping force V = 1.6 kN
a) b)
Fig. 8. Load-slip relationships for specimens: a) with constant vertical clamping force and cast screws, b) with constant vertical clamping force and inserted wooden wedges (the black dashed lines represent specimens without wooden wedges)
a) b)
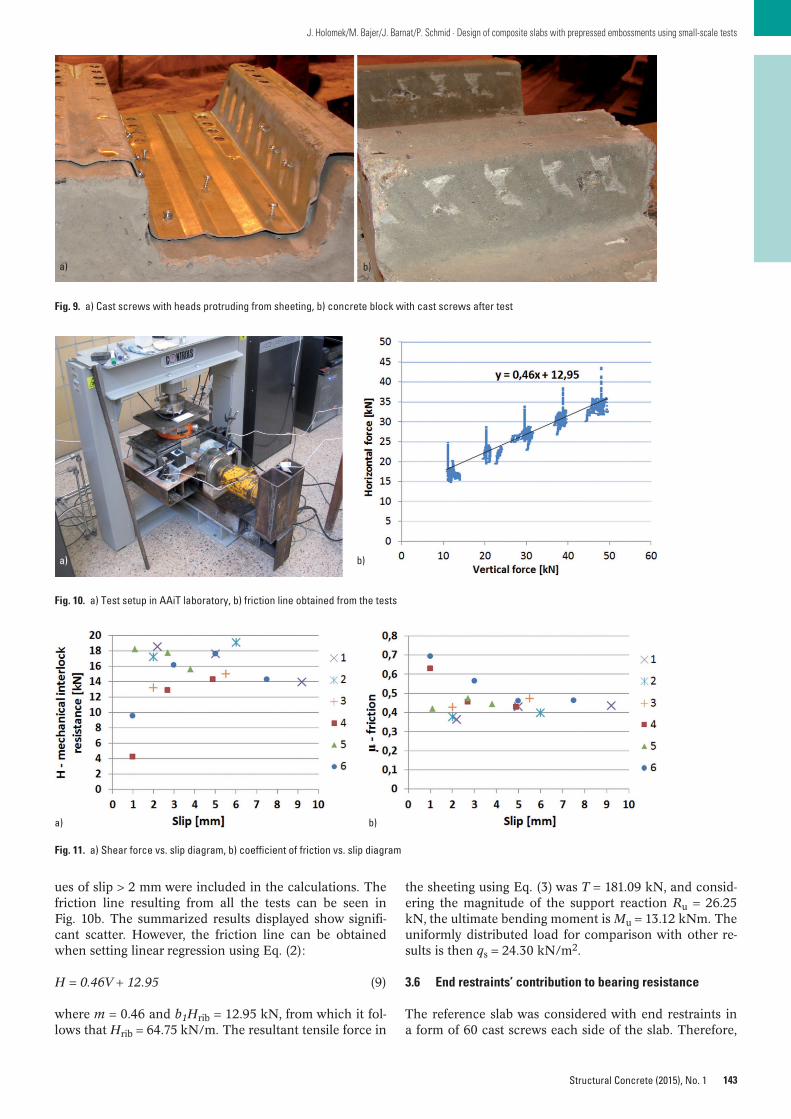
143
J. Holomek/M. Bajer/J. Barnat/P. Schmid · Design of composite slabs with prepressed embossments using small-scale tests
Structural Concrete (2015), No. 1
ues of slip > 2 mm were included in the calculations. Thefriction line resulting from all the tests can be seen inFig. 10b. The summarized results displayed show signifi-cant scatter. However, the friction line can be obtainedwhen setting linear regression using Eq. (2):
H = 0.46V + 12.95 (9)
where m = 0.46 and b1Hrib = 12.95 kN, from which it fol-lows that Hrib = 64.75 kN/m. The resultant tensile force in
the sheeting using Eq. (3) was T = 181.09 kN, and consid-ering the magnitude of the support reaction Ru = 26.25kN, the ultimate bending moment is Mu = 13.12 kNm. Theuniformly distributed load for comparison with other re-sults is then qs = 24.30 kN/m2.
3.6 End restraints’ contribution to bearing resistance
The reference slab was considered with end restraints ina form of 60 cast screws each side of the slab. Therefore,
Fig. 9. a) Cast screws with heads protruding from sheeting, b) concrete block with cast screws after test
a) b)
Fig. 10. a) Test setup in AAiT laboratory, b) friction line obtained from the tests
a) b)
Fig. 11. a) Shear force vs. slip diagram, b) coefficient of friction vs. slip diagram
a) b)
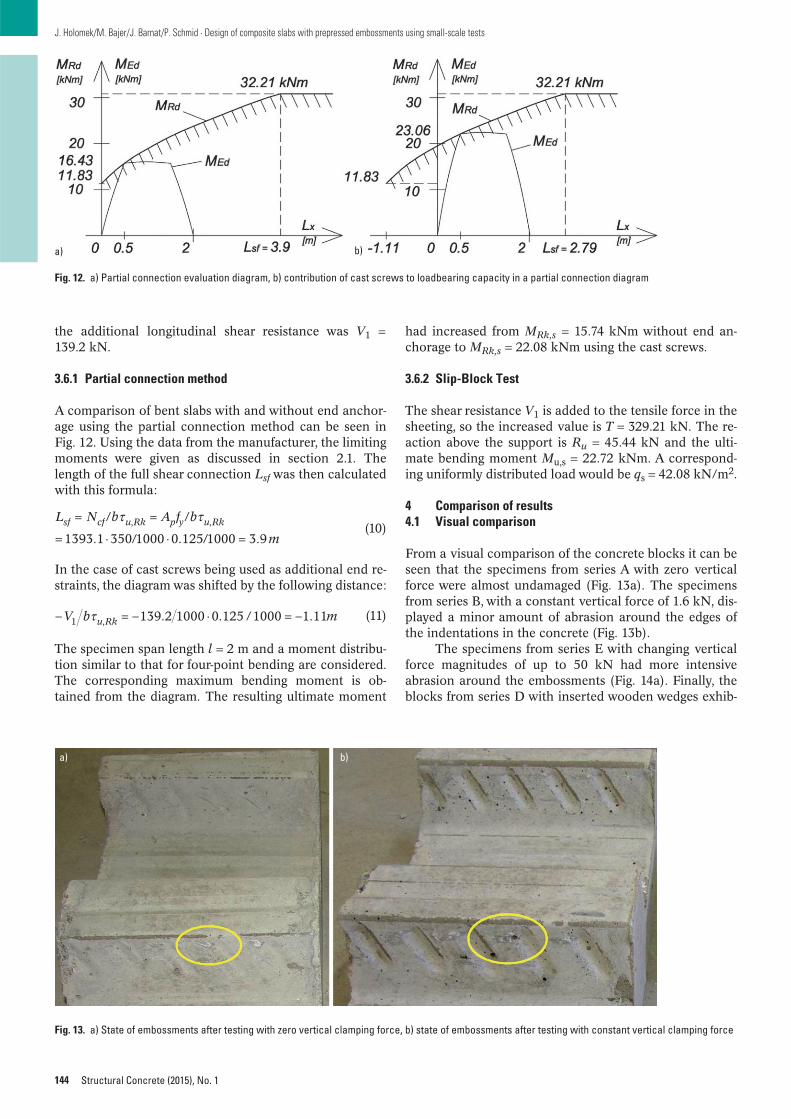
the additional longitudinal shear resistance was V1 =139.2 kN.
3.6.1 Partial connection method
A comparison of bent slabs with and without end anchor-age using the partial connection method can be seen inFig. 12. Using the data from the manufacturer, the limitingmoments were given as discussed in section 2.1. Thelength of the full shear connection Lsf was then calculatedwith this formula:
(10)
In the case of cast screws being used as additional end re-straints, the diagram was shifted by the following distance:
(11)
The specimen span length l = 2 m and a moment distribu-tion similar to that for four-point bending are considered.The corresponding maximum bending moment is ob-tained from the diagram. The resulting ultimate moment
139.2 1000 0.125 /1000 1.111 ,V b mu Rk
/ /
1393.1 350/1000 0.125/1000 3.9, ,L N b A f b
msf cf u Rk p y u Rk
144
J. Holomek/M. Bajer/J. Barnat/P. Schmid · Design of composite slabs with prepressed embossments using small-scale tests
Structural Concrete (2015), No. 1
had increased from MRk,s = 15.74 kNm without end an-chorage to MRk,s = 22.08 kNm using the cast screws.
3.6.2 Slip-Block Test
The shear resistance V1 is added to the tensile force in thesheeting, so the increased value is T = 329.21 kN. The re-action above the support is Ru = 45.44 kN and the ulti-mate bending moment Mu,s = 22.72 kNm. A correspond-ing uniformly distributed load would be qs = 42.08 kN/m2.
4 Comparison of results4.1 Visual comparison
From a visual comparison of the concrete blocks it can beseen that the specimens from series A with zero verticalforce were almost undamaged (Fig. 13a). The specimensfrom series B, with a constant vertical force of 1.6 kN, dis-played a minor amount of abrasion around the edges ofthe indentations in the concrete (Fig. 13b).
The specimens from series E with changing verticalforce magnitudes of up to 50 kN had more intensive abrasion around the embossments (Fig. 14a). Finally, theblocks from series D with inserted wooden wedges exhib-
Fig. 12. a) Partial connection evaluation diagram, b) contribution of cast screws to loadbearing capacity in a partial connection diagram
b)a)
Fig. 13. a) State of embossments after testing with zero vertical clamping force, b) state of embossments after testing with constant vertical clamping force
b)a)
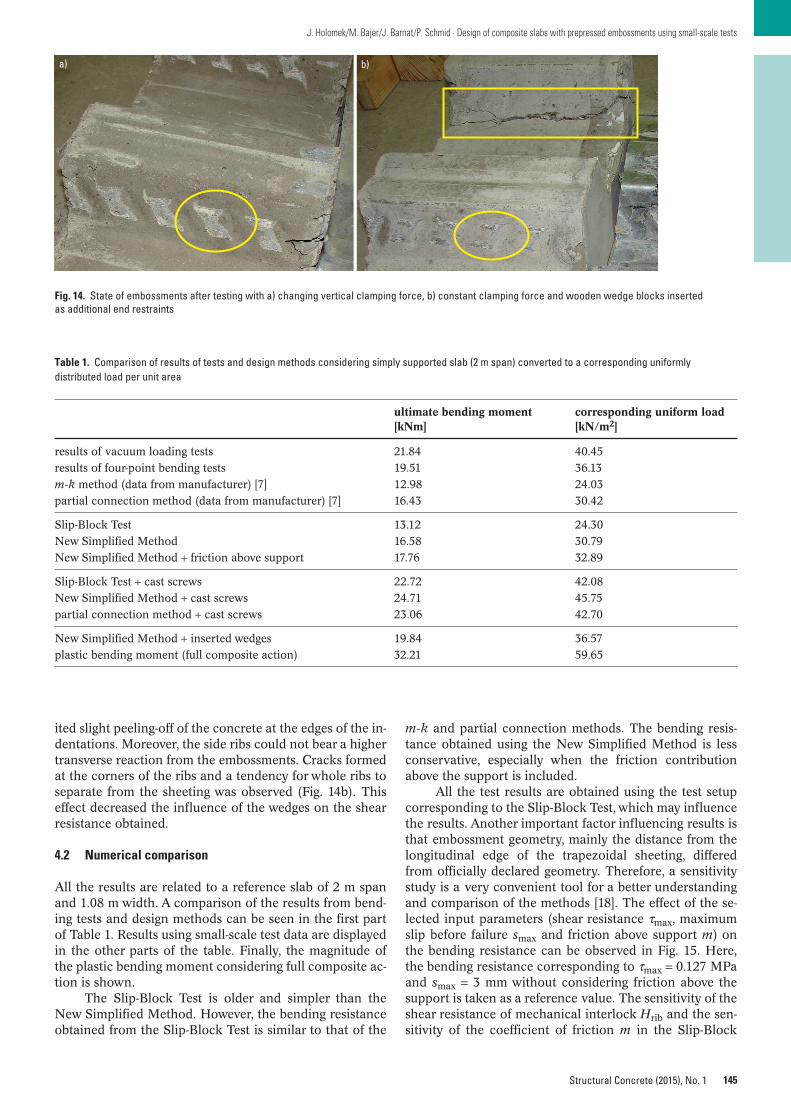
145
J. Holomek/M. Bajer/J. Barnat/P. Schmid · Design of composite slabs with prepressed embossments using small-scale tests
Structural Concrete (2015), No. 1
ited slight peeling-off of the concrete at the edges of the in-dentations. Moreover, the side ribs could not bear a highertransverse reaction from the embossments. Cracks formedat the corners of the ribs and a tendency for whole ribs toseparate from the sheeting was observed (Fig. 14b). Thiseffect decreased the influence of the wedges on the shearresistance obtained.
4.2 Numerical comparison
All the results are related to a reference slab of 2 m spanand 1.08 m width. A comparison of the results from bend-ing tests and design methods can be seen in the first partof Table 1. Results using small-scale test data are displayedin the other parts of the table. Finally, the magnitude ofthe plastic bending moment considering full composite ac-tion is shown.
The Slip-Block Test is older and simpler than theNew Simplified Method. However, the bending resistanceobtained from the Slip-Block Test is similar to that of the
m-k and partial connection methods. The bending resis-tance obtained using the New Simplified Method is lessconservative, especially when the friction contributionabove the support is included.
All the test results are obtained using the test setupcorresponding to the Slip-Block Test, which may influencethe results. Another important factor influencing results isthat embossment geometry, mainly the distance from thelongitudinal edge of the trapezoidal sheeting, differedfrom officially declared geometry. Therefore, a sensitivitystudy is a very convenient tool for a better understandingand comparison of the methods [18]. The effect of the se-lected input parameters (shear resistance τmax, maximumslip before failure smax and friction above support m) onthe bending resistance can be observed in Fig. 15. Here,the bending resistance corresponding to τmax = 0.127 MPaand smax = 3 mm without considering friction above thesupport is taken as a reference value. The sensitivity of theshear resistance of mechanical interlock Hrib and the sen-sitivity of the coefficient of friction m in the Slip-Block
Table 1. Comparison of results of tests and design methods considering simply supported slab (2 m span) converted to a corresponding uniformly distributed load per unit area
ultimate bending moment corresponding uniform load [kNm] [kN/m2]
results of vacuum loading tests 21.84 40.45
results of four-point bending tests 19.51 36.13
m-k method (data from manufacturer) [7] 12.98 24.03
partial connection method (data from manufacturer) [7] 16.43 30.42
Slip-Block Test 13.12 24.30
New Simplified Method 16.58 30.79
New Simplified Method + friction above support 17.76 32.89
Slip-Block Test + cast screws 22.72 42.08
New Simplified Method + cast screws 24.71 45.75
partial connection method + cast screws 23.06 42.70
New Simplified Method + inserted wedges 19.84 36.57
plastic bending moment (full composite action) 32.21 59.65
Fig. 14. State of embossments after testing with a) changing vertical clamping force, b) constant clamping force and wooden wedge blocks inserted as additional end restraints
b)a)
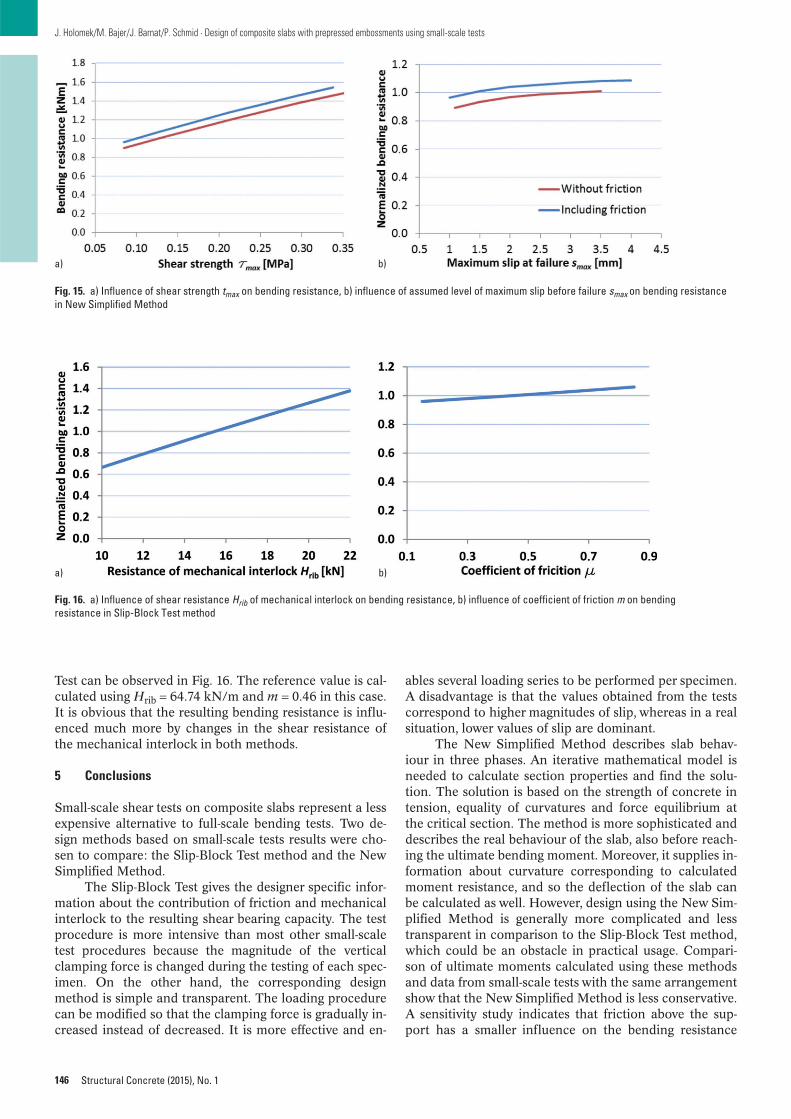
Test can be observed in Fig. 16. The reference value is cal-culated using Hrib = 64.74 kN/m and m = 0.46 in this case.It is obvious that the resulting bending resistance is influ-enced much more by changes in the shear resistance ofthe mechanical interlock in both methods.
5 Conclusions
Small-scale shear tests on composite slabs represent a lessexpensive alternative to full-scale bending tests. Two de-sign methods based on small-scale tests results were cho-sen to compare: the Slip-Block Test method and the NewSimplified Method.
The Slip-Block Test gives the designer specific infor-mation about the contribution of friction and mechanicalinterlock to the resulting shear bearing capacity. The testprocedure is more intensive than most other small-scaletest procedures because the magnitude of the verticalclamping force is changed during the testing of each spec-imen. On the other hand, the corresponding designmethod is simple and transparent. The loading procedurecan be modified so that the clamping force is gradually in-creased instead of decreased. It is more effective and en-
146
J. Holomek/M. Bajer/J. Barnat/P. Schmid · Design of composite slabs with prepressed embossments using small-scale tests
Structural Concrete (2015), No. 1
ables several loading series to be performed per specimen.A disadvantage is that the values obtained from the testscorrespond to higher magnitudes of slip, whereas in a realsituation, lower values of slip are dominant.
The New Simplified Method describes slab behav-iour in three phases. An iterative mathematical model isneeded to calculate section properties and find the solu-tion. The solution is based on the strength of concrete intension, equality of curvatures and force equilibrium atthe critical section. The method is more sophisticated anddescribes the real behaviour of the slab, also before reach-ing the ultimate bending moment. Moreover, it supplies in-formation about curvature corresponding to calculatedmoment resistance, and so the deflection of the slab canbe calculated as well. However, design using the New Sim-plified Method is generally more complicated and lesstransparent in comparison to the Slip-Block Test method,which could be an obstacle in practical usage. Compari-son of ultimate moments calculated using these methodsand data from small-scale tests with the same arrangementshow that the New Simplified Method is less conservative.A sensitivity study indicates that friction above the sup-port has a smaller influence on the bending resistance
Fig. 15. a) Influence of shear strength tmax on bending resistance, b) influence of assumed level of maximum slip before failure smax on bending resistancein New Simplified Method
Fig. 16. a) Influence of shear resistance Hrib of mechanical interlock on bending resistance, b) influence of coefficient of friction m on bending resistance in Slip-Block Test method
a) b)
b)a)

147
J. Holomek/M. Bajer/J. Barnat/P. Schmid · Design of composite slabs with prepressed embossments using small-scale tests
Structural Concrete (2015), No. 1
than the shear resistance in both methods. Both designmethods enable additional end restraints to be taken intoaccount.
The performance of small-scale tests may still pre-sent a significant uncertainty. The results exhibit a largescatter, especially for the magnitude of the shear force be-fore reaching slip in the case of constant clamping force orfor low values of slip in the case of changing clampingforce. The features that ought to be specified are, for ex-ample, optimal loading speed and conditions for castingand placing the specimens for the test setup.
Two types of easily assembled end restraints are com-pared in this paper: cast screws and inserted woodenwedges. Adding a sufficient number of screws enables thebearing capacity of the sheeting with low bond to be easilyenhanced – even up to full composite action. A disadvan-tage is that it changes the behaviour of the slab from duc-tile to brittle. The ductility of the screws can be slightly in-creased by allowing their heads to protrude from the slab.
Inserting wooden wedges comes from the idea thatthe shear bearing capacity of the indentations in concreteis usually unused, as can be observed from visual compar-isons. By filling the ribs in the area above the support it ispossible to prevent the sheeting from separating from theconcrete surface. The loadbearing capacity of a slab withprepressed embossments can be effectively increased inthis way. Inserting wooden wedges increases the shearbearing capacity while preserving ductile behaviour.
Acknowledgements
This paper has been worked out under the projectNo. LO1408 “AdMaS UP – Advanced Materials, Struc-tures and Technologies”, supported by Ministry of Educa-tion, Youth and Sports under the “National SustainabilityProgramme I” and under the project FAST-J-13-1918 andFAST-S-13-2077.
Notation
Ap cross-sectional area of sheetingAc cross-sectional area of concreteAequ cross-sectional area of equivalent sectionEa modulus of elasticity of steelFl longitudinal shear resistance of sheetingHrib rib resistance per unit length due to mechanical
interlockIa,eq,y moment of inertia of equivalent sectionLs shear span lengthLsf limiting length for full composite actionMlim,1 limiting bending moment for phase IMlim,2 limiting bending moment for phase IIMlim,3 limiting bending moment for phase IIINc longitudinal shear force in partial composite
actionNcf longitudinal shear force in full composite actionRu ultimate vertical reaction at end support per unit
width of slabVl additional longitudinal shear resistance from end
anchoringb slab widthb1 length of slip block specimen
br average steel rib spacingdp distance from top of sheeting to centroid of effec-
tive area of steel sheetingfy yield strengthx + Lc shear span length (including length beyond sup-
port)z vertical coordinate of cross-sectiongVS partial safety factorφlim,1 limiting curvature for phase Iφlim,f,0 limiting curvature calculated from maximum ten-
sile strain before cracking (phase II)φlim,sl,0 limiting curvature calculated using shear resis-
tance of sheeting (phase II)μ coefficient of frictionσa longitudinal stress in sheetingσb longitudinal stress in concreteτmax maximum longitudinal shear strength for New
Simplified Methodτu,Rk longitudinal shear strength for partial connection
method (characteristic value)
References
1. Patrick, M., Poh, W.: Parameters affecting the design and be-haviour of composite slabs. IABSE reports, Zurich, 60, 1990,pp. 220–225.
2. Maekawa, K., Okamura, H., Pimanmas, A.: Non-Linear Me-chanics of Reinforced Concrete. CRC Press, 2003, p. 768.
3. Ferrer, M., Marimon, F., Crisinel, M.: Designing cold-formedsteel sheets for composite slabs: An experimentally validatedFEM approach to slip failure mechanics. Thin-Walled Struc-tures, vol. 44, No. 12, Elsevier, 2001, p. 1261–1271.
4. European Convention for Constructional Steelwork (ECCS):Design Manual for Composite Slabs, No. 87, Brussels, 1995.
5. ANSI/SDI T-CD-2011: Test Standard for Composite SteelDeck – Slabs. Steel Deck Institute, 2012, available athttp://www.sdi.org/publications-2/standards/
6. CSTB Technical report Cofraplus 60, 3/03-390, PAB,ARCELOR Group, 32 rue Gambetta BP 62, F-59264 On-naing, 2004, pp. 27–34.
7. Cofraplus 60. Statické tabulky, Arval ArcelorMittal Con-struction Solutions, Biskupsky dvu° r 7, 110 00 Praha 1, CzechRepublic, available at: http:// ds. arcelor mittal. com / construc-tion/arval_easterneurope/10642/10643/language / CZ
8. Melcher, J.: Full-Scale Testing of Steel and Timber Struc-tures: Examples and Experience, Structural Assessment –The Role of Large and Full Scale Testing, K. S. Virdi et al.(eds.), E&FN SPON, London, 1997, pp. 301–308.
9. European Convention for Constructional Steelwork (ECCS):Longitudinal Shear Resistance of Composite Slabs: Evalua-tion of Existing Tests, Brussels, 1998.
10. Holomek, J., Bajer, M.: Experimental and Numerical Investi-gation of Composite Action of Steel Concrete Slab. ProcediaEngineering, Elsevier, vol. 40, 2012, pp. 143–147.
11. Abdullah, R.: Experimental Evaluation and Analytical Mod-eling of Shear Bond in Composite Slabs. Dissertation, Vir-ginia Polytechnic Institute & State University, Blacksburg,2004.
12. Patrick, M., Bridge, R.: Review of Concepts ConcerningBond of Steel Decking. 12th Intl. Specialty Conf. on Cold-Formed Steel Structures, St. Louis, Missouri, 1994.
13. Patrick, M., Poh, W.: Controlled test for composite slab designparameters. IABSE reports, Zurich, 60, 1990, pp. 227–231.
14. Crisinel, M., Marimon, F.: A new simplified method for thedesign of composite slabs. Journal of Constructional SteelResearch, 60, 2004, pp. 481–491.

15. Patrick, M., Bridge, R.: Partial shear connection design ofcomposite slabs. Engineering Structures, vol. 16, No. 5,1994, pp. 348–362.
16. Crisinel, M., Edder, P.: New Method for the Design of Com-posite Slabs. Composite Construction in Steel and ConcreteV, 2006, pp. 166–177.
17. Guignard, P., Schumacher, A., Crisinel, M.: Etude des dallesmixtes et développement d’une méthode de calcul basée surla relation moment-courbure. ICOM REPORT, Lausanne,2003.
18. Kala, Z., Kala J.: Sensitivity Analysis of Stability Problems ofSteel Columns using Shell Finite Elements and NonlinearComputation Methods. Proc. of 17th Intl. Conf. on Engi-neering Mechanics, Svratka, Czech Republic, 2011, pp.271–274.
Josef Holomek, PhD studentInstitute of Metal & Timber StructuresFaculty of Civil EngineeringBrno University of TechnologyVeveri 331/95, 602 00 Brno, Czech RepublicTel. [email protected] (corresponding author)
148
J. Holomek/M. Bajer/J. Barnat/P. Schmid · Design of composite slabs with prepressed embossments using small-scale tests
Structural Concrete (2015), No. 1
Pavel Schmid, Assoc. ProfessorInstitute of Building TestingFaculty of Civil EngineeringBrno University of TechnologyVeveri 331/95, 602 00 Brno, Czech RepublicTel. [email protected]
Miroslav Bajer, Assoc. ProfessorInstitute of Metal & Timber StructuresFaculty of Civil EngineeringBrno University of TechnologyVeveri 331/95, 602 00 Brno, Czech RepublicTel. [email protected]
Jan Barnat, AssistantInstitute of Metal & Timber StructuresFaculty of Civil EngineeringBrno University of TechnologyVeveri 331/95, 602 00 Brno, Czech RepublicTel. [email protected]

Structural Concrete 16 (2015), No. 1 149
fib-newsfib-news
weather conditions and standards for infrastructure need to be met to ensure inhabitants’ safety. Steel towers, pipes, storage units and all matter of buildings and bridges exist in regions where winter tempera-tures can drop below – 50 ºC. Some sections of the Eurocodes limit the use of steel to temperatures ranging from – 40 to – 50 º C, and no lower. Regrettably, these limitations could
The fib in Russia: new standards
fib-news is produced as an integral part
of the fib Journal Structural Concrete.
Contents Issue 1 (2015)
The fib in Russia: new standards 149
Worldwide representation at ACF 2014 150
DISC2014: the past and the future 151
Old for new: Penang Bridge 151
A venerable institute turns 80 152
JPEE2014 in Lisbon 152
fib MC2010 course in Brazil 153
Short notes 153
Nigel Priestley † 1943–2014 155
Congresses and symposia 156
Acknowledgement 157
A recent highway overpass in the small city of Podolsk, 15 km to the south of Moscow. The Eurocodes were used for guidance in the experimental calcula-tions for the structure Photo credit: V P Korotikhin
In 1993 the Ministry of Justice offi-cially registered the Structural Con-crete Association, the fib National Member Group for Russia. Howev-er, a true history of the association goes back as far as 1957, when the Academy of Construction and Ar-chitecture of the USSR created the Commission for Prestress Concrete, which later became the National Committee of the FIP, chaired by Professor K. Mikhailov. In 1969 the Coordinating Scientific and Techni-cal Council for concrete and rein-forced concrete was created. It was composed of delegates appointed by over 500 organizations from the Republics of the Soviet Union and established close contact with the FIP, the CEB, IASS, RILEM and other international organizations.
With the dissolution of the Soviet Union, the council was practically discontinued. For this reason, in 1991, it merged with the FIP Na-tional Committee to become the Structural Concrete Association and was reorganized again in 1999 under a new Russian law.
Since it has come into existence the Structural Concrete Associa-tion have organized nearly forty large conferences and congresses. Its major achievements are the all-
Russian (international) conferences on concrete and reinforced con-crete, supported by the fib, RILEM and the ACI, and the 59th RILEM annual meeting in Moscow. [A detailed account of the 3rd All-Rus-sian (International) Conference on Concrete and Reinforced Concrete can be found in the September 2014 issue of fib-news.]
One of the association’s main objec-tives is to implement international norms. This year the Eurocodes will be adopted in Russia.
A major benefit to the application of the codes is the ease with which European construction companies will be able to bring their own projects into Russia. Substantial sec-tions of edifices will be designed at home, thereby speeding up overall construction.
The introduction of the Eurocodes does not mean that the Russian codes will disappear in 2015; rather, the two systems will coexist, with a possible phasing out of one of them, should it become irrelevant.
One of the issues that the Euroco-des might encounter is the variety in climatic conditions in Russia. The northern territories have extreme
06_149_157_fibNews_0115.indd 149 18.02.15 10:08

150 Structural Concrete 16 (2015), No. 1
fib-news
Worldwide representation at ACF 2014
ACF 2014 (The 6th International Conference of Asian Concrete Fed-eration) was held in Korea from 21 to 24 September 2014.
The conference chair was Professor Jongsung Sim (Hanyang University) and the international organizing committee and scientific committee chairs were, respectively, Professors Manyop Han (Ajou University) and Donguk Choi (Hankyong National University).
In total, 261 papers from 27 coun-tries were submitted – the largest number received at any ACF confer-ence so far. Among the concrete institutes represented were the ACF, the ACI, the fib and RILEM.
The papers were presented in 7 par-allel sessions on 22 and 23 Septem-ber. Six categories were covered:
– Concrete structures– Concrete materials and tech- nologies– Maintenance, monitoring, repair and strengthening– Sustainability– Construction and engineering– Recent research and related topics
Twelve papers were honoured with a Best Papers Award.
The international event was a great success. The next ACF conference will be held in Hanoi, Vietnam, in 2016.
Professor Se-Jin Jeon Ajou University, Korea
The Lower Bureya hydroelectric power plant in the early stages of construction. Russian civil engi-neers have to take extreme climatic conditions into consideration Photo credit: V P Korotikhin
design and calculation software, determine which standards should be adopted first and organize work-shops for civil engineers.
The fib Model Code for Concrete Structures 2010 can play a role in the development of new national codes and the revision of exist-ing ones. We plan to translate fib MC2010 into Russian and organize special courses with the support of fib Commission 9 ‘Dissemination of knowledge’.
The year 2014 was a very produc-tive and rewarding time for us, what with the 3rd All-Russian (Interna-tional) Conference in Moscow and the 4th International Scientific-Practical Conference ‘Development of large-panel housing construction in Russia’ (InterConPan-2014) in Saint Petersburg. An ad-hoc meet-ing of fib-RILEM representatives on 13 May, at the Russian Academy of Sciences in Moscow, will make way for greater cooperation between the two organizations.
I hope that 2015 will bring prosper-ity and success to all our and your endeavours.
Professor Vyacheslav Falikman, fib Head of the Russian National Delegation
not be changed in the usual Nation-al Annexes of the Eurocodes.
Snow loads (80–560 kg/m2) are also a big problem because they can be much higher in Russia than in the north of Europe. Eighty per cent of Russian territory has saturations and floods, 80 % has dangerous slope processes, 65 % has permafrost, 40 % has particular soil conditions and 35 % lies in karst zones. The CEN has not yet given directions on how the Eurocodes and other standards may be changed for severe climatic conditions.
On the Russian side, civil engineers lack experience of the Eurocodes and will have to get used to working with them.
A last issue concerns the public availability of codes and standards in Russia. The CEN has recognized the precedence of Russian law but has specified that Russian versions of the codes should not go beyond its borders. Enforcing this will be problematic.
We hope to start long-running professional cooperation with representatives of international organizations and companies to promote Russian involvement in the next generation of codes, implement
06_149_157_fibNews_0115.indd 150 18.02.15 10:08

Structural Concrete 16 (2015), No. 1 151
fib-news
Aimed at providing practitioners with a valuable update on develop-ments in the design and construc-tion of structural concrete, the annu-al fibUK Developments in Structural Concrete 2014 seminar (DISC2014) took place on 27 November 2014 at St Martin-in-the-Fields in London. ‘Learning from the past – looking to the future’ attracted 90 delegates.
Mr Kenny Arnott gave an interna-tional perspective on reinforcement detailing past and future, covering how designers and contractors com-municate about reinforcement, the different styles of detailing (notably top bars in continuous members) and the need for standardization.
Dr Chris Burgoyne spoke about the collapse of Palau Bridge and asked why we have not been able to learn the lessons. Built in 1977 and re-paired in 1996, this bridge between two Pacific islands collapsed six weeks after repairs were completed.
Having introduced the first two speakers, Professor Steve Denton, Past Chairman of fibUK, gave a briefing on the activities of the fib and fibUK.
Mr Chris Hendy, newly inaugurated fibUK Chairman, took the chair while Dr Stuart Matthews described recent and ongoing developments in the structural assessment of build-ings and other constructed assets. Dr Matthews went through why, when and how assessment might be undertaken, a topic five fib task groups are currently addressing.
DISC2014: the past and the future
Speakers at DISC2014: Steve Denton, Chris Burgoyne, Kenny Arnott, Stuart Matthews, John Orr and Chris Hendy
Old for new: Penang Bridge
Although new bulletins are con-stantly being written to offer future solutions to current problems, past CEB, FIP and fib publications continue to be useful. When deal-ing with existing structures that need maintenance or renovation, engineers frequently turn to older bulletins to understand contempo-raneous construction choices and to find calculations that may have fallen out of use.
In a presentation given on 11 April 2013 Chris Hendy of Atkins spoke of how the consultancy turned to fib Bulletins 30, 35 and 58 for help with replacing the cable stays of the Pen-ang Bridge, the only existing fixed link between Penang Island and the mainland of Peninsular Malaysia. [A webinar of this talk is available on iStructE: http://www.istructe.org/resources-centre/webinars]
The bridge, 13.5 km long and with a span of 225 metres, was built out of reinforced concrete between 1983 and 1986. It was a typical cable-stay bridge with a twist: the stays used an experimental system of bars instead of strands. The bars were coupled together in 12-metre lengths and then encased in an outer steel tube, which was grouted up. Both the bars and casing carried load. Only the force of the bars was anchored off at the end plates and the force from the steel tubes was anchored off in bonds to the concrete. The cables were not designed to be replaceable.
There were already problems with bars and couplers breaking during construction. All the bars were test-ed to 80% of load and quite a few failed, mainly at the couplers, due to brittle failure. The solution found at the time was to inject couplers with resin. It worked in the laboratory but was harder to achieve on site.
In a 1999 study of the load, Atkins discovered that the shorter stays were heavily overstressed. The company Freyssinet installed some new bearings at the pylons to relieve
Finally, Dr John Orr advocated ef-ficiency through structural form. He showed how ‘equal strength’ beams (Rd = k · Ed everywhere) may be formed using tensile fabrics.
Questions and lively discussions followed.
Mr Charles GoodchildMPA – The Concrete Centre
The Penang Bridge, built out of reinforced concrete between 1983 and 1986, is the only existing fixed link between Penang Island and mainland Malaysia Photo credit: Cmglee
06_149_157_fibNews_0115.indd 151 18.02.15 10:08

152 Structural Concrete 16 (2015), No. 1
fib-news
The Eduardo Torroja Institute for Construction Science in Madrid celebrated its 80th anniversary in 2014. Gordon Clark, fib President, was invited to give a plenary address during the final session of the com-memorative event on 14 November. His presentation was streamed live over the Internet to an extended audience across Spain.
Mr Clark congratulated the insti-tute and spoke of Eduardo Torroja, a co-founder of both the CEB and FIP. In 1958, following the term of his friend Eugène Freyssinet, this eminent Spanish engineer became the second president of the FIP.
In his address Mr Clark also spoke of the challenges for structural concrete in the future and referred specifically to the megastructures he had seen during his presidential trips and the critical state of cer-tain infrastructures. Most will need maintenance, which will have to be carried out without causing disrup-tion.
Mr Clark’s presentation is available on YouTube: https://www.youtube.com/watch?v=iV6vcXOgBsQ
A venerable in-stitute turns 80
30 also offered valuable data for the fatigue test for these deviation devices.
During cable replacement, tempo-rary stays had to be installed. This required a number of large tempo-rary bolted fixings and fib Bulletin 58 ‘Design of anchorages in con-crete’ was instrumental in the calcu-lations for the fixings that had to be installed right next to the free edges of sections for the temporary works. It was able to give the pullout forces of the anchorages.
Installation of the new stays re-quired coring through the main deck edge girders. The cores were close to the prestressing strands in the deck transverse beams with the potential for them to be cut during coring operations. To offset damage to the post-tensioning, carbon fibre was used to strengthen the transverse beams. fib Bulletin 35 ‘Retrofitting of concrete structures by externally bonded FRPs’ significantly helped with this design.
Chris Hendy commented “The fib Bulletins offered guidance based on sound engineering principles rather than rigid and inflexible codified rules, which was exactly what was required on this project where noth-ing was standard. Their guidance was invaluable.”
fib Bulletins 30, 35 and 58 “offered guidance based on sound engineering principles rather than rigid
and inflexible codified rules,” according to Chris Hendy of Atkins
load from the short stays. Acoustic monitoring was also installed and gave indications that bars were breaking. A more detailed assess-ment in 2005 suggested that there were also fatigue problems with the cables as well as static overstressed. The bridge was not closed to traffic because analysis showed that in spite of the huge amount of dam-age it would suffer, it would remain standing if a cable failed. However, it was agreed by all relevant parties that the cables would all have to be replaced to provide a safe and serviceable future for the bridge.
Replacement of the 117 cables start-ed in 2007. The new cables were de-signed to EN 1993-1-11, which had been informed by fib Bulletin 30 ‘Acceptance of stay cable systems us-ing prestressing steels’. The bulletin aided with damping requirements and angular tolerances, among other things, but most importantly, with material specifications for polyethyl-ene sheeting.
The new cables, twice as strong as the existing ones, were also lighter and had less sag. Consequently, despite the best efforts of the de-signers and contractors, one new cable ended up misaligned with the replacement anchorage and a devia-tion device with a radius had to be created to correct the angle at which it exited the anchorage. fib Bulletin
fib President Gordon Clark was invited to make a keynote presenta-tion at the opening of JPEE2014 (5th Portuguese Conference on Structural Engineering) in Lisbon on 26 November. Mr Clark spoke about long-lasting concrete struc-tures, focussing on lessons that can be drawn from past experience to help with future projects.
The conference, organized by GPBE (the Portuguese national member group of the fib), among others, lasted three days and was very well
JPEE2014 in Lisbon
06_149_157_fibNews_0115.indd 152 18.02.15 10:08

Structural Concrete 16 (2015), No. 1 153
fib-news
Koji Sakai – Kudos
Professor Koji Sakai, the repre-sentative of the Japan Sustainability Institute (JSI), fib TC Deputy Chair (2011–2014) and Professor Emeritus of the University of British Colum-bia, received the ACI Concrete Sustainability Award during the American Concrete Institute (ACI) Fall 2014 Convention Opening Session, held in Washington DC on 26 October 2014.
The award, established in 2010, honours individuals or teams who highlight the role of concrete in sustainability.
Professor Sakai’s interest in sustain-ability can be traced back to his launching of the International Con-ference on Concrete Under Severe Conditions (CONSEC) in Sapporo, in 1995. In a paper for the work-shop that followed CONSEC95 he outlined the following tasks as future research subjects: the effec-tive use of resources, the control of CO2 emissions, the development of high-performance concrete and its utilization, the development of environmentally friendly concrete, interfaces between durability design and structural design, energy-saving construction methods and rational maintenance systems. He tackled most of the current major issues in concrete sustainability 20 years ago.
Professor Koji Sakai receives the ACI Concrete Sustainability Award from ACI President William E Rushing Jr
Short notes
fib MC2010 course in Brazil
Between 2011 and 2013, when it came to approving the fib Model Code for Concrete Structures 2010 as well as the latest version of the Brazilian Standard NBR6188 ‘Design of concrete structures’ there were intense discussions in the fib National Member Group for Brazil, composed of ABECE (Brazilian As-sociation of Structural Engineering and Consulting) and ABCIC (Brazil-ian Association of Industrialized Concrete Construction).
To stimulate further debate and find answers to some of the questions
attended, attracting 330 Portuguese and international delegates.
Mr Clark and Dr Manuel Pipa, President of GPBE, awarded the GPBE Medal of Merit to Dr João Almeida, fib Head of Delegation for Portugal (see Short notes). Several other fib members were present, including Dr Eduardo Carvalho and Professor Julio Appleton, both past presidents of GPBE.
raised, we hosted an fib MC2010 course in São Paolo on 27 and 28 November 2014.
The course was a great success thanks to the support of Professor György Balázs (former SAG 2 Con-vener, current Commission 9 Chair), the sponsorship of the companies Odebrecht and Andrade Gutierrez, the coordination of Professor Joost Walraven and the participation of Professors Aurelio Muttoni, Gi-useppe Mancini, Harald Müller and Hugo Corres. Indeed, the discus-sions were so lively that the last part of the course was cancelled so as not to disrupt them. Based on the interest shown, the Brazilian group will host future courses on related technical issues.
Such discussions contribute sig-nificantly to the advancement of technical standardization in con-crete structures in Brazil, not only for standard elements or codes of practice, but also for innovation and technological development. As a worldwide organization with operations on all the continents, the fib allows its members to connect internationally.
Mr Fernando Stucchifib Delegate for Brazil
In the foreground: Harald Müller, fib President, and Hugo Corres, fib Deputy President (both in office since January 2015) at the fib MC2010 course in São Paolo, where discussions were lively
06_149_157_fibNews_0115.indd 153 18.02.15 10:08

154 Structural Concrete 16 (2015), No. 1
fib-news
Since then Professor Sakai has organized 25 international confer-ences, workshops and forums, and given more than a hundred lectures worldwide to promote environmen-tal consciousness and sustainability in the field of concrete.
He was the chair of fib SAG8 ‘Sus-tainability initiative’ (2011–2014) and of Commission 3 ‘Environmen-tal aspects of design and construc-tion’ (2002–2010) and head of the Japanese national delegation. As well as actively leading concrete sustainability in the fib, he has insti-gated work in this field in the ACI, ISO and Asian Concrete Federation as well as in the Japan Concrete Institute.
Professor Takafumi Noguchi, University of TokyoDeputy Chair of fib Commission 7 ‘Sustainability’
Tor Ole Olsen and Tor Arne Martius-Hammer – Kudos
and notable service to the associa-tion itself and the concrete industry at large by disseminating knowledge of concrete and bringing Norway to the fore of the industry. Mr Olsen was commended for his interna-tional commitment, the number of offices he has held in various bodies and associations, his active partici-pation in organizing conferences, his valuable contributions to the industry, and the numerous publica-tions he has written and presenta-tions given.
Mr Olsen received his engineer-ing degree from the University of Toronto, Canada, in 1975, and has since worked for Dr. Techn. Olav Olsen, a consultancy founded by his father (a 1980 FIP medallist) and specializing in large onshore and offshore structures and facilities. He is currently an elected member of the fib Presidium as well as an active member of the ACI and IAB. He was Chairman of the Norwegian Concrete Association from 1995 to 1997.
A prize for his achievements in and contributions to the field of structural concrete and the Nor-wegian Concrete Association was awarded at the same ceremony to Dr Martius-Hammer. The associa-tion highlighted his assiduity within the organization and international bodies, the numerous articles he has written and his role as the managing director of COIN – Concrete Inno-vation Centre.
On 30 October 2014 the Norwegian Concrete Association (NB – Norsk Betongforening) honoured two very active members of the fib. Tor Ole Olsen received an honorary membership and Tor Arne Martius-Hammer an award for outstanding contribution.
The Norwegian Concrete Associa-tion bestows honorary membership on those who have rendered long
Tor Ole Olsen at the award ceremony for his honorary membership
Tor Arne Martius-Hammer receives an award for outstanding work
Dr Martius-Hammer received his degree in engineering from the Norwegian Institute of Technology in 1981 and his PhD in 2007. Since 1985 he has worked for the largest Scandanavian independent research institution and has led its innovation centre, COIN, for eight years. He is an active member of RILEM and is the deputy chair of fib Commis-sion 4 and the convener of fib Task Group 4.6.
João Almeida – Kudos
On 26 November 2014, during the Portuguese symposium on structural concrete held at the Portuguese Conference on Structural Engineer-ing (JPEE2014), the GPBE Medal of Merit was awarded to João Almeida.
This honour has been awarded every two years since 2000 at GPBE (Portuguese Group on Structural Concrete) national meetings in Por-tugal in recognition of outstanding contributions to the field of struc-tural concrete.
Dr Almeida is a professor at the Instituto Superior Técnico Lisboa, Portugal. In his career as structural engineer he has designed a number of major buildings and bridges.
A long-standing active member of the fib and the FIP and currently head of the Portuguese national delegation, he was the convener of
From left to right: Gordon Clark, João Almeida and Manuel Pipa at the GPBE Medal of Merit ceremony
06_149_157_fibNews_0115.indd 154 18.02.15 10:08

Structural Concrete 16 (2015), No. 1 155
fib-news
Marco Menegotto – 75th birthday
The fib wishes Marco Mene-gotto a very happy birthday.
Professor Mene-gotto received the fib Medal of Merit in 2009.
A member of various CEB, FIP and fib Commissions since 1972, he has contributed to CEB-FIP MC78 and MC90 and fib MC2010 as well as several FIP, CEB and fib reports and bulletins. From 2005 to 2014 he served as Chair of fib Commission 6 ‘Prefabrication’ and has also chaired IABSE and RILEM committees. He has contributed to CEN Structural Eurocodes and is the moderator of the CEN TC229-TC250 Ad Hoc Group.
Professor Menegotto is co-author of the most used model for steel consti-tutive law, known as the Menegotto-Pinto Model.
In 2010, after 30 years of teaching as Full Professor of Structural Engi-neering, Professor Menegotto retired from Sapienza University of Rome. Today he is Chairman of AICAP (Italian Association for Structural Concrete) and the head of the Italian delegation for the fib.
Hans-Wolf Reinhardt – 75th birthday
Congratulations to Hans-Wolf Reinhardt on his birthday. Profes-sor Reinhardt taught at the Delft University of Technology, Nether-
lands, then at the University of Technology Darmstadt, Germany, before becom-ing Dean of the Department of Civil Engi-
neering and Head of the Otto-Graf Institute of the University of Stutt-gart, Germany, in 1992. He retired officially in 2012.
Professor Reinhardt has been a very active member of the fib (and the CEB before it) and co-authored fib MC2010 and several bulletins. Outside the fib he headed the Ger-man delegation of the DIN Commit-tee Concrete Technology as part of CEN/TC 104 ‘Concrete’ preparing EN 206.
Honoured with the Emil-Mörsch Commemorative Medal in 2013, he also received an honorary doctorate from the Braunschweig University of Technology, Germany, in 2004, and an honorary professorship from Dalian University, China, in 2002.
research into the seismic behaviour of masonry structures. Nigel also studied the behaviour of reinforced concrete columns and a number of his research papers are now recognized as the basis for current understanding on the topic. From 1985 to 1986 he was the president of the New Zealand Society for Earthquake Engineering.
In 1986 Nigel was named Professor at the University of California, San Diego, and later became Professor Emeritus. During his 14 years there he conducted extensive research into the seismic design of concrete bridges and for the last three years was a visiting fellow funded by the New Zealand Earthquake Commis-sion. He left UCSD to become the co-director of the ROSE School in Pavia, Italy, where he taught courses in earthquake engineering.
Nigel received numerous honours, including honorary doctorates from ETH Zurich and UNCuyo, Argen-tina. In May 2010 he was awarded the Freyssinet Medal at the fib Con-gress in Washington DC. He was a co-author of three seismic design books: ‘Seismic Design of Concrete and Masonry Buildings’, ‘Seismic Design and Retrofit of Bridges’, and ‘Displacement-Based Seismic Design of Structures’. He was also a mem-ber of CEB Task Group 3.2: ‘Seis-mic design of reinforced concrete structures’ and co-authored Bulletin 240: ‘Seismic Design’. A fellow of the ACI, IPENZ, NZ Society for Earthquake Engineering and NZ Concrete Society, and Honorary Fellow of the Royal Society of New Zealand, he was made an Officer of the New Zealand Order of Merit in 2014 for his services to structural engineering.
He left behind his wife, Jan, his children, stepchildren and grandchil-dren.
Professor Jason InghamUniversity of Auckland
Task Group 1.1 from 1998 to 2008 and has co-authored six bulletins.
In Stockholm, in 2012, Dr Almeida was awarded the fib Medal of Merit.
Dr Manuel PipaPresident of GPBE
Nigel Priestley †1943–2014
Nigel enrolled for engineering at the University of Canterbury, New Zealand, at the age of 16 and completed his PhD at the age
of 23. He headed extensive stud-ies on bridges and buildings for 10 years at the Structures Laboratory of the Ministry of Works before return-ing to the University of Canterbury’s engineering faculty as a lecturer in 1976. There he and Professor Tom Paulay conducted comprehensive
06_149_157_fibNews_0115.indd 155 18.02.15 10:08

156 Structural Concrete 16 (2015), No. 1
fib-news
Date and location Event Main organiser Contact
24–26 February 2015 59th BetonTage FBF Betondienst GmbH [email protected] Ulm, Germany Concretes of the Future www.betontage.com
18–20 May 2015 fib Symposium: Concrete Danish Concrete Society www.fibcopenhagen2015.dkCopenhagen, Denmark innovation and design
23–24 April 2015 Deutscher Bautechnik-Tag 2015 DBV www.bautechniktag.deDüsseldorf, Germany
24–26 May 2015 5th International Symposium University of Wisconsin- www.nicom5.orgChicago, USA on Nanotechnology in Milwaukee, Northwestern Construction (NICOM5) University
1–3 July 2015 Multi-span Large Bridges Faculty of Engineering www.fe.up.pt/mslb2015Porto, Portugal University of Porto
1–2 October 2015 11th Central European Congress OBV Austrian Society for www.ccc2015.atHainburg, Austria on Concrete Engineering Construction Technology
5–7 October 2015 4th Int. Conf. on Concrete MFPA Leipzig GmbH www.iccrrr.comLeipzig, Germany Repair, Rehabilitation and University of Cape Town Retrofitting (ICCRRR 2015)
8–9 October 2015 4th Int. Workshop on Concrete MFPA Leipzig GmbH www.iccrrr.comLeipzig, Germany Spalling due to Fire Exposure TU Delft
13–15 June 2016 ICCS16 Second International Universidad Politecnica To be announcedMadrid, Spain Conference on Concrete de Madrid Sustainability
29–31 August 2016 11th fib International Ph.D. Nihon University concrete.t.u-tokyo.ac.jp/fibTokyo, Japan Symposium Tokyo University _PhD2016
12–14 September 2016 CONSEC2016 Politecnico di Milano To be announcedLecco, Italy
21–23 November 2016 fib Symposium University of Cape Town fibcapetown2016.com/Cape Town, South Africa Performance-based approaches for concrete structures
12–15 June 2017 fib Symposium fib National Member [email protected], Netherlands High tech concrete: Where Group Netherlands www.fibsymposium2017.com technology and engineering meet
6–12 October 2018 5th fib Congress and fib National Member www.fibcongress2018.com Melbourne, Australia Exhibition Group Australia
Congresses and symposia
The calendar list with fib Congresses and Symposia, co-sponsored events and, if space permits, events supported by the fib or organized by one of its na-tional member groups reflects the state of information available to the secretariat at the time of printing. The information given is subject to change.
06_149_157_fibNews_0115.indd 156 18.02.15 10:08

Structural Concrete 16 (2015), No. 1 157
fib-news
National member groups
AAHES – Asociación Argentina del Hormigón Estructural
CIA – Concrete Institute of Australia
ÖBV – Österreichische Bautech-technik Vereinigung, Austria
GBB – Groupement Belge du Bé-ton, Belgium
ABCIC – Associação Brasileira da Construção Industrializada de Concreto, Brazil
ABECE – Associação Brasileira de, Engenharia e Consultoria Estru-tural, Brazil
fib Group of CanadaCCES – China Civil Engineering
SocietyCyprus University of TechnologyCBS – Ceska Betonarska
Spolecnost, Czech RepublicDBF – Dansk Betonforening DBF,
DenmarkSuomen Betoniyhdistys R.Y., Fin-
landAFGC – Association Française de
Génie Civil, FranceDBV – Deutscher Beton- und
Bautechnik- Verein, Germany Deutscher Ausschuss für Stahlbeton
e.V., GermanyFDB – Fachvereinigung Deutscher,
Betonfertigteilbau e.V., GermanyTechnical Chamber of GreeceUniversity of Patras, GreeceHungarian Group of fibThe Institution of Engineers (India)Dept. of Technical Affairs, IranIACIE – Israeli Association of
Construction, and Infrastructure Engineers
Consiglio Nazionale delle Ricerche, Italy
JCI – Japan Concrete InstituteJPCI – Japan Prestressed Concrete
Institute Lebanese Concrete SocietyAdministration des Ponts et Chaus-
sées, Luxembourgfib NetherlandsNZCS – New Zealand Concrete
SocietyNorsk Betongforening, NorwayCommittee of Civil Engineering,
PolandGPBE – Grupo Portugês de Betão
Estrutural, PortugalSociety for Concrete & Prefab Units
of RomaniaTechnical University of Civil Engi-
neering, RomaniaTransylvania University of Brasov,
RomaniaAssociation for Structural Concrete,
RussiaAssociation of Structural Engineers,
SerbiaSlovak Union of Civil EngineersSlovenian Society of Structural
EngineersUniversity of Cape Town, South
AfricaKCI – Korean Concrete InstituteACHE – Asociación Cientifico-
Técnica del Hormigón Estructural, Spain
Svenska Betongföreningen, SwedenDélégation nationale suisse de la fib,
SwitzerlandTCA – Thailand Concrete Associa-
tion, ThailandUniversité de Tunis El Manar,
TunisiaITU – Istanbul Technical University,
TurkeyNIISK – Research Institute of
Building Constructions, Ukraine
fib UK GroupASBI – American Segmental Bridge
Institute, USA PCI – Precast/Prestressed Concrete
Institute, USA PTI – Post Tensioning Institute,
USA
Sponsoring members
Liuzhou OVM Machinery Company Ltd, China
Consolis Oy Ab,FinlandECS – European Engineered
Construction Systems (formerly VBBF), Germany
FBF Betondienst GmbH, GermanyFiReP Rebar Technology GmbH,
GermanyMKT Metall-Kunststoff-Technik
GmbH, GermanyLarsen & Toubro Ltd ECC Division,
IndiaATP s.r.l, ItalyFuji P. S. Corporation, JapanIHI Construction Service Company
Ltd, JapanObayashi Corporation, JapanOriental Shiraishi Corporation,
JapanP. S. Mitsubishi Construction Com-
pany Ltd, JapanSE Corporation, JapanSumitomo Mitsui Constructruction
Company Ltd, JapanHilti Corporation, LiechtensteinPatriot Engineering, RussiaBBR VT International Ltd, Switzer-
landSIKA Services AG, SwitzerlandVSL International Ltd, SwitzerlandChina Engineering Consultants,
Inc., Taiwan (China)PBL Group Ltd, ThailandCCL Stressing Systems Ltd, United
Kingdom
Acknowledgementfib – Fédération internationale du béton – the International Federation for Structural Concrete – is grateful for the invaluable support of the following national member groups and sponsoring members, which contributes to the publication of fib Technical Bulletins, the Structural Concrete journal, and fib-news.
06_149_157_fibNews_0115.indd 157 18.02.15 10:08
Dirk Schlicke, Nguyen Viet TueMinimum reinforcement of concretemembers regarding hardening causedstresses and member dimensions
Ricardo Costa, Paulo Providência,Alfredo DiasConsideration of strength and size ofbeam-column joints in the designof RC frames
Paolo Martinelli, Matteo Colombo,Marco Di PriscoA design approach for tunnels exposedto blast and fire
Jianzhuang Xiao, Chang Sun,Xinghan JiangFlexural behavior of recycledaggregate concrete gradient slabs
Benjamin Kromoser, Johann KolleggerPneumatic forming of hardenedconcrete – building shells in the21st century
Kim Van Tittelboom, Elke Gruyaert,Pieter De Backer, Wim Moerman,Nele De BelieSelf-repair of thermal cracksin concrete sandwich panels
Andreas Galmarini, Daniel Locher,Peter MartiPredicting the response of reinforcedconcrete slab strips subjected to axialtension and transverse load: acompetition
Li Yun-pan, Xu Gang, Su Yi-biao,Xu KeChloride ion transport mechanismunder different drying-wetting cycles
Caesar Abi Shdid, Masood Hajali,Ali AlavinasabEffect of the location of broken wirewraps on the failure pressure ofprestressed concrete cylinder pipes
Martin ClassenShear force carrying of compositedowels in transversely crackedconcrete
Elena Diaz, David Fernandez,Enrique GonzalezInfluence of axial tension on the shearstrength of floor joists withouttransverse reinforcement
Wael KassemShear strength of deep beams:a mathematical model and designformula
Preview
Structural Concrete 2/2015
Order online:
Annual subscription print + online
Single issue order
Free sample copy ➡
Journal:
www.ernst-und-sohn.de/structural-concrete 1003146_pf
Structural Concrete

* € Prices are valid in Germany, exclusively, and subject to alterations. Prices incl. VAT. excl. shipping. 1004126_dp
Customer Service: Wiley-VCH
Boschstraße 12
D-69469 Weinheim
Tel. +49 (0)6201 606-400
Fax +49 (0)6201 606-184
Ernst & Sohn
Verlag für Architektur und technische
Wissenschaften GmbH & Co. KG
Schrägkabelbrücken – Cable-Stayed Bridges
Es werden alle Phasen des Entwurfs, der Monta-geplanung und der Bauausführung grundsätzlich behandelt und anhand von ca. 250 ausgeführten Beispielen erläutert und illustriert. Die dargestellten Brücken sind nach internationalen Vorschriften be-messen worden, z. B. DIN, Eurocode, AASHTO, Bri-tish Standard. Besonderes Gewicht wurde auf die Kapitel über Kabel und Montage gelegt, denn hier-in liegt der entscheidende Unterschied zu anderen Brückenformen.
Order online:www.ernst-und-sohn.de
Holger Svensson
Schrägkabelbrücken
40 Jahre Erfahrung weltweit
Mit DVD: Vorlesungen live
2011. 458 S.
€ 79,–*
ISBN 978-3-433-02977-0
Auch als erhältlich
The need for large-scale bridges is constantly grow-
ing due to the enormous infrastructure develop-
ment around the world. Since the 1970s many of
them have been cable-stayed bridges. In 1975 the
largest span length was 404 m, in 1995 it increased
to 856 m, and today it is 1104 m. Thus the eco-
nomically efficient range of cable-stayed bridges is
tending to move towards even larger spans, and
cable-stayed bridges are increasingly the focus of
interest worldwide.
This book describes the fundamentals of design
analysis, fabrication and construction, in which the
author refers to 250 built examples to illustrate all
aspects. International or national codes and tech-
nical regulations are referred to only as examples,
such as bridges that were designed to German DIN,
Eurocode, AASHTO, British Standards. The chapters
on cables and erection are a major focus of this
work as they represent the most important differ-
ence from other types of bridges.
Holger Svennson
Cable-Stayed-Bridges
40 years of Experience
Worldwide
18 lectures on DVD
2012. 458 pages
€ 129,–*
ISBN 978-3-433-02992-3
Also available as
40 Jahre Erfahrung weltweit – Mit DVD: Vorlesungen live
40 years Experience Worldwide – 18 lectures on DVD

MAURER AGFrankfurter Ring 19380807 Munich/GermanyPhone +49 89 32394–0Fax +49 89 32394–306www.maurer.eu forces in motion
STRUCTURAL PROTECTION SYSTEMS
© KS
P Jü
rgen
Eng
el A
rcht
itekt
en, K
rebs
& K
iefe
r Int
erna
tiona
l
© by
DC
Tow
ers D
onau
City
STRUCTURAL BEARINGS | EXPANSION JOINTS | SEISMIC DEVICES | VIBRATION ABSORBERS | MONITORING
↑ SOCAR Tower, Aserbaidschan
Job Description: Prevention of horizontal accelerations of the flame shaped 200 m high struc-ture, caused by wind and earth-quake.
Project scope: One MAURER Tu-ned Mass Damper MTMD with a mass of 450 tons, plus MAURER Hydraulic Dampers MHD which dampens at 0.32 Hz and a stroke of +/– 400 mm. Including a moni-toring system for displace ments, forces and accelerations.
↑ Danube City Tower, Austria
Job Description: Reduction of the horizontal acceleration of the structure caused by wind and earthquake at a high rise building of 220 m height, to generate suf-ficient comfort.
Project scope: Two MAURER adaptive hydraulic dampers with a response force of up to 80 kN and +/– 700 mm stroke, which dampen the 300 ton mass-pen-dulum. Including a monitoring system for displace ments, forces and accelerations.
↑ Mosque in Algiers, Algeria
Job Description: The third big-gest mosque in the world re-quires an innovative seismic protection, with a design life of 500 years.
Project scope: 246 nos. sliding isolation pendulum bearings SIP with a rotational hinge (design specification 3 % dynamic friction and 2,400 mm effective radius), as well as 80 nos. MAURER Hy-draulic Dampers MHD with a re-sponse force of 2,500 kN.
↑ Signature Bridge, India
Job Description: Structural pro-tection for the new landmark in Delhi, displaying a 150 m high pylon with asymmetrically ar-ranged stay cables.
Project scope: 38 nos. MAURER MSM® Spherical Bearings, of this two pylon bearings which have to support a vertical load of up to 23,000 tons. This corresponds to the weight of about 15,000 me-dium sized cars. Moreover, eight rocker bearings which as a spe-cial structural element will ac-commodate 17,500 kN tensile forces each from the stay cables and transfer these loads into the foundation.

Annual table of contentsEditor-in-Chief:Luc Taerwe
Deputy Editor:Steinar Helland
Members:György L. BalázsJosée Bastien Mikael Braestrup Tom d’ Arcy Michael Fardis
Stephen Foster Sung Gul HongTim Ibell S.G. Joglekar Akio Kasuga Daniel A. KuchmaGaetano Manfredi Pierre Rossi Guilhemo Sales Melo Petra Schumacher Tamon Ueda Yong Yuan
2014Volume 15No. 1–4ISSN 1464-4177
2 Structural Concrete 15 www.ernst-und-sohn.de
Abbas, Ali A.; Mohsin, SharifahM. Syed; Cotsovos, DemetriosM.: Non-linear analysis of stati-cally indeterminate SFRCcolumns
Issue 1 94–105 TAbdellahi, Majid; Heidari, Javad;
Bahmanpour, Maryam: A newpredictive model for the bondstrength of FRP-to-concrete com-posite joints Issue 4 509–521 T
Aboutalebi, Morteza; Alani, AmirM.; Rizzuto, Joseph; Beckett,Derrick: Structural behaviourand deformation patterns inloaded plain concrete ground-supported slabs Issue 1 81–93 T
Aboutalebi, Morteza; see Alani,Amir M.
Ahuja, Ashok K.; see Gupta,Pramod K.
Akpinar, Erkan; see Ozden,Sevket
Alani, Amir M.; Aboutalebi,Morteza; Kilic, Gokhan: Use ofnon-contact sensors (IBIS-S) andfinite element methods in theassessment of bridge deck struc-tures Issue 2 240–247 T
Alani, Amir M.; see Aboutalebi,Morteza
Almeida, João F.; see Gama,David
Andreatta, Andreas; see Theiner,Yvonne
Ansell, Anders; see Magnusson,Johan
Atalay, Hilal M.; see Ozden,Sevket
Bahmanpour, Maryam; see Abdellahi, Majid
Beckett, Derrick; see Aboutalebi,Morteza
Belletti, Beatrice; Damoni, Cecil-ia; Hendriks, Max A. N.; deBoer, Ane: Analytical andnumerical evaluation of thedesign shear resistance of rein-forced concrete slabs Issue 3 317–330 T
Bergmeister, Konrad: The servicelife of any structure is due to thegenius of the engineer whodesigns it – and should not be atthe expense of the engineermaintaining it. Issue 2 115–116 E
Bergmeister, Konrad; seePodroužek, Jan
Bergmeister, Konrad; see Urban,Susanne
Biliszczuk, Jan; see Onysyk, JerzyBittencourt, Túlio Nogueira; see
Meneghetti, Leila CristinaBoel, Veerle; see Korte, SaraBollinger, Klaus; see Messari-
Becker, LamiaBreitenbücher, Rolf; Meschke,
Günther; Song, Fanbing; Zhan,Yijian: Experimental, analyticaland numerical analysis of thepullout behaviour of steel fibresconsidering different fibre types,inclinations and concretestrengths Issue 2 126–135 T
Cadamuro, Erica; see Carpinteri,Alberto
Cairns, John: Staggered lap jointsfor tension reinforcement Issue 1 45–54 T
Carpinteri, Alberto; Cadamuro,Erica; Corrado, Mauro: Mini-mum flexural reinforcement inrectangular and T-section con-crete beams Issue 3 361–372 T
Caspeele, Robby; see Van Coile,Ruben
Castberg, Andreas; see Hertz, Kristian
Castel, Arnaud; Gilbert, RaymondIan: Influence of time-dependenteffects on the crack spacing inreinforced concrete beams Issue 3 373–379 T
Castel, Arnaud; Gilbert, RaymondIan: Influence of time-dependenteffects on the crack spacing inreinforced concrete beams Issue 3 373–379 T
Cervenka, Vladimir; Ganz, HansRudolf: Validation of post-ten-sioning anchorage zones by lab-oratory testing and numericalsimulation Issue 2 258–268 T
Chen, Genda; see Yan, DongmingChi, Yang; see Yuan, YongChristensen, Jacob; see Hertz,
KristianClark, Gordon: Challenges for
concrete in tall buildings Issue 4 448–453 TCorrado, Mauro; see Carpinteri,
AlbertoCotsovos, Demetrios M.; see
Abbas, Ali A.Curbach, Manfred; see Wilhelm,
Sebastianda Silva Filho, Luiz Carlos Pinto;
see Meneghetti, Leila CristinaDahl, Kaare K. B.: Bella Sky Hotel
– taking precast concrete to thelimit Issue 4 441–447 T
Damoni, Cecilia; see Belletti, Beatrice
Structural Concrete: Annual table of contents Volume 15 (2014)
List of authors(T = Technical Paper, E = Editorial)
Annual table of contents 2014
3
Annual table of contents 2014
www.ernst-und-sohn.de Structural Concrete 15
de Boer, Ane; see Belletti, Beatrice
De Corte, Wouter; see Korte, SaraDe Schutter, Geert; see Korte,
SaraDe Schutter, Geert; see Liu, XianDehlinger, Christian; see Urban,
SusanneErdogan, Hakan; see Ozden,
SevketFan, Yuhui; Xiao, Jianzhuang;
Tam, Vivian W. Y.: Effect of oldattached mortar on the creep ofrecycled aggregate concrete Issue 2 169–178 T
Farkas, György; see Völgyi, IstvánForemniak, Sara; see Kollegger,
JohannGama, David; Almeida, João F.:
Concrete integral abutmentbridges with reinforced concretepiles Issue 3 292–304 T
Ganz, Hans Rudolf; see Cervenka,Vladimir
Garcez, Mônica Regina; seeMeneghetti, Leila Cristina
Gastal, Francisco de PaulaSimões Lopes; see Meneghetti,Leila Cristina
Gilbert, Raymond Ian; see Castel,Arnaud
Glavind, Mette: Innovations inconcrete for sustainable infra-structure constructions Issue 4 439–440 E
Gmainer, Susanne; see Kollegger,Johann
González, Dorys C.; see Vicente,Miguel A.
Grohmann, Manfred; see Messari-Becker, Lamia
Groli, Giancarlo; PérezCaldentey, Alejandro; Soto,Alejandro Giraldo: Crackingperformance of SCC reinforcedwith recycled fibres – an experi-mental study Issue 2 136–153 T
Gupta, Pramod K.; Ahuja, AshokK.; Khaudhair, Ziyad A.: Mod-elling, verification and investiga-tion of behaviour of circularCFST columns Issue 3 340–349 T
Hallgren, Mikael; see Magnusson,Johan
Han, Sang-Hun; see Won, DeokHee
Han, Taek Hee; see Won, DeokHee
Heek, Peter; see Winkler, KarstenHegger, Josef; see Siburg, CarstenHeidari, Javad; see Abdellahi,
MajidHelland, Steinar; see Taerwe, LucHendriks, Max A. N.; see Belletti,
BeatriceHertz, Kristian; Castberg,
Andreas; Christensen, Jacob:Super-light concrete decks forbuilding floor slabs Issue 4 522–529 T
Hofstetter, Günter; see Theiner,Yvonne
Hölmebakk, Carl-Viggo; seeKrokstrand, Ole H.
Jang, In-Sung; see Won, DeokHee
Jiang, Wei; see Liu, XianKeršner, Zbynek; see Strauss,
AlfredKhaudhair, Ziyad A.; see Gupta,
Pramod K.Kilic, Gokhan; see Alani, Amir M.Knappe, Florian; see Messari-
Becker, LamiaKollegger, Johann; Foremniak,
Sara; Suza, Dominik; Wimmer,David; Gmainer, Susanne:Building bridges using the balanced lift method Issue 3 281–291 T
Korte, Sara; Boel, Veerle; DeCorte, Wouter; De Schutter,Geert: Behaviour of fatigueloaded self-compacting concretecompared to vibrated concrete Issue 4 575–589 T
Krokstrand, Ole H.; Ramstad,Reiulf; Hölmebakk, Carl-Viggo:Splendid concrete architecturein National Tourist Routes inNorway Issue 2 117–125 T
Kunz, Jakob; see Randl, NorbertLehký, David; see Strauss, AlfredLi, Hedong; see Yan, DongmingLi, Hong; see Xiao, JianzhuangLi, Long; see Xiao, JianzhuangLitzner, Hans-Ulrich: Tempora
mutantur...... Issue 3 277–278 ELiu, Xian; Jiang, Wei; De Schut-
ter, Geert; Yuan, Yong; Su,Quanke: Early-age behaviour ofprecast concrete immersed tun-nel based on degree of hydrationconcept Issue 1 66–80 T
Liu, Xian; Yuan, Yong; Su,Quanke: Sensitivity analysis ofthe early-age cracking risk in animmersed tunnel Issue 2 179–190 T
Lu, Xilin: Precast concrete struc-tures in the future Issue 1 1–2 E
Magnusson, Johan; Hallgren,Mikael; Ansell, Anders: Shearin concrete structures subjectedto dynamic loads Issue 1 55–65 T
Mancini, Giuseppe; Tondolo,Francesco: Effect of bond degra-dation due to corrosion – a liter-ature survey Issue 3 408–418 T
Mark, Peter; see Winkler, KarstenMartínez, José A.; see Vicente,
Miguel A.Meneghetti, Leila Cristina;
Garcez, Mônica Regina; daSilva Filho, Luiz Carlos Pinto;Gastal, Francisco de PaulaSimões Lopes; Bittencourt,Túlio Nogueira: Fatigue life ofRC beams strengthened withFRP systems Issue 2 219–228 T
Meschke, Günther; see Breiten-bücher, Rolf
Messari-Becker, Lamia; Mettke,Angelika; Knappe, Florian;

Annual table of contents 2014
4 Structural Concrete 15 www.ernst-und-sohn.de
Storck, Ulrich; Bollinger,Klaus; Grohmann, Manfred:Recycling concrete in practice –a chance for sustainableresource management Issue 4 556–562 T
Mettke, Angelika; see Messari-Becker, Lamia
Mohsin, Sharifah M. Syed; seeAbbas, Ali A.
Mínguez, Jesús; see Vicente, Miguel A.
Novák, Drahomír; see Strauss,Alfred
Nyhus, Bente Skovseth: Consis-tent practical design of concretestructures Issue 3 305–316 T
Onysyk, Jerzy; Biliszczuk, Jan;Prabucki, Przemyslaw; Sadow -ski, Krzysztof; Toczkiewicz,Robert: Strengthening the 100-year-old reinforced concretedome of the Centennial Hall inWrocław Issue 1 30–37 T
Ozden, Sevket; Atalay, Hilal M.;Akpinar, Erkan; Erdogan,Hakan; Vulas, Yılmaz Zafer:Shear strengthening of rein-forced concrete T-beams withfully or partially bonded fibre-reinforced polymer composites Issue 2 229–239 T
Park, Woo Sun; see Won, DeokHee
Podroužek, Jan; Strauss, Alfred;Bergmeister, Konrad: Robust-ness-based performance assess-ment of a prestressed concretebridge Issue 2 248–257 T
Prabucki, Przemyslaw; seeOnysyk, Jerzy
Prince, M. John Robert; Singh,Bhupinder: Investigation ofbond behaviour between recy-cled aggregate concrete anddeformed steel bars Issue 2 154–168 T
Pérez Caldentey, Alejandro; seeGroli, Giancarlo
Ramstad, Reiulf; see Krokstrand,Ole H.
Randl, Norbert; Kunz, Jakob:Post-installed reinforcement con-nections at ultimate and service-ability limit states Issue 4 563–574 T
Reinhardt, Hans-Wolf: Aspects ofimposed deformation in con-crete structures – a condensedoverview Issue 4 454–460 T
Ricker, Marcus; see Siburg,Carsten
Rizzuto, Joseph; see Aboutalebi,Morteza
Rohländer, Sandra; see Winkler,Karsten
Sadowski, Krzysztof; see Onysyk,Jerzy
Schütz, Robert; see Urban,Susanne
Scott, Richard: Serviceabilityuncertainties in flat slabs Issue 4 469–483 T
Siburg, Carsten; Hegger, Josef:Experimental investigations onthe punching behaviour of rein-forced concrete footings withstructural dimensions Issue 3 331–339 T
Siburg, Carsten; Ricker, Marcus;Hegger, Josef: Punching sheardesign of footings: critical reviewof different code provisions Issue 4 497–508 T
Silva Filho, Júlio Jerônimo Holtz;see Souza, Osvaldo Luiz de Carvalho
Singh, Bhupinder; see Prince, M.John Robert
Sommer, Simone; see Winkler,Karsten
Song, Fanbing; see Breitenbücher,Rolf
Soto, Alejandro Giraldo; seeGroli, Giancarlo
Souza, Osvaldo Luiz de Carvalho;Sánchez Filho, Emil de Souza;Vaz, Luiz Eloy; Silva Filho,Júlio Jerônimo Holtz: Reliabilityanalysis of RC beams strength-ened for torsion with carbonfibre composites Issue 1 38–44 T
Storck, Ulrich; see Messari-Becker, Lamia
Strauss, Alfred; Zimmermann,Thomas; Lehký, David; Novák,Drahomír; Keršner, Zbynek:Stochastic fracture-mechanicalparameters for the performance-based design of concrete struc-tures Issue 3 380–394 T
Strauss, Alfred; see Podroužek,Jan
Strauss, Alfred; see Urban,Susanne
Su, Quanke; see Liu, XianSuza, Dominik; see Kollegger,
JohannSánchez Filho, Emil de Souza; see
Souza, Osvaldo Luiz de Carvalho
Taerwe, Luc; Helland, Steinar:Structural Concrete makesimpact Issue 3 279–280 E
Taerwe, Luc; see Van Coile,Ruben
Tam, Vivian W. Y.; see Fan, YuhuiTam, Vivian W.Y.; see Xiao,
JianzhuangTheiner, Yvonne; Andreatta,
Andreas; Hofstetter, Günter:Evaluation of models for esti-mating concrete strains due todrying shrinkage Issue 4 461–468 T
Toczkiewicz, Robert; see Onysyk,Jerzy
Tondolo, Francesco; see Mancini,Giuseppe
Urban, Susanne; Strauss, Alfred;Schütz, Robert; Bergmeister,Konrad; Dehlinger, Christian:Dynamically loaded concretestructures – monitoring-based

5
Annual table of contents 2014
www.ernst-und-sohn.de Structural Concrete 15
assessment of the real degree offatigue deterioration Issue 4 530–542 T
Van Coile, Ruben; Caspeele,Robby; Taerwe, Luc: Towards areliability-based post-fire assess-ment method for concrete slabsincorporating information frominspection Issue 3 395–407 T
Vaz, Luiz Eloy; see Souza, Osvaldo Luiz de Carvalho
Vicente, Miguel A.; González,Dorys C.; Mínguez, Jesús;Martínez, José A.: Residualmodulus of elasticity and maxi-mum compressive strain in HSCand FRHSC after high-stress-level cyclic loading Issue 2 210–218 T
Vulas, Yılmaz Zafer; see Ozden,Sevket
Völgyi, István; Windisch, Andor;Farkas, György: Resistance ofreinforced concrete memberswith hollow circular cross-sec-tions under combined bendingand shear – Part I: experimentalinvestigation Issue 1 13–20 T
Völgyi, István; Windisch, Andor:Resistance of reinforced con-crete members with hollow cir-cular cross-section under com-bined bending and shear – PartII: New calculation model Issue 1 21–29 T
Wilhelm, Sebastian; Curbach,Manfred: Review of possiblemineral materials and produc-tion techniques for a buildingmaterial on the moon Issue 3 419–428 T
Wimmer, David; see Kollegger,Johann
Windisch, Andor; see Völgyi,István
Winkler, Karsten; Mark, Peter;Heek, Peter; Rohländer, San-dra; Sommer, Simone: Punch-ing shear tests on symmetricallyreduced slab quarters Issue 4 484–496 T
Won, Deok Hee; Park, Woo Sun;Jang, In-Sung; Han, Sang-Hun;Han, Taek Hee: Fire resistanceperformance of steel compositehollow RC column with innertube under ISO 834 standardfire Issue 4 543–555 T
Won, Deok Hee; Park, Woo Sun;Yi, Jin-Hak; Han, Sang-Hun;Han, Taek Hee: Effect of weld-ing heat on precast steel com-posite hollow columns Issue 3 350–360 T
Xiao, Jianzhuang; Li, Long; Tam,Vivian W.Y.; Li, Hong: Thestate of the art regarding thelong-term properties of recycledaggregate concrete Issue 1 3–12 T
Xiao, Jianzhuang; see Fan, YuhuiXu, Shilang; see Yan, DongmingYan, Dongming; Xu, Shilang;
Chen, Genda; Li, Hedong: Bi -axial behaviour of plain concretesubjected to dynamic compres-sion with constant lateral stress Issue 2 202–209 T
Yi, Jin-Hak; s. Won, Deok HeeYuan, Yong; Chi, Yang: Water
permeability of concrete underuniaxial tension Issue 2 191–201 T
Yuan, Yong; s. Liu, XianZhan, Yijian; s. Breitenbücher,
RolfZimmermann, Thomas; s. Strauss,
Alfred

Annual table of contents 2014
6 Structural Concrete 15 www.ernst-und-sohn.de
Subject codes and keywords
Analysis and design methods
Abbas, Ali A.; Mohsin, Sharifah M.Syed; Cotsovos, Demetrios M.:Non-linear analysis of staticallyindeterminate SFRC columns[fibre-reinforced concrete; finiteelement methods; structuralanalysis] Issue 1 94–105
Aboutalebi, Morteza; Alani, AmirM.; Rizzuto, Joseph; Beckett,Derrick: Structural behaviourand deformation patterns inloaded plain concrete ground-supported slabs [ground-sup-ported slab; displacement; crackpropagation; bending; punching] Issue 1 81–93
Alani, Amir M.; Aboutalebi,Morteza; Kilic, Gokhan: Use ofnon-contact sensors (IBIS-S)and finite element methods inthe assessment of bridge deckstructures [finite element model-ling; bridge health monitoring;IBIS-S sensor; ANSYS] Issue 2 240–247
Belletti, Beatrice; Damoni, Cecilia;Hendriks, Max A. N.; de Boer,Ane: Analytical and numericalevaluation of the design shearresistance of reinforced con-crete slabs [reinforced concreteslabs; non-linear finite elementanalysis; shear resistance evalua-tion; guidelines; safety formats;design] Issue 3 317–330
Breitenbücher, Rolf; Meschke,Günther; Song, Fanbing; Zhan,Yijian: Experimental, analyticaland numerical analysis of thepullout behaviour of steelfibres considering differentfibre types, inclinations andconcrete strengths [steel fibre;pullout behaviour; laboratorytest; analytical modelling;numerical simulation] Issue 2 126–135
Castel, Arnaud; Gilbert, RaymondIan: Influence of time-depend-ent effects on the crack spacingin reinforced concrete beams[reinforced concrete; crack spac-ing; shrinkage; sustained load-ing; stirrup spacing; fib ModelCode 2010] Issue 3 373–379
Cervenka, Vladimir; Ganz, HansRudolf: Validation of post-ten-sioning anchorage zones bylaboratory testing and numeri-cal simulation [anchorage;numerical analysis; testing] Issue 2 258–268
Fan, Yuhui; Xiao, Jianzhuang;Tam, Vivian W. Y.: Effect of oldattached mortar on the creep ofrecycled aggregate concrete
[recycled aggregate concrete; oldadhering mortar; shrinkage;creep; influence mechanism] Issue 2 169–178
Gama, David; Almeida, João F.:Concrete integral abutmentbridges with reinforced con-crete piles [prestressed concretebridges; integral abutmentbridges; reinforced concretepiles; imposed deformations;soil-structure interaction; levelsof approximation] Issue 3 292–304
Gupta, Pramod K.; Ahuja, AshokK.; Khaudhair, Ziyad A.: Model-ling, verification and investiga-tion of behaviour of circularCFST columns [concrete-filledtube; CFST column; simulation;CFT; composite columns; con-finement; confined concrete; cir-cular columns] Issue 3 340–349
Liu, Xian; Jiang, Wei; De Schutter,Geert; Yuan, Yong; Su, Quanke:Early-age behaviour of precastconcrete immersed tunnelbased on degree of hydrationconcept [precast immersed tun-nel; early-age cracking; degree ofhydration; creep under varyingstress levels] Issue 1 66–80
Liu, Xian; Yuan, Yong; Su,Quanke: Sensitivity analysis ofthe early-age cracking risk inan immersed tunnel [immersedtunnel; early-age cracking; sensi-tivity analysis; curing scheme] Issue 2 179–190
Magnusson, Johan; Hallgren,Mikael; Ansell, Anders: Shear inconcrete structures subjected todynamic loads [dynamic loads;impulsive loads; rise time; shear;initial response; support reac-tions; arch action] Issue 1 55–65
Nyhus, Bente Skovseth: Consistentpractical design of concretestructures [concrete design;practical design; consistent stiff-ness method; non-linear analy-sis; shear design; MCFT; safety;cost effective] Issue 3 305–316
Onysyk, Jerzy; Biliszczuk, Jan;Prabucki, Przemyslaw; Sadow -ski, Krzysztof; Toczkiewicz,Robert: Strengthening the 100-year-old reinforced concretedome of the Centennial Hall inWrocław [pioneering concretestructure; renovation; FEManalysis; strengthening] Issue 1 30–37
Podroužek, Jan; Strauss, Alfred;Bergmeister, Konrad: Robust-ness-based performance assess-ment of a prestressed concretebridge [robustness; existing
7
Annual table of contents 2014
www.ernst-und-sohn.de Structural Concrete 15
structure; reliability; perform-ance indicators; safety; stochas-tic methods] Issue 2 248–257
Randl, Norbert; Kunz, Jakob: Post-installed reinforcement connec-tions at ultimate and servicea-bility limit states [post-installedreinforcement; anchorage; split-ting; pullout; serviceability limitstate] Issue 4 563–574
Reinhardt, Hans-Wolf: Aspects ofimposed deformation in con-crete structures – a condensedoverview [imposed deformation;fresh concrete; shrinkage; youngconcrete; cracking] Issue 4 454–460
Scott, Richard: Serviceabilityuncertainties in flat slabs [loadtests; finite element analysis;codes of practice] Issue 4 469–483
Siburg, Carsten; Ricker, Marcus;Hegger, Josef: Punching sheardesign of footings: criticalreview of different code provi-sions [punching; footing; fibModel Code 2010; Eurocode 2;tests] Issue 4 497–508
Souza, Osvaldo Luiz de Carvalho;Sánchez Filho, Emil de Souza;Vaz, Luiz Eloy; Silva Filho, JúlioJerônimo Holtz: Reliabilityanalysis of RC beams strength-ened for torsion with carbonfibre composites [reliabilityindex; torsion in RC beams; car-bon fibre composites] Issue 1 38–44
Van Coile, Ruben; Caspeele,Robby; Taerwe, Luc: Towards areliability-based post-fireassessment method for con-crete slabs incorporating infor-mation from inspection [fire;post-fire assessment; residualstrength; safety level; concreteslab] Issue 3 395–407
Vicente, Miguel A.; González,Dorys C.; Mínguez, Jesús;Martínez, José A.: Residualmodulus of elasticity and maxi-mum compressive strain inHSC and FRHSC after high-stress-level cyclic loading[fatigue; high-strength concrete;fibre-reinforced high-strengthconcrete; modulus of elasticity;maximum compressive strain] Issue 2 210–218
Völgyi, István; Windisch, Andor:Resistance of reinforced con-crete members with hollow cir-cular cross-section under com-bined bending and shear –Part II: New calculation model[behaviour under combinedbending and shear; hollow circu-lar cross-section; contribution ofcompressed concrete to shearresistance; sliding surface] Issue 1 21–29
Winkler, Karsten; Mark, Peter;Heek, Peter; Rohländer, Sandra;
Sommer, Simone: Punchingshear tests on symmetricallyreduced slab quarters [punchingshear; innovative test setup; axissymmetry; experiments; quar-tered slab] Issue 4 484–496
Anchorage
Cairns, John: Staggered lap jointsfor tension reinforcement[lapped joints; bond; detailing] Issue 1 45–54
Cervenka, Vladimir; Ganz, HansRudolf: Validation of post-ten-sioning anchorage zones bylaboratory testing and numeri-cal simulation [anchorage;numerical analysis; testing] Issue 2 258–268
Hertz, Kristian; Castberg, Andreas;Christensen, Jacob: Super-lightconcrete decks for buildingfloor slabs [super-light struc-tures; deck structures; precastconcrete; lightweight concrete;prestressed concrete; structuraldesign; testing structural ele-ments] Issue 4 522–529
Mancini, Giuseppe; Tondolo,Francesco: Effect of bonddegradation due to corrosion –a literature survey [bond degra-dation; corrosion rate; experi-mental procedure] Issue 3 408–418
Prince, M. John Robert; Singh,Bhupinder: Investigation ofbond behaviour between recy-cled aggregate concrete anddeformed steel bars [coarserecycled concrete aggregate;replacement percentage; naturalcoarse aggregate; bond; pulloutfailure; splitting failure; normal-ized bond strength] Issue 2 154–168
Randl, Norbert; Kunz, Jakob: Post-installed reinforcement connec-tions at ultimate and servicea-bility limit states [post-installedreinforcement; anchorage; split-ting; pullout; serviceability limitstate] Issue 4 563–574
Art of engineering
Dahl, Kaare K. B.: Bella Sky Hotel– taking precast concrete to thelimit [precast concrete; structur-al behaviour; hotel; complexgeometry; leaning building] Issue 4 441–447
Kollegger, Johann; Foremniak,Sara; Suza, Dominik; Wimmer,David; Gmainer, Susanne:Building bridges using the bal-anced lift method [precast con-crete elements; post-tensioning;bridge construction method;large-scale test] Issue 3 281–291
Annual table of contents 2014
8 Structural Concrete 15 www.ernst-und-sohn.de
Krokstrand, Ole H.; Ramstad,Reiulf; Hölmebakk, Carl-Viggo:Splendid concrete architecturein National Tourist Routes inNorway [concrete architecture;scenic view; tourist routes; Norway] Issue 2 117–125
Messari-Becker, Lamia; Mettke,Angelika; Knappe, Florian; Storck, Ulrich; Bollinger, Klaus;Grohmann, Manfred: Recyclingconcrete in practice – a chancefor sustainable resource man-agement [recycled concrete; greyenergy; sustainable construction;building materials; resourcemanagement; life cycle assess-ment] Issue 4 556–562
Winkler, Karsten; Mark, Peter;Heek, Peter; Rohländer, Sandra;Sommer, Simone: Punchingshear tests on symmetricallyreduced slab quarters [punchingshear; innovative test setup; axissymmetry; experiments; quar-tered slab] Issue 4 484–496
Bridge construction
Gama, David; Almeida, João F.:Concrete integral abutmentbridges with reinforced con-crete piles [prestressed concretebridges; integral abutmentbridges; reinforced concretepiles; imposed deformations;soil-structure interaction; levelsof approximation] Issue 3 292–304
Kollegger, Johann; Foremniak,Sara; Suza, Dominik; Wimmer,David; Gmainer, Susanne:Building bridges using the bal-anced lift method [precast con-crete elements; post-tensioning;bridge construction method;large-scale test] Issue 3 281–291
Podroužek, Jan; Strauss, Alfred;Bergmeister, Konrad: Robust-ness-based performance assess-ment of a prestressed concretebridge [robustness; existingstructure; reliability; perform-ance indicators; safety; stochas-tic methods] Issue 2 248–257
Building maintenance/refurbishment
Alani, Amir M.; Aboutalebi,Morteza; Kilic, Gokhan: Use ofnon-contact sensors (IBIS-S)and finite element methods inthe assessment of bridge deckstructures [finite element model-ling; bridge health monitoring;IBIS-S sensor; ANSYS] Issue 2 240–247
Onysyk, Jerzy; Biliszczuk, Jan;Prabucki, Przemyslaw; Sadow -
ski, Krzysztof; Toczkiewicz,Robert: Strengthening the 100-year-old reinforced concretedome of the Centennial Hall inWrocław [pioneering concretestructure; renovation; FEManalysis; strengthening] Issue 1 30–37
Van Coile, Ruben; Caspeele,Robby; Taerwe, Luc: Towards areliability-based post-fireassessment method for con-crete slabs incorporating infor-mation from inspection [fire;post-fire assessment; residualstrength; safety level; concreteslab] Issue 3 395–407
Building materials/construction materials
Abdellahi, Majid; Heidari, Javad;Bahmanpour, Maryam: A newpredictive model for the bondstrength of FRP-to-concretecomposite joints [bond strength;model; GEP; FRP; composite] Issue 4 509–521
Breitenbücher, Rolf; Meschke,Günther; Song, Fanbing; Zhan,Yijian: Experimental, analyticaland numerical analysis of thepullout behaviour of steelfibres considering differentfibre types, inclinations andconcrete strengths [steel fibre;pullout behaviour; laboratorytest; analytical modelling;numerical simulation] Issue 2 126–135
Fan, Yuhui; Xiao, Jianzhuang;Tam, Vivian W. Y.: Effect of oldattached mortar on the creep ofrecycled aggregate concrete[recycled aggregate concrete; oldadhering mortar; shrinkage;creep; influence mechanism] Issue 2 169–178
Groli, Giancarlo; Pérez Caldentey,Alejandro; Soto, AlejandroGiraldo: Cracking performanceof SCC reinforced with recy-cled fibres – an experimentalstudy [FRC; recycled steel fibres;crack width control; φ/ρs,ef;cover; sustainability; fib ModelCode 2010] Issue 2 136–153
Gupta, Pramod K.; Ahuja, AshokK.; Khaudhair, Ziyad A.: Model-ling, verification and investiga-tion of behaviour of circularCFST columns [concrete-filledtube; CFST column; simulation;CFT; composite columns; con-finement; confined concrete; cir-cular columns] Issue 3 340–349
Korte, Sara; Boel, Veerle; DeCorte, Wouter; De Schutter,Geert: Behaviour of fatigueloaded self-compacting con-crete compared to vibratedconcrete [self-compacting con-crete; vibrated concrete; cyclic
9
Annual table of contents 2014
www.ernst-und-sohn.de Structural Concrete 15
loading; fatigue; S-N curve;crack growth] Issue 4 575–589
Krokstrand, Ole H.; Ramstad,Reiulf; Hölmebakk, Carl-Viggo:Splendid concrete architecturein National Tourist Routes inNorway [concrete architecture;scenic view; tourist routes; Nor-way] Issue 2 117–125
Messari-Becker, Lamia; Mettke,Angelika; Knappe, Florian; Storck, Ulrich; Bollinger, Klaus;Grohmann, Manfred: Recyclingconcrete in practice – a chancefor sustainable resource man-agement [recycled concrete; greyenergy; sustainable construction;building materials; resourcemanagement; life cycle assess-ment] Issue 4 556–562
Ozden, Sevket; Atalay, Hilal M.;Akpinar, Erkan; Erdogan,Hakan; Vulas, Yılmaz Zafer:Shear strengthening of rein-forced concrete T-beams withfully or partially bonded fibre-reinforced polymer composites[reinforced concrete; beam shearstrengthening; fibre-reinforcedpolymer; anchorage; partiallybonded FRP; modulus of elastici-ty; composite] Issue 2 229–239
Prince, M. John Robert; Singh,Bhupinder: Investigation ofbond behaviour between recy-cled aggregate concrete anddeformed steel bars [coarserecycled concrete aggregate;replacement percentage; naturalcoarse aggregate; bond; pulloutfailure; splitting failure; normal-ized bond strength] Issue 2 154–168
Randl, Norbert; Kunz, Jakob: Post-installed reinforcement connec-tions at ultimate and servicea-bility limit states [post-installedreinforcement; anchorage; split-ting; pullout; serviceability limitstate] Issue 4 563–574
Reinhardt, Hans-Wolf: Aspects ofimposed deformation in con-crete structures – a condensedoverview [imposed deformation;fresh concrete; shrinkage; youngconcrete; cracking] Issue 4 454–460
Souza, Osvaldo Luiz de Carvalho;Sánchez Filho, Emil de Souza;Vaz, Luiz Eloy; Silva Filho, JúlioJerônimo Holtz: Reliabilityanalysis of RC beams strength-ened for torsion with carbonfibre composites [reliabilityindex; torsion in RC beams; car-bon fibre composites] Issue 1 38–44
Strauss, Alfred; Zimmermann,Thomas; Lehký, David; Novák,Drahomír; Keršner, Zbynek:Stochastic fracture-mechanicalparameters for the perform-
ance-based design of concretestructures [fracture-mechanicalparameters; reliability; inverseanalysis; fracture energy; materi-als database] Issue 3 380–394
Urban, Susanne; Strauss, Alfred;Schütz, Robert; Bergmeister,Konrad; Dehlinger, Christian:Dynamically loaded concretestructures – monitoring-basedassessment of the real degree offatigue deterioration [concretefatigue; monitoring; deteriora-tion assessment] Issue 4 530–542
Wilhelm, Sebastian; Curbach, Man-fred: Review of possible miner-al materials and productiontechniques for a building mate-rial on the moon [mineral mate-rials; lunar base design; buildingmaterials; lunar concrete; castbasalt; sulphur concrete; moon;lunar environment; lunarcement; DMSI] Issue 3 419–428
Won, Deok Hee; Park, Woo Sun;Jang, In-Sung; Han, Sang-Hun;Han, Taek Hee: Fire resistanceperformance of steel compositehollow RC column with innertube under ISO 834 standardfire [fire resistance; concrete;ISO 834; Eurocode] Issue 4 543–555
Won, Deok Hee; Park, Woo Sun;Yi, Jin-Hak; Han, Sang-Hun;Han, Taek Hee: Effect of weld-ing heat on precast steel com-posite hollow columns [welding;heat; column; precast; concrete] Issue 3 350–360
Xiao, Jianzhuang; Li, Long; Tam,Vivian W.Y.; Li, Hong: Thestate of the art regarding thelong-term properties of recy-cled aggregate concrete [recy-cled aggregate concrete; long-term properties; shrinkage andcreep; carbonation resistance;impermeability; fatigue behav-iour] Issue 1 3–12
Yan, Dongming; Xu, Shilang;Chen, Genda; Li, Hedong: Biax-ial behaviour of plain concretesubjected to dynamic compres-sion with constant lateral stress[biaxial stress state; strain rate;dynamic strength; stress-straincurve; failure mode; concrete] Issue 2 202–209
Yuan, Yong; Chi, Yang: Water per-meability of concrete underuniaxial tension [reinforced con-crete; structural member; waterpermeability; tensioned element;permeating test] Issue 2 191–201
Corrosion
Castel, Arnaud; Gilbert, RaymondIan: Influence of time-depend-ent effects on the crack spacing

Annual table of contents 2014
10 Structural Concrete 15 www.ernst-und-sohn.de
in reinforced concrete beams[reinforced concrete; crack spac-ing; shrinkage; sustained load-ing; stirrup spacing; fib ModelCode 2010] Issue 3 373–379
Castel, Arnaud; Gilbert, RaymondIan: Influence of time-depend-ent effects on the crack spacingin reinforced concrete beams[reinforced concrete; crack spac-ing; shrinkage; sustained load-ing; stirrup spacing; fib ModelCode 2010] Issue 3 373–379
Mancini, Giuseppe; Tondolo,Francesco: Effect of bonddegradation due to corrosion –a literature survey [bond degra-dation; corrosion rate; experi-mental procedure] Issue 3 408–418
Xiao, Jianzhuang; Li, Long; Tam,Vivian W.Y.; Li, Hong: Thestate of the art regarding thelong-term properties of recy-cled aggregate concrete [recy-cled aggregate concrete; long-term properties; shrinkage andcreep; carbonation resistance;impermeability; fatigue behav-iour] Issue 1 3–12
Design and construction
Abbas, Ali A.; Mohsin, Sharifah M.Syed; Cotsovos, Demetrios M.:Non-linear analysis of staticallyindeterminate SFRC columns[fibre-reinforced concrete; finiteelement methods; structuralanalysis] Issue 1 94–105
Abdellahi, Majid; Heidari, Javad;Bahmanpour, Maryam: A newpredictive model for the bondstrength of FRP-to-concretecomposite joints [bond strength;model; GEP; FRP; composite] Issue 4 509–521
Aboutalebi, Morteza; Alani, AmirM.; Rizzuto, Joseph; Beckett,Derrick: Structural behaviourand deformation patterns inloaded plain concrete ground-supported slabs [ground-sup-ported slab; displacement; crackpropagation; bending; punching] Issue 1 81–93
Carpinteri, Alberto; Cadamuro,Erica; Corrado, Mauro: Mini-mum flexural reinforcement inrectangular and T-section con-crete beams [reinforced con-crete; code provisions; minimumreinforcement; dimensionalanalysis; size effects; cohesivecrack] Issue 3 361–372
Clark, Gordon: Challenges forconcrete in tall buildings [tallbuildings; design; concretefloors; verticality] Issue 4 448–453
Dahl, Kaare K. B.: Bella Sky Hotel– taking precast concrete to the
limit [precast concrete; structur-al behaviour; hotel; complexgeometry; leaning building] Issue 4 441–447
Gama, David; Almeida, João F.:Concrete integral abutmentbridges with reinforced con-crete piles [prestressed concretebridges; integral abutmentbridges; reinforced concretepiles; imposed deformations;soil-structure interaction; levelsof approximation] Issue 3 292–304
Groli, Giancarlo; Pérez Caldentey,Alejandro; Soto, AlejandroGiraldo: Cracking performanceof SCC reinforced with recy-cled fibres – an experimentalstudy [FRC; recycled steel fibres;crack width control; φ/ρs,ef;cover; sustainability; fib ModelCode 2010] Issue 2 136–153
Gupta, Pramod K.; Ahuja, AshokK.; Khaudhair, Ziyad A.: Model-ling, verification and investiga-tion of behaviour of circularCFST columns [concrete-filledtube; CFST column; simulation;CFT; composite columns; con-finement; confined concrete; cir-cular columns] Issue 3 340–349
Hertz, Kristian; Castberg, Andreas;Christensen, Jacob: Super-lightconcrete decks for buildingfloor slabs [super-light struc-tures; deck structures; precastconcrete; lightweight concrete;prestressed concrete; structuraldesign; testing structural ele-ments] Issue 4 522–529
Liu, Xian; Jiang, Wei; De Schutter,Geert; Yuan, Yong; Su, Quanke:Early-age behaviour of precastconcrete immersed tunnelbased on degree of hydrationconcept [precast immersed tun-nel; early-age cracking; degree ofhydration; creep under varyingstress levels] Issue 1 66–80
Liu, Xian; Yuan, Yong; Su,Quanke: Sensitivity analysis ofthe early-age cracking risk inan immersed tunnel [immersedtunnel; early-age cracking; sensi-tivity analysis; curing scheme] Issue 2 179–190
Magnusson, Johan; Hallgren,Mikael; Ansell, Anders: Shear inconcrete structures subjected todynamic loads [dynamic loads;impulsive loads; rise time; shear;initial response; support reac-tions; arch action] Issue 1 55–65
Nyhus, Bente Skovseth: Consistentpractical design of concretestructures [concrete design;practical design; consistent stiff-ness method; non-linear analy-sis; shear design; MCFT; safety;cost effective] Issue 3 305–316
11
Annual table of contents 2014
www.ernst-und-sohn.de Structural Concrete 15
Podroužek, Jan; Strauss, Alfred;Bergmeister, Konrad: Robust-ness-based performance assess-ment of a prestressed concretebridge [robustness; existingstructure; reliability; perform-ance indicators; safety; stochas-tic methods] Issue 2 248–257
Siburg, Carsten; Hegger, Josef:Experimental investigations onthe punching behaviour ofreinforced concrete footingswith structural dimensions[Eurocode 2; footings; punchingshear; shear slenderless; sizeeffect; fib Model Code 2010] Issue 3 331–339
Vicente, Miguel A.; González,Dorys C.; Mínguez, Jesús;Martínez, José A.: Residualmodulus of elasticity and maxi-mum compressive strain inHSC and FRHSC after high-stress-level cyclic loading[fatigue; high-strength concrete;fibre-reinforced high-strengthconcrete; modulus of elasticity;maximum compressive strain] Issue 2 210–218
Wilhelm, Sebastian; Curbach, Man-fred: Review of possible miner-al materials and productiontechniques for a building mate-rial on the moon [mineral mate-rials; lunar base design; buildingmaterials; lunar concrete; castbasalt; sulphur concrete; moon;lunar environment; lunarcement; DMSI] Issue 3 419–428
Won, Deok Hee; Park, Woo Sun;Jang, In-Sung; Han, Sang-Hun;Han, Taek Hee: Fire resistanceperformance of steel compositehollow RC column with innertube under ISO 834 standardfire [fire resistance; concrete;ISO 834; Eurocode] Issue 4 543–555
Won, Deok Hee; Park, Woo Sun;Yi, Jin-Hak; Han, Sang-Hun;Han, Taek Hee: Effect of weld-ing heat on precast steel com-posite hollow columns [welding;heat; column; precast; concrete] Issue 3 350–360
Dynamic actions/earthquakes
Korte, Sara; Boel, Veerle; DeCorte, Wouter; De Schutter,Geert: Behaviour of fatigueloaded self-compacting con-crete compared to vibratedconcrete [self-compacting con-crete; vibrated concrete; cyclicloading; fatigue; S-N curve;crack growth] Issue 4 575–589
Magnusson, Johan; Hallgren,Mikael; Ansell, Anders: Shear inconcrete structures subjected todynamic loads [dynamic loads;impulsive loads; rise time; shear;
initial response; support reac-tions; arch action] Issue 1 55–65
Vicente, Miguel A.; González,Dorys C.; Mínguez, Jesús;Martínez, José A.: Residualmodulus of elasticity and maxi-mum compressive strain inHSC and FRHSC after high-stress-level cyclic loading[fatigue; high-strength concrete;fibre-reinforced high-strengthconcrete; modulus of elasticity;maximum compressive strain] Issue 2 210–218
Yan, Dongming; Xu, Shilang;Chen, Genda; Li, Hedong: Biax-ial behaviour of plain concretesubjected to dynamic compres-sion with constant lateral stress[biaxial stress state; strain rate;dynamic strength; stress-straincurve; failure mode; concrete] Issue 2 202–209
Eurocode
Carpinteri, Alberto; Cadamuro,Erica; Corrado, Mauro: Mini-mum flexural reinforcement inrectangular and T-section con-crete beams [reinforced con-crete; code provisions; minimumreinforcement; dimensionalanalysis; size effects; cohesivecrack] Issue 3 361–372
Scott, Richard: Serviceabilityuncertainties in flat slabs [loadtests; finite element analysis;codes of practice] Issue 4 469–483
Siburg, Carsten; Hegger, Josef:Experimental investigations onthe punching behaviour ofreinforced concrete footingswith structural dimensions[Eurocode 2; footings; punchingshear; shear slenderless; sizeeffect; fib Model Code 2010] Issue 3 331–339
Siburg, Carsten; Ricker, Marcus;Hegger, Josef: Punching sheardesign of footings: criticalreview of different code provi-sions [punching; footing; fibModel Code 2010; Eurocode 2;tests] Issue 4 497–508
Souza, Osvaldo Luiz de Carvalho;Sánchez Filho, Emil de Souza;Vaz, Luiz Eloy; Silva Filho, JúlioJerônimo Holtz: Reliabilityanalysis of RC beams strength-ened for torsion with carbonfibre composites [reliabilityindex; torsion in RC beams; car-bon fibre composites] Issue 1 38–44
Theiner, Yvonne; Andreatta,Andreas; Hofstetter, Günter:Evaluation of models for esti-mating concrete strains due todrying shrinkage [shrinkage;prediction models; experiments] Issue 4 461–468

Annual table of contents 2014
12 Structural Concrete 15 www.ernst-und-sohn.de
Völgyi, István; Windisch, Andor;Farkas, György: Resistance ofreinforced concrete memberswith hollow circular cross-sec-tions under combined bendingand shear – Part I: experimen-tal investigation [combinedbending and shear behaviour;parametric experimental study;hollow circular cross-section;failure section; sliding surface] Issue 1 13–20
Won, Deok Hee; Park, Woo Sun;Jang, In-Sung; Han, Sang-Hun;Han, Taek Hee: Fire resistanceperformance of steel compositehollow RC column with innertube under ISO 834 standardfire [fire resistance; concrete;ISO 834; Eurocode] Issue 4 543–555
Execution of construction works
Clark, Gordon: Challenges forconcrete in tall buildings [tallbuildings; design; concretefloors; verticality] Issue 4 448–453
fib Model Code 2010
Belletti, Beatrice; Damoni, Cecilia;Hendriks, Max A. N.; de Boer,Ane: Analytical and numericalevaluation of the design shearresistance of reinforced con-crete slabs [reinforced concreteslabs; non-linear finite elementanalysis; shear resistance evalua-tion; guidelines; safety formats;design] Issue 3 317–330
Cairns, John: Staggered lap jointsfor tension reinforcement[lapped joints; bond; detailing] Issue 1 45–54
Castel, Arnaud; Gilbert, RaymondIan: Influence of time-depend-ent effects on the crack spacingin reinforced concrete beams[reinforced concrete; crack spac-ing; shrinkage; sustained load-ing; stirrup spacing; fib ModelCode 2010] Issue 3 373–379
Castel, Arnaud; Gilbert, RaymondIan: Influence of time-depend-ent effects on the crack spacingin reinforced concrete beams[reinforced concrete; crack spac-ing; shrinkage; sustained load-ing; stirrup spacing; fib ModelCode 2010] Issue 3 373–379
Groli, Giancarlo; Pérez Caldentey,Alejandro; Soto, AlejandroGiraldo: Cracking performanceof SCC reinforced with recy-cled fibres – an experimentalstudy [FRC; recycled steel fibres;crack width control; φ/ρs,ef;cover; sustainability; fib ModelCode 2010] Issue 2 136–153
Meneghetti, Leila Cristina; Garcez,Mônica Regina; da Silva Filho,Luiz Carlos Pinto; Gastal, Fran-cisco de Paula Simões Lopes;Bittencourt, Túlio Nogueira:Fatigue life of RC beamsstrengthened with FRP systems[fibre-reinforced polymers; RCbeams; aramid; carbon; fatigue] Issue 2 219–228
Randl, Norbert; Kunz, Jakob: Post-installed reinforcement connec-tions at ultimate and servicea-bility limit states [post-installedreinforcement; anchorage; split-ting; pullout; serviceability limitstate] Issue 4 563–574
Siburg, Carsten; Ricker, Marcus;Hegger, Josef: Punching sheardesign of footings: criticalreview of different code provi-sions [punching; footing; fibModel Code 2010; Eurocode 2;tests] Issue 4 497–508
Strauss, Alfred; Zimmermann,Thomas; Lehký, David; Novák,Drahomír; Keršner, Zbynek:Stochastic fracture-mechanicalparameters for the perform-ance-based design of concretestructures [fracture-mechanicalparameters; reliability; inverseanalysis; fracture energy; materi-als database] Issue 3 380–394
Theiner, Yvonne; Andreatta,Andreas; Hofstetter, Günter:Evaluation of models for esti-mating concrete strains due todrying shrinkage [shrinkage;prediction models; experiments] Issue 4 461–468
Urban, Susanne; Strauss, Alfred;Schütz, Robert; Bergmeister,Konrad; Dehlinger, Christian:Dynamically loaded concretestructures – monitoring-basedassessment of the real degree offatigue deterioration [concretefatigue; monitoring; deteriora-tion assessment] Issue 4 530–542
Völgyi, István; Windisch, Andor;Farkas, György: Resistance ofreinforced concrete memberswith hollow circular cross-sec-tions under combined bendingand shear – Part I: experimen-tal investigation [combinedbending and shear behaviour;parametric experimental study;hollow circular cross-section;failure section; sliding surface] Issue 1 13–20
Fire protection
Hertz, Kristian; Castberg, Andreas;Christensen, Jacob: Super-lightconcrete decks for buildingfloor slabs [super-light struc-tures; deck structures; precastconcrete; lightweight concrete;
13
Annual table of contents 2014
www.ernst-und-sohn.de Structural Concrete 15
prestressed concrete; structuraldesign; testing structural ele-ments] Issue 4 522–529
Van Coile, Ruben; Caspeele,Robby; Taerwe, Luc: Towards areliability-based post-fireassessment method for con-crete slabs incorporating infor-mation from inspection [fire;post-fire assessment; residualstrength; safety level; concreteslab] Issue 3 395–407
Won, Deok Hee; Park, Woo Sun;Jang, In-Sung; Han, Sang-Hun;Han, Taek Hee: Fire resistanceperformance of steel compositehollow RC column with innertube under ISO 834 standardfire [fire resistance; concrete;ISO 834; Eurocode] Issue 4 543–555
Won, Deok Hee; Park, Woo Sun;Yi, Jin-Hak; Han, Sang-Hun;Han, Taek Hee: Effect of weld-ing heat on precast steel com-posite hollow columns [welding;heat; column; precast; concrete] Issue 3 350–360
General
Clark, Gordon: Challenges forconcrete in tall buildings [tallbuildings; design; concretefloors; verticality] Issue 4 448–453
Dahl, Kaare K. B.: Bella Sky Hotel– taking precast concrete to thelimit [precast concrete; structur-al behaviour; hotel; complexgeometry; leaning building] Issue 4 441–447
Hertz, Kristian; Castberg, Andreas;Christensen, Jacob: Super-lightconcrete decks for buildingfloor slabs [super-light struc-tures; deck structures; precastconcrete; lightweight concrete;prestressed concrete; structuraldesign; testing structural ele-ments] Issue 4 522–529
Krokstrand, Ole H.; Ramstad,Reiulf; Hölmebakk, Carl-Viggo:Splendid concrete architecturein National Tourist Routes inNorway [concrete architecture;scenic view; tourist routes; Nor-way] Issue 2 117–125
Mancini, Giuseppe; Tondolo,Francesco: Effect of bonddegradation due to corrosion –a literature survey [bond degra-dation; corrosion rate; experi-mental procedure] Issue 3 408–418
Meneghetti, Leila Cristina; Garcez,Mônica Regina; da Silva Filho,Luiz Carlos Pinto; Gastal, Fran-cisco de Paula Simões Lopes;Bittencourt, Túlio Nogueira:Fatigue life of RC beamsstrengthened with FRP systems
[fibre-reinforced polymers; RCbeams; aramid; carbon; fatigue] Issue 2 219–228
Völgyi, István; Windisch, Andor:Resistance of reinforced con-crete members with hollow cir-cular cross-section under com-bined bending and shear – PartII: New calculation model[behaviour under combinedbending and shear; hollow circu-lar cross-section; contribution ofcompressed concrete to shearresistance; sliding surface] Issue 1 21–29
Wilhelm, Sebastian; Curbach, Man-fred: Review of possible miner-al materials and productiontechniques for a building mate-rial on the moon [mineral mate-rials; lunar base design; buildingmaterials; lunar concrete; castbasalt; sulphur concrete; moon;lunar environment; lunarcement; DMSI] Issue 3 419–428
History of building
Onysyk, Jerzy; Biliszczuk, Jan;Prabucki, Przemyslaw; Sadows-ki, Krzysztof; Toczkiewicz,Robert: Strengthening the 100-year-old reinforced concretedome of the Centennial Hall inWrocław [pioneering concretestructure; renovation; FEManalysis; strengthening] Issue 1 30–37
Prestressed concrete
Cervenka, Vladimir; Ganz, HansRudolf: Validation of post-ten-sioning anchorage zones bylaboratory testing and numeri-cal simulation [anchorage;numerical analysis; testing] Issue 2 258–268
Gama, David; Almeida, João F.:Concrete integral abutmentbridges with reinforced con-crete piles [prestressed concretebridges; integral abutmentbridges; reinforced concretepiles; imposed deformations;soil-structure interaction; levelsof approximation] Issue 3 292–304
Podroužek, Jan; Strauss, Alfred;Bergmeister, Konrad: Robust-ness-based performance assess-ment of a prestressed concretebridge [robustness; existingstructure; reliability; perform-ance indicators; safety; stochas-tic methods] Issue 2 248–257
Annual table of contents 2014
14 Structural Concrete 15 www.ernst-und-sohn.de
Reinforcement
Abbas, Ali A.; Mohsin, Sharifah M.Syed; Cotsovos, Demetrios M.:Non-linear analysis of staticallyindeterminate SFRC columns[fibre-reinforced concrete; finiteelement methods; structuralanalysis] Issue 1 94–105
Abdellahi, Majid; Heidari, Javad;Bahmanpour, Maryam: A newpredictive model for the bondstrength of FRP-to-concretecomposite joints [bond strength;model; GEP; FRP; composite] Issue 4 509–521
Cairns, John: Staggered lap jointsfor tension reinforcement[lapped joints; bond; detailing] Issue 1 45–54
Carpinteri, Alberto; Cadamuro,Erica; Corrado, Mauro: Mini-mum flexural reinforcement inrectangular and T-section con-crete beams [reinforced con-crete; code provisions; minimumreinforcement; dimensionalanalysis; size effects; cohesivecrack] Issue 3 361–372
Groli, Giancarlo; Pérez Caldentey,Alejandro; Soto, AlejandroGiraldo: Cracking performanceof SCC reinforced with recy-cled fibres – an experimentalstudy [FRC; recycled steel fibres;crack width control; φ/ρs,ef;cover; sustainability; fib ModelCode 2010] Issue 2 136–153
Mancini, Giuseppe; Tondolo,Francesco: Effect of bonddegradation due to corrosion –a literature survey [bond degra-dation; corrosion rate; experi-mental procedure] Issue 3 408–418
Messari-Becker, Lamia; Mettke,Angelika; Knappe, Florian; Storck, Ulrich; Bollinger, Klaus;Grohmann, Manfred: Recyclingconcrete in practice – a chancefor sustainable resource man-agement [recycled concrete; greyenergy; sustainable construction;building materials; resourcemanagement; life cycle assess-ment] Issue 4 556–562
Ozden, Sevket; Atalay, Hilal M.;Akpinar, Erkan; Erdogan,Hakan; Vulas, Yılmaz Zafer:Shear strengthening of rein-forced concrete T-beams withfully or partially bonded fibre-reinforced polymer composites[reinforced concrete; beam shearstrengthening; fibre-reinforcedpolymer; anchorage; partiallybonded FRP; modulus of elastici-ty; composite] Issue 2 229–239
Reinhardt, Hans-Wolf: Aspects ofimposed deformation in con-crete structures – a condensedoverview [imposed deformation;
fresh concrete; shrinkage; youngconcrete; cracking] Issue 4 454–460
Völgyi, István; Windisch, Andor:Resistance of reinforced con-crete members with hollow cir-cular cross-section under com-bined bending and shear – PartII: New calculation model[behaviour under combinedbending and shear; hollow circu-lar cross-section; contribution ofcompressed concrete to shearresistance; sliding surface] Issue 1 21–29
Yuan, Yong; Chi, Yang: Water per-meability of concrete underuniaxial tension [reinforced con-crete; structural member; waterpermeability; tensioned element;permeating test] Issue 2 191–201
Standards, regulations, guidelines, directives
Aboutalebi, Morteza; Alani, AmirM.; Rizzuto, Joseph; Beckett,Derrick: Structural behaviourand deformation patterns inloaded plain concrete ground-supported slabs [ground-sup-ported slab; displacement; crackpropagation; bending; punching] Issue 1 81–93
Belletti, Beatrice; Damoni, Cecilia;Hendriks, Max A. N.; de Boer,Ane: Analytical and numericalevaluation of the design shearresistance of reinforced con-crete slabs [reinforced concreteslabs; non-linear finite elementanalysis; shear resistance evalua-tion; guidelines; safety formats;design] Issue 3 317–330
Carpinteri, Alberto; Cadamuro,Erica; Corrado, Mauro: Mini-mum flexural reinforcement inrectangular and T-section con-crete beams [reinforced con-crete; code provisions; minimumreinforcement; dimensionalanalysis; size effects; cohesivecrack] Issue 3 361–372
Nyhus, Bente Skovseth: Consistentpractical design of concretestructures [concrete design;practical design; consistent stiff-ness method; non-linear analy-sis; shear design; MCFT; safety;cost effective] Issue 3 305–316
Theiner, Yvonne; Andreatta,Andreas; Hofstetter, Günter:Evaluation of models for esti-mating concrete strains due todrying shrinkage [shrinkage;prediction models; experiments] Issue 4 461–468
Völgyi, István; Windisch, Andor;Farkas, György: Resistance ofreinforced concrete memberswith hollow circular cross-sec-tions under combined bendingand shear – Part I: experimen-
15
Annual table of contents 2014
www.ernst-und-sohn.de Structural Concrete 15
tal investigation [combinedbending and shear behaviour;parametric experimental study;hollow circular cross-section;failure section; sliding surface] Issue 1 13–20
Testing/experiments
Aboutalebi, Morteza; Alani, AmirM.; Rizzuto, Joseph; Beckett,Derrick: Structural behaviourand deformation patterns inloaded plain concrete ground-supported slabs [ground-sup-ported slab; displacement; crackpropagation; bending; punching] Issue 1 81–93
Alani, Amir M.; Aboutalebi,Morteza; Kilic, Gokhan: Use ofnon-contact sensors (IBIS-S)and finite element methods inthe assessment of bridge deckstructures [finite element model-ling; bridge health monitoring;IBIS-S sensor; ANSYS] Issue 2 240–247
Breitenbücher, Rolf; Meschke,Günther; Song, Fanbing; Zhan,Yijian: Experimental, analyticaland numerical analysis of thepullout behaviour of steelfibres considering differentfibre types, inclinations andconcrete strengths [steel fibre;pullout behaviour; laboratorytest; analytical modelling;numerical simulation] Issue 2 126–135
Cairns, John: Staggered lap jointsfor tension reinforcement[lapped joints; bond; detailing] Issue 1 45–54
Cervenka, Vladimir; Ganz, HansRudolf: Validation of post-ten-sioning anchorage zones bylaboratory testing and numeri-cal simulation [anchorage;numerical analysis; testing] Issue 2 258–268
Fan, Yuhui; Xiao, Jianzhuang;Tam, Vivian W. Y.: Effect of oldattached mortar on the creep ofrecycled aggregate concrete[recycled aggregate concrete; oldadhering mortar; shrinkage;creep; influence mechanism] Issue 2 169–178
Groli, Giancarlo; Pérez Caldentey,Alejandro; Soto, AlejandroGiraldo: Cracking performanceof SCC reinforced with recy-cled fibres – an experimentalstudy [FRC; recycled steel fibres;crack width control; φ/ρs,ef;cover; sustainability; fib ModelCode 2010] Issue 2 136–153
Hertz, Kristian; Castberg, Andreas;Christensen, Jacob: Super-lightconcrete decks for buildingfloor slabs [super-light struc-tures; deck structures; precastconcrete; lightweight concrete;prestressed concrete; structural
design; testing structural ele-ments] Issue 4 522–529
Kollegger, Johann; Foremniak,Sara; Suza, Dominik; Wimmer,David; Gmainer, Susanne:Building bridges using the bal-anced lift method [precast con-crete elements; post-tensioning;bridge construction method;large-scale test] Issue 3 281–291
Korte, Sara; Boel, Veerle; DeCorte, Wouter; De Schutter,Geert: Behaviour of fatigueloaded self-compacting con-crete compared to vibratedconcrete [self-compacting con-crete; vibrated concrete; cyclicloading; fatigue; S-N curve;crack growth] Issue 4 575–589
Magnusson, Johan; Hallgren,Mikael; Ansell, Anders: Shear inconcrete structures subjected todynamic loads [dynamic loads;impulsive loads; rise time; shear;initial response; support reac-tions; arch action] Issue 1 55–65
Meneghetti, Leila Cristina; Garcez,Mônica Regina; da Silva Filho,Luiz Carlos Pinto; Gastal, Fran-cisco de Paula Simões Lopes;Bittencourt, Túlio Nogueira:Fatigue life of RC beamsstrengthened with FRP systems[fibre-reinforced polymers; RCbeams; aramid; carbon; fatigue] Issue 2 219–228
Ozden, Sevket; Atalay, Hilal M.;Akpinar, Erkan; Erdogan,Hakan; Vulas, Yılmaz Zafer:Shear strengthening of rein-forced concrete T-beams withfully or partially bonded fibre-reinforced polymer composites[reinforced concrete; beam shearstrengthening; fibre-reinforcedpolymer; anchorage; partiallybonded FRP; modulus of elastici-ty; composite] Issue 2 229–239
Prince, M. John Robert; Singh,Bhupinder: Investigation ofbond behaviour between recy-cled aggregate concrete anddeformed steel bars [coarserecycled concrete aggregate;replacement percentage; naturalcoarse aggregate; bond; pulloutfailure; splitting failure; normal-ized bond strength] Issue 2 154–168
Scott, Richard: Serviceabilityuncertainties in flat slabs [loadtests; finite element analysis;codes of practice] Issue 4 469–483
Siburg, Carsten; Hegger, Josef:Experimental investigations onthe punching behaviour ofreinforced concrete footingswith structural dimensions[Eurocode 2; footings; punchingshear; shear slenderless; sizeeffect; fib Model Code 2010] Issue 3 331–339
Annual table of contents 2014
16 Structural Concrete 15 www.ernst-und-sohn.de
Siburg, Carsten; Ricker, Marcus;Hegger, Josef: Punching sheardesign of footings: criticalreview of different code provi-sions [punching; footing; fibModel Code 2010; Eurocode 2;tests] Issue 4 497–508
Strauss, Alfred; Zimmermann,Thomas; Lehký, David; Novák,Drahomír; Keršner, Zbynek:Stochastic fracture-mechanicalparameters for the perform-ance-based design of concretestructures [fracture-mechanicalparameters; reliability; inverseanalysis; fracture energy; materi-als database] Issue 3 380–394
Theiner, Yvonne; Andreatta,Andreas; Hofstetter, Günter:Evaluation of models for esti-mating concrete strains due todrying shrinkage [shrinkage;prediction models; experiments] Issue 4 461–468
Urban, Susanne; Strauss, Alfred;Schütz, Robert; Bergmeister,Konrad; Dehlinger, Christian:Dynamically loaded concretestructures – monitoring-basedassessment of the real degree offatigue deterioration [concretefatigue; monitoring; deteriora-tion assessment] Issue 4 530–542
Vicente, Miguel A.; González,Dorys C.; Mínguez, Jesús;Martínez, José A.: Residualmodulus of elasticity and maxi-mum compressive strain inHSC and FRHSC after high-stress-level cyclic loading[fatigue; high-strength concrete;fibre-reinforced high-strengthconcrete; modulus of elasticity;maximum compressive strain] Issue 2 210–218
Völgyi, István; Windisch, Andor;Farkas, György: Resistance ofreinforced concrete memberswith hollow circular cross-sec-tions under combined bendingand shear – Part I: experimen-tal investigation [combinedbending and shear behaviour;parametric experimental study;hollow circular cross-section;failure section; sliding surface] Issue 1 13–20
Winkler, Karsten; Mark, Peter;Heek, Peter; Rohländer, Sandra;Sommer, Simone: Punchingshear tests on symmetricallyreduced slab quarters [punchingshear; innovative test setup; axissymmetry; experiments; quar-tered slab] Issue 4 484–496
Xiao, Jianzhuang; Li, Long; Tam,Vivian W.Y.; Li, Hong: Thestate of the art regarding thelong-term properties of recy-cled aggregate concrete [recy-cled aggregate concrete; long-term properties; shrinkage andcreep; carbonation resistance;impermeability; fatigue behav-iour] Issue 1 3–12
Yan, Dongming; Xu, Shilang;Chen, Genda; Li, Hedong: Biax-ial behaviour of plain concretesubjected to dynamic compres-sion with constant lateral stress[biaxial stress state; strain rate;dynamic strength; stress-straincurve; failure mode; concrete] Issue 2 202–209
Yuan, Yong; Chi, Yang: Water per-meability of concrete underuniaxial tension [reinforced con-crete; structural member; waterpermeability; tensioned element;permeating test] Issue 2 191–201
Tunnelling
Liu, Xian; Jiang, Wei; De Schutter,Geert; Yuan, Yong; Su, Quanke:Early-age behaviour of precastconcrete immersed tunnelbased on degree of hydrationconcept [precast immersed tun-nel; early-age cracking; degree ofhydration; creep under varyingstress levels] Issue 1 66–80
Liu, Xian; Yuan, Yong; Su,Quanke: Sensitivity analysis ofthe early-age cracking risk inan immersed tunnel [immersedtunnel; early-age cracking; sensi-tivity analysis; curing scheme] Issue 2 179–190