Embed Size (px)
Citation preview

Structural Change in Manufacturing
Mark SchweitzerFederal Reserve Bank of Cleveland
April 27, 2004
Outline
• The current situation and the business cycle
• Look inside manufacturing productivity growth
• Where are the workers going?

The Current Employment Situation
0
5
10
15
20
25
30
35
1947 1952 1957 1962 1967 1972 1977 1982 1987 1992 1997 2002
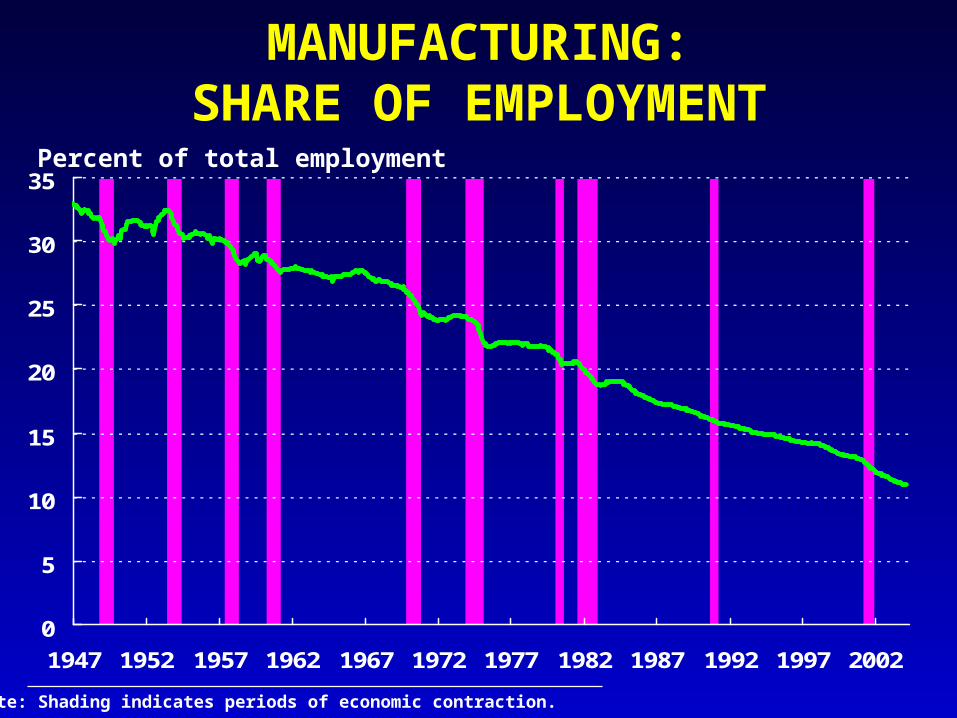
MANUFACTURING:SHARE OF EMPLOYMENT
Percent of total employment
Note: Shading indicates periods of economic contraction.
0
5
10
15
20
25
1947 1952 1957 1962 1967 1972 1977 1982 1987 1992 1997 2002
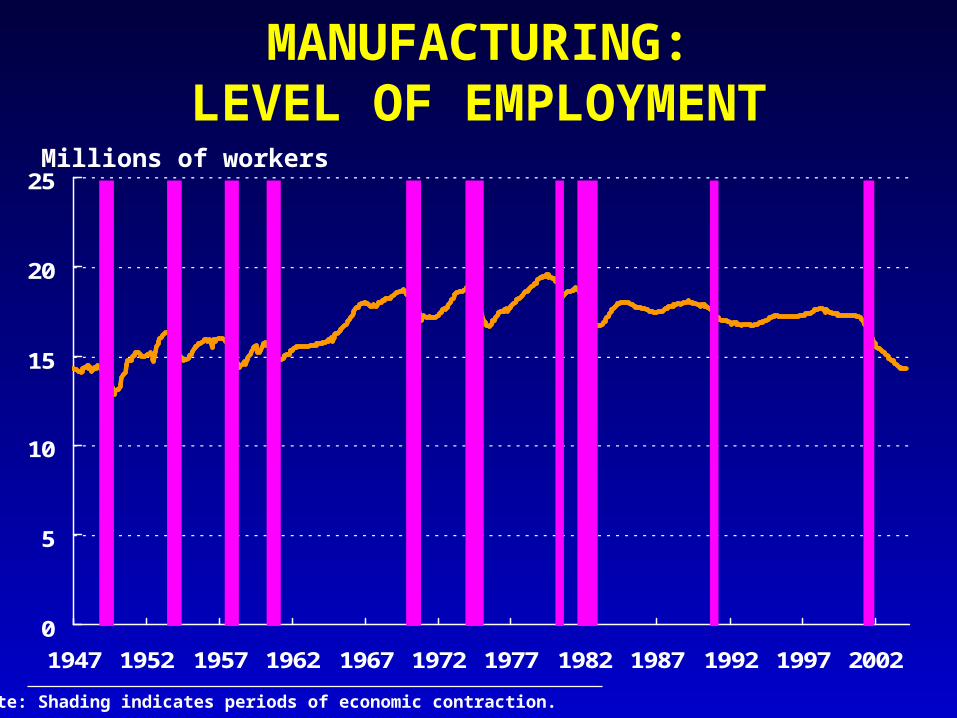
MANUFACTURING:LEVEL OF EMPLOYMENT
Millions of workers
Note: Shading indicates periods of economic contraction.
-20
-15
-10
-5
0
5
10
0 3 6 9 12 15 18 21 24 27 30 33 36
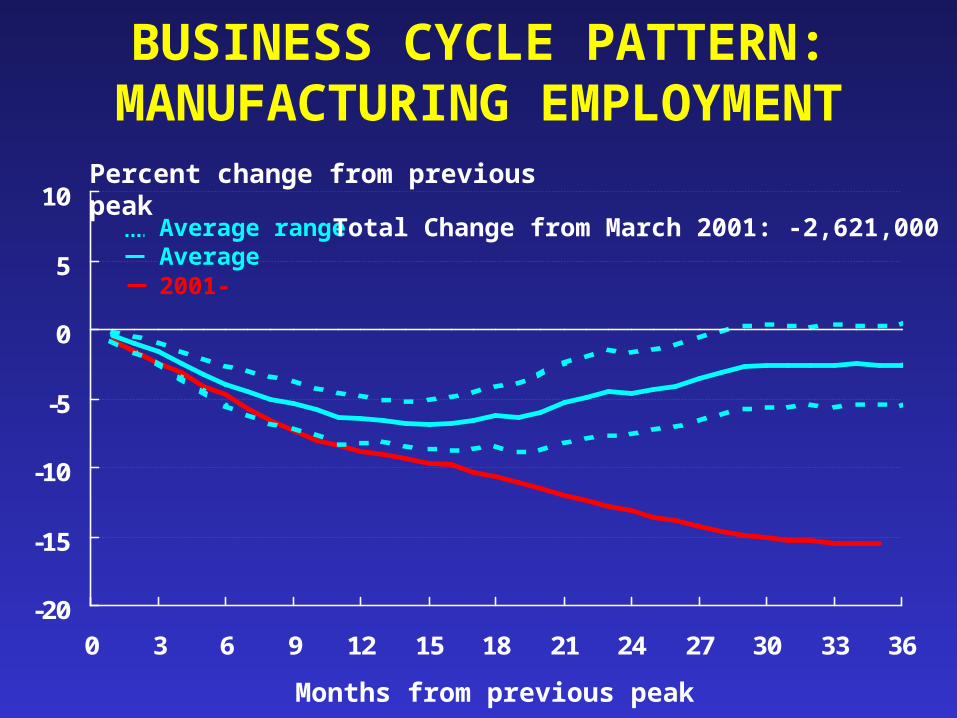
BUSINESS CYCLE PATTERN: MANUFACTURING EMPLOYMENT
Months from previous peak
2001-
Percent change from previous peak
AverageAverage range Total Change from March 2001: -2,621,000
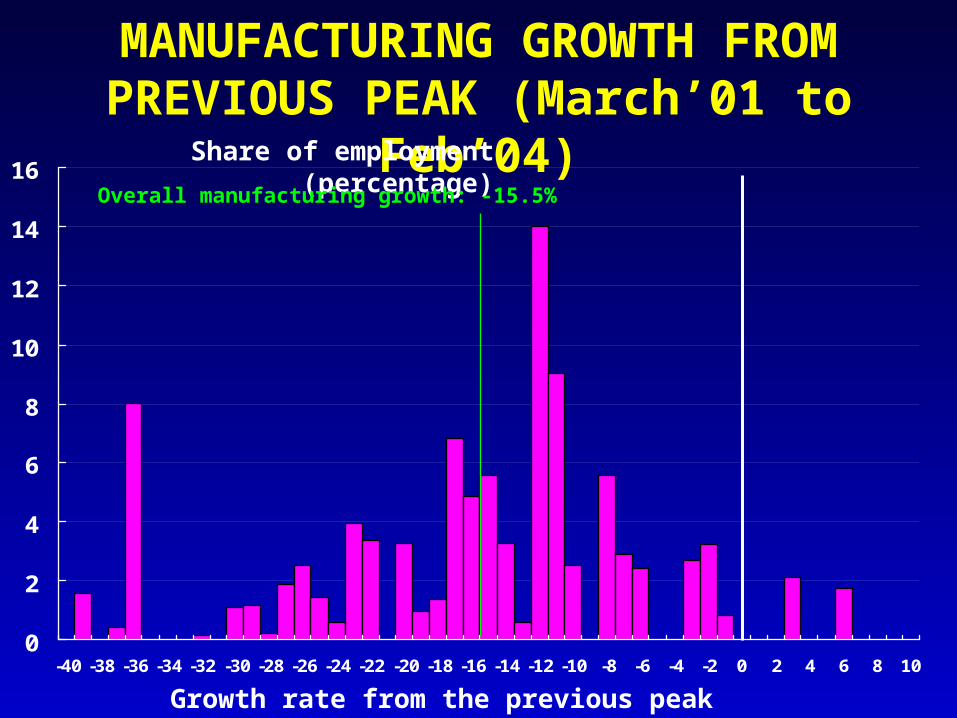
0
2
4
6
8
10
12
14
16
-40 -38 -36 -34 -32 -30 -28 -26 -24 -22 -20 -18 -16 -14 -12 -10 -8 -6 -4 -2 0 2 4 6 8 10
MANUFACTURING GROWTH FROM PREVIOUS PEAK (March’01 to Feb’04)
Growth rate from the previous peak
Share of employment (percentage)Overall manufacturing growth: -15.5%
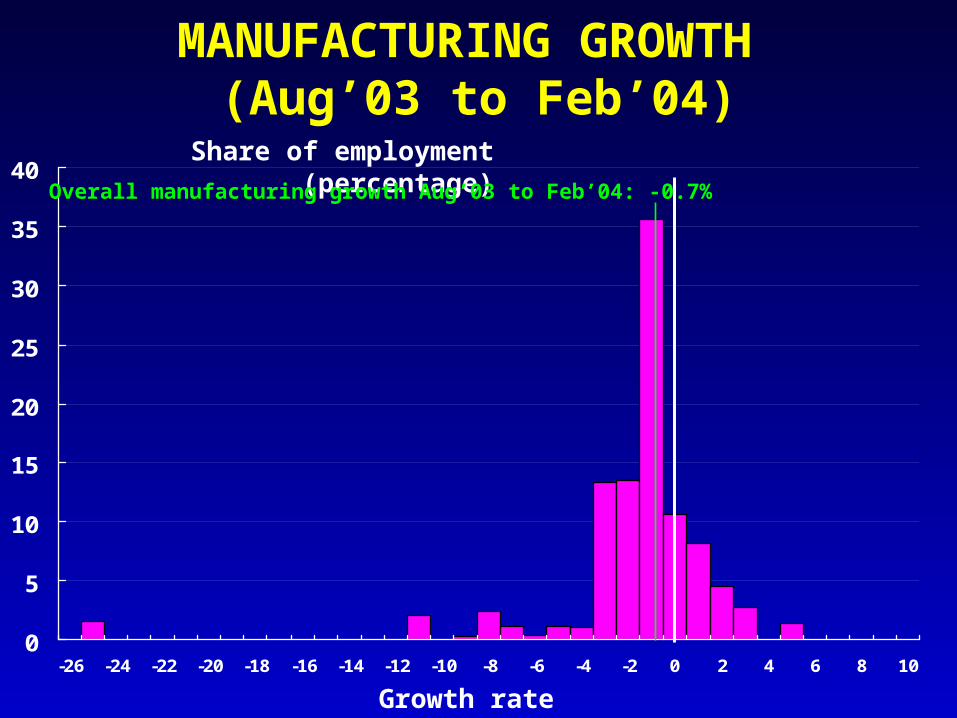
0
5
10
15
20
25
30
35
40
-26 -24 -22 -20 -18 -16 -14 -12 -10 -8 -6 -4 -2 0 2 4 6 8 10
MANUFACTURING GROWTH (Aug’03 to Feb’04)
Growth rate
Share of employment (percentage)Overall manufacturing growth Aug’03 to Feb’04: -0.7%
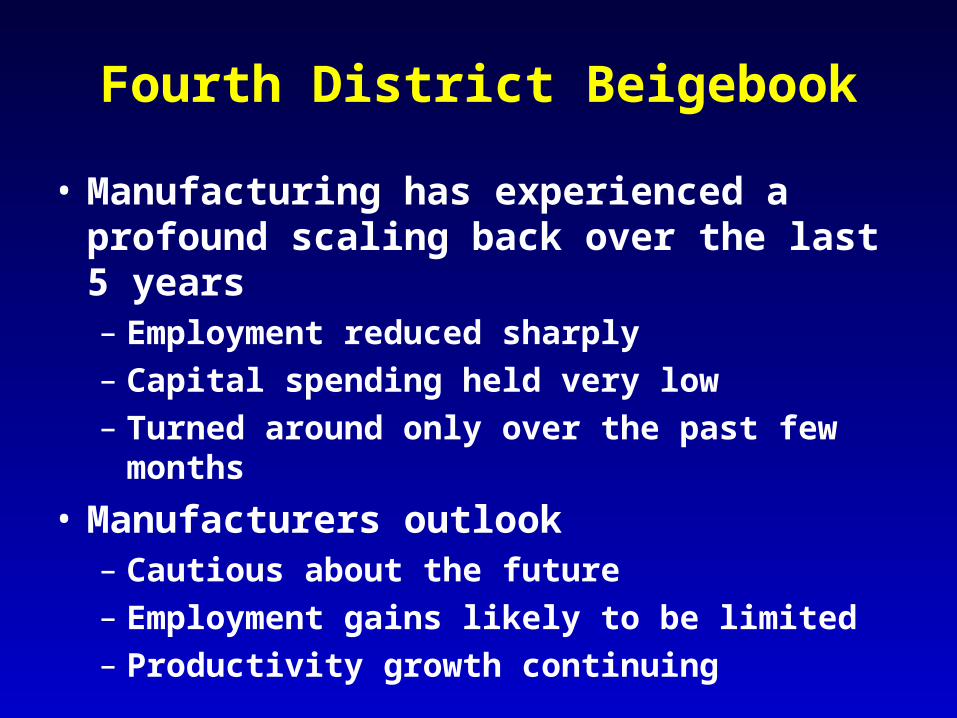
Fourth District Beigebook
• Manufacturing has experienced a profound scaling back over the last 5 years– Employment reduced sharply
– Capital spending held very low
– Turned around only over the past few months
• Manufacturers outlook– Cautious about the future
– Employment gains likely to be limited
– Productivity growth continuing

Looking Inside the Productivity Machine
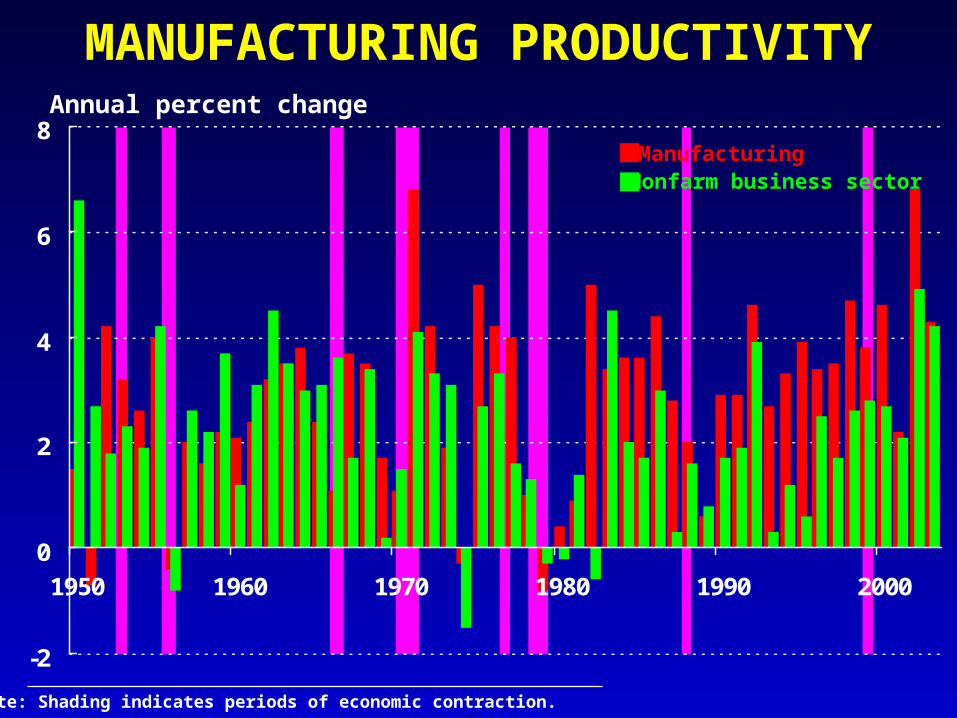
-2
0
2
4
6
8
1950 1960 1970 1980 1990 2000
MANUFACTURING PRODUCTIVITYAnnual percent change
Note: Shading indicates periods of economic contraction.
ManufacturingNonfarm business sector
BLS INDUSTRYPRODUCTIVITY PROGRAM
• The Bureau of Labor Statistics produces annual measures of productivity by detailed industry– Manufacturing Industries
• Data provide nearly complete coverage• 4-digit NAICS industries (e.g., basic chemicals or
industrial machinery)
– Services Industries • Data provide coverage of about half of the service sector• 4-digit NAICS industries (e.g., full service restaurants or
automotive repair and maintenance)• The industries for which data are available are the ones
with the most reliable productivity measures
0
4
8
12
16
20
24
28
-20 -15 -10 -5 0 5 10 15 20 25 30
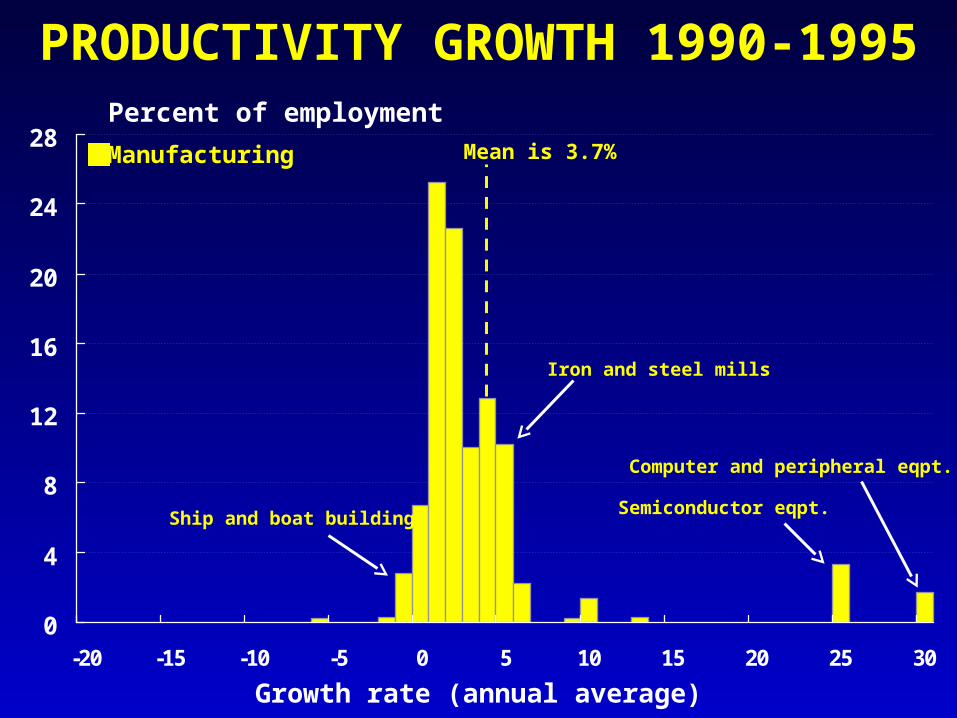
PRODUCTIVITY GROWTH 1990-1995
Growth rate (annual average)
Percent of employment
Manufacturing
Computer and peripheral eqpt.
Iron and steel mills
Ship and boat building
Mean is 3.7%
Semiconductor eqpt.
0
4
8
12
16
20
24
28
-20 -15 -10 -5 0 5 10 15 20 25 30
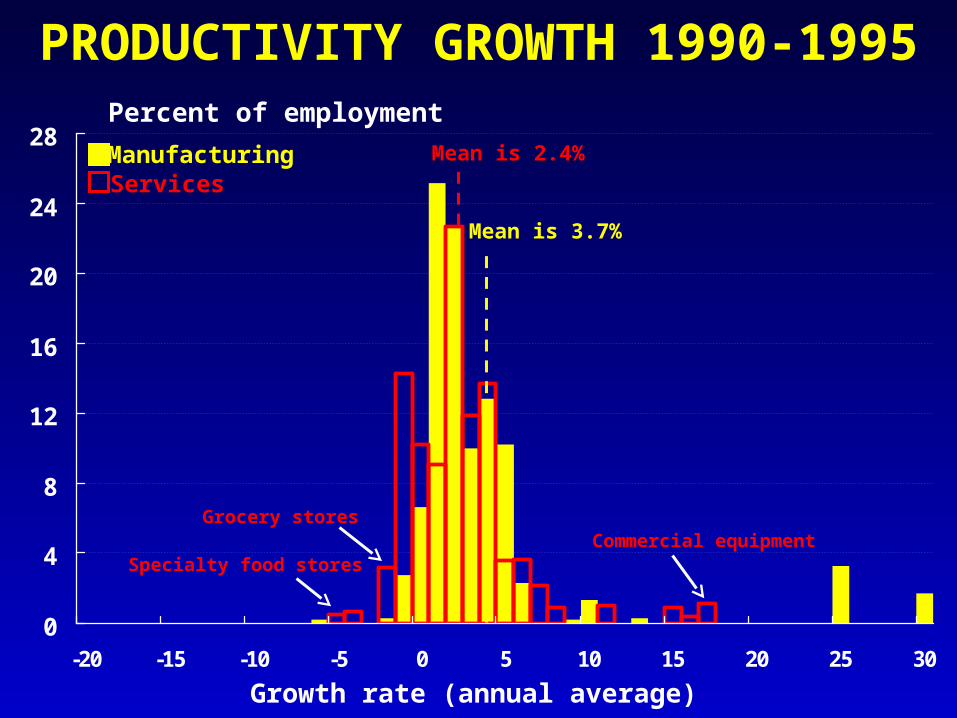
PRODUCTIVITY GROWTH 1990-1995
Growth rate (annual average)
Percent of employment
ManufacturingServices
Commercial equipmentSpecialty food stores
Grocery stores
Mean is 2.4%
Mean is 3.7%
0
5
10
15
20
25
30
35
40
-20 -15 -10 -5 0 5 10 15 20 25 30
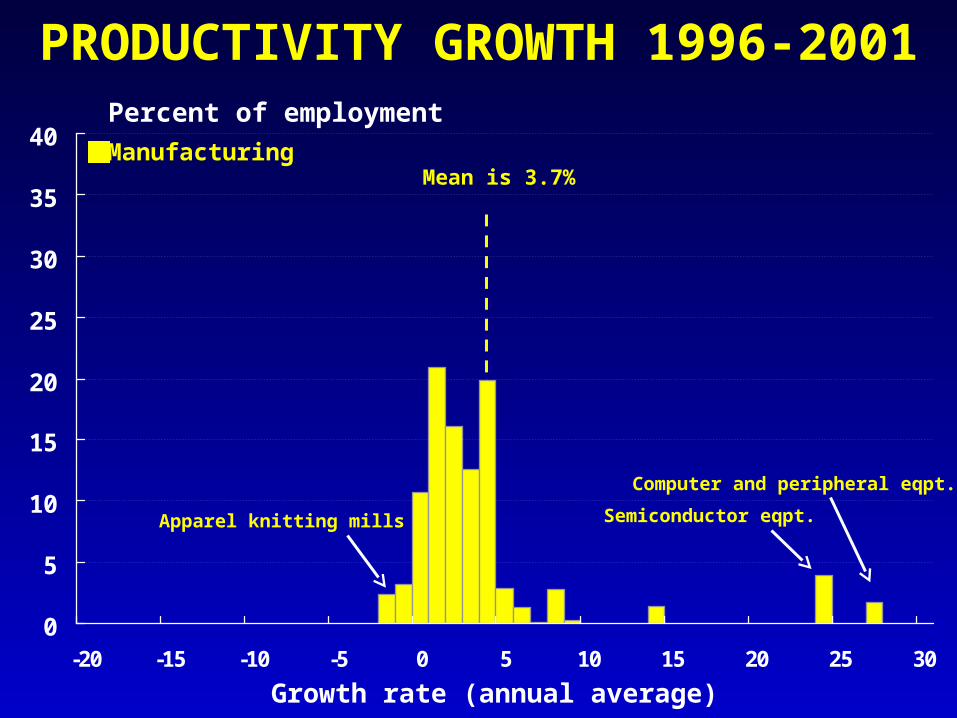
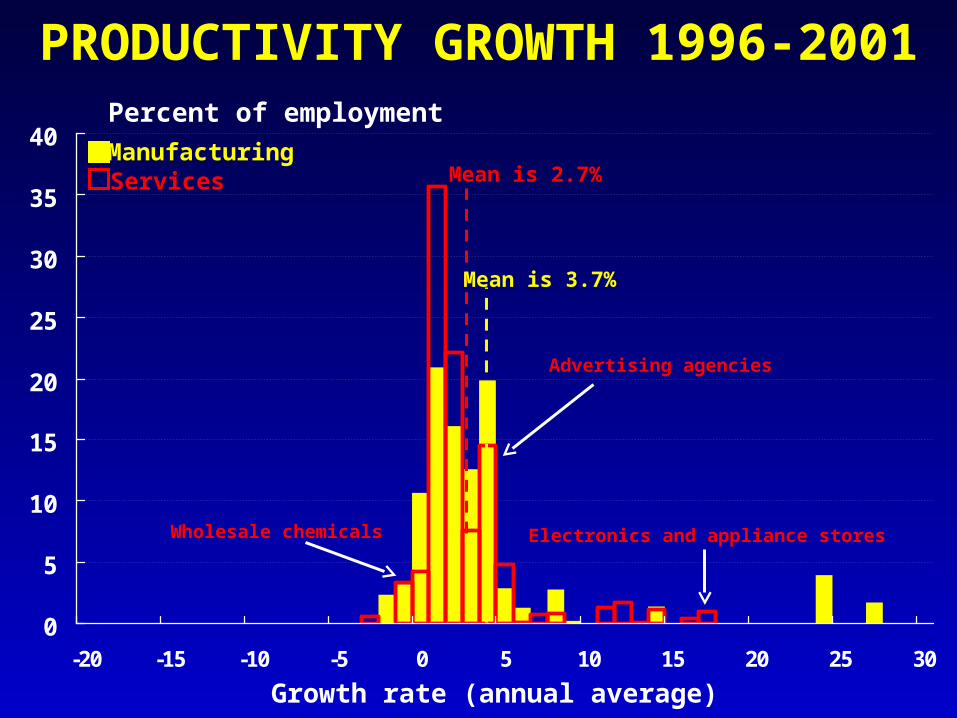
PRODUCTIVITY GROWTH 1996-2001
Growth rate (annual average)
Percent of employment
Manufacturing
Computer and peripheral eqpt.
Semiconductor eqpt.Apparel knitting mills
Mean is 3.7%
0
5
10
15
20
25
30
35
40
-20 -15 -10 -5 0 5 10 15 20 25 30
PRODUCTIVITY GROWTH 1996-2001
Growth rate (annual average)
Percent of employment
ManufacturingServices
Wholesale chemicals Electronics and appliance stores
Advertising agencies
Mean is 2.7%
Mean is 3.7%
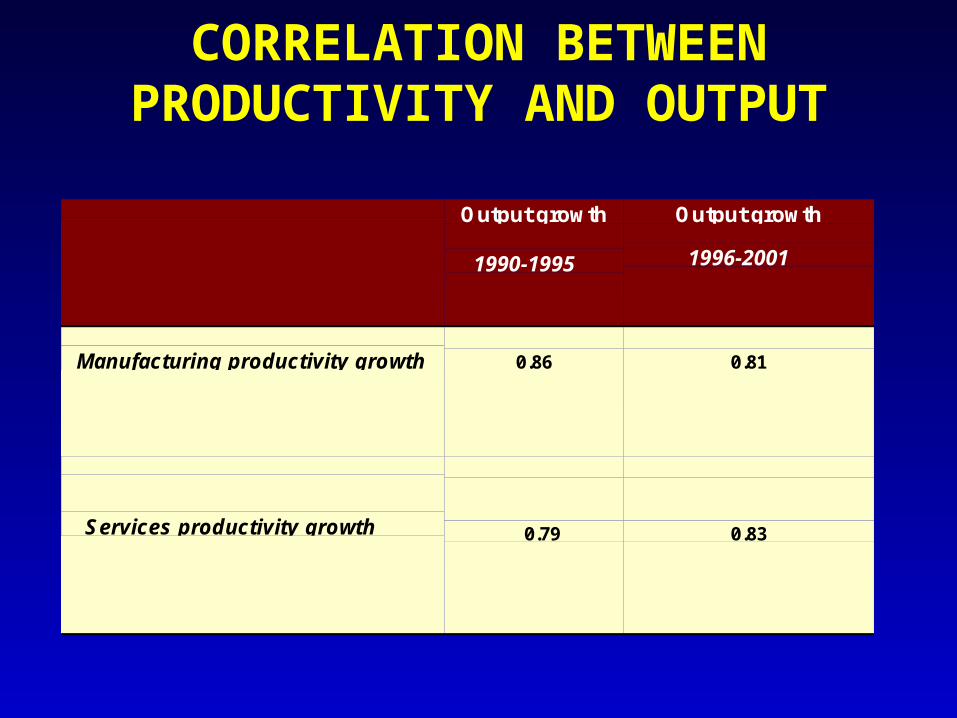
CORRELATION BETWEEN PRODUCTIVITY AND OUTPUT
Output growth
1990-1995
Output growth
1996-2001
Manufacturing productivity growth 0.86 0.81
Services productivity growth 0.79 0.83
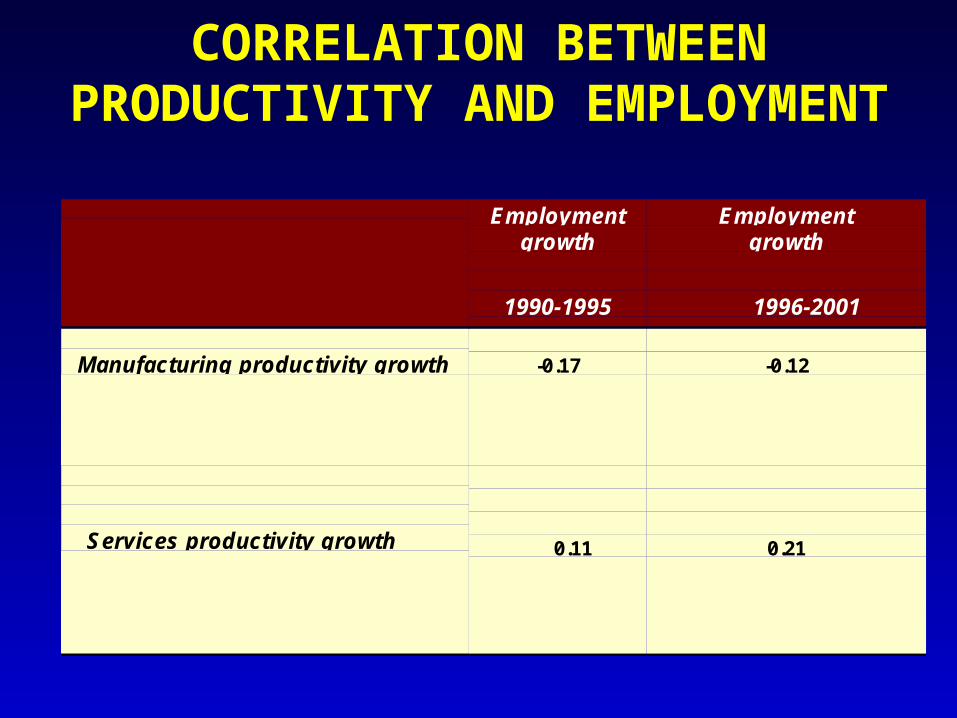
CORRELATION BETWEEN PRODUCTIVITY AND EMPLOYMENT
Employmentgrowth
1990-1995
Employmentgrowth
1996-2001
Manufacturing productivity growth -0.17 -0.12
Services productivity growth 0.11 0.21

Where Have the Workers Gone?
-4
-2
0
2
4
6
0 3 6 9 12 15 18 21 24 27 30 33 36
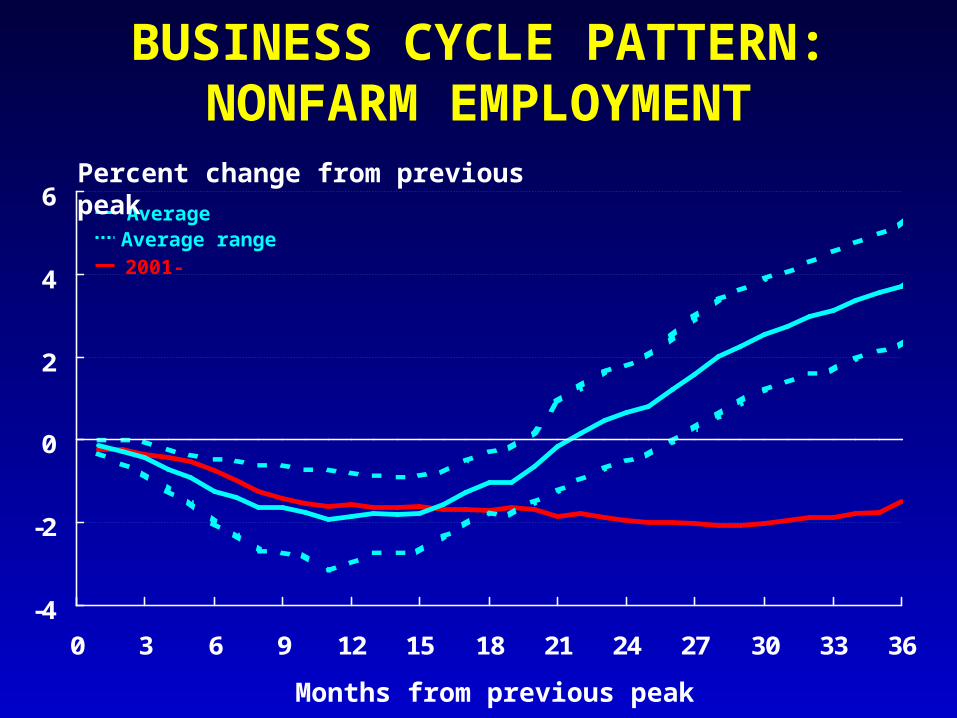
BUSINESS CYCLE PATTERN: NONFARM EMPLOYMENT
Months from previous peak
2001-Average rangeAverage
Percent change from previous peak
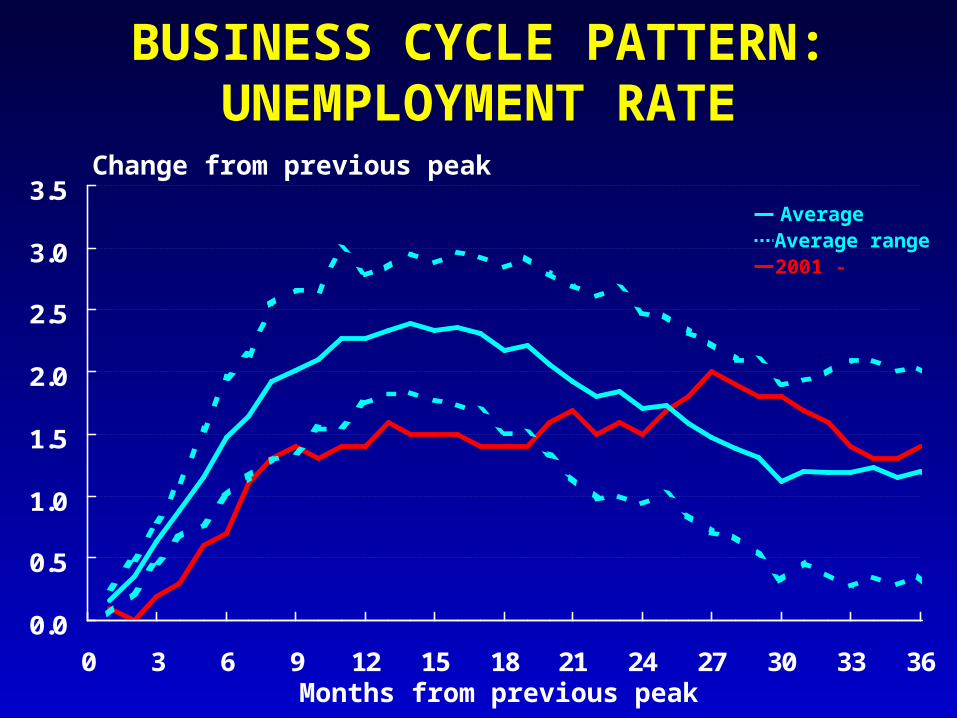
0.0
0.5
1.0
1.5
2.0
2.5
3.0
3.5
0 3 6 9 12 15 18 21 24 27 30 33 36
BUSINESS CYCLE PATTERN: UNEMPLOYMENT RATE
Months from previous peak
Change from previous peak
2001 -Average rangeAverage
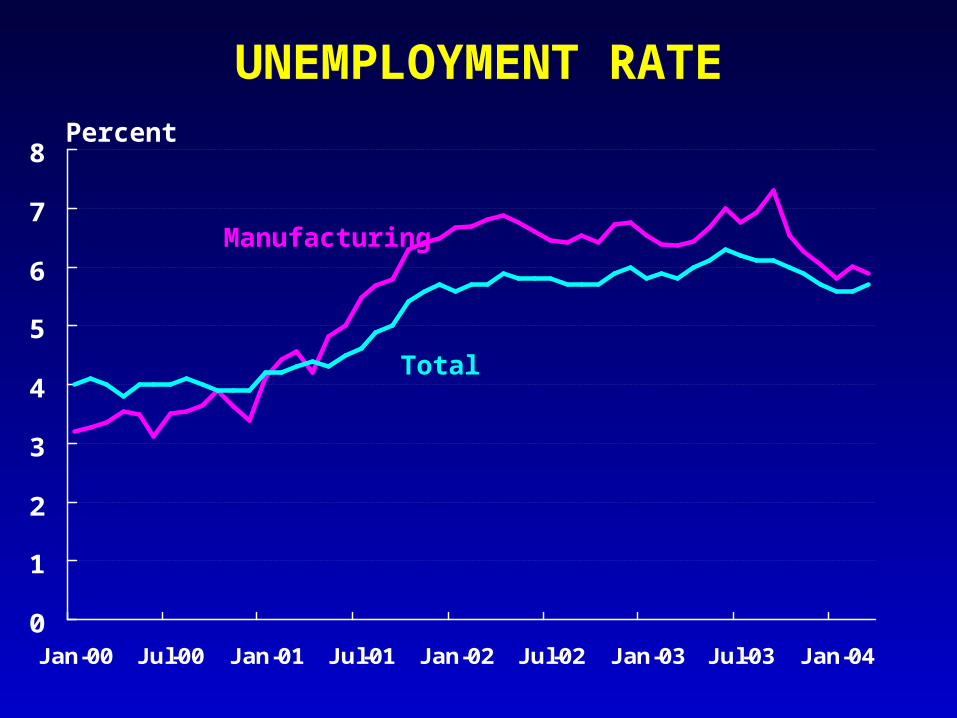
0
1
2
3
4
5
6
7
8
Jan-00 Jul-00 Jan-01 Jul-01 Jan-02 Jul-02 Jan-03 Jul-03 Jan-04
UNEMPLOYMENT RATEPercent
Manufacturing
Total
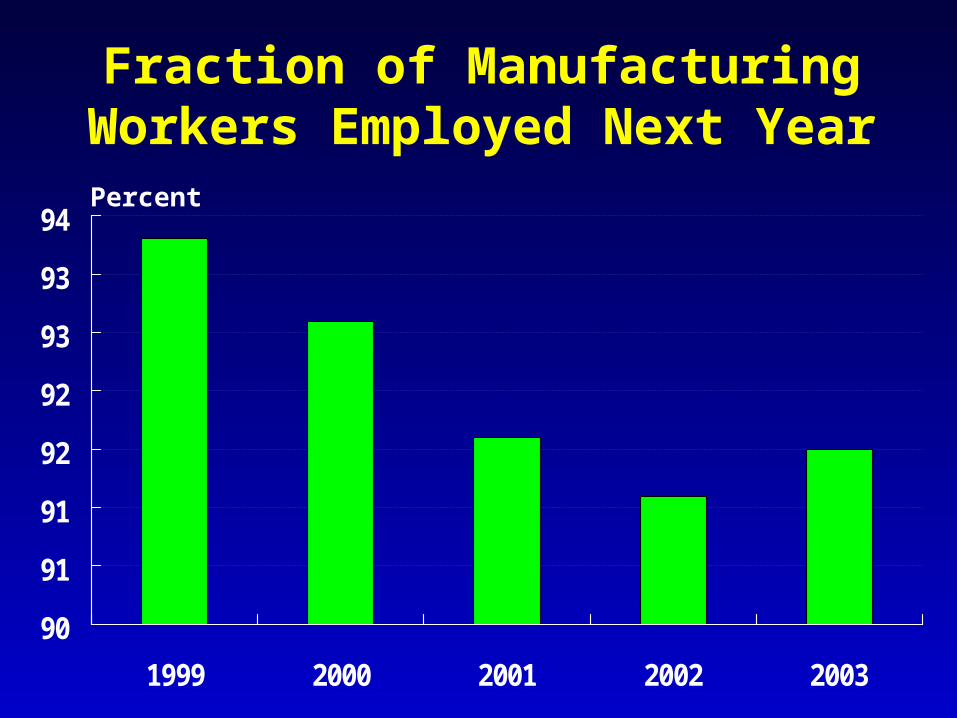
Fraction of Manufacturing Workers Employed Next Year
90
91
91
92
92
93
93
94
1999 2000 2001 2002 2003
Percent
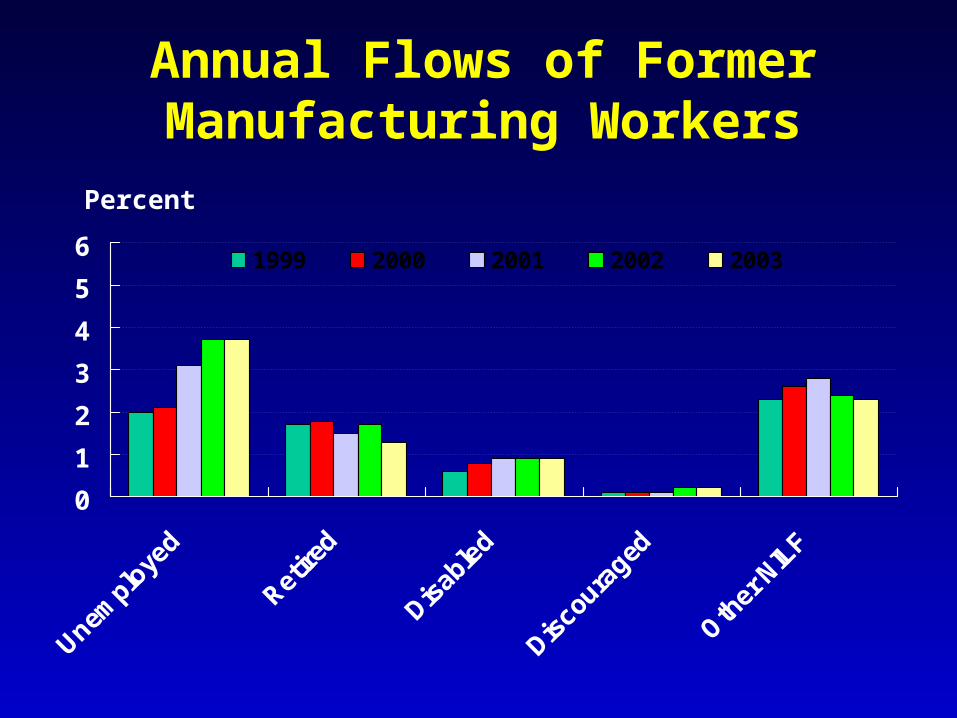
Annual Flows of Former Manufacturing Workers
0
1
2
3
4
5
6
Unempl
oyed
Retire
d
Disab
led
Disco
uraged
Oth
er N
ILF
1999 2000 2001 2002 2003
Percent
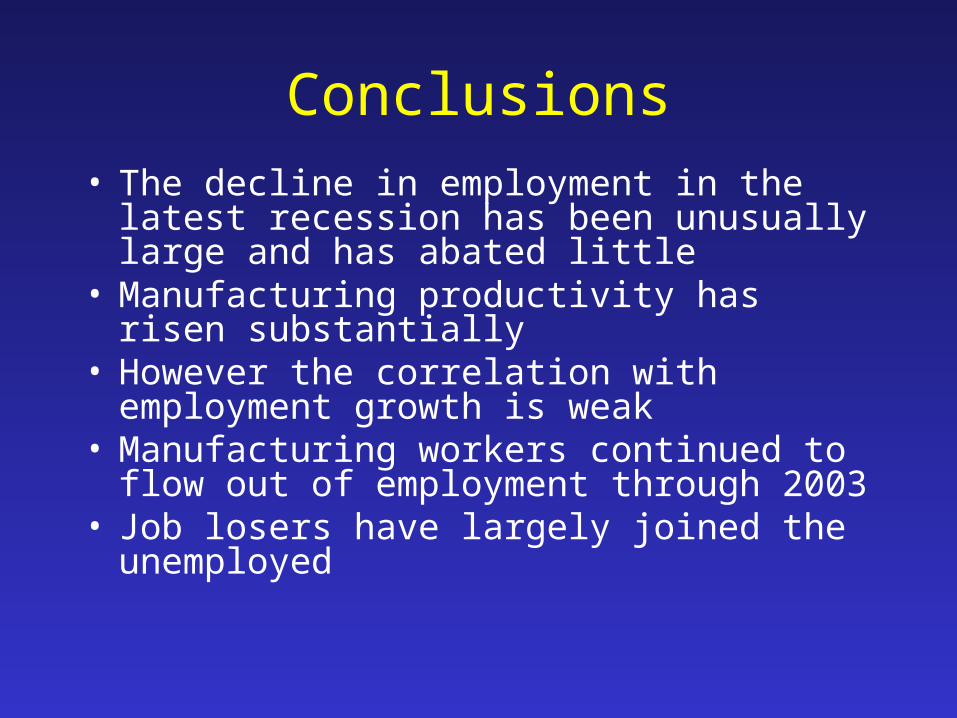
Conclusions• The decline in employment in the latest
recession has been unusually large and has abated little
• Manufacturing productivity has risen substantially
• However the correlation with employment growth is weak
• Manufacturing workers continued to flow out of employment through 2003
• Job losers have largely joined the unemployed

Structural Change in Manufacturing
Mark SchweitzerFederal Reserve Bank of Cleveland
April 27, 2004


![CASE WESTERN RESERVE UNIVERSITY AND EAST CLEVELAND … · [Type here] The Provost Scholars are in the Relentless Pursuit of Excellence CASE WESTERN RESERVE UNIVERSITY AND EAST CLEVELAND](https://img.pdfslide.us/doc/110x75/5e7a93fceb830d594b7391e2/case-western-reserve-university-and-east-cleveland-type-here-the-provost-scholars.jpg)