Embed Size (px)
Citation preview
Structural change in a globalized Asia: macrotrends and US policy challenges$
Michael G. Plummer*
Johns Hopkins University SAIS-Bologna, Via Belmeloro, 11, 40126 Bologna, Italy
Received 5 January 2003; received in revised form 4 February 2003; accepted 25 February 2003
Abstract
In this paper, we focus on directional and structural change in developing Asian trade patterns, with a
focus on economic interaction with the United States (and using the EU as a benchmark). Several
important results from the analysis are that: (1) while private-sector-led regional integration in Asia has
increased for most developing Asian countries (in some cases, impressively), the United States remains
the region’s single most important export market; (2) the trade structure of developing Asian countries
has changed significantly over the past decade, a result that resonates with the literature on structural
transformation in developing Asia; (3) the economic dynamism of developing Asian exports is
consistent with the changes in trade with the United States (and the EU); and (4) SITC 7, which is the
most sophisticated sector of the SITC groups, has become the most important sector for most
developing Asian exports (and imports), and the US market has been a key protagonist in this process.
In addition, the paper considers emerging policy challenges in developing the US–Asian economic
relationship at various levels, using the Viet Nam–US Bilateral Trade Agreement (BTA) as an ex post
case study and considering a number of ex ante initiatives that are currently being developed.
# 2003 Elsevier Science Inc. All rights reserved.
Keywords: Globalization; US economic policy; Asian economic development
1. Introduction
The global economy has been stagnating over the past year with no clear sign of
future direction. After the longest economic expansion in its history, the United States
Journal of Asian Economics 14 (2003) 243–281
$ This paper was first presented at the joint American Economic Association/American Committee for Asian
Economic Studies panel, ‘‘Asia-US Interdependence: Effects of the US Recession,’’ 3 January 2003,
Washington, DC.* Tel.: þ39-051-2917-811; fax: þ39-051-228-505.
E-mail address: [email protected] (M.G. Plummer).
1049-0078/03/$ – see front matter # 2003 Elsevier Science Inc. All rights reserved.
doi:10.1016/S1049-0078(03)00024-1
experienced an economic downturn in the third-quarter of 2001. Since then, the US
economy continues to offer a variety of confusing and contradictory economic signals. For
example, in December 2002, markets could cheer the rebound in consumer confidence,
high productivity growth of over 5%, and revised third-quarter GDP growth of 4%, but
despair over sluggish job creation and the increase in the unemployment rate to 6%. The
US stock markets have been highly volatile; the broadest oft-quoted index of US stocks, the
S&P 500, was down approximately 40% from its absolute high and by 24% over 2002. As
of end-January 2003, the dollar had depreciated against the euro by over 20% relative to its
peaks in 2001, and while the US current account deficit improved marginally toward the
end of 2002, it is estimated to reach 4.8 and 5.0% of GDP in 2002 and 2003, respectively.1
The US economy is expected to expand between 2.3 and 2.6% in 2002 and 2.0 and 3.3% in
2003. In the Euro Area and Japan, the economic indicators are even worse, with growth
forecasts of less than 1% over 2002–2003 for the former and probably continued recession
(�1.1 to 0% in 2002; �0.1 to 2.0 in 2003) in the latter.2
Moreover, Asia has been hit by a series of ‘‘policy shocks.’’ Developed-country
protection in areas in which East Asian countries have comparative advantage (e.g.
agriculture, textiles, and steel) continues to be high and, despite Uruguay Round cuts,
in some cases rising (e.g. in the case of agriculture in the United States and the EU; steel in
case of the United States). Moreover, the EU has been negotiating many preferential trade
arrangements with countries competing with East Asia (the United States has also been
doing this, albeit at a less ambitious pace and with more East Asian countries). The cost of
trade diversion due to such agreements has been high in certain sectors in the past and will
likely be so in the future (see, e.g. Kreinin & Plummer, 2002).
Nevertheless, Asia is doing fairly well, at least relative to what one might have guessed
given the region’s dependence on the global economy. True, 2001 was not a good year for
most economies in the region: growth in East Asia fell from 6.9% in 1999 and 7.6% in 2000
to only 4.3% in 2001.3 ASEAN (excluding Brunei and Myanmar) growth fell from 6.0% in
2000 to only 1.9% in 2001, with Singapore experiencing its first significant recession (GDP
fell by 2%) since the mid-1980s.4 Export growth fell considerably in the region; over 2000
and 2001 it plummeted from 28 to 7% for China, an average of about 19 to �7% for the
NIEs and 19 to �8% in the ASEAN-4. With such a dismal external performance it is
surprising that outward-oriented economies like those in East Asia did not experience even
deeper cuts in output growth, as was predicted by many economists. Moreover, economic
growth in Asia picked up considerably in 2002, despite volatility of growth in its major
markets. Most predictions currently maintain that the region had overcome the worst of the
business cycle by mid-2002. Revised forecasts in October 2002 from Consensus Forecasts5
suggest that East Asian economic growth should hit a respectable 6% in 2002, better than
1 ‘‘The Economist Poll of Forecasters, December 2002 Averages,’’ The Economist, 7 December 2002, p. 106.2 Ibid.3 Data in this paragraph come from the Asian Development Bank: (1) Asian Economic Monitor, July 2002 and
October 2002, and Key Economic Indicators 2002.4 Singapore output growth contacted by 0.1% in 1998, i.e. in the middle of the Asian Crisis.5 Consensus Forecasts bases its forecasts on estimates from 200 economic and financial forecasters in 70
countries and is used by the Asian Development Bank in its Asian Economic Monitor publication as a broad-
based source of economic forecasts for the region.
244 M.G. Plummer / Journal of Asian Economics 14 (2003) 243–281
double the forecast for the United States and triple that for Europe, and for 2003, the region
is now expected to expand by 5.9%.
These trends are somewhat puzzling; the real-side hit of the global slowdown was
predicted to cause a much larger external shock to the region’s economies. The financial
shock of falling equity and fixed-income markets in the West should have had an even more
significant effect. Despite attempts after the Asian Crisis to develop equity and fixed-income
markets, Asian capital markets continue to be under-developed relative to those in the United
States and Europe. Asia relies on financial intermediation in the West, leaving it exposed to
the significant volatility and persistent weakness in the US and European equity markets.
So why this economic resilience? Two possible explanations as to why developing Asia
continues to expand beyond predictions in light of economic slowdown/crises in the
developed countries are that: (1) intra-regional trade has been picking up, leaving the
region far less vulnerable to real-side external shocks; and (2) structural changes in the
composition of developing Asian exports have rendered the region less vulnerable.
In this paper, we will address (in Section 2) the first question briefly, as much has already
been done on the subject. Instead, we will concentrate on structural change in Asian trade.
We begin with a cursory analysis of intra-regional trade, followed by an assessment of the
changes in the overall structure of Asian trade and, in particular, bilateral trade with the
United States, both because of the key role of the United States as a trading partner and the
focus on US–Asian trade in this issue. We will undertake parallel analysis with the EU as a
‘‘control’’ country (over a shorter time period). Next, in Section 3 we will discuss some real
and policy implications of these changes for the dependence of Asia on the US market,
particularly in light of recent macroeconomic volatility, as well as issues in US–Asian
economic cooperation. We use the case study of the recent Viet Nam–US trade agreement
as an example of change in bilateral policy relationships and strategies. Finally, we offer
some concluding remarks in Section 4, including a discussion of US policy challenges in
Asia.
2. Trends in trade patterns: direction, composition and structural change
It is uncontroversial that exports have been an important engine of growth in Asia over
the past three decades. World Bank (1993) gives an excellent survey of the role of exports
in the Asian success story, but it is not alone. The Asian Crisis of 1997–1999 may have
expelled the myth that, somehow, Asian economic growth defied economic gravity, but it
did nothing to reduce the strong empirical evidence that exports have played a critical role
in regional growth. In fact, as Grilli (2002), Montes (1998), Parker and Lee (2001), and
others have pointed out, the fall in export growth in Asia actually contributed to the onset of
the Crisis.
Das (2000) gives an important historical perspective to the remarkable export perfor-
mance of Asia over the past three decades. His data show that, in real terms, from 1965 to
1980, world exports grew by 170%, followed by increases of 40% over the 1980s and 70%
from 1989 to 1997. On the other hand, real exports of developing Asian countries increased
by 207, 190, and 123% over these respective periods. The developing Asian share of world
exports grew from 7% in 1965 to 19% in 1997 (a total of US$ 1.009 trillion in 1990), with
M.G. Plummer / Journal of Asian Economics 14 (2003) 243–281 245
the NIEs leading the way (from 1.6 to 10.4%) followed by the ASEAN-4 (1.9–3.9%) and
China (1.5–3.3%). The relatively-closed South Asia-3 (Bangladesh, India and Pakistan)
actually saw their share fall from 1.3 to 0.9%.
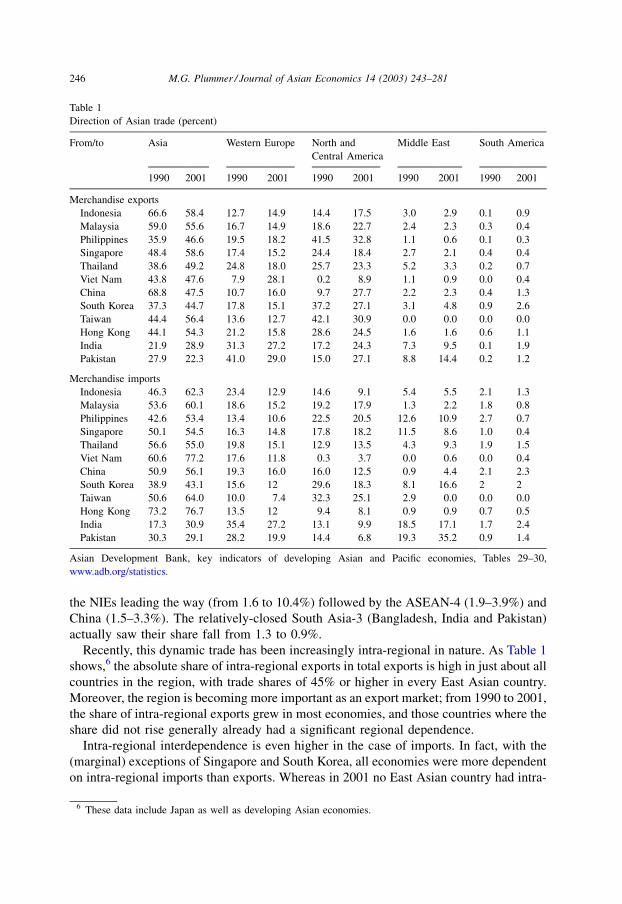
Recently, this dynamic trade has been increasingly intra-regional in nature. As Table 1
shows,6 the absolute share of intra-regional exports in total exports is high in just about all
countries in the region, with trade shares of 45% or higher in every East Asian country.
Moreover, the region is becoming more important as an export market; from 1990 to 2001,
the share of intra-regional exports grew in most economies, and those countries where the
share did not rise generally already had a significant regional dependence.
Intra-regional interdependence is even higher in the case of imports. In fact, with the
(marginal) exceptions of Singapore and South Korea, all economies were more dependent
on intra-regional imports than exports. Whereas in 2001 no East Asian country had intra-
Table 1
Direction of Asian trade (percent)
From/to Asia Western Europe North and
Central America
Middle East South America
1990 2001 1990 2001 1990 2001 1990 2001 1990 2001
Merchandise exports
Indonesia 66.6 58.4 12.7 14.9 14.4 17.5 3.0 2.9 0.1 0.9
Malaysia 59.0 55.6 16.7 14.9 18.6 22.7 2.4 2.3 0.3 0.4
Philippines 35.9 46.6 19.5 18.2 41.5 32.8 1.1 0.6 0.1 0.3
Singapore 48.4 58.6 17.4 15.2 24.4 18.4 2.7 2.1 0.4 0.4
Thailand 38.6 49.2 24.8 18.0 25.7 23.3 5.2 3.3 0.2 0.7
Viet Nam 43.8 47.6 7.9 28.1 0.2 8.9 1.1 0.9 0.0 0.4
China 68.8 47.5 10.7 16.0 9.7 27.7 2.2 2.3 0.4 1.3
South Korea 37.3 44.7 17.8 15.1 37.2 27.1 3.1 4.8 0.9 2.6
Taiwan 44.4 56.4 13.6 12.7 42.1 30.9 0.0 0.0 0.0 0.0
Hong Kong 44.1 54.3 21.2 15.8 28.6 24.5 1.6 1.6 0.6 1.1
India 21.9 28.9 31.3 27.2 17.2 24.3 7.3 9.5 0.1 1.9
Pakistan 27.9 22.3 41.0 29.0 15.0 27.1 8.8 14.4 0.2 1.2
Merchandise imports
Indonesia 46.3 62.3 23.4 12.9 14.6 9.1 5.4 5.5 2.1 1.3
Malaysia 53.6 60.1 18.6 15.2 19.2 17.9 1.3 2.2 1.8 0.8
Philippines 42.6 53.4 13.4 10.6 22.5 20.5 12.6 10.9 2.7 0.7
Singapore 50.1 54.5 16.3 14.8 17.8 18.2 11.5 8.6 1.0 0.4
Thailand 56.6 55.0 19.8 15.1 12.9 13.5 4.3 9.3 1.9 1.5
Viet Nam 60.6 77.2 17.6 11.8 0.3 3.7 0.0 0.6 0.0 0.4
China 50.9 56.1 19.3 16.0 16.0 12.5 0.9 4.4 2.1 2.3
South Korea 38.9 43.1 15.6 12 29.6 18.3 8.1 16.6 2 2
Taiwan 50.6 64.0 10.0 7.4 32.3 25.1 2.9 0.0 0.0 0.0
Hong Kong 73.2 76.7 13.5 12 9.4 8.1 0.9 0.9 0.7 0.5
India 17.3 30.9 35.4 27.2 13.1 9.9 18.5 17.1 1.7 2.4
Pakistan 30.3 29.1 28.2 19.9 14.4 6.8 19.3 35.2 0.9 1.4
Asian Development Bank, key indicators of developing Asian and Pacific economies, Tables 29–30,
www.adb.org/statistics.
6 These data include Japan as well as developing Asian economies.
246 M.G. Plummer / Journal of Asian Economics 14 (2003) 243–281
regional export shares exceeding 60% of total trade, fully one-half had intra-regional
import shares exceeding that figure.
There are a variety of ways that one might analyze further this change in intra-regional
trade dependence. For example, if one normalizes these trade shares by the size of these
economies, as proxied by their share of international trade, one might get a better picture of
this intra-regional trade ‘‘bias.’’ The literature has generated a number of estimates in this
regard (e.g. Frankel, 1993; Kreinin & Plummer, 2002; Petri, 1993) and most find a strong
bias for intra-regional trade, a bias which has generally been increasing over time.
Moreover, certain authors (e.g. Frankel, 1997; Kreinin, Plummer, & Abe, 1999; Plummer,
2002) have taken an econometric approach to analyzing the determinants of intra-regional
trade and they generally come to the same result: there exists a trade bias in Asian trade.
Assuming that this relationship remains stable, it is likely that faster growth rates in Asia
relative to the world will increasingly show up in trade-share figures. No doubt this is
already happening and may be interpreted as one reason why the region seems to be
becoming more insulated from extra-regional macroeconomic shocks. Indeed, Asian
regional integration over this period is unique in a global context as it is driven almost
exclusively through informal, market-led initiatives, rather than policy initiatives through
preferential-trading arrangements.7
However, the significance of these changes in trade patterns is also a function of the
composition of trade. If intra-regional trade were predominately a function of changes in
agricultural and national-resource-intensive goods, as it arguably has been in the past, the
trade numbers would be somewhat deceiving. In addition, for a variety of reasons, an
increase in the share of manufactured exports relative to primary exports, as well as the
progressive increase in the share of more sophisticated manufactured goods, constitutes an
important part of the economic development process, as well as reducing the susceptibility
of exports and, hence, economic growth to vicissitudes in the international marketplace
(due to, for example, less volatile and secular improvements in terms of trade, less exposure
to natural shocks, and technology-related benefits). Indeed, promotion of manufactures is a
key motivation behind the outward-oriented development policies that East Asia—and,
progressively, much of South Asia—has embraced.
Hence, it might be useful to consider the changing overall trade structure of developing
Asian countries (and Japan, for comparison), which we do in Fig. 1 for exports (and in
Appendix A for imports), for both 1994 and 1998. The results are illuminating. Primary-
based exports (roughly estimated as SITC 0–4) have fallen in just about all instances in all
East Asian economies. In fact, only Thailand continues to have a large agricultural-export
base (it is, e.g. the largest exporter of rice in the world) but it, too, is falling in importance.
Energy (SITC 3) continues to be a significant export for Indonesia, but its share in total
exports has been falling over time, coming to only a fraction of the three-fourths share two
decades ago. The same basic story applies to the Malaysian experience.
The big change throughout the region has been the impressive—in some cases,
spectacular—increases in the share of SITC 7, that is, electronics and transport equipment,
in the export structure of East Asia. The share of SITC 7 increased in all developing East
7 AFTA was operating over part of this period but a fairly small amount of trade was affected through regional
tariff preferences.
M.G. Plummer / Journal of Asian Economics 14 (2003) 243–281 247
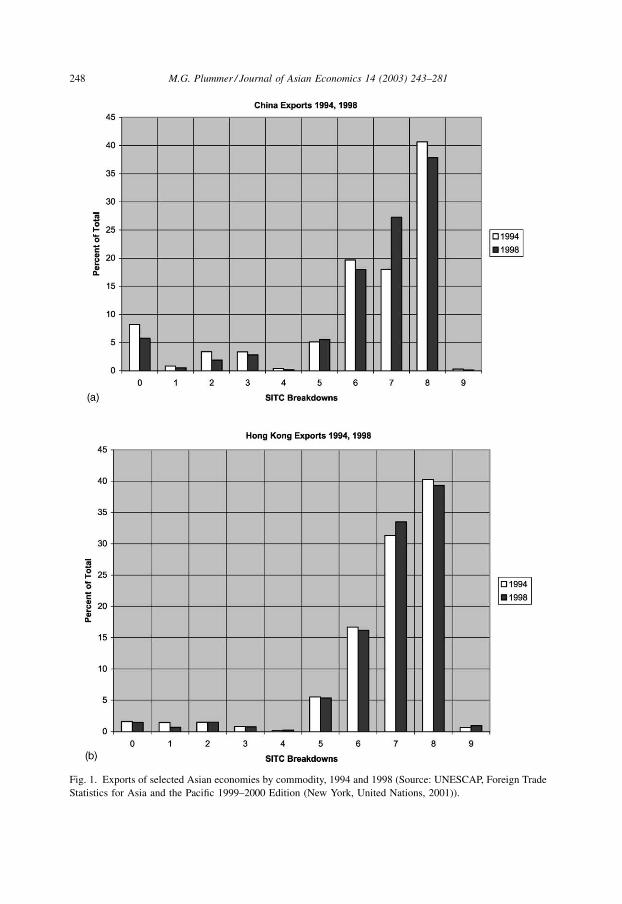
Fig. 1. Exports of selected Asian economies by commodity, 1994 and 1998 (Source: UNESCAP, Foreign Trade
Statistics for Asia and the Pacific 1999–2000 Edition (New York, United Nations, 2001)).
248 M.G. Plummer / Journal of Asian Economics 14 (2003) 243–281
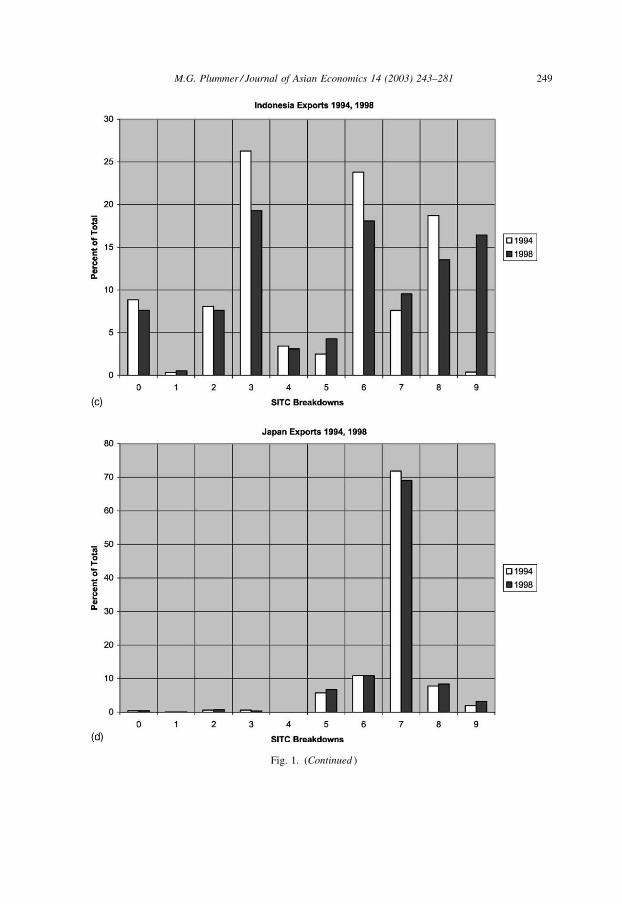
Fig. 1. (Continued )
M.G. Plummer / Journal of Asian Economics 14 (2003) 243–281 249
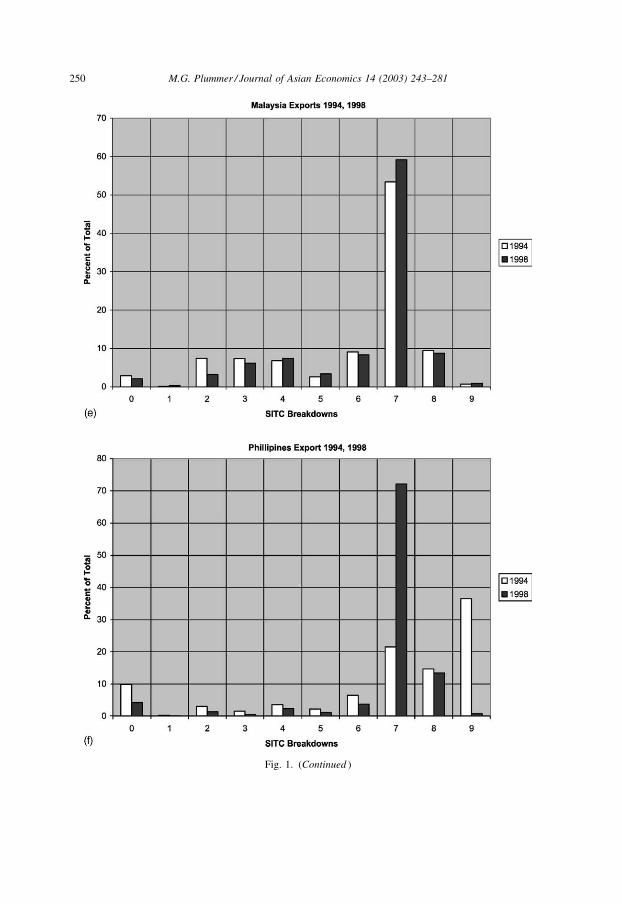
Fig. 1. (Continued )
250 M.G. Plummer / Journal of Asian Economics 14 (2003) 243–281
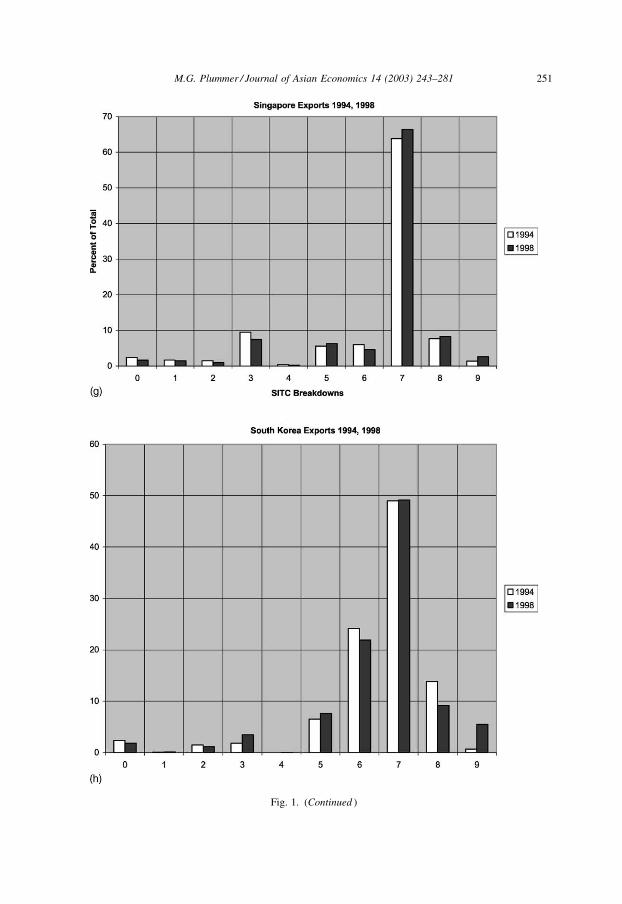
Fig. 1. (Continued )
M.G. Plummer / Journal of Asian Economics 14 (2003) 243–281 251
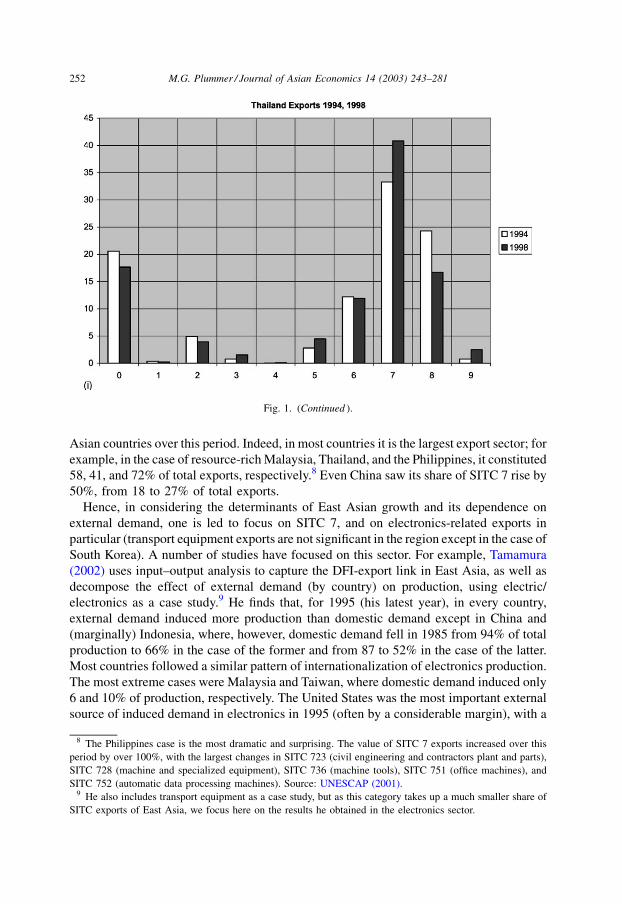
Asian countries over this period. Indeed, in most countries it is the largest export sector; for
example, in the case of resource-rich Malaysia, Thailand, and the Philippines, it constituted
58, 41, and 72% of total exports, respectively.8 Even China saw its share of SITC 7 rise by
50%, from 18 to 27% of total exports.
Hence, in considering the determinants of East Asian growth and its dependence on
external demand, one is led to focus on SITC 7, and on electronics-related exports in
particular (transport equipment exports are not significant in the region except in the case of
South Korea). A number of studies have focused on this sector. For example, Tamamura
(2002) uses input–output analysis to capture the DFI-export link in East Asia, as well as
decompose the effect of external demand (by country) on production, using electric/
electronics as a case study.9 He finds that, for 1995 (his latest year), in every country,
external demand induced more production than domestic demand except in China and
(marginally) Indonesia, where, however, domestic demand fell in 1985 from 94% of total
production to 66% in the case of the former and from 87 to 52% in the case of the latter.
Most countries followed a similar pattern of internationalization of electronics production.
The most extreme cases were Malaysia and Taiwan, where domestic demand induced only
6 and 10% of production, respectively. The United States was the most important external
source of induced demand in electronics in 1995 (often by a considerable margin), with a
Fig. 1. (Continued ).
8 The Philippines case is the most dramatic and surprising. The value of SITC 7 exports increased over this
period by over 100%, with the largest changes in SITC 723 (civil engineering and contractors plant and parts),
SITC 728 (machine and specialized equipment), SITC 736 (machine tools), SITC 751 (office machines), and
SITC 752 (automatic data processing machines). Source: UNESCAP (2001).9 He also includes transport equipment as a case study, but as this category takes up a much smaller share of
SITC exports of East Asia, we focus here on the results he obtained in the electronics sector.
252 M.G. Plummer / Journal of Asian Economics 14 (2003) 243–281
simple average share of approximately 25% for the sample. In the key cases of Malaysia,
the Philippines, and Taiwan, US demand was even more important than domestic demand,
and in the case of Thailand, they are about the same.
In short, SITC 7 is leading the way in the restructuring of Asian exports, and the United
States is a key protagonist in this process.
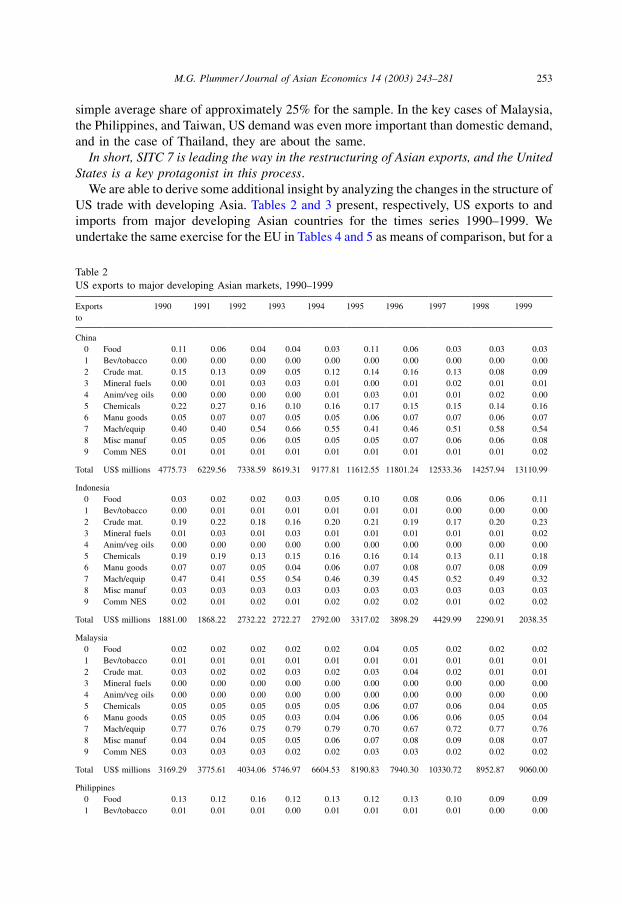
We are able to derive some additional insight by analyzing the changes in the structure of
US trade with developing Asia. Tables 2 and 3 present, respectively, US exports to and
imports from major developing Asian countries for the times series 1990–1999. We
undertake the same exercise for the EU in Tables 4 and 5 as means of comparison, but for a
Table 2
US exports to major developing Asian markets, 1990–1999
Exports
to
1990 1991 1992 1993 1994 1995 1996 1997 1998 1999
China
0 Food 0.11 0.06 0.04 0.04 0.03 0.11 0.06 0.03 0.03 0.03
1 Bev/tobacco 0.00 0.00 0.00 0.00 0.00 0.00 0.00 0.00 0.00 0.00
2 Crude mat. 0.15 0.13 0.09 0.05 0.12 0.14 0.16 0.13 0.08 0.09
3 Mineral fuels 0.00 0.01 0.03 0.03 0.01 0.00 0.01 0.02 0.01 0.01
4 Anim/veg oils 0.00 0.00 0.00 0.00 0.01 0.03 0.01 0.01 0.02 0.00
5 Chemicals 0.22 0.27 0.16 0.10 0.16 0.17 0.15 0.15 0.14 0.16
6 Manu goods 0.05 0.07 0.07 0.05 0.05 0.06 0.07 0.07 0.06 0.07
7 Mach/equip 0.40 0.40 0.54 0.66 0.55 0.41 0.46 0.51 0.58 0.54
8 Misc manuf 0.05 0.05 0.06 0.05 0.05 0.05 0.07 0.06 0.06 0.08
9 Comm NES 0.01 0.01 0.01 0.01 0.01 0.01 0.01 0.01 0.01 0.02
Total US$ millions 4775.73 6229.56 7338.59 8619.31 9177.81 11612.55 11801.24 12533.36 14257.94 13110.99
Indonesia
0 Food 0.03 0.02 0.02 0.03 0.05 0.10 0.08 0.06 0.06 0.11
1 Bev/tobacco 0.00 0.01 0.01 0.01 0.01 0.01 0.01 0.00 0.00 0.00
2 Crude mat. 0.19 0.22 0.18 0.16 0.20 0.21 0.19 0.17 0.20 0.23
3 Mineral fuels 0.01 0.03 0.01 0.03 0.01 0.01 0.01 0.01 0.01 0.02
4 Anim/veg oils 0.00 0.00 0.00 0.00 0.00 0.00 0.00 0.00 0.00 0.00
5 Chemicals 0.19 0.19 0.13 0.15 0.16 0.16 0.14 0.13 0.11 0.18
6 Manu goods 0.07 0.07 0.05 0.04 0.06 0.07 0.08 0.07 0.08 0.09
7 Mach/equip 0.47 0.41 0.55 0.54 0.46 0.39 0.45 0.52 0.49 0.32
8 Misc manuf 0.03 0.03 0.03 0.03 0.03 0.03 0.03 0.03 0.03 0.03
9 Comm NES 0.02 0.01 0.02 0.01 0.02 0.02 0.02 0.01 0.02 0.02
Total US$ millions 1881.00 1868.22 2732.22 2722.27 2792.00 3317.02 3898.29 4429.99 2290.91 2038.35
Malaysia
0 Food 0.02 0.02 0.02 0.02 0.02 0.04 0.05 0.02 0.02 0.02
1 Bev/tobacco 0.01 0.01 0.01 0.01 0.01 0.01 0.01 0.01 0.01 0.01
2 Crude mat. 0.03 0.02 0.02 0.03 0.02 0.03 0.04 0.02 0.01 0.01
3 Mineral fuels 0.00 0.00 0.00 0.00 0.00 0.00 0.00 0.00 0.00 0.00
4 Anim/veg oils 0.00 0.00 0.00 0.00 0.00 0.00 0.00 0.00 0.00 0.00
5 Chemicals 0.05 0.05 0.05 0.05 0.05 0.06 0.07 0.06 0.04 0.05
6 Manu goods 0.05 0.05 0.05 0.03 0.04 0.06 0.06 0.06 0.05 0.04
7 Mach/equip 0.77 0.76 0.75 0.79 0.79 0.70 0.67 0.72 0.77 0.76
8 Misc manuf 0.04 0.04 0.05 0.05 0.06 0.07 0.08 0.09 0.08 0.07
9 Comm NES 0.03 0.03 0.03 0.02 0.02 0.03 0.03 0.02 0.02 0.02
Total US$ millions 3169.29 3775.61 4034.06 5746.97 6604.53 8190.83 7940.30 10330.72 8952.87 9060.00
Philippines
0 Food 0.13 0.12 0.16 0.12 0.13 0.12 0.13 0.10 0.09 0.09
1 Bev/tobacco 0.01 0.01 0.01 0.00 0.01 0.01 0.01 0.01 0.00 0.00
M.G. Plummer / Journal of Asian Economics 14 (2003) 243–281 253
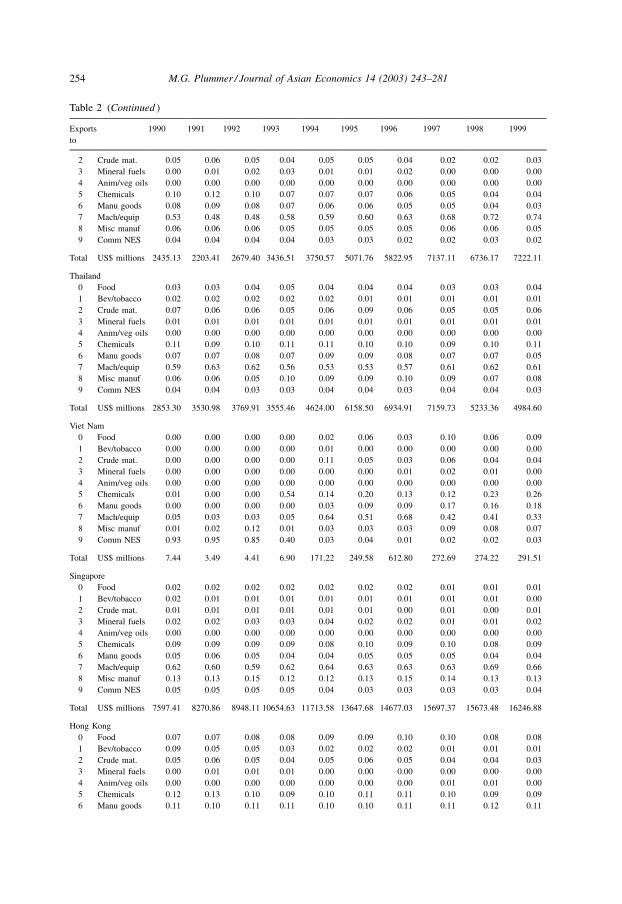
Table 2 (Continued )
Exports
to
1990 1991 1992 1993 1994 1995 1996 1997 1998 1999
2 Crude mat. 0.05 0.06 0.05 0.04 0.05 0.05 0.04 0.02 0.02 0.03
3 Mineral fuels 0.00 0.01 0.02 0.03 0.01 0.01 0.02 0.00 0.00 0.00
4 Anim/veg oils 0.00 0.00 0.00 0.00 0.00 0.00 0.00 0.00 0.00 0.00
5 Chemicals 0.10 0.12 0.10 0.07 0.07 0.07 0.06 0.05 0.04 0.04
6 Manu goods 0.08 0.09 0.08 0.07 0.06 0.06 0.05 0.05 0.04 0.03
7 Mach/equip 0.53 0.48 0.48 0.58 0.59 0.60 0.63 0.68 0.72 0.74
8 Misc manuf 0.06 0.06 0.06 0.05 0.05 0.05 0.05 0.06 0.06 0.05
9 Comm NES 0.04 0.04 0.04 0.04 0.03 0.03 0.02 0.02 0.03 0.02
Total US$ millions 2435.13 2203.41 2679.40 3436.51 3750.57 5071.76 5822.95 7137.11 6736.17 7222.11
Thailand
0 Food 0.03 0.03 0.04 0.05 0.04 0.04 0.04 0.03 0.03 0.04
1 Bev/tobacco 0.02 0.02 0.02 0.02 0.02 0.01 0.01 0.01 0.01 0.01
2 Crude mat. 0.07 0.06 0.06 0.05 0.06 0.09 0.06 0.05 0.05 0.06
3 Mineral fuels 0.01 0.01 0.01 0.01 0.01 0.01 0.01 0.01 0.01 0.01
4 Anim/veg oils 0.00 0.00 0.00 0.00 0.00 0.00 0.00 0.00 0.00 0.00
5 Chemicals 0.11 0.09 0.10 0.11 0.11 0.10 0.10 0.09 0.10 0.11
6 Manu goods 0.07 0.07 0.08 0.07 0.09 0.09 0.08 0.07 0.07 0.05
7 Mach/equip 0.59 0.63 0.62 0.56 0.53 0.53 0.57 0.61 0.62 0.61
8 Misc manuf 0.06 0.06 0.05 0.10 0.09 0.09 0.10 0.09 0.07 0.08
9 Comm NES 0.04 0.04 0.03 0.03 0.04 0.04 0.03 0.04 0.04 0.03
Total US$ millions 2853.30 3530.98 3769.91 3555.46 4624.00 6158.50 6934.91 7159.73 5233.36 4984.60
Viet Nam
0 Food 0.00 0.00 0.00 0.00 0.02 0.06 0.03 0.10 0.06 0.09
1 Bev/tobacco 0.00 0.00 0.00 0.00 0.01 0.00 0.00 0.00 0.00 0.00
2 Crude mat. 0.00 0.00 0.00 0.00 0.11 0.05 0.03 0.06 0.04 0.04
3 Mineral fuels 0.00 0.00 0.00 0.00 0.00 0.00 0.01 0.02 0.01 0.00
4 Anim/veg oils 0.00 0.00 0.00 0.00 0.00 0.00 0.00 0.00 0.00 0.00
5 Chemicals 0.01 0.00 0.00 0.54 0.14 0.20 0.13 0.12 0.23 0.26
6 Manu goods 0.00 0.00 0.00 0.00 0.03 0.09 0.09 0.17 0.16 0.18
7 Mach/equip 0.05 0.03 0.03 0.05 0.64 0.51 0.68 0.42 0.41 0.33
8 Misc manuf 0.01 0.02 0.12 0.01 0.03 0.03 0.03 0.09 0.08 0.07
9 Comm NES 0.93 0.95 0.85 0.40 0.03 0.04 0.01 0.02 0.02 0.03
Total US$ millions 7.44 3.49 4.41 6.90 171.22 249.58 612.80 272.69 274.22 291.51
Singapore
0 Food 0.02 0.02 0.02 0.02 0.02 0.02 0.02 0.01 0.01 0.01
1 Bev/tobacco 0.02 0.01 0.01 0.01 0.01 0.01 0.01 0.01 0.01 0.00
2 Crude mat. 0.01 0.01 0.01 0.01 0.01 0.01 0.00 0.01 0.00 0.01
3 Mineral fuels 0.02 0.02 0.03 0.03 0.04 0.02 0.02 0.01 0.01 0.02
4 Anim/veg oils 0.00 0.00 0.00 0.00 0.00 0.00 0.00 0.00 0.00 0.00
5 Chemicals 0.09 0.09 0.09 0.09 0.08 0.10 0.09 0.10 0.08 0.09
6 Manu goods 0.05 0.06 0.05 0.04 0.04 0.05 0.05 0.05 0.04 0.04
7 Mach/equip 0.62 0.60 0.59 0.62 0.64 0.63 0.63 0.63 0.69 0.66
8 Misc manuf 0.13 0.13 0.15 0.12 0.12 0.13 0.15 0.14 0.13 0.13
9 Comm NES 0.05 0.05 0.05 0.05 0.04 0.03 0.03 0.03 0.03 0.04
Total US$ millions 7597.41 8270.86 8948.11 10654.63 11713.58 13647.68 14677.03 15697.37 15673.48 16246.88
Hong Kong
0 Food 0.07 0.07 0.08 0.08 0.09 0.09 0.10 0.10 0.08 0.08
1 Bev/tobacco 0.09 0.05 0.05 0.03 0.02 0.02 0.02 0.01 0.01 0.01
2 Crude mat. 0.05 0.06 0.05 0.04 0.05 0.06 0.05 0.04 0.04 0.03
3 Mineral fuels 0.00 0.01 0.01 0.01 0.00 0.00 0.00 0.00 0.00 0.00
4 Anim/veg oils 0.00 0.00 0.00 0.00 0.00 0.00 0.00 0.01 0.01 0.00
5 Chemicals 0.12 0.13 0.10 0.09 0.10 0.11 0.11 0.10 0.09 0.09
6 Manu goods 0.11 0.10 0.11 0.11 0.10 0.10 0.11 0.11 0.12 0.11
254 M.G. Plummer / Journal of Asian Economics 14 (2003) 243–281
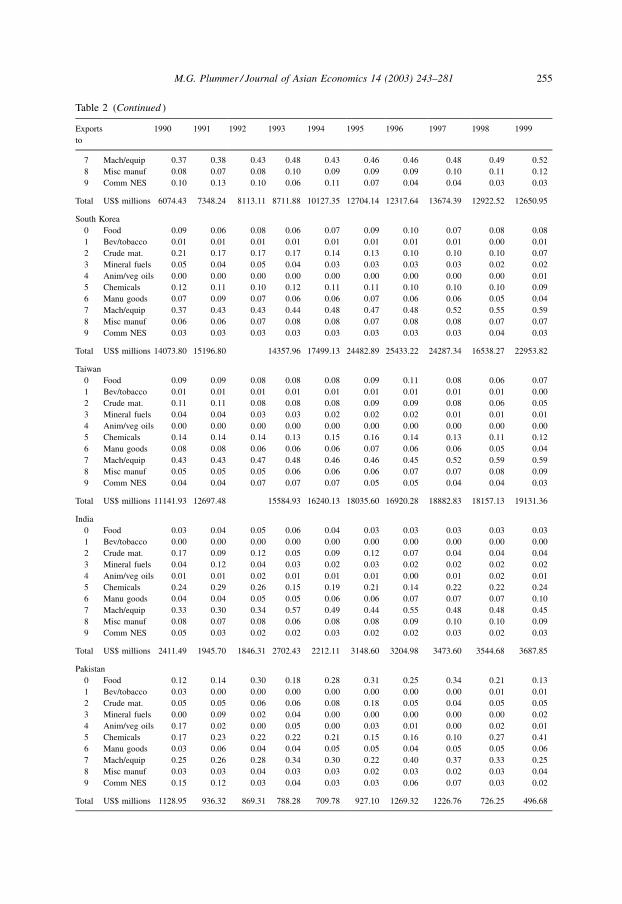
Table 2 (Continued )
Exports
to
1990 1991 1992 1993 1994 1995 1996 1997 1998 1999
7 Mach/equip 0.37 0.38 0.43 0.48 0.43 0.46 0.46 0.48 0.49 0.52
8 Misc manuf 0.08 0.07 0.08 0.10 0.09 0.09 0.09 0.10 0.11 0.12
9 Comm NES 0.10 0.13 0.10 0.06 0.11 0.07 0.04 0.04 0.03 0.03
Total US$ millions 6074.43 7348.24 8113.11 8711.88 10127.35 12704.14 12317.64 13674.39 12922.52 12650.95
South Korea
0 Food 0.09 0.06 0.08 0.06 0.07 0.09 0.10 0.07 0.08 0.08
1 Bev/tobacco 0.01 0.01 0.01 0.01 0.01 0.01 0.01 0.01 0.00 0.01
2 Crude mat. 0.21 0.17 0.17 0.17 0.14 0.13 0.10 0.10 0.10 0.07
3 Mineral fuels 0.05 0.04 0.05 0.04 0.03 0.03 0.03 0.03 0.02 0.02
4 Anim/veg oils 0.00 0.00 0.00 0.00 0.00 0.00 0.00 0.00 0.00 0.01
5 Chemicals 0.12 0.11 0.10 0.12 0.11 0.11 0.10 0.10 0.10 0.09
6 Manu goods 0.07 0.09 0.07 0.06 0.06 0.07 0.06 0.06 0.05 0.04
7 Mach/equip 0.37 0.43 0.43 0.44 0.48 0.47 0.48 0.52 0.55 0.59
8 Misc manuf 0.06 0.06 0.07 0.08 0.08 0.07 0.08 0.08 0.07 0.07
9 Comm NES 0.03 0.03 0.03 0.03 0.03 0.03 0.03 0.03 0.04 0.03
Total US$ millions 14073.80 15196.80 14357.96 17499.13 24482.89 25433.22 24287.34 16538.27 22953.82
Taiwan
0 Food 0.09 0.09 0.08 0.08 0.08 0.09 0.11 0.08 0.06 0.07
1 Bev/tobacco 0.01 0.01 0.01 0.01 0.01 0.01 0.01 0.01 0.01 0.00
2 Crude mat. 0.11 0.11 0.08 0.08 0.08 0.09 0.09 0.08 0.06 0.05
3 Mineral fuels 0.04 0.04 0.03 0.03 0.02 0.02 0.02 0.01 0.01 0.01
4 Anim/veg oils 0.00 0.00 0.00 0.00 0.00 0.00 0.00 0.00 0.00 0.00
5 Chemicals 0.14 0.14 0.14 0.13 0.15 0.16 0.14 0.13 0.11 0.12
6 Manu goods 0.08 0.08 0.06 0.06 0.06 0.07 0.06 0.06 0.05 0.04
7 Mach/equip 0.43 0.43 0.47 0.48 0.46 0.46 0.45 0.52 0.59 0.59
8 Misc manuf 0.05 0.05 0.05 0.06 0.06 0.06 0.07 0.07 0.08 0.09
9 Comm NES 0.04 0.04 0.07 0.07 0.07 0.05 0.05 0.04 0.04 0.03
Total US$ millions 11141.93 12697.48 15584.93 16240.13 18035.60 16920.28 18882.83 18157.13 19131.36
India
0 Food 0.03 0.04 0.05 0.06 0.04 0.03 0.03 0.03 0.03 0.03
1 Bev/tobacco 0.00 0.00 0.00 0.00 0.00 0.00 0.00 0.00 0.00 0.00
2 Crude mat. 0.17 0.09 0.12 0.05 0.09 0.12 0.07 0.04 0.04 0.04
3 Mineral fuels 0.04 0.12 0.04 0.03 0.02 0.03 0.02 0.02 0.02 0.02
4 Anim/veg oils 0.01 0.01 0.02 0.01 0.01 0.01 0.00 0.01 0.02 0.01
5 Chemicals 0.24 0.29 0.26 0.15 0.19 0.21 0.14 0.22 0.22 0.24
6 Manu goods 0.04 0.04 0.05 0.05 0.06 0.06 0.07 0.07 0.07 0.10
7 Mach/equip 0.33 0.30 0.34 0.57 0.49 0.44 0.55 0.48 0.48 0.45
8 Misc manuf 0.08 0.07 0.08 0.06 0.08 0.08 0.09 0.10 0.10 0.09
9 Comm NES 0.05 0.03 0.02 0.02 0.03 0.02 0.02 0.03 0.02 0.03
Total US$ millions 2411.49 1945.70 1846.31 2702.43 2212.11 3148.60 3204.98 3473.60 3544.68 3687.85
Pakistan
0 Food 0.12 0.14 0.30 0.18 0.28 0.31 0.25 0.34 0.21 0.13
1 Bev/tobacco 0.03 0.00 0.00 0.00 0.00 0.00 0.00 0.00 0.01 0.01
2 Crude mat. 0.05 0.05 0.06 0.06 0.08 0.18 0.05 0.04 0.05 0.05
3 Mineral fuels 0.00 0.09 0.02 0.04 0.00 0.00 0.00 0.00 0.00 0.02
4 Anim/veg oils 0.17 0.02 0.00 0.05 0.00 0.03 0.01 0.00 0.02 0.01
5 Chemicals 0.17 0.23 0.22 0.22 0.21 0.15 0.16 0.10 0.27 0.41
6 Manu goods 0.03 0.06 0.04 0.04 0.05 0.05 0.04 0.05 0.05 0.06
7 Mach/equip 0.25 0.26 0.28 0.34 0.30 0.22 0.40 0.37 0.33 0.25
8 Misc manuf 0.03 0.03 0.04 0.03 0.03 0.02 0.03 0.02 0.03 0.04
9 Comm NES 0.15 0.12 0.03 0.04 0.03 0.03 0.06 0.07 0.03 0.02
Total US$ millions 1128.95 936.32 869.31 788.28 709.78 927.10 1269.32 1226.76 726.25 496.68
M.G. Plummer / Journal of Asian Economics 14 (2003) 243–281 255
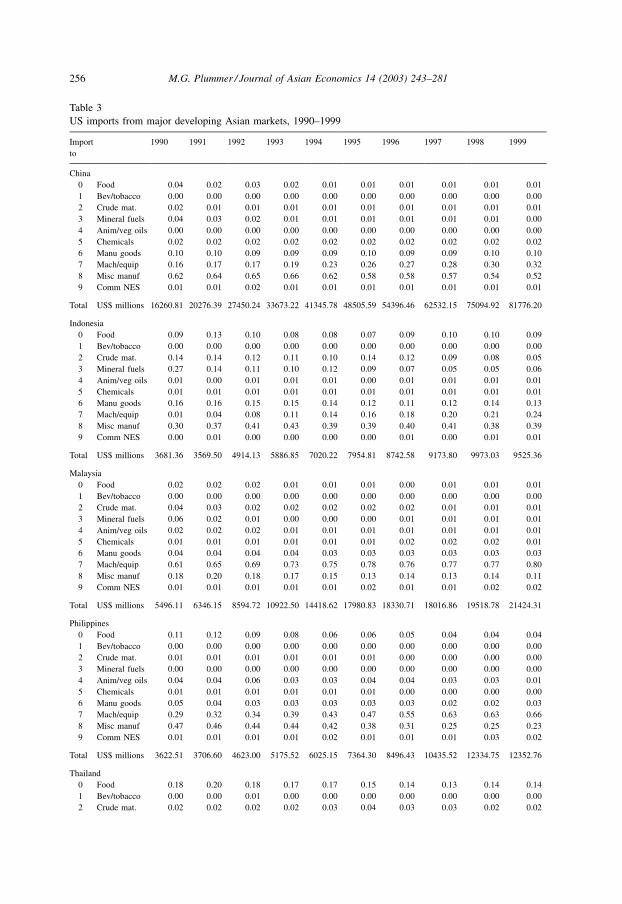
Table 3
US imports from major developing Asian markets, 1990–1999
Import
to
1990 1991 1992 1993 1994 1995 1996 1997 1998 1999
China
0 Food 0.04 0.02 0.03 0.02 0.01 0.01 0.01 0.01 0.01 0.01
1 Bev/tobacco 0.00 0.00 0.00 0.00 0.00 0.00 0.00 0.00 0.00 0.00
2 Crude mat. 0.02 0.01 0.01 0.01 0.01 0.01 0.01 0.01 0.01 0.01
3 Mineral fuels 0.04 0.03 0.02 0.01 0.01 0.01 0.01 0.01 0.01 0.00
4 Anim/veg oils 0.00 0.00 0.00 0.00 0.00 0.00 0.00 0.00 0.00 0.00
5 Chemicals 0.02 0.02 0.02 0.02 0.02 0.02 0.02 0.02 0.02 0.02
6 Manu goods 0.10 0.10 0.09 0.09 0.09 0.10 0.09 0.09 0.10 0.10
7 Mach/equip 0.16 0.17 0.17 0.19 0.23 0.26 0.27 0.28 0.30 0.32
8 Misc manuf 0.62 0.64 0.65 0.66 0.62 0.58 0.58 0.57 0.54 0.52
9 Comm NES 0.01 0.01 0.02 0.01 0.01 0.01 0.01 0.01 0.01 0.01
Total US$ millions 16260.81 20276.39 27450.24 33673.22 41345.78 48505.59 54396.46 62532.15 75094.92 81776.20
Indonesia
0 Food 0.09 0.13 0.10 0.08 0.08 0.07 0.09 0.10 0.10 0.09
1 Bev/tobacco 0.00 0.00 0.00 0.00 0.00 0.00 0.00 0.00 0.00 0.00
2 Crude mat. 0.14 0.14 0.12 0.11 0.10 0.14 0.12 0.09 0.08 0.05
3 Mineral fuels 0.27 0.14 0.11 0.10 0.12 0.09 0.07 0.05 0.05 0.06
4 Anim/veg oils 0.01 0.00 0.01 0.01 0.01 0.00 0.01 0.01 0.01 0.01
5 Chemicals 0.01 0.01 0.01 0.01 0.01 0.01 0.01 0.01 0.01 0.01
6 Manu goods 0.16 0.16 0.15 0.15 0.14 0.12 0.11 0.12 0.14 0.13
7 Mach/equip 0.01 0.04 0.08 0.11 0.14 0.16 0.18 0.20 0.21 0.24
8 Misc manuf 0.30 0.37 0.41 0.43 0.39 0.39 0.40 0.41 0.38 0.39
9 Comm NES 0.00 0.01 0.00 0.00 0.00 0.00 0.01 0.00 0.01 0.01
Total US$ millions 3681.36 3569.50 4914.13 5886.85 7020.22 7954.81 8742.58 9173.80 9973.03 9525.36
Malaysia
0 Food 0.02 0.02 0.02 0.01 0.01 0.01 0.00 0.01 0.01 0.01
1 Bev/tobacco 0.00 0.00 0.00 0.00 0.00 0.00 0.00 0.00 0.00 0.00
2 Crude mat. 0.04 0.03 0.02 0.02 0.02 0.02 0.02 0.01 0.01 0.01
3 Mineral fuels 0.06 0.02 0.01 0.00 0.00 0.00 0.01 0.01 0.01 0.01
4 Anim/veg oils 0.02 0.02 0.02 0.01 0.01 0.01 0.01 0.01 0.01 0.01
5 Chemicals 0.01 0.01 0.01 0.01 0.01 0.01 0.02 0.02 0.02 0.01
6 Manu goods 0.04 0.04 0.04 0.04 0.03 0.03 0.03 0.03 0.03 0.03
7 Mach/equip 0.61 0.65 0.69 0.73 0.75 0.78 0.76 0.77 0.77 0.80
8 Misc manuf 0.18 0.20 0.18 0.17 0.15 0.13 0.14 0.13 0.14 0.11
9 Comm NES 0.01 0.01 0.01 0.01 0.01 0.02 0.01 0.01 0.02 0.02
Total US$ millions 5496.11 6346.15 8594.72 10922.50 14418.62 17980.83 18330.71 18016.86 19518.78 21424.31
Philippines
0 Food 0.11 0.12 0.09 0.08 0.06 0.06 0.05 0.04 0.04 0.04
1 Bev/tobacco 0.00 0.00 0.00 0.00 0.00 0.00 0.00 0.00 0.00 0.00
2 Crude mat. 0.01 0.01 0.01 0.01 0.01 0.01 0.00 0.00 0.00 0.00
3 Mineral fuels 0.00 0.00 0.00 0.00 0.00 0.00 0.00 0.00 0.00 0.00
4 Anim/veg oils 0.04 0.04 0.06 0.03 0.03 0.04 0.04 0.03 0.03 0.01
5 Chemicals 0.01 0.01 0.01 0.01 0.01 0.01 0.00 0.00 0.00 0.00
6 Manu goods 0.05 0.04 0.03 0.03 0.03 0.03 0.03 0.02 0.02 0.03
7 Mach/equip 0.29 0.32 0.34 0.39 0.43 0.47 0.55 0.63 0.63 0.66
8 Misc manuf 0.47 0.46 0.44 0.44 0.42 0.38 0.31 0.25 0.25 0.23
9 Comm NES 0.01 0.01 0.01 0.01 0.02 0.01 0.01 0.01 0.03 0.02
Total US$ millions 3622.51 3706.60 4623.00 5175.52 6025.15 7364.30 8496.43 10435.52 12334.75 12352.76
Thailand
0 Food 0.18 0.20 0.18 0.17 0.17 0.15 0.14 0.13 0.14 0.14
1 Bev/tobacco 0.00 0.00 0.01 0.00 0.00 0.00 0.00 0.00 0.00 0.00
2 Crude mat. 0.02 0.02 0.02 0.02 0.03 0.04 0.03 0.03 0.02 0.02
256 M.G. Plummer / Journal of Asian Economics 14 (2003) 243–281
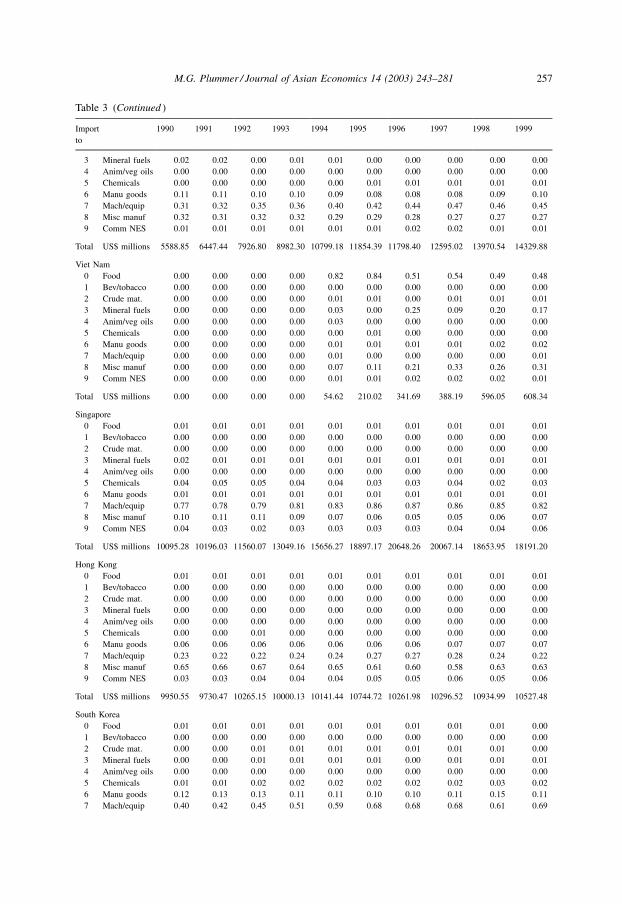
Table 3 (Continued )
Import
to
1990 1991 1992 1993 1994 1995 1996 1997 1998 1999
3 Mineral fuels 0.02 0.02 0.00 0.01 0.01 0.00 0.00 0.00 0.00 0.00
4 Anim/veg oils 0.00 0.00 0.00 0.00 0.00 0.00 0.00 0.00 0.00 0.00
5 Chemicals 0.00 0.00 0.00 0.00 0.00 0.01 0.01 0.01 0.01 0.01
6 Manu goods 0.11 0.11 0.10 0.10 0.09 0.08 0.08 0.08 0.09 0.10
7 Mach/equip 0.31 0.32 0.35 0.36 0.40 0.42 0.44 0.47 0.46 0.45
8 Misc manuf 0.32 0.31 0.32 0.32 0.29 0.29 0.28 0.27 0.27 0.27
9 Comm NES 0.01 0.01 0.01 0.01 0.01 0.01 0.02 0.02 0.01 0.01
Total US$ millions 5588.85 6447.44 7926.80 8982.30 10799.18 11854.39 11798.40 12595.02 13970.54 14329.88
Viet Nam
0 Food 0.00 0.00 0.00 0.00 0.82 0.84 0.51 0.54 0.49 0.48
1 Bev/tobacco 0.00 0.00 0.00 0.00 0.00 0.00 0.00 0.00 0.00 0.00
2 Crude mat. 0.00 0.00 0.00 0.00 0.01 0.01 0.00 0.01 0.01 0.01
3 Mineral fuels 0.00 0.00 0.00 0.00 0.03 0.00 0.25 0.09 0.20 0.17
4 Anim/veg oils 0.00 0.00 0.00 0.00 0.03 0.00 0.00 0.00 0.00 0.00
5 Chemicals 0.00 0.00 0.00 0.00 0.00 0.01 0.00 0.00 0.00 0.00
6 Manu goods 0.00 0.00 0.00 0.00 0.01 0.01 0.01 0.01 0.02 0.02
7 Mach/equip 0.00 0.00 0.00 0.00 0.01 0.00 0.00 0.00 0.00 0.01
8 Misc manuf 0.00 0.00 0.00 0.00 0.07 0.11 0.21 0.33 0.26 0.31
9 Comm NES 0.00 0.00 0.00 0.00 0.01 0.01 0.02 0.02 0.02 0.01
Total US$ millions 0.00 0.00 0.00 0.00 54.62 210.02 341.69 388.19 596.05 608.34
Singapore
0 Food 0.01 0.01 0.01 0.01 0.01 0.01 0.01 0.01 0.01 0.01
1 Bev/tobacco 0.00 0.00 0.00 0.00 0.00 0.00 0.00 0.00 0.00 0.00
2 Crude mat. 0.00 0.00 0.00 0.00 0.00 0.00 0.00 0.00 0.00 0.00
3 Mineral fuels 0.02 0.01 0.01 0.01 0.01 0.01 0.01 0.01 0.01 0.01
4 Anim/veg oils 0.00 0.00 0.00 0.00 0.00 0.00 0.00 0.00 0.00 0.00
5 Chemicals 0.04 0.05 0.05 0.04 0.04 0.03 0.03 0.04 0.02 0.03
6 Manu goods 0.01 0.01 0.01 0.01 0.01 0.01 0.01 0.01 0.01 0.01
7 Mach/equip 0.77 0.78 0.79 0.81 0.83 0.86 0.87 0.86 0.85 0.82
8 Misc manuf 0.10 0.11 0.11 0.09 0.07 0.06 0.05 0.05 0.06 0.07
9 Comm NES 0.04 0.03 0.02 0.03 0.03 0.03 0.03 0.04 0.04 0.06
Total US$ millions 10095.28 10196.03 11560.07 13049.16 15656.27 18897.17 20648.26 20067.14 18653.95 18191.20
Hong Kong
0 Food 0.01 0.01 0.01 0.01 0.01 0.01 0.01 0.01 0.01 0.01
1 Bev/tobacco 0.00 0.00 0.00 0.00 0.00 0.00 0.00 0.00 0.00 0.00
2 Crude mat. 0.00 0.00 0.00 0.00 0.00 0.00 0.00 0.00 0.00 0.00
3 Mineral fuels 0.00 0.00 0.00 0.00 0.00 0.00 0.00 0.00 0.00 0.00
4 Anim/veg oils 0.00 0.00 0.00 0.00 0.00 0.00 0.00 0.00 0.00 0.00
5 Chemicals 0.00 0.00 0.01 0.00 0.00 0.00 0.00 0.00 0.00 0.00
6 Manu goods 0.06 0.06 0.06 0.06 0.06 0.06 0.06 0.07 0.07 0.07
7 Mach/equip 0.23 0.22 0.22 0.24 0.24 0.27 0.27 0.28 0.24 0.22
8 Misc manuf 0.65 0.66 0.67 0.64 0.65 0.61 0.60 0.58 0.63 0.63
9 Comm NES 0.03 0.03 0.04 0.04 0.04 0.05 0.05 0.06 0.05 0.06
Total US$ millions 9950.55 9730.47 10265.15 10000.13 10141.44 10744.72 10261.98 10296.52 10934.99 10527.48
South Korea
0 Food 0.01 0.01 0.01 0.01 0.01 0.01 0.01 0.01 0.01 0.00
1 Bev/tobacco 0.00 0.00 0.00 0.00 0.00 0.00 0.00 0.00 0.00 0.00
2 Crude mat. 0.00 0.00 0.01 0.01 0.01 0.01 0.01 0.01 0.01 0.00
3 Mineral fuels 0.00 0.00 0.01 0.01 0.01 0.01 0.00 0.01 0.01 0.01
4 Anim/veg oils 0.00 0.00 0.00 0.00 0.00 0.00 0.00 0.00 0.00 0.00
5 Chemicals 0.01 0.01 0.02 0.02 0.02 0.02 0.02 0.02 0.03 0.02
6 Manu goods 0.12 0.13 0.13 0.11 0.11 0.10 0.10 0.11 0.15 0.11
7 Mach/equip 0.40 0.42 0.45 0.51 0.59 0.68 0.68 0.68 0.61 0.69
M.G. Plummer / Journal of Asian Economics 14 (2003) 243–281 257
shorter time span (5 years, from 1995 to 1999, corresponding to the most recent
enlargement of the EU to include Austria, Sweden, and Finland).
As Table 3 shows, US imports from developing Asian countries grew rapidly in all cases,
with the most impressive increases coming from the transitional economies of China and
Viet Nam. Chinese exports to the United States quadrupled from US$ 16 billion to US$ 82
billion, and exports from Viet Nam rose from 0 (due to the US embargo, discussed below)
as late as 1993 to US$ 608 million in 1999. Other countries also generally experienced high
growth rates, with the possible exception of already-important exporters to the United
States, such as Hong Kong, whose exports to the United States only grew by 6% but came
Table 3 (Continued )
Import
to
1990 1991 1992 1993 1994 1995 1996 1997 1998 1999
8 Misc manuf 0.44 0.41 0.38 0.32 0.24 0.18 0.16 0.15 0.16 0.14
9 Comm NES 0.01 0.01 0.01 0.01 0.01 0.01 0.02 0.02 0.02 0.02
Total US$ millions 19286.77 17735.58 17362.35 17778.97 20374.35 24890.54 23297.38 23158.98 24804.80 31178.61
Taiwan
0 Food 0.01 0.01 0.01 0.01 0.01 0.01 0.01 0.01 0.01 0.01
1 Bev/tobacco 0.00 0.00 0.00 0.00 0.00 0.00 0.00 0.00 0.00 0.00
2 Crude mat. 0.00 0.00 0.00 0.00 0.00 0.00 0.00 0.00 0.00 0.00
3 Mineral fuels 0.00 0.00 0.00 0.00 0.00 0.00 0.00 0.00 0.00 0.00
4 Anim/veg oils 0.00 0.00 0.00 0.00 0.00 0.00 0.00 0.00 0.00 0.00
5 Chemicals 0.02 0.02 0.02 0.02 0.02 0.01 0.01 0.01 0.01 0.01
6 Manu goods 0.14 0.14 0.14 0.14 0.14 0.13 0.13 0.13 0.13 0.13
7 Mach/equip 0.39 0.40 0.44 0.48 0.52 0.57 0.60 0.63 0.61 0.63
8 Misc manuf 0.42 0.41 0.38 0.33 0.30 0.25 0.23 0.20 0.20 0.19
9 Comm NES 0.01 0.01 0.01 0.01 0.01 0.01 0.02 0.02 0.02 0.03
Total US$ millions 23829.57 24215.50 25805.92 26300.41 27942.02 30157.56 31022.38 32623.87 34343.29 35204.34
India
0 Food 0.08 0.08 0.07 0.08 0.09 0.07 0.08 0.08 0.07 0.09
1 Bev/tobacco 0.00 0.00 0.00 0.00 0.00 0.00 0.00 0.00 0.00 0.00
2 Crude mat. 0.03 0.03 0.03 0.03 0.02 0.03 0.04 0.03 0.04 0.02
3 Mineral fuels 0.09 0.05 0.04 0.01 0.01 0.01 0.01 0.00 0.00 0.00
4 Anim/veg oils 0.01 0.01 0.00 0.01 0.01 0.01 0.01 0.00 0.01 0.00
5 Chemicals 0.03 0.04 0.04 0.04 0.04 0.04 0.05 0.06 0.05 0.05
6 Manu goods 0.47 0.46 0.45 0.46 0.43 0.45 0.42 0.43 0.44 0.46
7 Mach/equip 0.03 0.03 0.03 0.04 0.04 0.06 0.06 0.07 0.06 0.05
8 Misc manuf 0.27 0.29 0.33 0.34 0.35 0.33 0.33 0.32 0.32 0.30
9 Comm NES 0.01 0.01 0.00 0.01 0.00 0.01 0.01 0.01 0.01 0.02
Total US$ millions 3421.44 3423.76 4065.57 4882.98 5663.21 6090.55 6528.52 7320.93 8658.54 9070.82
Pakistan
0 Food 0.05 0.05 0.04 0.03 0.04 0.02 0.03 0.02 0.02 0.02
1 Bev/tobacco 0.00 0.00 0.00 0.00 0.00 0.00 0.00 0.00 0.00 0.00
2 Crude mat. 0.04 0.03 0.01 0.02 0.02 0.01 0.02 0.01 0.01 0.01
3 Mineral fuels 0.00 0.00 0.00 0.00 0.00 0.00 0.00 0.00 0.00 0.00
4 Anim/veg oils 0.00 0.00 0.00 0.00 0.00 0.00 0.00 0.00 0.00 0.00
5 Chemicals 0.00 0.00 0.00 0.00 0.00 0.00 0.00 0.00 0.00 0.00
6 Manu goods 0.40 0.42 0.37 0.36 0.35 0.37 0.37 0.42 0.46 0.45
7 Mach/equip 0.01 0.01 0.01 0.01 0.00 0.00 0.00 0.00 0.00 0.00
8 Misc manuf 0.49 0.48 0.56 0.58 0.58 0.59 0.57 0.55 0.51 0.52
9 Comm NES 0.01 0.01 0.01 0.00 0.01 0.00 0.00 0.00 0.00 0.00
Total US$ millions 656.13 713.01 931.66 966.75 1084.68 1278.18 1348.75 1442.38 1788.12 1740.73
258 M.G. Plummer / Journal of Asian Economics 14 (2003) 243–281
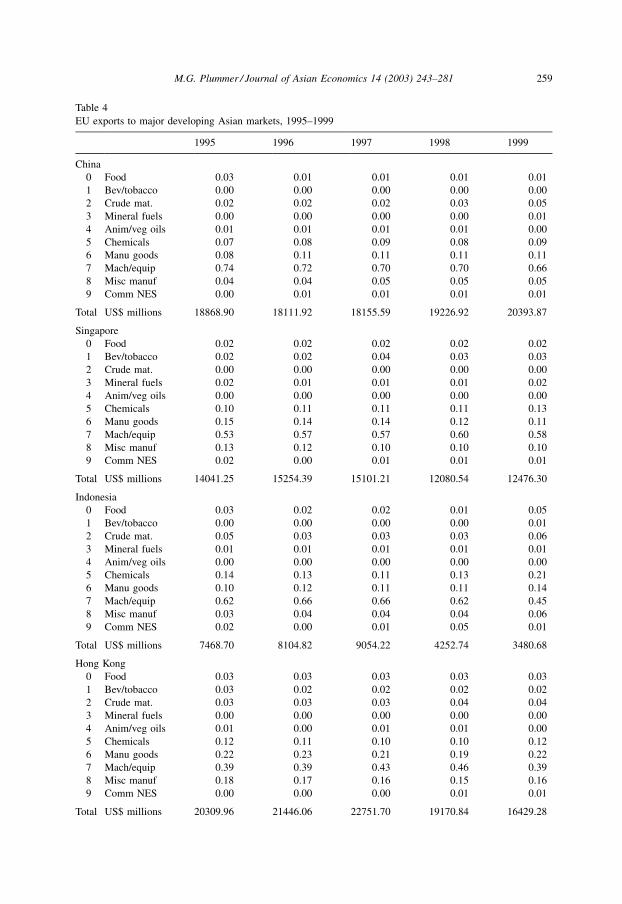
Table 4
EU exports to major developing Asian markets, 1995–1999
1995 1996 1997 1998 1999
China
0 Food 0.03 0.01 0.01 0.01 0.01
1 Bev/tobacco 0.00 0.00 0.00 0.00 0.00
2 Crude mat. 0.02 0.02 0.02 0.03 0.05
3 Mineral fuels 0.00 0.00 0.00 0.00 0.01
4 Anim/veg oils 0.01 0.01 0.01 0.01 0.00
5 Chemicals 0.07 0.08 0.09 0.08 0.09
6 Manu goods 0.08 0.11 0.11 0.11 0.11
7 Mach/equip 0.74 0.72 0.70 0.70 0.66
8 Misc manuf 0.04 0.04 0.05 0.05 0.05
9 Comm NES 0.00 0.01 0.01 0.01 0.01
Total US$ millions 18868.90 18111.92 18155.59 19226.92 20393.87
Singapore
0 Food 0.02 0.02 0.02 0.02 0.02
1 Bev/tobacco 0.02 0.02 0.04 0.03 0.03
2 Crude mat. 0.00 0.00 0.00 0.00 0.00
3 Mineral fuels 0.02 0.01 0.01 0.01 0.02
4 Anim/veg oils 0.00 0.00 0.00 0.00 0.00
5 Chemicals 0.10 0.11 0.11 0.11 0.13
6 Manu goods 0.15 0.14 0.14 0.12 0.11
7 Mach/equip 0.53 0.57 0.57 0.60 0.58
8 Misc manuf 0.13 0.12 0.10 0.10 0.10
9 Comm NES 0.02 0.00 0.01 0.01 0.01
Total US$ millions 14041.25 15254.39 15101.21 12080.54 12476.30
Indonesia
0 Food 0.03 0.02 0.02 0.01 0.05
1 Bev/tobacco 0.00 0.00 0.00 0.00 0.01
2 Crude mat. 0.05 0.03 0.03 0.03 0.06
3 Mineral fuels 0.01 0.01 0.01 0.01 0.01
4 Anim/veg oils 0.00 0.00 0.00 0.00 0.00
5 Chemicals 0.14 0.13 0.11 0.13 0.21
6 Manu goods 0.10 0.12 0.11 0.11 0.14
7 Mach/equip 0.62 0.66 0.66 0.62 0.45
8 Misc manuf 0.03 0.04 0.04 0.04 0.06
9 Comm NES 0.02 0.00 0.01 0.05 0.01
Total US$ millions 7468.70 8104.82 9054.22 4252.74 3480.68
Hong Kong
0 Food 0.03 0.03 0.03 0.03 0.03
1 Bev/tobacco 0.03 0.02 0.02 0.02 0.02
2 Crude mat. 0.03 0.03 0.03 0.04 0.04
3 Mineral fuels 0.00 0.00 0.00 0.00 0.00
4 Anim/veg oils 0.01 0.00 0.01 0.01 0.00
5 Chemicals 0.12 0.11 0.10 0.10 0.12
6 Manu goods 0.22 0.23 0.21 0.19 0.22
7 Mach/equip 0.39 0.39 0.43 0.46 0.39
8 Misc manuf 0.18 0.17 0.16 0.15 0.16
9 Comm NES 0.00 0.00 0.00 0.01 0.01
Total US$ millions 20309.96 21446.06 22751.70 19170.84 16429.28
M.G. Plummer / Journal of Asian Economics 14 (2003) 243–281 259
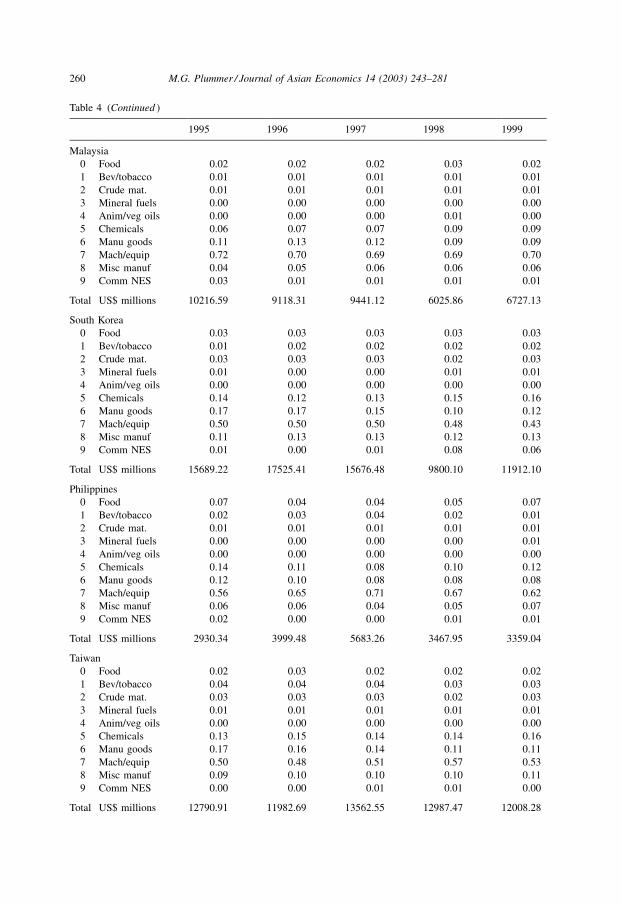
Table 4 (Continued )
1995 1996 1997 1998 1999
Malaysia
0 Food 0.02 0.02 0.02 0.03 0.02
1 Bev/tobacco 0.01 0.01 0.01 0.01 0.01
2 Crude mat. 0.01 0.01 0.01 0.01 0.01
3 Mineral fuels 0.00 0.00 0.00 0.00 0.00
4 Anim/veg oils 0.00 0.00 0.00 0.01 0.00
5 Chemicals 0.06 0.07 0.07 0.09 0.09
6 Manu goods 0.11 0.13 0.12 0.09 0.09
7 Mach/equip 0.72 0.70 0.69 0.69 0.70
8 Misc manuf 0.04 0.05 0.06 0.06 0.06
9 Comm NES 0.03 0.01 0.01 0.01 0.01
Total US$ millions 10216.59 9118.31 9441.12 6025.86 6727.13
South Korea
0 Food 0.03 0.03 0.03 0.03 0.03
1 Bev/tobacco 0.01 0.02 0.02 0.02 0.02
2 Crude mat. 0.03 0.03 0.03 0.02 0.03
3 Mineral fuels 0.01 0.00 0.00 0.01 0.01
4 Anim/veg oils 0.00 0.00 0.00 0.00 0.00
5 Chemicals 0.14 0.12 0.13 0.15 0.16
6 Manu goods 0.17 0.17 0.15 0.10 0.12
7 Mach/equip 0.50 0.50 0.50 0.48 0.43
8 Misc manuf 0.11 0.13 0.13 0.12 0.13
9 Comm NES 0.01 0.00 0.01 0.08 0.06
Total US$ millions 15689.22 17525.41 15676.48 9800.10 11912.10
Philippines
0 Food 0.07 0.04 0.04 0.05 0.07
1 Bev/tobacco 0.02 0.03 0.04 0.02 0.01
2 Crude mat. 0.01 0.01 0.01 0.01 0.01
3 Mineral fuels 0.00 0.00 0.00 0.00 0.01
4 Anim/veg oils 0.00 0.00 0.00 0.00 0.00
5 Chemicals 0.14 0.11 0.08 0.10 0.12
6 Manu goods 0.12 0.10 0.08 0.08 0.08
7 Mach/equip 0.56 0.65 0.71 0.67 0.62
8 Misc manuf 0.06 0.06 0.04 0.05 0.07
9 Comm NES 0.02 0.00 0.00 0.01 0.01
Total US$ millions 2930.34 3999.48 5683.26 3467.95 3359.04
Taiwan
0 Food 0.02 0.03 0.02 0.02 0.02
1 Bev/tobacco 0.04 0.04 0.04 0.03 0.03
2 Crude mat. 0.03 0.03 0.03 0.02 0.03
3 Mineral fuels 0.01 0.01 0.01 0.01 0.01
4 Anim/veg oils 0.00 0.00 0.00 0.00 0.00
5 Chemicals 0.13 0.15 0.14 0.14 0.16
6 Manu goods 0.17 0.16 0.14 0.11 0.11
7 Mach/equip 0.50 0.48 0.51 0.57 0.53
8 Misc manuf 0.09 0.10 0.10 0.10 0.11
9 Comm NES 0.00 0.00 0.01 0.01 0.00
Total US$ millions 12790.91 11982.69 13562.55 12987.47 12008.28
260 M.G. Plummer / Journal of Asian Economics 14 (2003) 243–281
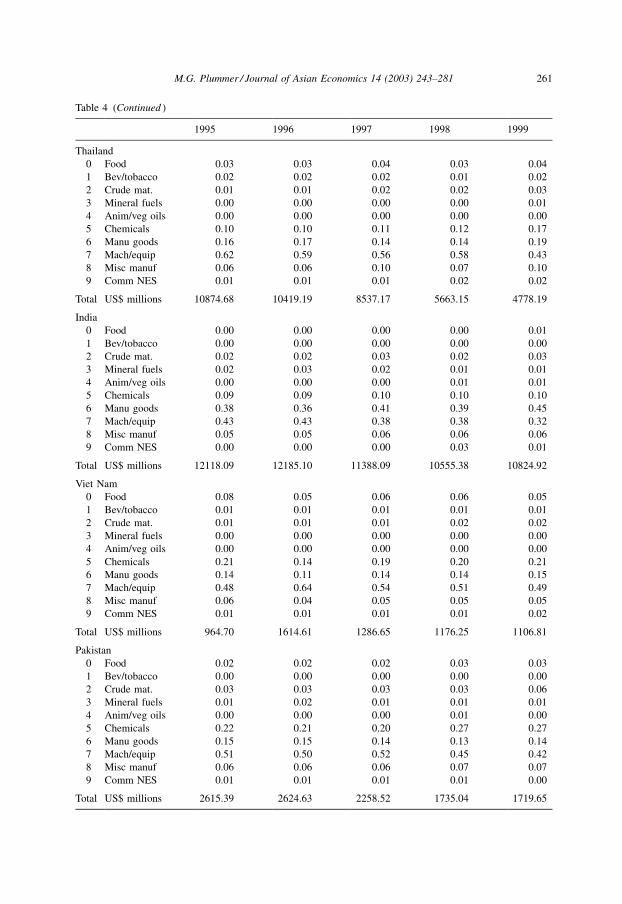
Table 4 (Continued )
1995 1996 1997 1998 1999
Thailand
0 Food 0.03 0.03 0.04 0.03 0.04
1 Bev/tobacco 0.02 0.02 0.02 0.01 0.02
2 Crude mat. 0.01 0.01 0.02 0.02 0.03
3 Mineral fuels 0.00 0.00 0.00 0.00 0.01
4 Anim/veg oils 0.00 0.00 0.00 0.00 0.00
5 Chemicals 0.10 0.10 0.11 0.12 0.17
6 Manu goods 0.16 0.17 0.14 0.14 0.19
7 Mach/equip 0.62 0.59 0.56 0.58 0.43
8 Misc manuf 0.06 0.06 0.10 0.07 0.10
9 Comm NES 0.01 0.01 0.01 0.02 0.02
Total US$ millions 10874.68 10419.19 8537.17 5663.15 4778.19
India
0 Food 0.00 0.00 0.00 0.00 0.01
1 Bev/tobacco 0.00 0.00 0.00 0.00 0.00
2 Crude mat. 0.02 0.02 0.03 0.02 0.03
3 Mineral fuels 0.02 0.03 0.02 0.01 0.01
4 Anim/veg oils 0.00 0.00 0.00 0.01 0.01
5 Chemicals 0.09 0.09 0.10 0.10 0.10
6 Manu goods 0.38 0.36 0.41 0.39 0.45
7 Mach/equip 0.43 0.43 0.38 0.38 0.32
8 Misc manuf 0.05 0.05 0.06 0.06 0.06
9 Comm NES 0.00 0.00 0.00 0.03 0.01
Total US$ millions 12118.09 12185.10 11388.09 10555.38 10824.92
Viet Nam
0 Food 0.08 0.05 0.06 0.06 0.05
1 Bev/tobacco 0.01 0.01 0.01 0.01 0.01
2 Crude mat. 0.01 0.01 0.01 0.02 0.02
3 Mineral fuels 0.00 0.00 0.00 0.00 0.00
4 Anim/veg oils 0.00 0.00 0.00 0.00 0.00
5 Chemicals 0.21 0.14 0.19 0.20 0.21
6 Manu goods 0.14 0.11 0.14 0.14 0.15
7 Mach/equip 0.48 0.64 0.54 0.51 0.49
8 Misc manuf 0.06 0.04 0.05 0.05 0.05
9 Comm NES 0.01 0.01 0.01 0.01 0.02
Total US$ millions 964.70 1614.61 1286.65 1176.25 1106.81
Pakistan
0 Food 0.02 0.02 0.02 0.03 0.03
1 Bev/tobacco 0.00 0.00 0.00 0.00 0.00
2 Crude mat. 0.03 0.03 0.03 0.03 0.06
3 Mineral fuels 0.01 0.02 0.01 0.01 0.01
4 Anim/veg oils 0.00 0.00 0.00 0.01 0.00
5 Chemicals 0.22 0.21 0.20 0.27 0.27
6 Manu goods 0.15 0.15 0.14 0.13 0.14
7 Mach/equip 0.51 0.50 0.52 0.45 0.42
8 Misc manuf 0.06 0.06 0.06 0.07 0.07
9 Comm NES 0.01 0.01 0.01 0.01 0.00
Total US$ millions 2615.39 2624.63 2258.52 1735.04 1719.65
M.G. Plummer / Journal of Asian Economics 14 (2003) 243–281 261
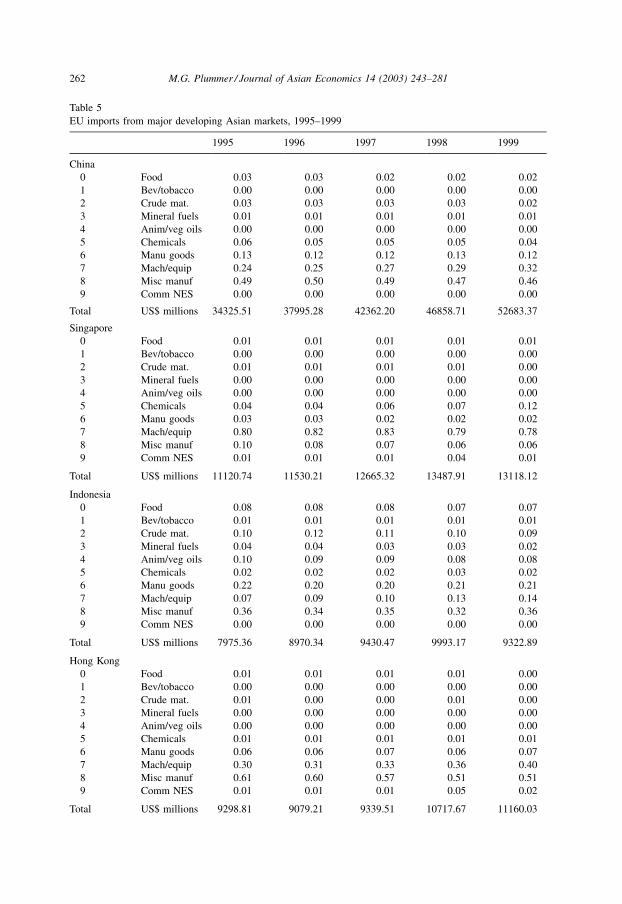
Table 5
EU imports from major developing Asian markets, 1995–1999
1995 1996 1997 1998 1999
China
0 Food 0.03 0.03 0.02 0.02 0.02
1 Bev/tobacco 0.00 0.00 0.00 0.00 0.00
2 Crude mat. 0.03 0.03 0.03 0.03 0.02
3 Mineral fuels 0.01 0.01 0.01 0.01 0.01
4 Anim/veg oils 0.00 0.00 0.00 0.00 0.00
5 Chemicals 0.06 0.05 0.05 0.05 0.04
6 Manu goods 0.13 0.12 0.12 0.13 0.12
7 Mach/equip 0.24 0.25 0.27 0.29 0.32
8 Misc manuf 0.49 0.50 0.49 0.47 0.46
9 Comm NES 0.00 0.00 0.00 0.00 0.00
Total US$ millions 34325.51 37995.28 42362.20 46858.71 52683.37
Singapore
0 Food 0.01 0.01 0.01 0.01 0.01
1 Bev/tobacco 0.00 0.00 0.00 0.00 0.00
2 Crude mat. 0.01 0.01 0.01 0.01 0.00
3 Mineral fuels 0.00 0.00 0.00 0.00 0.00
4 Anim/veg oils 0.00 0.00 0.00 0.00 0.00
5 Chemicals 0.04 0.04 0.06 0.07 0.12
6 Manu goods 0.03 0.03 0.02 0.02 0.02
7 Mach/equip 0.80 0.82 0.83 0.79 0.78
8 Misc manuf 0.10 0.08 0.07 0.06 0.06
9 Comm NES 0.01 0.01 0.01 0.04 0.01
Total US$ millions 11120.74 11530.21 12665.32 13487.91 13118.12
Indonesia
0 Food 0.08 0.08 0.08 0.07 0.07
1 Bev/tobacco 0.01 0.01 0.01 0.01 0.01
2 Crude mat. 0.10 0.12 0.11 0.10 0.09
3 Mineral fuels 0.04 0.04 0.03 0.03 0.02
4 Anim/veg oils 0.10 0.09 0.09 0.08 0.08
5 Chemicals 0.02 0.02 0.02 0.03 0.02
6 Manu goods 0.22 0.20 0.20 0.21 0.21
7 Mach/equip 0.07 0.09 0.10 0.13 0.14
8 Misc manuf 0.36 0.34 0.35 0.32 0.36
9 Comm NES 0.00 0.00 0.00 0.00 0.00
Total US$ millions 7975.36 8970.34 9430.47 9993.17 9322.89
Hong Kong
0 Food 0.01 0.01 0.01 0.01 0.00
1 Bev/tobacco 0.00 0.00 0.00 0.00 0.00
2 Crude mat. 0.01 0.00 0.00 0.01 0.00
3 Mineral fuels 0.00 0.00 0.00 0.00 0.00
4 Anim/veg oils 0.00 0.00 0.00 0.00 0.00
5 Chemicals 0.01 0.01 0.01 0.01 0.01
6 Manu goods 0.06 0.06 0.07 0.06 0.07
7 Mach/equip 0.30 0.31 0.33 0.36 0.40
8 Misc manuf 0.61 0.60 0.57 0.51 0.51
9 Comm NES 0.01 0.01 0.01 0.05 0.02
Total US$ millions 9298.81 9079.21 9339.51 10717.67 11160.03
262 M.G. Plummer / Journal of Asian Economics 14 (2003) 243–281
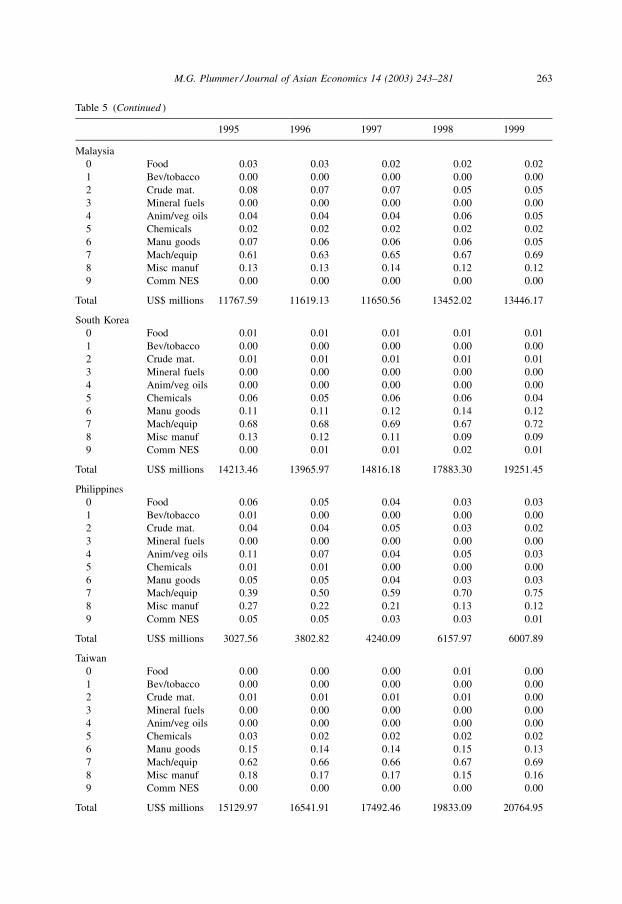
Table 5 (Continued )
1995 1996 1997 1998 1999
Malaysia
0 Food 0.03 0.03 0.02 0.02 0.02
1 Bev/tobacco 0.00 0.00 0.00 0.00 0.00
2 Crude mat. 0.08 0.07 0.07 0.05 0.05
3 Mineral fuels 0.00 0.00 0.00 0.00 0.00
4 Anim/veg oils 0.04 0.04 0.04 0.06 0.05
5 Chemicals 0.02 0.02 0.02 0.02 0.02
6 Manu goods 0.07 0.06 0.06 0.06 0.05
7 Mach/equip 0.61 0.63 0.65 0.67 0.69
8 Misc manuf 0.13 0.13 0.14 0.12 0.12
9 Comm NES 0.00 0.00 0.00 0.00 0.00
Total US$ millions 11767.59 11619.13 11650.56 13452.02 13446.17
South Korea
0 Food 0.01 0.01 0.01 0.01 0.01
1 Bev/tobacco 0.00 0.00 0.00 0.00 0.00
2 Crude mat. 0.01 0.01 0.01 0.01 0.01
3 Mineral fuels 0.00 0.00 0.00 0.00 0.00
4 Anim/veg oils 0.00 0.00 0.00 0.00 0.00
5 Chemicals 0.06 0.05 0.06 0.06 0.04
6 Manu goods 0.11 0.11 0.12 0.14 0.12
7 Mach/equip 0.68 0.68 0.69 0.67 0.72
8 Misc manuf 0.13 0.12 0.11 0.09 0.09
9 Comm NES 0.00 0.01 0.01 0.02 0.01
Total US$ millions 14213.46 13965.97 14816.18 17883.30 19251.45
Philippines
0 Food 0.06 0.05 0.04 0.03 0.03
1 Bev/tobacco 0.01 0.00 0.00 0.00 0.00
2 Crude mat. 0.04 0.04 0.05 0.03 0.02
3 Mineral fuels 0.00 0.00 0.00 0.00 0.00
4 Anim/veg oils 0.11 0.07 0.04 0.05 0.03
5 Chemicals 0.01 0.01 0.00 0.00 0.00
6 Manu goods 0.05 0.05 0.04 0.03 0.03
7 Mach/equip 0.39 0.50 0.59 0.70 0.75
8 Misc manuf 0.27 0.22 0.21 0.13 0.12
9 Comm NES 0.05 0.05 0.03 0.03 0.01
Total US$ millions 3027.56 3802.82 4240.09 6157.97 6007.89
Taiwan
0 Food 0.00 0.00 0.00 0.01 0.00
1 Bev/tobacco 0.00 0.00 0.00 0.00 0.00
2 Crude mat. 0.01 0.01 0.01 0.01 0.00
3 Mineral fuels 0.00 0.00 0.00 0.00 0.00
4 Anim/veg oils 0.00 0.00 0.00 0.00 0.00
5 Chemicals 0.03 0.02 0.02 0.02 0.02
6 Manu goods 0.15 0.14 0.14 0.15 0.13
7 Mach/equip 0.62 0.66 0.66 0.67 0.69
8 Misc manuf 0.18 0.17 0.17 0.15 0.16
9 Comm NES 0.00 0.00 0.00 0.00 0.00
Total US$ millions 15129.97 16541.91 17492.46 19833.09 20764.95
M.G. Plummer / Journal of Asian Economics 14 (2003) 243–281 263
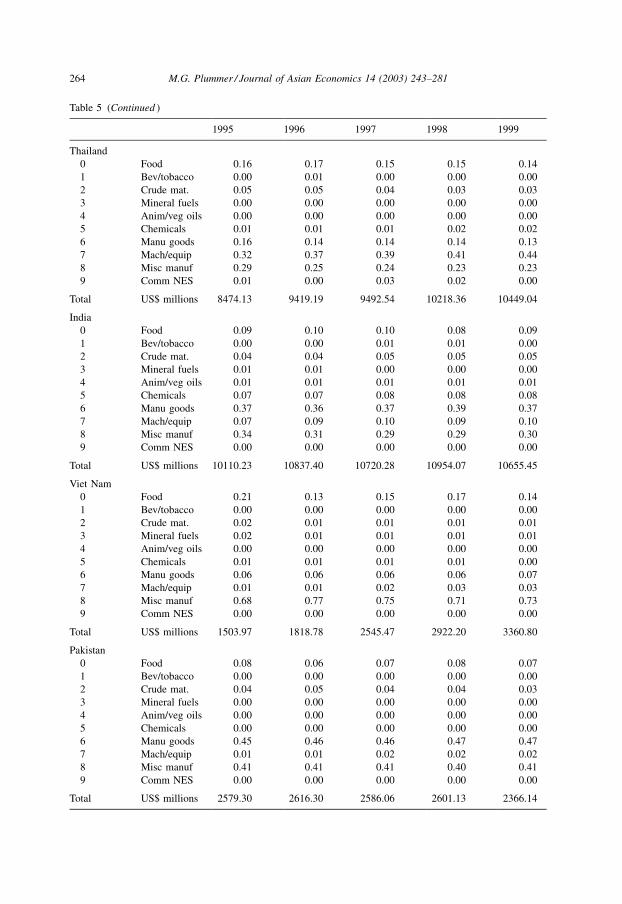
Table 5 (Continued )
1995 1996 1997 1998 1999
Thailand
0 Food 0.16 0.17 0.15 0.15 0.14
1 Bev/tobacco 0.00 0.01 0.00 0.00 0.00
2 Crude mat. 0.05 0.05 0.04 0.03 0.03
3 Mineral fuels 0.00 0.00 0.00 0.00 0.00
4 Anim/veg oils 0.00 0.00 0.00 0.00 0.00
5 Chemicals 0.01 0.01 0.01 0.02 0.02
6 Manu goods 0.16 0.14 0.14 0.14 0.13
7 Mach/equip 0.32 0.37 0.39 0.41 0.44
8 Misc manuf 0.29 0.25 0.24 0.23 0.23
9 Comm NES 0.01 0.00 0.03 0.02 0.00
Total US$ millions 8474.13 9419.19 9492.54 10218.36 10449.04
India
0 Food 0.09 0.10 0.10 0.08 0.09
1 Bev/tobacco 0.00 0.00 0.01 0.01 0.00
2 Crude mat. 0.04 0.04 0.05 0.05 0.05
3 Mineral fuels 0.01 0.01 0.00 0.00 0.00
4 Anim/veg oils 0.01 0.01 0.01 0.01 0.01
5 Chemicals 0.07 0.07 0.08 0.08 0.08
6 Manu goods 0.37 0.36 0.37 0.39 0.37
7 Mach/equip 0.07 0.09 0.10 0.09 0.10
8 Misc manuf 0.34 0.31 0.29 0.29 0.30
9 Comm NES 0.00 0.00 0.00 0.00 0.00
Total US$ millions 10110.23 10837.40 10720.28 10954.07 10655.45
Viet Nam
0 Food 0.21 0.13 0.15 0.17 0.14
1 Bev/tobacco 0.00 0.00 0.00 0.00 0.00
2 Crude mat. 0.02 0.01 0.01 0.01 0.01
3 Mineral fuels 0.02 0.01 0.01 0.01 0.01
4 Anim/veg oils 0.00 0.00 0.00 0.00 0.00
5 Chemicals 0.01 0.01 0.01 0.01 0.00
6 Manu goods 0.06 0.06 0.06 0.06 0.07
7 Mach/equip 0.01 0.01 0.02 0.03 0.03
8 Misc manuf 0.68 0.77 0.75 0.71 0.73
9 Comm NES 0.00 0.00 0.00 0.00 0.00
Total US$ millions 1503.97 1818.78 2545.47 2922.20 3360.80
Pakistan
0 Food 0.08 0.06 0.07 0.08 0.07
1 Bev/tobacco 0.00 0.00 0.00 0.00 0.00
2 Crude mat. 0.04 0.05 0.04 0.04 0.03
3 Mineral fuels 0.00 0.00 0.00 0.00 0.00
4 Anim/veg oils 0.00 0.00 0.00 0.00 0.00
5 Chemicals 0.00 0.00 0.00 0.00 0.00
6 Manu goods 0.45 0.46 0.46 0.47 0.47
7 Mach/equip 0.01 0.01 0.02 0.02 0.02
8 Misc manuf 0.41 0.41 0.41 0.40 0.41
9 Comm NES 0.00 0.00 0.00 0.00 0.00
Total US$ millions 2579.30 2616.30 2586.06 2601.13 2366.14
264 M.G. Plummer / Journal of Asian Economics 14 (2003) 243–281
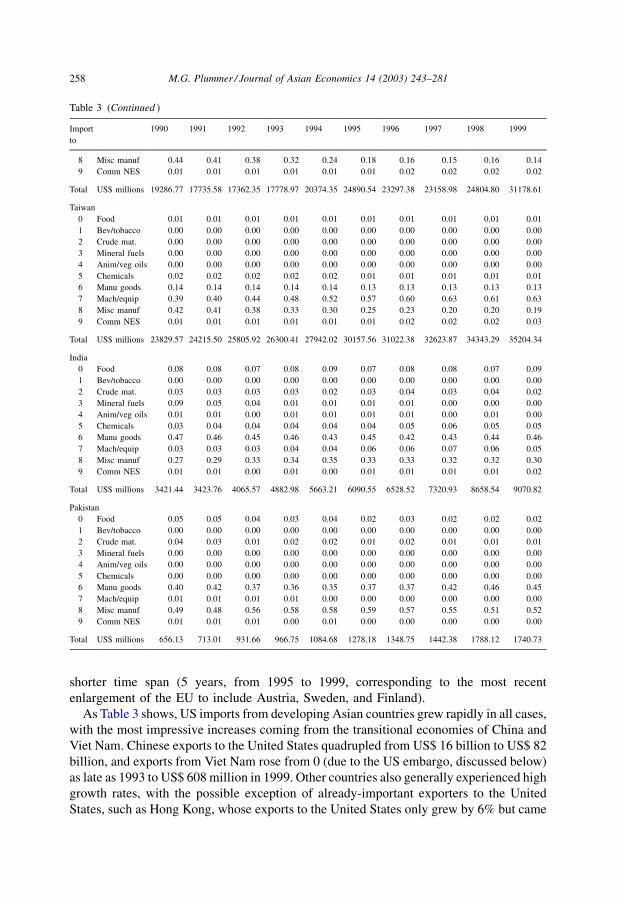
to US$ 11 billion in 1999. Regarding changes in the structure of these imports, SITC 7, as
expected, dominates in almost all markets, with shares that are generally significantly
higher than in 1990. In fact, in 1999 SITC 7 constituted over three-fourths of all imports
from Malaysia and Singapore, and two-thirds of imports from the Philippines, South Korea
and Taiwan. Where shares are relatively low in East Asia (i.e. China, Indonesia, and Viet
Nam), they have risen considerably over time, for example doubling in the case of China
and increasing by 24-fold in the case of Indonesia.10 Only in India and Pakistan do SITC 7
exports appear to be insignificant.
As is apparent in Table 5, a similar but generally less-pronounced trend is in evidence
over the mid-late 1990s in the case of Asian exports to the EU, where SITC 7 also made
important gains in bilateral export structures. The share of SITC 7 in East Asian exports
was almost always higher in the case of the United States, with the exception of Hong
Kong.
It is interesting to note that, in the case of both the United States (Table 2) and the EU
(Table 4), East Asian imports also showed an increase in the share of more sophisticated
commodities, with SITC 7 generally becoming more important over time. For example, the
share of SITC 7 exports from the United States rose in all countries save Malaysia, where it
stayed the same (at a dominant 77%). Even the shares in the less-developed countries such
as India, Pakistan and Viet Nam saw these shares increase substantially, though the levels
were still relatively low in these countries.
It isnocoincidence thatexportsandimports tendtoshowthesameevolution.Thetraditional
explanation would be that the structure of exports and imports are both correlated with per
capita income; the more developed the country, the greater the share of sophisticated exports
generated from a more sophisticated economy, and the more sophisticated are the tastes of the
population (and, hence, imports tend to be more sophisticated). But with the increasing global
division of labor, a country’s imports may end up as its exports with a small amount of value
added.Directforeigninvestment(DFI)playsanimportantroleinthisprocess; indeed,asiswell
documented in the literature (e.g. Lee & Roland-Holst, 1999), the trade–DFI link is not only
important but in some cases dominating, a result that would be congruent with Tamamura
(2002). In addition, the economic literature is increasingly respecting the important role that
imports play in the process of technology transfer.
Finally, in order to get a better idea of the dynamism of US trade with Asia, we calculate
Spearman Rank Correlation Coefficients (SRCCs) to capture changes in trade structure over
time(Table6).TheSRCCisanon-parametricestimate, showinghowtherankingsoftwoseries
are correlated with each other. The estimates range from �1 to þ1: perfect rank correlation
would be unity in absolute value, while complete lack of correlation would be zero. Here, we
rank exports (imports) according to their importance between two years (1990 and 1995, 1990
and 1999 for the United States; 1995 and 1999 for the EU) to capture this effect. The lower the
SRCC,thegreater thechangeinexport(import)structure.Asthere isaclearaggregationbias in
such calculations, we undertake this exercise at the three-digit SITC level.
As expected, US imports from developing Asia display a considerable amount of
structural change in all cases save China and Taiwan, where the SRCCs are fairly high at
10 The case of Hong Kong is difficult to decipher, as its role as a key entrepot center increased substantially
with its economic and political integration with China.
M.G. Plummer / Journal of Asian Economics 14 (2003) 243–281 265
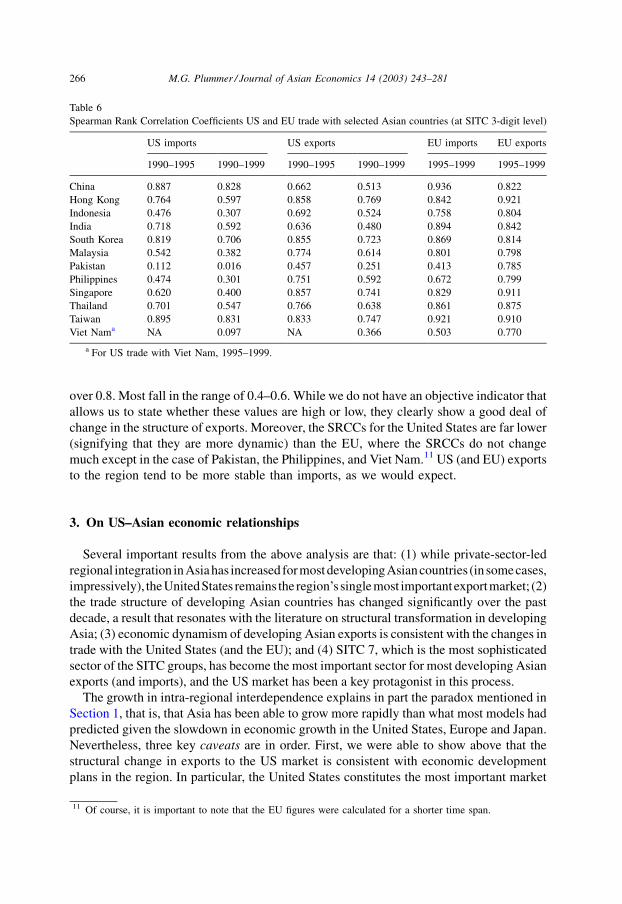
over 0.8. Most fall in the range of 0.4–0.6. While we do not have an objective indicator that
allows us to state whether these values are high or low, they clearly show a good deal of
change in the structure of exports. Moreover, the SRCCs for the United States are far lower
(signifying that they are more dynamic) than the EU, where the SRCCs do not change
much except in the case of Pakistan, the Philippines, and Viet Nam.11 US (and EU) exports
to the region tend to be more stable than imports, as we would expect.
3. On US–Asian economic relationships
Several important results from the above analysis are that: (1) while private-sector-led
regional integration inAsiahas increased formostdeveloping Asiancountries (in somecases,
impressively), theUnitedStates remains the region’s singlemost importantexportmarket; (2)
the trade structure of developing Asian countries has changed significantly over the past
decade, a result that resonates with the literature on structural transformation in developing
Asia; (3) economic dynamism of developing Asian exports is consistent with the changes in
trade with the United States (and the EU); and (4) SITC 7, which is the most sophisticated
sector of the SITC groups, has become the most important sector for most developing Asian
exports (and imports), and the US market has been a key protagonist in this process.
The growth in intra-regional interdependence explains in part the paradox mentioned in
Section 1, that is, that Asia has been able to grow more rapidly than what most models had
predicted given the slowdown in economic growth in the United States, Europe and Japan.
Nevertheless, three key caveats are in order. First, we were able to show above that the
structural change in exports to the US market is consistent with economic development
plans in the region. In particular, the United States constitutes the most important market
Table 6
Spearman Rank Correlation Coefficients US and EU trade with selected Asian countries (at SITC 3-digit level)
US imports US exports EU imports EU exports
1990–1995 1990–1999 1990–1995 1990–1999 1995–1999 1995–1999
China 0.887 0.828 0.662 0.513 0.936 0.822
Hong Kong 0.764 0.597 0.858 0.769 0.842 0.921
Indonesia 0.476 0.307 0.692 0.524 0.758 0.804
India 0.718 0.592 0.636 0.480 0.894 0.842
South Korea 0.819 0.706 0.855 0.723 0.869 0.814
Malaysia 0.542 0.382 0.774 0.614 0.801 0.798
Pakistan 0.112 0.016 0.457 0.251 0.413 0.785
Philippines 0.474 0.301 0.751 0.592 0.672 0.799
Singapore 0.620 0.400 0.857 0.741 0.829 0.911
Thailand 0.701 0.547 0.766 0.638 0.861 0.875
Taiwan 0.895 0.831 0.833 0.747 0.921 0.910
Viet Nama NA 0.097 NA 0.366 0.503 0.770
a For US trade with Viet Nam, 1995–1999.
11 Of course, it is important to note that the EU figures were calculated for a shorter time span.
266 M.G. Plummer / Journal of Asian Economics 14 (2003) 243–281
for SITC 7 items. Tamamura’s (2002) results, reviewed above, show that an impressive
amount of growth in this sector has been spurred by demand-side considerations in the US
market. Hence, the United States market continues to be important not only in terms of
quantity but also quality. Moreover, it is important to point out that while Asian countries
have grown faster than what was predicted, growth has still slowed at least in part due to the
generally poor performance of the US economy. Indeed, Singapore, the most open market
in the region (along with Hong Kong) and having two-thirds of its exports falling under
SITC 7, actually experienced a strong recession in 2001.
Second, while it has been shown that there is a tendency for the price of manufactures
relative to that of primary products to rise, relative prices within manufactures continue to
be quite volatile. Indeed, the prices of many electronics-related products have been subject
to considerable oscillations. For example, as is pointed out in Kim, Ayhan Kose, and
Plummer (2001), a key terms of trade shock contributing to the Asian Crisis was the fall in
certain electronics prices, including a precipitous decline in DRAM prices.
Third, while intra-regional trade has been increasing, there is no evidence that intra-
regional financial transactions have risen, at a time when finance has been shown to be the
Achilles’ Heel of regional development. Indeed, Japan has become a less important actor in
supplying DFI to developing Asia (indeed, for the first time, Japan is becoming an
important recipient of global DFI inflows), while the United States and Europe continue to
increase their DFI flows to the region at fairly robust rates (Kreinin & Plummer, 2003). This
is not only true at the regional level but also globally. For example, in 2000, US and EU DFI
outflows came to US$ 139 billion and US$ 773 billion, respectively, whereas Japanese DFI
outflows came to only US$ 33 billion.12 Moreover, while reliable data on bilateral financial
flows by type are difficult to come by, it is clear that external financial intermediation of
developing Asia countries tends to take place principally in the United States, followed by
the EU and Japan. Some speak of a resurgence in EU finance once markets become more
comfortable with the euro, an argument that might be supported by the strong appreciation
of the euro over 2002 and early 2003. However, a resurgence in Japanese finance does not
seem to be on the radar screen in the short-medium run, given the financial crisis in the
country as well as relatively-closed (though obviously opening), illiquid financial markets.
Hence, the region will continue to be exposed to the vicissitudes of the US (and, potentially,
EU) financial markets.
This brings us to a fourth (and related) caveat: there is some question as to the
sustainability of the US current account deficit. Economists have been increasingly asking
the question of whether or not the United States can continue to run current account deficits
of 4% of GDP. The United States has had large current account deficits essentially for the
past two decades; the flip-side of these deficits is the huge increase in the holdings of US
financial assets, particularly sovereign debt, in foreign hands. If, indeed, the US economy
can sustain large current account deficits over the medium-long-term (a prospect that many
economists doubt), it may very well be that its politics cannot. Moreover, this large
proportion of liquid debt in the hands of non-residents creates, ceteris paribus, a greater
potential for wide swings in the dollar and/or crisis. Hence, even if the economy could take
it, the markets may not believe it.
12 UNCTAD (2003).
M.G. Plummer / Journal of Asian Economics 14 (2003) 243–281 267
Does this leave the dollar exposed to a crisis? Such an expenditure-switching policy
might have an important bearing on the US trade balance through the relative price effect
on tradable and non-tradable goods, but it could lead to significant negative consequence
for Asian exports to the United States. While most Asian developing countries do have
managed floats or even exchange-rate pegs, the role of the dollar has been declining in most
of these targeting schemes. Hence, a fall in the dollar could affect the competitiveness of
Asian exports to the US market (and other markets as well), especially since these countries
increasingly compete with the United States in similar product lines (e.g. within SITC 7).
Former Secretary of the Treasury Larry Summers once quipped that the United States
cannot continue to be an ‘‘importer of last resort.’’ If not the United States, then who? Both
Europe and Japan look like unlikely candidates. It may be that in the medium term that
intra-regional exports in Asia will increase significantly but in an unexpected, and
deleterious, way.
Still, while such a crisis in the United States is possible, it is unlikely, at least in the short-
run. The fundamentals of the US economy are generally strong; indeed, as was noted
above, the US economy seems to be showing fairly encouraging signs of economic growth
in the second half of 2002 and first quarter of 2003, though the Iraqi war is weighing
heavily on the markets and consumer/business confidence. Nevertheless, from a policy
perspective, it seems to be sensible both for developing Asia and the United States to build
a strong relationship. The United States and Asia have ostensibly chosen the path of
bilateral-trading arrangements as a means of enhancing cooperation in the region. The
literature is replete with discussions of the economics of the new regionalism, ‘‘building
bloc versus stumbling bloc’’ issues, and empirical studies; hence, we do not deal with these
issues here, though we will consider emerging issues in US–Asian regionalism in Section
4.13 Rather, we concentrate here on the case study of Viet Nam, which provides an
interesting example of how the United States is using bilateral agreements. It is also the
only bilateral arrangement that the United States has successfully completely in the region,
though it is in the final phase of a few other arrangements.14
3.1. Case study of Viet Nam15
Viet Nam presents an interesting case study in US–Asian relations. Between the end of
the US military involvement in Viet Nam in 1975 and the end of the Vietnamese occupation
13 See, for example, Scollay and Gilbert (2002) for an excellent review of new regional pacts in the region as
well ex ante, CGE estimates of their effects. Moreover, Kreinin and Plummer (2002), among many, review the
economics of the new regionalism, with a focus on developing countries.14 For example, as of the end of 2002, the United States and Singapore were in the final throes of free-trade area
negotiations. An agreement has been reached on the real side—the fact that Singapore is not a threat to US
agriculture, textiles, or steel facilitated negotiations significantly on the US side—but not yet on the financial
side, as Singapore has resisted some aspects of capital market liberalization which may create greater volatility
in Singaporean capital markets, particularly the foreign exchange market (Singapore has always been wary of
internationalization of the Singapore dollar).15 This case study derives in part from the author’s presentation at the conference, ‘‘Bridging Capacity Gaps in
Vietnam’s Economic Integration Program,’’ February 28, 2002. It uses as a source the NCIEC/UNDP
(unpublished) study, ‘‘Stock-Taking Report: Vietnam’s Economic Integration Commitments, Government’s
Action Plans and Donors’ Current Assistance.’’
268 M.G. Plummer / Journal of Asian Economics 14 (2003) 243–281
of Cambodia, US–Vietnamese relations were ice-cold. The United States had imposed a
trade embargo on Viet Nam that was not lifted until the early 1990s, when the process of
establishing diplomatic relations began. Since then, the United States has supported the
economic reform process in Viet Nam and has increasingly endeavored to help integrate it
into the world economy. This process culminated in the Viet Nam–US Bilateral Trade
Agreement (BTA) in October 2001, 2 months before Viet Nam presented its initial offering
to the WTO, which presents an interesting example of the use of a regional agreement to
promote multilateral aims.
A brief bit of recent economic history is in order. Following the economic reform process
unleashed by doi moi in 1986, liberalization of commercial policies in Viet Nam has
gathered considerable momentum over the past 15 years. As mentioned in UNDP (2001),
these reforms have taken place on five main fronts: (1) phasing-out of foreign-exchange
controls and financial restructuring; (2) liberalization of controls regarding foreign-trading
activities; (3) reform of the import and export tax structures and controls used to manage
imports and exports; (4) adoption of measures designed to bring in DFI; and (5) establish-
ing bilateral, regional and multilateral trading agreements.
In many ways, bilateral and regional arrangements have been fuelling reform in other
areas: in order to meet its commitments under the ASEAN Free-Trade Area (AFTA) and
the ASEAN Investment Area (AIA), for example, Viet Nam has had to reform the way in
which it regulates its imports and exports and DFI. The BTA will encourage Viet Nam to
conform to most international norms regarding trade in goods and services, a big step on
the road to reaching the ultimate goal of WTO accession.
Hence, bilateral and plurilateral agreements are increasingly shaping commercial-policy
reform in Viet Nam. This is not unusual; many developing countries are choosing the same
strategy. The 1990s saw a large upswing in the number of preferential-trading agreements,
with the biggest ‘‘spikes’’ in such deals coming in the late 1990s. The WTO homepage
reports over 200 Free-Trade Area (FTAs). And almost all of these new agreements involve
at least one developing or transitional economy.
In addition to AFTA and the BTA, Viet Nam has negotiated special (non-preferen-
tial) accords under: APEC,16 ASEM,17 the World Bank/IMF,18 and the Miyazawa
16 Viet Nam’s commitments under APEC are voluntary and the time-line for implementation of various
policies, indefinite. The most salient commitment that Viet Nam has is to adhere to ‘‘open trade and investment’’
by 2020, though, as discussed later, the lack of definition of what this means leaves things ambiguous.17 While ASEM has no long-term free trade commitments in the way that APEC supposedly does, areas that
have been agreed to include: adoption of international standards regarding sanitary and psytosanitary measures;
continued services liberalization; adopting international standards and conformance measures; simplification of
customs procedures; reduction in differences in intellectual property protection and enforcement standards;
provision of greater transparency in government procurement procedures; and the consideration of the issuance
of an ASEM travel card for businesspeople.18 Viet Nam’s commitments under World Bank and IMF programs in the area of trade generally reinforce the
process of economic integration set out in other agreements, especially AFTA. Moreover, the list of
liberalization measures included under the World Bank/IMF agreement is consistent with what Viet Nam will
have to accept for WTO accession. Coverage, however, is not complete in this sense; the focus is on creating
greater efficiency in the ‘‘real’’ sector as well as advocacy of greater competition and openness in the financial
area. For example, tariff-barrier provisions mirror commitments under AFTA, and those under non-tariff barriers
generally mirror AFTA and BTA commitments.
M.G. Plummer / Journal of Asian Economics 14 (2003) 243–281 269
Initiative.19 But the ‘‘deepest’’ accord that Viet Nam has negotiated is with AFTA. Viet
Nam joined ASEAN in 1995 and agreed to join AFTA in 1996, with a 10-year schedule to
create a free-trade area with its ASEAN neighbors. While this is 3 years later than for the
ASEAN-6, these latter countries began implementation 3 years earlier than Viet Nam. Of
all Viet Nam’s agreements, clearly AFTA has led to the most ex post ‘‘value added,’’ as Viet
Nam has been in AFTA the longest and the country continues to have much to do in
meeting its exigencies: as of early 2002, less than two-thirds of its inclusion-list items were
in the required 0–5% range. According to Viet Nam’s AFTA agreement, it must reduce
tariffs on all ‘‘normal track’’ items (which tend to be the more sensitive ones, e.g. machines,
equipment, iron and steel) by January 2006 and ‘‘fast track’’ items by January 2003. Items
included in the temporary exclusion list are to be gradually phased-out over the 2004–2013
period, after which all commodities should be included in AFTA.
Although AFTA is principally a trade agreement, many protagonists supported AFTA
more as a means of luring DFI inflows, rather than stimulating intra-regional trade (which,
after all, is only about one-fourth of total ASEAN trade). Hence, it is no accident that AFTA
has an ancillary investment agreement, the ASEAN Investment Area. Under this agree-
ment, Viet Nam will: grant immediate and unconditional MFN status for investors (with the
exception of special arrangements such as in a ‘‘growth triangle’’ framework); open up just
about all industries to ASEAN investors; and participate in regional investment promotion
activities, such as the ASEAN Investment Report, the Compendium of Investment Policies
and Measures, and the ASEAN Investment facilitation series.
As Viet Nam and the United States only normalized diplomatic relations in 1994,
the BTA is important not merely in terms of its economic content but also in its heralding
a new era in US–Vietnamese relations. While Viet Nam’s trade with the United States
has been relatively small (from Table 1 and its sources, about 8% of its total exports
and 3% of total imports in 2001), bilateral trade is expected to pick up considerably as
trade relations are stabilized. Moreover, the United States has become an increasingly-
important source of DFI inflows, and will be an important player in Viet Nam’s bid to
become a member of the WTO. In addition, with the potential for trade and investment
diversion from NAFTA and other possible preferential-trading arrangements that the
United States is contemplating, Viet Nam risks being increasingly isolated (at least at the
margin) from the US market. Stable relations are deemed to be of the essence. Hence, the
BTA has been understandably an important priority in the Vietnamese economic-integra-
tion strategy.
19 The ‘‘Miyazawa Initiative’’ builds on cooperation in the area of finance spurred by the Asian Financial
Crisis, beginning with the ‘‘Chiang Mai Initiative’’ (CMI). As part of its agreement with Japan under the rubric
of the Miyazawa Initiative, Viet Nam has agreed to undertake a number of liberalization measures, beginning
‘‘as soon as possible’’ but to be finished no later than 2010. These include the tariffication of 19 groups of goods
currently subject to import license, as well as allowing businesses to export and import all eligible goods with
equal access to export and import quotas; relaxation of local content requirements applied to foreign ventures,
termination of the ‘‘dual price’’ system, and expansion of the list of sectors open to foreign investment;
introduction of international accounting standards; improvements in transparency of customs and promulgation
of the Customs Law; greater effectiveness in intellectual property protection; enhanced competitions laws and
government procurement procedures; promotion of private-sector development and State-Owned Enterprise
reforms; and advocacy of greater deregulation and transparency.
270 M.G. Plummer / Journal of Asian Economics 14 (2003) 243–281
The BTA tends to be consistent with the WTO and ‘‘open regionalism,’’ but there could
be a time-inconsistency in liberalization that gives priority to the United States and, in
effect, could lead to short-term preferential treatment. Viet Nam will have to make
substantial reductions in the tariffs on US imports, in both the industrial and agricultural
sectors. It has agreed to remove all quantitative restrictions applied to industrial
products (252 tariff lines) and agricultural products (82 tariff lines) over a 10-year
period, with sequencing carefully articulated. Some US imports, however, will continue
to be banned, including cigarettes, used consumer goods, right-hand-drive cars, used spare
parts for automobiles, and large motorbikes (175 cc and higher). Moreover, textiles, which
is an important comparative-advantage sector for Viet Nam, is excluded from the
agreement.
In services, Viet Nam agrees to ‘‘general horizontal commitments’’ and the GATS
framework of rules, including disciplines on domestic regulation. Areas that are explicitly
targeted for liberalization include: business services, communications services, construc-
tion and engineering services, distribution services, educational services, financial ser-
vices, health-related services, and tourism and travel-related services. With respect to DFI,
which is closely related to services as their provision often requires foreign branches
(‘‘mode 3’’ services trade), Viet Nam will grant to US investors national treatment in all but
a few selected sectors. Some important excluded sectors include insurance, banking,
dealership in securities, and telecommunications, whereas provisions of the agreement
often allow for joint ventures with up to 50% US equity. Viet Nam will gradually phase-out
all WTO-inconsistent measures under the Trade Related Investment Measures (TRIMs)
convention, though it will continue to have performance requirements in some sectors
through 2008.
Regarding other areas, Viet Nam agreed to full compliance in the WTO Trade-related
Intellectual Property (TRIP) convention within a very short time frame, including TRIPs’
patent and trademark protection within 12 months and copyrights and trade secrets
protection within 18 months. It also agreed to ‘‘TRIPs-plus’’ treatment in several areas.
Other areas covered include: competition policies and laws, government procurement,
deregulation, and business facilitation. It is also worthy of note that the agreement does
mention that the United States will consider GSP privileges for Viet Nam.
In terms of the economic effects of the AFTA and the BTA on Viet Nam, of the
publications in English, the few studies that estimate explicitly the economic effects tend to
yield positive effects of economic integration. Examples: Fukase and Martin (1999) at the
World Bank estimate that the United States’ granting of MFN treatment to Viet Nam would
cause Vietnamese exports to the United States to double, with welfare gains to the economy
of US$ 118 million per year, or about a 0.9% increase in real expenditures per capita. They
also estimate that the effects of Viet Nam’s accession to AFTAwill be very small (e.g. 0.4%
of base-period expenditures in the most optimistic case), though generally positive. Fukase
and Winters (1999) discuss what many of the dynamic effects would be in the context of
ASEAN accession and argue that they could be large, though no numerical estimates are
given.
In short, with some exceptions, the BTA includes many of the policy reforms that Viet
Nam will have to embrace in its WTO application. Moreover, the Vietnamese government
is counting on the United States as an important ally in the application process. It is also
M.G. Plummer / Journal of Asian Economics 14 (2003) 243–281 271
clear that Viet Nam saw many political benefits of such a deal with its former nemesis (and
superpower). However, there is some question of whether or not Viet Nam is ready for the
highly ambitious commitments of the BTA. Liberalization under AFTA, though in many
ways far deeper in terms of economic integration, is likely far ‘‘softer’’ than what the BTA
will be. ASEAN has never been much for monitoring its integration commitments; the
monitoring mechanisms under AFTA have been made intentionally weak. Indeed, there
has even been some back-sliding for the original member states who are, in theory, slated to
implement fully their AFTA commitments in 2003. This is not so with the BTA. If Viet
Nam is unable to meet its commitments on time, this will lead to friction. Viet Nam is
currently revising many of its domestic laws to meet its BTA commitments. Indeed, the
BTA covers some sectors, such as management services, that do not yet exist in Viet Nam!
There are risks involved in speeding up the process so quickly, when the institutions are not
yet ready, implementation capacity is weak, and the political system continues to receive
liberalization with ambivalence.
4. Final comments: issues in regional cooperation
From the above analysis, it is clear that United States remains a key economic partner to
developing Asia. Intra-regional integration will reduce at the margin Asia’s exposure to
external shocks across the Pacific, but economic growth in the region will continue to be a
function of the performance of real and financial markets in the United States. We used in
the paper several approaches to underscore the dynamic relationship and critical economic
links between the United States and Asia. However, it might be argued that the policy
relationship between the United States and Asia tends to be less dynamic, though it would
appear that the United States is placing a priority—albeit not its highest—on developing
closer relations with individual Asian countries, and possibly subregional groups. We
examined above in some detail the case of Viet Nam. In the rest of this section, we will
consider some additional issues in regionalism.
To begin, we might note that while Asia was characterized by very few concrete
regional integration agreements prior to the 1990s, it has seen a wave of new accords and
proposed agreements in the 2000s. A key protagonist behind this movement and its future
is Japan. Japan’s volte face regarding regionalism represents a sea-change in the country’s
international diplomacy and economic strategy. Previously it focused only on multilateral
initiatives (except when forced into sectoral accords by its trading partners, mainly the
United States but also Europe) and even insisted, for example, that the original (all-East-
Asian) Australian proposal to create what was to become APEC must include North
America. Malaysian Prime Minister Mahathir’s proposal to create an Asian-only East
Asian Economic Grouping was (politely) rejected by Japan. Recently, however, Japan has
demonstrated that it is, indeed, ready to play a leadership role, for example, in negotia-
tions/concluded agreements with Singapore, South Korea, and ASEAN in the area of
trade, and the Chiang Mai and related initiatives in the area of finance. The ‘‘ASEANþ3’’
(ASEAN, China, South Korea, Japan) approach to economic cooperation is picking up
steam.
Why this change in policy stance? There are a number of factors, including:
272 M.G. Plummer / Journal of Asian Economics 14 (2003) 243–281
1. The Asian Crisis underscored how closely connected Asia is, and that what happens in
one country affects powerfully another country. This ‘‘contagion externality’’ can be
endogenized through closer cooperation.
2. Asia was quite disappointed by the way the West handled the Asian Crisis. There is a
strong feeling in Asia that it needs to look after itself, while still maintaining its
traditional partnerships outside the region.
3. This change in perspective and attitude now allows for closer cooperation between
certain countries in the region in a way that was not possible prior to the Crisis. In
particular, it lowered resistance in China and South Korea to Japanese leadership. For
example, McGregor and Hijino (2002) note that the Chinese authorities have been
promoting links with Japan, even by criticizing ‘‘Japan Bashing’’ and projecting a
positive image of Japan through the media.
4. The aggressive regionalism programs in Asia’s major markets (the United States and
Europe) could lead to considerable trade and investment diversion in certain sectors.
Moreover, the trend has given the impression—true or false—that regionalism is beneficial
to economic development. Recent European integration—first in the form of the Single
Market Program and then monetary union—and NAFTA seem to be big successes.
Thus, for the first time the United States finds itself in the position of having to
‘‘compete’’ with Japan in terms of policy initiatives in the Pacific. Of course, the United
States did play a key role in promoting APEC and, at least under the Clinton Adminis-
tration, focused on APEC as its primary regional initiative after NAFTA. But while there
has been some progress in trade facilitation and in other areas under APEC, as well as
increased consultation on finance-related matters since the Asian Crisis, the ambitious
‘‘Bogor Vision’’ of open trade and investment by 2010 (2020 for developing countries)
appears to be on hold. Although every year countries table what appear to be impressive
Individual Action Plans (IAPs) towards the Bogor target, in reality these tend to be merely
commitments already made under other agreements, especially the Uruguay Round. APEC
‘‘value added’’ in trade liberalization is negligible, at least at this point.
Moreover, a number of other intra-Asian initiatives have been emerging of late. ASEAN,
for example, has launched a series of proposals to move forward on the financial-
cooperation front, for example, the financial part of the ASEAN Vision 2020, the Joint
Ministerial Statement of the Fourth ASEAN Finance Ministers Meeting, and the Ha Noi
Plan of Action. The bilateral swap arrangements negotiated between Japan and the ASEAN
countries may be small but are significant in their potential and as examples of intra-
regional financial cooperation. Proposals for an Asian Monetary Fund, monetary union,
etc. are far more comprehensive and are being actively considered. Moreover, the Asian
Development Bank has been instrumental in helping these countries launch a macro-
economic and financial monitoring mechanism (‘‘ASEAN Surveillance Unit’’) that should
provide consistent, up-to-date and compatible information to both governments and the
private sector, serving as a means to remove informational asymmetries and providing an
early-warning mechanism.
Thus, the United States is finding that if it does not move forward in cementing economic
policy relationships with Asia, it will de facto be moving backwards. It has a number of
options in this regard, and we discuss (briefly) several below.
M.G. Plummer / Journal of Asian Economics 14 (2003) 243–281 273
4.1. Promoting Doha
Arguments in favor of a multilateral—rather than regional/bilateral—approach are
many. In fact, while mainstream economists tend to be split on the virtues/defects of
regionalism, almost all agree that a multilateral approach would be preferable, at least in
terms of economic goals. Moreover, a successful Doha Round would render any emerging
preferential-trading arrangements in the region that exclude the United States potentially
less damaging. The problem is that it is not clear how far Doha will be able to go. In fact,
developments in 2002 (e.g. the new US Farm Bill, EU and Japanese resistance to reductions
in agricultural subsidies and support, US steel tariffs, backsliding on textiles, etc.) do not
bode particularly well for a successful, comprehensive agreement.
4.2. Higher priority on APEC
The United States is already part of what could be the largest regional free-trade
agreement in the world, or at least an agreement that frees trade (and investment). It is not
clear, in fact, what the Bogor Vision, or ‘‘open regionalism,’’ means. Technically, it has
been promoted as concerted liberalization, in which countries reduce together any barriers
to trade and investment in a non-discriminatory way. However, it is not clear if such a
agreement would require reciprocity on the part of other trading partners, for example, the
EU. A non-reciprocal agreement would be a non-starter in the US Congress, as well as in
parliaments of some other APEC member-states. A reciprocal agreement, in which the EU
would only be included only if it responded in kind by reducing its barriers to trade and
investment, would be difficult to reach, for the same reasons that the WTO has not
succeeded in creating global free trade. If APEC were to move forward to the exclusion of
(an expanded) EU and, no doubt, other countries/regions, its sheer size would pose a
tremendous challenge to the integrity of the WTO itself. This is not something that the
United States would like to do.
4.3. Other bilateral agreements
The United States could ‘‘compete’’ in terms of policy initiatives in the region through
additional bilateral agreements. It has already started this process. The BTA is one
example, but it is non-discriminatory in that it does not give preferential treatment to
partner states, at least in the medium run. Actual free-trade areas that it is negotiating or has
expressed interest in include most major countries in the region, though only the
Singapore–US agreement is at an advanced stage at this point.
4.4. Enterprise for ASEAN/ASEAN–US initiative
Finally, the United States might consider negotiating subregional agreements. The most
likely candidate would be ASEAN, as it is (along with the CER) the most advanced
subregional agreement in the Asia-Pacific. In 2002, the US government expressed an
interest in this possibility, under the rubric of the ‘‘Enterprise for ASEAN’’ framework.
Actually, this is not the first time. An ASEAN–US accord, possibly in the form of a free-
274 M.G. Plummer / Journal of Asian Economics 14 (2003) 243–281
trade agreement, was proposed in 1989, under the ‘‘ASEAN–US Initiative.’’20 This
agreement was put on the backburner, not so much due to the United States but rather
the cautious attitude that ASEAN member-states had relative to economic integration, be it
extra- or intra-regional. Since then, the ASEAN position has changed considerably, making
the possibility of such an agreement far more feasible, though the agreement would be
unlikely to include all ASEAN countries (in particular, Myanmar would be a hard sell).
Recognizing this, the US government has expressed its desire to use the Enterprise for
ASEAN initiative as a framework agreement, under which a series of bilateral accords
could be negotiated. This could be an important priority for the United States over the
2003–2005 period.
Acknowledgements
The author would like to acknowledge the insightful comments of Professors Steve
Reynolds and Seiji Naya, as well as the excellent research assistance of Theresa Beltramo
and Daniele Giacomini.
20 See Naya, Plummer, Sandhu, and Akrasanee (1989).
M.G. Plummer / Journal of Asian Economics 14 (2003) 243–281 275
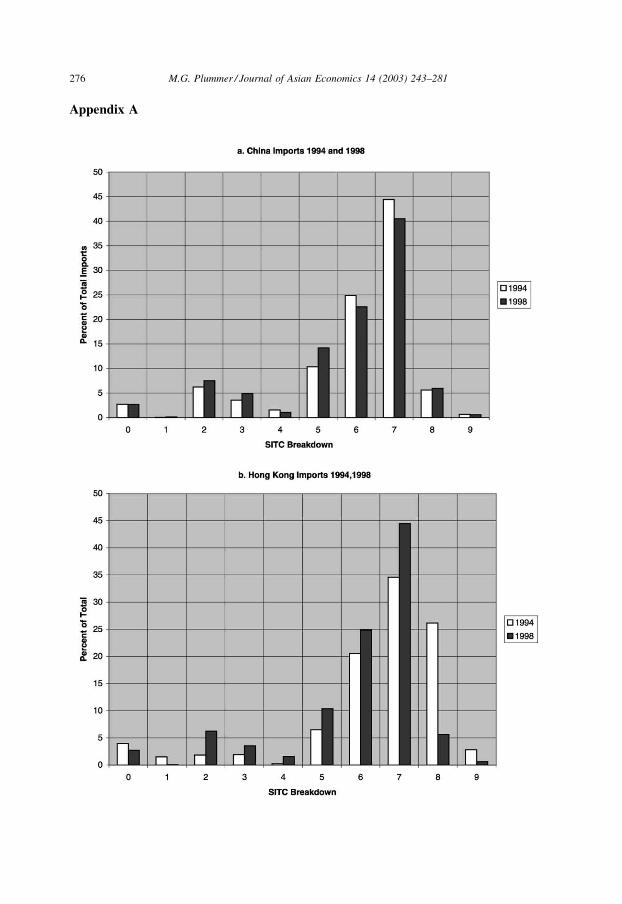
Appendix A
276 M.G. Plummer / Journal of Asian Economics 14 (2003) 243–281
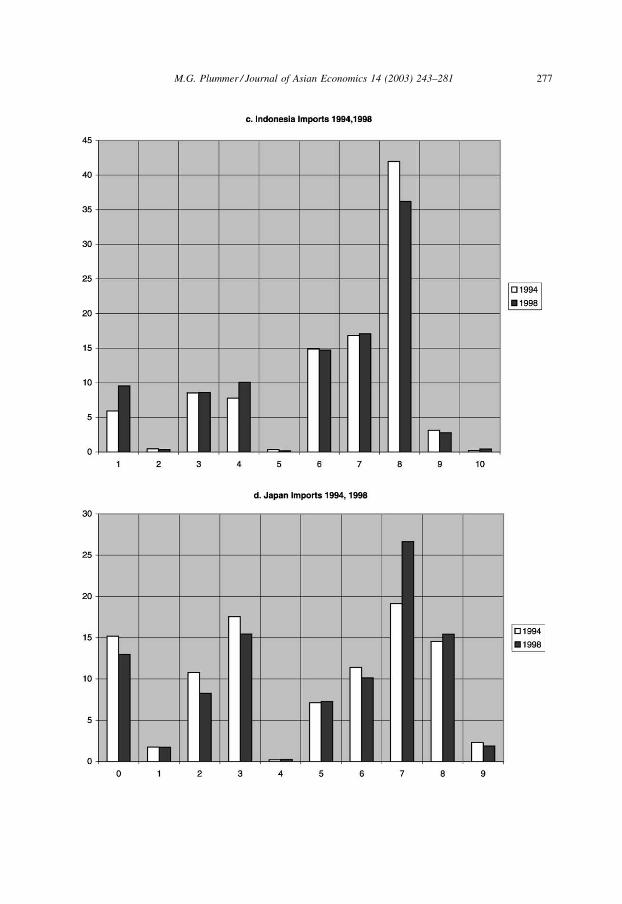
M.G. Plummer / Journal of Asian Economics 14 (2003) 243–281 277
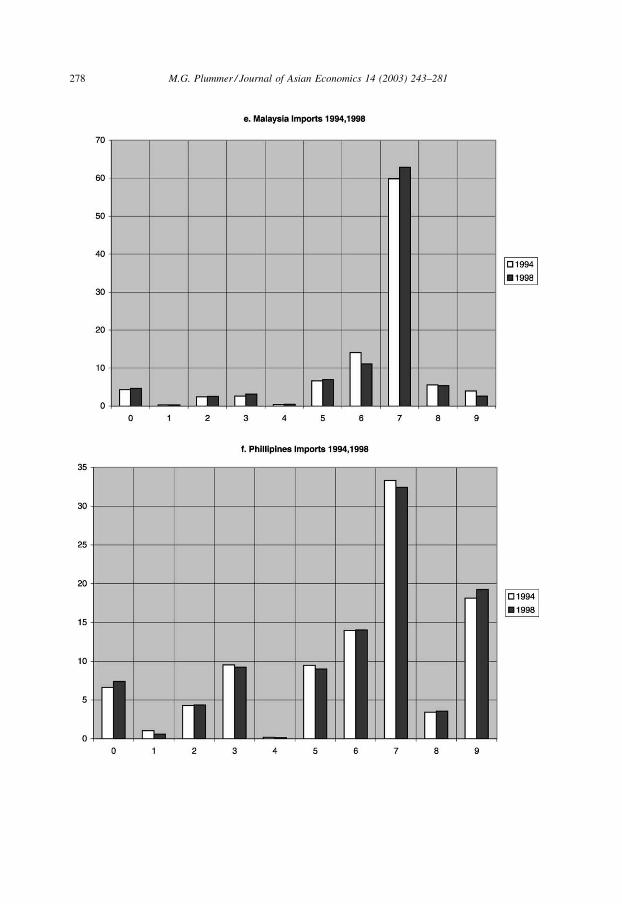
278 M.G. Plummer / Journal of Asian Economics 14 (2003) 243–281
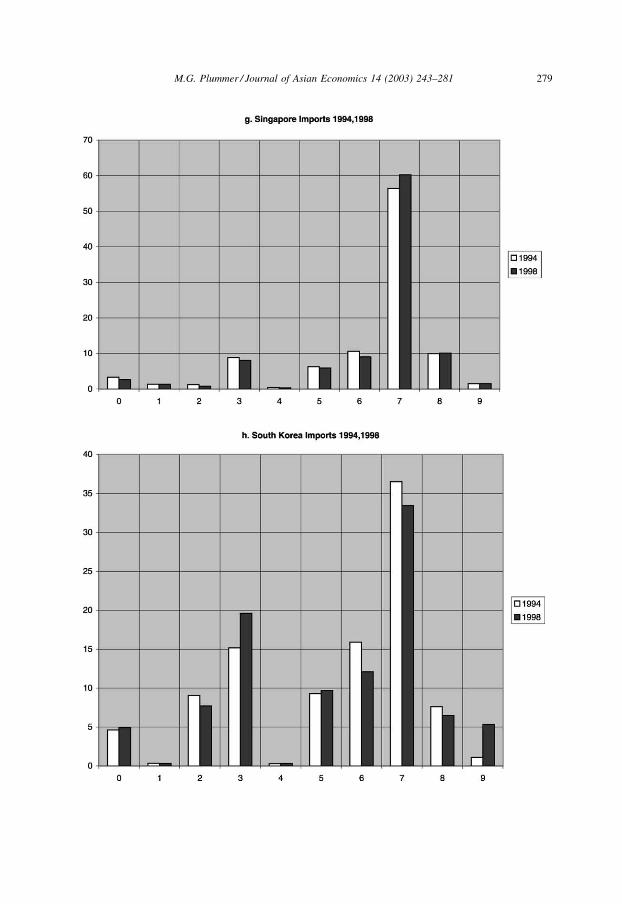
M.G. Plummer / Journal of Asian Economics 14 (2003) 243–281 279
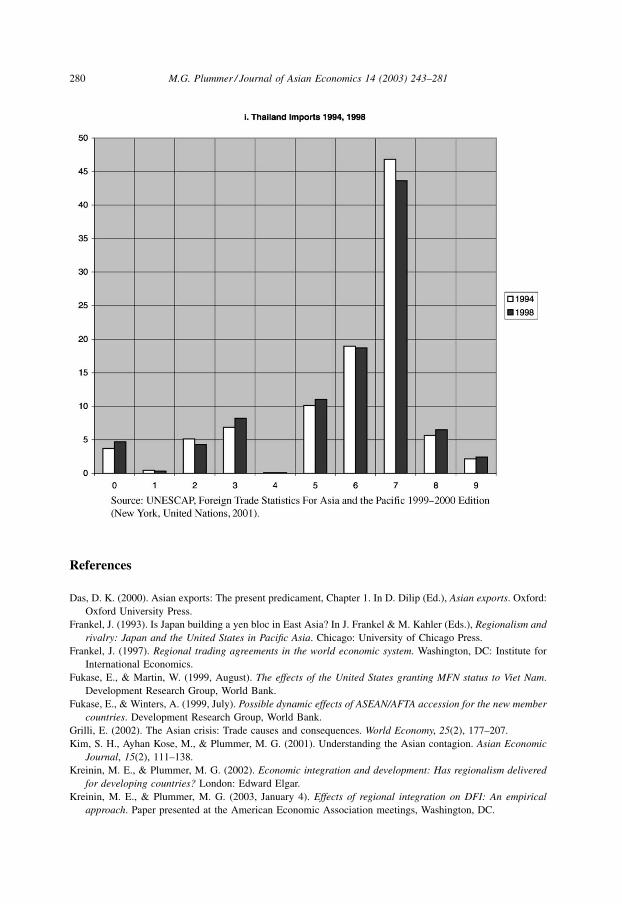
References
Das, D. K. (2000). Asian exports: The present predicament, Chapter 1. In D. Dilip (Ed.), Asian exports. Oxford:
Oxford University Press.
Frankel, J. (1993). Is Japan building a yen bloc in East Asia? In J. Frankel & M. Kahler (Eds.), Regionalism and
rivalry: Japan and the United States in Pacific Asia. Chicago: University of Chicago Press.
Frankel, J. (1997). Regional trading agreements in the world economic system. Washington, DC: Institute for
International Economics.
Fukase, E., & Martin, W. (1999, August). The effects of the United States granting MFN status to Viet Nam.
Development Research Group, World Bank.
Fukase, E., & Winters, A. (1999, July). Possible dynamic effects of ASEAN/AFTA accession for the new member
countries. Development Research Group, World Bank.
Grilli, E. (2002). The Asian crisis: Trade causes and consequences. World Economy, 25(2), 177–207.
Kim, S. H., Ayhan Kose, M., & Plummer, M. G. (2001). Understanding the Asian contagion. Asian Economic
Journal, 15(2), 111–138.
Kreinin, M. E., & Plummer, M. G. (2002). Economic integration and development: Has regionalism delivered
for developing countries? London: Edward Elgar.
Kreinin, M. E., & Plummer, M. G. (2003, January 4). Effects of regional integration on DFI: An empirical
approach. Paper presented at the American Economic Association meetings, Washington, DC.
280 M.G. Plummer / Journal of Asian Economics 14 (2003) 243–281
Kreinin, M. E., Plummer, M. G., & Abe, S. (Eds.). (1999). Asia-Pacific economic linkages. London: Elsevier.
Lee, H., & Roland-Holst, D. (Eds.). (1999). Economic development and cooperation in the Pacific Basin: Trade,
investment, and environmental issues. Cambridge: Cambridge University Press.
McGregor, R., & Hijino, K. (2002, December 19). Trade growth softens China’s view of Japan. Financial Times.
Montes, M. (1998). Southeast Asian currency crisis. Singapore: ISEAS.
Naya, S., Plummer, M. G., Sandhu, K., & Akrasanee, N. (1989). ASEAN–US initiative: Assessment and
recommendations for improved economic relations. Singapore: ISEAS.
Parker, S., & Lee, S. (2001). Did East-Asian developing countries lose export competitiveness in the pre-crisis
1990s? Asian Development Bank Institute, mimeo.
Petri, P. (1993). East Asian trade integration: An analytical history. In J. Frankel & M. Kahler (Eds.),
Regionalism and rivalry: Japan and the United States in Pacific Asia. Chicago: University of Chicago Press.
Plummer, M. G. (2002, December). EU and ASEAN: Real integration and lessons in financial cooperation.
World Economy, 25(10).
Scollay, R., & Gilbert, J. P. (2002). New regional trading arrangements in the Asia-Pacific? Washington, DC:
Institute for International Economics.
Tamamura, C. (2002). Structural changes in international industrial linkages and export competitiveness in the
Asia-Pacific region. ASEAN Economic Bulletin, 19(1), 52–82.
UNDP. (2001). Globalization and international economic integration. UNDP, Hanoi.
United Nations Economic and Social Commission for Asia and the Pacific (UNESCAP, 2001). Foreign trade
statistics for Asia and the Pacific 1999–2000 Edition. New York: United Nations.
World Bank. (1993). East Asian miracle: Economic growth and public policy. Oxford: Oxford University Press.
M.G. Plummer / Journal of Asian Economics 14 (2003) 243–281 281