Embed Size (px)
Citation preview

Structural Behaviour of Post-Tensioned Glass Beams Dissertação apresentada para a obtenção do grau de Mestre em Engenharia Civil na
Especialidade de Mecânica Estrutural,
Autor
João Pedro Fernandes Olim Neves Orientadores
Prof. Dr. Sandra Filomena da Silva Jordão Alves
Dr. Eng. Christian Louter
Esta dissertação é da exclusividade responsabilidade do
seu autor, não tendo sofrido correções após a defesa em
provas públicas. O Departamento de Engenharia Civil da
FCTUC declina qualquer responsabilidade pelo uso da
informação apresentada.
Coimbra, Setembro, 2014

Structural Behaviour of Post-Tensioned Glass Beams Dissertation submitted for the degree of Master of Civil Engineering Specialization in
Structural Mechanics,
Author
João Pedro Fernandes Olim Neves Supervisors
Prof. Dr. Sandra Filomena da Silva Jordão Alves
Dr. Eng. Christian Louter
This dissertation is the sole responsibility of its author, not
having suffered corrections after the public thesis
presentation. The Department of Civil Engineering
FCTUC accepts no responsibility for the use of the
presented information.
Coimbra, September, 2014

Structural Behaviour of Post-Tensioned Glass Beams Acknowledgements
João Pedro Fernandes Olim Neves i
Acknowledgements
I’d like to acknowledge all professors from the Department of Civil Engineering at the
University of Coimbra for teaching me to excel in this field, but in particular a special
acknowledgement to Prof. Sandra Jordão for accepting being my tutor and for providing me
one of the most important journeys of my whole life. A special acknowledgement to my friend
and colleague Marco Pinho for helping in my most desperate moments during the numerical
analysis.
Prof. Dr. Jean Paul Lebet is highly acknowledged for hosting me at the great polytechnic school
EPFL is. This journey made me a different and more aware engineer. I’d like to acknowledge
Dr. Ing. Christian Louter for being my tutor abroad and Jagoda Cupać for helping me when
needed and for providing the experimental data.
Last but not least I’d like to acknowledge my parents for their effort into making this journey
possible to me, and a special acknowledgement to my girlfriend Natacha for waiting for me
while far, with her unconditional love.

Structural Behaviour of Post-Tensioned Glass Beams Abstract
João Pedro Fernandes Olim Neves ii
Abstract
The demand for transparency in the last decade has been increasing in the construction industry.
The need that man has to feel the natural light and to have the perfect landscape in buildings
has been challenging engineers. So far Glass is the only construction material that can provide
such properties.
The brittleness of the material and its low strength are the main disadvantages of glass as a
structural component when compared to the standard construction materials. Technological
advances were made by scientists and engineers to avoid or postpone these disadvantages, and
that is why glass is nowadays widely used throughout the whole world. Lately these
technological advances have become so powerful that today is now possible to have buildings
in which the structural components, such as beams or columns, are made of glass.
Despite its use, glass is still not fully characterized and researched and that’s the main goal of
this thesis. Studying the structural behaviour of post-tensioned glass beams is one step forward
to fully know the material and thus, to develop the European Standard Code of Glass.
To do this, a Finite Element Analysis was performed and then calibrated with the experimental
results from the ongoing Dissertation of the PhD Candidate Jagoda Cupać from EPFL.
Afterwards some key parameters were studied in order to bear the maximum load.
From the results it’s shown that this type of beam is a feasible concept and that the numerical
analysis is extremely sensitive to some input parameters. Furthermore, it can also be concluded
that the reinforcement used on the bottom of the beam has a great influence on the maximum
load the beam can bear and the thickness of the adhesive has a great influence on the initial
failure.

Structural Behaviour of Post-Tensioned Glass Beams Resumo
João Pedro Fernandes Olim Neves iii
Resumo
A procura por transparência na última década te vindo a aumentar na indústria da construção.
A necessidade que o homem tem de sentir a luz natural e de obter a paisagem perfeita em
edifícios tem vindo a desafiar os engenheiros. Até hoje o vidro é o único material que pode
ministrar tais propriedades.
A fragilidade do material e a sua baixa resistência são as principais desvantagens do vidro como
componente estrutural quando comparados com os materiais comumente utilizados. Avanços
tecnológicos foram feitos por cientistas e engenheiros de modo a evitar ou retardar estas
desvantagens, e é graças a esses avanços que o vidro é nos dias de hoje amplamente utilizado
pelo globo. Ultimamente esses avanços têm sido tão poderosos que já é possível a existência
de edifícios em que até os componentes estruturais, tais como os pilares e as vigas, são feitas
de vidro.
Embora já seja utilizado, o vidro não está ainda totalmente caracterizado e investigado e é esse
o principal objetivo desta tese. Estudar o comportamento estrutural de vigas de vidro pós-
tensionadas é um novo passo nesta caminhada para conhecer por completo o material e assim
desenvolver o Eurocódigo de Vidro.
Para efetuar este estudo, uma análise de elementos finitos foi realizada e então calibrada com
resultados experimentais da Dissertação da candidata a doutora Jagoda Cupać da EPFL. Depois
alguns parâmetros chave foram estudados para que estas vigas possam suportar o máximo de
carga.
A partir dos resultados chegou-se à conclusão que este tipo de viga é um conceito viável e que
a análise numérica é extremamente sensível a alguns parâmetros de input. Além disso, pode-se
concluir que o reforço utilizado no fundo da viga tem uma grande influência na carga máxima
que a viga pode suportar e que a espessura do adesivo tem uma grande influência na falha
inicial.

Structural Behaviour of Post-Tensioned Glass Beams Table of Contents
João Pedro Fernandes Olim Neves iv
Table of Contents
Acknowledgements .................................................................................................................... i Abstract ..................................................................................................................................... ii
Resumo .....................................................................................................................................iii Table of Contents ..................................................................................................................... iv List of Figures .......................................................................................................................... vi List of Tables ..........................................................................................................................viii
Symbols ..................................................................................................................................... ix 1 Introduction ...................................................................................................................... 1 1.1 Main Goal of this Thesis .............................................................................................................................. 2 1.2 Structure of the Thesis ................................................................................................................................. 2
2 Overview ............................................................................................................................ 3 2.1 Historical evolution of glass......................................................................................................................... 3 2.2 Recent technological highlights leading to structural glass ...................................................................... 4
2.2.1 Float Glass ............................................................................................................................................ 4
2.2.2 Laminated Glass ................................................................................................................................... 5 2.2.3 Heat Strengthened Glass....................................................................................................................... 6
2.3 The strength of glass .................................................................................................................................... 7
2.4 Material properties of glass ......................................................................................................................... 8 2.4.1 Chemical properties .............................................................................................................................. 9 2.4.2 Optical Properties ................................................................................................................................. 9 2.4.3 Physical properties ............................................................................................................................. 10
3 State of art on glass beam systems ................................................................................ 12 3.1 Structural behaviour .................................................................................................................................. 12
3.1.1 Reinforced Glass Beams..................................................................................................................... 12 3.1.2 Post-tensioned Glass Beams ............................................................................................................... 12
3.1.3 Tempered Glass Beams vs Laminated Glass Beams .......................................................................... 13
3.2 Overview of similar post-tensioned beams ............................................................................................... 14
4 Experimental Analysis ................................................................................................... 19 4.1 Introduction ................................................................................................................................................ 19 4.2 Layout and instrumentation...................................................................................................................... 20
4.3 Materials ..................................................................................................................................................... 21 4.3.1 Glass ................................................................................................................................................... 21
4.3.2 Stainless Steel ..................................................................................................................................... 21 4.3.3 Adhesive ............................................................................................................................................. 22 4.3.4 Interlayer material .............................................................................................................................. 23
4.4 Loading ....................................................................................................................................................... 24 4.5 Structural Model ........................................................................................................................................ 24
4.6 Results ......................................................................................................................................................... 25
5 Numerical Analysis ......................................................................................................... 27 5.1 Structural model ........................................................................................................................................ 27

Structural Behaviour of Post-Tensioned Glass Beams Table of Contents
João Pedro Fernandes Olim Neves v
5.2 Element type ............................................................................................................................................... 27 5.3 Explicit Analysis ......................................................................................................................................... 28 5.4 Quasi-Static Simulation ............................................................................................................................. 30 5.5 Reducing the computational cost .............................................................................................................. 31
5.5.1 Speeding up the simulation ................................................................................................................ 31 5.5.2 Using Mass Scaling ............................................................................................................................ 31
5.6 Influence of the interlayer in the numerical analysis .............................................................................. 34 5.7 Mesh ............................................................................................................................................................ 34 5.8 Equivalent Cross Section ........................................................................................................................... 36 5.9 Pre-Stress .................................................................................................................................................... 37
5.10 Loading Step .......................................................................................................................................... 40 5.11 Materials’ Properties ............................................................................................................................ 40
5.11.1 Adhesive Properties ....................................................................................................................... 40
5.11.2 Steel Properties .............................................................................................................................. 41 5.11.3 Glass Properties ............................................................................................................................. 42
5.11.3.1 Mode I fracture Energy .................................................................................................................. 42 5.11.3.2 Brittle Shear ................................................................................................................................... 45
5.11.3.3 Brittle Failure ................................................................................................................................. 50
6 Parametric Study ............................................................................................................ 51 6.1 Thickness of the Adhesive ......................................................................................................................... 51 6.2 Characterization of the Steel ..................................................................................................................... 52
7 Conclusions ...................................................................................................................... 54 7.1 Suggestions for future research ................................................................................................................ 54
8 Bibliographic References ............................................................................................... 55

Structural Behaviour of Post-Tensioned Glass Beams List of Figures
João Pedro Fernandes Olim Neves vi
List of Figures
FIGURE 2.1 – FLOAT PROCESS (HALDIMANN ET AL., 2008) ..................................................................................... 4
FIGURE 2.2 – LAMINATED GLASS PROCESS ............................................................................................................. 5
FIGURE 2.3 – STRUCTURAL PERFORMANCE VS REMAINING STRUCTURAL CAPACITY IN LAMINATED GLASS
(HALDIMANN ET AL., 2008) ............................................................................................................................ 5
FIGURE 2.4 – INTERNAL FORCES IN ANNEALED [LEFT] AND TEMPERED [RIGHT] GLASS (HALDIMANN ET AL.,
2008) .............................................................................................................................................................. 6
FIGURE 2.5 – FRACTURE PATTERNS OF ANNEALED [LEFT], TEMPERED [MIDDLE] AND FULLY TEMPERED [RIGHT]
GLASS (HALDIMANN ET AL., 2008) ................................................................................................................. 7
FIGURE 2.6 – COMPRESSIVE STRESSES ARE USUALLY ACCOMPANIED BY TENSILE STRESSES ................................. 8
FIGURE 2.7 – A) CHEMICAL COMPOSITION OF SLSG AND BSG; B) NETWORK OF SLSG (HALDIMANN ET AL., 2008)
....................................................................................................................................................................... 9
FIGURE 2.8 – TRANSMITTANCE AS A FUNCTION OF WAVELENGTH (HALDIMANN ET AL., 2008) ......................... 10
FIGURE 3.1 – REINFORCED GLASS BEAM CROSS SECTION AND ITS DUCTILITY (LOUTER, 2011) ........................... 12
FIGURE 3.2 – TRACTION CAPACITY VS COMPRESSION CAPACITY (ADAPTED FROM DIAZ ET AL., 2011) ............... 13
FIGURE 3.3 – INTERNAL FORCES OF THE CROSS SECTION BEFORE LOADING ....................................................... 13
FIGURE 3.4 – REMAINING LOAD CARRYING CAPACITY AFTER FIRST CRACK BETWEEN ANNEALED AND TEMPERED
GLASS (LOUTER, 2011) ................................................................................................................................. 14
FIGURE 3.5 – T-SECTION BEAM LAYOUT [LEFT] AND CROSS SECTION [RIGHT] (LOUTER, 2008) ........................... 14
FIGURE 3.6 – HYBRID PRE-STRESSED STEEL-GLASS BEAM (FROLI & LANI, 2010) .................................................. 15
FIGURE 3.7 – LAMINATED GLASS BEAM REINFORCED WITH PRE-STRESSED CABLES (JORDÃO ET AL., 2014) ...... 15
FIGURE 3.8 – 4 TYPES STUDIED IN (WELLER & ENGELMANN, 2014) ..................................................................... 16
FIGURE 3.9 – LAYOUT OF THE TYPE B AND TYPE D BEAMS (WELLER & ENGELMANN, 2014) ............................... 16
FIGURE 3.10 – OUT OF PLANE DISPLACEMENT (WELLER & ENGELMANN, 2014) ................................................. 16
FIGURE 3.11 – POST-TENSIONED BEAMS TESTED IN (LOUTER, 2013) ................................................................... 17
FIGURE 3.12 – STRUCTURAL BEHAVIOUR OF TWO GLASS BEAMS. (LOUTER, 2013) ............................................. 17
FIGURE 3.13 – FORCE VS DISPLACEMENT PLOT (FROLI & MAMONE, 2014) ......................................................... 18
FIGURE 4.1 – STRUCTURAL MODEL OF THE BEAM ................................................................................................ 20
FIGURE 4.2 – CROSS-SECTION DETAILS ................................................................................................................. 20
FIGURE 4.3 – NOMINAL CURVE FOR AISI 304 ........................................................................................................ 22
FIGURE 4.4 – STRUCTURAL BEHAVIOR OF THE ADHESIVE ACCORDING TO (NHAMOINESU AND OVEREND, 2012)
..................................................................................................................................................................... 22
FIGURE 4.5 - PROPERTIES OF SGP DEPENDING ON TIME OF LOAD AND TEMPERATURE (STELZER, 2010) ........... 23
FIGURE 4.6 - UNLOADED BEAM (LEFT), LOADED BEAM (RIGHT) ........................................................................... 24
FIGURE 4.7 - STRESS DISTRIBUTION AFTER THE CRACKING .................................................................................. 24
FIGURE 4.8 – INTERNAL FORCES DUE TO THE PRE-STRESS STEP ........................................................................... 25
FIGURE 4.9 – INTERNAL FORCES DUE TO THE LOADING STEP............................................................................... 25

Structural Behaviour of Post-Tensioned Glass Beams List of Figures
João Pedro Fernandes Olim Neves vii
FIGURE 4.10 - PROVIDED DATA FROM EXPERIMENTS IN REINFORCED GLASS BEAMS (LEFT) AND POST-
TENSIONED GLASS BEAMS (RIGHT) .............................................................................................................. 26
FIGURE 4.11 – DIFFERENCE BETWEEN THE REINFORCED BEAM BEHAVIOR AND THE POST-TENSIONED BEAM
BEHAVIOR .................................................................................................................................................... 26
FIGURE 5.1 - REPRESENTATION OF THE BOUNDARY CONDITIONS ....................................................................... 27
FIGURE 5.2 - PURPOSES OF BOTH ANALYSIS (MASHAYEKHI, 2013) ...................................................................... 29
FIGURE 5.3 - AMPLITUDE IMPOSED ...................................................................................................................... 30
FIGURE 5.4- REACTION FORCE IN FUNCTION OF TIME WHEN STEP TIME WAS 1 COMPUTATIONAL SECOND ..... 32
FIGURE 5.5 - REACTION FORCE IN FUNCTION OF TIME WHEN STEP TIME WAS 50 COMPUTATIONAL SECONDS 33
FIGURE 5.6 – THE INFLUENCE OF THE SGP IN FORCE-DISPLACEMENT CURVES (LOUTER ET NIELSEN, 2013)....... 34
FIGURE 5.7 – MESH PATTERN USED IN BEDON AND LOUTER, 2014 ..................................................................... 35
FIGURE 5.8 – MESH PATTERN USED WITHIN THIS STUDY ..................................................................................... 35
FIGURE 5.9 – ZOOMED PICTURE OF THE MESH USED WITHIN THE STUDY AT THE BOTTOM EDGE OF THE BEAM
..................................................................................................................................................................... 35
FIGURE 5.10 – DIFFERENCES BETWEEN THE REAL [O] AND THE NUMERICAL CROSS SECTIONS [A, B AND C] ..... 36
FIGURE 5.11 – FORCE-DISPLACEMENT CURVES FROM EXPERIMENT [O] AND NUMERICAL ANALYSIS [A, B AND C]
..................................................................................................................................................................... 37
FIGURE 5.12 – FORCE ANALOGY REGARDING THE PRE-STRESS ............................................................................ 38
FIGURE 5.13 – STRESS ON THE STEEL ALONG ITS AXIS AND ITS AXIAL FORCE DUE TO THE FORCE ANALOGY ..... 38
FIGURE 5.14 – STRESS ON THE STEEL ALONG ITS AXIS AND ITS AXIAL FORCE DUE TO THE VARIATION OF
TEMPERATURE ............................................................................................................................................. 39
FIGURE 5.15 – CONNECTION BETWEEN THE BEND RADIUS AND THE HALF SPAN DISPLACEMENT...................... 40
FIGURE 5.16 - ADHESIVE BEHAVIOUR STUDY ........................................................................................................ 41
FIGURE 5.17 – COMPARISON BETWEEN THE EXPERIMENTAL RESULTS AND THE FEM RESULTS WITH THE STEEL
CHARACTERIZATION ACCORDING TO LOUTER, 2011 ................................................................................... 42
FIGURE 5.18 - MODE I FRACTURE ENERGY (AREA) ................................................................................................ 43
FIGURE 5.19 - DIFFERENT FRACTURE MODES (TWISP, 2008) ................................................................................ 43
FIGURE 5.20 – MODE I FRACTURE ENERGY IN GLASS ............................................................................................ 44
FIGURE 5.21 – EFFECTS OF FRACTURE ENERGY OF GLASS. COMPARISON OF LOAD-DISPLACEMENT PLOTS [LEFT];
COMPARISON OF CRACK PATTERNS [RIGHT] (BEDON AND LOUTER, 2014) ................................................ 45
FIGURE 5.22 - SHEAR RETENTION FACTOR VARIES WITH CRACK STRAIN OPENING (ECK) ............................... 46
FIGURE 5.23 – SHEAR RETENTION FACTOR PARAMETER STUDY .......................................................................... 47
FIGURE 5.24 - SHEAR RETENTION FACTOR STUDY ................................................................................................ 48
FIGURE 5.25 - INFLUENCE OF THE EMAXCK ......................................................................................................... 48
FIGURE 5.26 - COMPARISON BETWEEN EMAXCK=0.1, EMAXCK=0.01 AND EMAXCK=0.05 .............................. 49
FIGURE 5.27 - DIFFERENCE BETWEEN EMAXCK=0.05 AND EMAXCK=0.04 ......................................................... 49
FIGURE 6.1 – RESULTS OF THE PARAMETER STUDY REGARDING THE THICKNESS OF THE ADHESIVE .................. 52
FIGURE 6.2 - RESULTS OF THE PARAMETER STUDY REGARDING THE CHARACTERIZATION OF THE STEEL ........... 53

Structural Behaviour of Post-Tensioned Glass Beams List of Figures
João Pedro Fernandes Olim Neves viii
List of Tables
TABLE 2.1 – PROPERTIES OF DIFFERENT MATERIALS (ADAPTED FROM WURM, 2007) ........................................ 11
TABLE 2.2 – MECHANICAL PROPERTIES OF SLSG AND BSG (ADAPTED FROM HALDIMANN ET AL., 2008) ........... 11
TABLE 4.1 – EXPERIMENTAL STUDY ....................................................................................................................... 19
TABLE 4.2 – NOMINAL VALUES FOR AISI 304 (ADAPTED FROM LOUTER, 2011) ................................................... 22
TABLE 5.1 – ANALYSIS TYPE AND MESH STUDY ..................................................................................................... 28
TABLE 5.2 - ANALYTICAL VS NUMERICAL APPROACH REGARDING THE PRE-STRESS ............................................ 40
TABLE 5.3 – FRACTURE ENERGY STUDY DONE IN (BEDON AND LOUTER, 2014) ................................................... 44
TABLE 5.4 – SHEAR RETENTION FACTOR PARAMETER VARIATION ....................................................................... 47
TABLE 6.1 – THICKNESSES OF THE ADHESIVE STUDIED ......................................................................................... 51
TABLE 6.2 – INITIAL FAILURE AND MAXIMUM LOAD OF THE THICKNESS OF THE ADHESIVE STUDY .................... 52
TABLE 6.3 – STEEL STUDY ...................................................................................................................................... 53
TABLE 6.4 - INITIAL FAILURE AND MAXIMUM LOAD OF THE STEEL CHARACTERIZATION STUDY ......................... 53

Structural Behaviour of Post-Tensioned Glass Beams Symbols
João Pedro Fernandes Olim Neves ix
Symbols
Latin letters:
a acceleration
A Cross-sectional area of the whole beam
Ai Cross-sectional area of the considered element
As Cross-Sectional Area of the steel
Iyy Moment of Inertia in its strong axis
𝑒𝑚𝑎𝑥𝑐𝑘 Maximum crack strain
𝑒𝑛𝑛𝑐𝑘 Crack strain
Eg Young’s Modulus of Glass
Ei Young’s Modulus of the considered component in the section
Es Young’s Modulus of Steel
EIcomposite Bending Stiffness of the composite section
Cd Dilatational wave speed
ft Ultimate Tensile Strength
fy0,2% Yield Strength 0.2% Proof
F Force
g.c. Geometrical Centre
G Shear Modulus
Gf Mode I fracture Energy
i considered component in the section
Iyy Moment of Inertia in its strong axis
Iyy,i Moment of Inertia of the considered component in its strong axis
L Length of the beam
Lmin smallest element dimension in the mesh
m mass
MLoad Moment due the loading in the moment of the 1st crack
MPS Equivalent Moment due the pre-stress
n Total number of components in the section
N Pre-Stress
r0 Equilibrium spacing of the atom
uck Critical Displacement
v Distance from the geometrical centre of the beam to the top of the glass
zi distance between the axis of the considered component and the neutral axis

Structural Behaviour of Post-Tensioned Glass Beams Symbols
João Pedro Fernandes Olim Neves x
Greek Letters:
Coefficient of thermal expansion
Fracture Surface Energy
T Variation of Temperature
Extension
Lamé's first parameter
Poisson's Ration
Shear Retention Factor
r Bending radius
Stress
c,glass Failure Stress of Glass
m Theoretical failure stress
Lamé's second parameter (also called Shear Modulus

Structural Behaviour of Post-Tensioned Glass Beams 1 - Introduction
João Pedro Fernandes Olim Neves 1
1 Introduction
Glass by itself is an extraordinary product because it allows the entrance of light and an
unobstructed view of any landscape. Many buildings still lack the possibility to have natural
light instead of artificial light due to the lack of glass in its façades.
Glass demanding has been increasing. The use of glass in buildings it’s getting more and more
often and the dimensions of these components have been increasing due to the successive
technological advances. Such technological advances has made glass as affordable as it never
was.
There has been so many technological advances in the last decade that glass is now becoming
a structural material, i.e., instead of the standard materials such as steel or concrete, there are
now buildings in which the columns and/or the beams are made of glass.
In order to get the needed confidence of the projects designers and the developers this material
and its behaviour needs to be well known and characterized. That’s the role of this research.
The present thesis aims to contribute to the whole knowledge of the product and the structural
behaviour of post tensioned glass beams.
The structural model of post tensioned glass beams when compared with normal glass beams
is advantageous as it is has a higher load bear capacity and it slows the propagation of the cracks
in the material due to the steel in the tensile zone.
The work in the present theses has been done with the following methodology:
1. Experiments
2. Finite Element Analysis
3. Calibration
4. Parametrical Study
It should be noticed that the research for this thesis was performed at EPFL (Switzerland). There
experimental data was provided so it can be used to calibrate with the numerical modelling.
This data was obtained to be also used in the Dissertation of the PhD Candidate Jagoda Cupać
from EPFL.

Structural Behaviour of Post-Tensioned Glass Beams 1 - Introduction
João Pedro Fernandes Olim Neves 2
1.1 Main Goal of this Thesis
The purpose of the present thesis is to contribute to the characterization of the behaviour of
post-tensioned glass beams. The approach chosen for such aim encompasses the preparation of
a numerical element model of the beam, duly calibrated with the experimental results given by
(Cupać, 2014). The calibrated numerical model was then used to perform a parametrical
analysis on the main/key parameters conditioning the structural behaviour of the beam system.
The main outcome is a toll (FEM of the beam) that is ready to validate any new design
formulations for this structural system, or to allow broader parametric analysis, bringing in a
clearer view on the structural behaviour. This is in fact a valid input/iteration for the
characterization of post-tensioned glass beams.
1.2 Structure of the Thesis
In the second chapter there’s an overview of the study done in glass and the technologies
involved. This study regards a historical evolution of glass and some ways to enhance the
strength or the safety of glass, the mechanical and chemical properties of glass and its strength.
Chapter 3 concerns the state of the art on glass beam systems such as their structural behaviour,
and a brief overview of some similar post-tensioned glass beams, in which the cross-section
and the main conclusions of the research are included.
In Chapter 4 information regarding the experimental analysis can be found. There is also the
properties of the materials used in the beam, the structural model and its internal forces and a
summary of the results.
In Chapter 5 the structural model of the numerical analysis may be found, as well as the
elements type used for each material, the cross section used, an explanation why a certain type
of analysis was used, the parameters input in the software and how their values were obtained,
the mesh used in the FEA, the method used to simulate accurately the experiments done, how
the computational cost was reduced and its consequences and the method used the simulate the
pretension of the beam.
In Chapter 6 a parametrical study may be found as well as some commentaries regarding this
study and the results obtained, and in Chapter 7 there’s an overall conclusion about the
numerical analysis and the parametrical study. Some suggestions for future study is also present
in this chapter.

Structural Behaviour of Post-Tensioned Glass Beams 2 - Overview
João Pedro Fernandes Olim Neves 3
2 Overview
2.1 Historical evolution of glass
Glass began being manufactured nearly 3500 years ago, yet slowly due to the limited techniques
available. It was the Egyptians and Mesopotamians the pioneers of glass manufacturing with
glass beads and vessels. About the next millennium glass manufacturing became widely
practiced, with improvements in its manufacturing such as new ingredients to improve its
strength or produce clearer glass. Such techniques was yet difficult and expensive so almost
only royalty or religious services used glass. Near 300 B.C. the first revolution of glass appeared
due the discovery of the Syrians’ new blow pipe. Due to the ease of the process the price of
glass dropped and such discovery made the glass affordable to the average citizen. (Kennedy,
1997)
In the first century A.D. the romans revolutionized glass making by a using a variety of manufacturing
processes. Their geography couldn’t be better; their market were everywhere because of the great
Roman Empire. They were the first to apply a silver amalgam to flat glass to manufacture mirrors.
Thanks to these Romans, glass industry spread throughout Europe but, as the Roman Empire falls, so
do the fine art of glass making and the glass became again a product for the wealthy, and flat glass was
now used to medieval churches. In 650 A.D. Syrian glassmakers developed a new manufacturing
method for producing “crown glass”. This glass was used in windows and they were made by the blown
glass through a “crown”. Then it was flattened by reheating and as it was spinning it creates a “bulls
eye” thanks to centrifugal force. (Carter and Norton, 2007) This type of glass was used in windows
until the late 19th century. (Kennedy, 1997)
In the late 13th century Venetians entered the glass industry. Until then they had been importing
Byzantine glassware. The Industry by that time was already challenging and they had to move all
Venetian glasshouses to the Island of Murano in order to protect “trade secrets”. They also created a
way to perfect the plate glass by casting colourless glass on an iron table and polishing the glass until
no distortions remained. It was so profitable to these venetians that the city fathers instituted death
penalty for anyone who revealed the secret behind the manufacturing process. Eventually the Venetian
glassmaking expertise spread throughout Europe and France improved upon Italian processes only by
using larger tables and creating annealing ovens that gave French glassmakers a way to cool glass sheets
over the course of several days. (Kennedy, 1997)

Structural Behaviour of Post-Tensioned Glass Beams 2 - Overview
João Pedro Fernandes Olim Neves 4
Glass makers, in the 1900s, discovered a way to improve glass strength by as much as 400%
by tempering it. Such improve was important for automotive industries. Due to the housing and
automobile boom after the World War I the flat glass industry grown exponentially. The mainly
used glass was still flat, despite its high price. So the glassmakers tried to achieve a new kind
of cheaper glass. Alastair Pilkington succeeded in this manner by developing the modern float
glass process between 1953 and 1957 that eliminates the distinction between flat and polished
plate glass. Companies that were capable to produce glass with this new improved process were
increasing their capacity, lowering the price of glass, though smaller firms that could not use
such innovative process had leading difficulties. (Kennedy, 1997)
2.2 Recent technological highlights leading to structural glass
This chapter concerns technological aspects and improvements of glass. It’s important to
mention that is due to such improvements that one is now able to create an entire building made
of glass.
2.2.1 Float Glass
The main production process for flat glass in the current days is the float process. Such
continuous process consists on the melting of raw materials in a furnace at 1550 ºC, then the
molten glass is poured at 1000 ºC onto a bath of molten tin. In this tin the glass floats due to the
difference between the glass’ density and the molten tin’s density, forming a glass ribbon with
smooth surfaces. The wanted thickness of the glass can be easily adjusted by the top rollers; the
faster they roll, the thinner the glass will be and vice-versa. When the glass has passed through
the whole tin bath it should be around 600 ºC, and is drawn into an annealing lehr, in which the
main objective is to cool down the glass slowly (from 500 ºC to 100 ºC), in order to prevent
residual stresses. After this whole process the glass should be perfectly functional, so there’s
an automated inspection right after the end of the annealing lehr and then the final cutting of
the glass. In Figure 2.1 it’s shown a schematic representation of the float glass process.
(Haldimann et al., 2008)
Figure 2.1 – Float Process (Haldimann et al., 2008)

Structural Behaviour of Post-Tensioned Glass Beams 2 - Overview
João Pedro Fernandes Olim Neves 5
2.2.2 Laminated Glass
One of the ways engineers found to enhance the security of glass is by laminating it, i.e.,
bonding two or more layers of glass. (Figure 2.2) By bonding the full-surface many
opportunities are provided to modify the mechanical properties of the section. Laminated glass
remains as one piece when shattered – after breakage, the glass fragments adhere to the film
and so a certain remaining structural capacity is obtained. (Wurm, 2007) This post-breakage
behaviour furthermore depends on the interlayer material and its properties. (Haldimann et al.,
2008)
Figure 2.2 – Laminated Glass Process
The remaining load capacity is dependent on the fragmentation of glass, i.e., the bigger the
fragments the better the post-breakage behaviour. Such property asks for extreme care when
dealing with the different types of glass. Although it’s well known that tempered glass has a
higher strength than annealed glass, it has also a higher energy stored (see 2.2.3) that makes it
shatter in pieces when the strength is surpassed. Annealed glass, since has no energy stored,
breaks in larger fragments. Thus, the remaining structural capacity in annealed laminated glass
is better than that of tempered laminated glass. (Haldimann et al., 2008)
Figure 2.3 – Structural performance vs remaining structural capacity in laminated glass
(Haldimann et al., 2008)
Structural Behaviour of Post-Tensioned Glass Beams 2 - Overview
João Pedro Fernandes Olim Neves 6
Although the interlayer is not a rigid material, it is fundamental so the whole section can work
as one. Despite its viscoelastic behaviour it has proven to be an asset regarding the structural
behaviour of laminated glass.
One suggestion from the bibliography is that, for the usual interlayers, we can assume a full
composite shear section stiffness exclusively for short-term loads such as wind or impact. This
means that for permanent loads such as dead load it should only be considered the stiffness of
the individual sheets. (Wurm at al., 2007)
The first interlayers to have a widespread use as laminating adhesive was Polyvinyl butyral
film, also known as PVB. Its main drawback is that it is strongly dependent from the duration
of the load and the temperature. At 80ºC the PVB film starts to delaminate. A new product has
become available that overcomes negative features of PVB. Sentry Glass Plus, also known as
SGP, which has a stiffness up to 100 times higher than that of the common PVB, it is less
temperature dependent and can carry the same load with thinner thicknesses. With this type of
interlayer the full interaction can be assumed even for permanent loads. (Wurm, 2007)
2.2.3 Heat Strengthened Glass
One of the ways to enhance the strength of the glass is by tempering it. This process consists in
rapidly cooling the glass causing the surface to cool faster than the interior, which produce
compression stresses at the surface and tension stresses at the interior of the glass. This
compression is beneficial because it is like a pre-stress field which tends to avoid the spreading
of the crack. (Figure 2.4) This pre-stress compression field brings in a higher energy stored at
the glass which once damaged, shatters in tiny pieces. (Haldimann et al., 2008)
Figure 2.4 – Internal forces in Annealed [left] and Tempered [right] Glass (Haldimann et al.,
2008)

Structural Behaviour of Post-Tensioned Glass Beams 2 - Overview
João Pedro Fernandes Olim Neves 7
The difference between annealed, tempered glass and fully tempered glass is shown by the
fracture pattern that they produce. (Figure 2.5) This pattern depends on the energy stored in the
glass. Due to the pre-stress observed in the tempered glass, it has the highest fragmentation than
that of annealed glass as it is clearly visible in the following figures. It should be noticed that
the difference between the figure at the middle, and the picture at the right is the temperature
gradient during the tempering process. (Haldimann et al., 2008)
2.3 The strength of glass
The glass strength, as given by the Orowan equation, which is determined by the forces of the
interatomic bonds, the theoretical failure stress, m, also known as the stress necessary to break
a bond, is about 32 GPa.
(2.1)
Where Eg = 70GPa, = 3J/m2 andr0 = 0.2nm stand for Young’s modulus, Fracture Surface
Energy and Equilibrium spacing of the atoms, respectively.
Figure 2.5 – Fracture patterns of Annealed [Left], Tempered [Middle] and Fully Tempered
[Right] Glass (Haldimann et al., 2008)
0r
Eg
m

Structural Behaviour of Post-Tensioned Glass Beams 2 - Overview
João Pedro Fernandes Olim Neves 8
Obviously, the real tensile strength is much lower, and this huge difference between the
theoretical and the practical strength is, according to Griffith, due the microscopic flaws at the
glass surface that are unnoticeable to the naked eye. These microscopic flaws are already
present right after the production process of glass. Additional flaws may occur in the further
processes until installation and even in its service life-time. The strength is highly related to the
flaw dimension (depth). Despite the bending strength of annealed glass varies between 30 and
80 MPa (Feldmann and Kasper, 2014), in the bibliography the most common value for the
strength of glass in tension is 45 MPa. (Louter, 2011) This value is given with a 5% breakage
probability and a confidence interval of 95%. (Valarinho, 2010)
Crack opening and propagation are prevented in compression, thus the glass compressive
strength is up to 900 MPa, but compressive stresses are usually accompanied by tensile stresses.
An element when compressed has an equivalent moment due to the offset between the point
where the compression is applied and the gravity centre of the cross-section. (Figure 2.6) Due
to this effect the actual compressive strength, as given in the literature, is about 500 MPa. This
compressive strength, decreases to 170 MPa when under permanent loads given the creep
behaviour of viscoelastic materials under such loads. (Wurm, 2007)
Figure 2.6 – Compressive stresses are usually accompanied by tensile stresses
2.4 Material properties of glass
Glass is a solid, inorganic, homogeneous product of fusion. (Valarinho, 2010) Given the quick
cooling it forms without crystallization, and that’s the reason it is often called supercooled
liquid. Materials with non-crystalline molecular structure are called amorphous. (Wurm, 2007)

Structural Behaviour of Post-Tensioned Glass Beams 2 - Overview
João Pedro Fernandes Olim Neves 9
2.4.1 Chemical properties
There are two major types of glass: soda lime silica glass (SLSG) and borosilicate glass (BSG).
The BSG it’s preferred in labs given the heat resistance it provides (Haldimann et al., 2008).
Both use Silica sand in high quantities (Figure 2.7a) which is present in the Earth’s crust in the
form of pure quartz sand. (Wurm, 2007) Glass, unlike most other materials, do not consist of a
geometrically regular network of crystals. (Haldimann et al., 2008)
Figure 2.7 – a) Chemical composition of SLSG and BSG; b) Network of SLSG (Haldimann et
al., 2008)
2.4.2 Optical Properties
Unlike most solids, the electrons in glass are confined to particular energy levels, i.e., the
molecules cannot alternate between different states of excitement by absorbing radiation in the
bandwidths of visible and near infrared. Thus, the molecules do not absorb or dissipate those
forms of radiant energy and so, the energy passes without interaction with the molecules of the
material and hence glass appears transparent. As impurities aren’t unavoidable in the soda-lime
silica mix, typical windows absorb some radiation due to small amounts of iron that oxides
causing a greenish colour of SLSG. This unwanted effect can be avoided using extra-clear glass,
also known as low iron glass. (Haldimann et al., 2008)
Despite its disadvantages when compared with other materials, glass is able to give a high
transparency within the visible range of wavelengths ( = 380-750nm) that no other material
can. Within the Ultraviolet range and the infrared range the glass absorbs radiation due to
interaction with O2-ions in the glass and Si-O-groups, respectively. (Figure 2.8) (Haldimann et
al., 2008)
Sola lime
silica glass
Borosilicate
Glass
Silica sand SiO2 69-74% 7-87%
Lime (calcium oxide) CaO 5-14% -
Soda Na2O 10-16% 0-8%
Boron-oxide B2O3 - 7-15%
Potassium oxide K2O - 0-8%
Magnesia MgO 0-6% -
Alumina Al2O3 0-3% 0-8%
Others 0-5% 0-8%

Structural Behaviour of Post-Tensioned Glass Beams 2 - Overview
João Pedro Fernandes Olim Neves 10
Figure 2.8 – Transmittance as a function of wavelength (Haldimann et al., 2008)
2.4.3 Physical properties
The main disadvantage of glass, is that it is brittle, and cracks can easily propagate through it.
That's because when this material is bent there's compression stress on one side of the surface,
and tension stress on the other side of the surface. That tension stress opens the crack and pulls
it through the slide, resulting in fracture. Metals on the other hand are generally ductile, meaning
that when it’s bent the atoms can distribute the higher stresses, and consequently cracks have a
hard time travelling through metals. In order to make the glass used in construction and other
industries, engineers had to think of ways of making glass more fracture resistant. (Haldimann
et al., 2008)
In Table 2.1 there are the mechanical properties of different construction materials and the
reasons why glass should be handled with care; and in Table 2.2 the mechanical properties of
SLSG and BSG.

Structural Behaviour of Post-Tensioned Glass Beams 2 - Overview
João Pedro Fernandes Olim Neves 11
Table 2.1 – Properties of Different Materials (adapted from Wurm, 2007)
Steel
S 235
Softwood
S 10
Concrete
C20/25
Glass
Soda-lime glass
Refractive index h - - - 1.5
Density
[kN/m3]
78.5 6 22 25
7000
(like aluminium)
Tensile strength ft ,k
[kN/cm2]
24
(yield strength)1.4 0.22 4.5
Elongation at break in % 25 0.7 - 0.006 - 0.17
23.5 ║1.8-2.6 2 approx.50
┴0.4-0.6
Limiting tensile stress IId 21.8 0.9 (-0.1) 1.2/1.8
Safety factor y 1.1 1.3 1.8 2.5
Breaking length s/r
[m]2800 1500 -45 480/720
75 ║0.5 1.6 1
┴0.5
Thermal shock resistance
T [1/K]- - - 40
12x10-6
║5x10⁻⁶
10x10-6 9x10⁻⁶
┴35x10-6 60 K ≈ 0.5mm/m
Coefficient of thermal
expansion t [1/K]
Modulus of Elasticity E
[kN/cm2]
21000 1100 2900
Compressive strength fc,k
[kN/cm2]
Thermal conductivity
[W/m x K]
Table 2.2 – Mechanical properties of SLSG and BSG (adapted from Haldimann et al., 2008)
Sola lime silica
glass
Borosilicate
Glass
Density kg/m3 2500 2200-2500
Knoop hardness HK0,1/20 GPa 6 4.5-6
Young's modulus E MPa 70000 60000-70000
Poisson's ratio n - 0.23 0.2
Coefficient of thermanl expansion t 10-6
K-1 9 Class 1: 3.1-4.0
Class 2: 4.1-5.0
Class 3: 5.1-6.0
Specific thermal capacity cp Jkg-1
K-1 720 800
Thermal conductivity Wm-1
K-1 1 1
Average refractive index within the visible spectrum n - 1.52 1.5
Emissivity - 0.837 0.837

Structural Behaviour of Post-Tensioned Glass Beams 3 - State of art on glass beam systems
João Pedro Fernandes Olim Neves 12
3 State of art on glass beam systems
3.1 Structural behaviour
3.1.1 Reinforced Glass Beams
One way to obtain the desired ductility is by adding a steel section at the bottom (or at the
tensile zone) of the beam. This steel has the role to avoid the crack opening, i.e., the cracks still
appear but it’s much more difficult to get to a critical stage. Thanks to this phenomenon the
cracks will not run over the full height of the beam. Such composite section is capable to
generate significant post-breakage resistance. (Louter, 2011) (Figure 3.1)
3.1.2 Post-tensioned Glass Beams
With the reinforced glass beam concept, glass beams have now the particularity of bearing load
after the cracking of the glass, i.e., it has now a ductile behaviour such as steel or concrete but
has also the advantage of transparency. Despite this, its strength is still lower than that of any
of the others. That is why engineers are now developing new ways to improve the strength of
glass beams. One method found is by pre-tensioning the beam.
Figure 3.2 illustrates the favourable stress state induced by the pre-stress system. The crack
initiation and propagation are prevented in compression (see 2.3) so by inducing the pre-stress
field it leads the glass to a more advantageous situation with a longer region subjected to
compression instead of tension.
Figure 3.1 – Reinforced glass beam cross section and its Ductility (Louter, 2011)

Structural Behaviour of Post-Tensioned Glass Beams 3 - State of art on glass beam systems
João Pedro Fernandes Olim Neves 13
It was due to this fact that the post-tensioned glass beam appeared. By adding a compression
Stress previous to the load the maximum capacity of the beam is reached to a greater load value.
Figure 3.3 – Internal forces of the cross section before loading
3.1.3 Tempered Glass Beams vs Laminated Glass Beams
It has already been said that annealed laminated glass has a better post-breakage behaviour than
that of tempered laminated glass (see 2.2.2). Regarding (laminated) glass beams a study was
performed in Louter, 2011 and the conclusions were similar. Tempered glass beams shatter to
a higher load but the remaining load carrying capacity is minimal when compared to laminated
glass beams. (Louter, 2011) The Figure 3.4 tries to illustrate this phenomenon:
Figure 3.2 – Traction capacity vs Compression Capacity (Adapted
from Diaz et al., 2011)

Structural Behaviour of Post-Tensioned Glass Beams 3 - State of art on glass beam systems
João Pedro Fernandes Olim Neves 14
3.2 Overview of similar post-tensioned beams
In 2004 a post-tensioned glass beam prototype had already been tested by Louter (Louter,
2004). Such beam had a T-section. Composed by 3 layers of segmented annealed glass. A
curved stainless steel section has been integrated in the web of the beam. Through this hollow
section a 7 high strength steel tendon was fed and tensioned at the beam ends. The pre-
tensioning creates a compression field at the beam and, due to its curvature provides an upwards
lift and additional resistance to the beam. From the results of this study it was concluded that
the concept of post-tensioning an annealed glass beam is feasible and highly beneficial,
however the explosive failure poses possible risks for building applications.
Figure 3.5 – T-section beam layout [left] and cross section [right] (Louter, 2008)
Figure 3.4 – Remaining load carrying capacity after first crack between annealed and
tempered glass (Louter, 2011)

Structural Behaviour of Post-Tensioned Glass Beams 3 - State of art on glass beam systems
João Pedro Fernandes Olim Neves 15
In (Froli & Lani, 2010) hybrid pre-stressed steel-glass beams are investigated. (Figure 3.6) The
beam encompasses triangular double-layer PVB-laminated chemically tempered glass,
stainless steel knots and steel tension cables. In the system the steels provides a ductile failure
behaviour to the whole beam. In this works it was concluded that, different values of post-
tensioning influence just the service of deformability of the beam but not its ultimate load.
Figure 3.6 – Hybrid pre-stressed steel-glass beam (Froli & Lani, 2010)
In (Jordão et al., 2014) a laminated glass beam reinforced with pre-stressed cables is
numerically studied. The purpose of this paper was to establish a finite element model of the
beam in which a parameter study was done regarding the choice of the element, the mesh
dimensions, the choice of the feature used to model the lamination. Then benchmarking with
experimental results and comparison was done to test the quality of the numerical model dealing
with instability issues. A parametrical study regarding the optical position of the cable was also
done. (The main conclusions for this thesis were that S4 elements and 8 element along the
beam’s height lead to the best compromise between accuracy and time and the composite
section formulation leads to equivalent contact formulation so it’s better given the simplicity.
Figure 3.7 – Laminated glass beam reinforced with pre-stressed cables (Jordão et al., 2014)

Structural Behaviour of Post-Tensioned Glass Beams 3 - State of art on glass beam systems
João Pedro Fernandes Olim Neves 16
In (Weller & Engelmann, 2014) a studied is performed to assess the deformation of the beam
during post-tensioning. These deformations occur derived from imperfections. Due to this
offset from the theoretical perfect state the applied axial force from post-tensioning will induce
torsion and bending moments. During the experiments an imperfection of L/1000 was used. 4
layouts were studied. (Figure 3.8 and Figure 3.9) By analysing Figure 3.10 the out-of-plane
displacement did not exceed L/1000. Thus, it’s concluded that this layout indeed works during
post-tensioning.
Figure 3.8 – 4 types studied in (Weller & Engelmann, 2014)
Figure 3.9 – Layout of the type B and type D beams (Weller & Engelmann, 2014)
Figure 3.10 – Out of plane displacement (Weller & Engelmann, 2014)

Structural Behaviour of Post-Tensioned Glass Beams 3 - State of art on glass beam systems
João Pedro Fernandes Olim Neves 17
In (Louter, 2013) a different post-tensioned systems were tested. (Figure 3.11) From the results
it was concluded that these post-tensioned beams are feasible concepts in which the residual
load-carrying capacity increased significantly, as well as the initial failure strength. Figure 3.12
shows the advantage of the post-tensioned glass beams when compared to beam only made with
annealed glass.
Figure 3.11 – Post-tensioned beams tested in (Louter, 2013)
Figure 3.12 – Structural Behaviour of two glass beams. (Louter, 2013)

Structural Behaviour of Post-Tensioned Glass Beams 3 - State of art on glass beam systems
João Pedro Fernandes Olim Neves 18
To follow (Froli & Lani, 2010) work, (Froli & Mamone, 2014) improve the length of the beam
and develop now a 12m segmented glass beam. This beam is also composed by triangular and
rectangular laminated glass panels assembled together by means of post-tensioned bars only.
An experimental quasi-static cyclic test was performed experimentally and numerically. In
Figure 3.13 it can be concluded that the model predicts well the yielding initiation in the lower
bars, it overestimates the stiffness of the whole beam and its ultimate load-bearing model.
Figure 3.13 – Force vs Displacement plot (Froli & Mamone, 2014)

Structural Behaviour of Post-Tensioned Glass Beams 4 - Experimental Analysis
João Pedro Fernandes Olim Neves 19
4 Experimental Analysis
4.1 Introduction
The experimental work and corresponding results presented in this chapter belong to the
ongoing PhD thesis of Eng. MSc Jagoda Cupać. The referred thesis is being developed at École
Polytechnique Fédéral de Lausanne (EPFL), under the supervision of Prof. Dr. Jean-Paul Lebet
and under the co-supervision of Dr. Eng. Christian Louter. The experimental campaign was
developed at the Laboratoire de la construction métallique (ICOM), EPFL. Eng. MSc Jagoda
Cupac and her supervisors kindly authorized the use of the experimental data for the sole
purpose of calibration of the FEM developed in the current thesis.
The purpose of the experimental tests is to characterize the behaviour of triple-laminated glass
beam reinforced with a stainless steel strip at the bottom. In some tests the steel strip was post-
tensioned.
The details of the experimental tests are summarised in Table 4.1 in which hg, ha, hs, ti, ts, ta and
tg stand for height of the glass, width of the adhesive, width of the steel, thickness of the
interlayer, thickness of the steel, thickness of the adhesive and thickness of the glass,
respectively.
Table 4.1 – Experimental study Experiment 1st Exp NoPS 1st Exp PS 2nd Exp PS 2nd Exp NoPS 3rd Exp PS 3rd Exp NoPS
hg 122 mm 122 mm 122 mm 122 mm 122 mm 122 mm
ha 1.5 mm 1.5 mm 1.5 mm 1.5 mm 1.5 mm 1.5 mm
hs 25 mm 25 mm 25 mm 25 mm 25 mm 25 mm
ti (1.52x2) mm (1.52x2) mm (1.52x2) mm (1.52x2) mm (1.52x2) mm (1.52x2) mm
ts 3 mm 3 mm 3 mm 3 mm 3 mm 3 mm
ta 1.5 mm 1.5 mm 1.5 mm 1.5 mm 1.5 mm 1.5 mm
tg (2x6+10) mm (2x6+10) mm (2x6+10) mm (2x6+10) mm (2x6+10) mm (2x6+10) mm
Pre-Stress
Date 19-05-14
Without With With Without With Without
14-03-14 31-03-14 13-05-14 14-05-14 16-05-14
The PhD candidate Jagoda Cupac from EPFL is now studying the application of post-tensioned
glass beams with a reinforcement at the bottom of the beam. The stainless steel will be pre-
tensioned, creating an initial compressive stress where, when loaded, will be the maximum
tensile stresses. Therefore, it can bear some more load before it cracks.

Structural Behaviour of Post-Tensioned Glass Beams 4 - Experimental Analysis
João Pedro Fernandes Olim Neves 20
4.2 Layout and instrumentation
The layout corresponds to a 4PB arrangement, with the geometry shown in Figure 4.1. The
details of the cross-section may be found in Figure 4.2. The out of plane displacement is
prevented at the supports.
Figure 4.1 – Structural Model of the beam
Figure 4.2 – Cross-section details
The instrumentation corresponds to a deflectometer at mid span, and the applied force to the
beam was measured by the test machine load cell. The pretension force in the steel
reinforcement was measured by load cells during the pre-tension and curing of the adhesive.
Since the weight of the whole beam is much lower than the actual load and to simplify the
numerical modelling, such force wasn’t considered.

Structural Behaviour of Post-Tensioned Glass Beams 4 - Experimental Analysis
João Pedro Fernandes Olim Neves 21
4.3 Materials
4.3.1 Glass
The beam is made of annealed glass due to the reasons shown in 3.1.3. Although the failure
stress is higher, tempered glass has a worst structural behaviour once the cracking occurs.
The failure stress of glass is a value with high dispersion. It doesn’t only depend on the
processing but also depends on the ambient conditions. Thus, and despite the common value
suggested in the bibliography of 45MPa, the strength of the beam was calculated analytically
according to the experimental data.
The first crack is clearly visible in the Force-Displacement Curve, corresponding to the first
“jump” in the graphic. With that piece of information the exact load that caused the first crack
can be pinpointed. Equation (3.1) was used to calculate the tension of the beam when the first
crack appeared was the following, yielding the value of 46 MPa.
(3.1)
Where N, A, MPS, MLoad, I and v stand for Pre-Stress, Cross sectional area of the whole beam,
equivalent moment due the pre-stress, moment due the loading in the moment of the first
crack, moment of inertia in its strong axis and distance from the geometrical centre of the
beam to the top of the glass, respectively.
4.3.2 Stainless Steel
Stainless steels are a large family of iron-chromium based alloys. By adding chromium the steel
is now corrosion resistant in a variety of environments. Stainless Steel was used over usual steel
given the exposure that the steel has in the whole beam. That way, in normal conditions, a
stainless material can be assured through its living time. (Louter, 2008)
Between the stainless steels there are the austenitic stainless steels class, in which AISI 304 is
amongst. AISI 304 was chosen for this research given the fact that, in terms of total industrial
usage, it’s the most commonly used. (Louter, 2008)
The nominal curve for stainless steel grade AISI304 (1.4301) is in Figure 4.3.
--
v
I
MM
A
N LoadPS
Structural Behaviour of Post-Tensioned Glass Beams 4 - Experimental Analysis
João Pedro Fernandes Olim Neves 22
Table 4.2 – Nominal values for AISI 304 (adapted from Louter, 2011)
Figure 4.3 – Nominal curve for AISI 304
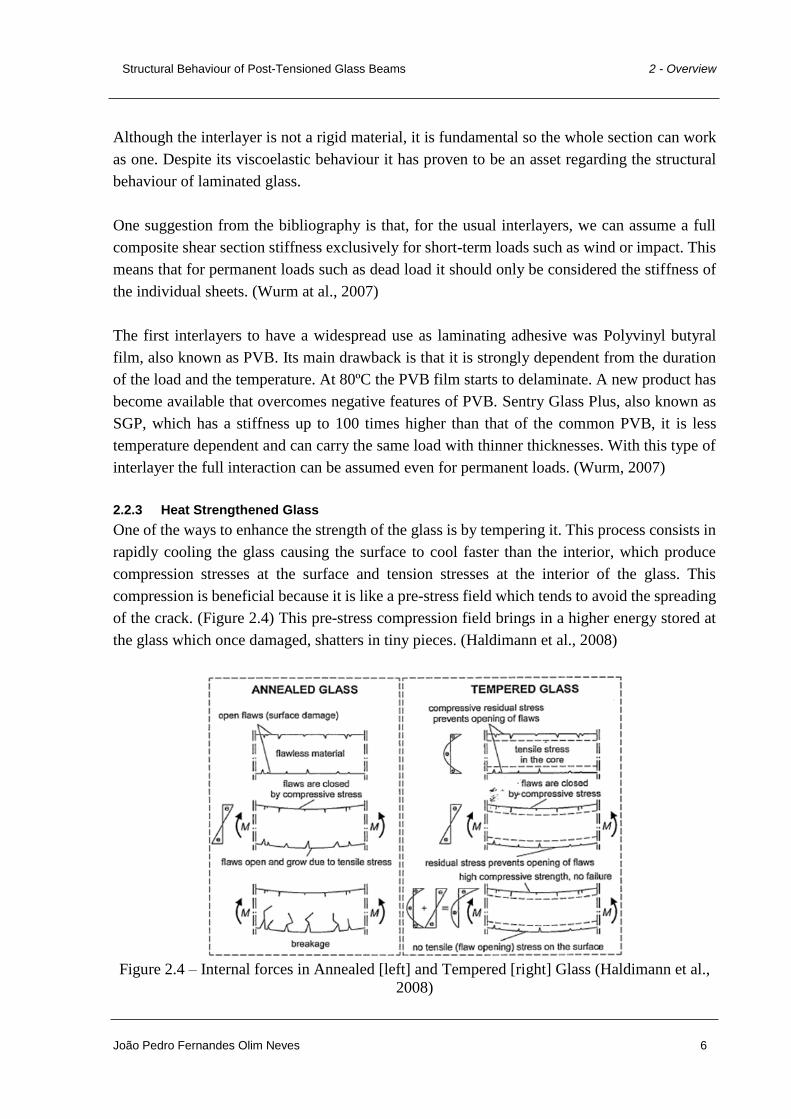
4.3.3 Adhesive
The adhesive used is Araldite 2047, which corresponds to an acrylic with a shear and tensile
strength of 20 MPa and 13-15 MPa, respectively and an elongation at break of 13-15%.
(Huntsman, 2013) This adhesive was chosen on the basis of previous research by (Belis et al.,
2011) (Nhamoinesu and Overend, 2012). Figure 4.4 shows the different behaviour between the
chosen adhesive and the other standard adhesives. It was applied with a thickness of 1.5mm.
Figure 4.4 – Structural behavior of the adhesive according to (Nhamoinesu and Overend,
2012)
Density kg/dm3 7.9
Modulus of Elasticity at 20ºC E GPa 200
Yield Strength 0.2% proof f y,0.2% MPa 210-230
Ultimate tensile strength f t MPa 520-750
Elongation at fracture r % 45
0
2
4
6
8
10
0 0.5 1 1.5 2 2.5 3 3.5 4
Stre
ss [
MP
a]
Strain [-]
Silicone
Polyurethane
Acrylate
Araldite 2047 Acrylic

Structural Behaviour of Post-Tensioned Glass Beams 4 - Experimental Analysis
João Pedro Fernandes Olim Neves 23
4.3.4 Interlayer material
The interlayer material is Sentryglas Plus (SGP). Each layer is 1.52mm thick. The elastic
properties of the SGP are shown in Figure 4.5.
1 s 3s 1 min 1 hr 1 day 1 mo 10 yrs
10 ºC 692 681 651 597 553 499 448
20 ºC 628 612 567 493 428 330 256
24 ºC 581 561 505 416 327 217 129
30 ºC 442 413 324 178 148 34.7 15.9
40 ºC 228 187 91.6 27.8 13.6 9.86 8.84
50 ºC 108 78.8 33.8 12.6 8.45 6.54 6
60 ºC 35.3 24.5 10.9 5.1 3.87 3.24 2.91
70 ºC 11.3 8.78 5.64 2.52 1.77 1.44 1.35
80 ºC 4.65 3.96 2.49 0.96 0.75 0.63 0.54
1 s 3s 1 min 1 hr 1 day 1 mo 10 yrs
10 ºC 240 236 225 206 190 171 153
20 ºC 217 211 195 169 146 112 86.6
24 ºC 200 193 173 142 111 73.2 43.3
30 ºC 151 141 110 59.9 49.7 11.6 5.31
40 ºC 77.0 63.0 30.7 9.28 4.54 3.29 2.95
50 ºC 36.2 26.4 11.3 4.20 2.82 2.18 2.00
60 ºC 11.8 8.18 3.64 1.70 1.29 1.08 0.97
70 ºC 3.77 2.93 1.88 0.84 0059 0.48 0.45
80 ºC 1.55 1.32 0.83 0.32 0.25 0.21 0.18
1 s 3s 1 min 1 hr 1 day 1 mo 10 yrs
10 ºC 0.442 0.443 0.446 0.45 0.454 0.458 0.463
20 ºC 0.448 0.449 0.453 0.459 0.464 0.473 0.479
24 ºC 0.452 0.453 0.458 0.465 0.473 0.482 0.489
30 ºC 0.463 0.466 0.473 0.485 0.488 0.497 0.499
40 ºC 0.481 0.484 0.492 0.498 0.499 0.499 0.499
50 ºC 0.491 0.493 0.497 0.499 0.499 0.5 0.5
60 ºC 0.497 0.498 0.499 0.5 0.5 0.5 0.5
70 ºC 0.499 0.499 0.5 0.5 0.5 0.5 0.5
80 ºC 0.5 0.5 0.5 0.5 0.5 0.5 0.5
Load Duration
Poisson Ratio
Tem
per
atu
reT
emp
erat
ure
Young's Modulus E (MPa)
Load Duration
Load Duration
Shear Modulus G (MPa)
Tem
per
atu
re
Figure 4.5 - Properties of SGP depending on time of load and temperature (Stelzer, 2010)

Structural Behaviour of Post-Tensioned Glass Beams 4 - Experimental Analysis
João Pedro Fernandes Olim Neves 24
4.4 Loading
6 tests were performed, 3 with and 3 without Pre-stress. For each series 3 speeds were
considered. 1 mm/min, 2 mm/min and 5 mm/min.
In the cases with PS, it was applied an initial step:
1. The stainless steel strip is tensioned with a force of 15 kN leading to a stress of 200 MPa
on the steel, which was near the normative yield stress value (Ruukii, 2014).
2. The adhesive is applied to the steel strip and to the beam.
3. When the adhesive is cured, the PS supports are released and the PS force is transferred
to the glass.
4. The beam is tested with the vertical force.
4.5 Structural Model
The propagation of the cracks only occur in traction, and since there’s the steel to hold the
traction after the cracking, the top of the beam is always compressed. Therefore, the crack
propagation stops as shown in Figure 4.6. (Louter, 2011) This concept may be understood in
by analysing Figure 4.7:
Figure 4.6 - Unloaded beam (left), Loaded Beam (Right)
Figure 4.7 - Stress distribution after the cracking

Structural Behaviour of Post-Tensioned Glass Beams 4 - Experimental Analysis
João Pedro Fernandes Olim Neves 25
The internal forces due the Pre-Stress step are represented in Figure 4.8 and the internal forces
due the loading step are represented in Figure 4.9.
Figure 4.8 – Internal forces due to the Pre-Stress step
Figure 4.9 – Internal forces due to the Loading Step
4.6 Results
The results for the reinforced beam and reinforced post-tensioned beams are depicted in Figure
4.10a) and Figure 4.10b), respectively. Figure 4.11 shows a comparison between the results of
a reinforced and a post-tensioned beam.

Structural Behaviour of Post-Tensioned Glass Beams 4 - Experimental Analysis
João Pedro Fernandes Olim Neves 26
Figure 4.11 – Difference between the reinforced beam behavior and the post-tensioned beam
behavior
From the results it can be concluded that the main advantage of the post-tensioned glass system
is that the first crack appears for a higher load – it can be observed that for the reinforced glass
beam and for the post-tensioned glass beam the first crack appears at approximately 13kN and
18kN, respectively. For higher loads the post-tensioned beam behaves similarly to the
reinforced glass beams.
The reason for this is related with PS losses. In fact the pre-stress is applied on the steel that is
transferred to the glass through the adhesive, but as the adhesive deforms the pre-stress
decreases. This effect is increased when the cracks appear at the bottom of the glass. It then
creates some debonding and instantaneous bending and so some more pre-stress is lost.
0
5
10
15
20
25
30
35
-60-50-40-30-20-100
Forc
e (k
N)
Displacement (mm)
Reinforced Beam vs Post-tensioned Beam
1stExp NoPS
1stExp PS=15kN
0
10
20
30
-60-40-200
Forc
e [k
N]
Displacement [mm]
Reinforced beam
1stExp NoPS
2ndExp NoPS
3rdExp NoPS
0
10
20
30
-60-40-200
Forc
e [k
N]
Displacement [mm]
Post-tensioned beam
1stExp PS=15kN
2ndExp PS=15kN
3rdExp PS=15kN
Figure 4.10 - Provided Data from Experiments in Reinforced Glass Beams (Left) and
Post-tensioned Glass Beams (Right)

Structural Behaviour of Post-Tensioned Glass Beams 5 - Numerical Analysis
João Pedro Fernandes Olim Neves 27
5 Numerical Analysis
The objective of the present chapter is the establishment of the numerical model. It is intended
to reproduce the behaviour of the prototype used in the experimental campaign, so all the
geometry layout and material properties will be reproduced. After calibration with the
experimental results the numerical model will be used for a parametrical analysis aiming to
completely characterize the behaviour of the structural model under study.
5.1 Structural model
The structural model corresponds to the experimental layout. In order to save time and since
the setup was symmetrical, only half of the beam was considered in the numerical analysis. So
3 boundary conditions were assumed:
Mid Span symmetry
Simple supported blocking vertical displacement
Simple supported blocking horizontal out-of-plane displacement
Figure 5.1 - Representation of the boundary conditions
5.2 Element type
The numerical analysis was done with shell elements. Nevertheless a comparison was
established between the calculations of the model with Shell elements and the calculations of
the model with 3D deformable elements and the difference was minimal as it can be shown in
Table 5.1. This analysis was done in 2D elements without the Adhesive (2 parts), 2D elements
with the adhesive included (3 parts) and 3D elements with the adhesive included (3 parts). To
avoid calculating two steps in the Finite Element Analysis (FEA) software, these analysis were
done on the reinforced glass beam. It was chosen homogeneous meshes with square/cubic
elements for steel and adhesive and triangular/tetrahedral elements for glass. The results of this
analysis are shown in Table 5.1. A mesh convergence study was performed (10mm, 5mm, 3mm,
2mm).

Structural Behaviour of Post-Tensioned Glass Beams 5 - Numerical Analysis
João Pedro Fernandes Olim Neves 28
Table 5.1 – Analysis type and Mesh Study
It was observed that for the 2D simulation without the adhesive the stress was too high when
compared with the analytical approach (see 4.3.1). It was also found that the difference of
stresses between the 2D simulation and the 3D simulation aren’t significant. Nevertheless, the
calculation time for the 3D simulation was much higher than the calculation time for the 2D
simulation. It was chosen the 2D model with the adhesive included (3 parts).
5.3 Explicit Analysis
Unlike steel, glass is brittle and when the strength of the material is reached it cracks instead of
yielding. It was necessary to define properly the numerical assessment of the brittle cracking.
In order to define the brittleness of the material it’s necessary to define the crack initiation and
the post-cracked behaviour of the glass.
Abaqus software offers two ways of performing the analysis – Standard/Implicit or Explicit. In
a standard analysis - the implicit analysis - the integration operator matrix must be inverted and
a set of nonlinear equilibrium equations must be solved at each time increment. In an explicit
analysis displacements and velocities are calculated in terms of quantities that are known at the
beginning of an increment; therefore, the global mass and stiffness matrices don’t need to be
formed and inverted, which means that each increment is less expensive than in a standard
analysis. (Abaqus, 2012)
Load =
10 mm 47.69 MPa -74.39 MPa -2.48 mm
5 mm 47.69 MPa -80.12 MPa -2.48 mm
3 mm 47.69 MPa -82.73 MPa -2.48 mm
2 mm 47.69 MPa -82.29 MPa -2.48 mm
Load =
10 mm 45.41 MPa -54.88 MPa -2.43 mm
5 mm 46.31 MPa -64.19 MPa -2.47 mm
3 mm 46.68 MPa -69.54 MPa -2.49 mm
2 mm 47.00 MPa -74.34 MPa -2.50 mm
Load =
10 mm 43.50 MPa -55.22 MPa -2.57 mm
5 mm 45.49 MPa -65.71 MPa -2.55 mm
3 mm 46.35 MPa -70.59 MPa -2.56 mm
2 mm 46.75 MPa -74.70 MPa -2.49 mm
2D Analysis 2 Parts
2D Analysis 3 Parts
3D Analysis 3 Parts
Mesh Size max In-Plane Principal min In-Plane Principal dmidspanRE
INF
OR
CE
D G
LA
SS
BE
AM
6.665 kN= 13.3333/2
Mesh Size max In-Plane Principal min In-Plane Principal dmidspan
6.665 kN= 13.3333/2
6.665 kN= 13.3333/2
Mesh Size max In-Plane Principal min In-Plane Principal dmidspan

Structural Behaviour of Post-Tensioned Glass Beams 5 - Numerical Analysis
João Pedro Fernandes Olim Neves 29
The explicit dynamics procedure has the advantage of being able to process large rotations and
deformations and can be used to perform quasi-static analysis with complicated contact
conditions. Unlike the Standard analysis, where the equilibrium must be validated, in the
explicit analysis the calculations are based on Newton’s Second law (Mashayekhi, 2013), since
the explicit dynamics procedure solves every problem as a wave propagation problem:
(5.1)
Where F, m and a stand for force, mass and acceleration, respectively.
Figure 5.2 - Purposes of both analysis (Mashayekhi, 2013)
The explicit analysis is more suitable in order to simulate the quasi-static loading performed in
the experiments due to the capability to use mass scaling to reduce the cost of the analysis and
to have into account the brittleness of the material. Without such analysis the brittle cracking
of the material could not be modelled. (Abaqus, 2012)
The calculations in an explicit analysis are done by stable time increments. That stable time
increment, t, can be estimated by the following Equation (Abaqus, 2012)
(5.2)
Where Lmin and cd stand for smallest element dimension in the mesh and dilatational wave
speed, respectively. The dilatational wave speed, cd, may expressed as (Abaqus, 2012):
dc
Lt min
amF

Structural Behaviour of Post-Tensioned Glass Beams 5 - Numerical Analysis
João Pedro Fernandes Olim Neves 30
(5.3)
Where �̂� and 𝜇 stand for Lamé’s first parameter and Lamé’s second parameter (also known
as Shear Modulus), respectively. For application in Structural Engineering, in which materials
are mainly isotropic and elastic it can be assumed that:
(5.4)
(5.5)
By these equations it can be deduced that the bigger the element, the bigger the stable time
increment. The remaining parameters are properties of the material. The stable time increment
will not remain constant in general, since element distortion will change the smallest element
dimension during the analysis. These calculations were automatically done by the software. A
fixed incrementation may be used but it is advised to use the automatic incrementation to avoid
errors.
5.4 Quasi-Static Simulation
The beams were tested with low displacement ratios (see 4.4) so a quasi-static experiment may
be assumed. A Quasi-static loading, by definition, refers to a slow loading in which the inertial
effects can be negligible.
To have a really quasi-static simulation an amplitude was determined. (Figure 5.3). With such
amplitude an increasing load is assured, i.e., in the beginning of the step the applied loading
value is zero and in the end of the step the loading value is what it was determined.
0 0.1 0.2 0.3 0.4 0.5 0.6 0.7 0.8 0.9 1
Am
p
Time
Load Amplitude
Figure 5.3 - Amplitude Imposed
ucd
ˆ2ˆ
)21)(1(0
nn
n
-
E
)1(20
n
E

Structural Behaviour of Post-Tensioned Glass Beams 5 - Numerical Analysis
João Pedro Fernandes Olim Neves 31
5.5 Reducing the computational cost
As this is a complex and long analysis and the available time was extremely limited, reducing
the computational cost was mandatory. In (Abaqus, 2012) 2 methods can be found to reduce
the computational cost. These 2 ways are explained below:
5.5.1 Speeding up the simulation
One way to reduce the number of increments required, is to speed up the simulation compared
to the time of the actual process, i.e., artificially reduce the time period of the event. By doing
this 2 possible errors may occur:
The increased inertia forces will change the predicted response, i.e., the problem may
exhibit a wave propagation response.
If the material behaviour is rate dependent the simulation will not be real.
5.5.2 Using Mass Scaling
The second way to reduce the number of increments is by artificially increasing the material
density, , by a factor of f2. Analysing the equations (5.2) and (5.3) it can be understood that
by doing this the stable time increment increases f times.
Both of these methods were considered, due to the time limitation. The contact difficulties
between the materials, the low density of some materials and the small displacement rates
performed in the experiment made these analysis too difficult and so it is highly recommended
that after the study of the parameters to input, an analysis with the adequate time and with a
lower mass scale factor be carried.
After defining the amplitude, an analysis was carried to simulate an experiment in the reinforced
glass beam. The first simulation was done with a total time of 1s which is the default definition
of the software and with a mass scale factor of 1x10⁶. When plotted the reaction force at the
support in function of the time period of the step the result depicted below as obtained:

Structural Behaviour of Post-Tensioned Glass Beams 5 - Numerical Analysis
João Pedro Fernandes Olim Neves 32
Figure 5.4- Reaction Force in function of Time when Step time was 1 computational second
It was immediately realized that the step must take more than 1 computational second to
simulate the experiment. This inaccuracy happens due to the quick loading rate. The quick
loading rate can be avoided by increasing the step time.
It was written before that the displacement ratio during the experiments had been 1mm/min,
2mm/min and 5mm/min. So, in order to get the most accurate simulation as possible, 1mm/min
was assumed for the whole experiment.
For a displacement higher than 30mm the beam behaves as a plastic material, proving that the
steel is the main material bearing load in the current state. As in this thesis the goal is to
characterize the structural behaviour of the beam, i.e., the composite section, all the plots shown
are until 30mm of displacement.
For a ratio of 1mm/min and in order to get 30mm of displacement it was necessary an analysis
with 1800 computational seconds. Since this is unpractical and the resources were limited it
was assumed 50 computational seconds. (Figure 5.5)
By the stable time increment, taken from (Bedon and Louter, 2014) and the adequate time
calculated before, it is easy to get the required number of increments, n (Abaqus, 2012):
(5.6)
Where T and t stand for time period and stable time increment, respectively.
97 1094.9
1081.11800
-t
Tn

Structural Behaviour of Post-Tensioned Glass Beams 5 - Numerical Analysis
João Pedro Fernandes Olim Neves 33
This means that in order to get the real simulation almost 10 000 millions increments are
needed. Abaqus explicit is able to process the calculations with two different precisions: the
double precision and the single precision. The double precision executable makes the
calculations with 64-bit word lengths instead of the usual 32-bit word lengths (single precision).
By using the single precision it could be saved 20% to 30% of the CPU when compared to the
double precision, however single precision tends to be inadequate in analysis that require a
number of increments greater than 300 000. (Abaqus, 2012) Since it was done an explicit
analysis and the number of increments required for each step was a significant number a double
precision executable was used. (Bedon and Louter, 2014)
By assuming the mass scale factor = 1 000 000 the n reduces 1 000 times, and by assuming a
time period of 1s the n reduces 1800 times. So n’ increments were analysed:
(5.7)
As this value is much lower than that of the experiment, an analysis with 50 computational
seconds was tested. By doing this the number of increments was now:
(5.8)
The same plot as before, but this time for 50 computational seconds may be find below:
Figure 5.5 - Reaction Force in function of Time when Step time was 50 computational
seconds
nnf
nn -71056.51800
110000001800
1'
nn -5108.2'

Structural Behaviour of Post-Tensioned Glass Beams 5 - Numerical Analysis
João Pedro Fernandes Olim Neves 34
It is clear that, although the wave propagation response still exists, is much less significant than
before. As it was said before, an analysis with a higher number of increments is highly
recommended.
5.6 Influence of the interlayer in the numerical analysis
Almost all models for reinforced glass beams have been two-dimensional. By only using 2D
elements the interlayers could not be taken into account in the numerical modelling. A study
regarding the influence of the interlayer was done in (Louter and Nielsen, 2013) and it was
concluded that a simulation is still highly dependent on the interlayers properties, particularly
its Shear modulus, G, i.e., when the analysis is calculated without taking into account the
adhesive, the plots force-displacement are slightly lower than that of the experiment. This fact
is shown in Figure 5.6. For that reason the force-displacement plots given by the numerical
calculations are expected to have a slightly smaller resistance than that of the experiments.
Figure 5.6 – The influence of the SGP in force-displacement curves (Louter et Nielsen, 2013)
5.7 Mesh
In (Bedon and Louter, 2014) it is shown that a different mesh from bottom to the top of the
beam is adequate, (1mm at the bottom and 5mm at the top particularly) and so the first
numerical models including the brittle cracking were done with this fine mesh. Unfortunately,
these models were shown to be too slow and too expensive for the limited time available, i.e.,
the Stable time increment, t, was 1.81x10⁻⁷ (Bedon and Louter, 2014). After analysing Table
5.1, a homogeneous mesh of 3mm was chosen. By doing so, the stable time increment, t,
dropped to approximately 5x10⁻⁷, i.e. the analysis got 3 times faster as expected. (see 5.3)

Structural Behaviour of Post-Tensioned Glass Beams 5 - Numerical Analysis
João Pedro Fernandes Olim Neves 35
Figure 5.7 – Mesh pattern used in Bedon and Louter, 2014
As the size of each element is slightly bigger than the size practised in Bedon and Louter, 2014
is should be expected bigger irregularities on the graph of the numerical analysis done within
this thesis. This happens because, since the elements are bigger, once it gets to the failure stress
a relatively large portion of the beam is taken from the analysis when compared with the portion
of the beam taken in Bedon and Louter, 2014.
Figure 5.9 – Zoomed picture of the mesh used within the study at the bottom edge of the
beam
The three different materials may be found in Figure 5.8 and in Figure 5.9. The blue, brown
and silver colours corresponds to the glass elements, adhesive elements and steel elements,
respectively.
Figure 5.8 – Mesh pattern used within this study

Structural Behaviour of Post-Tensioned Glass Beams 5 - Numerical Analysis
João Pedro Fernandes Olim Neves 36
5.8 Equivalent Cross Section
The real cross section (O in
Figure 5.10) encompasses three layers of annealed glass. Two of them with 6mm and another
with 10mm. The interlayers were not modelled, so the beam could be modelled with Shell
Elements.
In order to assess which one was the best to model the behaviour of the beam a comparison was
established between the numerical and experimental results, for each equivalent cross section.
3 possibilities were considered. (A, B and C in
Figure 5.10). After analysing Figure 5.11 the possibility A was found to be the most suitable
since its results are the ones closer to the experimental ones. In fact B has a lower strength B
when compared to that of the experiment and C has a higher stiffness than that of the
experiment.
Figure 5.10 – Differences between the real [O] and the numerical cross sections [A, B and C]

Structural Behaviour of Post-Tensioned Glass Beams 5 - Numerical Analysis
João Pedro Fernandes Olim Neves 37
Figure 5.11 – Force-displacement curves from Experiment [O] and Numerical Analysis [A, B
and C]
Although at first sight it appears an inaccurate simulation, taking into account what was
mentioned in 5.6 and previous research, the plots shown in Figure 5.11 are indeed due to
accurate simulations and show a good correspondence when comparing with the experimental
results. The “jumps” shown in the plots correspond to elements deletion (see 5.11.3) and are
also due to some dynamic response that isn’t inexistent in the model. (see 5.5)
5.9 Pre-Stress
The value of the pre-load was determined to be 15kN (see 4.4). As the used software doesn’t
have the built-in function of pre-stress it was needed to calculate the equivalent variation of
temperature, T. The conductivity of the materials that were not to be pre-stressed was set to
be zero in order to prevent heat transfer between the materials. With that variation it was
possible to simulate the pre-stress. To calculate the T, firstly it was needed to calculate the
displacement, L, in the steel due to the pre-stress of 15kN.
(5.9)
Where N, L, E and A stand for determined pre-stress value, length of the beam, young’s
modulus of the steel reinforcement and cross-sectional are of the steel reinforcement. The
same displacement may be calculated due to a T:
0
5
10
15
20
25
30
35
40
-30-25-20-15-10-50
Forc
e (k
N)
Displacement (mm)
O
A
C
B
ss AE
NLL

Structural Behaviour of Post-Tensioned Glass Beams 5 - Numerical Analysis
João Pedro Fernandes Olim Neves 38
(5.10)
Where stands for coefficient of thermal expansion. Equating both of the equations we get:
(5.11)
It was tried the force analogy (Figure 5.12), i.e., with the 15kN force on the edge of the beam
but the stress distribution on the steel was found incorrect (Figure 5.13), i.e., different of what
should be expected. By adding the pre-tensioning field it should be expected a bigger tension
at half span of the beam and not at the edge. The stress distribution caused by the variation of
temperature is the most accurate between these two (Figure 5.14). The axial force in Figure
5.14 doesn’t reach the 15kN due to immediate pre-stress losses. These pre-stress losses are
immediate and happen due to the bending.
Figure 5.12 – Force analogy regarding the pre-stress
Figure 5.13 – Stress on the steel along its axis and its axial force due to the force analogy
TLL
KAE
NT º7.65
1-

Structural Behaviour of Post-Tensioned Glass Beams 5 - Numerical Analysis
João Pedro Fernandes Olim Neves 39
To validate these calculations a comparison between the analytical approach and the numerical
approach was done.
In order to use the analytical approach, the bending stiffness of the composite section, EIcomposite,
was calculated according to the following Equation (Louter, 2011):
(5.12)
Where Egl stand for Young’s modulus of glass (the main component in the section), Ei stand
for Young’s modulus of the considered component in the section, Iyy,I stand for moment of
inertia of the considered component, n stand for total number of components in the section, zi
stand for distance between the axis of the considered component and the neutral axis, i stand
for considered component in the section and Ai stand for cross-sectional area of the considered
element
The displacement was calculated according to the following equation (Dias da Silva, 2004):
(5.13)
Figure 5.14 – Stress on the steel along its axis and its axial force due to the variation of
temperature
n
ni gl
iii
gl
iiyyglcomposite
E
EAz
E
EIEEI 2
,
composite
PS
EI
M
1

Structural Behaviour of Post-Tensioned Glass Beams 5 - Numerical Analysis
João Pedro Fernandes Olim Neves 40
Where andMPS stand for bend radius and moment installed due the pre-stress, respectively.
Figure 5.15 – Connection between the Bend radius and the half span displacement
The comparison of the displacements between the analytical and the numerical approach may
be found below:
Table 5.2 - Analytical vs Numerical Approach regarding the Pre-Stress
dmidspan,PS 0.735 mm 0.712 mm
3%
Analytical Numerical
As the difference is nearly 3% the variation of temperature equivalency can be assumed.
5.10 Loading Step
To avoid to perform an explicit analysis in two steps, i.e., pre-stress step and loading step, it
was chosen to run this step on a different analysis and then run the second step in another job
with an imported predefined field containing the stress on each element from the 1st step. To do
so, according to (Abaqus, 2012), it was necessary to change the element family, i.e., the element
instead of being part of the usual shell family became part of the coupled temperature-
displacement family. Thus, the stress field due to the pre-stress tension was then transferred to
the loading step as a predefined stress field.
5.11 Materials’ Properties
5.11.1 Adhesive Properties
The adhesive used in the experimental tests (Araldyte 2047-1) has a non-linear law with of
0.43. (Nhamoinesu and Overend, 2012), established an analytical expression to characterize the
behaviour of the referred adhesive.

Structural Behaviour of Post-Tensioned Glass Beams 5 - Numerical Analysis
João Pedro Fernandes Olim Neves 41
-
-
3631.634.1415.1300
1548.043.766168812
2
025.0
025.0
(5.14)
Where and stand for stress [MPa] and extension, respectively.For the numerical model a
multi-linear curve was used to reproduce the adhesive non-linear law. In order to save resources,
two different curves were tested. Figure 5.16a) shows the referred curves. Figure 5.16b) shows
a comparison of the numerical results for both curves.
Figure 5.16 - Adhesive Behaviour Study
According to the numerical calculations these two different approaches resulted in similar load-
displacement plots, as it can be observed by Figure 5.16. For this reason, and to make the
calculations less complex, only the first simpler approach was considered in the following
numerical models.
5.11.2 Steel Properties
The Steel used, as it has been told, is a stainless steel. Stainless Steel AISI 304 (1.4301) in
particular. Its properties may be found in 4.3.2.
Uniaxial coupon tests on the steel have not yet been performed for the batch of AISI304 used
for the steel strips used in the experimental campaign. Nevertheless, the results of uniaxial tests
on an actual batch of AISI304 were used for the numerical analysis.
0
5
10
0 0.02 0.04 0.06
Stre
ss
Strain
Analytical (Nhamoinesu andOverend)Numerical
Numerical_10
5
10
15
20
25
30
35
40
-30-20-100
Forc
e (k
N)
Displacement (mm)
Exp
Numerical
Numerical_1
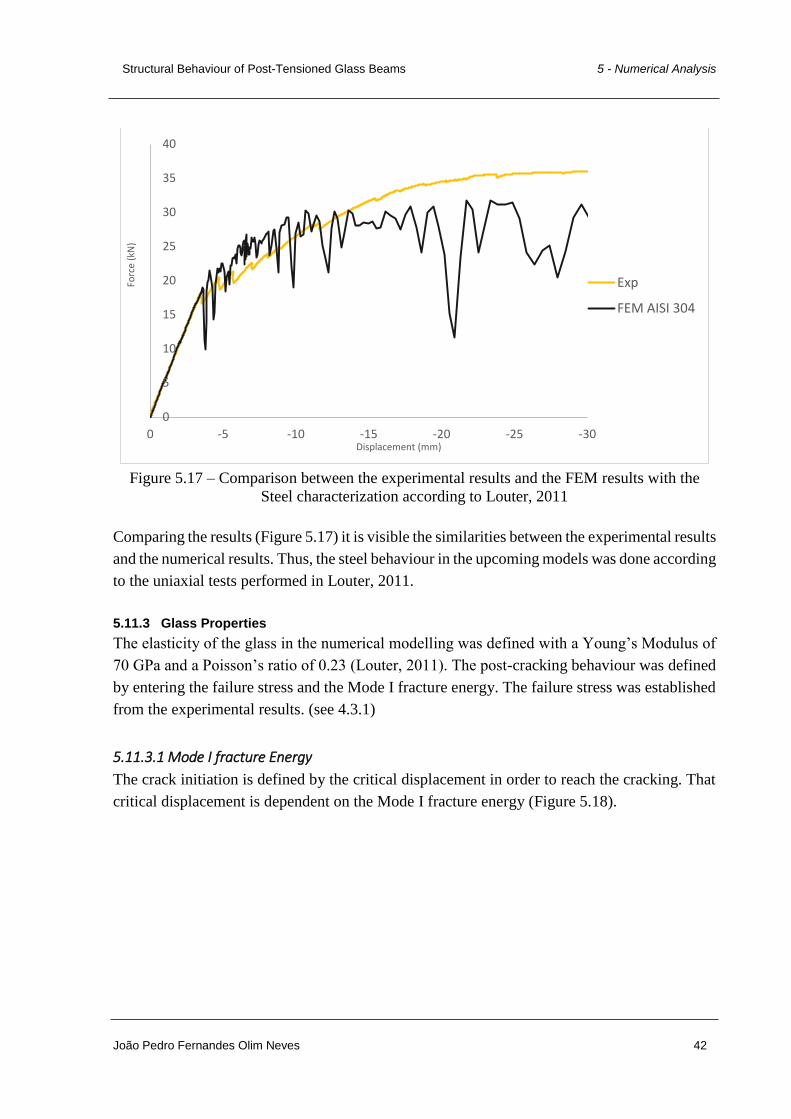
Structural Behaviour of Post-Tensioned Glass Beams 5 - Numerical Analysis
João Pedro Fernandes Olim Neves 42
Figure 5.17 – Comparison between the experimental results and the FEM results with the
Steel characterization according to Louter, 2011
Comparing the results (Figure 5.17) it is visible the similarities between the experimental results
and the numerical results. Thus, the steel behaviour in the upcoming models was done according
to the uniaxial tests performed in Louter, 2011.
5.11.3 Glass Properties
The elasticity of the glass in the numerical modelling was defined with a Young’s Modulus of
70 GPa and a Poisson’s ratio of 0.23 (Louter, 2011). The post-cracking behaviour was defined
by entering the failure stress and the Mode I fracture energy. The failure stress was established
from the experimental results. (see 4.3.1)
5.11.3.1 Mode I fracture Energy
The crack initiation is defined by the critical displacement in order to reach the cracking. That
critical displacement is dependent on the Mode I fracture energy (Figure 5.18).
0
5
10
15
20
25
30
35
40
-30-25-20-15-10-50
Forc
e (k
N)
Displacement (mm)
Exp
FEM AISI 304

Structural Behaviour of Post-Tensioned Glass Beams 5 - Numerical Analysis
João Pedro Fernandes Olim Neves 43
Figure 5.18 - Mode I fracture Energy (Area)
From Figure 5.18, the critical displacement, uck, is given by:
(5.15)
In linear elastic Fracture Mechanics there are three fracture modes (Lawn, 1993). All of them
may be defined as:
Mode I – normal separation of the crack walls under the action of tensile stress
Mode II – longitudinal shearing of the crack walls in a direction normal to the crack
front
Mode III – lateral shearing parallel to the crack front
These different fracture modes may be also summarized into this figure that follows:
Figure 5.19 - Different Fracture Modes (Twisp, 2008)
t
f
ckcktff
GuufG
2
21

Structural Behaviour of Post-Tensioned Glass Beams 5 - Numerical Analysis
João Pedro Fernandes Olim Neves 44
For the structural model being studied, only mode I is relevant (see Figure 5.20) since there are
only forces at the plane of the structure (longitudinal).
Figure 5.20 – Mode I fracture energy in glass
The Mode I fracture Energy in the bibliography varies between 3 J/m2 (Louter, 2011) and 8
J/m2 (Bernard et al., 2013). A study in (Bedon and Louter, 2014) was done regarding this
parameter and the conclusion is that, despite the global resistance and structural performance
of the examined beams not being affected by the variation in Mode I Fracture Energy of glass,
the fracture pattern indeed varies significantly. In this study it was concluded that the lower the
fracture energy the more cracks appeared in glass and vice-versa. In Figure 5.21 it can be
observed what was said before.
Table 5.3 – Fracture Energy study done in (Bedon and Louter, 2014)
FEM
M01 3 J/m2
M-GF02 8 J/m2
M-GF03 5.5 J/m2
Mode I fracture Energy
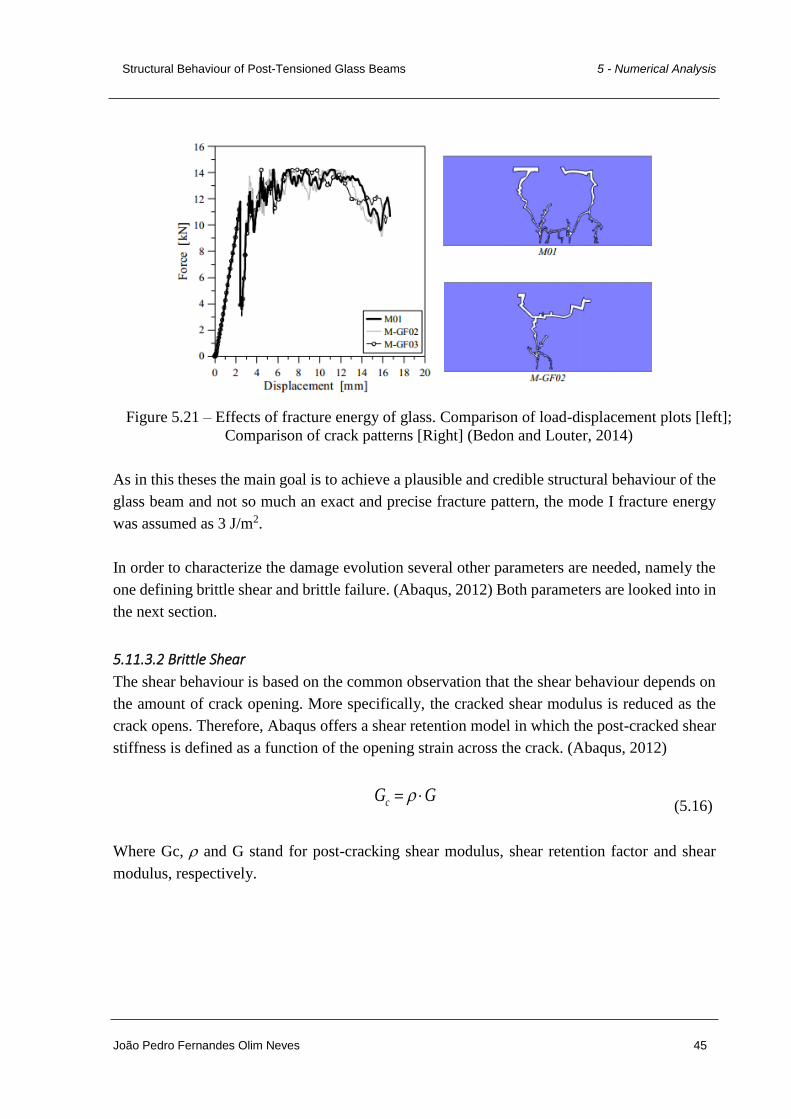
Structural Behaviour of Post-Tensioned Glass Beams 5 - Numerical Analysis
João Pedro Fernandes Olim Neves 45
As in this theses the main goal is to achieve a plausible and credible structural behaviour of the
glass beam and not so much an exact and precise fracture pattern, the mode I fracture energy
was assumed as 3 J/m2.
In order to characterize the damage evolution several other parameters are needed, namely the
one defining brittle shear and brittle failure. (Abaqus, 2012) Both parameters are looked into in
the next section.
5.11.3.2 Brittle Shear
The shear behaviour is based on the common observation that the shear behaviour depends on
the amount of crack opening. More specifically, the cracked shear modulus is reduced as the
crack opens. Therefore, Abaqus offers a shear retention model in which the post-cracked shear
stiffness is defined as a function of the opening strain across the crack. (Abaqus, 2012)
GGc
(5.16)
Where Gc, and G stand for post-cracking shear modulus, shear retention factor and shear
modulus, respectively.
Figure 5.21 – Effects of fracture energy of glass. Comparison of load-displacement plots [left];
Comparison of crack patterns [Right] (Bedon and Louter, 2014)

Structural Behaviour of Post-Tensioned Glass Beams 5 - Numerical Analysis
João Pedro Fernandes Olim Neves 46
The brittle shear retention, , varies between 0 and 1; whereas 0 meaning no shear retention
thus full reduction in shear modulus and 1 meaning no reduction at all. This parameter was
already studied in Louter, 2011 and in the conclusions of this study it could be read that when
this parameter was too high (1) it showed highly extensive cracking and when it was too low
(nearly 0) it shown a limited number of cracks. For the particular experiment the most suitable
value was 0.01. Nevertheless, and since the numerical modelling in Louter, 2011 was done in
the software DIANA, and so it wasn’t done in the same software used for the numerical
modelling of this dissertation, it was done a study of this parameter.
It should also be noticed that this value is dependent on the crack strain so it was needed to
define a function where the shear retention varies with the crack strain as in the example seen
in Figure 5.22. (Abaqus, 2012).
Abaqus offers two methods to define the brittle shear. One method is by using a piecewise
linear form (just like in Figure 5.22) and the other is in power law form in which the shear
retention factor varies in uni-linear form (Equation 4.9). Although the parameters to input are
different, both methods characterize the shear behaviour in the same way. Any power law form
can be characterized in a piecewise linear form. To define the brittle shear a power law form
was selected:
p
ck
ck
nnck
nne
ee
-
max
1 (5.17)
Where , 𝑒𝑛𝑛𝑐𝑘 , 𝑒𝑚𝑎𝑥
𝑐𝑘 and p stand for shear retention factor, crack strain, maximum crack strain
and power, respectively.
Figure 5.22 - Shear Retention Factor varies with Crack Strain Opening (eck)

Structural Behaviour of Post-Tensioned Glass Beams 5 - Numerical Analysis
João Pedro Fernandes Olim Neves 47
In order to establish the sensitivity of the FEA to this parameter and to select its most adequate
value for the calibration at hand, a comparative analysis was performed. (Table 5.4 and Figure
5.23)
p eck
max
1 0.1
1 0.01
2 0.1
2 0.01
3 0.1FEM p=3 eck
max=0.1
Analysis
FEM p=1 eck
max=0.1
FEM p=1 eck
max=0.01
FEM p=2 eck
max=0.1
FEM p=1 eck
max=0.01
Table 5.4 – Shear Retention Factor parameter variation
Figure 5.23 – Shear retention factor parameter study
0
0.1
0.2
0.3
0.4
0.5
0.6
0.7
0.8
0.9
1
0 0.02 0.04 0.06 0.08 0.1
Shea
r R
eten
tio
n F
acto
r
Crack Opening Strain
p=1 eckmax=0.1
p=1 eckmax=0.01
p=2 eckmax=0.1
p=2 eckmax=0.01
p=3 eckmax=0.01

Structural Behaviour of Post-Tensioned Glass Beams 5 - Numerical Analysis
João Pedro Fernandes Olim Neves 48
Figure 5.24 - Shear Retention Factor study
After running these analysis, and analysing the Figure 5.24 it was concluded that the power, p,
doesn’t have much influence in the analysis. Regarding the maximum crack strain, 𝑒𝑚𝑎𝑥𝑐𝑘 , the
differences are visible; being the analysis a little stiffer than that of the experiment when 𝑒𝑚𝑎𝑥𝑐𝑘
= 0.1mm, and being less stiff when 𝑒𝑚𝑎𝑥𝑐𝑘 = 0.01mm as it is visible in Figure 5.25. For that
reason it was also done an analysis in which 𝑒𝑚𝑎𝑥𝑐𝑘 = 0.05mm.
Figure 5.25 - Influence of the 𝑒𝑚𝑎𝑥𝑐𝑘
0
5
10
15
20
25
30
35
-30-25-20-15-10-50
Forc
e (k
N)
Displacement (mm)
FEM p=1 eckmax=0.1
FEM p=2 eckmax=0.1
FEM p=1 eckmax=0.01
FEM p=2 eckmax=0.01
FEM p=3 eckmax=0.1
0
5
10
15
20
25
30
35
40
-30-25-20-15-10-50
Forc
e (k
N)
Displacement (mm)
Exp
FEM p=1 eckmax=0.1
FEM p=1 eckmax=0.01

Structural Behaviour of Post-Tensioned Glass Beams 5 - Numerical Analysis
João Pedro Fernandes Olim Neves 49
Figure 5.26 - Comparison between 𝑒𝑚𝑎𝑥𝑐𝑘 =0.1, 𝑒𝑚𝑎𝑥
𝑐𝑘 =0.01 and 𝑒𝑚𝑎𝑥𝑐𝑘 =0.05
The analysis in which 𝑒𝑚𝑎𝑥𝑐𝑘 = 0.05mm was slightly different from that of the 𝑒𝑚𝑎𝑥
𝑐𝑘 = 0.1mm as
it can be observed in Figure 5.26, meaning that this parameter should be smaller. An analysis
with 𝑒𝑚𝑎𝑥𝑐𝑘 = 0.04mm was done. As this analysis was too similar to the one with 𝑒𝑚𝑎𝑥
𝑐𝑘 = 0.04mm
as it can be observed in, from now on all the models should be done with 𝑒𝑚𝑎𝑥𝑐𝑘 = 0.04mm
because it’s less complex and therefore the computational cost is lower.
Figure 5.27 - Difference between 𝑒𝑚𝑎𝑥𝑐𝑘 =0.05 and 𝑒𝑚𝑎𝑥
𝑐𝑘 =0.04
0
5
10
15
20
25
30
35
40
-30-25-20-15-10-50
Forc
e (k
N)
Displacement (mm)
Exp
FEM p=1 eckmax=0.1
FEM p=1 eckmax=0.01
FEM p=1 eckmax=0.05
0
5
10
15
20
25
30
35
-30-25-20-15-10-50
Forc
e (k
N)
Displacement (mm)
FEM p=1 eckmax=0.05
FEM p=1 eckmax=0.04

Structural Behaviour of Post-Tensioned Glass Beams 5 - Numerical Analysis
João Pedro Fernandes Olim Neves 50
5.11.3.3 Brittle Failure
When the direct cracking displacement reaches the value defined as the failure displacement,
the element node fails and all the stress components are set to zero. If all of the material points
in an element fail, the element is removed from the mesh. (Abaqus, 2012)
To model the failure of the model in a rudimentary way, Abaqus has a capability called “Brittle
Failure” criterion. This feature helps in computations by removing an element that can no longer
carry stress. By removing these elements it can be assured that there isn’t the excessive
distortion of those elements and subsequent premature termination of the simulation. This
feature should be handled with care given the fact that whenever the brittle material loses its
ability to carry tensile forces does not preclude it from withstanding compressive stresses.
Therefore, if a material is expected to carry loads after it has failed in tension it’s not appropriate
to remove those elements. (Abaqus, 2012)
The following sentence may be found in Abaqus manual (Abaqus, 2012): “Thus, the effective
use of the brittle failure criterion relies on you having some knowledge of the structural
behavior and potential failure mechanism. The use of the brittle failure criterion based on an
incorrect user assumption of the failure mechanism will generally result in an incorrect
simulation.”
In order to simplify the numerical modelling the brittle failure was set to be at the moment when
the shear retention factor got to zero, i.e., the Brittle Failure was equal to 𝑒𝑚𝑎𝑥𝑐𝑘 in all analysis.
This also goes according to the suggestion given in Abaqus, 2012 regarding the shear retention
factor in which it says that “Zero shear retention should not be used”.

Structural Behaviour of Post-Tensioned Glass Beams 6 - Parametric Study
João Pedro Fernandes Olim Neves 51
6 Parametric Study
In order to increase the load-bear capacity of the post-tensioned glass beam, key parameters
were studied in this document. More parameters could have been studied such as the pre-stress
force used – since the yield strength of the steel is much higher than 200 MPa which is the value
given in (Ruukii, 2014) - different types of adhesives or simply different dimensions for the
beam. Such studies are not present in this thesis due to the time and resources limitations.
This chapter regards the study of two different thicknesses of the adhesive and two different
characterizations of the steel. To perform this study the models were calculated with the
definitions found in Chapter 5.
6.1 Thickness of the Adhesive
Two thickness were chosen; one which the thickness is increased by 25% and another which
the thickness is decreased by 25%. (Table 6.1). The results of the numerical modelling
regarding the calculations with the different thicknesses of the adhesive are shown in Figure
6.1.
Table 6.1 – Thicknesses of the Adhesive studied
100% (Original) 1.5 mm
125% 1.875 mm
75% 1.125 mm
tadhesive
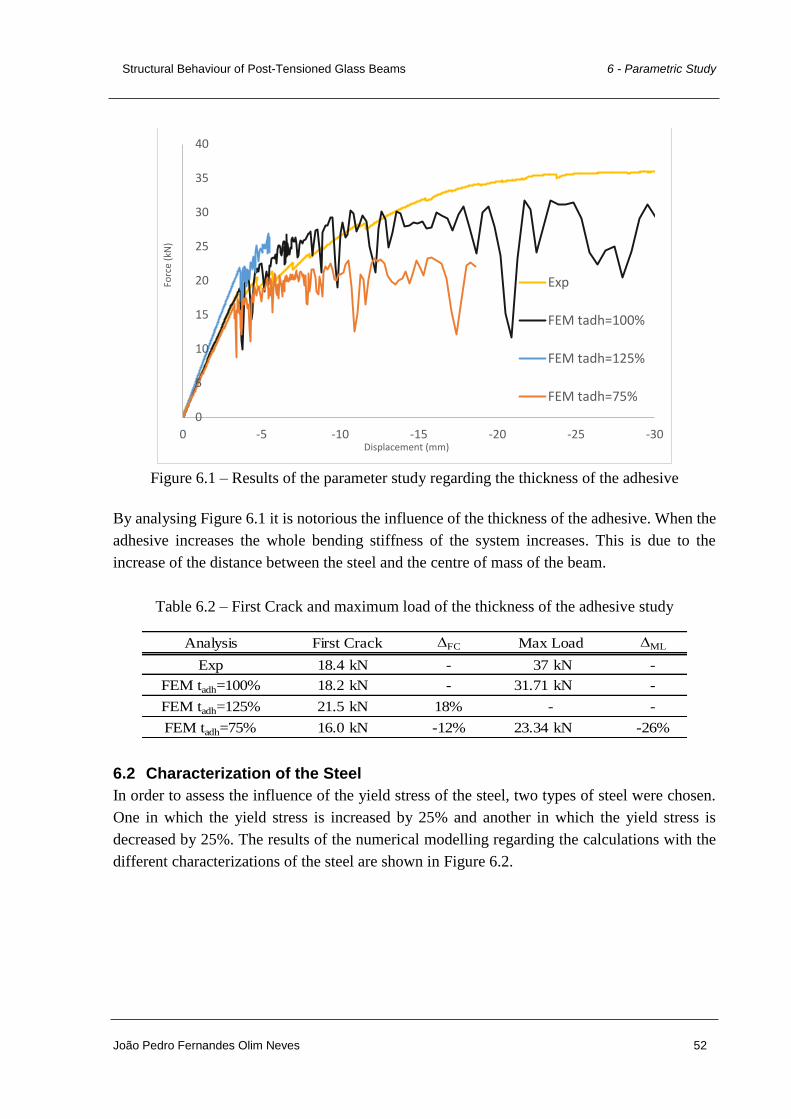
Structural Behaviour of Post-Tensioned Glass Beams 6 - Parametric Study
João Pedro Fernandes Olim Neves 52
Figure 6.1 – Results of the parameter study regarding the thickness of the adhesive
By analysing Figure 6.1 it is notorious the influence of the thickness of the adhesive. When the
adhesive increases the whole bending stiffness of the system increases. This is due to the
increase of the distance between the steel and the centre of mass of the beam.
Table 6.2 – First Crack and maximum load of the thickness of the adhesive study
FC ML
18.4 kN - 37 kN -
18.2 kN - 31.71 kN -
21.5 kN 18% -
16.0 kN -12% 23.34 kN -26%
-
First Crack Max Load
Exp
FEM tadh=100%
FEM tadh=125%
FEM tadh=75%
Analysis
6.2 Characterization of the Steel
In order to assess the influence of the yield stress of the steel, two types of steel were chosen.
One in which the yield stress is increased by 25% and another in which the yield stress is
decreased by 25%. The results of the numerical modelling regarding the calculations with the
different characterizations of the steel are shown in Figure 6.2.
0
5
10
15
20
25
30
35
40
-30-25-20-15-10-50
Forc
e (k
N)
Displacement (mm)
Exp
FEM tadh=100%
FEM tadh=125%
FEM tadh=75%

Structural Behaviour of Post-Tensioned Glass Beams 6 - Parametric Study
João Pedro Fernandes Olim Neves 53
Table 6.3 – Steel study
100% (Original) 550 MPa
125% 687.5 MPa
75% 412.5 MPa
y,steel
Figure 6.2 - Results of the parameter study regarding the characterization of the steel
Table 6.4 - Initial failure and maximum load of the steel characterization study
Max Load
18.4 kN - 37 kN -
18.2 kN - 31.71 kN -
18.2 kN 0% 7%
18.2 kN 0% 24.98 kN -21%FEM y=412.5 Mpa
34.0182
Analysis Initial Failure
Exp
FEM y=550 Mpa
FEM y=687.5 Mpa
By analysing Figure 6.2 it can be concluded that a steel with a yield stress of 412.5 MPa is
unadvised because it lowers significantly the resistance of the beam. However the increase of
the yield stress to 687.5 MPa almost doesn’t change the response of the beam, i.e., the
improvement is less than 10%. Thus, the use of the AISI 304 is highly advised.
0
5
10
15
20
25
30
35
40
-30-25-20-15-10-50
Forc
e (k
N)
Displacement (mm)
Exp
FEM sy=550MPa
FEM sy=687.5MPa
FEM sy=412.5MPa

Structural Behaviour of Post-Tensioned Glass Beams 7 - Conclusions
João Pedro Fernandes Olim Neves 54
7 Conclusions
The purpose of this thesis is the characterization of a specific type of post-tensioned glass
beams. This thesis aimed to contribute to the whole knowledge of a relatively new, feasible and
advantageous product.
The main focus of the thesis was on the preparation of the Finite Element Modelling. The Finite
Element Analysis, as it was proven, represents the experimental results which means that the
correlation between numerical data and experimental data may be obtained. In that Finite
Element Analysis it’s shown that the software used is highly sensitive to some input parameters
and that a significant number of increments are needed. Thus, the machine to perform these
calculations should have high performance settings.
From the parametric study it can be concluded that the increase of thickness of the adhesive is
beneficial so the beam can bear more load, for instance, when the thickness of the adhesive
increases 25%, the first crack only occurs to 21.5 kN which is a load 18% higher than that of
the previous analysis. Regarding the steel characterization it was shown that for a steel in which
the yield stress was higher 25% the maximum load the beam could bore was only 7% higher
than that of the experiments. Thus, the steel used in the experimental campaign may have the
optimal characteristics.
Regarding the pre-stress within the numerical modelling, given that the used software didn’t
have a built-in function regarding this matter, in order to get an accurate stress distribution on
the steel, a variation of temperature of 𝑁
𝐸𝐴×
1
∝ should be used, being N the wanted value of pre-
stress. The variation of temperature has proven to be the most suitable when compared to the
usual force analogy.
7.1 Suggestions for future research
The study on post-tensioned glass beams is not over. To overcome the difficulties of these
beams, more parameters should be studied as it was written before. After the completion of that
study a software can be made in which the user input the load the beam should load and from
an algorithm it should give the user a range of possibilities regarding these parameters that
could fulfil the user’s needs. Last but not least, this study can and should be implemented in the
next European Norm exclusively about glass.

Structural Behaviour of Post-Tensioned Glass Beams 8 - Bibliographic References
João Pedro Fernandes Olim Neves 55
8 Bibliographic References
Abaqus Online Documentation (2012), generated on Monday, February 13, 2012 at 14:58:02.
Dassault Systèmes
Abaqus 6.13 (2013), “Getting Started with Abaqus: Interactive Edition”
Bedon, C, Louter, C. (2014). “Parametric 2D numerical investigation of the structural response
of SG-laminated reinforced glass beams”. Challenging Glass 4 & Cost Action TU0905
Final Conference, pp. 483-490.
Belis, J., Van Hulle, A., Out, B., Bos, F., Callewart, D., Poulis, H. (2011). “Broad screening of
adhesives for glass-metal bonds”. Proceedings of Glass Performance Days, pp. 286-
289.
Bernard, F., Krour, B., Benyoucef, S., Fahsi, B. (2013). “Analysis of the debonding risks and
the failure of laminated glass thanks to a coupled analytical-numerical investigation”.
COST Action TU0905 & Mid-term Conference on Structural Glass, pp. 391-403.
Carter, C., Norton, M. (2007). “Ceramic Materials, Science and Engineering”. 1st Edition.
London, United Kingdom
Copeland, P., Martin, J. (1981). “Story of Glass”. 1st Edition. New York, United States of
America
Dias da Silva, V. (2004). “Mecânica e Resistência dos Materiais”. 3rd Edition. Coimbra,
Portugal
Diaz, M., Miguel, J., Aguirregabiria, B. (2011). “Prestresses Glass Beams”. Glass Performance
Days 2011, pp. 645-649
Feldmann, M., Kasper, R. (2014). “Guidance for European Structural Design of Glass
Components”. Luxembourg, Luxembourg
Froli, M., Lani, L. (2010). “Glass tensegrity trusses”. Structural Engineering International 2010,
pp. 436-441

Structural Behaviour of Post-Tensioned Glass Beams 8 - Bibliographic References
João Pedro Fernandes Olim Neves 56
Froli, M, Mamone, V. (2014). “A 12 meter long segmented post-tensioned steel-glass beam
(TVT gamma). Challenging Glass 4 & Cost Action TU0905 Final Conference, pp. 243-
251.
Haldimann, M., Luible, A., Overend, M. (2008), “Structural Use of Glass”. Zurich, Switzerland
Huntsman (2013). Araldite 2047-1, Methacrylate adhesive requiring minimal surface
pretreatment. Technical data sheet.
Jordão, S., Pinho, M., Martins, J.P, Santiago, A. (2014), “Numerical modelling of laminated
glass beam reinforced with pre stressed cables”. Challenging Glass 4 & Cost Action
TU0905 Final Conference, pp. 253-260.
Kennedy, R. (1997), “The History and the Future of the Flat Glass Industry”. Glass Processing
Days, pp. 28-36.
Lawn, B. (1993). “Fracture of Brittle Solids”. 2nd Edition. Cambridge, United Kingdom.
Louter, C. (2011). “Fragile yet Ductile, Structural Aspects of Reinforced Glass Beams”. PhD
Thesis. Technische Universiteit Delft
Louter, C. (2013). “Reinforced and post-tensioned glass beams”. Glass Performance Days
2013, pp. 353-355.
Louter, C., Nielsen, J.H. (2013). “Numerical analysis of the effect of SG-interlayer shear
stiffness on the structural performance of reinforced glass beams. COST Action
TU0905 & Mid-term Conference on Structural Glass, pp. 405-412
Mashayekhi@ 2013.
http://mashayekhi.iut.ac.ir/sites/mashayekhi.iut.ac.ir/files//u32/presentation4.pdf.
Slides from a FEM classroom taken from the website of Professor Dr. Mohammad
Mashayekhi
Nhamoinesu, S., Overend, M. (2012). “The Mechanical Performance of Adhesives for a Steel-
Glass Composite Façade System” Challenging Glass 3 – Conference on Architectural
Structural Applications of Glass, pp. 293-306

Structural Behaviour of Post-Tensioned Glass Beams 8 - Bibliographic References
João Pedro Fernandes Olim Neves 57
Reynolds, L. @ (2009), https://www.flickr.com/photos/lwr/3558879983/. Crown Glass photo
found in flickr (Website consulted on Nov 15, 2013)
Ruukki@ (2014). http://www.ruukki.com/Products-and-solutions/Stainless-steel-and-
aluminium-products/Stainless-steel-flat-products/Stainless-steel-1430114307-cold-
rolled. Stainless steel 1.4301/1.4307 cold-roller Properties (Website consulted on Feb
25, 2014)
Stelzer, I. (2010). “High Performance Laminated Glass”. Challenging Glass 2 – Conference on
Architectural and Structural Applications of Glass, pp. 467-474
Twisp’s Wikipedia@ (2008).
http://commons.wikimedia.org/wiki/File:Fracture_modes_v2.svg. Three fracture
modes. (Website consulted on Jun 27, 2014)
Valarinho, L. (2010). “Construção em Vidro Estrutural, Comportamento estrutural de vigas
mistas vidro-GFRP”. Tese de Mestrado. Instituto Superior Técnico, Lisboa.
Weller, B., Engelmann, M. (2014). “Deformation of Spannglass beams during post-tensioning”.
Challenging Glass 4 & Cost Action TU0905 Final Conference, pp. 285-294.
Wurm, J. (2007). “Glass Structures: Design and Construction of Self Supporting Skins”. Basel,
Boston, Berlin