Embed Size (px)
Citation preview
Portland State University Portland State University
PDXScholar PDXScholar
Dissertations and Theses Dissertations and Theses
Fall 12-8-2017
Structural Behavior of Lap Shear Connections with Structural Behavior of Lap Shear Connections with
Thermally Insulating Filler Plates Thermally Insulating Filler Plates
Salih Qasim Mahmood Portland State University
Follow this and additional works at: https://pdxscholar.library.pdx.edu/open_access_etds
Part of the Civil and Environmental Engineering Commons
Let us know how access to this document benefits you.
Recommended Citation Recommended Citation Mahmood, Salih Qasim, "Structural Behavior of Lap Shear Connections with Thermally Insulating Filler Plates" (2017). Dissertations and Theses. Paper 4159. https://doi.org/10.15760/etd.6047
This Thesis is brought to you for free and open access. It has been accepted for inclusion in Dissertations and Theses by an authorized administrator of PDXScholar. Please contact us if we can make this document more accessible: [email protected].
Behavior of Lap Shear Connections with Thermally Insulating Filler Plates
by
Salih Qasim Mahmood
A thesis submitted in partial fulfillment of the
requirements for the degree of
Master of Science
in
Civil and Environmental Engineering
Thesis Committee:
Thomas Schumacher, Chair
Peter Dusicka
Hormoz Zarah
Portland State University
2017

© 2017 Salih Qasim Mahmood
i
Abstract
This research consists of experimental load tests and numerical simulations of structural
steel connections with various filler materials to study the effect of non-steel fillers on the
connection strength. Non-steel fillers are used in the steel connections to provide thermal
insulation by reducing thermal bridging. Eight specimens having steel and polypropylene
filler plates of various thicknesses were tested in the laboratory. The collected data were
compared to a Finite Element Analysis (FEA) using ABAQUS to validate the numerical
results. After validation, three parametric studies were conducted using ABAQUS to
provide insight into general behavior of connections with a variety of fillers that could be
used as thermal breaks. In addition, an extreme case of having air gaps instead of alternative
fillers was also considered.
The Research Council on Structural Connections (RCSC 2014) suggests a reduction in the
bolt shear strength when undeveloped fillers with a thickness of more than 0.25 inch are
used while using any non-steel material is prohibited due the limited research available.
Most research studies have investigated the mechanical behavior of thermal breaks in either
end-plate moment connections or slip-critical connections. No data is available for thermal
breaks in bearing-type connections up to failure.
This research aims to study the effects of filler material properties such as modulus of
elasticity and strength on bolt strength, as well as investigate whether the current equation
in RCSC 2014 is applicable for alternative filler materials like polypropylene that has less
than 0.5% of the steel modulus of elasticity and less than 10% of steel strength.

ii
Acknowledgment
This work would not have the spirit it has without the guidance and support provided by
my academic advisor Dr. Thomas Schumacher. First and foremost, I would like to show
my sincere gratitude to Dr. Schumacher for his expert advice, immense knowledge,
encouragement, motivation and for funding the experimental test. Throughout the rough
road to finish this thesis, Dr. Schumacher’s support was not limited to the academic
assistantship only, but also emotionally.
I would like to extend my gratitude to my thesis committee member Dr. Peter Dusicka for
his ideas and feedback. I would also like to thank committee member Dr. Hormoz Zareh
for his invaluable advice. The knowledge I gained from his classes along with his advice
were of great help in numerous aspects of this research.
I would like to thank the Higher Committee of Education Development in Iraq (HCED)
for giving me this scholarship and the opportunity to pursue my Master’s degree. I would
also like to thank Portland State University for their financial support.
I would like to further thank my friends and colleagues: Leah Goeres, Mohamed Saud,
Ali Hafiz, Anas Yosefani, Mohammed Al-Saedi, Hayder Al-Khafaji, Wisam Abdulkader,
Hosam Al Azzawi, Yasir Saeed, Jim Morud and Kevin Cady for their help and support
through various stages of this research.
Lastly, special thanks to my family for their continuous love, encouragement, and support
throughout my life and studies. Their enthusiasm and belief in me is the greatest gift
anyone has ever given me.
iii
Contents
Abstract ....................................................................................................................................... i
Acknowledgment ....................................................................................................................... ii
List of Figures: ............................................................................................................................ v
List of Tables: .......................................................................................................................... viii
1 Introduction ....................................................................................................................... 1
1.1 Background ................................................................................................................ 1
1.2 Objectives .................................................................................................................. 5
2 Literature review ................................................................................................................ 6
2.1 Steel Fillers ................................................................................................................ 6
2.2 Thermal Breaks ........................................................................................................ 14
2.3 Summary .................................................................................................................. 18
2.4 Objectives and Motivation ....................................................................................... 18
3 Experimental program ..................................................................................................... 19
3.1 Test Matrix and Specimen Layout ........................................................................... 19
3.2 Instrumentation ........................................................................................................ 24
3.3 Test Setup ................................................................................................................ 25
3.4 Bolt-clamping force ................................................................................................. 26
4 Experimental results ........................................................................................................ 28
4.1 Slip Resistance ......................................................................................................... 30
4.2 Ultimate Strength ..................................................................................................... 31
5 Finite Element Analysis .................................................................................................... 35
5.1 Introduction .............................................................................................................. 35
5.2 Model 1 .................................................................................................................... 35
5.3 Model 2 .................................................................................................................... 37
5.4 Model Simplification ............................................................................................... 37
5.5 Elements and Staging ............................................................................................... 39
5.6 Modeling of Bolts and Plates ................................................................................... 40
5.7 Modeling of Contact Surfaces.................................................................................. 42
iv
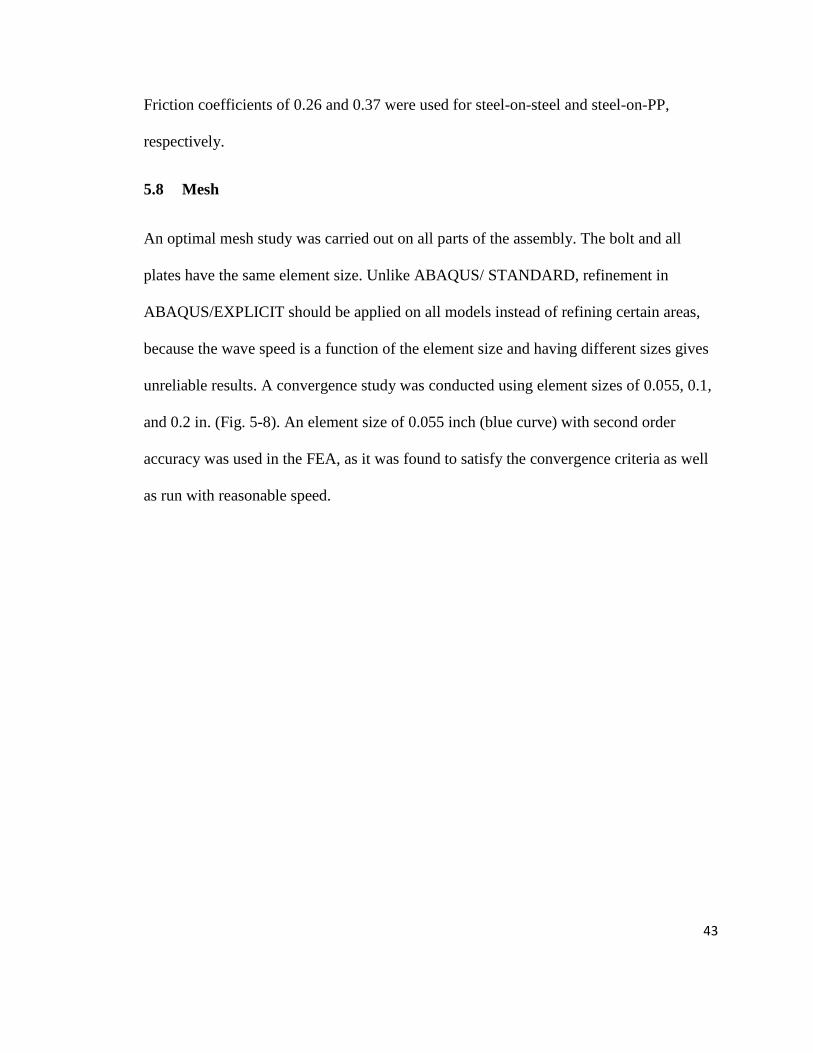
5.8 Mesh ......................................................................................................................... 43
5.9 Material properties ................................................................................................... 45
5.10 Load and Boundary Conditions ............................................................................... 49
6 Finite Element Analysis .................................................................................................... 51
6.1 Validation of FEA Models. ...................................................................................... 51
6.2 Validation of FEA Models for Steel Filler Plates .................................................... 61
6.3 Comparison with Code Design Equation ................................................................. 65
7 Parametric Study .............................................................................................................. 69
7.1 Air Gap Fillers ......................................................................................................... 69
7.2 Ultimate Strength ..................................................................................................... 73
7.3 Modulus of Elasticity ............................................................................................... 75
7.4 Stiffening the Splice Plates ...................................................................................... 77
7.5 Summary .................................................................................................................. 81
8 Summary and Conclusions ............................................................................................... 83
9 Future Work ..................................................................................................................... 86
10 References ....................................................................................................................... 87
A- Appendix A: Experimental results .................................................................................... 90
B- Appendix B: Finite Element Analysis ................................................................................ 91
v
List of Figures:
Fig. 1-1: Thermal bridges in a balcony. .......................................................................................... 2
Fig. 1-2: Sketch showing a thermal break in the steel connection of a balcony. ............................ 3
Fig. 1-3: HSS – wide-flange beam connection. .............................................................................. 4
Fig. 1-4: Hypothetical case of a steel connection with gaps. .......................................................... 5
Fig. 2-1: Assembly layout used in Dusicka and Lewis (2010). ...................................................... 9
Fig. 2-2: Load vs. deformation for different filler cases. From Dusicka and Lewis (2010). .......... 9
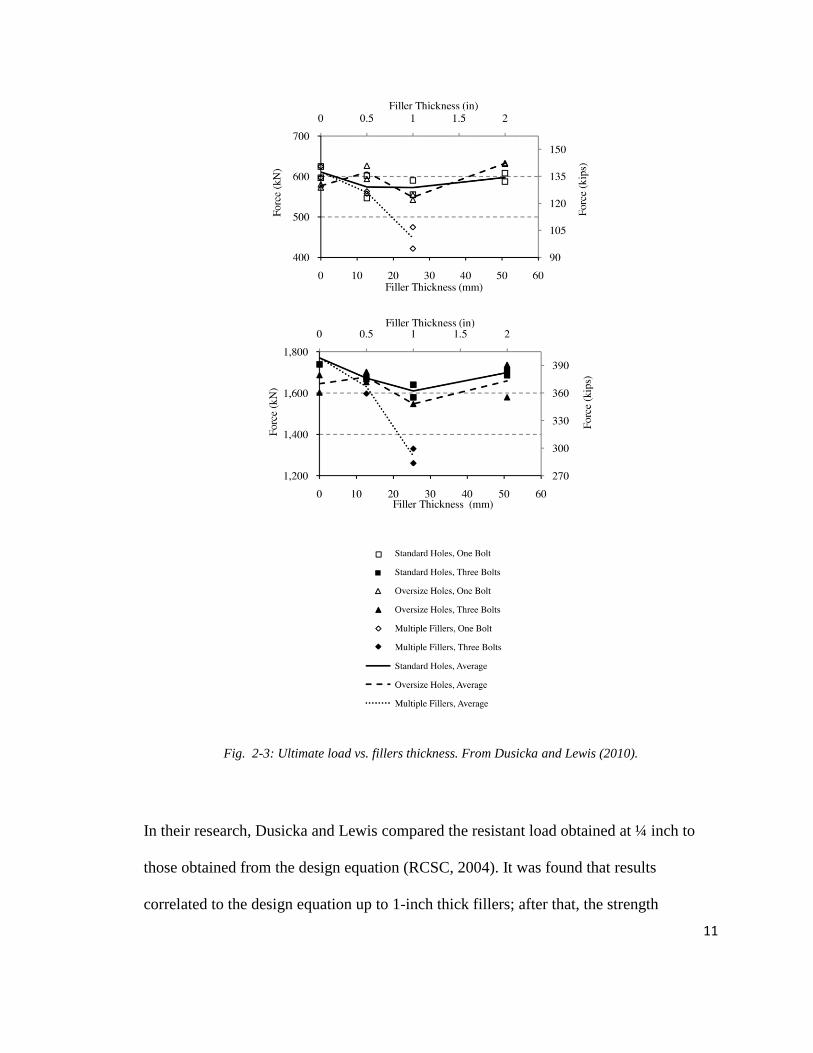
Fig. 2-3: Ultimate load vs. fillers thickness. From Dusicka and Lewis (2010). ........................... 11
Fig. 2-4: Normalized load vs. filler thickness compared to the design equation in RCSC (2001).
....................................................................................................................................................... 12
Fig. 3-1: Test specimens. .............................................................................................................. 20
Fig. 3-2: Sketch showing the tested steel connection specimen with fillers. ................................ 22
Fig. 3-3: RCSC (2004) test coupon. .............................................................................................. 23
Fig. 3-4: Photo of universal testing machine. ............................................................................... 23
Fig. 3-5: Test specimen with LVDTs............................................................................................ 24
Fig. 3-6: Photo showing specimens with strain gauge locations. ................................................. 25
Fig. 3-7: Bolt clamping force test for a sandwich of Fig. 3-8: Direct tension indicators.
....................................................................................................................................................... 27
Fig. 3-9: Orange indicator appearing around the DTI washers when load reached 38 kips. ........ 27
Fig. 3-10: Sample bolt clamping force vs. time. ........................................................................... 28
Fig. 4-1: Load vs. deformation curves for four select specimens from each test group. .............. 29
Fig. 4-2: Bolts after testing connections to failure. ....................................................................... 29
Fig. 4-3: Ultimate load vs. filler thickness (all tests). ................................................................... 31
Fig. 4-4: Normalized load at 0.25 inch deformation compared to the design equation (dashed
line). ............................................................................................................................................... 33
Fig. 4-5: Normalized ultimate load compared to the design equation (dashed line). ................... 34
Fig. 4-6: Normalized load compared to Dusicka and Lewis’ (2010) Eq. ..................................... 34
Fig. 5-1: Example of one-bolt portion of steel connection with 1-inch PP fillers ........................ 36
Fig. 5-2: RCSC coupon. ................................................................................................................ 37
Fig. 5-3: FEA Model ..................................................................................................................... 38
Fig. 5-4: C3D8R element used for all FEA. ................................................................................. 39
Fig. 5-5: Half-bolt model geometry. ............................................................................................. 40
Fig. 5-6: Bolted assembly with bolt in reverse bearing. ............................................................... 41
Fig. 5-7: plates geometry. ............................................................................................................. 41
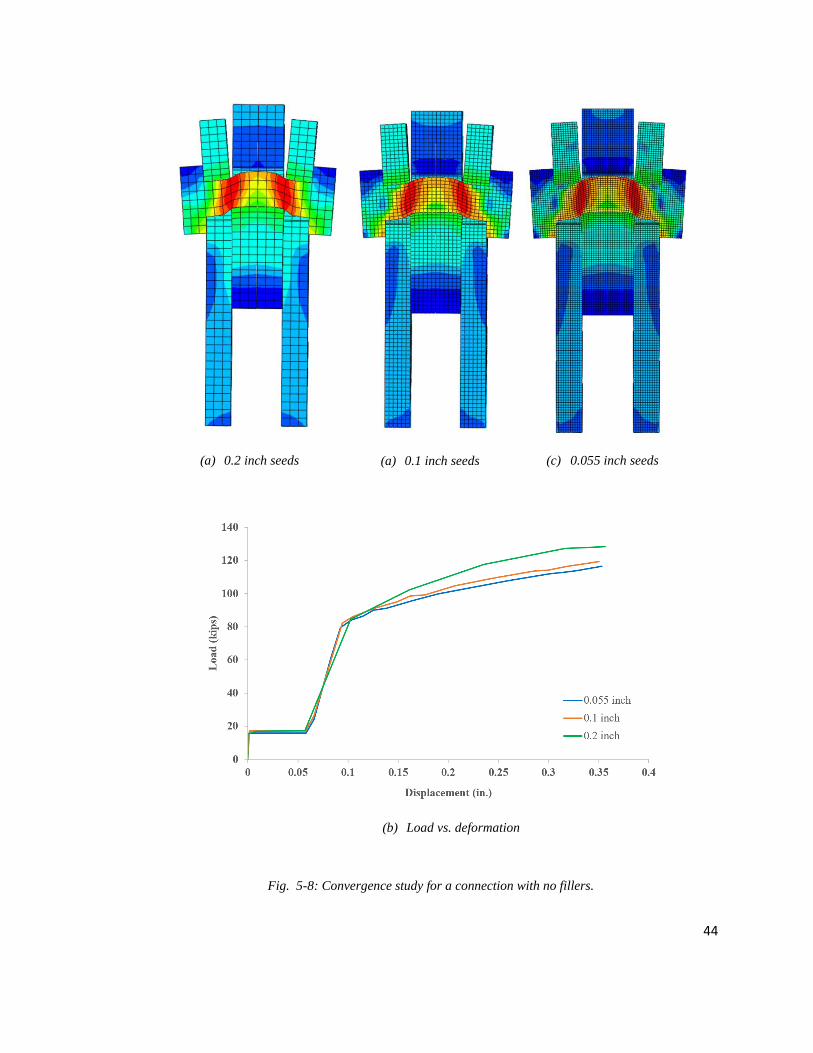
Fig. 5-8: Convergence study for a connection with no fillers. ...................................................... 44
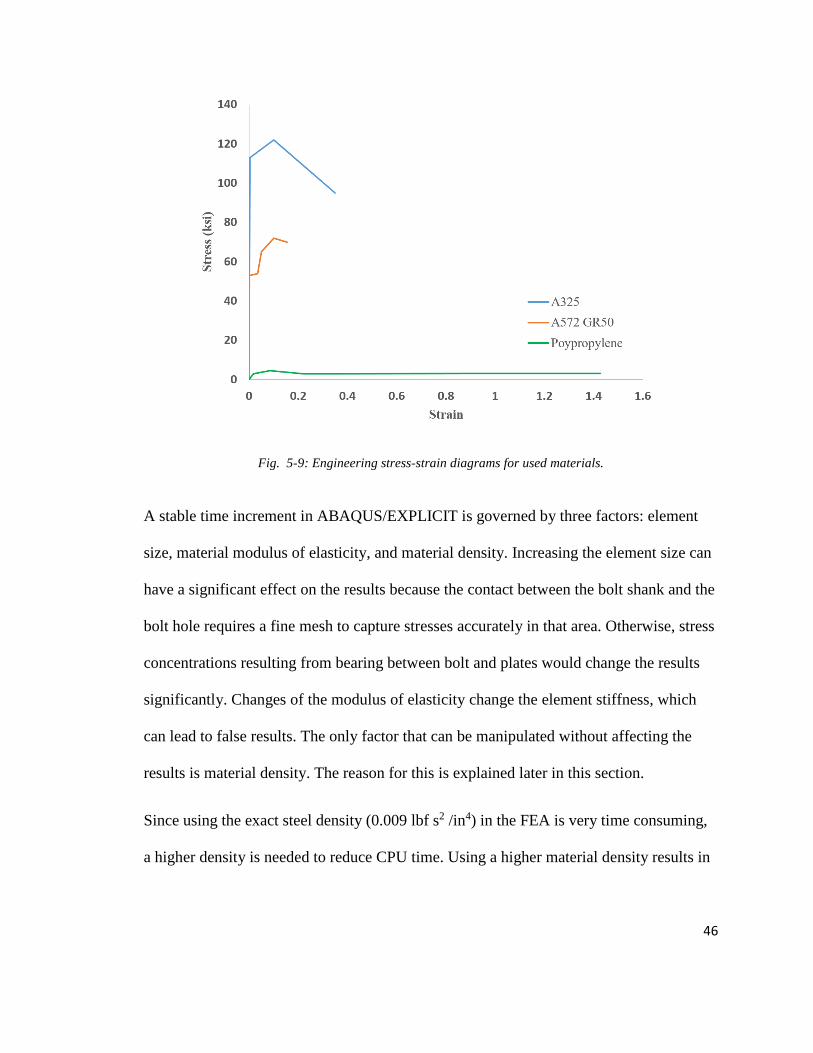
Fig. 5-9: Engineering stress-strain diagrams for used materials. .................................................. 46
Fig. 5-10: Mass sensitivity study for a bolted connection with no fillers. .................................... 49
Fig. 5-11: Boundary conditions of a bolted connection with ½ steel filler plates. ....................... 50
Fig. 6-1: FEA and experimental results for load-deformation curves for no-filler specimen. ...... 52
Fig. 6-2: FEA and experimental results for load-deformation curves for ½” steel filler plate
specimen. ....................................................................................................................................... 53
vi
Fig. 6-3: FEA and experimental results for load-deformation curves for ½ PP filler plate
specimen. ....................................................................................................................................... 53
Fig. 6-4: FEA and experimental results for load-deformation curves for 1” PP filler plate
specimen. ....................................................................................................................................... 54
Fig. 6-5: Comparison of ultimate connections strength for all test specimens. Both experimental
and FEA results are shown for comparison. .................................................................................. 55
Fig. 6-6: Comparison of force in connection at 0.25 inch deformation for all test specimens. Both
experimental and FEA results are shown for comparison. ............................................................ 56
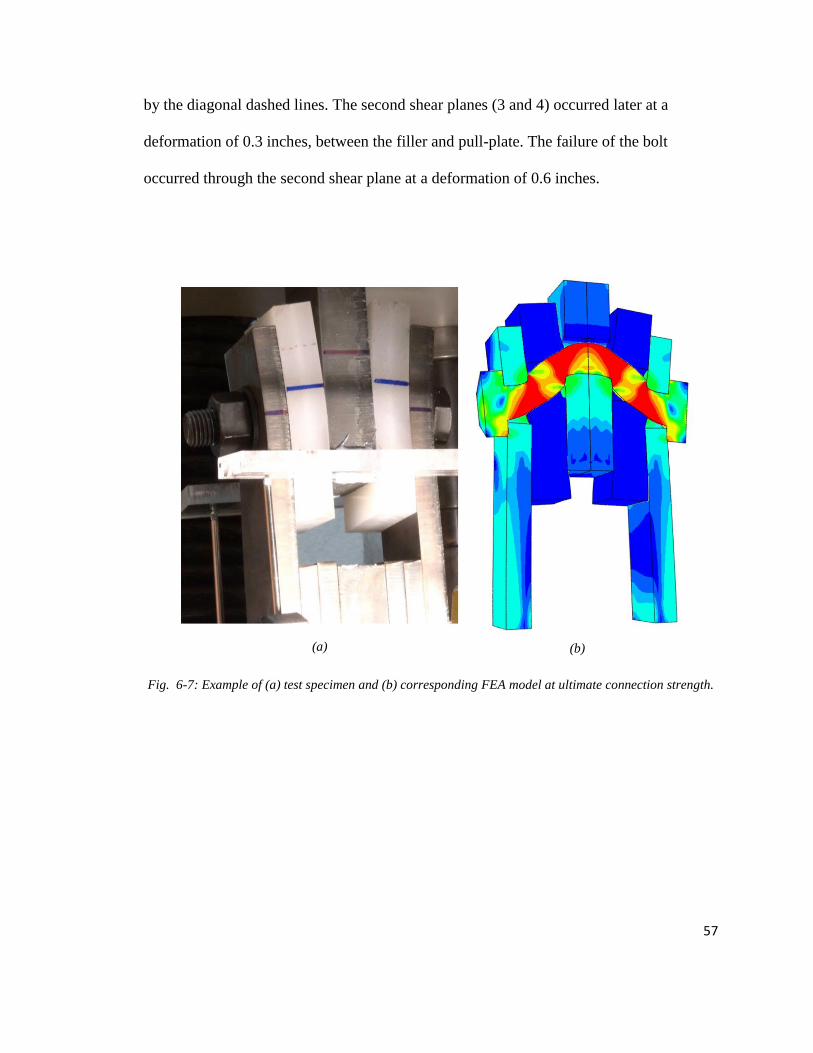
Fig. 6-7: Example of (a) test specimen and (b) corresponding FEA model at ultimate connection
strength. .......................................................................................................................................... 57
Fig. 6-8: Example of (a) bolt and (b) corresponding FEA model at ultimate connection strength.
....................................................................................................................................................... 58
Fig. 6-9: Example of connection with ½-inch steel fillers shows: ................................................ 59
Fig. 6-10: Example of connections with ½-inch fillers shows the deformation in the bolt hole of:
(a) PP fillers (b) Steel fillers. ......................................................................................................... 60
Fig. 6-11:Catenary mechanism: (a) PP fillers (b) Steel fillers. ..................................................... 60
Fig. 6-12: load vs deformation for four assemblies with different filler thicknesses. ................... 62
Fig. 6-13: Bolt deformation of connection with ½ inch steel filler plates. ................................... 62
Fig. 6-14: Connection with ½ inch steel filler plates. ................................................................... 63
Fig. 6-15: Connection with 1 inch steel filler plates. .................................................................... 63
Fig. 6-16: FEA results for assemblies with 2 steel filler. .............................................................. 64
Fig. 6-17: Normalized ultimate strength and design equation (RCSC 2014). .............................. 65
Fig. 6-18: Normalized ultimate strength and Dusicka and Lewis (2010) reduction equation. ..... 66
Fig. 6-19: Normalized ultimate strength at 0.25 in deformation and Frank and Yura’s (1981)
reduction equation. ......................................................................................................................... 66
Fig. 7-1: Ultimate strength vs. filler thickness for air gaps compared to steel and PP filler plates.
....................................................................................................................................................... 70
Fig. 7-2: Load at 0.25 in. deformation vs. filler thickness for air gaps compared to steel and PP
filler plates. .................................................................................................................................... 70
Fig. 7-3: FEA models (deformed) of three types of connections when ultimate strength is
reached. Colors in the bolts show the shear stress. ........................................................................ 72
Fig. 7-4: Filler plate materials with varying strength. ................................................................... 73
Fig. 7-5: FEA predicted ultimate strength vs. filler plate thickness for varying filler plate
strengths. ........................................................................................................................................ 74
Fig. 7-6: FEA predicted load at 0.25 inch deformation vs. filler plate thickness for varying filler
plate strengths. ............................................................................................................................... 74
Fig. 7-7: ) Filler plate materials with varying modulus of elasticity. ............................................ 75
Fig. 7-8: FEA predicted ultimate strength vs. filler plate thickness for varying filler plate moduli
of elasticity. .................................................................................................................................... 76
Fig. 7-9: FEA predicted load at 0.25 inch deformation vs. filler plate thickness for varying filler
plate moduli of elasticity. ............................................................................................................... 76
Fig. 7-10: three bolt connection with filler shows two different bolt groups................................ 77
Fig. 7-11: Example of an FEA model with restraint of the splice plate along z-axis. .................. 78
vii
Fig. 7-12 Example of (a) connection with stiffened splice plates and (b) connection with
unstiffened splice plates for 1 inch PP filler. ................................................................................. 79
Fig. 7-13: Load at 0.25 inch deformation vs. filler thickness for connections with PP fillers with
and without stiffening. ................................................................................................................... 80
Fig. 7-14: Ultimate load vs. filler thickness for connections with PP fillers with and without
stiffening. ....................................................................................................................................... 80
Fig. 7-15: FEA predicted ultimate strength vs. filler plate thickness compared with the code
equation. ......................................................................................................................................... 81
Fig. 7-16: FEA predicted ultimate strength vs. filler plate thickness compared with the Dusicka
and Lewis (2010) equation. ............................................................................................................ 81
Fig. 7-17: FEA predicted load at 0.25 inch deformation vs. filler plate thickness compared with
the Frank and Yura’s (1981) equation. .......................................................................................... 82
Fig. 7-18: Summary for the connections deformation with different filler thickness and material.
....................................................................................................................................................... 82
Fig. A-1: Experimental results of load vs. deformation for steel connection with different
material. ......................................................................................................................................... 90
Fig. B-1: FEA results of load vs. deformation for connection with steel fillers. .......................... 91
Fig. B-2: FEA results of load vs. deformation for connection with Polypropylene fillers. ......... 91
Fig. B-3: FEA results of load vs. deformation for connection with Air Gap. ............................... 92
Fig. B-4: FEA results of load vs. deformation for connection with fillers that have 50% of steel
Strength. ......................................................................................................................................... 92
Fig. B-5: FEA results of load vs. deformation for connection with fillers that have 25% of steel
Strength. ......................................................................................................................................... 93
Fig. B-6: FEA results of load vs. deformation for connection with fillers that have 50% of steel
modulus of elasticity. ..................................................................................................................... 93
Fig. B-7: FEA results of load vs. deformation for connection with fillers that have 25% of steel
modulus of elasticity. ..................................................................................................................... 94
Fig. B-8: 1/2 inch PP fillers vs. connection with Stiffened splice plate. ....................................... 94
Fig. B-9: 1 inch PP filler vs. connection with Stiffened splice plate. ........................................... 95
Fig. B-10: 2 inch PP vs. connection with Stiffened splice plate. .................................................. 95
viii
List of Tables:
Table 2-1: Properties of thermal materials used by Cleary (2016). ......................................... 16
Table 3-1: Test matrix .............................................................................................................. 19
Table 3-2: Thermal conductivity of different materials. .......................................................... 20
Table 4-1: Test slip coefficients. .............................................................................................. 30
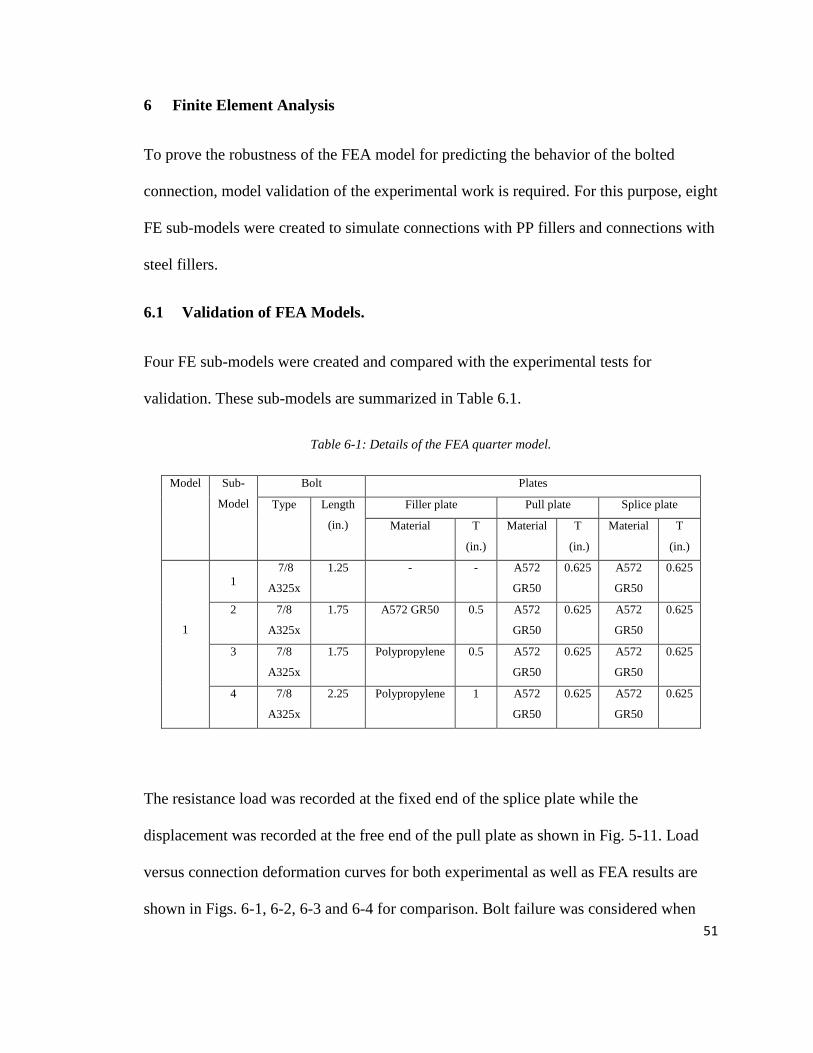
Table 6-1: Details of the FEA quarter model. .......................................................................... 51
Table 6-2: Details of the FEA models used for model validation............................................ 61
Table 6-3: FEA vs. reduction equations................................................................................... 67

1
1 Introduction
1.1 Background
Global warming is one of the biggest issues threatening our planet. It is the result of
an increasing percentage of greenhouse gases (GHG) in the atmosphere, which have
the ability to absorb radiation, especially carbon dioxide. Since 1750, the beginning
of the first industrial revolution, humans have participated in increasing the
percentage of carbon dioxide up to 40% according to the Earth Research System
Laboratory. A study by Mora, C. (2013), shows that the earth’s temperature will hit
new historical records, if the rate of GHG emissions stays constant. One major
contributor to global warming comes from the energy spent to compensate for heat
loss, which elevates the percentage of GHG (greenhouse gases) in the atmosphere.
Heat loss is a common problem in most buildings. In addition to the environmental
effects, it has economic effects. Reducing heat loss in buildings could be
economically advantageous in the long run.
Heat loss can take place in buildings in many ways, through structural and
nonstructural elements. One of the major contributors in buildings’ heat loss is
thermal bridging.
A study by Valério (2007), demonstrated that about 20% of the heat lost is caused by
thermal bridging. Therefore, there are many projects in this field to mitigate the effect
of thermal bridges. The term thermal bridge refers to a structure’s element that has a
2
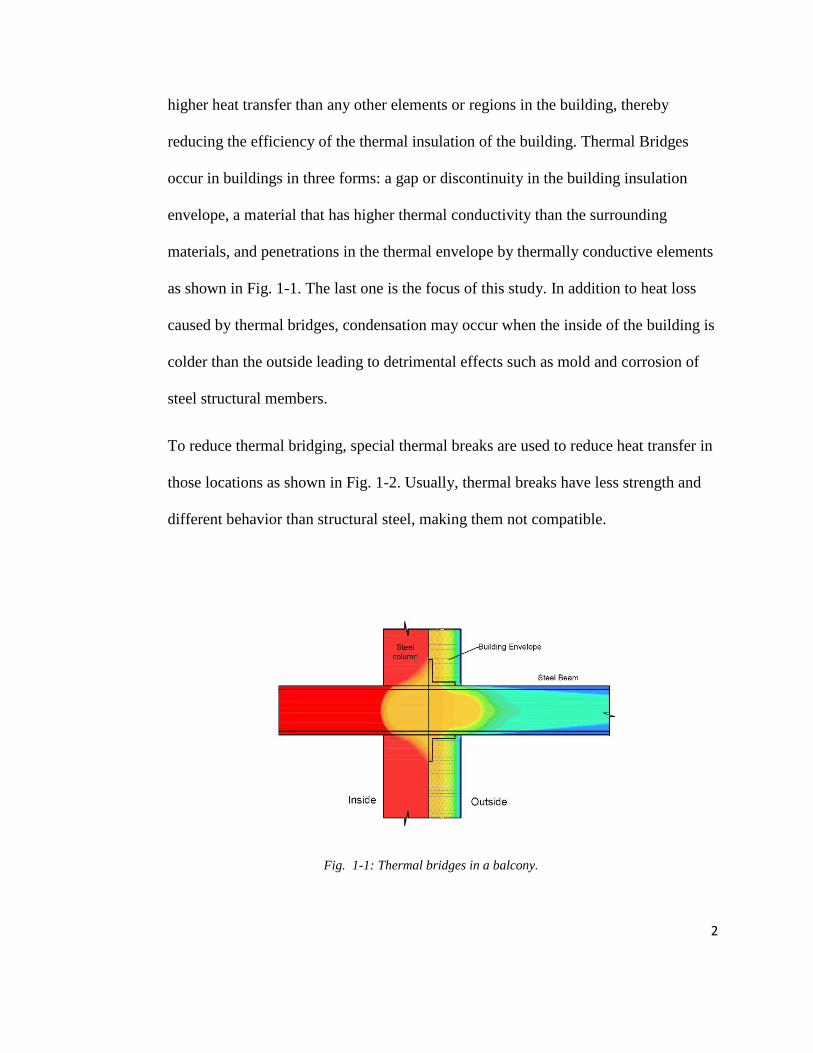
higher heat transfer than any other elements or regions in the building, thereby
reducing the efficiency of the thermal insulation of the building. Thermal Bridges
occur in buildings in three forms: a gap or discontinuity in the building insulation
envelope, a material that has higher thermal conductivity than the surrounding
materials, and penetrations in the thermal envelope by thermally conductive elements
as shown in Fig. 1-1. The last one is the focus of this study. In addition to heat loss
caused by thermal bridges, condensation may occur when the inside of the building is
colder than the outside leading to detrimental effects such as mold and corrosion of
steel structural members.
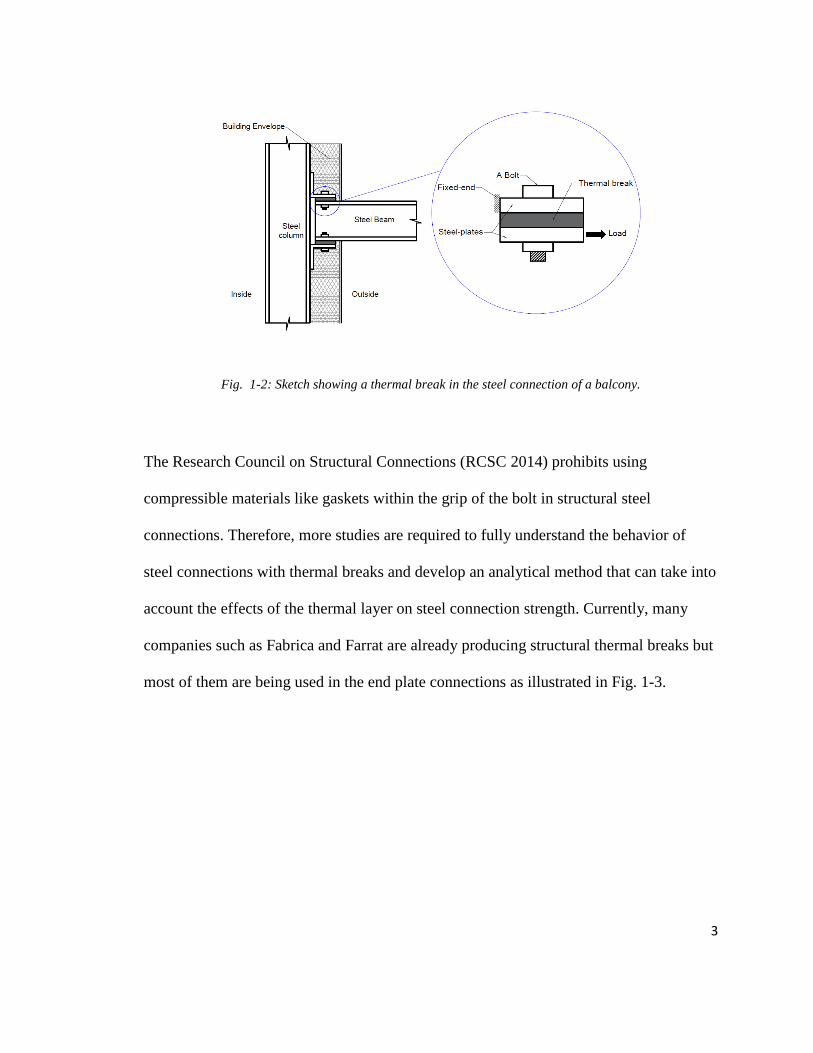
To reduce thermal bridging, special thermal breaks are used to reduce heat transfer in
those locations as shown in Fig. 1-2. Usually, thermal breaks have less strength and
different behavior than structural steel, making them not compatible.
Fig. 1-1: Thermal bridges in a balcony.
3
Fig. 1-2: Sketch showing a thermal break in the steel connection of a balcony.
The Research Council on Structural Connections (RCSC 2014) prohibits using
compressible materials like gaskets within the grip of the bolt in structural steel
connections. Therefore, more studies are required to fully understand the behavior of
steel connections with thermal breaks and develop an analytical method that can take into
account the effects of the thermal layer on steel connection strength. Currently, many
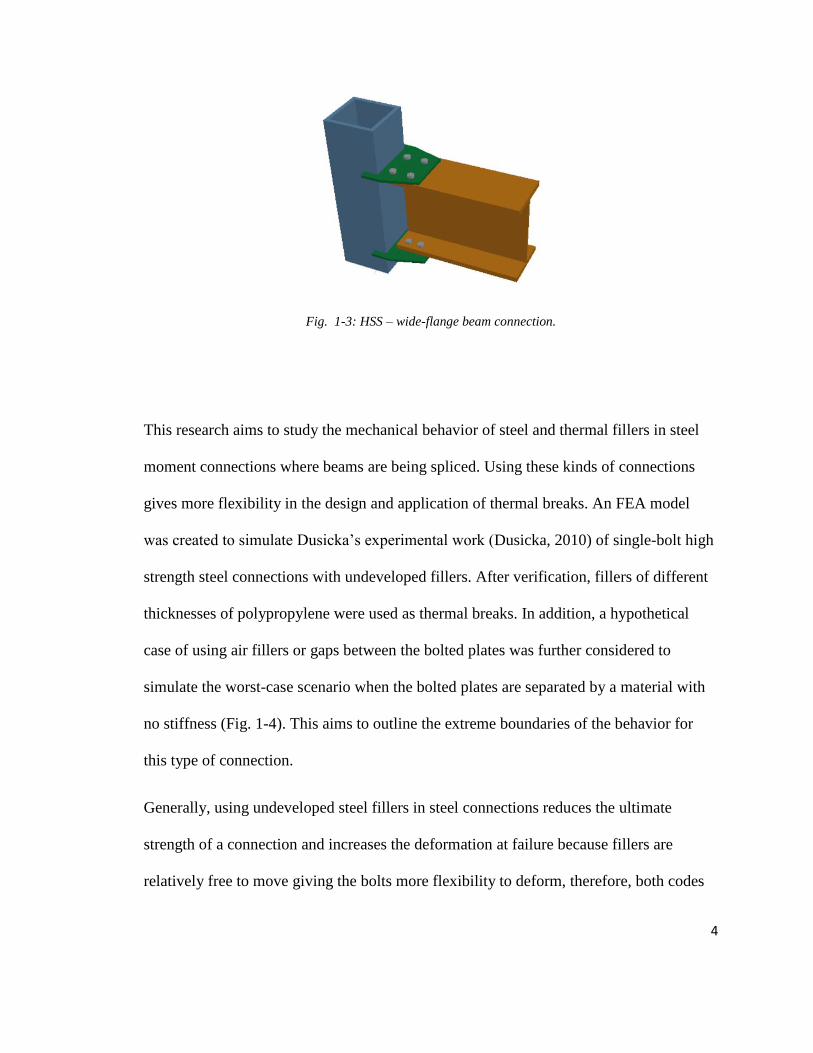
companies such as Fabrica and Farrat are already producing structural thermal breaks but
most of them are being used in the end plate connections as illustrated in Fig. 1-3.
4
Fig. 1-3: HSS – wide-flange beam connection.
This research aims to study the mechanical behavior of steel and thermal fillers in steel
moment connections where beams are being spliced. Using these kinds of connections
gives more flexibility in the design and application of thermal breaks. An FEA model
was created to simulate Dusicka’s experimental work (Dusicka, 2010) of single-bolt high
strength steel connections with undeveloped fillers. After verification, fillers of different
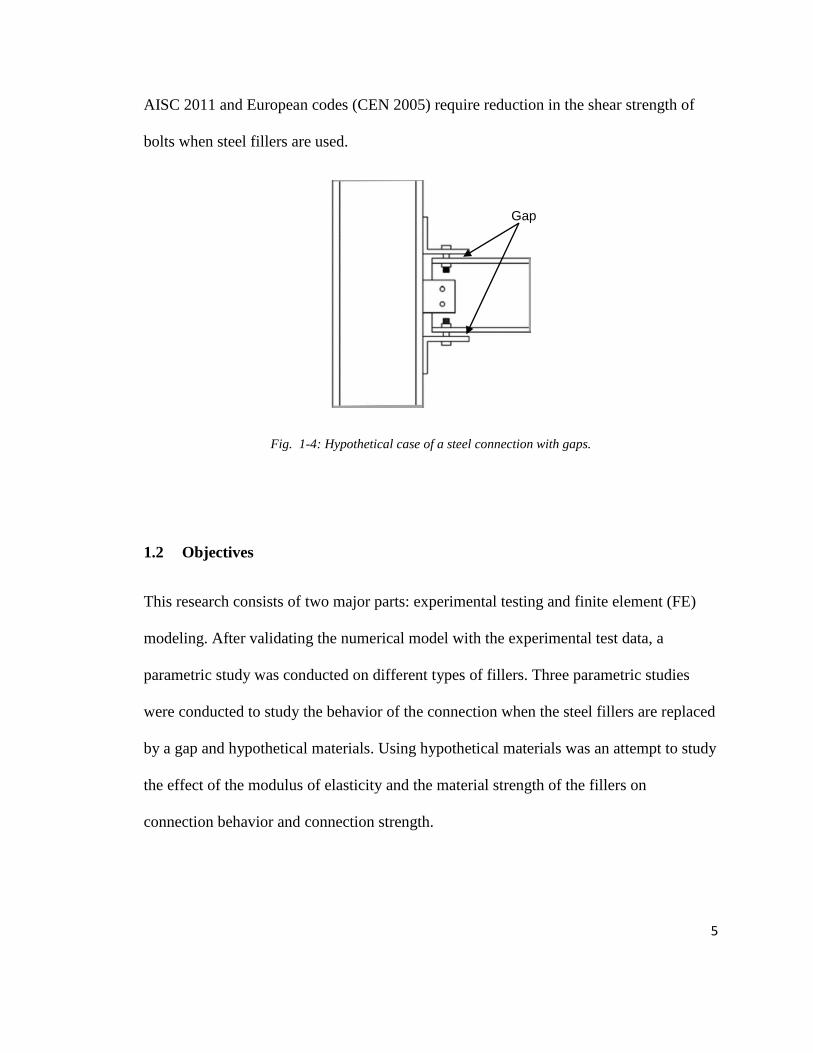
thicknesses of polypropylene were used as thermal breaks. In addition, a hypothetical
case of using air fillers or gaps between the bolted plates was further considered to
simulate the worst-case scenario when the bolted plates are separated by a material with
no stiffness (Fig. 1-4). This aims to outline the extreme boundaries of the behavior for
this type of connection.
Generally, using undeveloped steel fillers in steel connections reduces the ultimate
strength of a connection and increases the deformation at failure because fillers are
relatively free to move giving the bolts more flexibility to deform, therefore, both codes
5
AISC 2011 and European codes (CEN 2005) require reduction in the shear strength of
bolts when steel fillers are used.
Fig. 1-4: Hypothetical case of a steel connection with gaps.
1.2 Objectives
This research consists of two major parts: experimental testing and finite element (FE)
modeling. After validating the numerical model with the experimental test data, a
parametric study was conducted on different types of fillers. Three parametric studies
were conducted to study the behavior of the connection when the steel fillers are replaced
by a gap and hypothetical materials. Using hypothetical materials was an attempt to study
the effect of the modulus of elasticity and the material strength of the fillers on
connection behavior and connection strength.
Gap
6
2 Literature review
2.1 Steel Fillers
Fisher and Lee (1968), studied the effects of fillers on slip strength by using circular and
rectangular washers and plates. Using washers was also an attempt to simulate the effect
of out-of-flatness that might occur in the flat plates due to various reasons such as
shearing, punching or welding during installation or fabrication. The main purpose of this
study was to determine whether full contact is required over the entire faying surface. A
series of thirty-six bolted connections were tested with circular and rectangular washers
with fifteen joints that had clean mill scales on all their surfaces. All joints were
fabricated from 1-inch A36 steel plate connected by 7/8-A325 bolts. For the case of clean
mill scale, slip strength was found to drop by 12% to 32%, when washers were used. For
blast clean joints, the insertion of 3 ½-inch diameter washers between the faying surfaces
of the blast cleaned joints and reduced the slip resistance from 56% to 72%. Rectangular
fillers had less of an effect, reducing the slip strength by 20%.
Fank and Yura (1981) conducted two replicate tests of five different specimen
assemblages to study the effects of undeveloped fillers of varying thicknesses and
number of plies. Filler thicknesses ranged from 0 to 0.75 inch with single and multi-ply
fillers. Undeveloped fillers have less strength than splice plates and pull plates. The
bolted connection consisted of two 2-inch thick A514 pull plates and two 2-inch thick
A514 splice plates. Both splice and pull plates were designed to induce failure in the bolt.
7
The undeveloped fillers consisted of A36 steel with thicknesses of 0 in., 0.075 in., 0.25
inch, and 0.75 inch single-ply and three 0.25 inch to achieve 0.75 inch multi-ply filler.
The bolts were A325 of 7/8 inch diameter with a standard hole of 15/16 inch. The upper
part of the connection contained fully developed fillers by one bolt while the lower part
of the connection contained the undeveloped fillers. The surface conditions were different
for each plate. Full plates, splice plates, and 0.25-inch fillers had clean mill-scale finish.
The 0.075-inch fillers had a rust coating removed by wire brushing. The single-ply 0.75-
inch filler had been sandblasted about eight months prior to testing with no observable
surface corrosion. The bolt clamping force was achieved using the turn-of-nut method to
one half turn past snug tight. It was found that the slip coefficient dropped by 16.7%
when using 0.25 inch undeveloped fillers, which is consistent with Fish and Lee’s
findings. It was found that the use of multi-ply fillers had a greater detrimental effect on
strength over single-ply fillers; the multi-ply fillers express less resistance to the bending
of the bolt because they can move relative to each other. Moreover, it was observed that
the ultimate load decreased with increasing thickness of the undeveloped fillers. The
researchers suggested a reduction factor for connections with undeveloped fillers
represented by the following equation:
Rb = 1-0.4t Where t = fillers thickness. …… (Eq. 2-1)
Undeveloped fillers create an efficient separation in the loading pattern. This separation
provides more space for the bolt to move and bend. Herein, any further increase in the
filler thickness means increasing the load separation in which greater bending would
occur. It was found that there is no significant difference in the ultimate load between 1 x
8
0.75-inch and 3 x 0.25 inch thickness because of the local bearing deformation that
occurred in the solid plate of 0.75-inch thickness. The difference might be greater if
higher strength steel had been used, as it would decrease the bearing deformation.
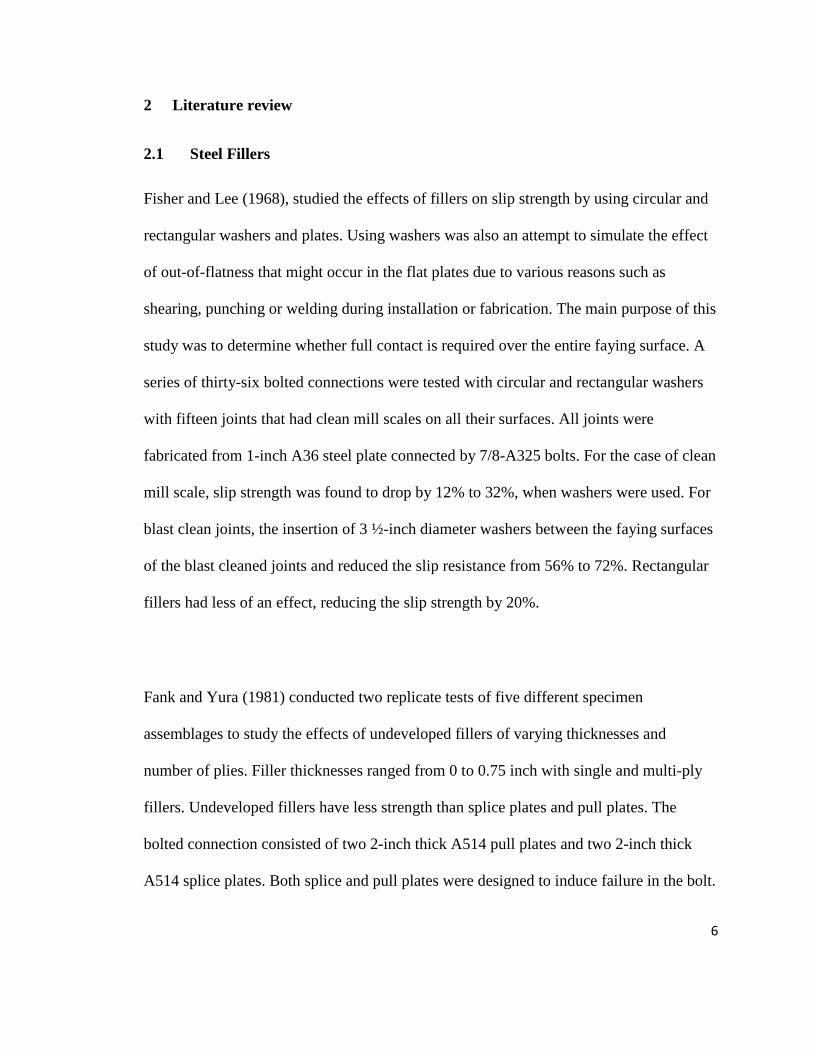
Dusicka and Lewis (2010) studied the behavior of steel connections with fillers using
high strength steel with standard holes and oversized holes of one-bolt and three-bolt
assemblies. In an effort to consider different variables such as lower grade fillers, their
study focused on strength issues and comprised only two repeated tests per configuration
in order to achieve reliability. Most of the specimens had clean blast surfaces (SP-10 or
NACE 2) and few fillers had clean mill scale. High strength steel A709HPS70W along
with high strength bolts A490 were used, which was the focus of the research. Generally,
assemblies consisted of two pull plates and two splice plates with single and multi-ply
fillers in between. Pull plates and splice plates were HPS A709 Grade 70 of thickness
1.75 inch and 1.125 inch, respectively Fillers were A572 Grade 50 of ½-inch, 1-inch and
2-inch thicknesses for single plate fillers, while 0.25-inch plates were used in the multi-
ply fillers to achieve the required thickness. Plates were connected by 7/8 inch diameter
A490 bolts of various lengths and were placed in a reverse bearing to achieve larger
movement. Bolt threads were excluded from the bearing area of the connection to
account for the failure in the solid part of the bolt shank (Fig. 2-1)
9
Fig. 2-1: Assembly layout used in Dusicka and Lewis (2010).
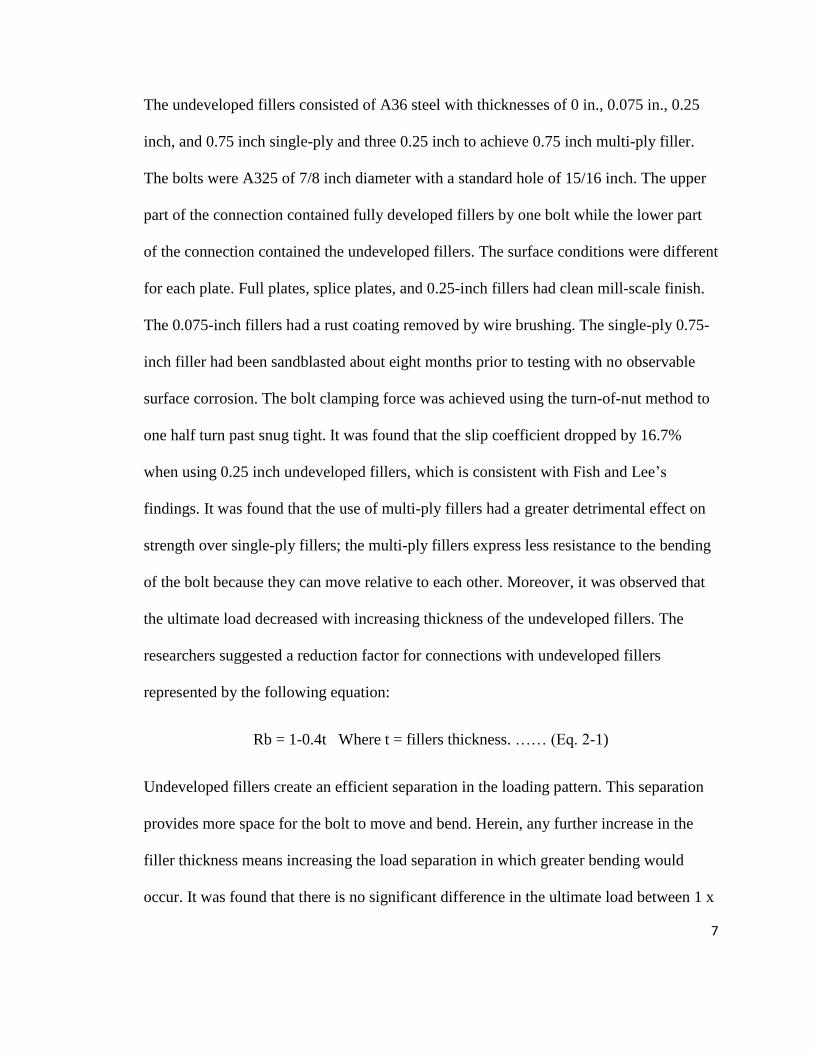
Fig. 2-2: Load vs. deformation for different filler cases. From Dusicka and Lewis (2010).

10
The results expressed similar trends for one-bolt and three-bolt assemblies, but when
comparing strength per bolt, the strength from one-bolt assembly is higher than that for
the three-bolt assembly. Generally, the existence of fillers between pull plates and splice
plates reduced the ultimate strength of the connection. The ultimate strength decreased
with increasing filler thickness up to 1-inch, after which the shear strength recovered and
expressed similar strength as when no fillers are used. Shear strength reduced by 5.5%
and 6% for ½-inch and 1-inch fillers respectively (Fig. 2-3). The reason for the observed
reduction in the connection strength for fillers up to 1-inch thickness is due to the
increment of the deformation within the constraints of the holes. For 2-inch thick fillers,
the flexural deformation decreased and the connection behavior was similar to the case
without fillers. The detrimental effect was obvious for multi-ply fillers due to the
minimum bolt restraints resulting from the relative movement of the plies.
11
Fig. 2-3: Ultimate load vs. fillers thickness. From Dusicka and Lewis (2010).
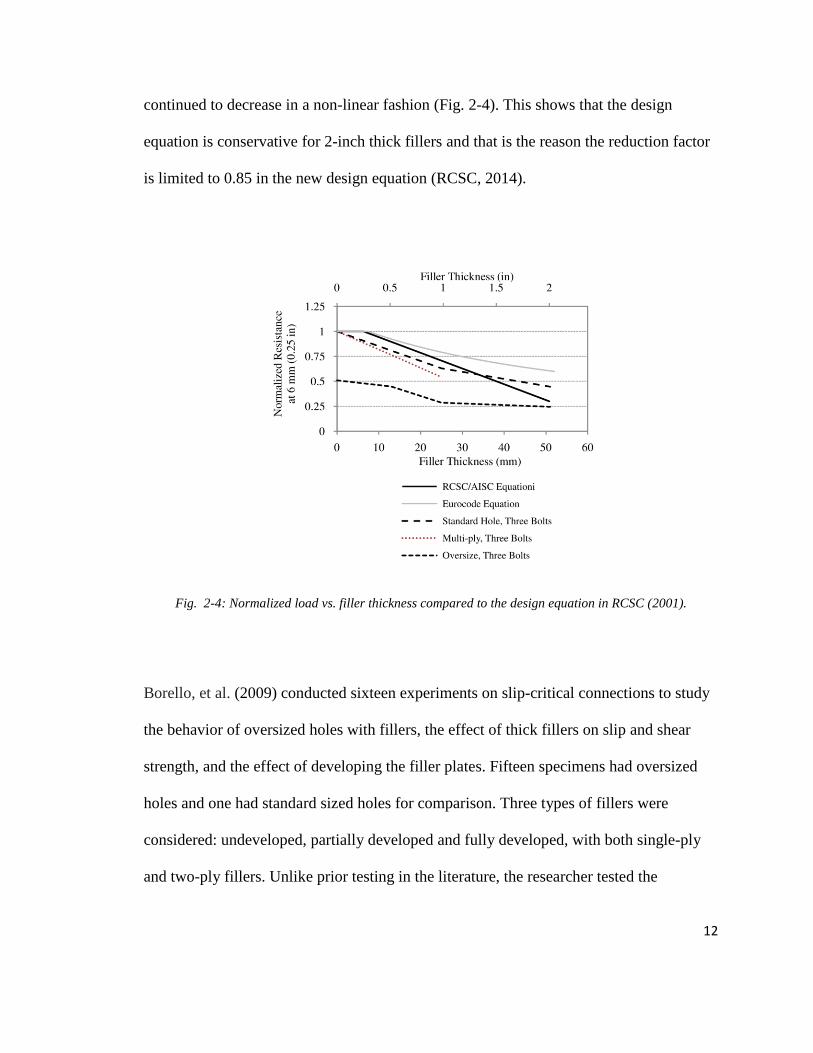
In their research, Dusicka and Lewis compared the resistant load obtained at ¼ inch to
those obtained from the design equation (RCSC, 2004). It was found that results
correlated to the design equation up to 1-inch thick fillers; after that, the strength
12
continued to decrease in a non-linear fashion (Fig. 2-4). This shows that the design
equation is conservative for 2-inch thick fillers and that is the reason the reduction factor
is limited to 0.85 in the new design equation (RCSC, 2014).
Fig. 2-4: Normalized load vs. filler thickness compared to the design equation in RCSC (2001).
Borello, et al. (2009) conducted sixteen experiments on slip-critical connections to study
the behavior of oversized holes with fillers, the effect of thick fillers on slip and shear
strength, and the effect of developing the filler plates. Fifteen specimens had oversized
holes and one had standard sized holes for comparison. Three types of fillers were
considered: undeveloped, partially developed and fully developed, with both single-ply
and two-ply fillers. Unlike prior testing in the literature, the researcher tested the
13
specimens in compression instead of tension. The specimens consisted of two wide
flange columns connected by 2-inch thick splice plates. The bottom column for all
specimens was a W14x730 section, while the top columns were W14x159, W14x455 and
W14x730 sections, which required filler plates of 3 ¾-inch, 1 5/8-inch, and 0-inch
thickness, respectively. All surfaces were Class B surfaces that meet the requirements of
SSPC SP6. The bolts used in this study were A490X with diameters of 1 1/8 inch pre-
tensioned either by the turn-of-nut or by tension-controlled bolts. During testing, it was
observed that the behavior of the connection was linear before the slip. Similarly, to what
was found in previous studies, increasing the number of plies resulted in reduced slip
strength. However, it was found that developing the fillers can mitigate their detrimental
effects significantly, depending on the added number of bolts. Additionally, extending the
connection to accommodate all bolts required for the development can lessen the
detrimental effects of additional slip surfaces depending on the required number of bolts.
The counteracting mechanism of bolt bending and jamming within the bolt hole was also
investigated. It was found that the shear strength decreased with increasing filler
thickness. Multi-ply fillers had a detrimental effect in that they delayed the jamming of
the bolt. The detrimental effect on shear strength can be mitigated significantly by
extending the connection to accommodate the bolts used to develop the plate.
14
2.2 Thermal Breaks
Most thermal breaks have low stiffness and strength compared to steel. Because of that,
the behavior of the connection is different and a reduction in the connection strength is
thus to be expected. Most research on connections with thermal breaks have considered
the case of end plate moment connections. Thermal breaks used were mainly constructed
from PVC and neoprene that have extremely low thermal conductivity (0.025 - 0.05
W/m*K).
A study by Sulcova, et al. (2010) investigated the compression strength of thermal break
used in end plate moment connections. In their study, they tested Erthacetal H, a
technical plastic that has thermal insulation characteristics in compression and used the
resulting data for Erthacetal H in the design equation according to the Eurocode [EN
1993-1-8:2005] to predict the behavior of the connection under moment and shear
loading. The end plate thicknesses were 12 and 20 mm (0.47 and 0.79 inch), while the
Erthacetal H thermal insulation thicknesses were 8, 16, and 25 mm (0.32, 0.63, and 0.98
inch). It was found that when the thickness of the thermal breaks increases, there is a
decrease in connection stiffness.
Nasdala, et al. (2006), conducted a Finite Element Analysis (FEA) study on an end-plate
moment connection with elastomeric thermal breaks to develop analytical design rules
for end-plate moment connections with thermal breaks. The FEA model considered
geometric and material nonlinearities. The thermal breaks studied had a thermal
15
conductivity of 0.2 W/mk and found that creep has a negligible effect on the connection
strength, while the length of the bolts, the bolt’s preloading, and the friction between the
steel and interference thermal layers have a direct effect on connection behavior.
Larbi, et al. (2017), studied the effect of using PVC and acoustic insulations with end-
plate moment connections for steel structures attached to a concrete support. A numerical
simulation was used to study the thermal performance of the thermal breaks. It was found
that using thermal barriers within the steel connection can reduce thermal bridging up to
65%. It was also found that thermal performance depends on thermal configuration
(whether additional thermal insulation is used to insulate the steel beam), the thickness of
the thermal barriers, the material used in the fasteners (carbon or stainless steel) and the
thickness of the thermal envelope.
Cleary, et al. (2016), conducted an experimental study on simple shear and moment
connections using fiber reinforced resin (FRR) as thermal breaks (0.3 W/mK thermal
conductivity) under service loading conditions. The study considered two FRR grades of
standard weave and high weave in two thicknesses (1 and 2 inch). Two surface
preparations were investigated: no surface preparation and roughened surfaces using
ANSI (2012) to increase the friction coefficient. The bolts were ¾-inch diameter A563
with Grade C nuts with a clamping force of 32 kips with F436 washers. For shear tests,
the researchers used a built-up steel angle of 1/2 x 10 x 6 inch attached to steel leg
16
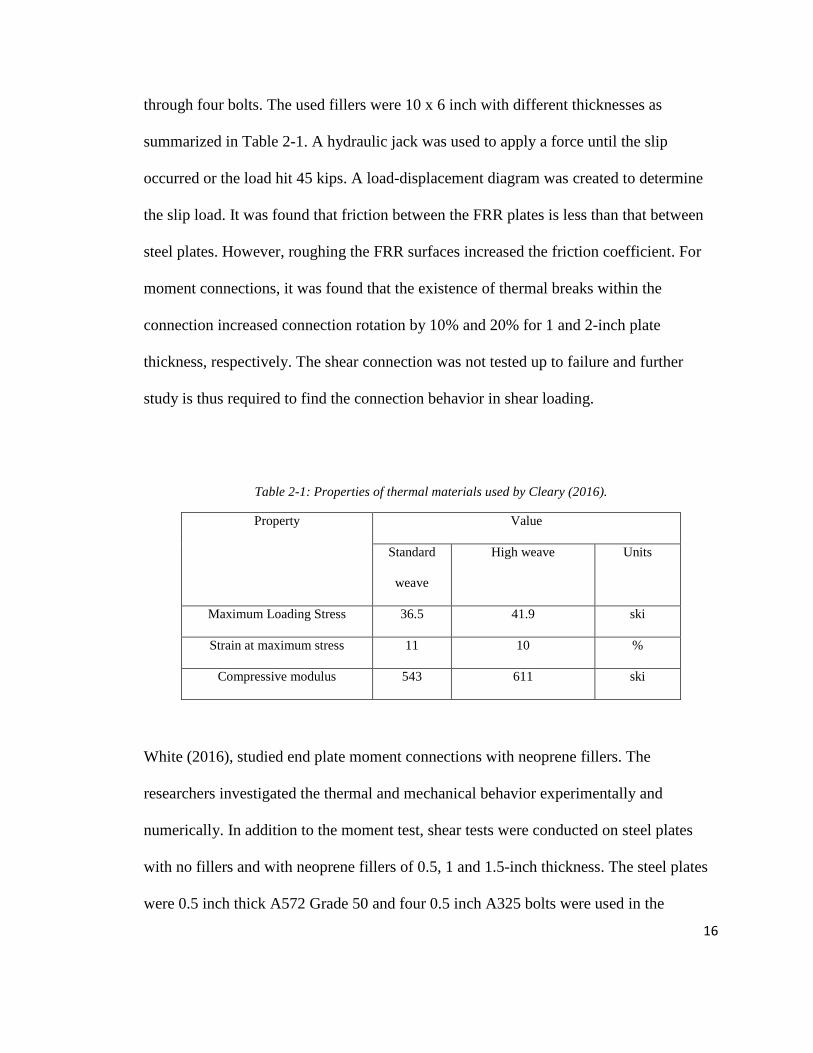
through four bolts. The used fillers were 10 x 6 inch with different thicknesses as
summarized in Table 2-1. A hydraulic jack was used to apply a force until the slip
occurred or the load hit 45 kips. A load-displacement diagram was created to determine
the slip load. It was found that friction between the FRR plates is less than that between
steel plates. However, roughing the FRR surfaces increased the friction coefficient. For
moment connections, it was found that the existence of thermal breaks within the
connection increased connection rotation by 10% and 20% for 1 and 2-inch plate
thickness, respectively. The shear connection was not tested up to failure and further
study is thus required to find the connection behavior in shear loading.
Table 2-1: Properties of thermal materials used by Cleary (2016).
Property Value
Standard
weave
High weave Units
Maximum Loading Stress 36.5 41.9 ski
Strain at maximum stress 11 10 %
Compressive modulus 543 611 ski
White (2016), studied end plate moment connections with neoprene fillers. The
researchers investigated the thermal and mechanical behavior experimentally and
numerically. In addition to the moment test, shear tests were conducted on steel plates
with no fillers and with neoprene fillers of 0.5, 1 and 1.5-inch thickness. The steel plates
were 0.5 inch thick A572 Grade 50 and four 0.5 inch A325 bolts were used in the
17
connection as shown in It was found that shear stiffness decreases exponentially with an
increase of the neoprene thickness. For connections without neoprene, slip occurred at a
load of 5 kips, while in the case of neoprene fillers there was no clear transition between
friction and bolt bearing. The shear stiffness between the cases of no filler and the 0.5-
inch neoprene filler was close. The tests were not continued up to bolt failure, but the
curvature of the bolts was significant. Double-curvature bending occurred in bolts
because of the low shear resistance of the neoprene.
18
2.3 Summary
Despite an anticipated trend towards using thermal break fillers within steel connections,
no experimental studies have compared ultimate load and deformation of steel
connections with fillers of different materials and thicknesses. Some thermal break
studies were conducted on end plate connections. Very few studies were carried out on
lap connections and no study has evaluated and compared the effect of steel and non-steel
fillers on ultimate strength and ductility of the connection.
2.4 Objectives and Motivation
The main objective of this research was to collect enough physical data on the behavior
of polypropylene (PP) fillers of different thicknesses with steel connections to determine
the effect of non-steel fillers on connection capacity and slip resistance, and to compare
them with a numerical model. The work was motivated by the growing interest in green
buildings to enable the use of inexpensive non-steel fillers that have better thermal
performance.
19
3 Experimental program
3.1 Test Matrix and Specimen Layout
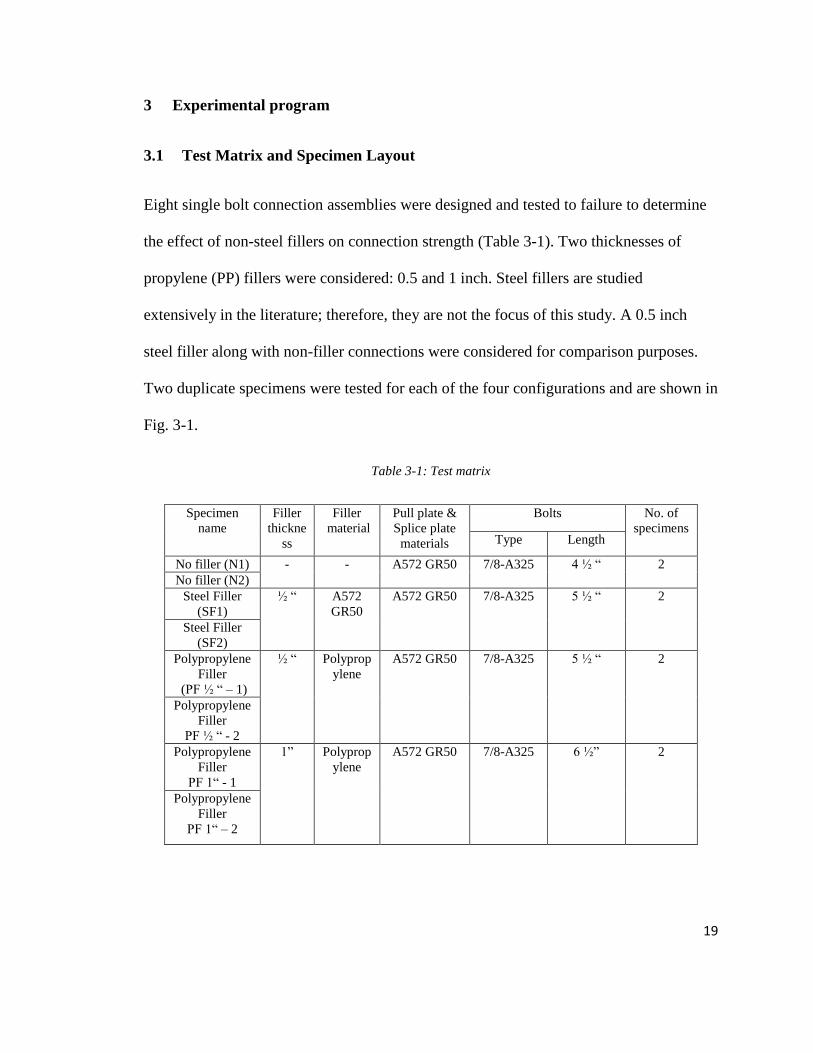
Eight single bolt connection assemblies were designed and tested to failure to determine
the effect of non-steel fillers on connection strength (Table 3-1). Two thicknesses of
propylene (PP) fillers were considered: 0.5 and 1 inch. Steel fillers are studied
extensively in the literature; therefore, they are not the focus of this study. A 0.5 inch
steel filler along with non-filler connections were considered for comparison purposes.
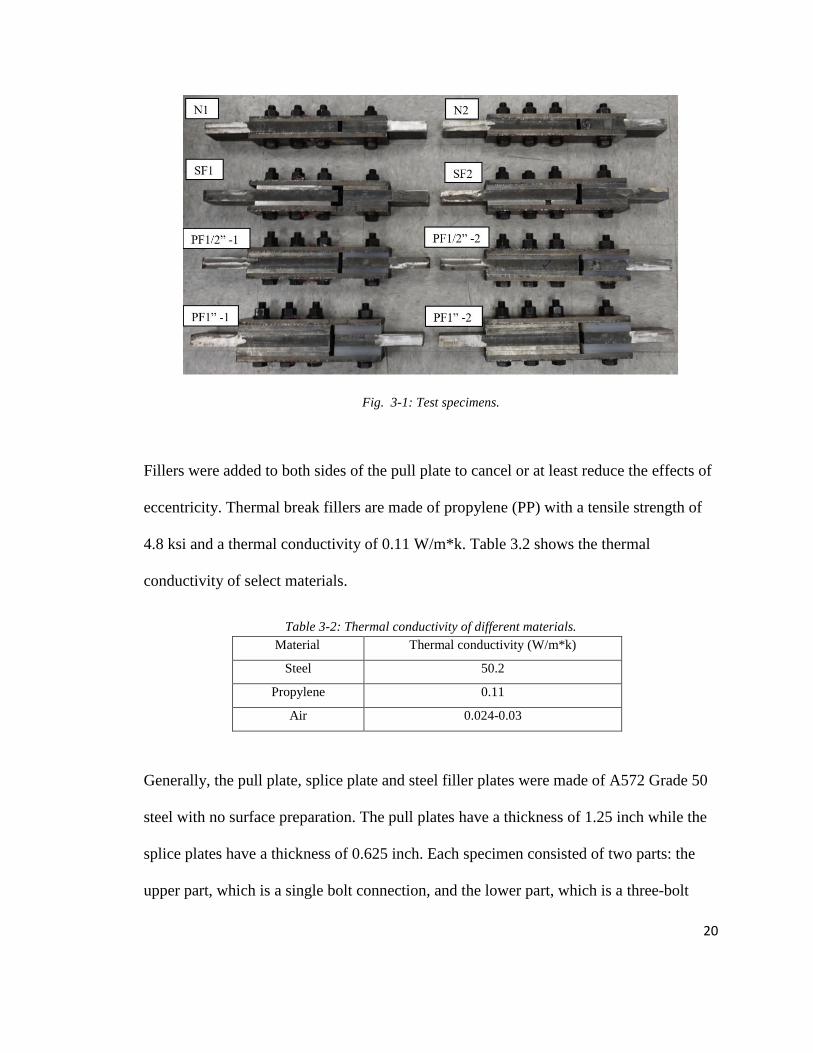
Two duplicate specimens were tested for each of the four configurations and are shown in
Fig. 3-1.
Table 3-1: Test matrix
Specimen
name
Filler
thickne
ss
Filler
material
Pull plate &
Splice plate
materials
Bolts No. of
specimens Type Length
No filler (N1) - - A572 GR50 7/8-A325 4 ½ “ 2
No filler (N2)
Steel Filler
(SF1)
½ “ A572
GR50
A572 GR50 7/8-A325 5 ½ “ 2
Steel Filler
(SF2)
Polypropylene
Filler
(PF ½ “ – 1)
½ “ Polyprop
ylene
A572 GR50 7/8-A325 5 ½ “ 2
Polypropylene
Filler
PF ½ “ - 2
Polypropylene
Filler
PF 1“ - 1
1” Polyprop
ylene
A572 GR50 7/8-A325 6 ½” 2
Polypropylene
Filler
PF 1“ – 2
20
Fig. 3-1: Test specimens.
Fillers were added to both sides of the pull plate to cancel or at least reduce the effects of
eccentricity. Thermal break fillers are made of propylene (PP) with a tensile strength of
4.8 ksi and a thermal conductivity of 0.11 W/m*k. Table 3.2 shows the thermal
conductivity of select materials.
Table 3-2: Thermal conductivity of different materials.
Generally, the pull plate, splice plate and steel filler plates were made of A572 Grade 50
steel with no surface preparation. The pull plates have a thickness of 1.25 inch while the
splice plates have a thickness of 0.625 inch. Each specimen consisted of two parts: the
upper part, which is a single bolt connection, and the lower part, which is a three-bolt
Material Thermal conductivity (W/m*k)
Steel 50.2
Propylene 0.11
Air 0.024-0.03
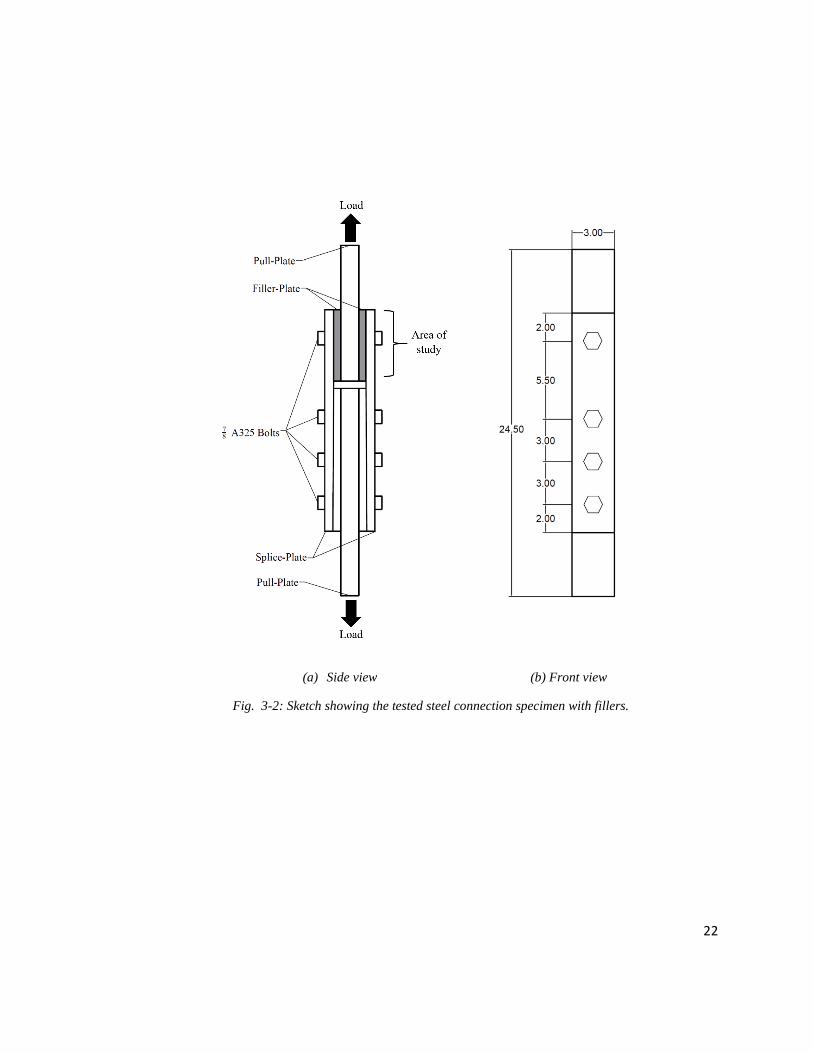
21
connection (Fig. 3-2). The upper part is the area of consideration in this study. It has
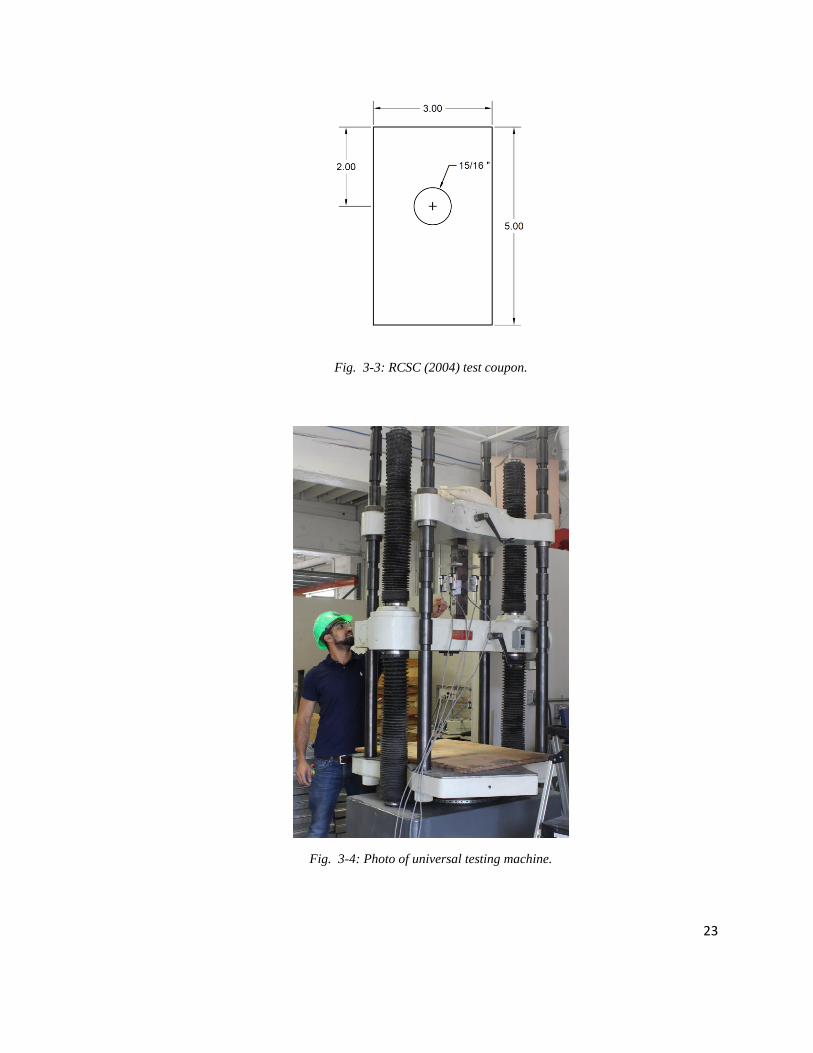
faying surfaces of 3 x 5 inch as specified in RCSC (2004) for slip critical tests (Fig. 3-3).
The function of the lower part is to connect the splice plates to the lower pull plate and
make sure no deformations occur in this part of the connection when ultimate load is
reached in the single-bolt part. The connection was designed such that the failure occurs
in the bolt while taking into consideration the threaded part of the bolt is excluded from
the bearing area. The selected bolt is 7/8 inch diameter made of A325 steel and represents
the most commonly used bolt in steel structures. The bolt hole is a standard sized hole
(15/16 inch) located 2 inches from one end and 3 inches from the other end as shown in
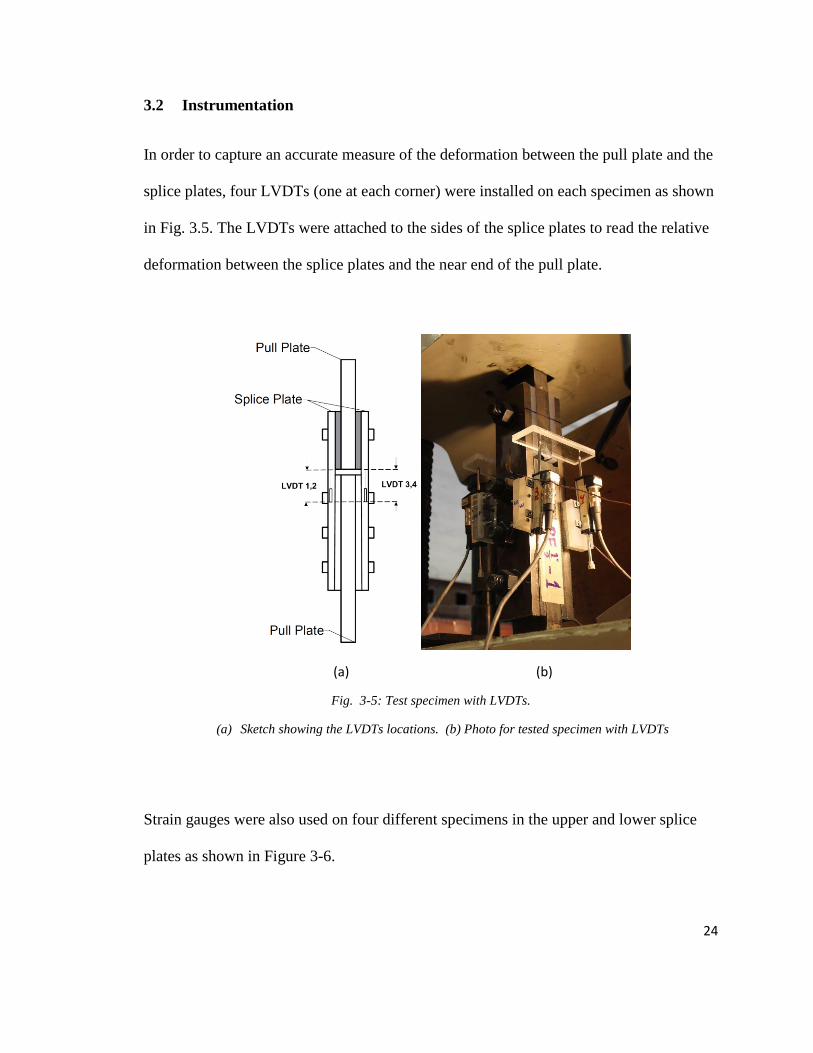
Fig. 3.2 (b). The specimens were tested using a 120-kip-capacity Tinius Olsen Super L
testing machine owned by VGO, Inc. (Fig. 3.4).
22
(a) Side view (b) Front view
Fig. 3-2: Sketch showing the tested steel connection specimen with fillers.
23
Fig. 3-3: RCSC (2004) test coupon.
Fig. 3-4: Photo of universal testing machine.
24
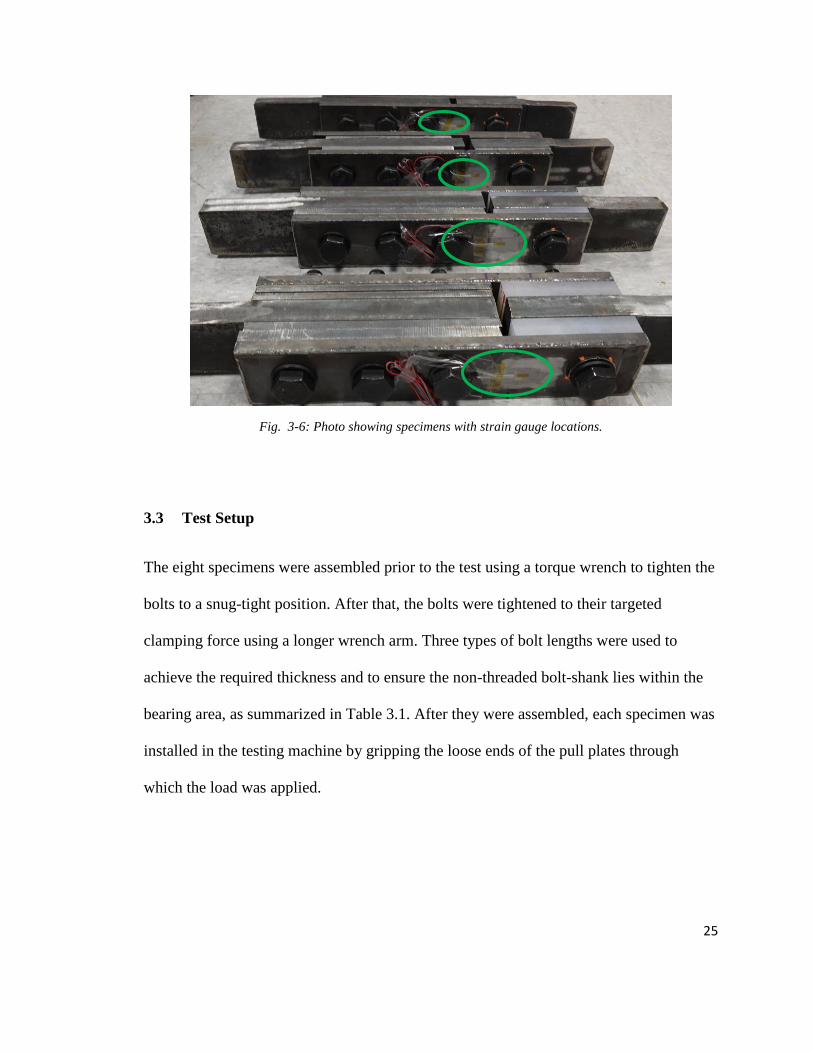
3.2 Instrumentation
In order to capture an accurate measure of the deformation between the pull plate and the
splice plates, four LVDTs (one at each corner) were installed on each specimen as shown
in Fig. 3.5. The LVDTs were attached to the sides of the splice plates to read the relative
deformation between the splice plates and the near end of the pull plate.
(a) (b)
Fig. 3-5: Test specimen with LVDTs.
(a) Sketch showing the LVDTs locations. (b) Photo for tested specimen with LVDTs
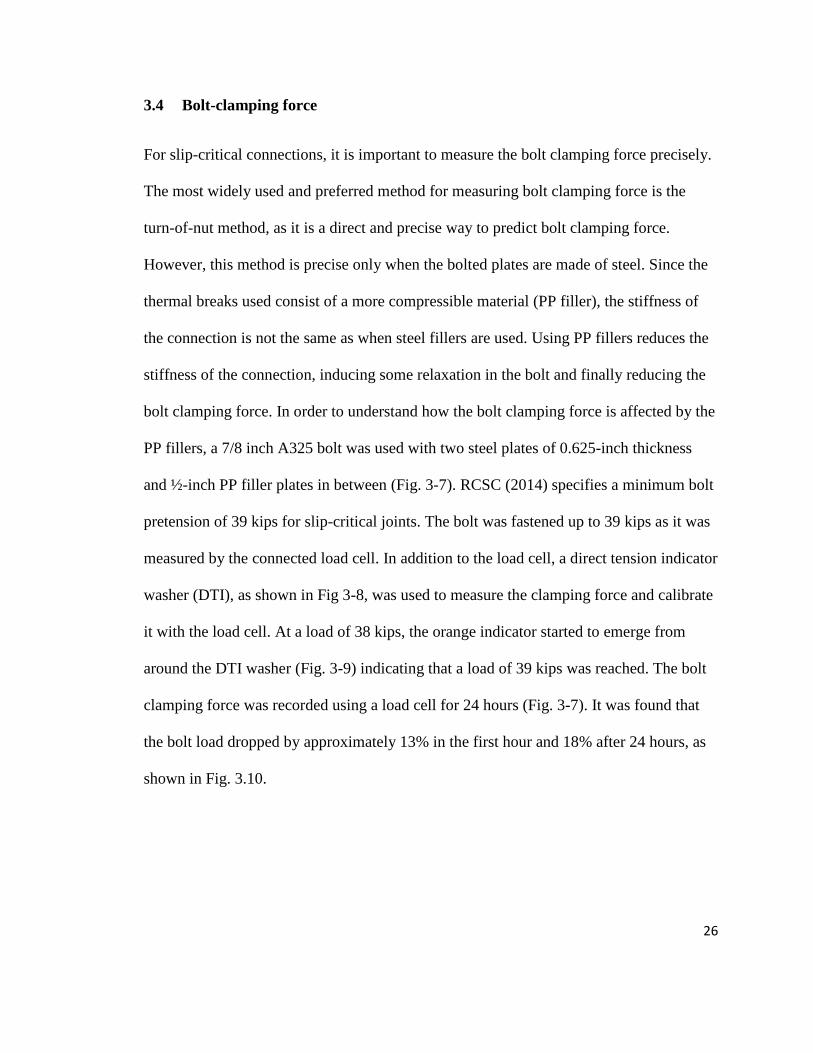
Strain gauges were also used on four different specimens in the upper and lower splice
plates as shown in Figure 3-6.
25
Fig. 3-6: Photo showing specimens with strain gauge locations.
3.3 Test Setup
The eight specimens were assembled prior to the test using a torque wrench to tighten the
bolts to a snug-tight position. After that, the bolts were tightened to their targeted
clamping force using a longer wrench arm. Three types of bolt lengths were used to
achieve the required thickness and to ensure the non-threaded bolt-shank lies within the
bearing area, as summarized in Table 3.1. After they were assembled, each specimen was
installed in the testing machine by gripping the loose ends of the pull plates through
which the load was applied.
26
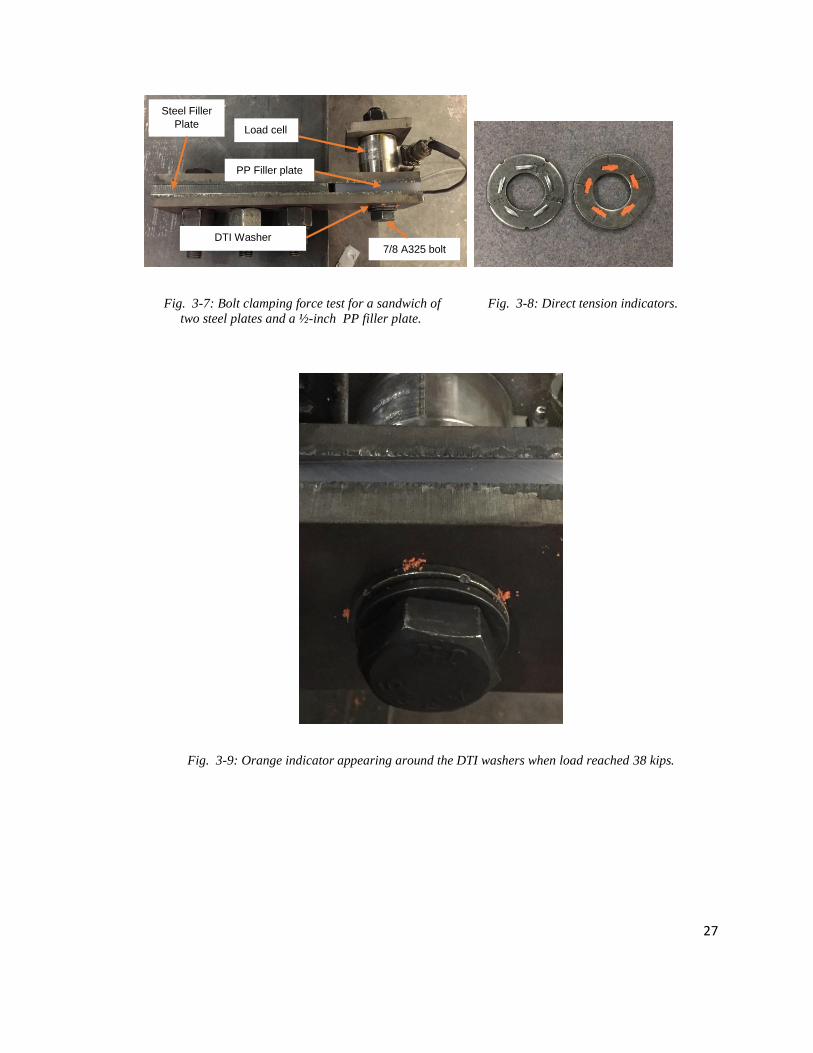
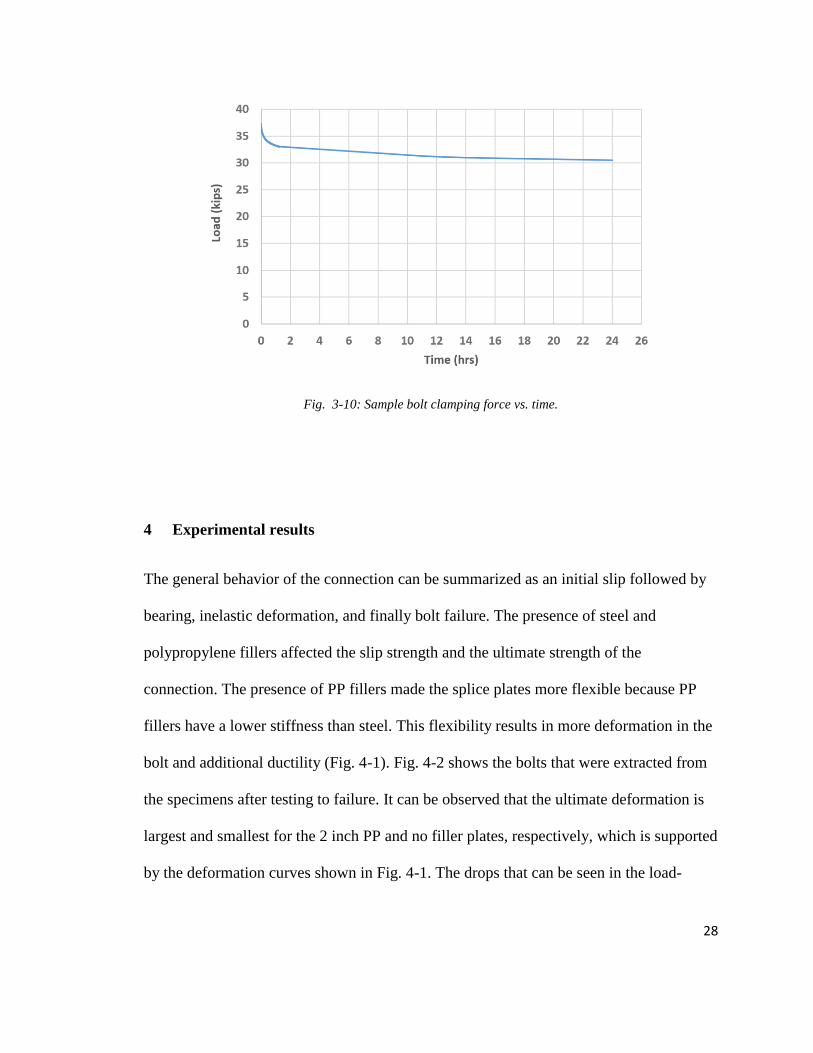
3.4 Bolt-clamping force
For slip-critical connections, it is important to measure the bolt clamping force precisely.
The most widely used and preferred method for measuring bolt clamping force is the
turn-of-nut method, as it is a direct and precise way to predict bolt clamping force.
However, this method is precise only when the bolted plates are made of steel. Since the
thermal breaks used consist of a more compressible material (PP filler), the stiffness of
the connection is not the same as when steel fillers are used. Using PP fillers reduces the
stiffness of the connection, inducing some relaxation in the bolt and finally reducing the
bolt clamping force. In order to understand how the bolt clamping force is affected by the
PP fillers, a 7/8 inch A325 bolt was used with two steel plates of 0.625-inch thickness
and ½-inch PP filler plates in between (Fig. 3-7). RCSC (2014) specifies a minimum bolt
pretension of 39 kips for slip-critical joints. The bolt was fastened up to 39 kips as it was
measured by the connected load cell. In addition to the load cell, a direct tension indicator
washer (DTI), as shown in Fig 3-8, was used to measure the clamping force and calibrate
it with the load cell. At a load of 38 kips, the orange indicator started to emerge from
around the DTI washer (Fig. 3-9) indicating that a load of 39 kips was reached. The bolt
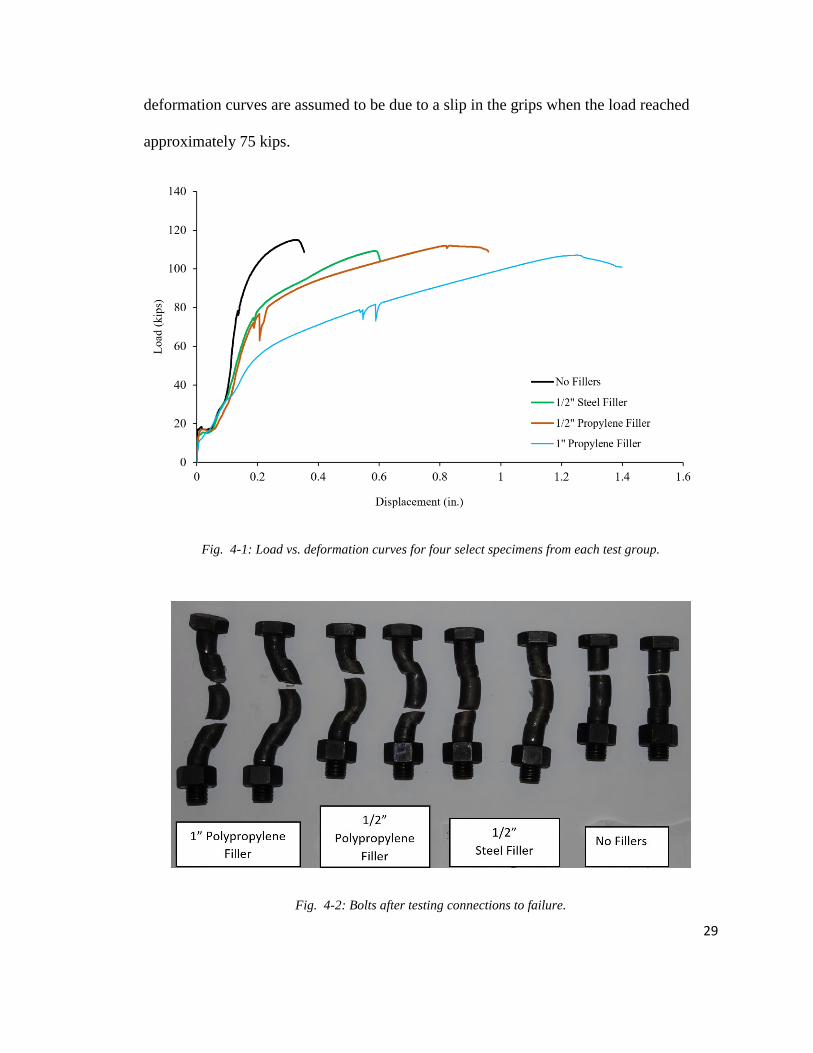
clamping force was recorded using a load cell for 24 hours (Fig. 3-7). It was found that
the bolt load dropped by approximately 13% in the first hour and 18% after 24 hours, as
shown in Fig. 3.10.
27
Fig. 3-7: Bolt clamping force test for a sandwich of Fig. 3-8: Direct tension indicators.
two steel plates and a ½-inch PP filler plate.
Fig. 3-9: Orange indicator appearing around the DTI washers when load reached 38 kips.
Load cell
DTI Washer
PP Filler plate
7/8 A325 bolt
Steel Filler
Plate
28
Fig. 3-10: Sample bolt clamping force vs. time.
4 Experimental results
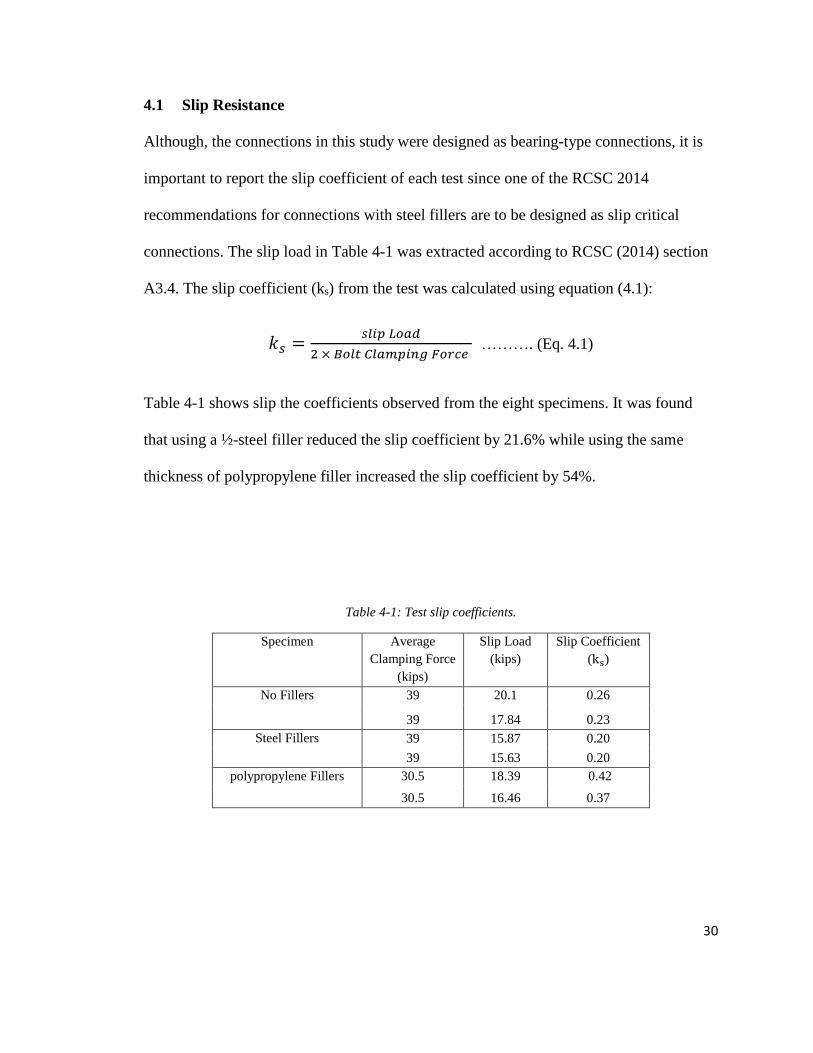
The general behavior of the connection can be summarized as an initial slip followed by
bearing, inelastic deformation, and finally bolt failure. The presence of steel and
polypropylene fillers affected the slip strength and the ultimate strength of the
connection. The presence of PP fillers made the splice plates more flexible because PP
fillers have a lower stiffness than steel. This flexibility results in more deformation in the
bolt and additional ductility (Fig. 4-1). Fig. 4-2 shows the bolts that were extracted from
the specimens after testing to failure. It can be observed that the ultimate deformation is
largest and smallest for the 2 inch PP and no filler plates, respectively, which is supported
by the deformation curves shown in Fig. 4-1. The drops that can be seen in the load-
29
deformation curves are assumed to be due to a slip in the grips when the load reached
approximately 75 kips.
Fig. 4-1: Load vs. deformation curves for four select specimens from each test group.
Fig. 4-2: Bolts after testing connections to failure.
30
4.1 Slip Resistance
Although, the connections in this study were designed as bearing-type connections, it is
important to report the slip coefficient of each test since one of the RCSC 2014
recommendations for connections with steel fillers are to be designed as slip critical
connections. The slip load in Table 4-1 was extracted according to RCSC (2014) section
A3.4. The slip coefficient (ks) from the test was calculated using equation (4.1):
𝑘𝑠 =𝑠𝑙𝑖𝑝 𝐿𝑜𝑎𝑑
2 × 𝐵𝑜𝑙𝑡 𝐶𝑙𝑎𝑚𝑝𝑖𝑛𝑔 𝐹𝑜𝑟𝑐𝑒 ………. (Eq. 4.1)
Table 4-1 shows slip the coefficients observed from the eight specimens. It was found
that using a ½-steel filler reduced the slip coefficient by 21.6% while using the same
thickness of polypropylene filler increased the slip coefficient by 54%.
Table 4-1: Test slip coefficients.
Specimen Average
Clamping Force
(kips)
Slip Load
(kips)
Slip Coefficient
(ks)
No Fillers 39 20.1 0.26
39 17.84 0.23
Steel Fillers 39 15.87 0.20
39 15.63 0.20
polypropylene Fillers 30.5 18.39 0.42
30.5 16.46 0.37
31
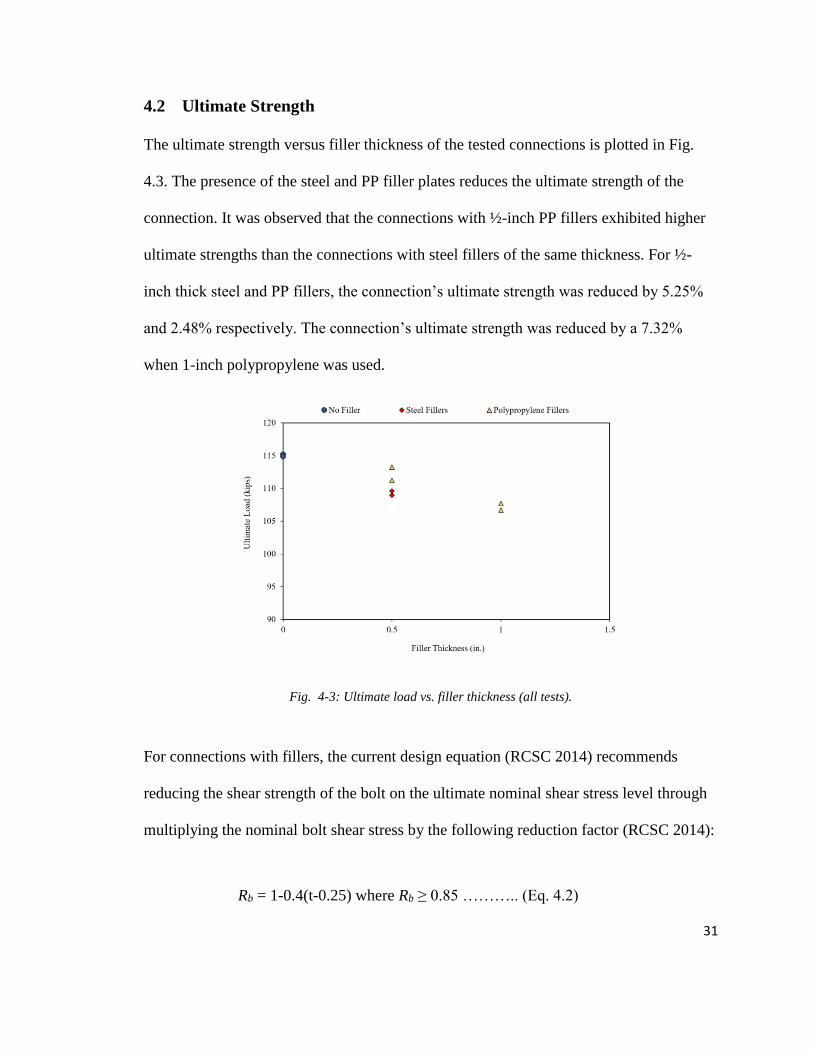
4.2 Ultimate Strength
The ultimate strength versus filler thickness of the tested connections is plotted in Fig.
4.3. The presence of the steel and PP filler plates reduces the ultimate strength of the
connection. It was observed that the connections with ½-inch PP fillers exhibited higher
ultimate strengths than the connections with steel fillers of the same thickness. For ½-
inch thick steel and PP fillers, the connection’s ultimate strength was reduced by 5.25%
and 2.48% respectively. The connection’s ultimate strength was reduced by a 7.32%
when 1-inch polypropylene was used.
Fig. 4-3: Ultimate load vs. filler thickness (all tests).
For connections with fillers, the current design equation (RCSC 2014) recommends
reducing the shear strength of the bolt on the ultimate nominal shear stress level through
multiplying the nominal bolt shear stress by the following reduction factor (RCSC 2014):
Rb = 1-0.4(t-0.25) where Rb ≥ 0.85 ……….. (Eq. 4.2)
32
The design equation from RCSC 2014 is conservative for connections with thick fillers,
therefore, Dusicka and Lewis (2010) suggested a new adjustment factor. Their equation is
based on the bolt diameter and filler thickness rather than the filler thickness only:
𝑓𝑟 = 1 + [(𝑘𝑓
𝑑𝑏2) (0.75𝑡 − 𝑑𝑏)2 − 𝑘𝑓]………. (Eq.4.3) where kf = 0.1 for a standard size
hole and db is the bolt diameter.
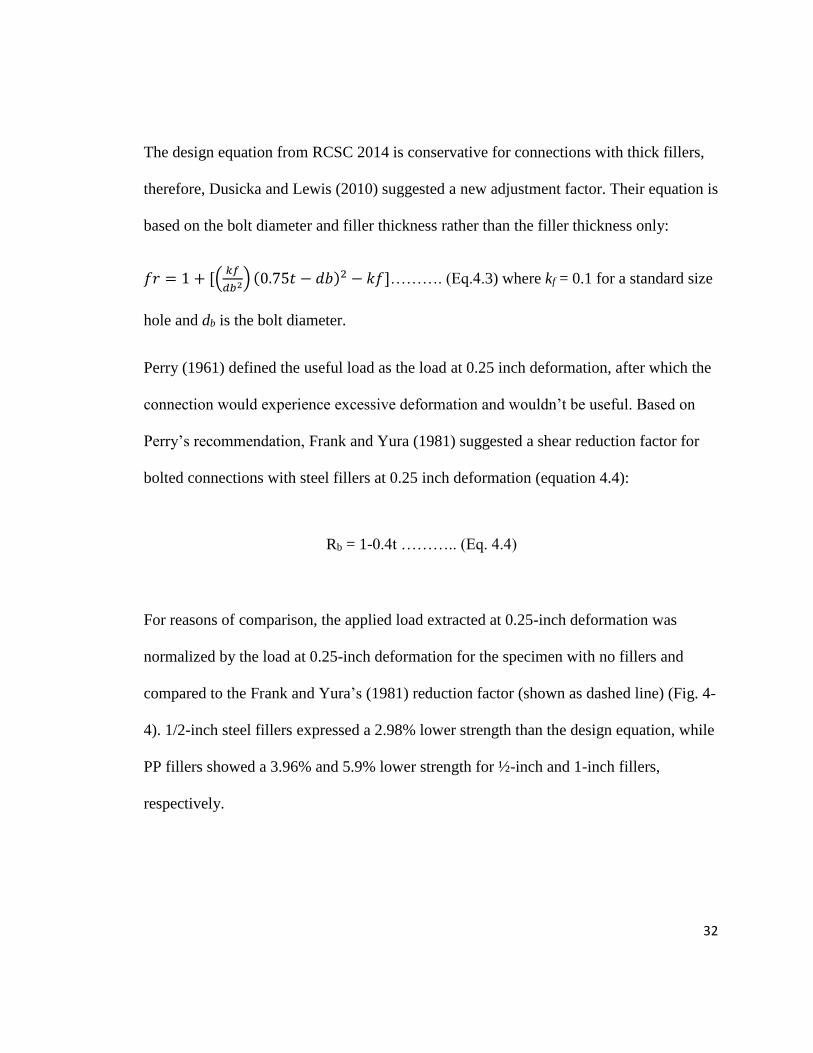
Perry (1961) defined the useful load as the load at 0.25 inch deformation, after which the
connection would experience excessive deformation and wouldn’t be useful. Based on
Perry’s recommendation, Frank and Yura (1981) suggested a shear reduction factor for
bolted connections with steel fillers at 0.25 inch deformation (equation 4.4):
For reasons of comparison, the applied load extracted at 0.25-inch deformation was
normalized by the load at 0.25-inch deformation for the specimen with no fillers and
compared to the Frank and Yura’s (1981) reduction factor (shown as dashed line) (Fig. 4-
4). 1/2-inch steel fillers expressed a 2.98% lower strength than the design equation, while
PP fillers showed a 3.96% and 5.9% lower strength for ½-inch and 1-inch fillers,
respectively.
Rb = 1-0.4t ……….. (Eq. 4.4)
33
Fig. 4-4: Normalized load at 0.25 inch deformation compared to the design equation (dashed line).
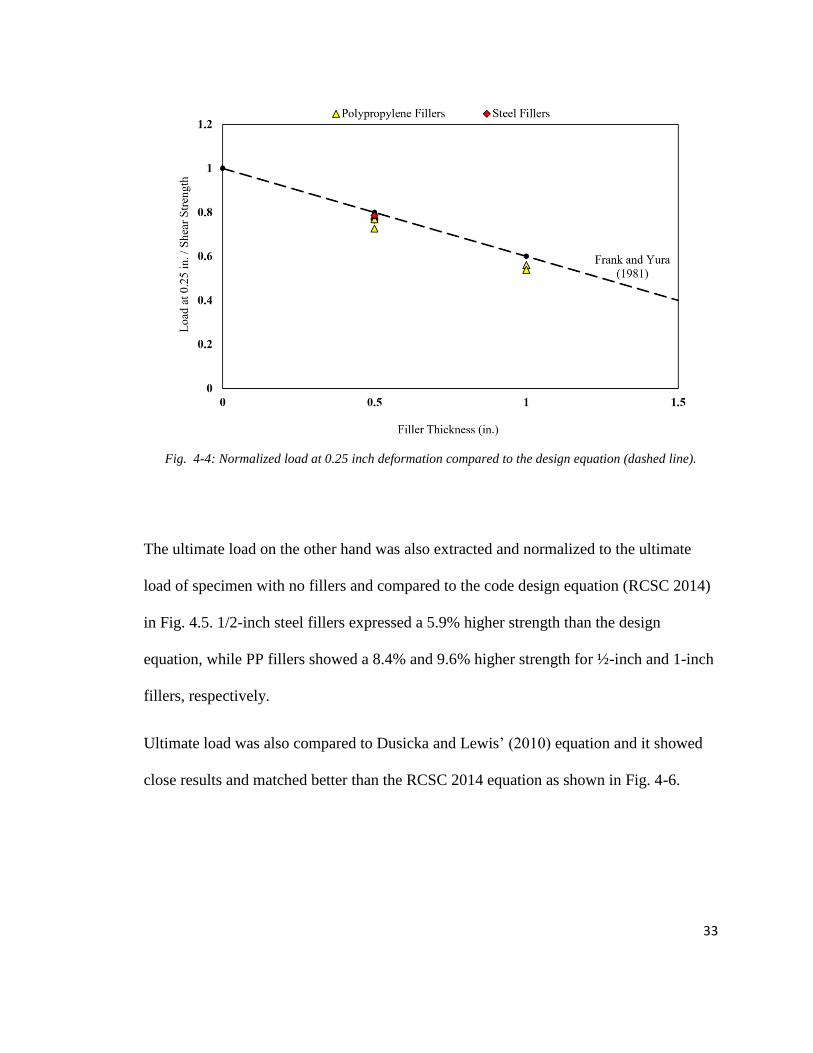
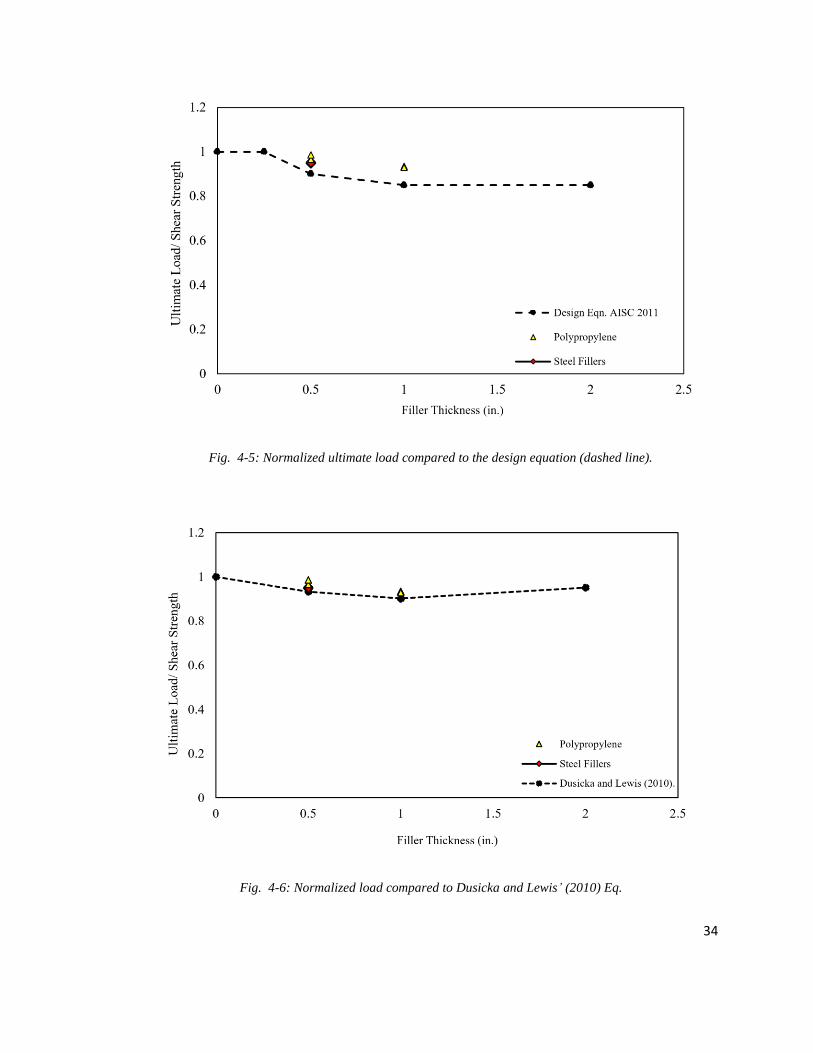
The ultimate load on the other hand was also extracted and normalized to the ultimate
load of specimen with no fillers and compared to the code design equation (RCSC 2014)
in Fig. 4.5. 1/2-inch steel fillers expressed a 5.9% higher strength than the design
equation, while PP fillers showed a 8.4% and 9.6% higher strength for ½-inch and 1-inch
fillers, respectively.
Ultimate load was also compared to Dusicka and Lewis’ (2010) equation and it showed
close results and matched better than the RCSC 2014 equation as shown in Fig. 4-6.
34
Fig. 4-5: Normalized ultimate load compared to the design equation (dashed line).
Fig. 4-6: Normalized load compared to Dusicka and Lewis’ (2010) Eq.
35
5 Finite Element Analysis
ABAQUS software 6.14-4 was used for all Finite Element Analyses (FEA), with both
explicit and implicit codes. Contact, friction, sliding, bolt hole deformation, bolt bending,
bolt clamping force (pretension) and material non-linearity were all considered in the
simulation. Details are presented in the following subsections.
5.1 Introduction
This research employed of two different FEA models. The first model simulates the
experimental tests with the PP fillers, which were conducted as part of this research, and
the second one simulates the laboratory tests with steel fillers studied by Dusicka (2010).
The two models were used to prove their ability to handle different materials.
5.2 Model 1
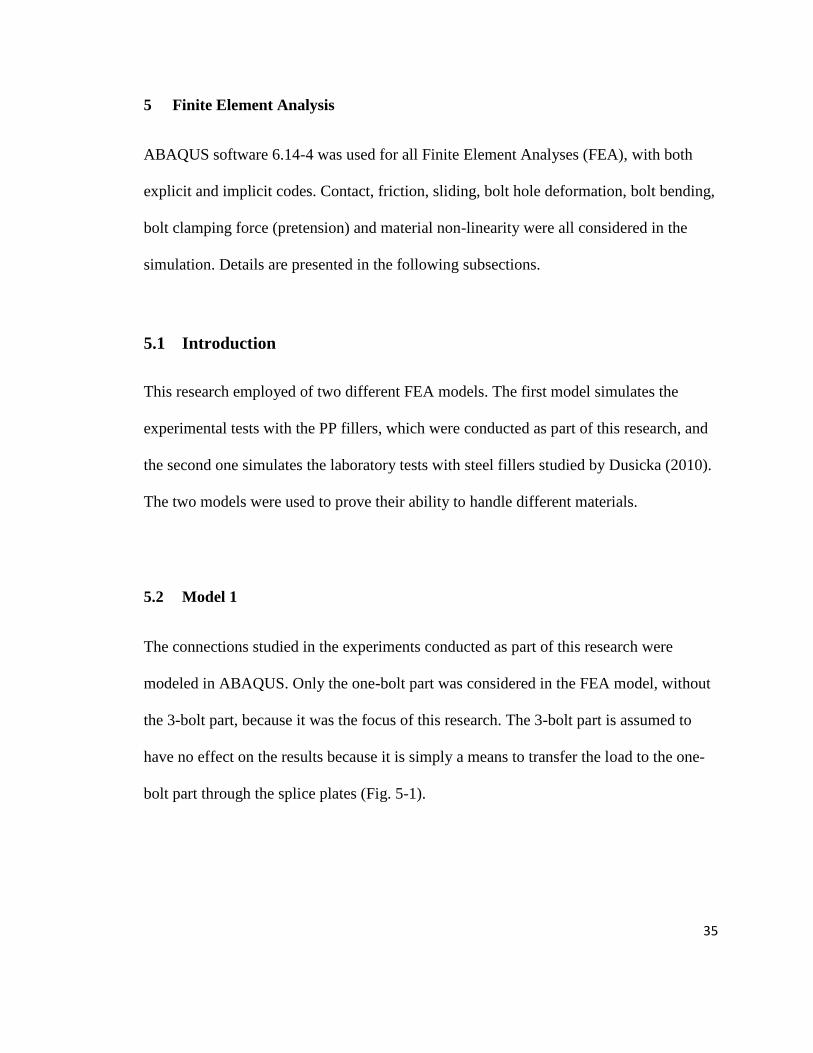
The connections studied in the experiments conducted as part of this research were
modeled in ABAQUS. Only the one-bolt part was considered in the FEA model, without
the 3-bolt part, because it was the focus of this research. The 3-bolt part is assumed to
have no effect on the results because it is simply a means to transfer the load to the one-
bolt part through the splice plates (Fig. 5-1).
36
Fig. 5-1: Example of one-bolt portion of steel connection with 1-inch PP fillers
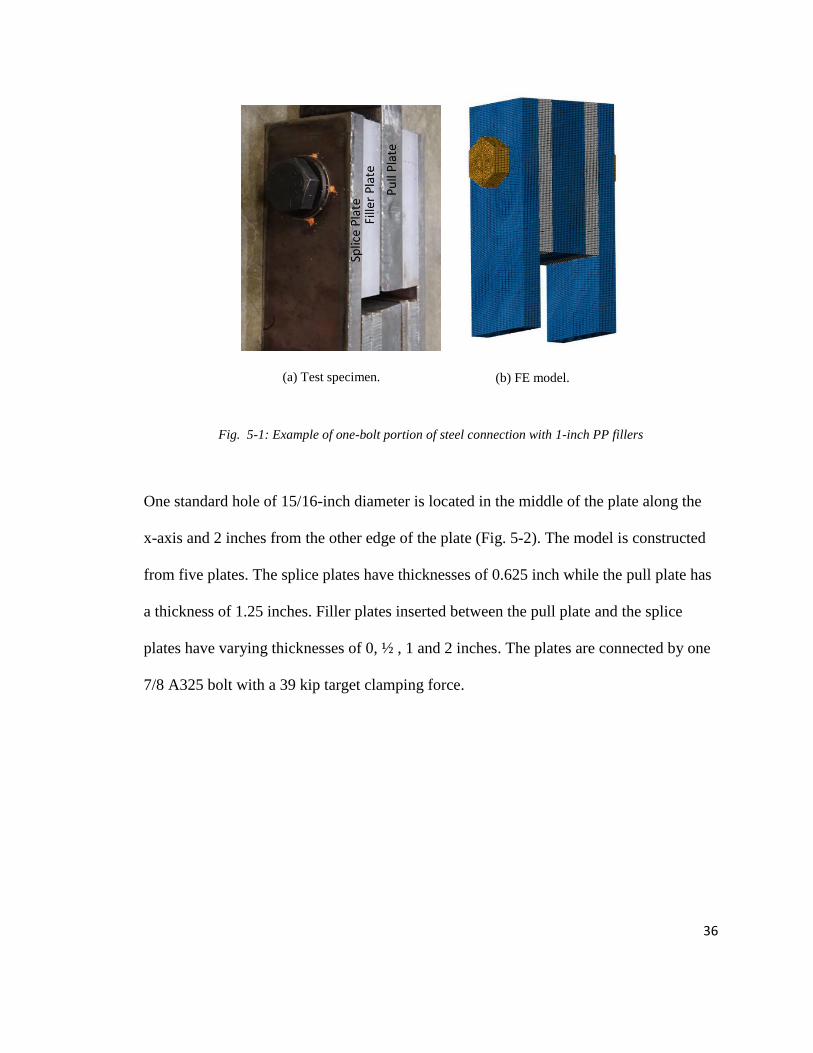
One standard hole of 15/16-inch diameter is located in the middle of the plate along the
x-axis and 2 inches from the other edge of the plate (Fig. 5-2). The model is constructed
from five plates. The splice plates have thicknesses of 0.625 inch while the pull plate has
a thickness of 1.25 inches. Filler plates inserted between the pull plate and the splice
plates have varying thicknesses of 0, ½ , 1 and 2 inches. The plates are connected by one
7/8 A325 bolt with a 39 kip target clamping force.
(a) Test specimen. (b) FE model.
37
Fig. 5-2: RCSC coupon.
5.3 Model 2
Model 2 simulates the specimens from Dusicka and Lewis (2010) using connections with
steel fillers. The faying surfaces are the same, but the pull plate and splice plates are from
different steel grades and have different thicknesses. The pull plate had a thickness of
1.75 inches while the splice plates had a thickness of 1.125 inches. The steel fillers had
thicknesses of 0, ½, 1 and 2 inches and all the plates were connected by 7/8 A490 bolts.
5.4 Model Simplification
For large and complex geometries, FEA can be time consuming; therefore, it is necessary
to simplify a model if possible, for instance by considering symmetry, without affecting
the connection’s behavior. Since the bolt’s threads were out of the bearing area, they
were not considered in the design and this allowed the simulation to account for
38
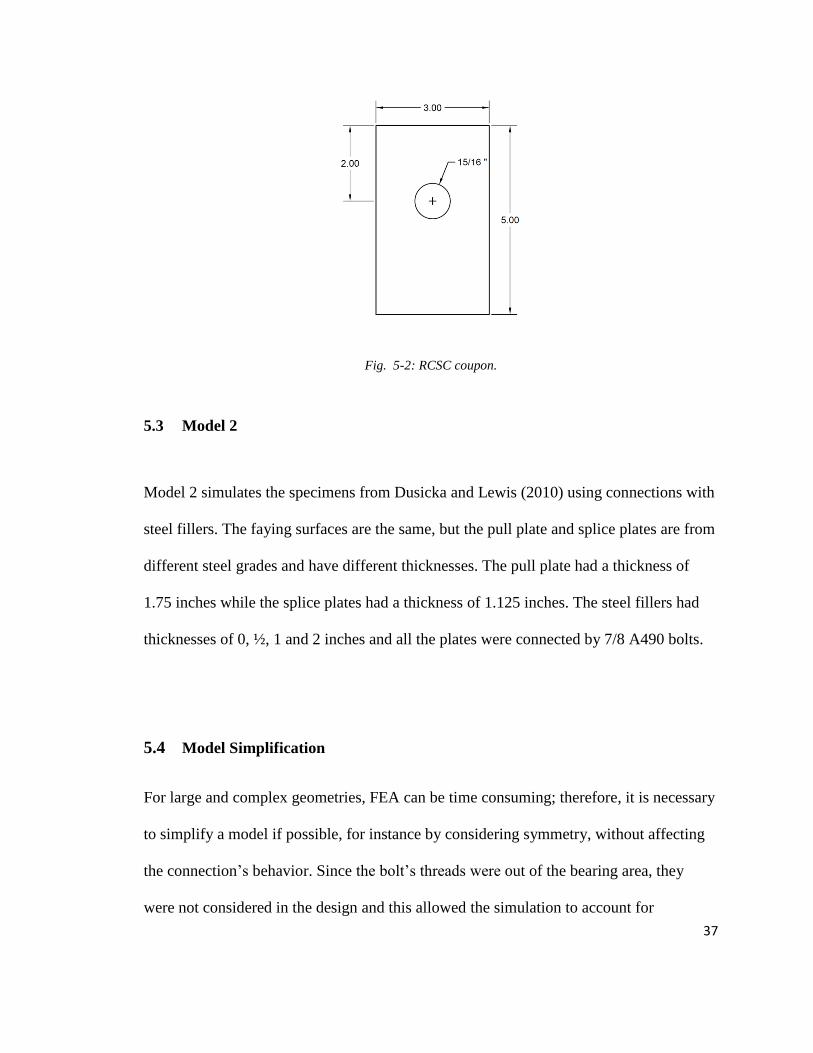
symmetry along the x-y plane. Symmetry along the z-y plane was also taken into
consideration, as the bolt was in the middle of the plate. In the end, only one-quarter of
the connection was simulated (Fig. 5-3 (a)) and the results were then multiplied by a
factor of 4 when obtained from ABAQUS. Fig. 5-3 (b) shows the full model for
comparison. The fixed end of the splice plates was assumed to be at the center of the first
bolt of the 3-bolt portion, while fillers were free to move and the displacement was
applied through the pull plate (Fig. 5-3 (a)).
Fig. 5-3: FEA Model
(a) Simplified Model (b) Full Model.
Displacement
Fixed end
39
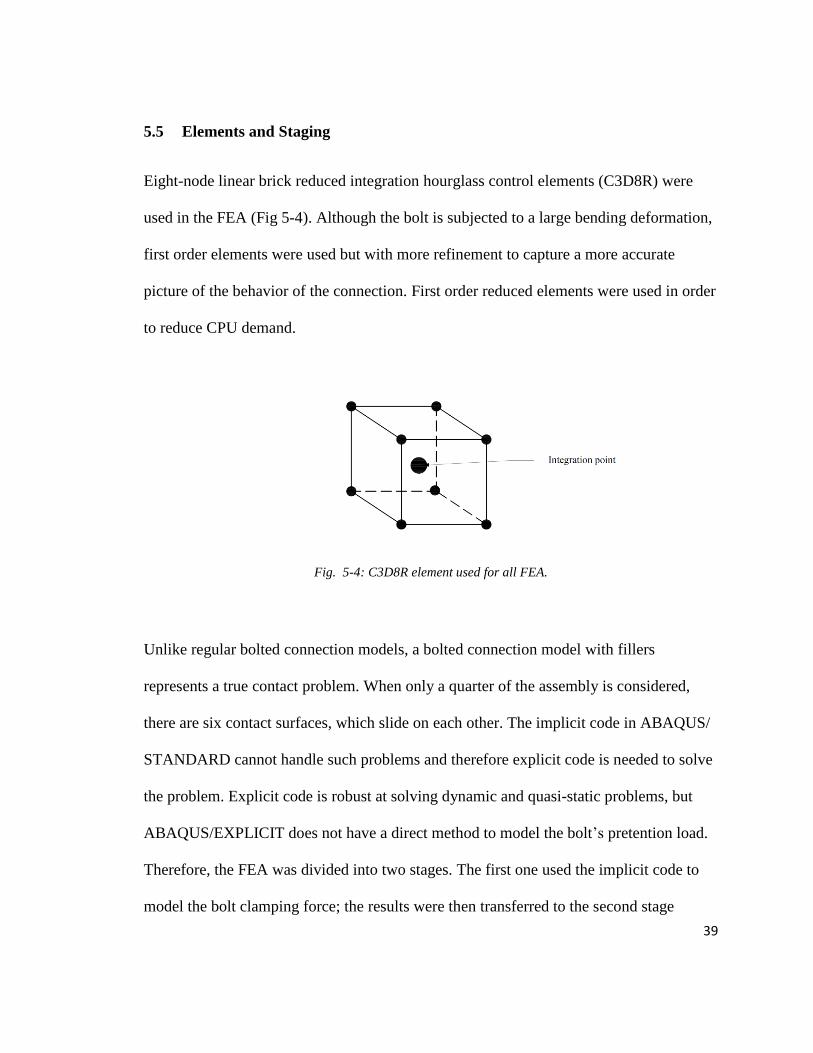
5.5 Elements and Staging
Eight-node linear brick reduced integration hourglass control elements (C3D8R) were
used in the FEA (Fig 5-4). Although the bolt is subjected to a large bending deformation,
first order elements were used but with more refinement to capture a more accurate
picture of the behavior of the connection. First order reduced elements were used in order
to reduce CPU demand.
Fig. 5-4: C3D8R element used for all FEA.
Unlike regular bolted connection models, a bolted connection model with fillers
represents a true contact problem. When only a quarter of the assembly is considered,
there are six contact surfaces, which slide on each other. The implicit code in ABAQUS/
STANDARD cannot handle such problems and therefore explicit code is needed to solve
the problem. Explicit code is robust at solving dynamic and quasi-static problems, but
ABAQUS/EXPLICIT does not have a direct method to model the bolt’s pretention load.
Therefore, the FEA was divided into two stages. The first one used the implicit code to
model the bolt clamping force; the results were then transferred to the second stage
40
(explicit code) where the displacement was applied at the end of the pull plate. When
transferring from ABAQUS/Implicit to ABAQUS/EXPLICIT, a limited number of
elements are available. For the case of 3D modeling, the only available element was the
C3D8R.
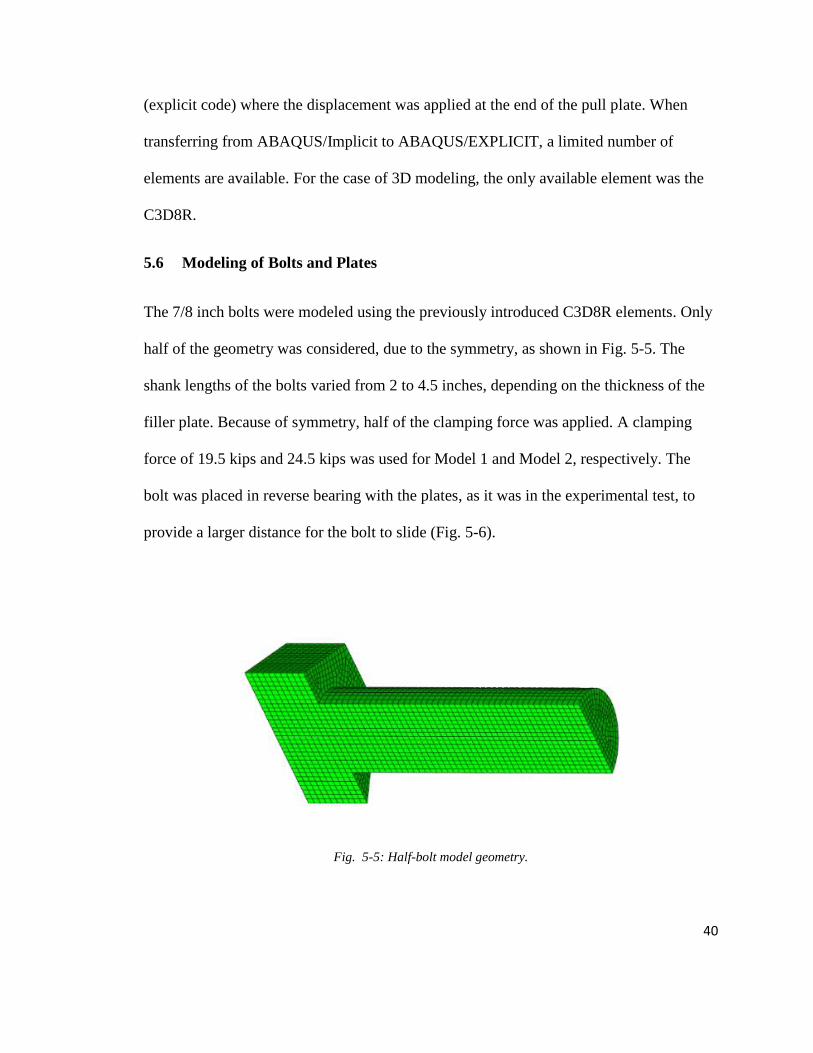
5.6 Modeling of Bolts and Plates
The 7/8 inch bolts were modeled using the previously introduced C3D8R elements. Only
half of the geometry was considered, due to the symmetry, as shown in Fig. 5-5. The
shank lengths of the bolts varied from 2 to 4.5 inches, depending on the thickness of the
filler plate. Because of symmetry, half of the clamping force was applied. A clamping
force of 19.5 kips and 24.5 kips was used for Model 1 and Model 2, respectively. The
bolt was placed in reverse bearing with the plates, as it was in the experimental test, to
provide a larger distance for the bolt to slide (Fig. 5-6).
Fig. 5-5: Half-bolt model geometry.
41
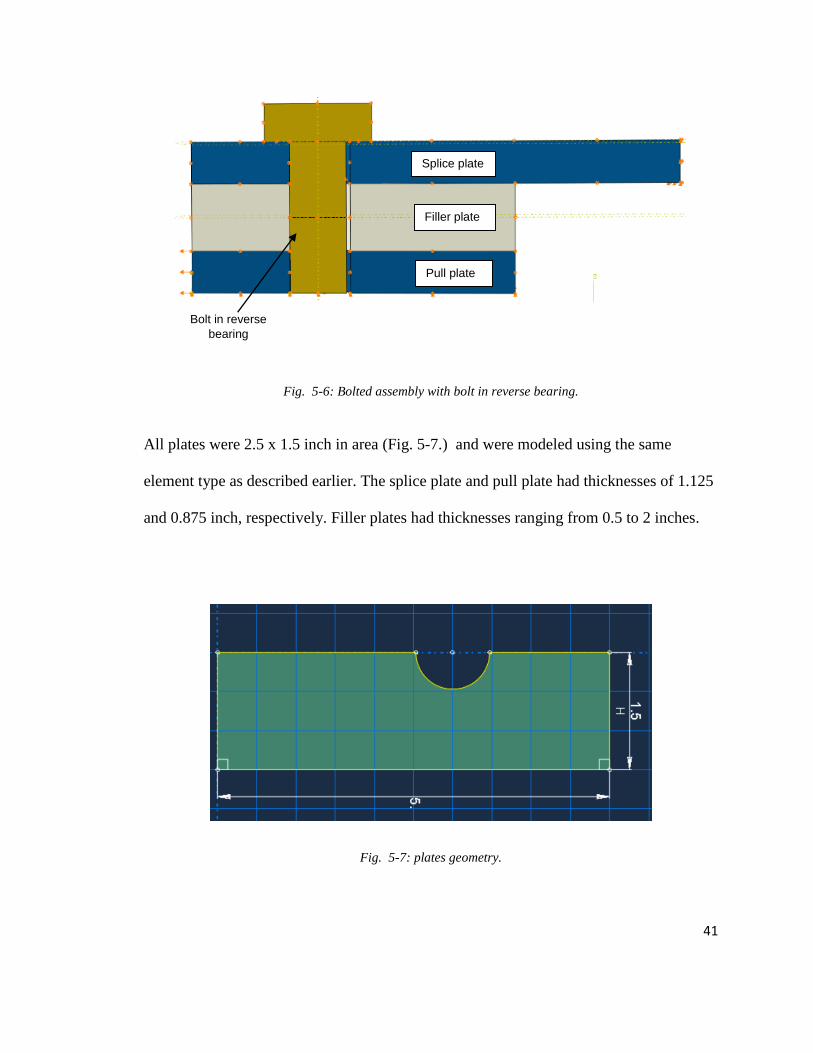
Fig. 5-6: Bolted assembly with bolt in reverse bearing.
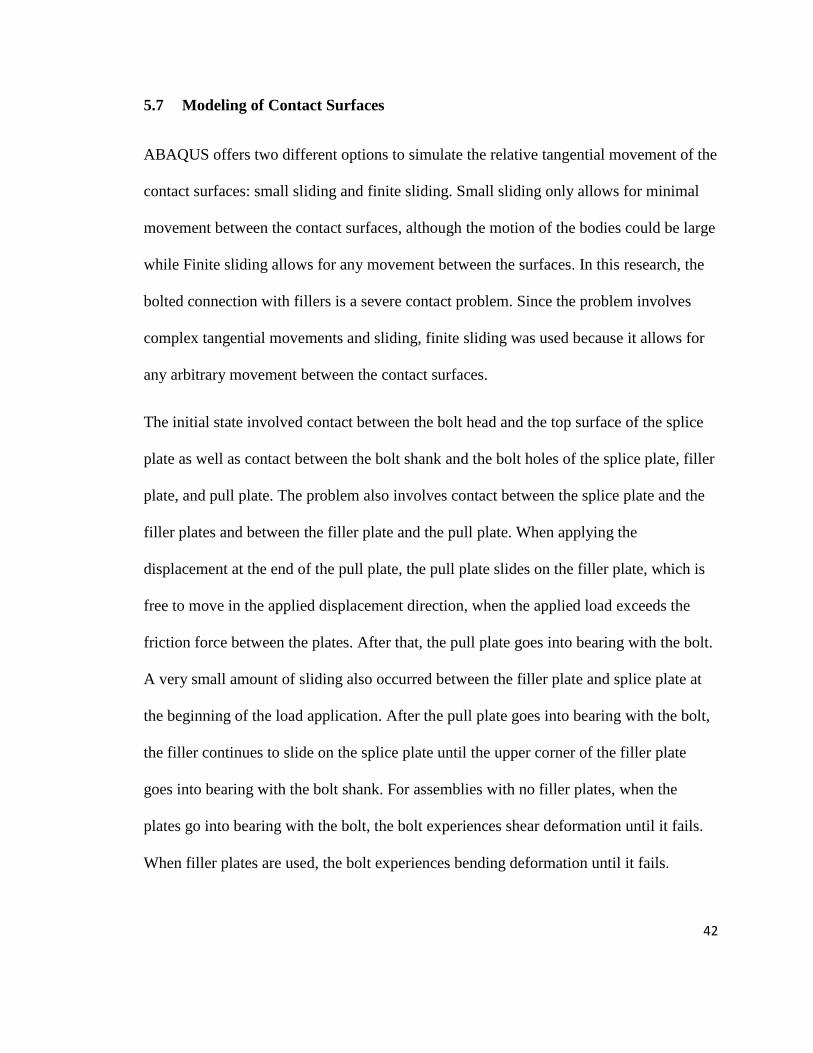
All plates were 2.5 x 1.5 inch in area (Fig. 5-7.) and were modeled using the same
element type as described earlier. The splice plate and pull plate had thicknesses of 1.125
and 0.875 inch, respectively. Filler plates had thicknesses ranging from 0.5 to 2 inches.
Fig. 5-7: plates geometry.
Bolt in reverse
bearing
Splice plate
Filler plate
Pull plate
42
5.7 Modeling of Contact Surfaces
ABAQUS offers two different options to simulate the relative tangential movement of the
contact surfaces: small sliding and finite sliding. Small sliding only allows for minimal
movement between the contact surfaces, although the motion of the bodies could be large
while Finite sliding allows for any movement between the surfaces. In this research, the
bolted connection with fillers is a severe contact problem. Since the problem involves
complex tangential movements and sliding, finite sliding was used because it allows for
any arbitrary movement between the contact surfaces.
The initial state involved contact between the bolt head and the top surface of the splice
plate as well as contact between the bolt shank and the bolt holes of the splice plate, filler
plate, and pull plate. The problem also involves contact between the splice plate and the
filler plates and between the filler plate and the pull plate. When applying the
displacement at the end of the pull plate, the pull plate slides on the filler plate, which is
free to move in the applied displacement direction, when the applied load exceeds the
friction force between the plates. After that, the pull plate goes into bearing with the bolt.
A very small amount of sliding also occurred between the filler plate and splice plate at
the beginning of the load application. After the pull plate goes into bearing with the bolt,
the filler continues to slide on the splice plate until the upper corner of the filler plate
goes into bearing with the bolt shank. For assemblies with no filler plates, when the
plates go into bearing with the bolt, the bolt experiences shear deformation until it fails.
When filler plates are used, the bolt experiences bending deformation until it fails.
43
Friction coefficients of 0.26 and 0.37 were used for steel-on-steel and steel-on-PP,
respectively.
5.8 Mesh
An optimal mesh study was carried out on all parts of the assembly. The bolt and all
plates have the same element size. Unlike ABAQUS/ STANDARD, refinement in
ABAQUS/EXPLICIT should be applied on all models instead of refining certain areas,
because the wave speed is a function of the element size and having different sizes gives
unreliable results. A convergence study was conducted using element sizes of 0.055, 0.1,
and 0.2 in. (Fig. 5-8). An element size of 0.055 inch (blue curve) with second order
accuracy was used in the FEA, as it was found to satisfy the convergence criteria as well
as run with reasonable speed.
44
Fig. 5-8: Convergence study for a connection with no fillers.
(a) 0.2 inch seeds
(a) 0.1 inch seeds
(c) 0.055 inch seeds
(b) Load vs. deformation
45
5.9 Material properties
Five different types of materials were used. The splice plates, pull plates and steel fillers
in Model 1 are A572 GR50 while plastic fillers; bolts are PP and A325 respectively. In
Model 2, steel A572 GR50 and A490 are used for the filler plate and bolts respectively.
Steel A709 GR70 is used for the splice plate and pull plate.
All types of steel were assumed to have a modulus of elasticity around 29,600 ksi. The
data obtained from the tensile test provided engineering stress-strain relationships,
ABAQUS requires the material properties to be true stress-plastic strain. The following
equations were used to transform the stresses and strains:
σ𝑒𝑛𝑔 = 𝑃
𝐴… … … … … … … . . (5.1)
σ𝑇𝑟𝑢𝑒 = σ𝑒𝑛𝑔 ∗ (1 + ℇ𝑒𝑛𝑔) … … … … … … … . . (5.2)
ℇ𝑇𝑟𝑢𝑒 = ln(1 + ℇ𝑒𝑛𝑔) … … … … … … … . . (5.3)
ℇ𝑒𝑓𝑓𝑒𝑐𝑡𝑖𝑣𝑒 𝑝𝑙𝑎𝑠𝑡𝑖𝑐 = ℇ𝑇𝑟𝑢𝑒 − (σ𝑇𝑟𝑢𝑒
𝐸) … … … … … … … . . (5.4)
where:
𝑝 = 𝑎𝑝𝑝𝑙𝑖𝑒𝑑 𝑡𝑒𝑛𝑠𝑖𝑙𝑒 𝑙𝑜𝑎𝑑
σ𝑒𝑛𝑔 = 𝑒𝑛𝑔𝑖𝑛𝑒𝑒𝑟𝑖𝑛𝑔 𝑠𝑡𝑟𝑒𝑠𝑠
σ𝑇𝑟𝑢𝑒 = 𝑡𝑟𝑢𝑒 𝑠𝑡𝑟𝑒𝑠𝑠
ℇ𝑇𝑟𝑢𝑒 = 𝑡𝑟𝑢𝑒 𝑠𝑡𝑟𝑎𝑖𝑛
ℇ𝑒𝑓𝑓𝑒𝑐𝑡𝑖𝑣𝑒 𝑝𝑙𝑎𝑠𝑡𝑖𝑐 = 𝑒𝑓𝑓𝑒𝑐𝑡𝑖𝑣𝑒 𝑝𝑙𝑎𝑠𝑡𝑖𝑐 𝑠𝑡𝑟𝑎𝑖𝑛
46
Fig. 5-9: Engineering stress-strain diagrams for used materials.
A stable time increment in ABAQUS/EXPLICIT is governed by three factors: element
size, material modulus of elasticity, and material density. Increasing the element size can
have a significant effect on the results because the contact between the bolt shank and the
bolt hole requires a fine mesh to capture stresses accurately in that area. Otherwise, stress
concentrations resulting from bearing between bolt and plates would change the results
significantly. Changes of the modulus of elasticity change the element stiffness, which
can lead to false results. The only factor that can be manipulated without affecting the
results is material density. The reason for this is explained later in this section.
Since using the exact steel density (0.009 lbf s2 /in4) in the FEA is very time consuming,
a higher density is needed to reduce CPU time. Using a higher material density results in
47
lower wave velocity. As a result, a larger time increment can be used, which reduces the
running time according to the following equations:
∆𝑡= (𝑙
𝐶𝑑) … … … … … … … . . (5.5)
𝐶𝑑 = √𝐸
𝜌 … … … … … … … . . (5.6)
where:
∆𝑡= 𝑡𝑖𝑚𝑒 𝑖𝑛𝑐𝑟𝑒𝑚𝑒𝑛𝑡
𝑙 = 𝑒𝑙𝑒𝑚𝑒𝑛𝑡 𝑠𝑖𝑧𝑒
𝐶𝑑 = 𝑤𝑎𝑣𝑒 𝑠𝑝𝑒𝑒𝑑
𝐸 = 𝑀𝑜𝑑𝑢𝑙𝑢𝑠 𝑜𝑓 𝐸𝑙𝑎𝑠𝑡𝑖𝑐𝑖𝑡𝑦
𝜌 = 𝑚𝑎𝑡𝑒𝑟𝑖𝑎𝑙 𝑑𝑒𝑛𝑠𝑖𝑡𝑦
The equilibrium equation in ABAQUS/EXPLICIT involves the effect of inertial forces
(Eq. 5.7). Since the problem is quasi-static, the acceleration is very small. Hence, the
inertia force contribution is very small as well; therefore, increasing the mass within
certain limits results in very small changes in the equilibrium equation.
48
𝑀ü = P − I … … … … … . . (5.7)
where:
𝑀 = 𝑚𝑎𝑠𝑠
ü = acceleration
P = external forces
𝐼 = Internal forces
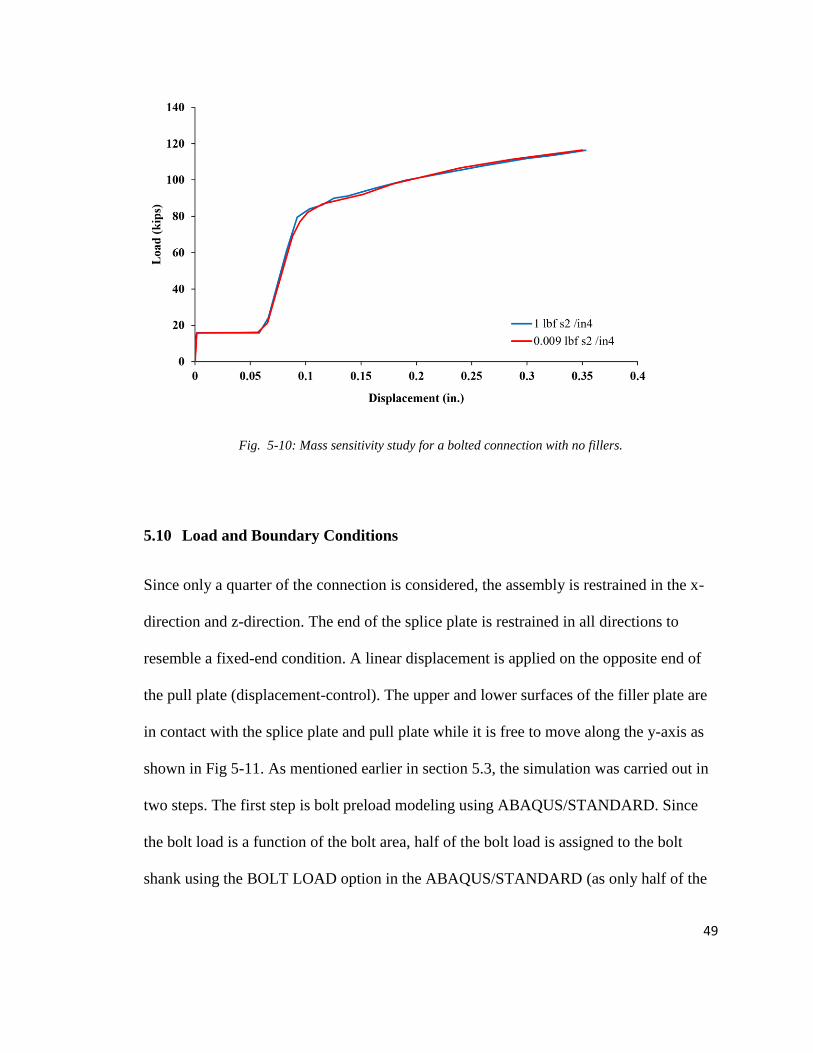
A mass sensitivity study was also conducted by using different material densities (0.009
and 1 lbf s2 /in4) to illustrate the density effects. Load versus deformation for the two
models is shown in Figure 5.10. The model with 1 slug/inch3 density shows a similar
behavior to that of 0.009 lbf s2 /in4 density. A density of 1 slug/inch3 was used for all
FEA to save CPU time. Using this mass density increased the running time significantly.
49
Fig. 5-10: Mass sensitivity study for a bolted connection with no fillers.
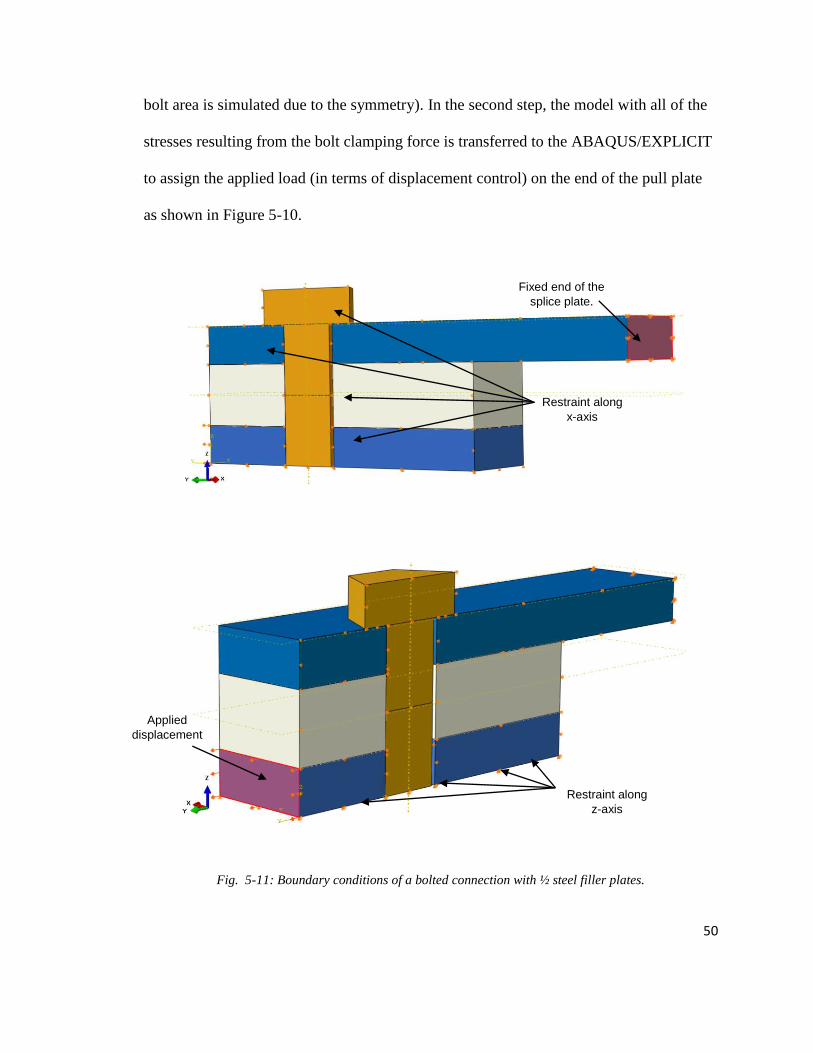
5.10 Load and Boundary Conditions
Since only a quarter of the connection is considered, the assembly is restrained in the x-
direction and z-direction. The end of the splice plate is restrained in all directions to
resemble a fixed-end condition. A linear displacement is applied on the opposite end of
the pull plate (displacement-control). The upper and lower surfaces of the filler plate are
in contact with the splice plate and pull plate while it is free to move along the y-axis as
shown in Fig 5-11. As mentioned earlier in section 5.3, the simulation was carried out in
two steps. The first step is bolt preload modeling using ABAQUS/STANDARD. Since
the bolt load is a function of the bolt area, half of the bolt load is assigned to the bolt
shank using the BOLT LOAD option in the ABAQUS/STANDARD (as only half of the
50
bolt area is simulated due to the symmetry). In the second step, the model with all of the
stresses resulting from the bolt clamping force is transferred to the ABAQUS/EXPLICIT
to assign the applied load (in terms of displacement control) on the end of the pull plate
as shown in Figure 5-10.
Fig. 5-11: Boundary conditions of a bolted connection with ½ steel filler plates.
Fixed end of the
splice plate.
Applied
displacement
Restraint along
x-axis
Restraint along
z-axis
51
6 Finite Element Analysis
To prove the robustness of the FEA model for predicting the behavior of the bolted
connection, model validation of the experimental work is required. For this purpose, eight
FE sub-models were created to simulate connections with PP fillers and connections with
steel fillers.
6.1 Validation of FEA Models.
Four FE sub-models were created and compared with the experimental tests for
validation. These sub-models are summarized in Table 6.1.
Table 6-1: Details of the FEA quarter model.
The resistance load was recorded at the fixed end of the splice plate while the
displacement was recorded at the free end of the pull plate as shown in Fig. 5-11. Load
versus connection deformation curves for both experimental as well as FEA results are
shown in Figs. 6-1, 6-2, 6-3 and 6-4 for comparison. Bolt failure was considered when
Model Sub-
Model
Bolt Plates
Type Length
(in.)
Filler plate Pull plate Splice plate
Material T
(in.)
Material T
(in.)
Material T
(in.)
1
1
7/8
A325x
1.25 - - A572
GR50
0.625 A572
GR50
0.625
2 7/8
A325x
1.75 A572 GR50 0.5 A572
GR50
0.625 A572
GR50
0.625
3 7/8
A325x
1.75 Polypropylene 0.5 A572
GR50
0.625 A572
GR50
0.625
4 7/8
A325x
2.25 Polypropylene 1 A572
GR50
0.625 A572
GR50
0.625
52
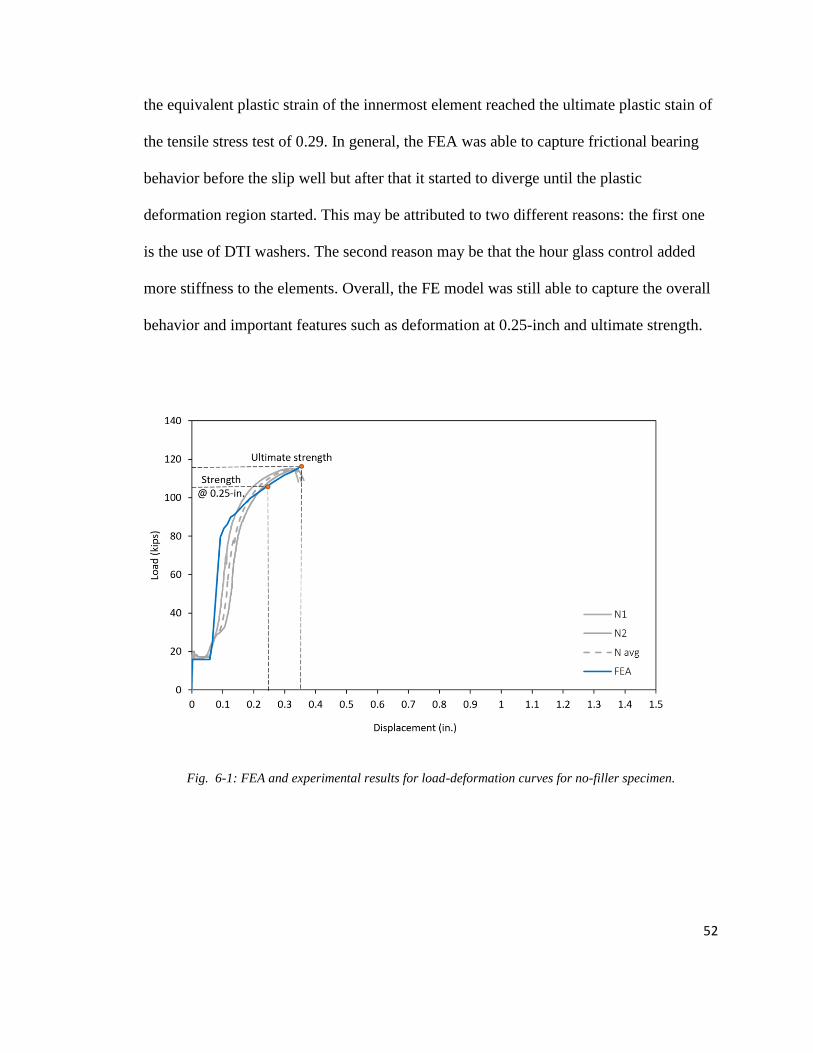
the equivalent plastic strain of the innermost element reached the ultimate plastic stain of
the tensile stress test of 0.29. In general, the FEA was able to capture frictional bearing
behavior before the slip well but after that it started to diverge until the plastic
deformation region started. This may be attributed to two different reasons: the first one
is the use of DTI washers. The second reason may be that the hour glass control added
more stiffness to the elements. Overall, the FE model was still able to capture the overall
behavior and important features such as deformation at 0.25-inch and ultimate strength.
Fig. 6-1: FEA and experimental results for load-deformation curves for no-filler specimen.
53
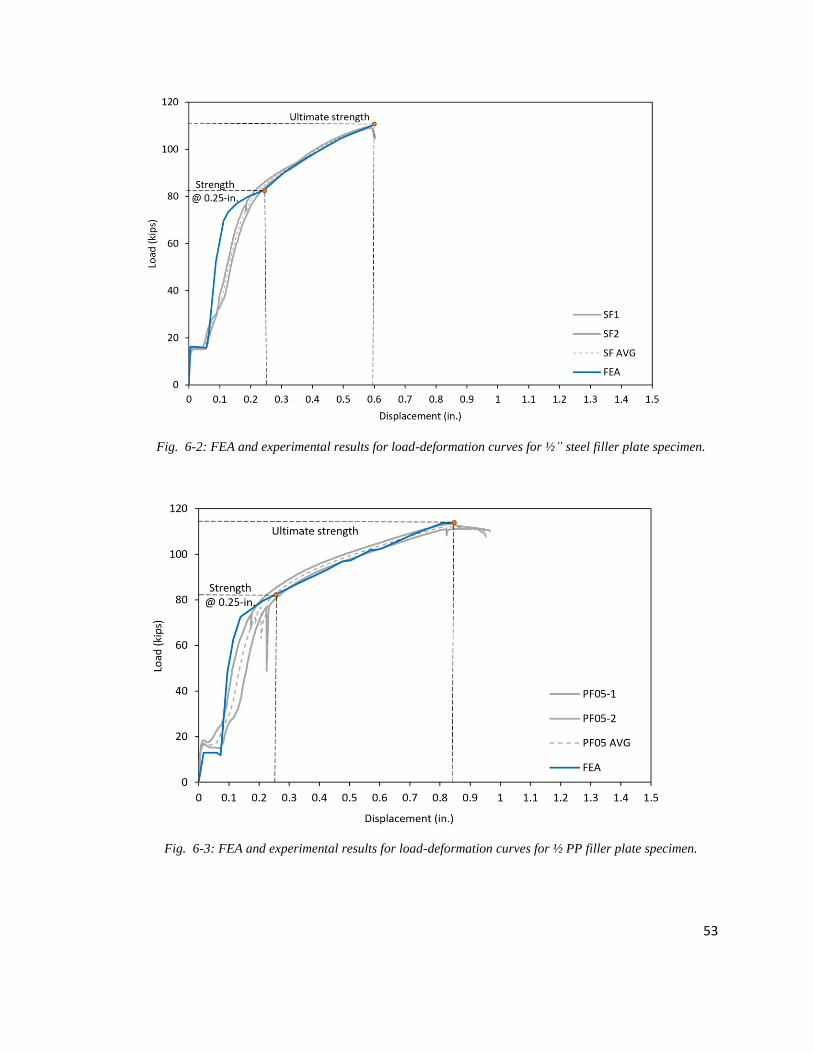
Fig. 6-2: FEA and experimental results for load-deformation curves for ½” steel filler plate specimen.
Fig. 6-3: FEA and experimental results for load-deformation curves for ½ PP filler plate specimen.
54
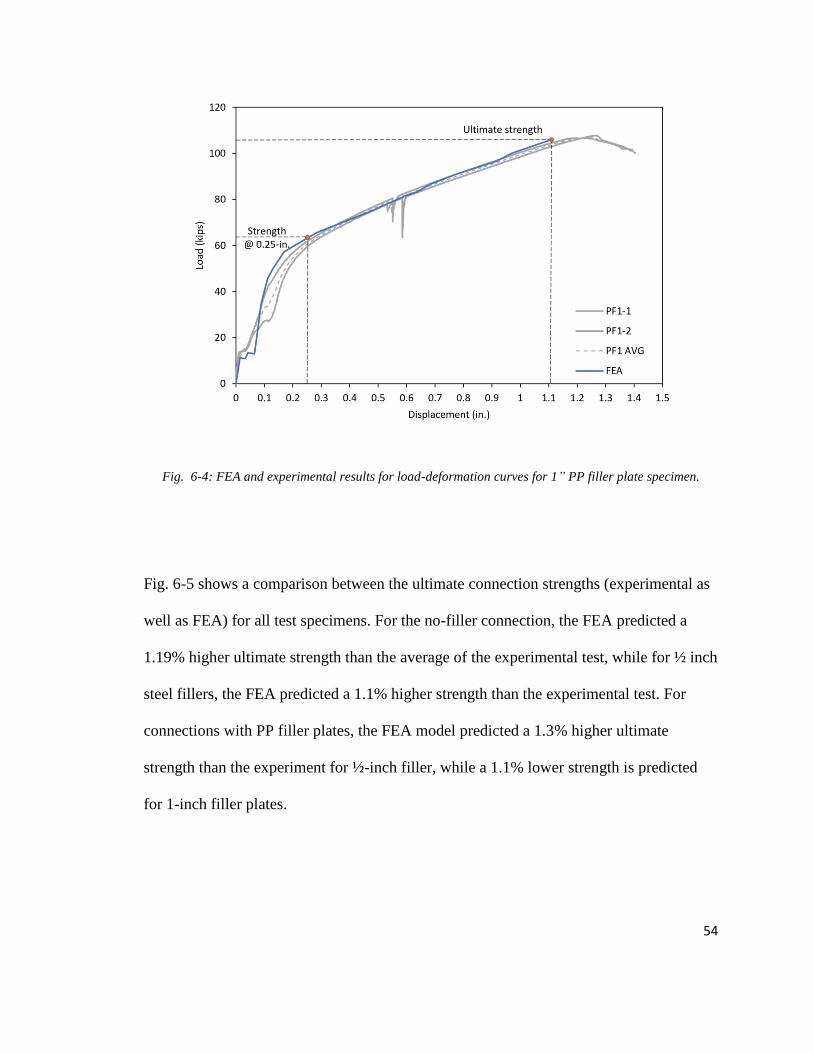
Fig. 6-4: FEA and experimental results for load-deformation curves for 1” PP filler plate specimen.
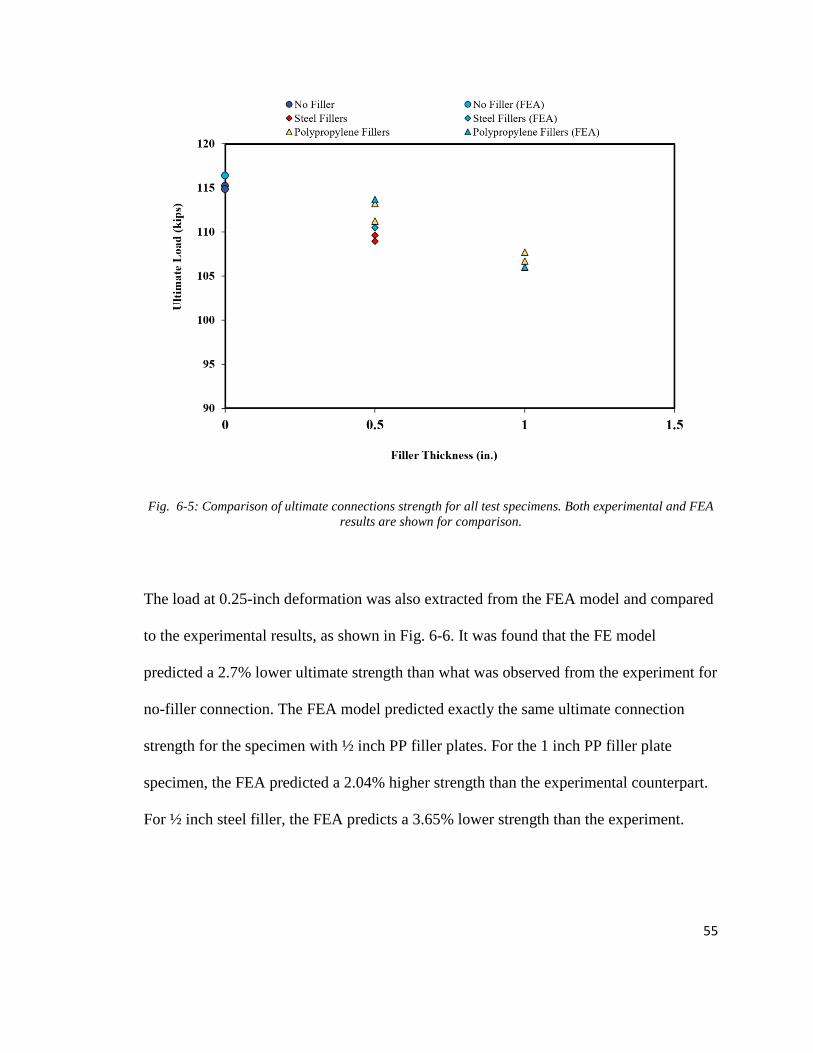
Fig. 6-5 shows a comparison between the ultimate connection strengths (experimental as
well as FEA) for all test specimens. For the no-filler connection, the FEA predicted a
1.19% higher ultimate strength than the average of the experimental test, while for ½ inch
steel fillers, the FEA predicted a 1.1% higher strength than the experimental test. For
connections with PP filler plates, the FEA model predicted a 1.3% higher ultimate
strength than the experiment for ½-inch filler, while a 1.1% lower strength is predicted
for 1-inch filler plates.
55
Fig. 6-5: Comparison of ultimate connections strength for all test specimens. Both experimental and FEA
results are shown for comparison.
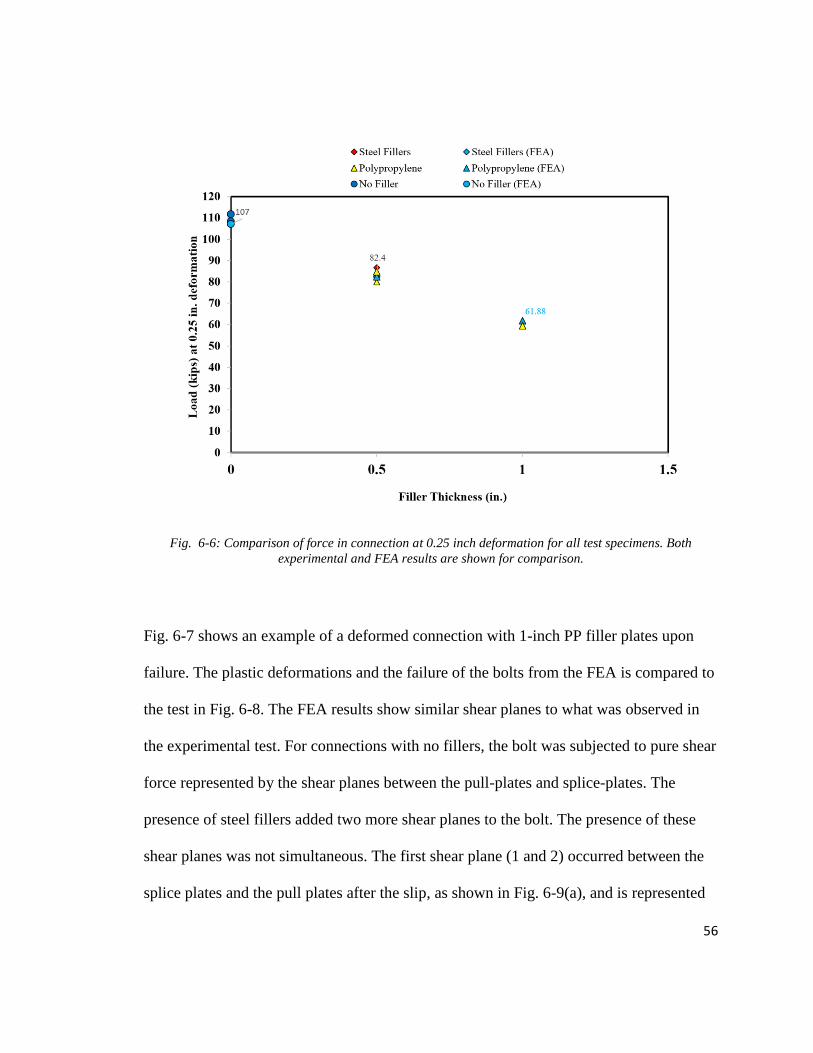
The load at 0.25-inch deformation was also extracted from the FEA model and compared
to the experimental results, as shown in Fig. 6-6. It was found that the FE model
predicted a 2.7% lower ultimate strength than what was observed from the experiment for
no-filler connection. The FEA model predicted exactly the same ultimate connection
strength for the specimen with ½ inch PP filler plates. For the 1 inch PP filler plate
specimen, the FEA predicted a 2.04% higher strength than the experimental counterpart.
For ½ inch steel filler, the FEA predicts a 3.65% lower strength than the experiment.
56
Fig. 6-6: Comparison of force in connection at 0.25 inch deformation for all test specimens. Both
experimental and FEA results are shown for comparison.
Fig. 6-7 shows an example of a deformed connection with 1-inch PP filler plates upon
failure. The plastic deformations and the failure of the bolts from the FEA is compared to
the test in Fig. 6-8. The FEA results show similar shear planes to what was observed in
the experimental test. For connections with no fillers, the bolt was subjected to pure shear
force represented by the shear planes between the pull-plates and splice-plates. The
presence of steel fillers added two more shear planes to the bolt. The presence of these
shear planes was not simultaneous. The first shear plane (1 and 2) occurred between the
splice plates and the pull plates after the slip, as shown in Fig. 6-9(a), and is represented
57
by the diagonal dashed lines. The second shear planes (3 and 4) occurred later at a
deformation of 0.3 inches, between the filler and pull-plate. The failure of the bolt
occurred through the second shear plane at a deformation of 0.6 inches.
Fig. 6-7: Example of (a) test specimen and (b) corresponding FEA model at ultimate connection strength.
(b)
(a)
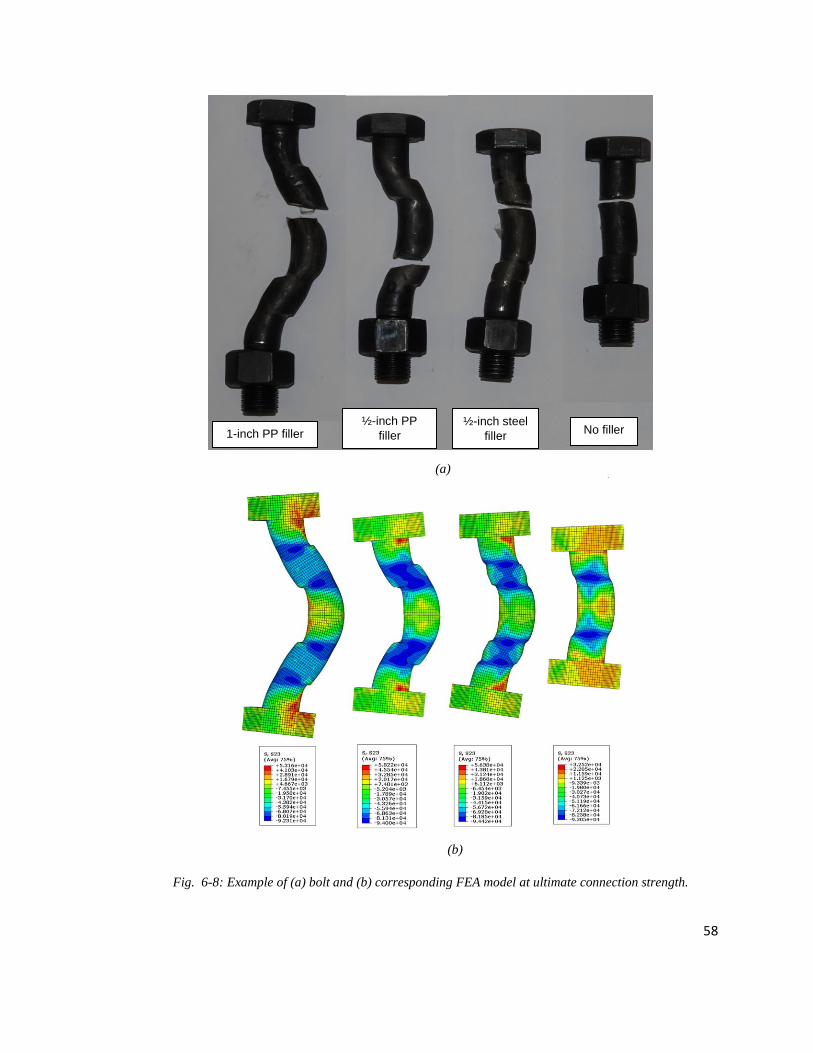
58
Fig. 6-8: Example of (a) bolt and (b) corresponding FEA model at ultimate connection strength.
No filler ½-inch steel
filler
½-inch PP
filler 1-inch PP filler
(a)
(b)
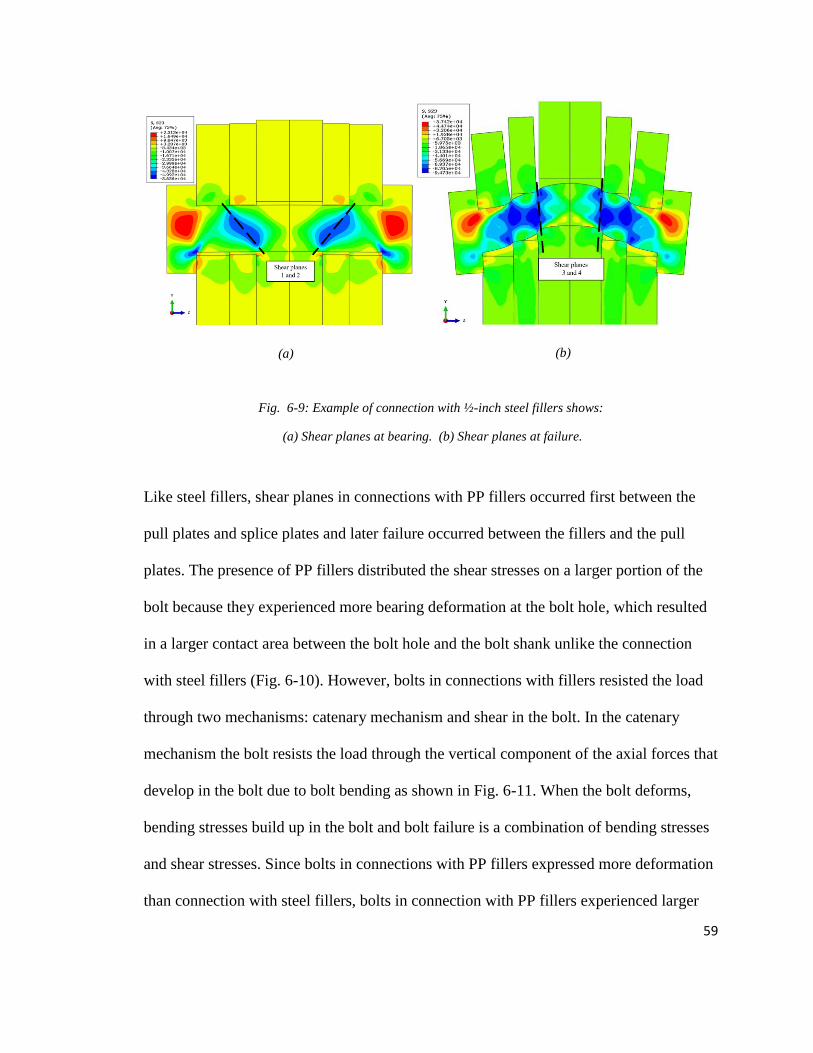
59
Fig. 6-9: Example of connection with ½-inch steel fillers shows:
(a) Shear planes at bearing. (b) Shear planes at failure.
Like steel fillers, shear planes in connections with PP fillers occurred first between the
pull plates and splice plates and later failure occurred between the fillers and the pull
plates. The presence of PP fillers distributed the shear stresses on a larger portion of the
bolt because they experienced more bearing deformation at the bolt hole, which resulted
in a larger contact area between the bolt hole and the bolt shank unlike the connection
with steel fillers (Fig. 6-10). However, bolts in connections with fillers resisted the load
through two mechanisms: catenary mechanism and shear in the bolt. In the catenary
mechanism the bolt resists the load through the vertical component of the axial forces that
develop in the bolt due to bolt bending as shown in Fig. 6-11. When the bolt deforms,
bending stresses build up in the bolt and bolt failure is a combination of bending stresses
and shear stresses. Since bolts in connections with PP fillers expressed more deformation
than connection with steel fillers, bolts in connection with PP fillers experienced larger
(b) (a)
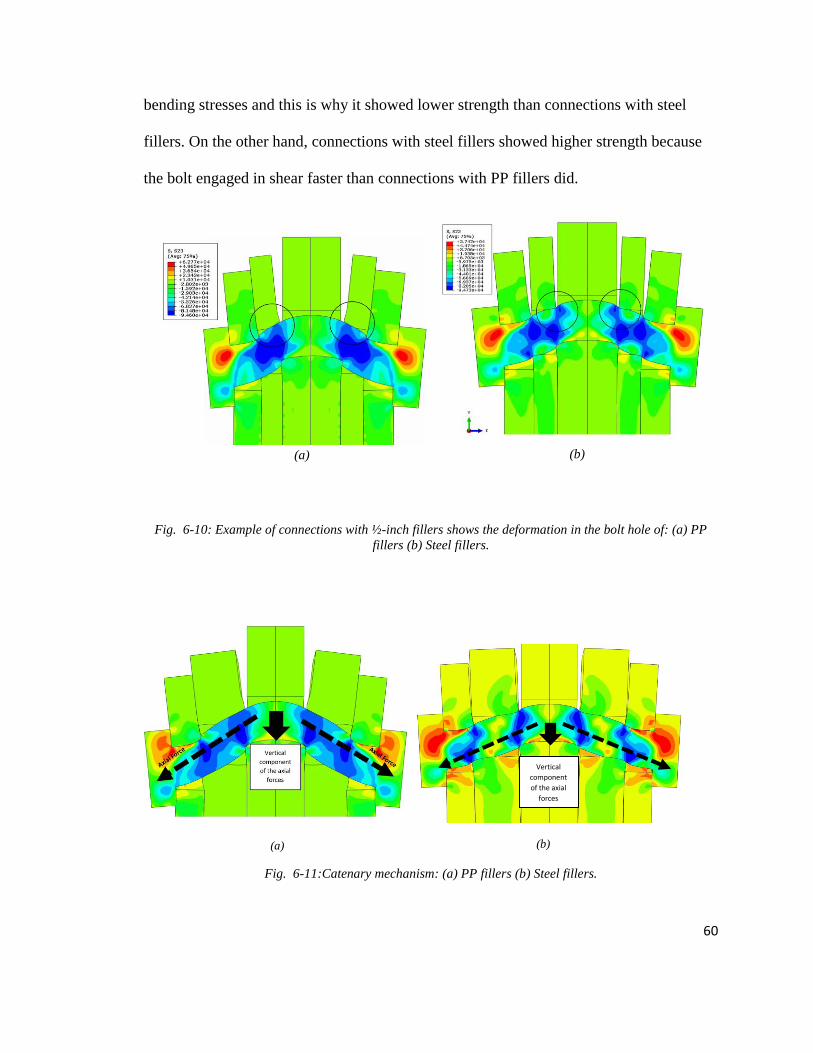
60
bending stresses and this is why it showed lower strength than connections with steel
fillers. On the other hand, connections with steel fillers showed higher strength because
the bolt engaged in shear faster than connections with PP fillers did.
Fig. 6-10: Example of connections with ½-inch fillers shows the deformation in the bolt hole of: (a) PP
fillers (b) Steel fillers.
Fig. 6-11:Catenary mechanism: (a) PP fillers (b) Steel fillers.
(a)
(b)
(b) (a)
Vertical
component
of the axial
forces
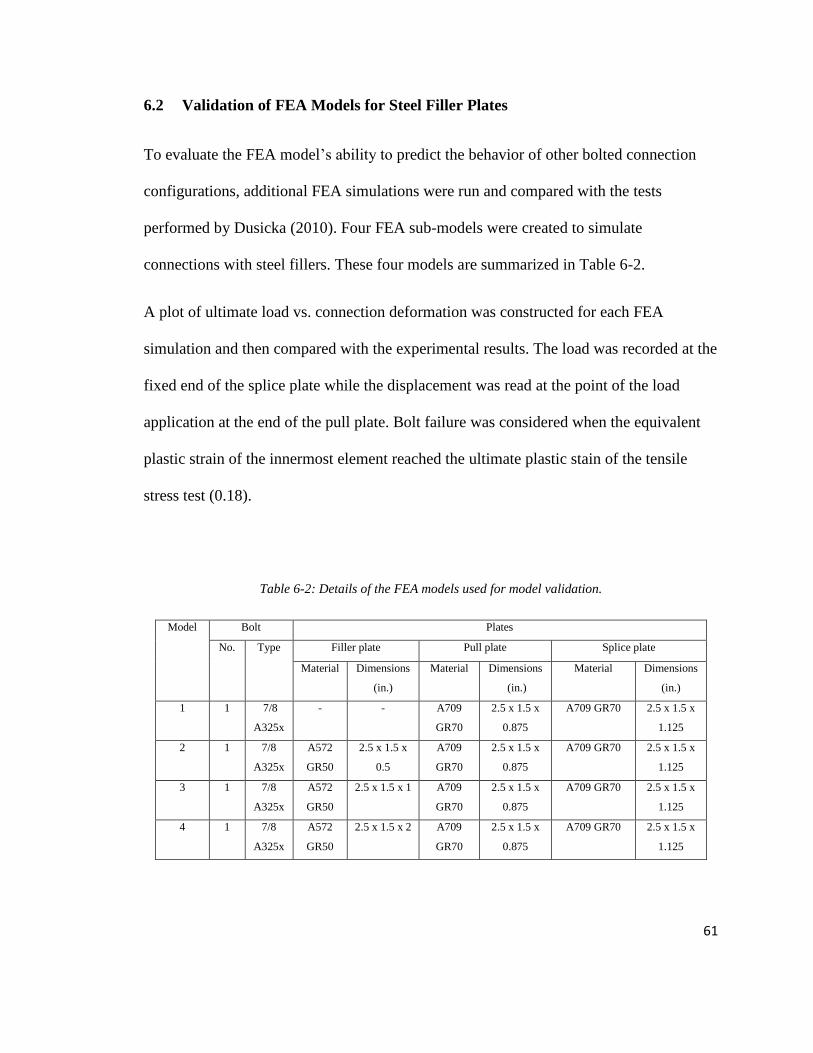
61
6.2 Validation of FEA Models for Steel Filler Plates
To evaluate the FEA model’s ability to predict the behavior of other bolted connection
configurations, additional FEA simulations were run and compared with the tests
performed by Dusicka (2010). Four FEA sub-models were created to simulate
connections with steel fillers. These four models are summarized in Table 6-2.
A plot of ultimate load vs. connection deformation was constructed for each FEA
simulation and then compared with the experimental results. The load was recorded at the
fixed end of the splice plate while the displacement was read at the point of the load
application at the end of the pull plate. Bolt failure was considered when the equivalent
plastic strain of the innermost element reached the ultimate plastic stain of the tensile
stress test (0.18).
Table 6-2: Details of the FEA models used for model validation.
Model Bolt Plates
No. Type Filler plate Pull plate Splice plate
Material Dimensions
(in.)
Material Dimensions
(in.)
Material Dimensions
(in.)
1 1 7/8
A325x
- - A709
GR70
2.5 x 1.5 x
0.875
A709 GR70 2.5 x 1.5 x
1.125
2 1 7/8
A325x
A572
GR50
2.5 x 1.5 x
0.5
A709
GR70
2.5 x 1.5 x
0.875
A709 GR70 2.5 x 1.5 x
1.125
3 1 7/8
A325x
A572
GR50
2.5 x 1.5 x 1 A709
GR70
2.5 x 1.5 x
0.875
A709 GR70 2.5 x 1.5 x
1.125
4 1 7/8
A325x
A572
GR50
2.5 x 1.5 x 2 A709
GR70
2.5 x 1.5 x
0.875
A709 GR70 2.5 x 1.5 x
1.125
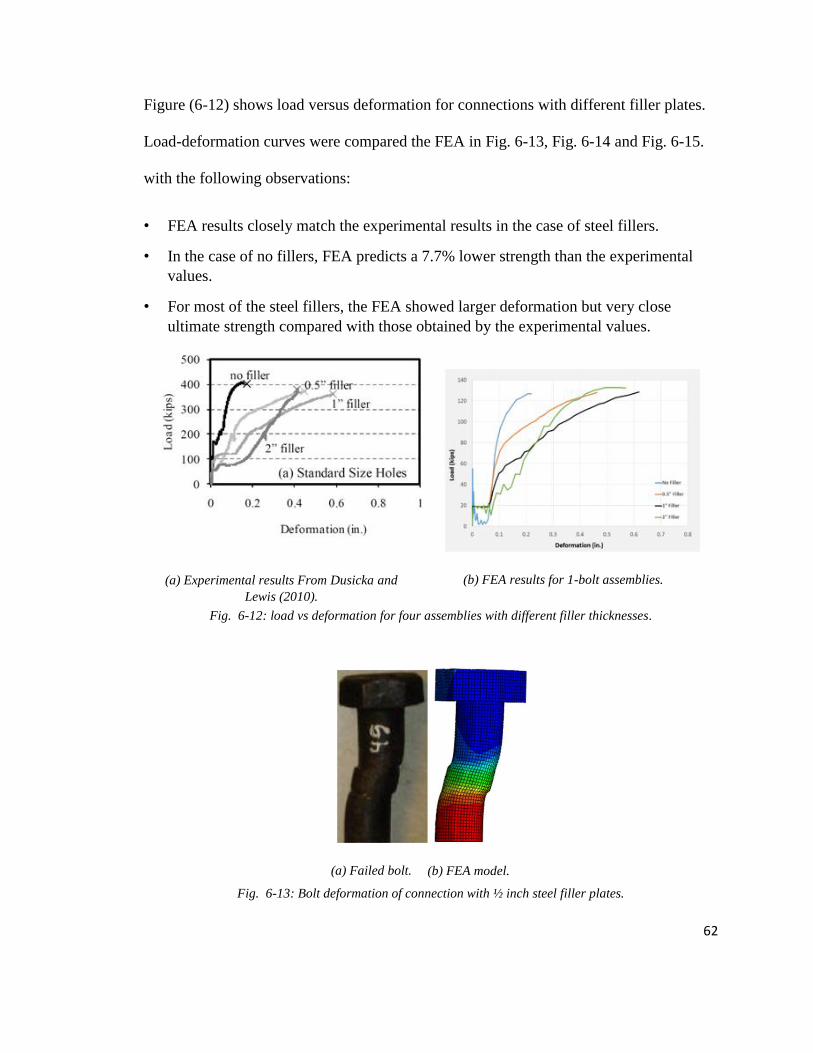
62
Figure (6-12) shows load versus deformation for connections with different filler plates.
Load-deformation curves were compared the FEA in Fig. 6-13, Fig. 6-14 and Fig. 6-15.
with the following observations:
• FEA results closely match the experimental results in the case of steel fillers.
• In the case of no fillers, FEA predicts a 7.7% lower strength than the experimental
values.
• For most of the steel fillers, the FEA showed larger deformation but very close
ultimate strength compared with those obtained by the experimental values.
Fig. 6-12: load vs deformation for four assemblies with different filler thicknesses.
Fig. 6-13: Bolt deformation of connection with ½ inch steel filler plates.
(b) FEA results for 1-bolt assemblies.
(a) Experimental results From Dusicka and
Lewis (2010).
(a) Failed bolt. (b) FEA model.
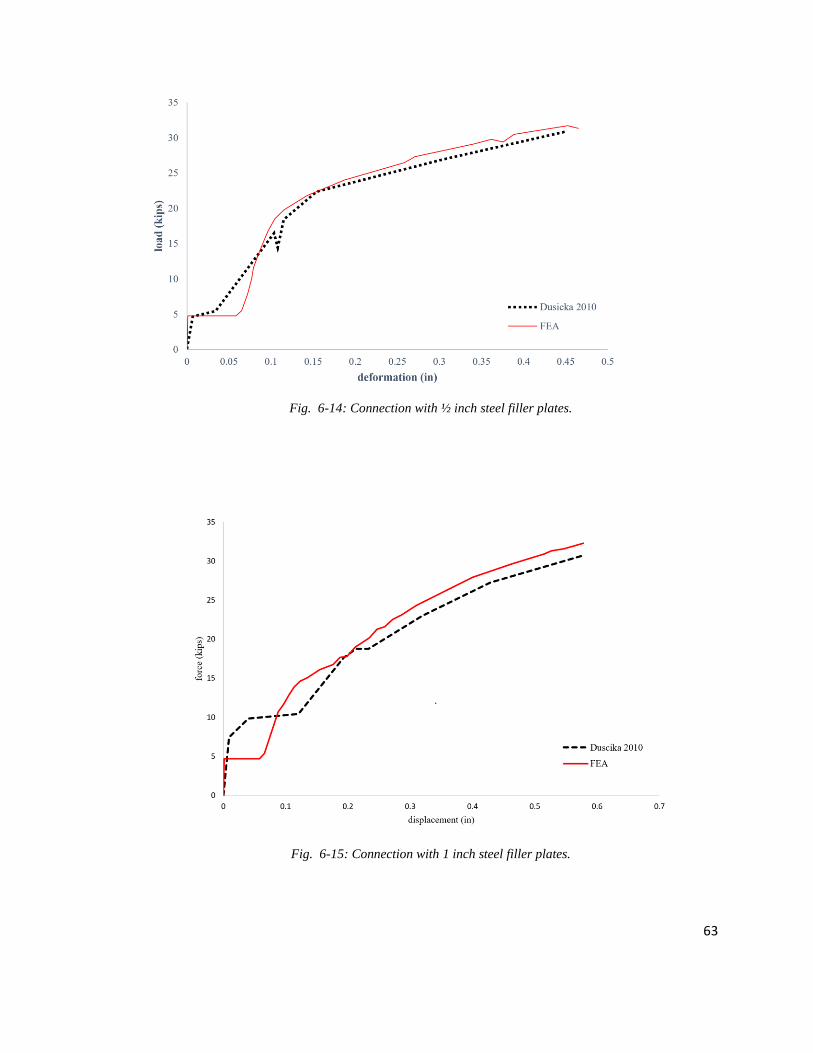
63
Fig. 6-14: Connection with ½ inch steel filler plates.
Fig. 6-15: Connection with 1 inch steel filler plates.
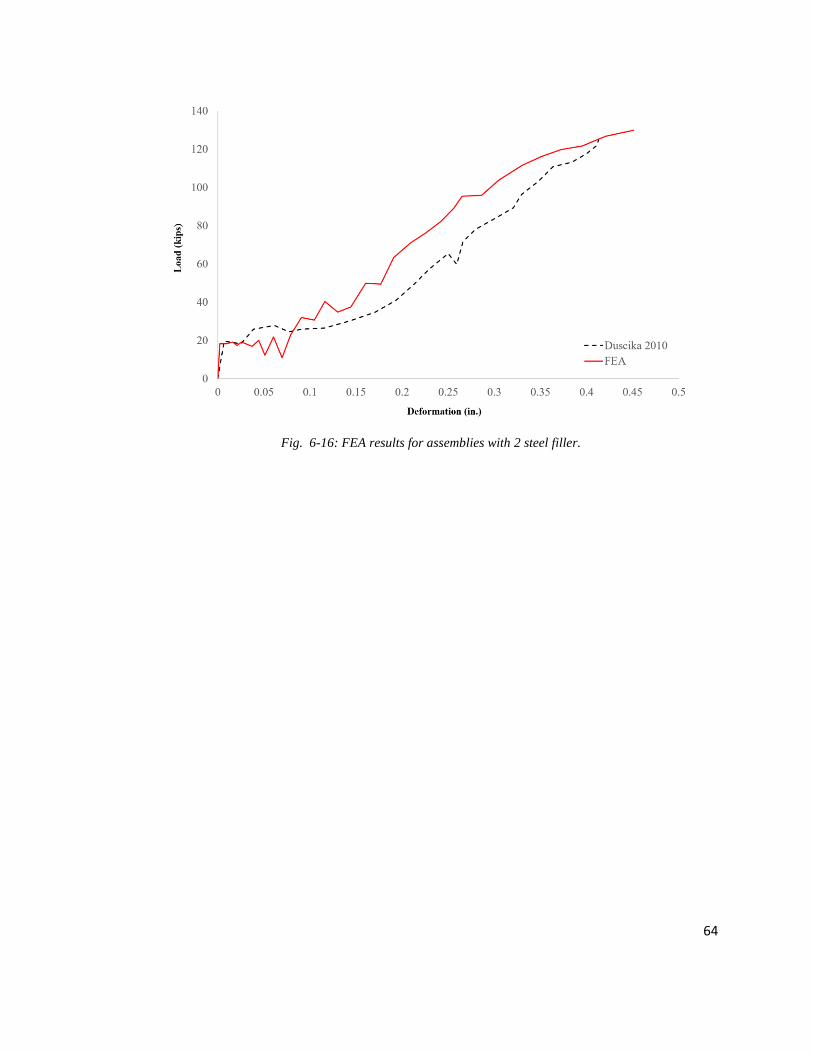
64
Fig. 6-16: FEA results for assemblies with 2 steel filler.
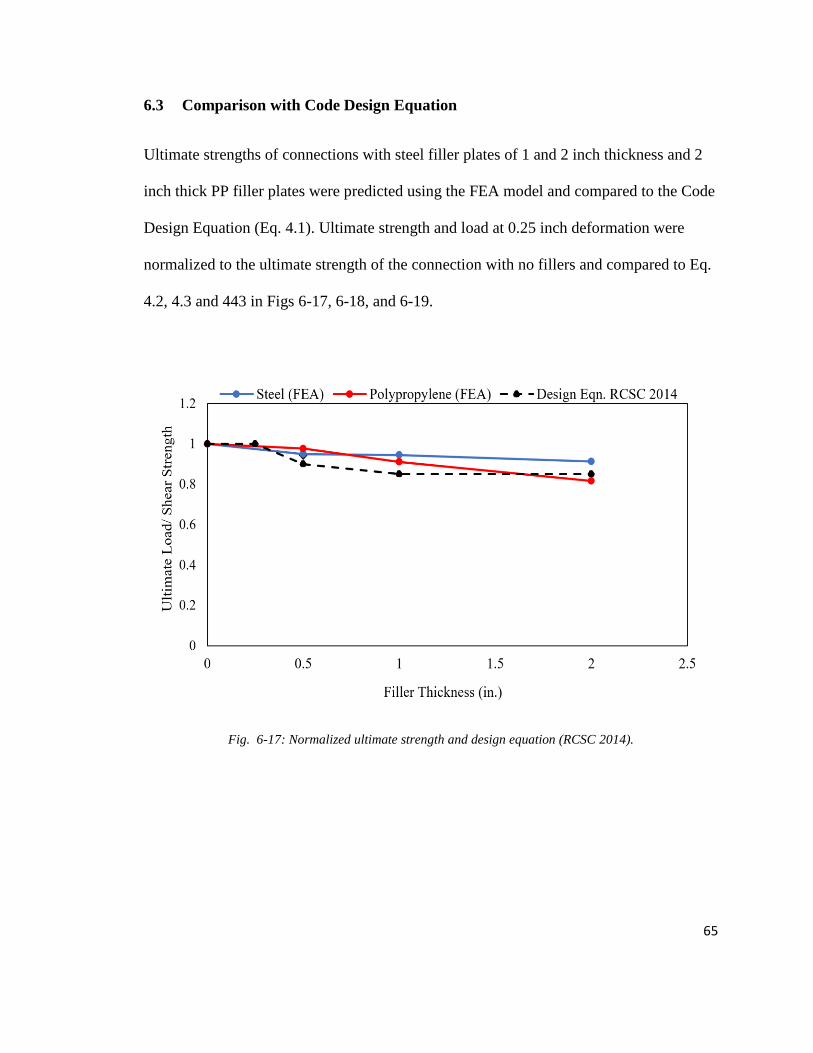
65
6.3 Comparison with Code Design Equation
Ultimate strengths of connections with steel filler plates of 1 and 2 inch thickness and 2
inch thick PP filler plates were predicted using the FEA model and compared to the Code
Design Equation (Eq. 4.1). Ultimate strength and load at 0.25 inch deformation were
normalized to the ultimate strength of the connection with no fillers and compared to Eq.
4.2, 4.3 and 443 in Figs 6-17, 6-18, and 6-19.
Fig. 6-17: Normalized ultimate strength and design equation (RCSC 2014).
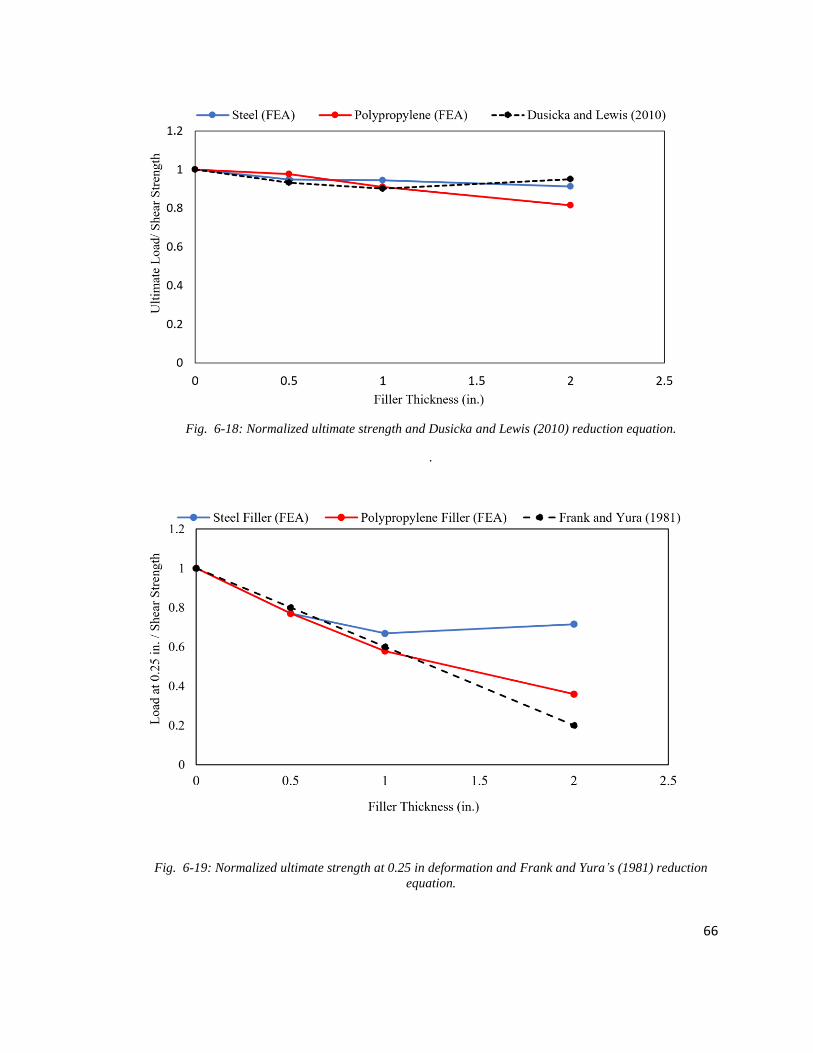
66
Fig. 6-18: Normalized ultimate strength and Dusicka and Lewis (2010) reduction equation.
.
Fig. 6-19: Normalized ultimate strength at 0.25 in deformation and Frank and Yura’s (1981) reduction
equation.
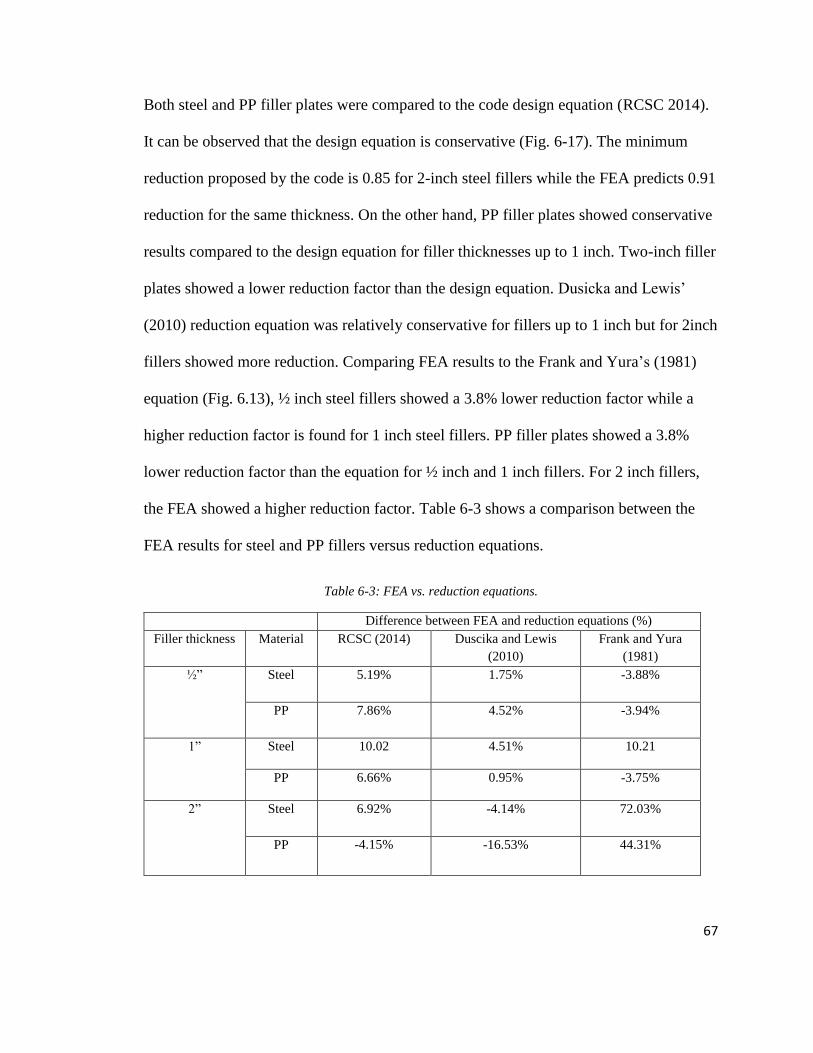
67
Both steel and PP filler plates were compared to the code design equation (RCSC 2014).
It can be observed that the design equation is conservative (Fig. 6-17). The minimum
reduction proposed by the code is 0.85 for 2-inch steel fillers while the FEA predicts 0.91
reduction for the same thickness. On the other hand, PP filler plates showed conservative
results compared to the design equation for filler thicknesses up to 1 inch. Two-inch filler
plates showed a lower reduction factor than the design equation. Dusicka and Lewis’
(2010) reduction equation was relatively conservative for fillers up to 1 inch but for 2inch
fillers showed more reduction. Comparing FEA results to the Frank and Yura’s (1981)
equation (Fig. 6.13), ½ inch steel fillers showed a 3.8% lower reduction factor while a
higher reduction factor is found for 1 inch steel fillers. PP filler plates showed a 3.8%
lower reduction factor than the equation for ½ inch and 1 inch fillers. For 2 inch fillers,
the FEA showed a higher reduction factor. Table 6-3 shows a comparison between the
FEA results for steel and PP fillers versus reduction equations.
Table 6-3: FEA vs. reduction equations.
Difference between FEA and reduction equations (%)
Filler thickness Material RCSC (2014) Duscika and Lewis
(2010)
Frank and Yura
(1981)
½” Steel 5.19% 1.75%
-3.88%
PP 7.86%
4.52% -3.94%
1” Steel 10.02
4.51% 10.21
PP 6.66% 0.95% -3.75%
2” Steel 6.92% -4.14%
72.03%
PP -4.15% -16.53%
44.31%

68
This drives us to the conclusion that up to 1 inch filler thickness, PP fillers behave like
steel fillers and for design consideration, all equations can be used to predict connection
strength.
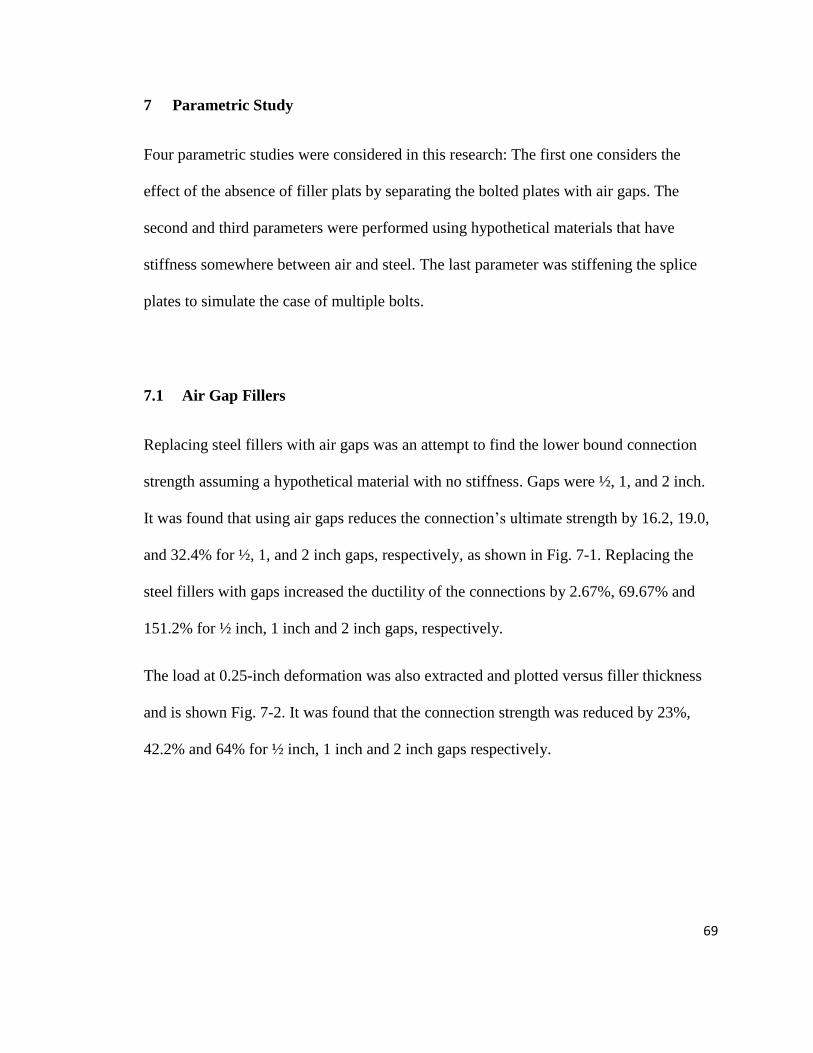
69
7 Parametric Study
Four parametric studies were considered in this research: The first one considers the
effect of the absence of filler plats by separating the bolted plates with air gaps. The
second and third parameters were performed using hypothetical materials that have
stiffness somewhere between air and steel. The last parameter was stiffening the splice
plates to simulate the case of multiple bolts.
7.1 Air Gap Fillers
Replacing steel fillers with air gaps was an attempt to find the lower bound connection
strength assuming a hypothetical material with no stiffness. Gaps were ½, 1, and 2 inch.
It was found that using air gaps reduces the connection’s ultimate strength by 16.2, 19.0,
and 32.4% for ½, 1, and 2 inch gaps, respectively, as shown in Fig. 7-1. Replacing the
steel fillers with gaps increased the ductility of the connections by 2.67%, 69.67% and
151.2% for ½ inch, 1 inch and 2 inch gaps, respectively.
The load at 0.25-inch deformation was also extracted and plotted versus filler thickness
and is shown Fig. 7-2. It was found that the connection strength was reduced by 23%,
42.2% and 64% for ½ inch, 1 inch and 2 inch gaps respectively.
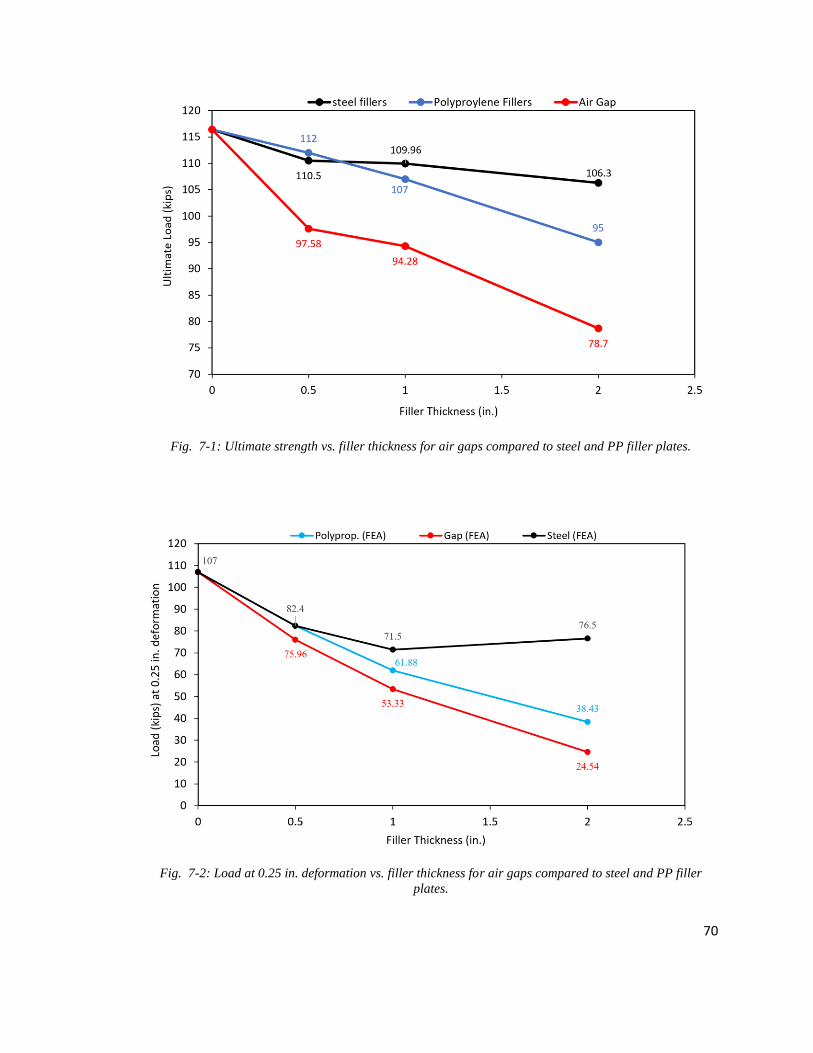
70
Fig. 7-1: Ultimate strength vs. filler thickness for air gaps compared to steel and PP filler plates.
Fig. 7-2: Load at 0.25 in. deformation vs. filler thickness for air gaps compared to steel and PP filler
plates.
71
Connections with air gaps represent a true case of the catenary action because the
excessive bending in the splice plate along with the absence of bearing resistance of the
filler plates at the bolt hole allowed the bolt to exhibit larger deformation, as shown in
Fig. 7-3. Because of the excessive bending in the bolt, larger bending stresses build up in
the bolt and this reduced the bolt strength before it failed in shear.
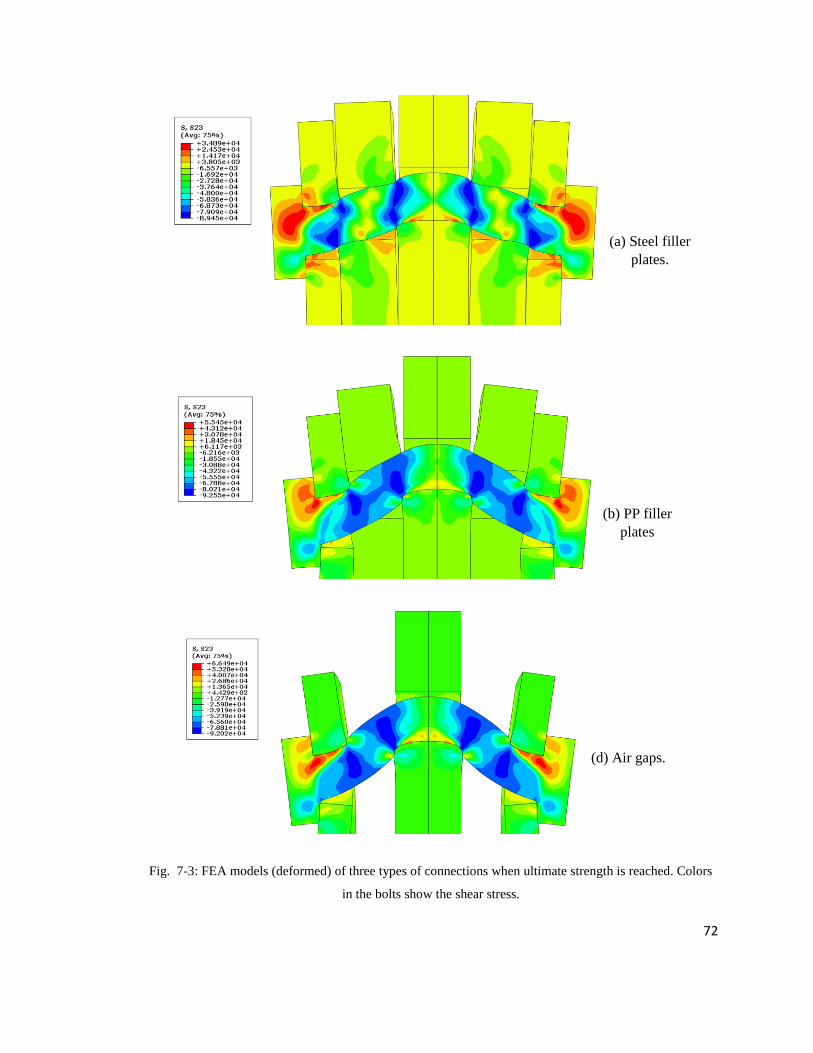
72
Fig. 7-3: FEA models (deformed) of three types of connections when ultimate strength is reached. Colors
in the bolts show the shear stress.
(d) Air gaps.
(a) Steel filler
plates.
(b) PP filler
plates
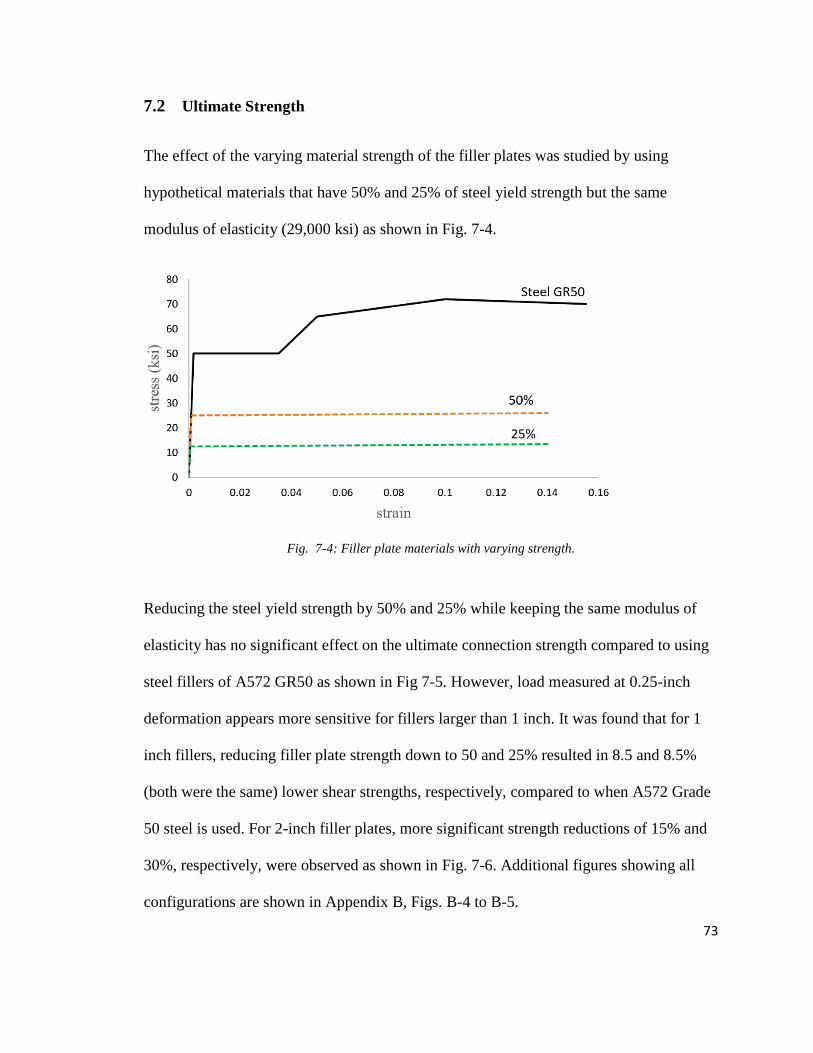
73
7.2 Ultimate Strength
The effect of the varying material strength of the filler plates was studied by using
hypothetical materials that have 50% and 25% of steel yield strength but the same
modulus of elasticity (29,000 ksi) as shown in Fig. 7-4.
Fig. 7-4: Filler plate materials with varying strength.
Reducing the steel yield strength by 50% and 25% while keeping the same modulus of
elasticity has no significant effect on the ultimate connection strength compared to using
steel fillers of A572 GR50 as shown in Fig 7-5. However, load measured at 0.25-inch
deformation appears more sensitive for fillers larger than 1 inch. It was found that for 1
inch fillers, reducing filler plate strength down to 50 and 25% resulted in 8.5 and 8.5%
(both were the same) lower shear strengths, respectively, compared to when A572 Grade
50 steel is used. For 2-inch filler plates, more significant strength reductions of 15% and
30%, respectively, were observed as shown in Fig. 7-6. Additional figures showing all
configurations are shown in Appendix B, Figs. B-4 to B-5.
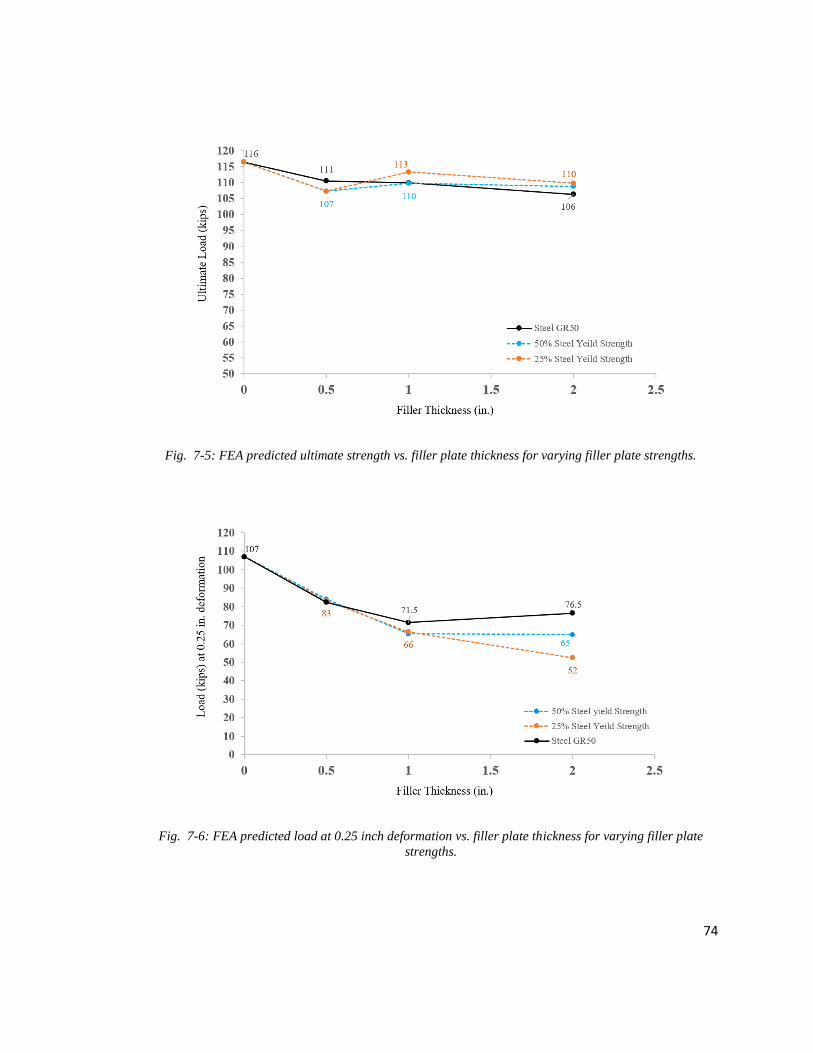
74
Fig. 7-5: FEA predicted ultimate strength vs. filler plate thickness for varying filler plate strengths.
Fig. 7-6: FEA predicted load at 0.25 inch deformation vs. filler plate thickness for varying filler plate
strengths.
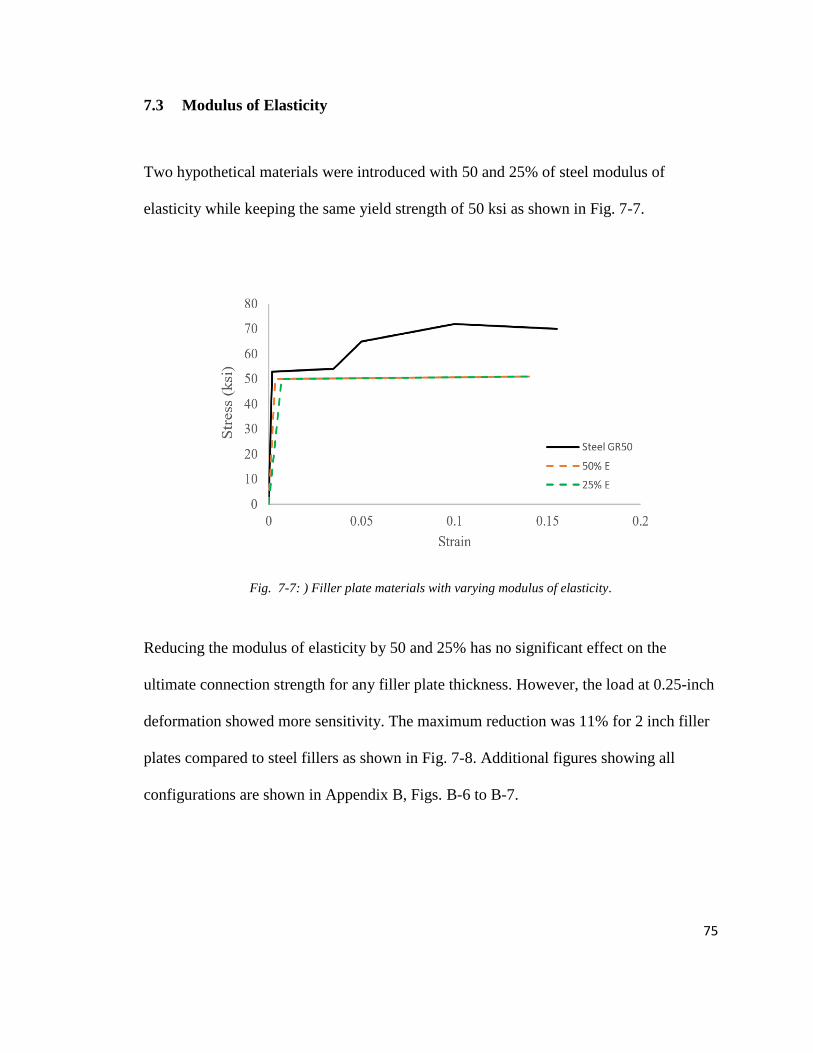
75
7.3 Modulus of Elasticity
Two hypothetical materials were introduced with 50 and 25% of steel modulus of
elasticity while keeping the same yield strength of 50 ksi as shown in Fig. 7-7.
Fig. 7-7: ) Filler plate materials with varying modulus of elasticity.
Reducing the modulus of elasticity by 50 and 25% has no significant effect on the
ultimate connection strength for any filler plate thickness. However, the load at 0.25-inch
deformation showed more sensitivity. The maximum reduction was 11% for 2 inch filler
plates compared to steel fillers as shown in Fig. 7-8. Additional figures showing all
configurations are shown in Appendix B, Figs. B-6 to B-7.
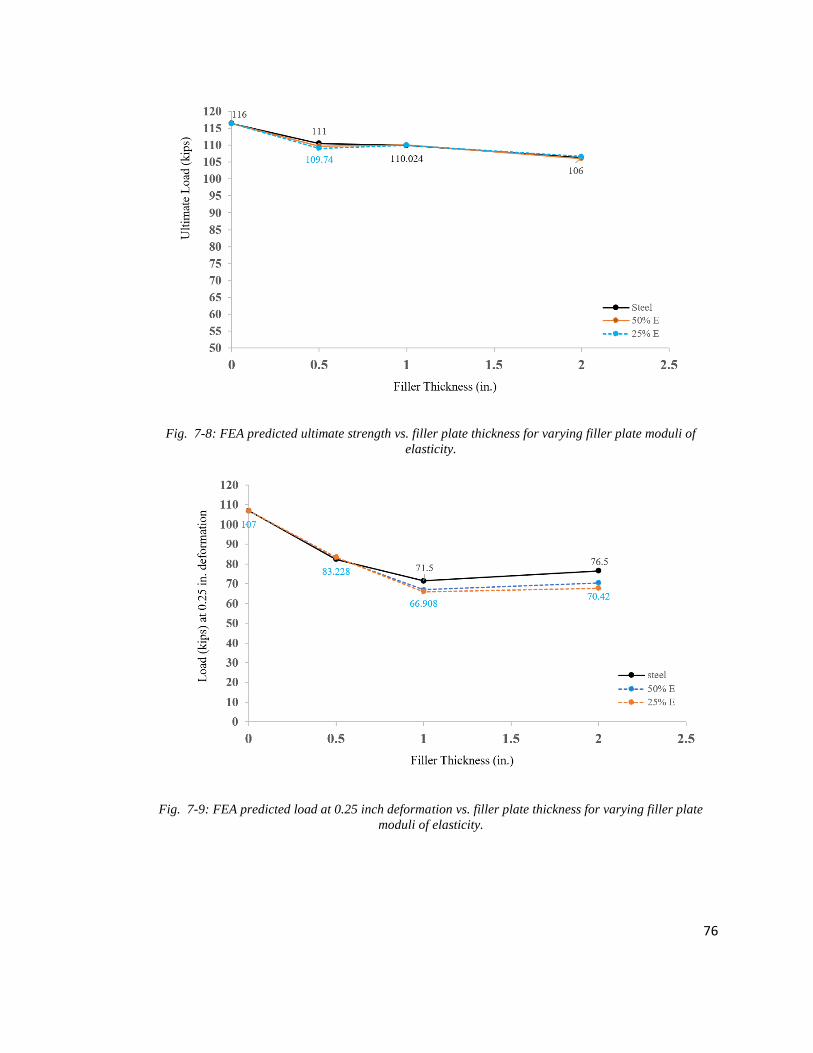
76
Fig. 7-8: FEA predicted ultimate strength vs. filler plate thickness for varying filler plate moduli of
elasticity.
Fig. 7-9: FEA predicted load at 0.25 inch deformation vs. filler plate thickness for varying filler plate
moduli of elasticity.
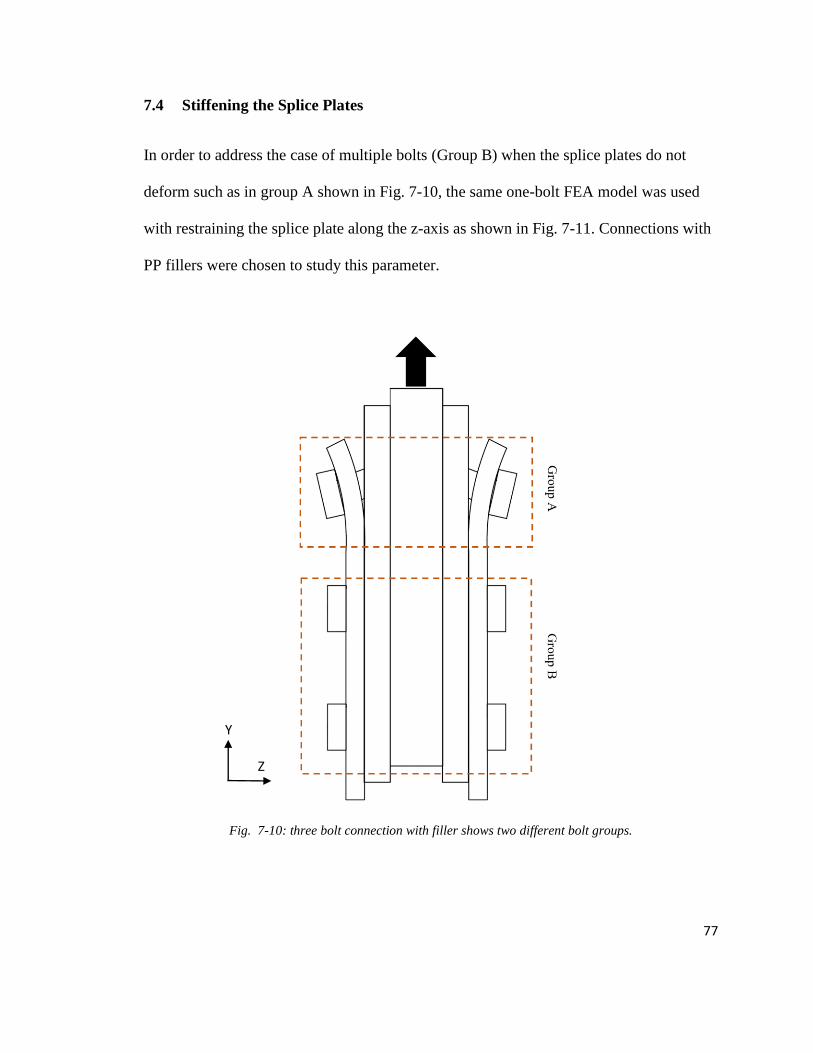
77
7.4 Stiffening the Splice Plates
In order to address the case of multiple bolts (Group B) when the splice plates do not
deform such as in group A shown in Fig. 7-10, the same one-bolt FEA model was used
with restraining the splice plate along the z-axis as shown in Fig. 7-11. Connections with
PP fillers were chosen to study this parameter.
Fig. 7-10: three bolt connection with filler shows two different bolt groups.
Z
Y
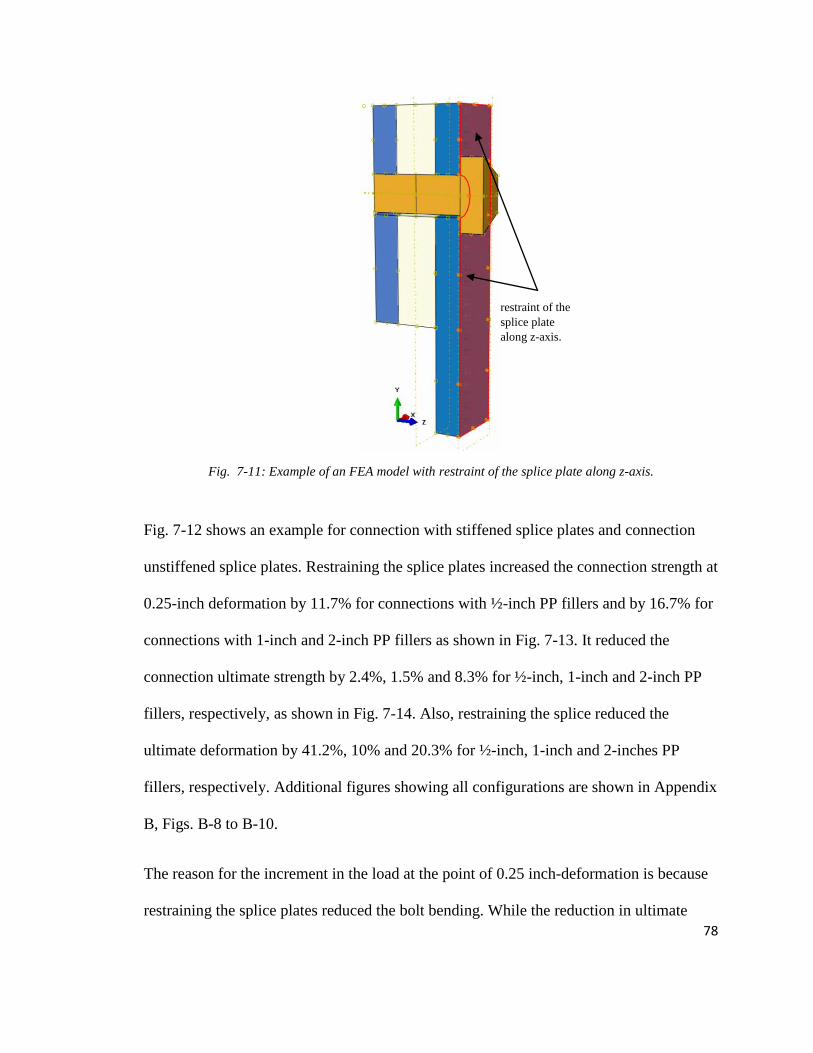
78
Fig. 7-11: Example of an FEA model with restraint of the splice plate along z-axis.
Fig. 7-12 shows an example for connection with stiffened splice plates and connection
unstiffened splice plates. Restraining the splice plates increased the connection strength at
0.25-inch deformation by 11.7% for connections with ½-inch PP fillers and by 16.7% for
connections with 1-inch and 2-inch PP fillers as shown in Fig. 7-13. It reduced the
connection ultimate strength by 2.4%, 1.5% and 8.3% for ½-inch, 1-inch and 2-inch PP
fillers, respectively, as shown in Fig. 7-14. Also, restraining the splice reduced the
ultimate deformation by 41.2%, 10% and 20.3% for ½-inch, 1-inch and 2-inches PP
fillers, respectively. Additional figures showing all configurations are shown in Appendix
B, Figs. B-8 to B-10.
The reason for the increment in the load at the point of 0.25 inch-deformation is because
restraining the splice plates reduced the bolt bending. While the reduction in ultimate
restraint of the
splice plate
along z-axis.
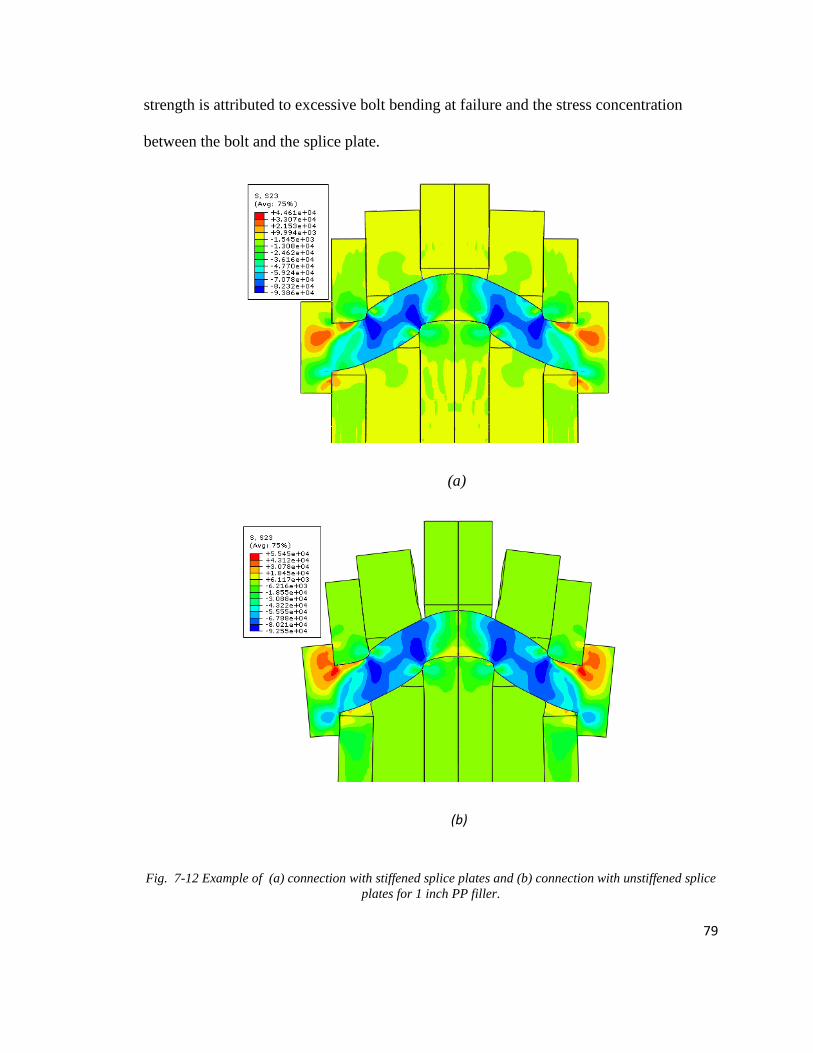
79
strength is attributed to excessive bolt bending at failure and the stress concentration
between the bolt and the splice plate.
(a)
(b)
Fig. 7-12 Example of (a) connection with stiffened splice plates and (b) connection with unstiffened splice
plates for 1 inch PP filler.
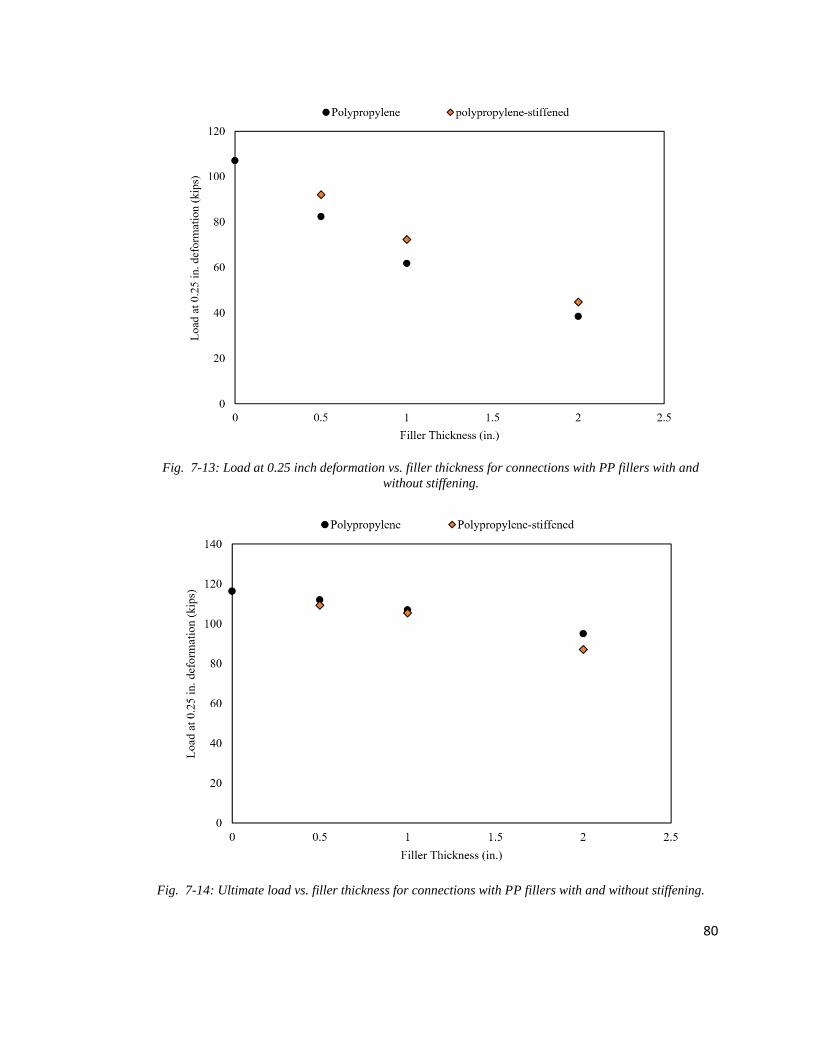
80
Fig. 7-13: Load at 0.25 inch deformation vs. filler thickness for connections with PP fillers with and
without stiffening.
Fig. 7-14: Ultimate load vs. filler thickness for connections with PP fillers with and without stiffening.
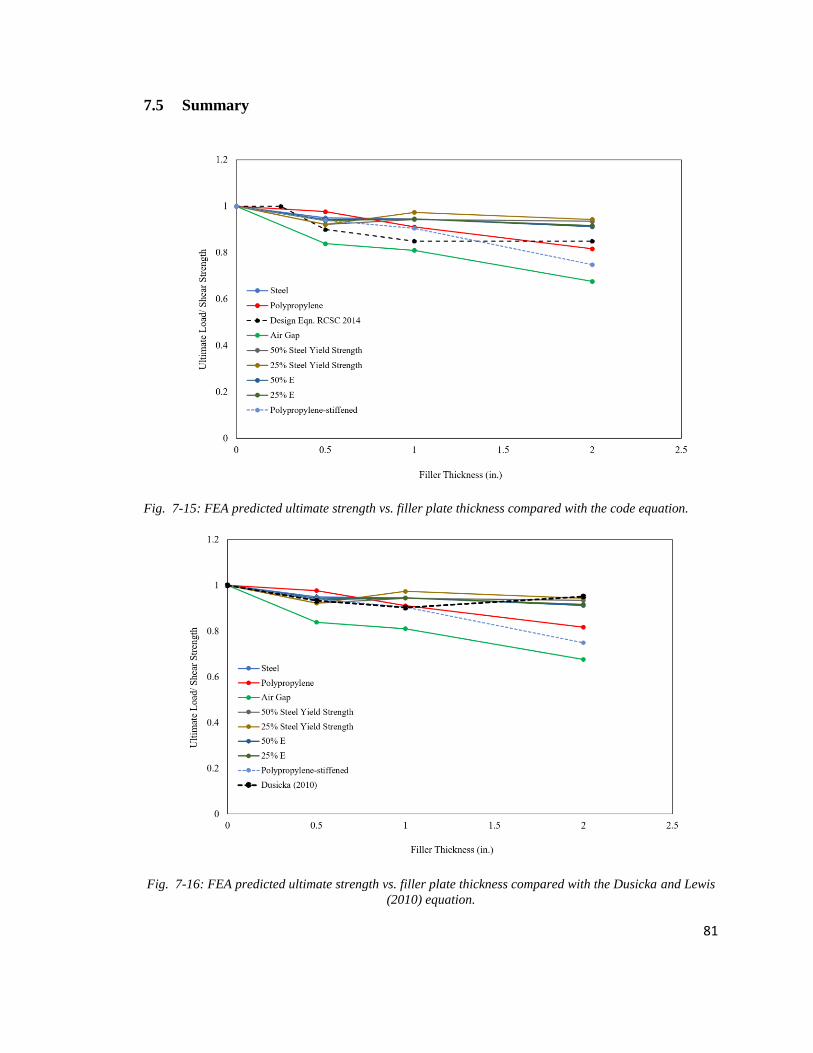
81
7.5 Summary
Fig. 7-15: FEA predicted ultimate strength vs. filler plate thickness compared with the code equation.
Fig. 7-16: FEA predicted ultimate strength vs. filler plate thickness compared with the Dusicka and Lewis
(2010) equation.
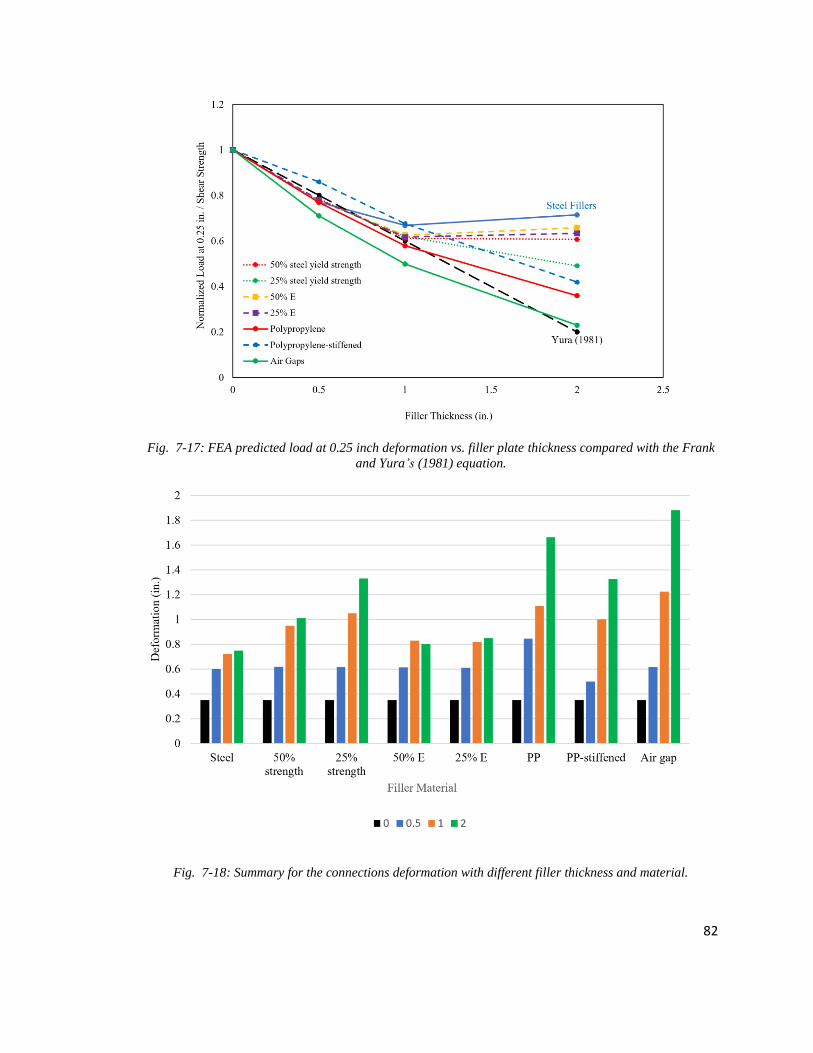
82
Fig. 7-17: FEA predicted load at 0.25 inch deformation vs. filler plate thickness compared with the Frank
and Yura’s (1981) equation.
Fig. 7-18: Summary for the connections deformation with different filler thickness and material.
83
8 Summary and Conclusions
Eight specimens having steel and polypropylene filler plates of various thicknesses were
tested in the laboratory. The collected data were compared to a Finite Element Analysis
(FEA) using ABAQUS to validate the numerical results. FEA was able to predict the
overall behavior and the important features very well with a maximum error of 1.3%.
Also, the results from experimental test and FEA were compared to the code design
equation (RCSC 2014), Dusicka and Lewis (2010), and Frank and Yura’s (1981)
reduction equation and discussed below.
The general behavior of a bolted shear-lap connection can be summarized by an initial
slip, bolt engagement in bearing, elastic deformation, plastic deformation, and finally bolt
failure in shear. Bolts in connections with no fillers experience pure shear without
bending but when fillers are introduced between the splice-plate and pull-plate, bolts
experience a combined effect of bending and shear. For the case when steel filler plates
are used, the bolt experiences bending followed by shear failure generated between the
pull-plate and filler plate (Fig. 7-3). This bending reduces the shear strength of the bolt.
While when PP fillers are used, more reduction is observed because PP fillers had lower
bearing resistance than the steel and allowed more deformation in the bolt accompanied
with increased bending stresses that reduced the bolt strength at failure.
The FEA was found effective for conducting parametric studies of different kinds of
fillers.
The presence of steel fillers reduced the slip strength by 22% while the presence of
PP fillers increased the slip strength by 54%.

84
If the deformation is a problem, Frank and Yura’s equation can be used to limit the
deformations up to 0.25 inch.
For the load at 0.25 inch deformation, fillers up to ½ inch thickness expressed similar
behavior to the steel fillers while a ½ inch air gap reduced the connection strength by
29% (9% lower than ½ inch steel fillers).
For the load at 0.25 inch, connections with 1-inch fillers and more are more sensitive
to the material properties, and a larger reduction factor should be used when low
stiffness filler plate materials are used. For example, a reduction factor of 0.58 and
0.67 is needed for PP and steel fillers, respectively.
The code design equation RCSC 2014 and Dusicka and Lewis’ (2010) reduction
equation can be used for PP fillers up to 1 inch thickness if excessive deformation is
not a problem. For fillers larger than 1 inch Dusicka and Lewis’ (2010) equation is
not recommended because it gives 16.5% higher strength while RCSC 2014 equation
predicts 4% higher strength.
The code design equation RCSC 2104 can be used for materials that have 25%
strength and the elastic modulus of steel because this still gives conservative results.
While Duscika and Lewis’ (2010) reduction equation can be used only for fillers up
to 1 inch.
Inner bolts in multi-bolted connections with PP fillers (group B in Fig. 7-10)
expressed higher strength at 0.25 inch deformation than the bolt in group A due to
restraint of the splice plates by other bolts. Therefore, a lower reduction factor is
recommended for bolts in group B. For example, if 1 inch PP filler is used in 3-bolt

85
connection, then the bolt in group A should be multiplied by a factor of 0.58 while
bolts in group B should be multiplied by a factor of 0.68.
PP fillers up to 1 inch had miner effects on the ultimate strength for bolts in group B
while fillers of 2 inches showed 8.3% lower strength than bolts in group A.
86
9 Future Work
Future studies should investigate the effect of bolt diameter to the filler thickness ratio on
the ultimate strength and strength at 0.25-inch deformation. Cyclic loading, creep and
fatigue should also be considered in the future studies since the behavior of these
materials is not well known. The future studies can consider the effect of soft materials
like polypropylene on the connection strength of long connections.
87
10 References
Lee, J.H. and Fisher, J.W., 1968. Bolted joints with rectangular or circular filters, July
196b.
Yura, J.A., Hansen, M.A. and Frank, K.H., 1982. Bolted splice connections with
undeveloped fillers. Journal of the Structural Division, 108(12), pp.2837-2849.
Dusicka, P. and Lewis, G., 2010. High strength steel bolted connections with filler
plates. Journal of Constructional Steel Research, 66(1), pp.75-84.
Research Council on Structural Connections (2014).
Borello, D.J., Denavit, M.D. and Hajjar, J.F., 2009. Behavior of bolted steel slip-critical
connections with fillers. Newmark Structural Engineering Laboratory. University of
Illinois at Urbana-Champaign.
Perry WC. Bearing Strength of Bolted Connections. Thesis presented to the
University of Texas, at Austin in partial fulfillment of the requirements for the
degree of Master of Science 1961.
Valerio, J.A.P., 2007. Impact Assessment of Thermal Bridges on Residential Buildings
Performance. Instituto Superior Técnico, DECivil, Av. Rovisco Pais, pp.1049-001.
American Institute of Steel Construction Inc. (2011). Steel Construction Manual, 14th
Ed.
Ed Dlugokencky and Pieter Tans, NOAA/ESRL (www.esrl.noaa.gov/gmd/ccgg/trends/)
Mora, C., Frazier, A.G., Longman, R.J., Dacks, R.S., Walton, M.M., Tong, E.J., Sanchez,
J.J., Kaiser, L.R., Stender, Y.O., Anderson, J.M. and Ambrosino, C.M., 2013. The
88
projected timing of climate departure from recent variability. Nature, 502(7470), pp.183-
187.
Sulcova, Z., Sokol, Z. and Wald, F., 2010. Integration of the new component into the
design method for thermal insulating connections. Portugal SB10—Sustainable Building
Affordable to All: Low Cost Sustainable Solutions, Universidade do Minho, Braga,
Portugal.
Nasdala, L., Hohn, B. and Rühl, R., 2007. Design of end-plate connections with
elastomeric intermediate layer. Journal of Constructional Steel Research, 63(4), pp.494-
504.
Cleary, D.B., Riddell, W.T., Camishion, N., Downey, P., Marko, S., Neville, G.,
Oostdyk, M. and Panaro, T., 2016. Steel connections with fiber-reinforced resin thermal
barrier filler plates under service loading. Journal of Structural Engineering, 142(11),
p.04016095.
Larbi, A.B., Couchaux, M. and Bouchair, A., 2017. Thermal and mechanical analysis of
thermal break with end-plate for attached steel structures. Engineering Structures, 131,
pp.362-379.
White, S.P., 2016. Thermo-mechanical modeling of thermal breaks in structural steel
point transmittances (Doctoral dissertation, University of Alaska Anchorage).
CEN (European Committee for Standardization). (2005). “Eurocode 3:Design of steel
structures—Design of joints.” EN 1993-1-8, Brussels,Belgium.
ASTM. (2006). “Standard practice for measuring the change in length of fasteners using
the ultrasonic pulse-echotechnique.” ASTM E1685–00, West Conshohocken, PA.
ASTM, A., 325(2007a) Standard Specification for Structural Bolts. Steel, Heat
Treated, 120, p.105.
ASTM, A., 2009. 490 Standard Specification for Structural Bolts. Alloy Steel, Heat
Treated, 150.

89
ANSI (American National Standards Institute). (2012). “Standard specification for the
size of abrasive grain–grinding wheels, polishing, and general industrial use.” ANSI
874.12-2012, Washington, DC.
SSPC, S., 7/NACE No. 4, SSPC SP 6/NACE No. 3, and SSPC SP 10/NACE No. 2. As a
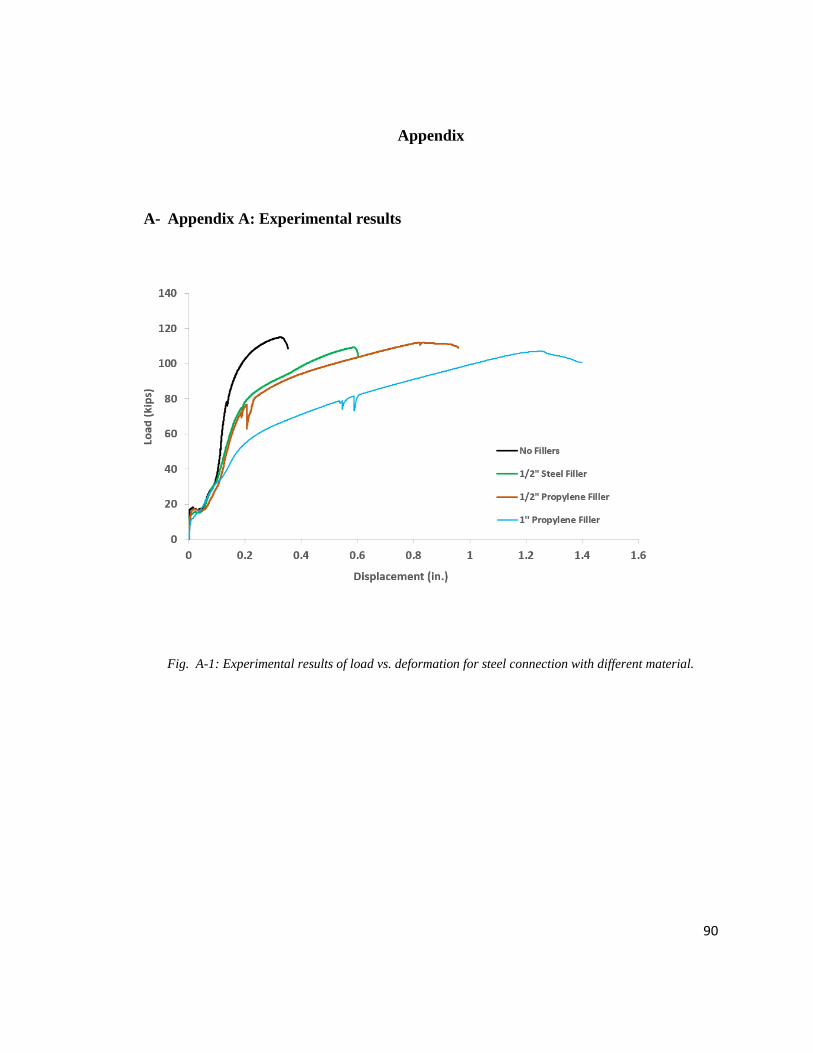
90
Appendix
A- Appendix A: Experimental results
Fig. A-1: Experimental results of load vs. deformation for steel connection with different material.
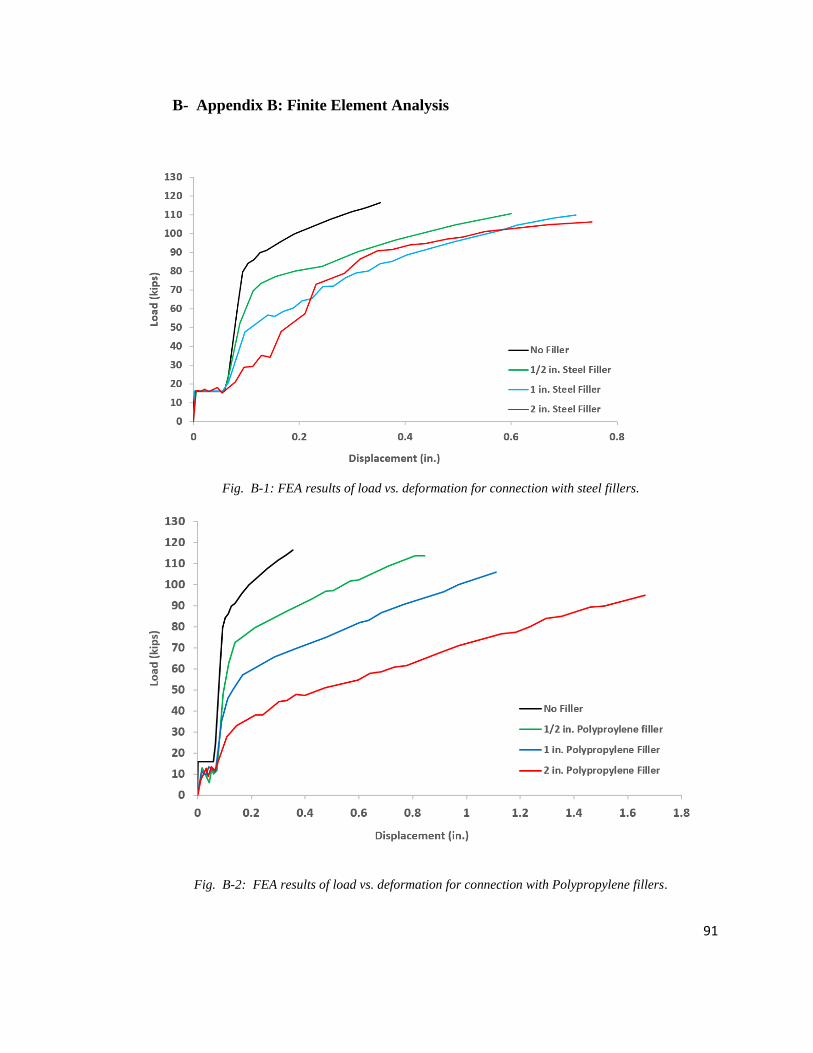
91
B- Appendix B: Finite Element Analysis
Fig. B-1: FEA results of load vs. deformation for connection with steel fillers.
Fig. B-2: FEA results of load vs. deformation for connection with Polypropylene fillers.
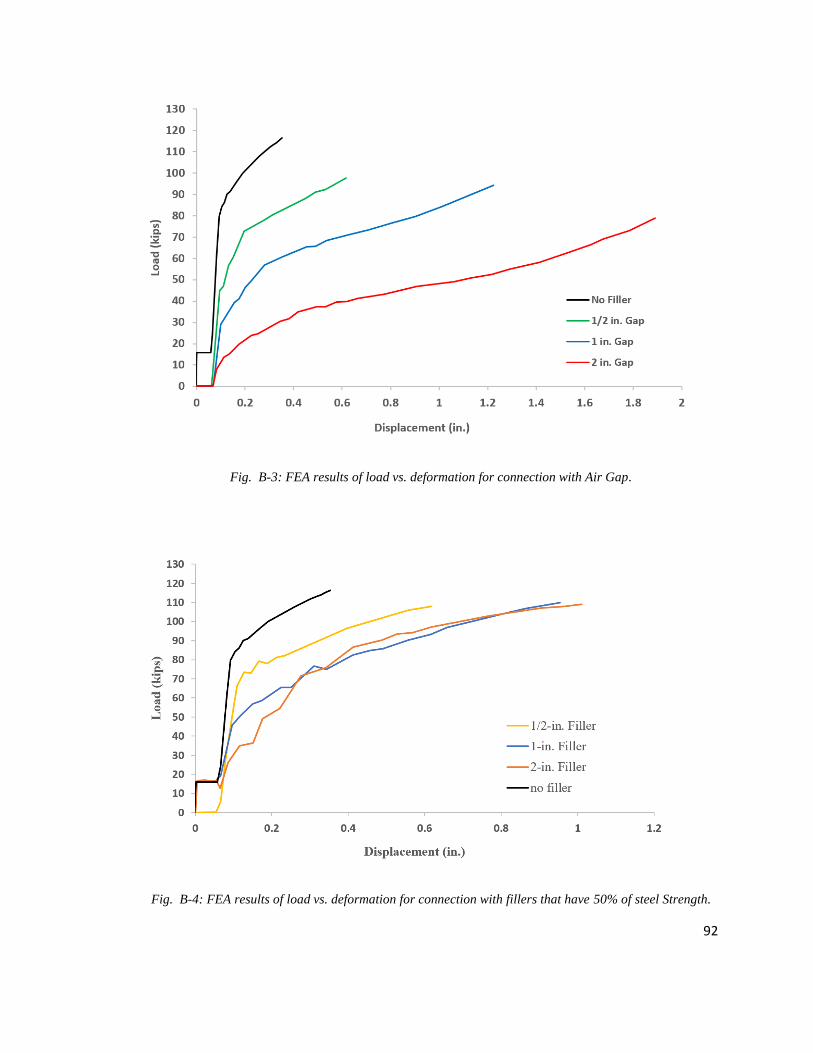
92
Fig. B-3: FEA results of load vs. deformation for connection with Air Gap.
Fig. B-4: FEA results of load vs. deformation for connection with fillers that have 50% of steel Strength.
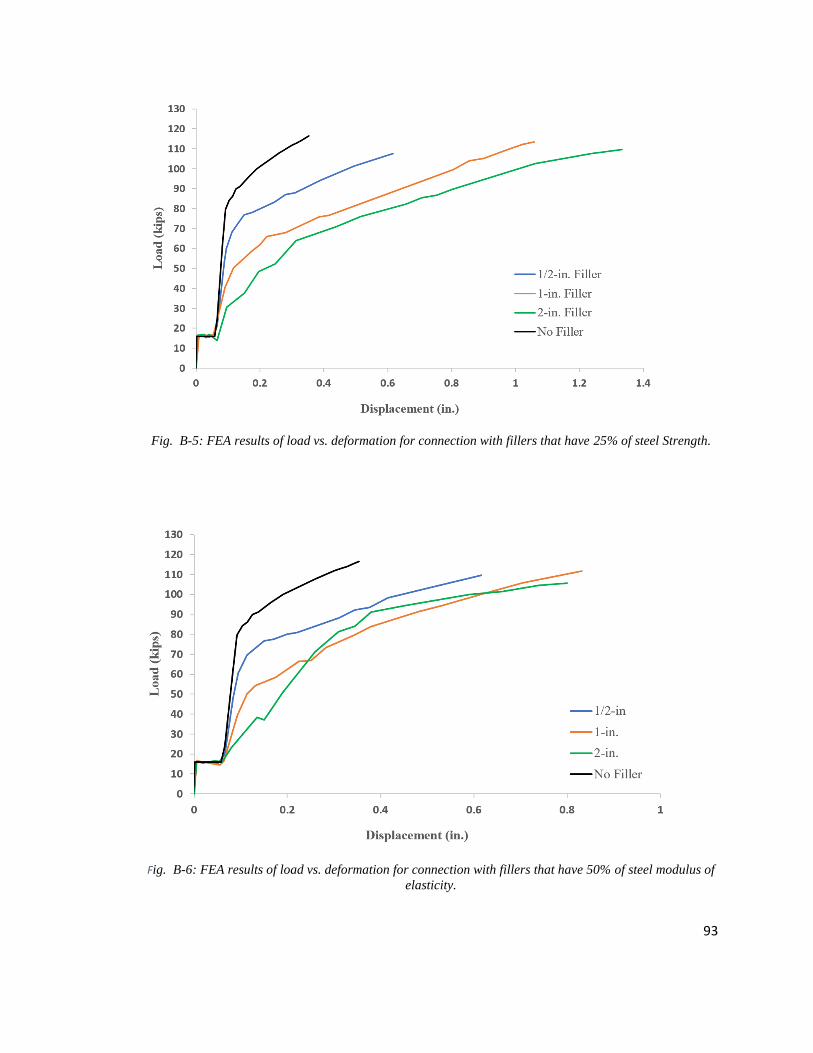
93
Fig. B-5: FEA results of load vs. deformation for connection with fillers that have 25% of steel Strength.
Fig. B-6: FEA results of load vs. deformation for connection with fillers that have 50% of steel modulus of
elasticity.
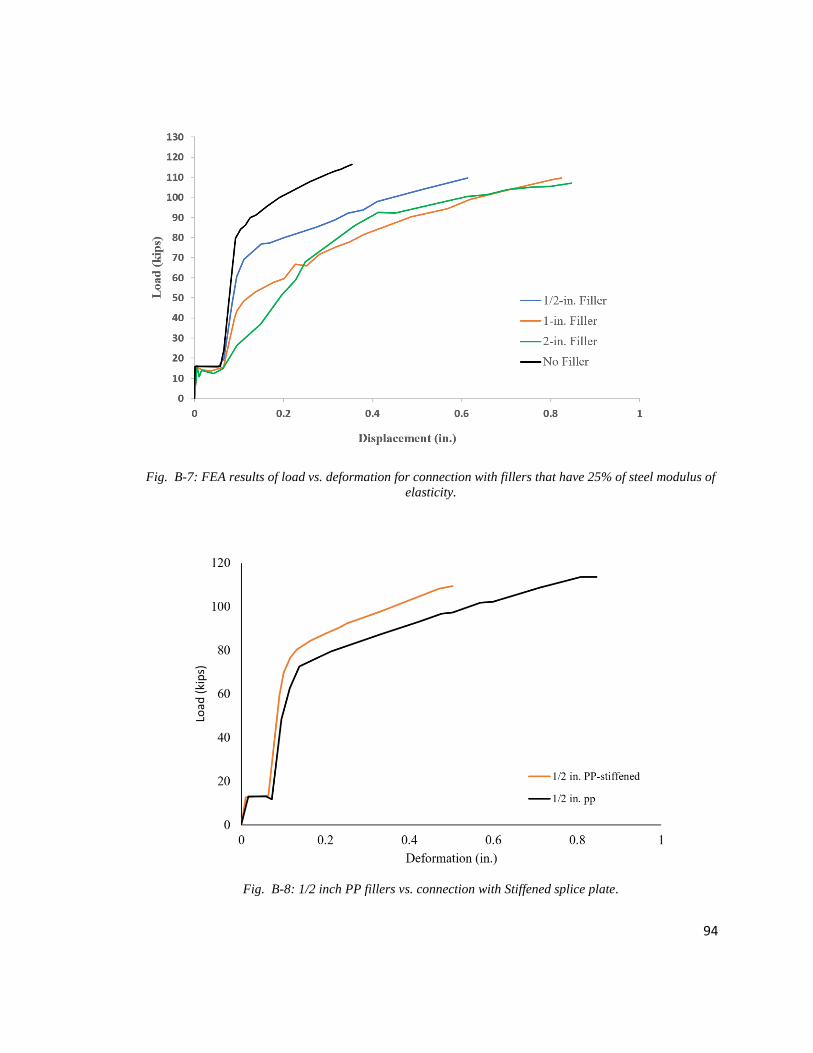
94
Fig. B-7: FEA results of load vs. deformation for connection with fillers that have 25% of steel modulus of
elasticity.
Fig. B-8: 1/2 inch PP fillers vs. connection with Stiffened splice plate.
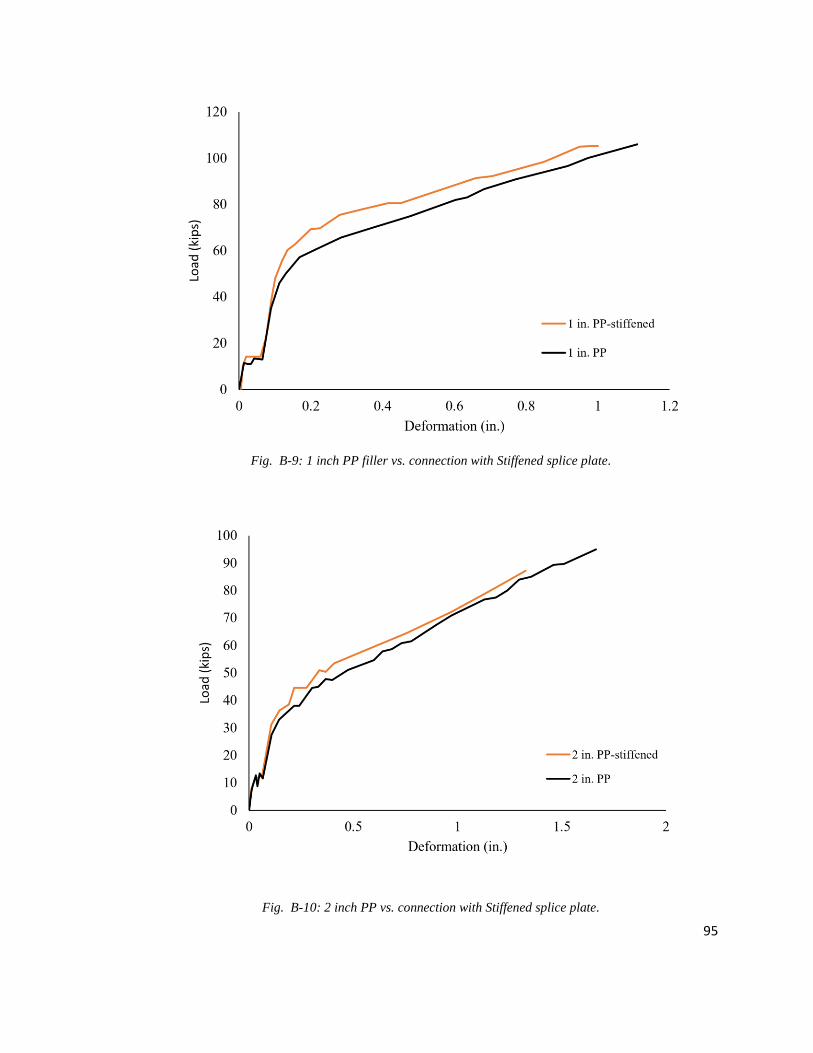
95
Fig. B-9: 1 inch PP filler vs. connection with Stiffened splice plate.
Fig. B-10: 2 inch PP vs. connection with Stiffened splice plate.


![Characterization of Structural Adhesives Using Lap Shear ...Figure 2-21: Double lap shear joint, modelled with tiebreak contact (taken from Xiao X. et al.[120]) ..... 28 Figure 2-22:](https://img.pdfslide.us/doc/110x75/610ea925760ce05ab725b4be/characterization-of-structural-adhesives-using-lap-shear-figure-2-21-double.jpg)