Embed Size (px)
Citation preview
ORIGINAL RESEARCH
Structural assessment of a lattice tower for a small, multi-bladedwind turbine
Redeemer Axisa1 • Martin Muscat1 • Tonio Sant1 • Robert N. Farrugia2
Received: 17 November 2016 / Accepted: 30 May 2017 / Published online: 8 June 2017
� The Author(s) 2017. This article is an open access publication
Abstract This paper deals with a limit load assessment
and preliminary experimental testing of a lattice-type steel
tower used to support a newly designed, prototype small
wind turbine having nine blades and a rotor diameter of
3.4 m. Small wind turbine and structural engineering codes
of standards were followed with the purpose of imple-
menting a system that meets European Union countries’
legislation. The supporting lattice tower structure was
subjected to a full-scale load test. This test verified that the
structure can withstand the design loads. The finite element
software ANSYS Mechanical was used to model and
analyse the actual structure, and to determine the possible
failure modes and their associated load levels. The most
probable mode of failure for such a structure was found to
be elastic buckling of the main corner posts. A number of
finite element lattice tower models utilising different
modelling strategies and solution methods are presented
and analysed. The paper highlights the importance of using
non-linear analyses as opposed to linear analyses and gives
recommendations on the most reliable available modelling
technique. Computational analyses’ results are compared
with measurements from a full-scale test on the tower
structure.
Keywords Small wind turbine � Lattice tower structure �Buckling � Field testing
List of symbols
[K] Structural stiffness matrix
[S] Stress stiffness matrix
ki ith eigenvalue
Wi ith eigenvector of displacements
Nb,Rd Buckling resistance of a truss member
A Truss member cross-sectional area [m2]
fy Yield strength of material [N/m2]
fu Ultimate strength of material [N/m2]
cM1 Partial material factor of safety�k Non-dimensional slenderness ratio
ry Yield stress [N/m2]
Ncr Eigenvalue critical buckling load for a strut
having pinned boundary conditions
v Reduction factor for compression members
a Constant imperfection factor
g Imperfection parameter
Mshaft Bending moment acting on wind turbine shaft
[N m]
Mx-shaft Torque acting on wind turbine shaft [N m]
Fx-shaft Thrust load on wind turbine rotor in the parked
position [N]
Vref Reference wind speed averaged over 10 min
[m/s1]
Vavg Annual average wind speed at hub height [m/s1]
Abbreviations
CWM Chicago windmill
FE Finite element
FEA Finite element analysis
ID Inside diameter
OD Outside diameter
SLM Simple load model
SWT Small wind turbine
& Martin Muscat
1 Faculty of Engineering, University of Malta,
Msida MSD2080, Malta
2 Institute for Sustainable Energy, University of Malta,
Marsaxlokk MXK1531, Malta
123
Int J Energy Environ Eng (2017) 8:343–358
https://doi.org/10.1007/s40095-017-0239-3
MRRA Ministry for resources and rural affairs
IEC International Electrotechnical Commission
Introduction
The wind-driven water pump (Fig. 1) was introduced to the
Maltese countryside with the main purpose of extracting water
from the aquifer for agricultural irrigation purposes. Most of
these wind pumps are no longer in use mainly because of the
introduction of the electric water pump and the extension of
the electricity grid. Over the years most of these wind pumps
have been abandoned and left to deteriorate.
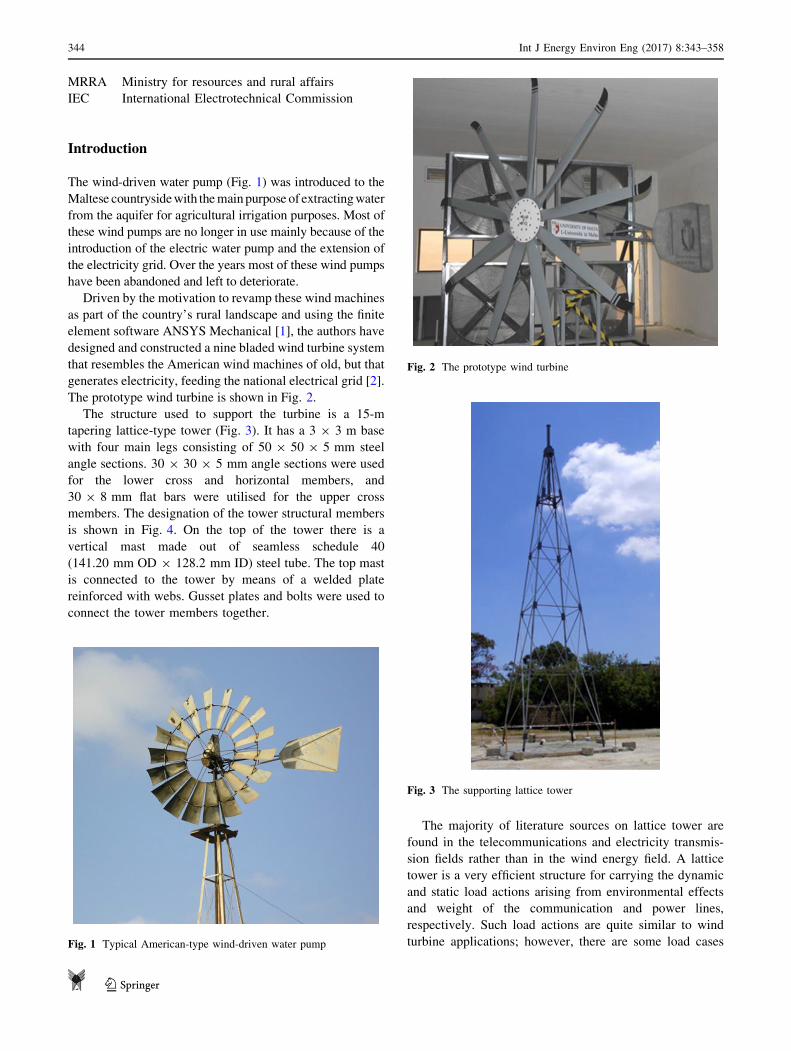
Driven by the motivation to revamp these wind machines
as part of the country’s rural landscape and using the finite
element software ANSYS Mechanical [1], the authors have
designed and constructed a nine bladed wind turbine system
that resembles the American wind machines of old, but that
generates electricity, feeding the national electrical grid [2].
The prototype wind turbine is shown in Fig. 2.
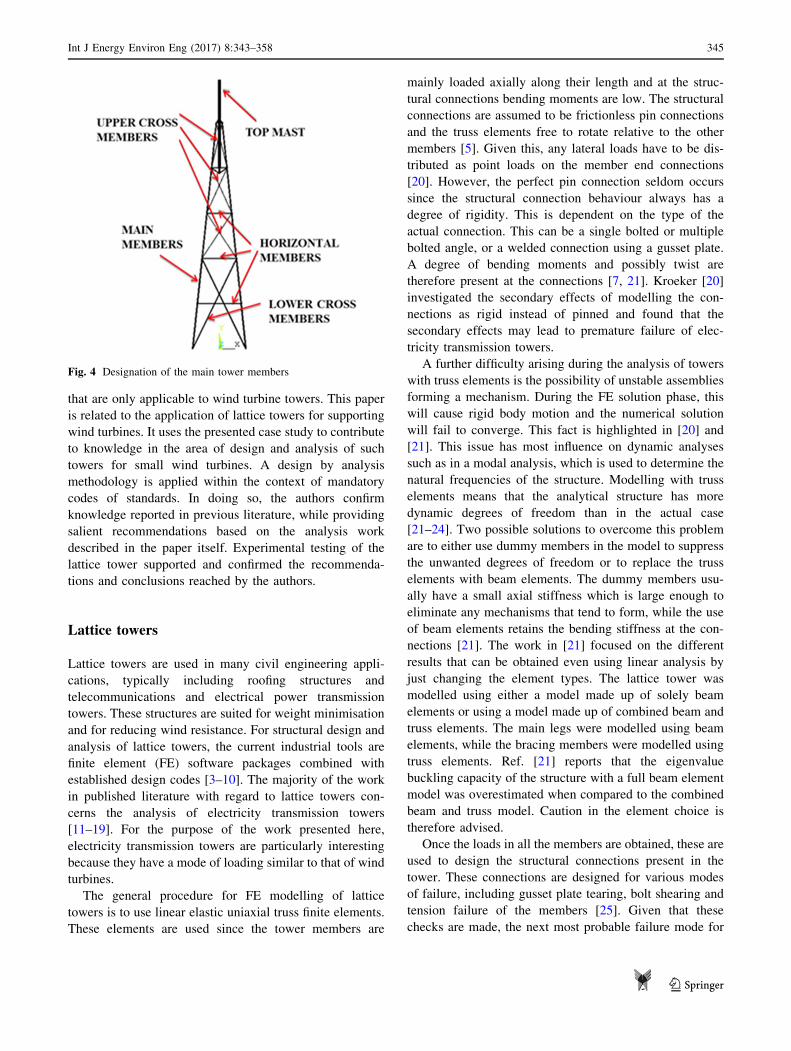
The structure used to support the turbine is a 15-m
tapering lattice-type tower (Fig. 3). It has a 3 9 3 m base
with four main legs consisting of 50 9 50 9 5 mm steel
angle sections. 30 9 30 9 5 mm angle sections were used
for the lower cross and horizontal members, and
30 9 8 mm flat bars were utilised for the upper cross
members. The designation of the tower structural members
is shown in Fig. 4. On the top of the tower there is a
vertical mast made out of seamless schedule 40
(141.20 mm OD 9 128.2 mm ID) steel tube. The top mast
is connected to the tower by means of a welded plate
reinforced with webs. Gusset plates and bolts were used to
connect the tower members together.
The majority of literature sources on lattice tower are
found in the telecommunications and electricity transmis-
sion fields rather than in the wind energy field. A lattice
tower is a very efficient structure for carrying the dynamic
and static load actions arising from environmental effects
and weight of the communication and power lines,
respectively. Such load actions are quite similar to wind
turbine applications; however, there are some load casesFig. 1 Typical American-type wind-driven water pump
Fig. 2 The prototype wind turbine
Fig. 3 The supporting lattice tower
344 Int J Energy Environ Eng (2017) 8:343–358
123
that are only applicable to wind turbine towers. This paper
is related to the application of lattice towers for supporting
wind turbines. It uses the presented case study to contribute
to knowledge in the area of design and analysis of such
towers for small wind turbines. A design by analysis
methodology is applied within the context of mandatory
codes of standards. In doing so, the authors confirm
knowledge reported in previous literature, while providing
salient recommendations based on the analysis work
described in the paper itself. Experimental testing of the
lattice tower supported and confirmed the recommenda-
tions and conclusions reached by the authors.
Lattice towers
Lattice towers are used in many civil engineering appli-
cations, typically including roofing structures and
telecommunications and electrical power transmission
towers. These structures are suited for weight minimisation
and for reducing wind resistance. For structural design and
analysis of lattice towers, the current industrial tools are
finite element (FE) software packages combined with
established design codes [3–10]. The majority of the work
in published literature with regard to lattice towers con-
cerns the analysis of electricity transmission towers
[11–19]. For the purpose of the work presented here,
electricity transmission towers are particularly interesting
because they have a mode of loading similar to that of wind
turbines.
The general procedure for FE modelling of lattice
towers is to use linear elastic uniaxial truss finite elements.
These elements are used since the tower members are
mainly loaded axially along their length and at the struc-
tural connections bending moments are low. The structural
connections are assumed to be frictionless pin connections
and the truss elements free to rotate relative to the other
members [5]. Given this, any lateral loads have to be dis-
tributed as point loads on the member end connections
[20]. However, the perfect pin connection seldom occurs
since the structural connection behaviour always has a
degree of rigidity. This is dependent on the type of the
actual connection. This can be a single bolted or multiple
bolted angle, or a welded connection using a gusset plate.
A degree of bending moments and possibly twist are
therefore present at the connections [7, 21]. Kroeker [20]
investigated the secondary effects of modelling the con-
nections as rigid instead of pinned and found that the
secondary effects may lead to premature failure of elec-
tricity transmission towers.
A further difficulty arising during the analysis of towers
with truss elements is the possibility of unstable assemblies
forming a mechanism. During the FE solution phase, this
will cause rigid body motion and the numerical solution
will fail to converge. This fact is highlighted in [20] and
[21]. This issue has most influence on dynamic analyses
such as in a modal analysis, which is used to determine the
natural frequencies of the structure. Modelling with truss
elements means that the analytical structure has more
dynamic degrees of freedom than in the actual case
[21–24]. Two possible solutions to overcome this problem
are to either use dummy members in the model to suppress
the unwanted degrees of freedom or to replace the truss
elements with beam elements. The dummy members usu-
ally have a small axial stiffness which is large enough to
eliminate any mechanisms that tend to form, while the use
of beam elements retains the bending stiffness at the con-
nections [21]. The work in [21] focused on the different
results that can be obtained even using linear analysis by
just changing the element types. The lattice tower was
modelled using either a model made up of solely beam
elements or using a model made up of combined beam and
truss elements. The main legs were modelled using beam
elements, while the bracing members were modelled using
truss elements. Ref. [21] reports that the eigenvalue
buckling capacity of the structure with a full beam element
model was overestimated when compared to the combined
beam and truss model. Caution in the element choice is
therefore advised.
Once the loads in all the members are obtained, these are
used to design the structural connections present in the
tower. These connections are designed for various modes
of failure, including gusset plate tearing, bolt shearing and
tension failure of the members [25]. Given that these
checks are made, the next most probable failure mode for
Fig. 4 Designation of the main tower members
Int J Energy Environ Eng (2017) 8:343–358 345
123
lattice towers is structural instability or buckling of the
slender members.
Structural members are designed against the buckling
mode of failure using an appropriate design standard such
as the European Standard EN1993-1-1 [26]. Linear elastic
finite element analysis is not sufficient when checking for
this type of failure mode and non-linear analysis must then
be used. This is mainly because of the geometric imper-
fections and eccentricities present in the structural con-
nections. The latter is most common for towers which are
fabricated from members having an angle cross section
using a single bolt or welding without the use of a gusset
plate. This eccentricity in the connection induces a sec-
ondary bending moment at the joint end of the members
[6, 27]. Results from actual full-scale tower tests indicate
that linear static analysis is not consistent in modelling the
behaviour of the structure. It is also reported that bending
stresses in the members, which initially were assumed to be
negligible, can be as high as the axial stresses [27–31]. Ref.
[27] gives a number of reasons why the pin joint
assumption does not hold for real towers. One of the main
reasons is due to the main legs normally being continuous
through the joint and due to the fact that, usually, more
than one bolt is used in the connections, so that they should
be assumed to be semi-rigid and not pinned. The bending
moments at the connections are referred to as the second-
order effect.
Albermani and Kitipornchai [28] present an analytical
technique that takes into account both geometric and mate-
rial non-linearities. The geometric non-linearity analysis
considers the effects of accumulated stresses and the effect of
the changes in the geometry on the structural stiffness of the
elements as the load is increased. The material non-linearity
considers the effect of plasticity occurring in the sections if
the elastic limit is exceeded. Their investigation was used to
upgrade old towers by reinforcing them using a horizontal
diaphragm bracing system. They also used their analysis to
verify a new tower design which showed good agreement
with the actual full-scale tower test. Very large towers con-
sidered in the literature usually use a K-type truss bracing
system to support the main leg, and within these bracings
there are secondary and redundant members. As discussed in
[29], linear analysis calculates the forces in these secondary
bracing members to be negligible. However, results from
real tests show that these members are substantially loaded
and play a role in the stability of the main members. In fact, in
one of the full-scale tower tests carried out in [13], the main
member buckled because of end tearing failure of these
‘redundant’ members. Other literature compares results from
the non-linear structural analysis to full-scale tower tests
subjected to the same load cases [6–8, 12, 15–19, 29–31].
Albermani et al. [30] concluded that the predicted failure
loads and failure modes of their models were in good
agreement with those obtained in tests. The same conclusion
was made by Rao et al. [29], in which the forces acting on the
bracing members of the tower before failure were consistent
with test results. On the other hand, Rao et al.’s [31] results
from the non-linear analysis slightly over-predicted the
experimental buckling failure load for two of the towers
analysed by a few percent. They put forward a number of
observations which might have contributed to this differ-
ence, mainly bolt hole clearances, force fitting of members,
non-triangulated bracings and other imperfections which
were claimed to be difficult to incorporate into the finite
element model.
The IEC61400 design standard
The design of the wind turbine followed the International
Electrotechnical Commission’s IEC 61400 design standard
for small wind turbines [32], which defines a number of
small wind turbine (SWT) classes in terms of wind speed
and turbulence parameters.
For the island of Malta, the wind conditions for a SWT
class IV were chosen. These give a Vref of 30.0 m/s and a
Vave of 6.0 m/s, as well as a number of other parameters
such as the dimensionless characteristic value of turbulence
intensity at 15 m/s.
Three methods can be used to calculate the load actions
on the turbine for each given load case [32]. These are the
‘simple load model’ (SLM), ‘Aero-elastic modelling’ and
‘Load measurements with extrapolations for extreme wind
conditions’. The latter requires initial field testing, whereas
the first two methodologies can be used at the design stage.
For the work reported in this paper, the adopted method-
ology was the SLM. The SLM gives a number of load cases
that need to be considered. The load cases cover a number
of operating scenarios such as the normal operational
mode, turbine yawing, maximum wind thrust and maxi-
mum rotational speed conditions. The load cases consist of
static and dynamic loads which are caused by the airflow
and its interaction with the stationary or moving parts of
the wind turbine. IEC 61400-2 requires both load and
material safety factors. The factor of safety for loads when
the SLM method is used is 3, while the factor of safety for
material is based on the amount of testing done on the
material itself and by considering other issues such as
corrosion and environmental effects. For the purpose of
this paper, the safety factor on material was calculated to
be 1.43. The governing load cases for the designed turbine
were as follows:
– Load Case B (Yawing), which is a bending moment
shaft having a value of 2242 N m acting on the turbine
drive shaft,
346 Int J Energy Environ Eng (2017) 8:343–358
123
– Load Case G (Shutdown braking), which is a torque
load Mx-shaft having a value of 500 N m acting on the
drive shaft, and
– Load Case H (Parked wind loading), which is the thrust
load Fx-shaft on the rotor having a value of 3063 N
[2, 32].
The design loads were used within the standard
IEC 61400 [32] in order to design the main components for
the turbine and nacelle. Such main components include the
turbine and generator drive shaft, the yaw shaft and turbine
blade root dimensions. The turbine blades were fabricated
using E glass fibre composite material with steel bushes at
the blade root in order to minimise damage at the rotor hub
end. The turbine blades were tested as required by [32].
Eigenvalue and non-linear buckling analysis
Eigenvalue analysis predicts the theoretical buckling
strength (the bifurcation point) of a structure which is ide-
alised as elastic. For a basic structural configuration, struc-
tural eigenvalues are computed from boundary and loading
conditions. Each buckling load is associated with a buckled
mode shape which represents the shape a structure assumed
in the buckled configuration. Eigenvalue buckling analysis
yields non-conservative results when compared to the results
obtained from a non-linear buckling analysis. Elastic (Euler)
buckling is formulated as an eigenvalue problem with
ð½K� þ ki½S�ÞfWig ¼ 0: ð1Þ
In FE software, the eigenvalue solution is obtained using
either Block Lanczos or the Subspace Method solvers. The
conditions under which real compression members behave
differ in many ways from the idealised conditions assumed in
an eigenvalue buckling analysis. Real struts are affected by
initial curvature, eccentric loading, residual stresses and
plasticity. All these factors have a detrimental effect on the
strut’s buckling capacity. In a compression member, the
residual compressive stresses cause premature yielding under
reduced axial loads and the member buckles inelastically at a
load which is less than the eigenvalue elastic buckling load. In
contrast with eigenvalue buckling analysis, non-linear anal-
ysis is used in FE software in order to compute more realistic
buckling loads when compared with experiments.
Design of compression members accordingto EN1993-1-1
For routine design of compression members, EN1993-1-1
(Eurocode 3) [26] uses a simplified design procedure which
was developed from computer analysis and from correla-
tion with test data. The formulae given in [26] for the
design procedure are based on the theory for first yielding
of the geometrically imperfect column. As the axial load
increases, so do the stresses due to bending moments and
axial stresses. The total stress in the member is composed
of direct axial and bending stresses. The buckling resis-
tance of a truss member is therefore given in EN1993-1-
1:2005 [26] as
Nb;Rd ¼ vAfycM1
; ð2Þ
where
v ¼ 1
/þffiffiffiffiffiffiffiffiffiffiffiffiffiffiffiffi
/2 � �k2p ð3Þ
�k ¼ Ary
Ncr
ð4Þ
/ ¼ 1 þ gþ �k2
2: ð5Þ
In order to achieve a correlation with numerical solu-
tions, EN1993-1-1 established the imperfection parameter
g as a function of a constant factor and of the non-di-
mensional slenderness ratio �k, so that
g ¼ a �k� 0:2� �
; ð6Þ
where a is a constant imperfection factor as given in [26].
Five different values for a are given and the choice depends
on the type of cross section (whether an I-beam, hollow
section, etc.), on the buckling axes, thicknesses and mate-
rial strengths. These curves are based on experimental
results for real columns.
FE model of the tower structure
Three different elements were used for the FE model of the
tower. These were BEAM188, LINK180 and SHELL281
[1]. BEAM188 is a three-dimensional beam element for-
mulated on Timoshenko beam theory having 6 degrees of
freedom at each node: 3 are translational while the other 3
are rotational. LINK180 is a three-dimensional truss ele-
ment having 3 degrees of freedom (translational) at each
node. SHELL281 has 6 degrees of freedom at each node (3
translational and 3 rotational). All three elements have
large deflections and stress stiffening capabilities which are
required for an eigenvalue and non-linear buckling analy-
sis. SHELL281 was used to model the plate structural
components present at the top of the lattice part of the
tower. These plate components were used as a transition
between the top mast and the tower. The element MASS21
was used to apply the weight of the nacelle and wind tur-
bine components on top of the tower. In conjunction with
this, the gravity function in ANSYS [1] was used in the
Int J Energy Environ Eng (2017) 8:343–358 347
123
appropriate direction by specifying a downward accelera-
tion of 9.81 m/s2. This, together with the material density,
was also required to model the tower self-weight.
The boundary conditions for all the tower models that
were analysed consisted of fully constrained tower legs in
all the translational and rotational degrees of freedom at the
base. Differential support settlement as proposed by [28]
was not taken into account since the tower foundation
comprises a single, concrete foundation with reinforcement
steel/mesh that was cast in situ and which was slightly
larger than the square base of the tower. The geometrical
model of the lattice tower is shown in Fig. 6. Tensile tests
were carried out on samples of material used to fabricate
the tower. The test results gave a yield strength fy,tower of
330 N/mm2, an ultimate strength fu,tower of 470 N/mm2, an
elastic modulus E of 208,500 N/mm2 and a Poisson’s ratio
m of 0.29. The material for the top mast’s circular hollow
section has a yield stress fy,topmast of 326 N/mm2 and an
ultimate strength fu,topmast of 475 N/mm2. Taking into
consideration the material’s factor of safety of 1.43, the
allowable stress for the tower members is therefore 230 N/
mm2, while that for the top mast is 227 N/mm2.
For the tower analysis, only the load cases associated
with the total loads transferred by the wind turbine to the
supporting structure were of interest. These load cases were
further sub-divided, depending on the direction in which
they are acting with respect to the tower orientation. The
load cases which the tower was designed for were Load
Case H (Parked wind loading) and Load Case B (Yawing).
The wind loading effect on the individual tower members
was assumed to be negligible. The partial safety factor of 3
as required by [32] was not applied to the weight of the
wind turbine, as this was known from actual data.
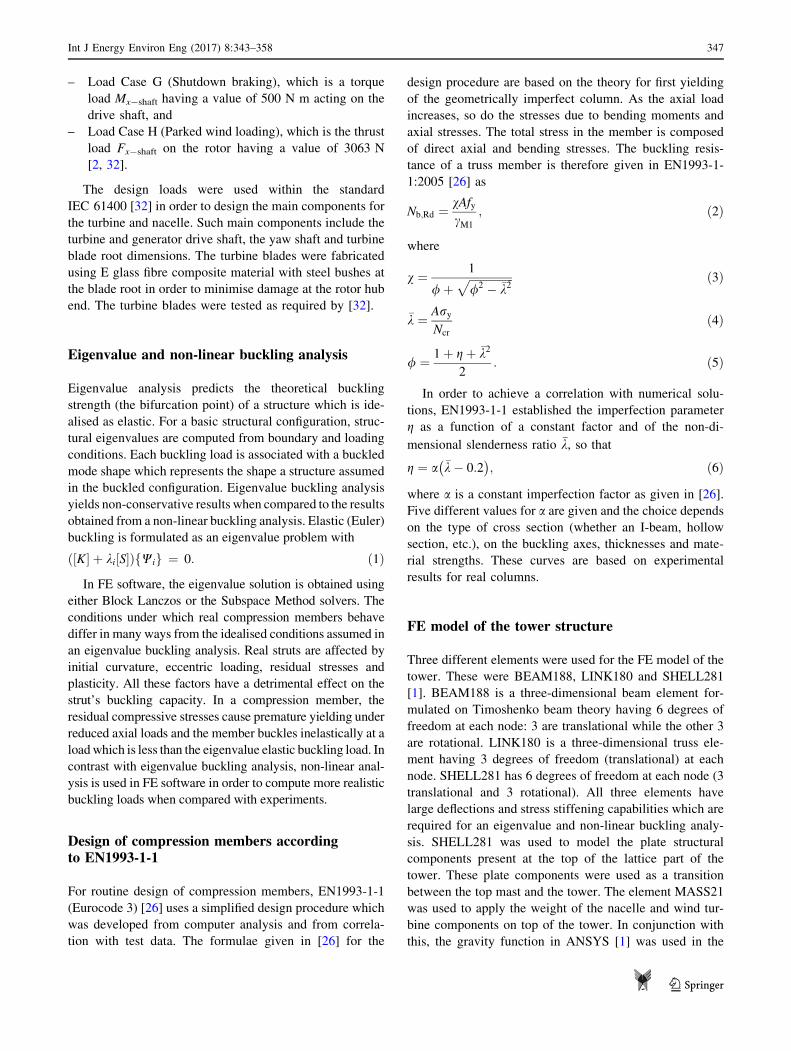
For all models, a mesh convergence study was carried
out to find the best mesh size for the tower. Figure 5 shows
the results of a typical mesh convergence study when the
tower model consisted of only BEAM188 elements. A
converged, non-linear solution based on maximum load at
failure (loss of equilibrium) was obtained for a beam ele-
ment size of 20 mm, giving a density of 50 elements per
metre.
Structural linear static tower analysis
The main aim of the linear static analysis was to check for
any stresses that exceeded the allowable stress level. The
tower main members, horizontal members, lower cross
members and the top mast were modelled with BEAM188
elements. On the other hand, the upper cross members were
modelled with LINK180 elements because of their high
slenderness ratio (Fig. 4). 8000 elements were used to
generate the FE model of the tower that rendered a con-
verged solution. A macro program using ANSYS APDL
[1] was written at post-processing stage in order to list
various stresses and displacements in each element and at
each node, respectively.
In the elastic analysis, the tower was loaded both in a
direction perpendicular to one of the four sides and also in
a direction along the diagonal of the tower’s square base.
For these two directions of loading, the difference in
maximum deflection of the tower was minimal. This means
that the overall stiffness of the tower structure is almost the
same when loaded perpendicularly and diagonally. This
can be justified by the fact that the tower’s second moment
of area is approximately equal for these two directions. A
maximum deflection of 55.14 mm occurred at the top of
the mast due to thrust loading. The moment loading due to
yawing caused a tip mast deflection of 17.43 mm. Thrust
loading caused higher stresses and deflections than the
gyroscopic moment due to turbine yawing at the maximum
rate. Figure 6 shows the tower deflection under the action
Fig. 5 Typical mesh convergence study
Fig. 6 Tower deflection for thrust loading along the diagonal
direction
348 Int J Energy Environ Eng (2017) 8:343–358
123
of a thrust load applied along the diagonal direction with
respect to the base.
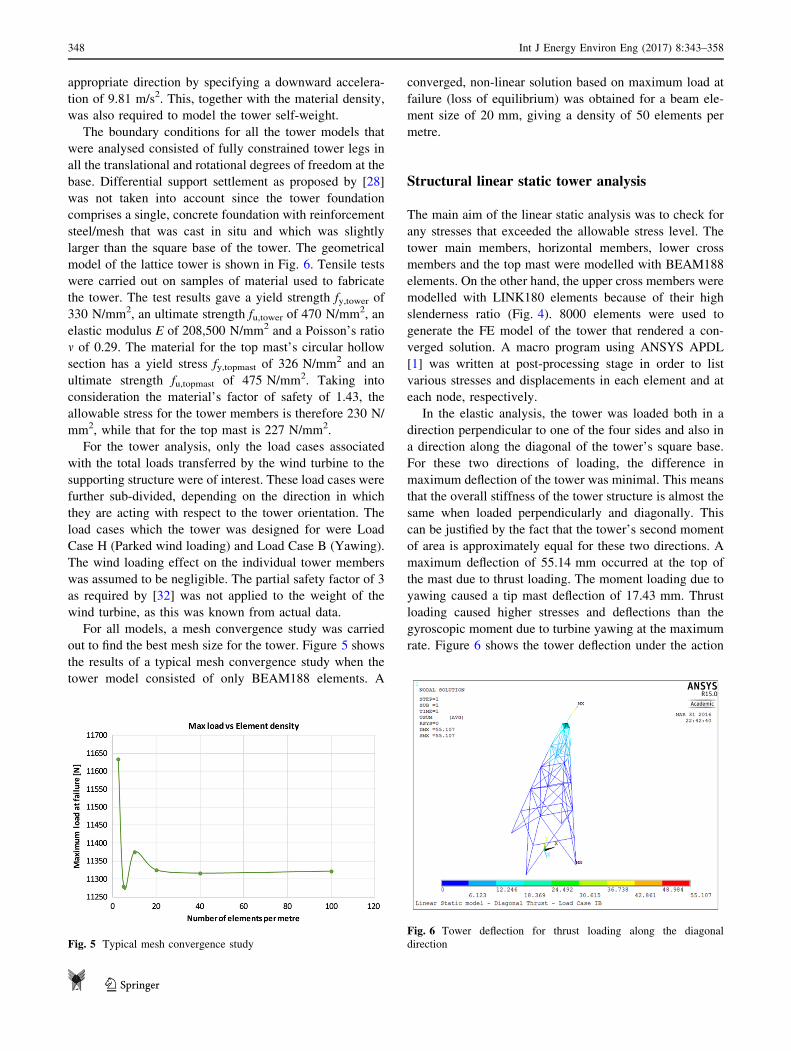
Except for small stress concentrations in the top mast/-
tower plate connection, the top mast was the most stressed
member. All other beam/axial members in the tower had
lower stress levels. The maximum stress obtained in the top
mast for thrust loading was 221 N/mm2 which is below the
allowable limit of 227 N/mm2 (see Fig. 7). Maximum axial
stress in the upper cross members was of 34.63 N/mm2,
while the maximum bending stress in the legs was of
68.72 N/mm2.
The function of the cross members in the truss system is
to transfer the shearing loads acting between the tension
and compressive main members. Therefore, the cross
members reduce the sway motion of the tower by acting in
tension or compression depending on their location. To
prove this, a model of the tower was modified by elimi-
nating the cross members completely, and a solution was
obtained for the same loads. The deflected contour plot of
this model is shown in Fig. 8. The total horizontal deflec-
tion at the top of the tower without cross members under
the same loads increased by almost two and a half times as
compared to the previous model.
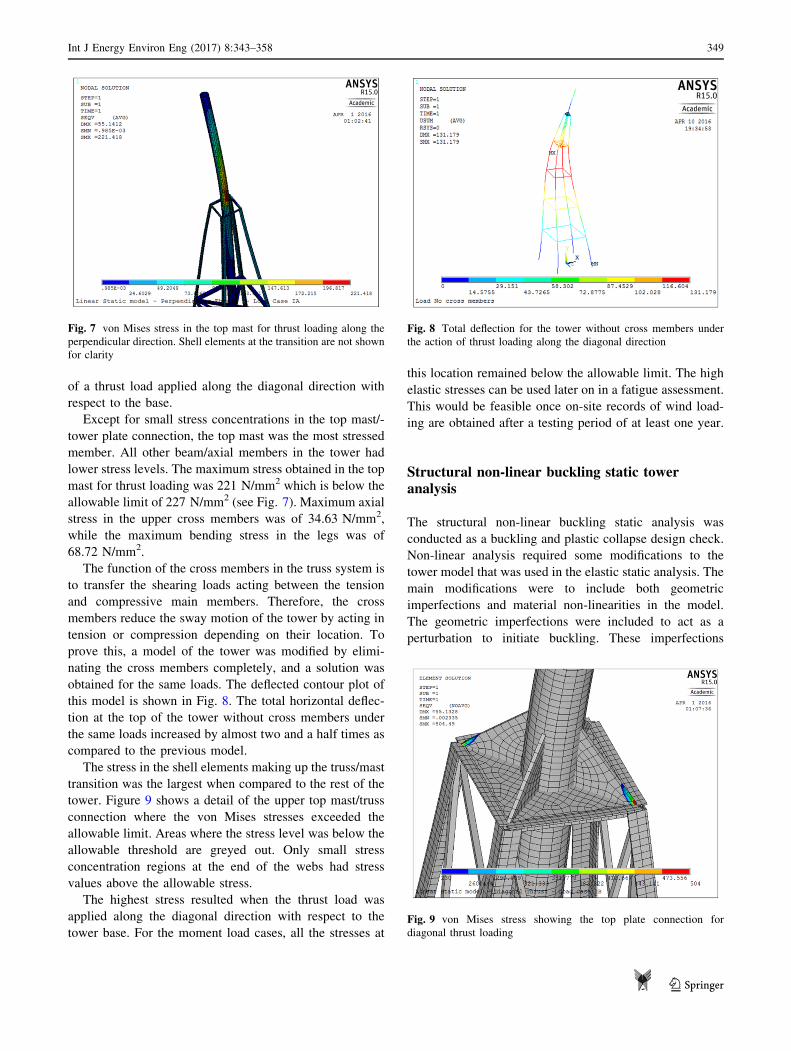
The stress in the shell elements making up the truss/mast
transition was the largest when compared to the rest of the
tower. Figure 9 shows a detail of the upper top mast/truss
connection where the von Mises stresses exceeded the
allowable limit. Areas where the stress level was below the
allowable threshold are greyed out. Only small stress
concentration regions at the end of the webs had stress
values above the allowable stress.
The highest stress resulted when the thrust load was
applied along the diagonal direction with respect to the
tower base. For the moment load cases, all the stresses at
this location remained below the allowable limit. The high
elastic stresses can be used later on in a fatigue assessment.
This would be feasible once on-site records of wind load-
ing are obtained after a testing period of at least one year.
Structural non-linear buckling static toweranalysis
The structural non-linear buckling static analysis was
conducted as a buckling and plastic collapse design check.
Non-linear analysis required some modifications to the
tower model that was used in the elastic static analysis. The
main modifications were to include both geometric
imperfections and material non-linearities in the model.
The geometric imperfections were included to act as a
perturbation to initiate buckling. These imperfections
Fig. 7 von Mises stress in the top mast for thrust loading along the
perpendicular direction. Shell elements at the transition are not shown
for clarity
Fig. 8 Total deflection for the tower without cross members under
the action of thrust loading along the diagonal direction
Fig. 9 von Mises stress showing the top plate connection for
diagonal thrust loading
Int J Energy Environ Eng (2017) 8:343–358 349
123
represent the geometric imperfections present in the real
structure. In order for the structure to be acceptable, geo-
metric imperfections must be within certain tolerances as
specified by the fabrication part of the relevant design
code. For the work presented in this paper, two methods
were used to create the imperfections in the tower model.
In the first method, the mode shapes from an eigenvalue
buckling analysis were used to pre-deform the structure. In
the second method, an amount of deformation was imposed
on the main members, mid-span between the horizontal
members. This created an imposed imperfection similar to
a sinusoidal form. Limits on the values of imperfections
were based on Eurocode 3 [26]. Measurements of out-of-
straightness imperfections were made on the actual tower
structure. During measurements, the main members were
the main focus. The unsupported length for the tower’s
main members is 2.5 m, and the out-of-straightness was
within the range of 5 to 8 mm. Eurocode 3 [26] requires
these imperfections to fall within a length given by L/300
(8.3 mm in this case), where L is the unsupported length.
Material non-linearity was introduced in the constitutive
equations for the tower. The material was modelled as
elastic perfectly plastic, exhibiting a linear stress–strain
relationship up to the yield point, with a plastic modulus
equivalent to zero slope beyond that point.
For the non-linear buckling analyses, the tower members
were all modelled using beam elements in order to model
buckling (out-of-plane deformation). The transition
between the top mast and the tower was made up of shell
elements as employed in the elastic analyses. For the non-
linear model, a modification was made to join the cross
members as on the actual tower (Fig. 10). This was not
possible with the truss element model as it caused the
eigenvalue buckling analysis solution to fail to converge.
This modification was included in the model since the
tension member, by virtue of the midpoint connection,
provides lateral support to the compression brace. If the
cross members were not connected, each member would
behave independently of the other, and they would buckle
in the first mode. Thus, the midpoint connection provides
stability to the bracing system and efficiency to the struc-
ture as a whole [33].
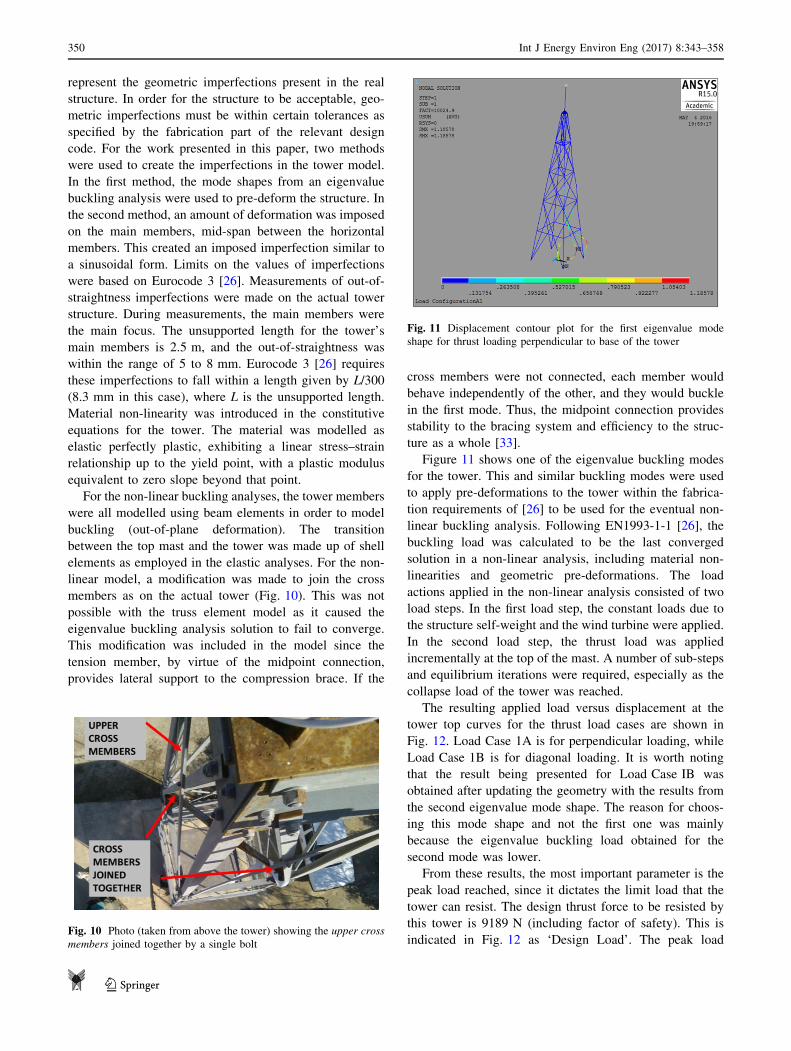
Figure 11 shows one of the eigenvalue buckling modes
for the tower. This and similar buckling modes were used
to apply pre-deformations to the tower within the fabrica-
tion requirements of [26] to be used for the eventual non-
linear buckling analysis. Following EN1993-1-1 [26], the
buckling load was calculated to be the last converged
solution in a non-linear analysis, including material non-
linearities and geometric pre-deformations. The load
actions applied in the non-linear analysis consisted of two
load steps. In the first load step, the constant loads due to
the structure self-weight and the wind turbine were applied.
In the second load step, the thrust load was applied
incrementally at the top of the mast. A number of sub-steps
and equilibrium iterations were required, especially as the
collapse load of the tower was reached.
The resulting applied load versus displacement at the
tower top curves for the thrust load cases are shown in
Fig. 12. Load Case 1A is for perpendicular loading, while
Load Case 1B is for diagonal loading. It is worth noting
that the result being presented for Load Case IB was
obtained after updating the geometry with the results from
the second eigenvalue mode shape. The reason for choos-
ing this mode shape and not the first one was mainly
because the eigenvalue buckling load obtained for the
second mode was lower.
From these results, the most important parameter is the
peak load reached, since it dictates the limit load that the
tower can resist. The design thrust force to be resisted by
this tower is 9189 N (including factor of safety). This is
indicated in Fig. 12 as ‘Design Load’. The peak loadFig. 10 Photo (taken from above the tower) showing the upper cross
members joined together by a single bolt
Fig. 11 Displacement contour plot for the first eigenvalue mode
shape for thrust loading perpendicular to base of the tower
350 Int J Energy Environ Eng (2017) 8:343–358
123
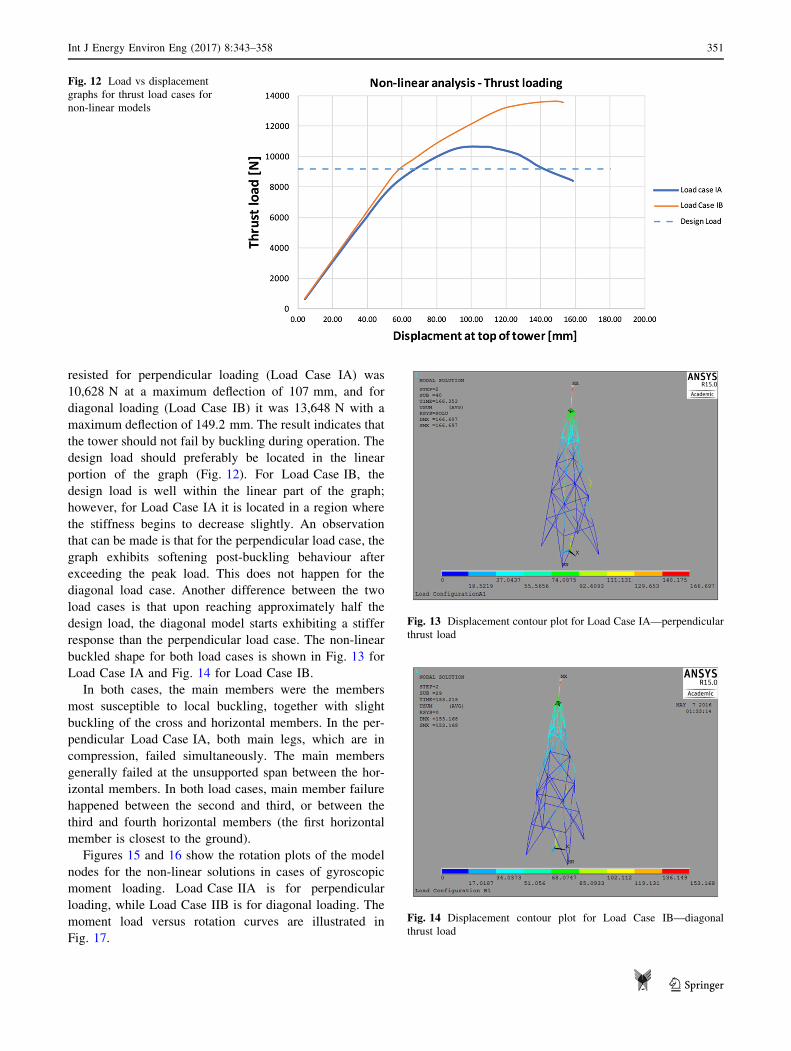
resisted for perpendicular loading (Load Case IA) was
10,628 N at a maximum deflection of 107 mm, and for
diagonal loading (Load Case IB) it was 13,648 N with a
maximum deflection of 149.2 mm. The result indicates that
the tower should not fail by buckling during operation. The
design load should preferably be located in the linear
portion of the graph (Fig. 12). For Load Case IB, the
design load is well within the linear part of the graph;
however, for Load Case IA it is located in a region where
the stiffness begins to decrease slightly. An observation
that can be made is that for the perpendicular load case, the
graph exhibits softening post-buckling behaviour after
exceeding the peak load. This does not happen for the
diagonal load case. Another difference between the two
load cases is that upon reaching approximately half the
design load, the diagonal model starts exhibiting a stiffer
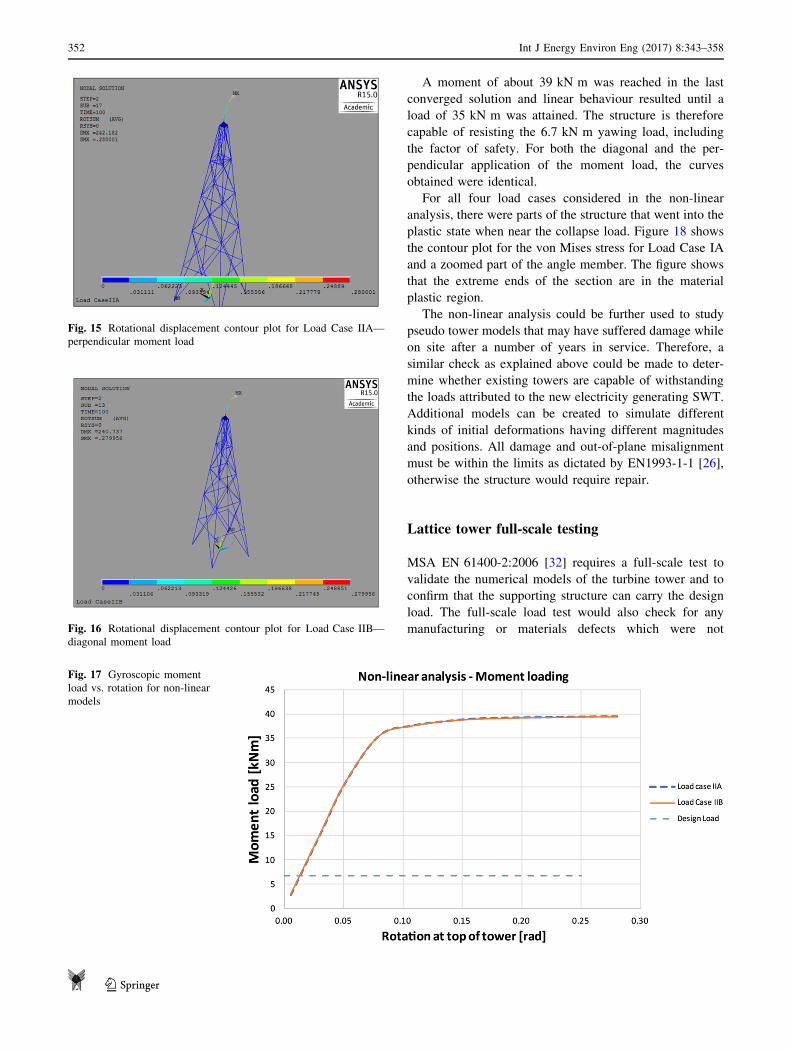
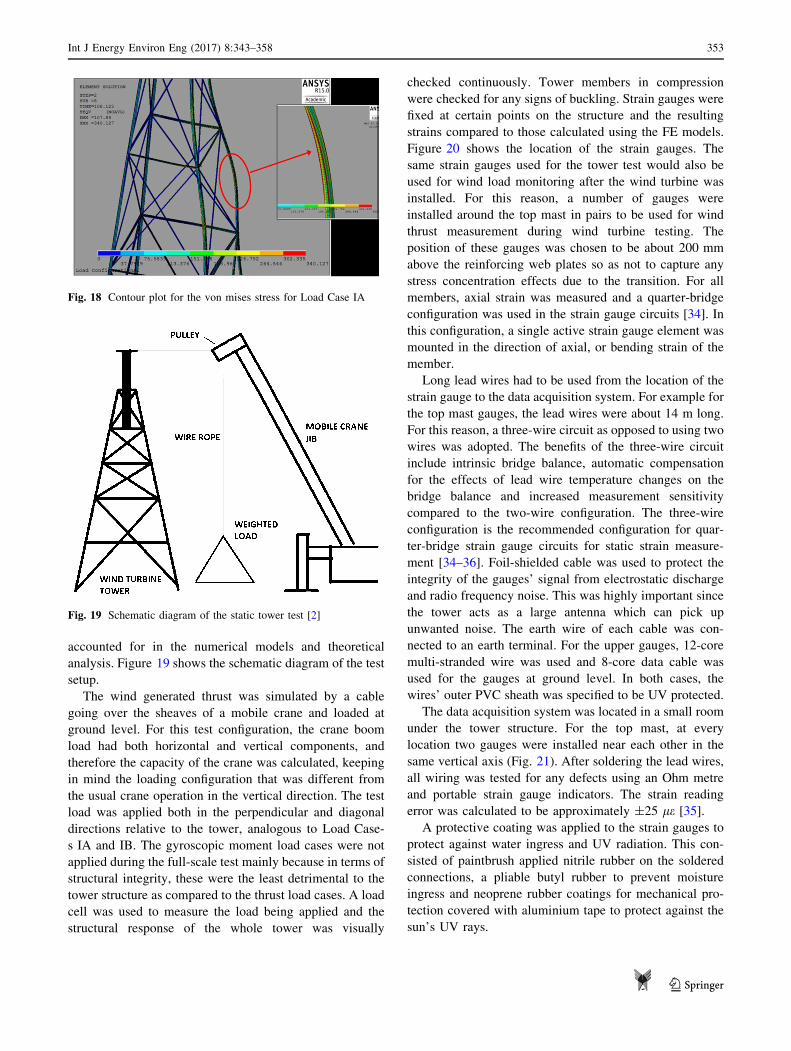
response than the perpendicular load case. The non-linear
buckled shape for both load cases is shown in Fig. 13 for
Load Case IA and Fig. 14 for Load Case IB.
In both cases, the main members were the members
most susceptible to local buckling, together with slight
buckling of the cross and horizontal members. In the per-
pendicular Load Case IA, both main legs, which are in
compression, failed simultaneously. The main members
generally failed at the unsupported span between the hor-
izontal members. In both load cases, main member failure
happened between the second and third, or between the
third and fourth horizontal members (the first horizontal
member is closest to the ground).
Figures 15 and 16 show the rotation plots of the model
nodes for the non-linear solutions in cases of gyroscopic
moment loading. Load Case IIA is for perpendicular
loading, while Load Case IIB is for diagonal loading. The
moment load versus rotation curves are illustrated in
Fig. 17.
Fig. 12 Load vs displacement
graphs for thrust load cases for
non-linear models
Fig. 13 Displacement contour plot for Load Case IA—perpendicular
thrust load
Fig. 14 Displacement contour plot for Load Case IB—diagonal
thrust load
Int J Energy Environ Eng (2017) 8:343–358 351
123
A moment of about 39 kN m was reached in the last
converged solution and linear behaviour resulted until a
load of 35 kN m was attained. The structure is therefore
capable of resisting the 6.7 kN m yawing load, including
the factor of safety. For both the diagonal and the per-
pendicular application of the moment load, the curves
obtained were identical.
For all four load cases considered in the non-linear
analysis, there were parts of the structure that went into the
plastic state when near the collapse load. Figure 18 shows
the contour plot for the von Mises stress for Load Case IA
and a zoomed part of the angle member. The figure shows
that the extreme ends of the section are in the material
plastic region.
The non-linear analysis could be further used to study
pseudo tower models that may have suffered damage while
on site after a number of years in service. Therefore, a
similar check as explained above could be made to deter-
mine whether existing towers are capable of withstanding
the loads attributed to the new electricity generating SWT.
Additional models can be created to simulate different
kinds of initial deformations having different magnitudes
and positions. All damage and out-of-plane misalignment
must be within the limits as dictated by EN1993-1-1 [26],
otherwise the structure would require repair.
Lattice tower full-scale testing
MSA EN 61400-2:2006 [32] requires a full-scale test to
validate the numerical models of the turbine tower and to
confirm that the supporting structure can carry the design
load. The full-scale load test would also check for any
manufacturing or materials defects which were not
Fig. 15 Rotational displacement contour plot for Load Case IIA—
perpendicular moment load
Fig. 16 Rotational displacement contour plot for Load Case IIB—
diagonal moment load
Fig. 17 Gyroscopic moment
load vs. rotation for non-linear
models
352 Int J Energy Environ Eng (2017) 8:343–358
123
accounted for in the numerical models and theoretical
analysis. Figure 19 shows the schematic diagram of the test
setup.
The wind generated thrust was simulated by a cable
going over the sheaves of a mobile crane and loaded at
ground level. For this test configuration, the crane boom
load had both horizontal and vertical components, and
therefore the capacity of the crane was calculated, keeping
in mind the loading configuration that was different from
the usual crane operation in the vertical direction. The test
load was applied both in the perpendicular and diagonal
directions relative to the tower, analogous to Load Case-
s IA and IB. The gyroscopic moment load cases were not
applied during the full-scale test mainly because in terms of
structural integrity, these were the least detrimental to the
tower structure as compared to the thrust load cases. A load
cell was used to measure the load being applied and the
structural response of the whole tower was visually
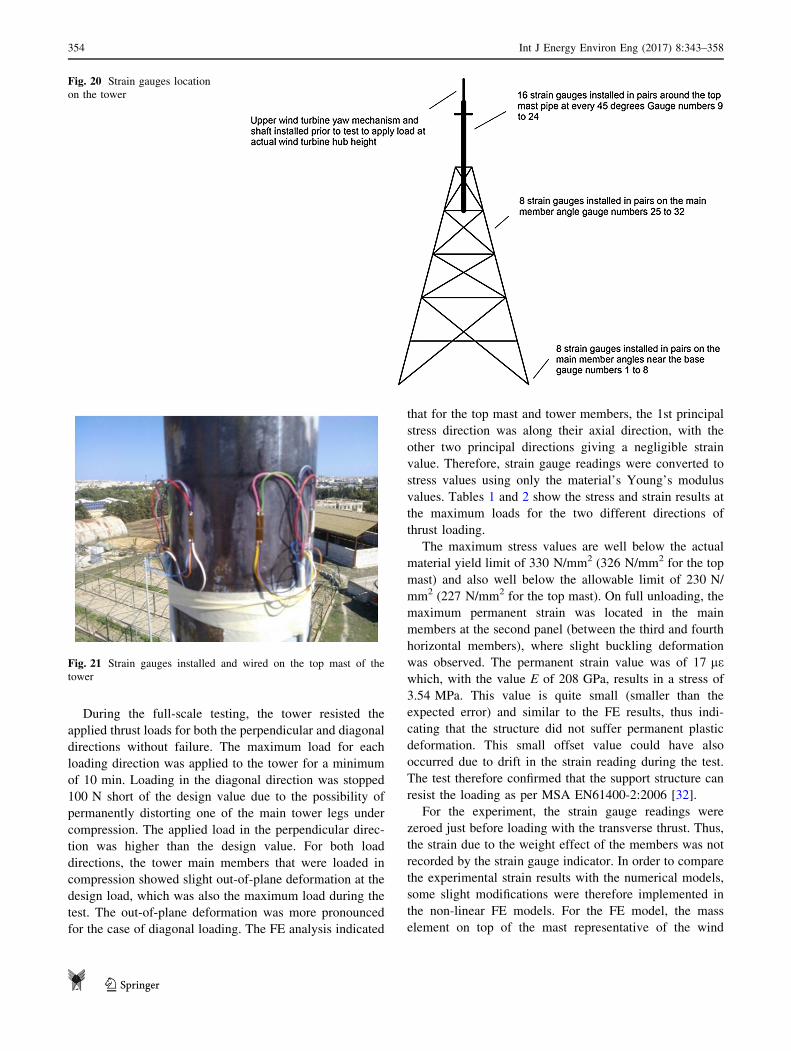
checked continuously. Tower members in compression
were checked for any signs of buckling. Strain gauges were
fixed at certain points on the structure and the resulting
strains compared to those calculated using the FE models.
Figure 20 shows the location of the strain gauges. The
same strain gauges used for the tower test would also be
used for wind load monitoring after the wind turbine was
installed. For this reason, a number of gauges were
installed around the top mast in pairs to be used for wind
thrust measurement during wind turbine testing. The
position of these gauges was chosen to be about 200 mm
above the reinforcing web plates so as not to capture any
stress concentration effects due to the transition. For all
members, axial strain was measured and a quarter-bridge
configuration was used in the strain gauge circuits [34]. In
this configuration, a single active strain gauge element was
mounted in the direction of axial, or bending strain of the
member.
Long lead wires had to be used from the location of the
strain gauge to the data acquisition system. For example for
the top mast gauges, the lead wires were about 14 m long.
For this reason, a three-wire circuit as opposed to using two
wires was adopted. The benefits of the three-wire circuit
include intrinsic bridge balance, automatic compensation
for the effects of lead wire temperature changes on the
bridge balance and increased measurement sensitivity
compared to the two-wire configuration. The three-wire
configuration is the recommended configuration for quar-
ter-bridge strain gauge circuits for static strain measure-
ment [34–36]. Foil-shielded cable was used to protect the
integrity of the gauges’ signal from electrostatic discharge
and radio frequency noise. This was highly important since
the tower acts as a large antenna which can pick up
unwanted noise. The earth wire of each cable was con-
nected to an earth terminal. For the upper gauges, 12-core
multi-stranded wire was used and 8-core data cable was
used for the gauges at ground level. In both cases, the
wires’ outer PVC sheath was specified to be UV protected.
The data acquisition system was located in a small room
under the tower structure. For the top mast, at every
location two gauges were installed near each other in the
same vertical axis (Fig. 21). After soldering the lead wires,
all wiring was tested for any defects using an Ohm metre
and portable strain gauge indicators. The strain reading
error was calculated to be approximately ±25 le [35].
A protective coating was applied to the strain gauges to
protect against water ingress and UV radiation. This con-
sisted of paintbrush applied nitrile rubber on the soldered
connections, a pliable butyl rubber to prevent moisture
ingress and neoprene rubber coatings for mechanical pro-
tection covered with aluminium tape to protect against the
sun’s UV rays.
Fig. 18 Contour plot for the von mises stress for Load Case IA
Fig. 19 Schematic diagram of the static tower test [2]
Int J Energy Environ Eng (2017) 8:343–358 353
123
During the full-scale testing, the tower resisted the
applied thrust loads for both the perpendicular and diagonal
directions without failure. The maximum load for each
loading direction was applied to the tower for a minimum
of 10 min. Loading in the diagonal direction was stopped
100 N short of the design value due to the possibility of
permanently distorting one of the main tower legs under
compression. The applied load in the perpendicular direc-
tion was higher than the design value. For both load
directions, the tower main members that were loaded in
compression showed slight out-of-plane deformation at the
design load, which was also the maximum load during the
test. The out-of-plane deformation was more pronounced
for the case of diagonal loading. The FE analysis indicated
that for the top mast and tower members, the 1st principal
stress direction was along their axial direction, with the
other two principal directions giving a negligible strain
value. Therefore, strain gauge readings were converted to
stress values using only the material’s Young’s modulus
values. Tables 1 and 2 show the stress and strain results at
the maximum loads for the two different directions of
thrust loading.
The maximum stress values are well below the actual
material yield limit of 330 N/mm2 (326 N/mm2 for the top
mast) and also well below the allowable limit of 230 N/
mm2 (227 N/mm2 for the top mast). On full unloading, the
maximum permanent strain was located in the main
members at the second panel (between the third and fourth
horizontal members), where slight buckling deformation
was observed. The permanent strain value was of 17 lewhich, with the value E of 208 GPa, results in a stress of
3.54 MPa. This value is quite small (smaller than the
expected error) and similar to the FE results, thus indi-
cating that the structure did not suffer permanent plastic
deformation. This small offset value could have also
occurred due to drift in the strain reading during the test.
The test therefore confirmed that the support structure can
resist the loading as per MSA EN61400-2:2006 [32].
For the experiment, the strain gauge readings were
zeroed just before loading with the transverse thrust. Thus,
the strain due to the weight effect of the members was not
recorded by the strain gauge indicator. In order to compare
the experimental strain results with the numerical models,
some slight modifications were therefore implemented in
the non-linear FE models. For the FE model, the mass
element on top of the mast representative of the wind
Fig. 20 Strain gauges location
on the tower
Fig. 21 Strain gauges installed and wired on the top mast of the
tower
354 Int J Energy Environ Eng (2017) 8:343–358
123

turbine weight was ignored, and gravity loading was
removed after obtaining the new, non-linear solution. This
was done as a third load step in which gravity was
removed. Thus, any effects in the non-linear solution due to
the tower members’ weight were included, but then the
third load step removed its effect on the resulting strains.
For the perpendicular load case, the comparison of results
between strains obtained experimentally and using FEA is
shown in Figs. 22, 23, 24 and 25. In these plots, the error
bars for strain, deflection and load are included. The error
bars for the load are not visible since the error was very
small compared to the range being plotted on the graphs.
Figure 22 shows the strain results for the top mast in the
case of perpendicular loading in which only the maximum
and minimum strain values are shown for clarity. The
experimentally measured strains remain linear in relation to
the load, behaviour similar to that obtained in the FE
results. Other observations are that the experimental and
FEA load-strain lines have almost the same slope and that
the FEA strain is within ±35 le of the measured experi-
mental strain.
Figure 23 shows the comparison for four gauges in the
case of perpendicular loading (Load Case IA): two located
in a compression-loaded main member, and two in a ten-
sile-loaded main member. The FEA results for these
locations lie within the error range of the experimental
strain values obtained.
Figure 24 shows the comparison for the strain gauges
located on the main members at ground level. Only two
main members are shown for clarity, as the load in the
other two main members is symmetric. At this location, the
experimental strains are more dispersed from each other,
which may imply that the main member has a bending
moment acting and creating different strain levels on the
sides of the angle member. This can occur due to some
slight side sway caused by the fact that the angle sections
are open sections, as opposed to closed sections. It is to be
noted that this dispersion does not manifest itself in the FE
results mainly because of the one-sided direction of pre-
deformation imposed on the unloaded model.
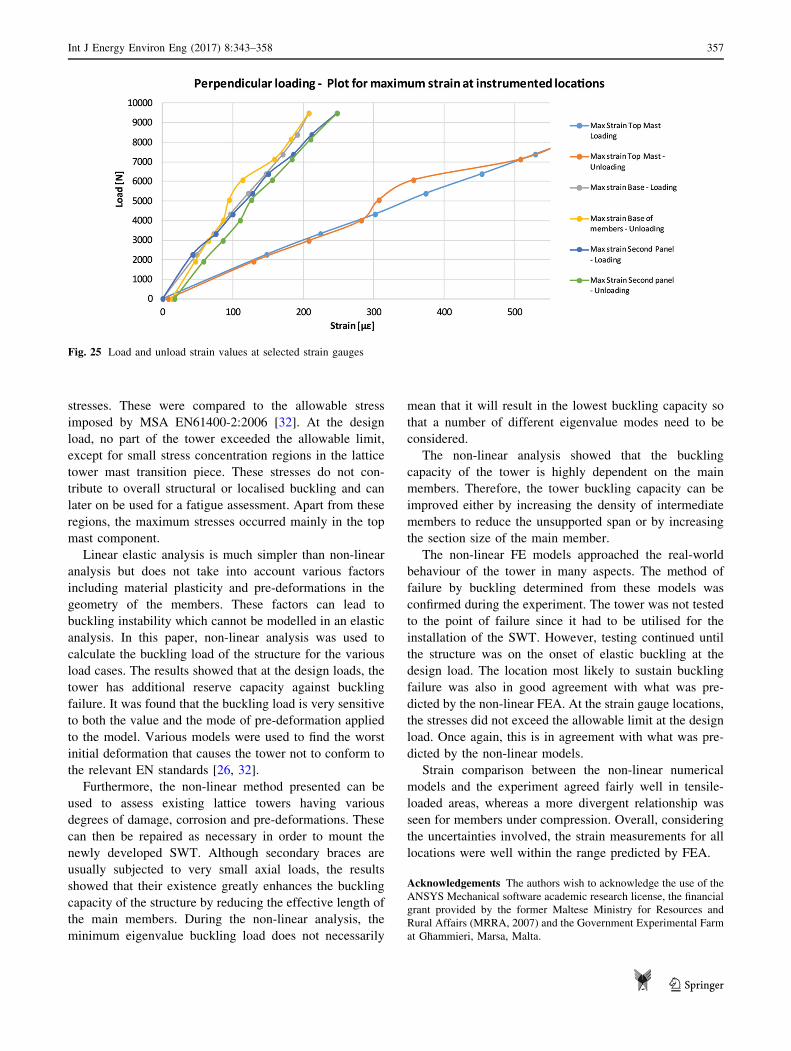
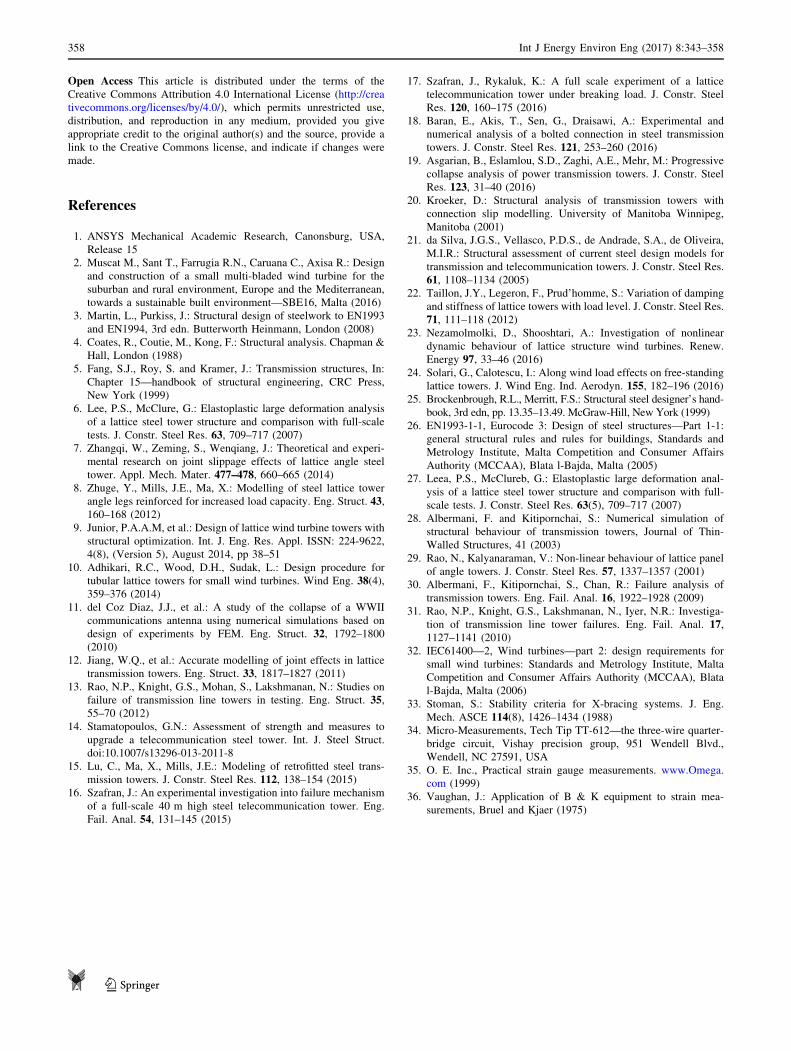
Figure 25 shows the plots of the strain gauges that
recorded the maximum strain at the instrumented locations.
Table 1 Thrust load in
perpendicular direction
(9476 N) (Load Case IA)
Maximum strain, le Maximum stress, N/mm2
Top mast 673.5 154.50
Base of main members 207.0 43.16
Main members at the 2nd panel 247.5 51.48
Table 2 Thrust load in
diagonal direction (9084 N)
(Load Case IIB)
Maximum strain, le Maximum stress, N/mm2
Top mast 649.5 148.10
Base of main members 258.5 53.77
Main members at the 2nd panel 303.5 63.13
Fig. 22 Load Case IA (perpendicular loading) Top mast maximum and minimum strain comparison
Int J Energy Environ Eng (2017) 8:343–358 355
123
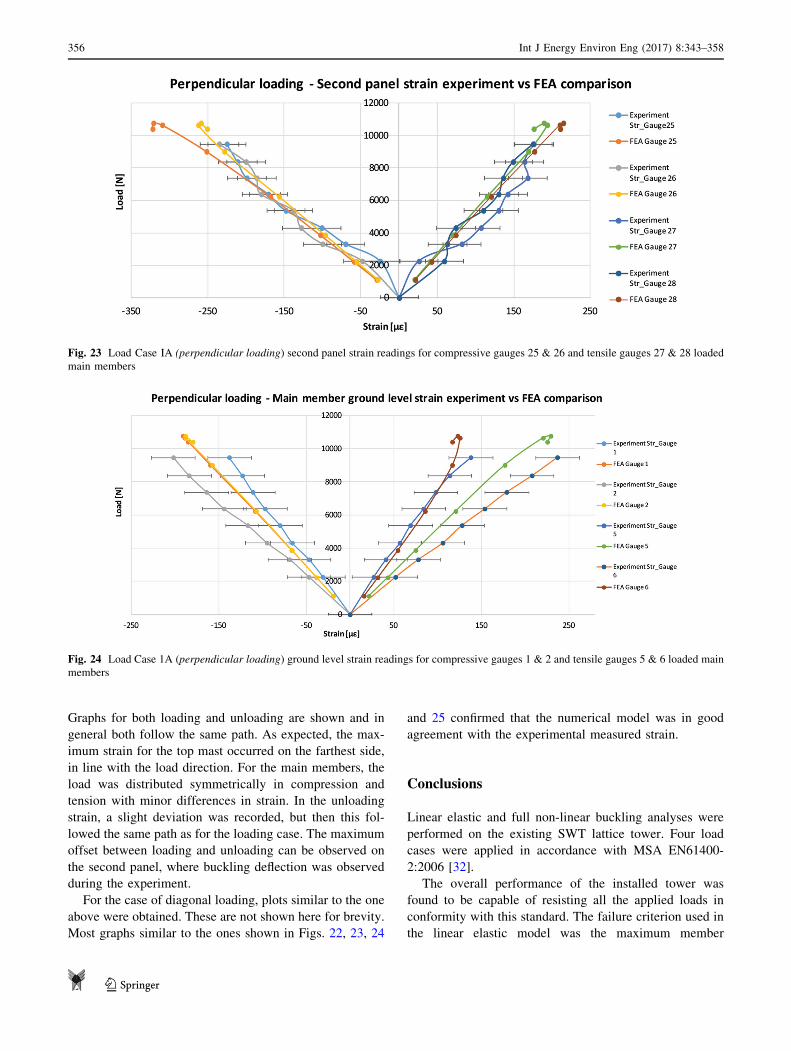
Graphs for both loading and unloading are shown and in
general both follow the same path. As expected, the max-
imum strain for the top mast occurred on the farthest side,
in line with the load direction. For the main members, the
load was distributed symmetrically in compression and
tension with minor differences in strain. In the unloading
strain, a slight deviation was recorded, but then this fol-
lowed the same path as for the loading case. The maximum
offset between loading and unloading can be observed on
the second panel, where buckling deflection was observed
during the experiment.
For the case of diagonal loading, plots similar to the one
above were obtained. These are not shown here for brevity.
Most graphs similar to the ones shown in Figs. 22, 23, 24
and 25 confirmed that the numerical model was in good
agreement with the experimental measured strain.
Conclusions
Linear elastic and full non-linear buckling analyses were
performed on the existing SWT lattice tower. Four load
cases were applied in accordance with MSA EN61400-
2:2006 [32].
The overall performance of the installed tower was
found to be capable of resisting all the applied loads in
conformity with this standard. The failure criterion used in
the linear elastic model was the maximum member
Fig. 23 Load Case IA (perpendicular loading) second panel strain readings for compressive gauges 25 & 26 and tensile gauges 27 & 28 loaded
main members
Fig. 24 Load Case 1A (perpendicular loading) ground level strain readings for compressive gauges 1 & 2 and tensile gauges 5 & 6 loaded main
members
356 Int J Energy Environ Eng (2017) 8:343–358
123
stresses. These were compared to the allowable stress
imposed by MSA EN61400-2:2006 [32]. At the design
load, no part of the tower exceeded the allowable limit,
except for small stress concentration regions in the lattice
tower mast transition piece. These stresses do not con-
tribute to overall structural or localised buckling and can
later on be used for a fatigue assessment. Apart from these
regions, the maximum stresses occurred mainly in the top
mast component.
Linear elastic analysis is much simpler than non-linear
analysis but does not take into account various factors
including material plasticity and pre-deformations in the
geometry of the members. These factors can lead to
buckling instability which cannot be modelled in an elastic
analysis. In this paper, non-linear analysis was used to
calculate the buckling load of the structure for the various
load cases. The results showed that at the design loads, the
tower has additional reserve capacity against buckling
failure. It was found that the buckling load is very sensitive
to both the value and the mode of pre-deformation applied
to the model. Various models were used to find the worst
initial deformation that causes the tower not to conform to
the relevant EN standards [26, 32].
Furthermore, the non-linear method presented can be
used to assess existing lattice towers having various
degrees of damage, corrosion and pre-deformations. These
can then be repaired as necessary in order to mount the
newly developed SWT. Although secondary braces are
usually subjected to very small axial loads, the results
showed that their existence greatly enhances the buckling
capacity of the structure by reducing the effective length of
the main members. During the non-linear analysis, the
minimum eigenvalue buckling load does not necessarily
mean that it will result in the lowest buckling capacity so
that a number of different eigenvalue modes need to be
considered.
The non-linear analysis showed that the buckling
capacity of the tower is highly dependent on the main
members. Therefore, the tower buckling capacity can be
improved either by increasing the density of intermediate
members to reduce the unsupported span or by increasing
the section size of the main member.
The non-linear FE models approached the real-world
behaviour of the tower in many aspects. The method of
failure by buckling determined from these models was
confirmed during the experiment. The tower was not tested
to the point of failure since it had to be utilised for the
installation of the SWT. However, testing continued until
the structure was on the onset of elastic buckling at the
design load. The location most likely to sustain buckling
failure was also in good agreement with what was pre-
dicted by the non-linear FEA. At the strain gauge locations,
the stresses did not exceed the allowable limit at the design
load. Once again, this is in agreement with what was pre-
dicted by the non-linear models.
Strain comparison between the non-linear numerical
models and the experiment agreed fairly well in tensile-
loaded areas, whereas a more divergent relationship was
seen for members under compression. Overall, considering
the uncertainties involved, the strain measurements for all
locations were well within the range predicted by FEA.
Acknowledgements The authors wish to acknowledge the use of the
ANSYS Mechanical software academic research license, the financial
grant provided by the former Maltese Ministry for Resources and
Rural Affairs (MRRA, 2007) and the Government Experimental Farm
at G�hammieri, Marsa, Malta.
Fig. 25 Load and unload strain values at selected strain gauges
Int J Energy Environ Eng (2017) 8:343–358 357
123
Open Access This article is distributed under the terms of the
Creative Commons Attribution 4.0 International License (http://crea
tivecommons.org/licenses/by/4.0/), which permits unrestricted use,
distribution, and reproduction in any medium, provided you give
appropriate credit to the original author(s) and the source, provide a
link to the Creative Commons license, and indicate if changes were
made.
References
1. ANSYS Mechanical Academic Research, Canonsburg, USA,
Release 15
2. Muscat M., Sant T., Farrugia R.N., Caruana C., Axisa R.: Design
and construction of a small multi-bladed wind turbine for the
suburban and rural environment, Europe and the Mediterranean,
towards a sustainable built environment—SBE16, Malta (2016)
3. Martin, L., Purkiss, J.: Structural design of steelwork to EN1993
and EN1994, 3rd edn. Butterworth Heinmann, London (2008)
4. Coates, R., Coutie, M., Kong, F.: Structural analysis. Chapman &
Hall, London (1988)
5. Fang, S.J., Roy, S. and Kramer, J.: Transmission structures, In:
Chapter 15—handbook of structural engineering, CRC Press,
New York (1999)
6. Lee, P.S., McClure, G.: Elastoplastic large deformation analysis
of a lattice steel tower structure and comparison with full-scale
tests. J. Constr. Steel Res. 63, 709–717 (2007)
7. Zhangqi, W., Zeming, S., Wenqiang, J.: Theoretical and experi-
mental research on joint slippage effects of lattice angle steel
tower. Appl. Mech. Mater. 477–478, 660–665 (2014)
8. Zhuge, Y., Mills, J.E., Ma, X.: Modelling of steel lattice tower
angle legs reinforced for increased load capacity. Eng. Struct. 43,
160–168 (2012)
9. Junior, P.A.A.M, et al.: Design of lattice wind turbine towers with
structural optimization. Int. J. Eng. Res. Appl. ISSN: 224-9622,
4(8), (Version 5), August 2014, pp 38–51
10. Adhikari, R.C., Wood, D.H., Sudak, L.: Design procedure for
tubular lattice towers for small wind turbines. Wind Eng. 38(4),
359–376 (2014)
11. del Coz Diaz, J.J., et al.: A study of the collapse of a WWII
communications antenna using numerical simulations based on
design of experiments by FEM. Eng. Struct. 32, 1792–1800
(2010)
12. Jiang, W.Q., et al.: Accurate modelling of joint effects in lattice
transmission towers. Eng. Struct. 33, 1817–1827 (2011)
13. Rao, N.P., Knight, G.S., Mohan, S., Lakshmanan, N.: Studies on
failure of transmission line towers in testing. Eng. Struct. 35,
55–70 (2012)
14. Stamatopoulos, G.N.: Assessment of strength and measures to
upgrade a telecommunication steel tower. Int. J. Steel Struct.
doi:10.1007/s13296-013-2011-8
15. Lu, C., Ma, X., Mills, J.E.: Modeling of retrofitted steel trans-
mission towers. J. Constr. Steel Res. 112, 138–154 (2015)
16. Szafran, J.: An experimental investigation into failure mechanism
of a full-scale 40 m high steel telecommunication tower. Eng.
Fail. Anal. 54, 131–145 (2015)
17. Szafran, J., Rykaluk, K.: A full scale experiment of a lattice
telecommunication tower under breaking load. J. Constr. Steel
Res. 120, 160–175 (2016)
18. Baran, E., Akis, T., Sen, G., Draisawi, A.: Experimental and
numerical analysis of a bolted connection in steel transmission
towers. J. Constr. Steel Res. 121, 253–260 (2016)
19. Asgarian, B., Eslamlou, S.D., Zaghi, A.E., Mehr, M.: Progressive
collapse analysis of power transmission towers. J. Constr. Steel
Res. 123, 31–40 (2016)
20. Kroeker, D.: Structural analysis of transmission towers with
connection slip modelling. University of Manitoba Winnipeg,
Manitoba (2001)
21. da Silva, J.G.S., Vellasco, P.D.S., de Andrade, S.A., de Oliveira,
M.I.R.: Structural assessment of current steel design models for
transmission and telecommunication towers. J. Constr. Steel Res.
61, 1108–1134 (2005)
22. Taillon, J.Y., Legeron, F., Prud’homme, S.: Variation of damping
and stiffness of lattice towers with load level. J. Constr. Steel Res.
71, 111–118 (2012)
23. Nezamolmolki, D., Shooshtari, A.: Investigation of nonlinear
dynamic behaviour of lattice structure wind turbines. Renew.
Energy 97, 33–46 (2016)
24. Solari, G., Calotescu, I.: Along wind load effects on free-standing
lattice towers. J. Wind Eng. Ind. Aerodyn. 155, 182–196 (2016)
25. Brockenbrough, R.L., Merritt, F.S.: Structural steel designer’s hand-
book, 3rd edn, pp. 13.35–13.49. McGraw-Hill, New York (1999)
26. EN1993-1-1, Eurocode 3: Design of steel structures—Part 1-1:
general structural rules and rules for buildings, Standards and
Metrology Institute, Malta Competition and Consumer Affairs
Authority (MCCAA), Blata l-Bajda, Malta (2005)
27. Leea, P.S., McClureb, G.: Elastoplastic large deformation anal-
ysis of a lattice steel tower structure and comparison with full-
scale tests. J. Constr. Steel Res. 63(5), 709–717 (2007)
28. Albermani, F. and Kitipornchai, S.: Numerical simulation of
structural behaviour of transmission towers, Journal of Thin-
Walled Structures, 41 (2003)
29. Rao, N., Kalyanaraman, V.: Non-linear behaviour of lattice panel
of angle towers. J. Constr. Steel Res. 57, 1337–1357 (2001)
30. Albermani, F., Kitipornchai, S., Chan, R.: Failure analysis of
transmission towers. Eng. Fail. Anal. 16, 1922–1928 (2009)
31. Rao, N.P., Knight, G.S., Lakshmanan, N., Iyer, N.R.: Investiga-
tion of transmission line tower failures. Eng. Fail. Anal. 17,
1127–1141 (2010)
32. IEC61400—2, Wind turbines—part 2: design requirements for
small wind turbines: Standards and Metrology Institute, Malta
Competition and Consumer Affairs Authority (MCCAA), Blata
l-Bajda, Malta (2006)
33. Stoman, S.: Stability criteria for X-bracing systems. J. Eng.
Mech. ASCE 114(8), 1426–1434 (1988)
34. Micro-Measurements, Tech Tip TT-612—the three-wire quarter-
bridge circuit, Vishay precision group, 951 Wendell Blvd.,
Wendell, NC 27591, USA
35. O. E. Inc., Practical strain gauge measurements. www.Omega.
com (1999)
36. Vaughan, J.: Application of B & K equipment to strain mea-
surements, Bruel and Kjaer (1975)
358 Int J Energy Environ Eng (2017) 8:343–358
123


![LOADS AND DYNAMICS IN LATTICE TOWER SUPPORT … · 2014. 11. 17. · Lattice tower − 120m, 4 legs, 10 sections Leg distance y [m] Wind Power R&D seminar – Deep sea offshore wind](https://img.pdfslide.us/doc/110x75/60b1ab8a714e9d60a637f769/loads-and-dynamics-in-lattice-tower-support-2014-11-17-lattice-tower-a-120m.jpg)