Embed Size (px)
Citation preview
Universidade de São Paulo
2014-08
Structural and morphological characterization
of poly(o-ethoxyaniline) emeraldine-salt form
using FTIR, XRD, LeBail method and SEM Journal of Molecular Structure, Amsterdam : Elsevier BV, v. 1071, p. 1-5, Aug. 2014http://www.producao.usp.br/handle/BDPI/50358
Downloaded from: Biblioteca Digital da Produção Intelectual - BDPI, Universidade de São Paulo
Biblioteca Digital da Produção Intelectual - BDPI
Departamento de Física e Ciência Interdisciplinar - IFSC/FCI Artigos e Materiais de Revistas Científicas - IFSC/FCI
brought to you by COREView metadata, citation and similar papers at core.ac.uk
provided by Biblioteca Digital da Produção Intelectual da Universidade de São Paulo (BDPI/USP)
Structural and morphological characterization of Poly(o-ethoxyaniline)Emeraldine-salt form using FTIR, XRD, LeBail Method and SEM
Adriano de S. Silva a, Juliana C. Soares b, Ana Carolina Mafud b, Sérgio M. de Souza a,Edson G.R. Fernandes b, Yvonne P. Mascarenhas b, Edgar A. Sanches a,⇑a Universidade Federal do Amazonas (UFAM), Departamento de Física (DF), Engenharia de Recursos da Amazônia (ENGRAM), Manaus, AM, Brazilb Universidade de São Paulo (USP), Instituto de Física de São Carlos (IFSC), São Carlos, SP, Brazil
h i g h l i g h t s
� XRD patterns did not show structural differences with increasing polymerization times.� The presence of the functional group –OCH2CH3 in the ortho position of the carbon rings need to increase cell parameters.� Polymer morphology showed interconnected vesicular microspheres.
a r t i c l e i n f o
Article history:Received 17 March 2014Received in revised form 8 April 2014Accepted 10 April 2014Available online 19 April 2014
Keywords:PolyanilinePOEA-ESFTIRXRDLeBail MethodSEM
a b s t r a c t
The introduction of polar functional and alkyl groups into the main chain of Polyaniline (PANI) is a mech-anism to obtain soluble polymers in a wider variety of organic solvents. Poly(o-ethoxyaniline) (POEA) is aderivative of PANI and its structural difference is the presence of the group (–OC2H5) in the ortho positionof the carbon rings. Despite the large number of studies performed with PANI and its derivatives, thereare few that focus on a structural study of these materials in doped form (ES). Poly(o-ethoxyaniline)Emeraldine-salt form (POEA-ES) was synthesized in polymerization times of 3, 24 and 48 h. ThroughXRD measurements were observed that different polymerization times did not cause structural changesin polymer structures. It were found in XRD patterns peaks at 2h = 8�, 12�, 16�, 24�, 26�, 38�, 44� and 52�.Crystallinity percentage was calculated using the Peak Fitting Module Program and showed that POEA-EShas around 39% of crystallinity. FTIR analysis allowed to identify characteristic absorption bands in thestructure of POEA-ES. By Scanning Electron Microscopy (SEM) it was observed micrometric particles ofvarying sizes, with morphologies similar to interconnected vesicular microspheres. Through LeBailMethod, it was observed that crystallites of POEA-ES are present in the order of 26 Å. It was found aconductivity value of 0.3 � 10�7 S/cm for POEA-ES.
� 2014 Elsevier B.V. All rights reserved.
Introduction
Within the Intrinsically Conducting Polymers class (ICPs),Polyaniline (PANI) and its derivatives have received great attentiondue to the low cost of monomer, ease of synthesis and doping andchemical stability under ambient conditions, enabling technologi-cal applications that have been developed industrially [1–4].
Despite the prominence of PANI in the class of ICPs, there aresome limitations that hinder its use in industrial scale, such asthe low solubility in organic solvents, low mechanical flexibilityand processability. A widely used mechanism for improve the PANI
solubility in organic solvents is the introduction of polar functionaland long flexible alkyl groups mainly bonded to the main chain,allowing their characterization and processability [5–7].
PANI and its derivatives can be synthesized in different oxida-tion states. Their synthesis and derivatives are influenced by anumber of parameters, such as pH, reactants concentration, natureof the oxidizing agents and protonic acids, polymerization temper-ature and time [8], may result in polymers with different structuralcharacteristics and physicochemical properties [9,10].
Poly(o-ethoxyaniline) Emeraldine-salt form (POEA-ES) is aderivative of PANI and its structural difference is the presence ofthe group (–OCH2CH3) in the ortho position of the aniline rings[11,12]. Based on the structural proposals existing in the literatureand considering the importance of these materials in technologicalapplications, the goal of this paper is provide greater benefits to a
http://dx.doi.org/10.1016/j.molstruc.2014.04.0390022-2860/� 2014 Elsevier B.V. All rights reserved.
⇑ Corresponding author. Tel.: +55 9284167887.E-mail address: [email protected] (E.A. Sanches).
Journal of Molecular Structure 1071 (2014) 1–5
Contents lists available at ScienceDirect
Journal of Molecular Structure
journal homepage: www.elsevier .com/ locate /molst ruc
better understanding of the structural and morphological charac-teristics of PANI derivatives. Thus, we proposed a structural andmorphological characterization of POEA-ES synthesized at differ-ent polymerization times.
Fourier-transformed Infrared Spectroscopy (FTIR) was used forbonds structural information; XRD was used for determination ofcell parameters and crystallinity percentage; LeBail Method wasperformed to refine cell parameters and to obtain crystallite sizeand shape; SEM was carried out for polymer morphology investi-gation. Then, these results were correlated with POEA-ES electricalproperties.
Experimental
Polymer synthesis
POEA-ES was obtained based on previously published literaturesynthesis [12], with some modifications [8]. Chemical synthesiswas made using hydrochloric acid (HCl) and ammonium peroxydi-sulfate (APS). After precipitation, aliquots collected at 3, 24 and48 h were vacuum filtered and washed with acetone to obtainpowder polymers.
Fourier-transformed Infrared Spectroscopy (FTIR)
FTIR spectra were measured in Nanomed Inovação emNanotecnologia, São Carlos/SP, Brazil, with a spectrophotometerBomem-MB Series-Hartmann & Braun in the range of400–3500 cm�1 and 16 scans. Pellets were prepared with KBr inmass ratio of 1:100 using a hydraulic press Perkin–Elmer at apressure of 15 tons.
X-ray diffraction and crystallinity percentage
XRD data were obtained at the Laboratory of X-ray crystallogra-phy of IFSC/USP – São Carlos/SP, using a Rigaku Rotaflex diffrac-tometer equipped with graphite monochromator and rotatinganode tube, operating with Cu Ka, 50 kV and 100 mA. Powder dif-fraction patterns were obtained in stepscanning mode, 2h = 5–60�,step of 0.02� and 5 s/step. Peak Fitting Module Program [13] wasused for the peak decomposition of the semi crystalline patternand determination of area due to the amorphous phase. Crystallin-ity percentage was obtained by the ratio between the sums of thepeak areas to the area of amorphous broad hallo due to the amor-phous phase.
LeBail fit
The use of LeBail Method [14] to obtain structural informa-tion from semi crystalline patterns is not very common due tothe large overlapped peaks on diffractograms. Nevertheless ithas been used to characterize polyaniline and substituted poly-anilines [8,15,16]. LeBail Method was performed using the soft-ware package Fullprof [17]. All parameters were refined by theleast-squares method [18]. The pseudo-Voigt function modifiedby Thompson–Cox–Hastings was used as peak profile function[19]. Instrumental resolution function parameters were obtainedfrom a lanthanum hexaborate standard, LaB6. Aniline tetramersingle crystal parameters obtained by Evain et al. [20] were usedas initial parameters (a = 5.7328 Å, b = 8.8866 Å, c = 22.6889 Å,a = 82.7481�, b = 84.5281� and c = 88.4739�). Particle size wasdetermined from the anisotropic crystallites size using sphericalharmonics (SHP) [21].
SEM analysis and conductivity measurements
SEM experiments were performed using a Supra 35, Carl Zeiss,3.0 kV. Powder samples were deposited on a carbon tape and thesurface morphology was obtained at room temperature. Conduc-tivity measurements were performed using the Van Der Pauwmethod [22]. Samples were processed into pellets with 1.27 cmof diameter and 1.5 mm of thickness which were coated with silverink on both sides in which were made electrical connections usingmetal wires. Measurements were performed at room temperatureusing Keithley Model 2612A from 500 mV to 2 V.
Results and discussion
FTIR analysis
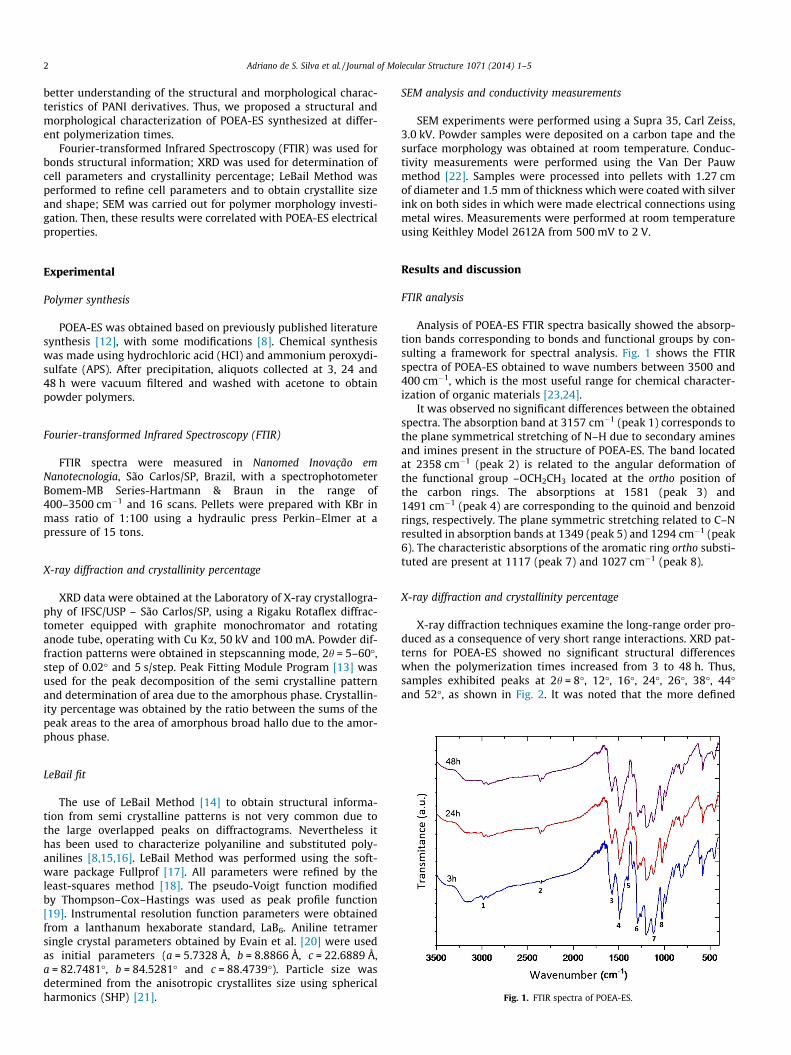
Analysis of POEA-ES FTIR spectra basically showed the absorp-tion bands corresponding to bonds and functional groups by con-sulting a framework for spectral analysis. Fig. 1 shows the FTIRspectra of POEA-ES obtained to wave numbers between 3500 and400 cm�1, which is the most useful range for chemical character-ization of organic materials [23,24].
It was observed no significant differences between the obtainedspectra. The absorption band at 3157 cm�1 (peak 1) corresponds tothe plane symmetrical stretching of N–H due to secondary aminesand imines present in the structure of POEA-ES. The band locatedat 2358 cm�1 (peak 2) is related to the angular deformation ofthe functional group –OCH2CH3 located at the ortho position ofthe carbon rings. The absorptions at 1581 (peak 3) and1491 cm�1 (peak 4) are corresponding to the quinoid and benzoidrings, respectively. The plane symmetric stretching related to C–Nresulted in absorption bands at 1349 (peak 5) and 1294 cm�1 (peak6). The characteristic absorptions of the aromatic ring ortho substi-tuted are present at 1117 (peak 7) and 1027 cm�1 (peak 8).
X-ray diffraction and crystallinity percentage
X-ray diffraction techniques examine the long-range order pro-duced as a consequence of very short range interactions. XRD pat-terns for POEA-ES showed no significant structural differenceswhen the polymerization times increased from 3 to 48 h. Thus,samples exhibited peaks at 2h = 8�, 12�, 16�, 24�, 26�, 38�, 44�and 52�, as shown in Fig. 2. It was noted that the more defined
Fig. 1. FTIR spectra of POEA-ES.
2 Adriano de S. Silva et al. / Journal of Molecular Structure 1071 (2014) 1–5
peaks of POEA-ES are present in the region below of 2h = 30�. Thepatterns are in agreement with those obtained by Leite et al. [25].
PANI and its derivatives were long regarded as amorphousmaterials, but by the use of XRD technique it was detected a degree
of crystallinity around 50% [26–28]. Recent studies have shown thatfor PANI-ES, the percentage of crystallinity obtained was 22% [29]by the ratio of the area of the peaks and the amorphous halomethod. Bhadra et al. [30] obtained PANI-ES chemically synthe-sized with percentage of 60.8%. Sanches et al. [16] obtained valuesof 49% and 51% related to synthesis times of 0.5 and 48 h, respec-tively. More recently, results ranged from 48% to 63% for POMA-ES related to the time of synthesis of 0.5 and 72 h, respectively [8].
To determine the crystallinity percentage of semi crystallinepolymers, it is assumed that the polymer consists of a well-definedmixture of amorphous and crystalline regions [31,32]. Fig. 3 showsthe decomposition peaks of POEA-ES. Through Peak Fitting ModuleProgram the POEA-ES crystallinity percentage was around 39%.
LeBail Method analysis
Structural refinement through LeBail Method started using asinput data the symmetry and unit cell parameters of PANI tetramerobtained by Evain et al. [20]. However, it is important to note thatthe obtained diffraction pattern is from a derivative of PANI, whosestructural difference is the presence of the functional group –OCH2-
CH3 in the ortho position of carbon rings. With the presence of thisfunctional group in POEA-ES chains, it was needed to modify thedimensions in the directions ‘‘a’’ and ‘‘b’’ of the unit cell due toaccommodate this functional group.
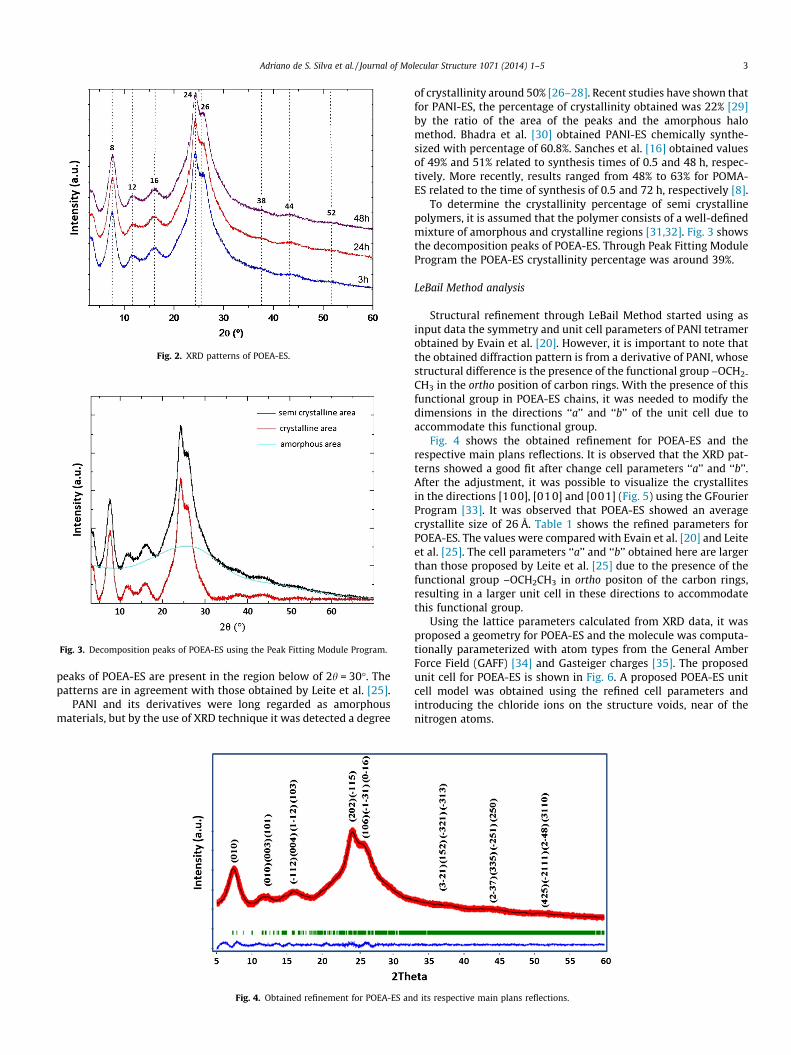
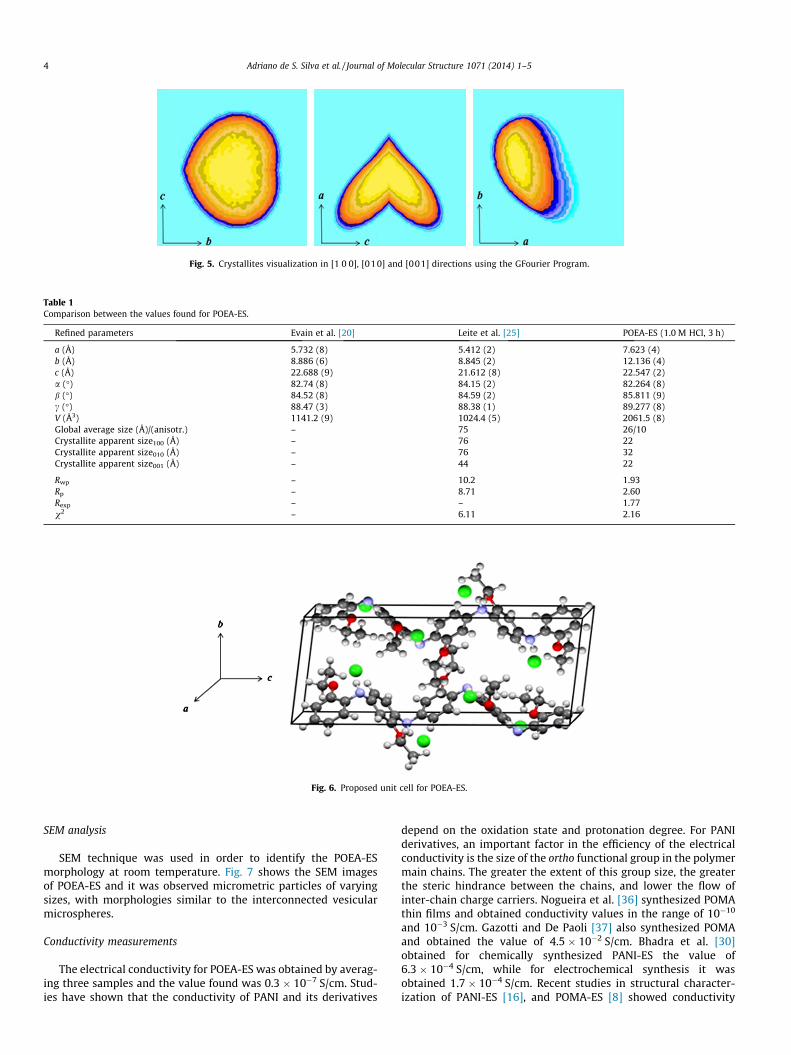
Fig. 4 shows the obtained refinement for POEA-ES and therespective main plans reflections. It is observed that the XRD pat-terns showed a good fit after change cell parameters ‘‘a’’ and ‘‘b’’.After the adjustment, it was possible to visualize the crystallitesin the directions [100], [010] and [001] (Fig. 5) using the GFourierProgram [33]. It was observed that POEA-ES showed an averagecrystallite size of 26 Å. Table 1 shows the refined parameters forPOEA-ES. The values were compared with Evain et al. [20] and Leiteet al. [25]. The cell parameters ‘‘a’’ and ‘‘b’’ obtained here are largerthan those proposed by Leite et al. [25] due to the presence of thefunctional group –OCH2CH3 in ortho positon of the carbon rings,resulting in a larger unit cell in these directions to accommodatethis functional group.
Using the lattice parameters calculated from XRD data, it wasproposed a geometry for POEA-ES and the molecule was computa-tionally parameterized with atom types from the General AmberForce Field (GAFF) [34] and Gasteiger charges [35]. The proposedunit cell for POEA-ES is shown in Fig. 6. A proposed POEA-ES unitcell model was obtained using the refined cell parameters andintroducing the chloride ions on the structure voids, near of thenitrogen atoms.
Fig. 2. XRD patterns of POEA-ES.
Fig. 3. Decomposition peaks of POEA-ES using the Peak Fitting Module Program.
Fig. 4. Obtained refinement for POEA-ES and its respective main plans reflections.
Adriano de S. Silva et al. / Journal of Molecular Structure 1071 (2014) 1–5 3
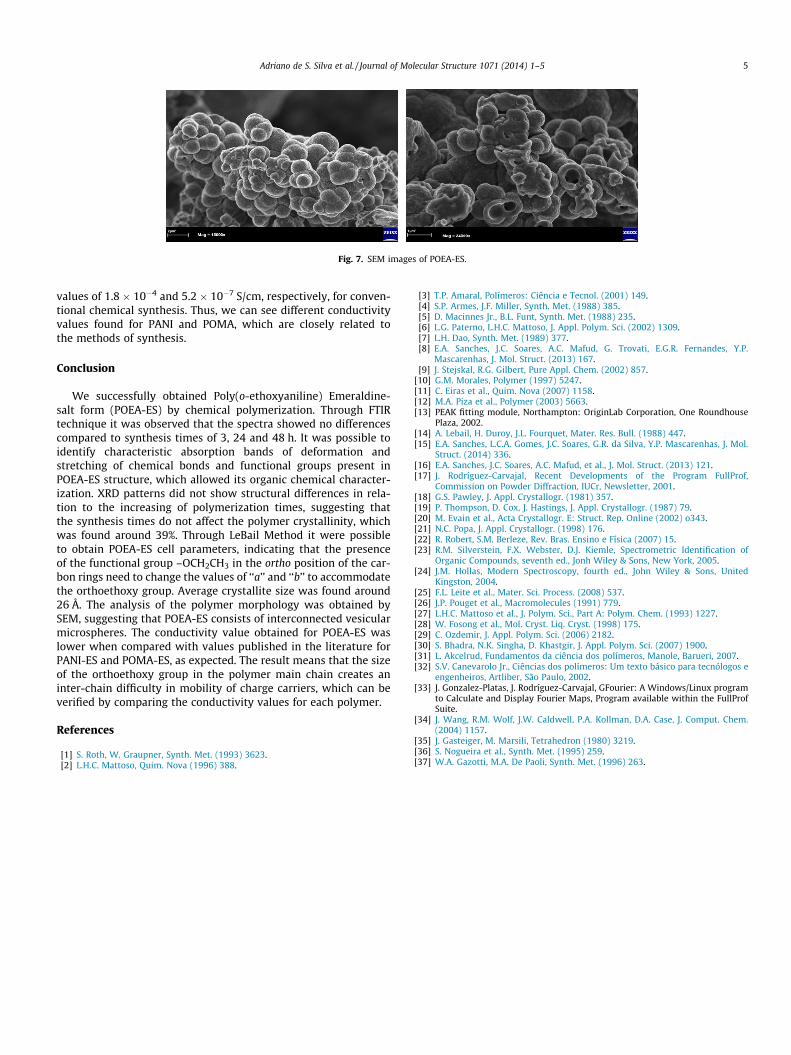
SEM analysis
SEM technique was used in order to identify the POEA-ESmorphology at room temperature. Fig. 7 shows the SEM imagesof POEA-ES and it was observed micrometric particles of varyingsizes, with morphologies similar to the interconnected vesicularmicrospheres.
Conductivity measurements
The electrical conductivity for POEA-ES was obtained by averag-ing three samples and the value found was 0.3 � 10�7 S/cm. Stud-ies have shown that the conductivity of PANI and its derivatives
depend on the oxidation state and protonation degree. For PANIderivatives, an important factor in the efficiency of the electricalconductivity is the size of the ortho functional group in the polymermain chains. The greater the extent of this group size, the greaterthe steric hindrance between the chains, and lower the flow ofinter-chain charge carriers. Nogueira et al. [36] synthesized POMAthin films and obtained conductivity values in the range of 10�10
and 10�3 S/cm. Gazotti and De Paoli [37] also synthesized POMAand obtained the value of 4.5 � 10�2 S/cm. Bhadra et al. [30]obtained for chemically synthesized PANI-ES the value of6.3 � 10�4 S/cm, while for electrochemical synthesis it wasobtained 1.7 � 10�4 S/cm. Recent studies in structural character-ization of PANI-ES [16], and POMA-ES [8] showed conductivity
Table 1Comparison between the values found for POEA-ES.
Refined parameters Evain et al. [20] Leite et al. [25] POEA-ES (1.0 M HCl, 3 h)
a (Å) 5.732 (8) 5.412 (2) 7.623 (4)b (Å) 8.886 (6) 8.845 (2) 12.136 (4)c (Å) 22.688 (9) 21.612 (8) 22.547 (2)a (�) 82.74 (8) 84.15 (2) 82.264 (8)b (�) 84.52 (8) 84.59 (2) 85.811 (9)c (�) 88.47 (3) 88.38 (1) 89.277 (8)V (Å3) 1141.2 (9) 1024.4 (5) 2061.5 (8)Global average size (Å)/(anisotr.) – 75 26/10Crystallite apparent size100 (Å) – 76 22Crystallite apparent size010 (Å) – 76 32Crystallite apparent size001 (Å) – 44 22
Rwp – 10.2 1.93Rp – 8.71 2.60Rexp – – 1.77v2 – 6.11 2.16
Fig. 5. Crystallites visualization in [1 0 0], [010] and [001] directions using the GFourier Program.
Fig. 6. Proposed unit cell for POEA-ES.
4 Adriano de S. Silva et al. / Journal of Molecular Structure 1071 (2014) 1–5
values of 1.8 � 10�4 and 5.2 � 10�7 S/cm, respectively, for conven-tional chemical synthesis. Thus, we can see different conductivityvalues found for PANI and POMA, which are closely related tothe methods of synthesis.
Conclusion
We successfully obtained Poly(o-ethoxyaniline) Emeraldine-salt form (POEA-ES) by chemical polymerization. Through FTIRtechnique it was observed that the spectra showed no differencescompared to synthesis times of 3, 24 and 48 h. It was possible toidentify characteristic absorption bands of deformation andstretching of chemical bonds and functional groups present inPOEA-ES structure, which allowed its organic chemical character-ization. XRD patterns did not show structural differences in rela-tion to the increasing of polymerization times, suggesting thatthe synthesis times do not affect the polymer crystallinity, whichwas found around 39%. Through LeBail Method it were possibleto obtain POEA-ES cell parameters, indicating that the presenceof the functional group –OCH2CH3 in the ortho position of the car-bon rings need to change the values of ‘‘a’’ and ‘‘b’’ to accommodatethe orthoethoxy group. Average crystallite size was found around26 Å. The analysis of the polymer morphology was obtained bySEM, suggesting that POEA-ES consists of interconnected vesicularmicrospheres. The conductivity value obtained for POEA-ES waslower when compared with values published in the literature forPANI-ES and POMA-ES, as expected. The result means that the sizeof the orthoethoxy group in the polymer main chain creates aninter-chain difficulty in mobility of charge carriers, which can beverified by comparing the conductivity values for each polymer.
References
[1] S. Roth, W. Graupner, Synth. Met. (1993) 3623.[2] L.H.C. Mattoso, Quim. Nova (1996) 388.
[3] T.P. Amaral, Polímeros: Ciência e Tecnol. (2001) 149.[4] S.P. Armes, J.F. Miller, Synth. Met. (1988) 385.[5] D. Macinnes Jr., B.L. Funt, Synth. Met. (1988) 235.[6] L.G. Paterno, L.H.C. Mattoso, J. Appl. Polym. Sci. (2002) 1309.[7] L.H. Dao, Synth. Met. (1989) 377.[8] E.A. Sanches, J.C. Soares, A.C. Mafud, G. Trovati, E.G.R. Fernandes, Y.P.
Mascarenhas, J. Mol. Struct. (2013) 167.[9] J. Stejskal, R.G. Gilbert, Pure Appl. Chem. (2002) 857.
[10] G.M. Morales, Polymer (1997) 5247.[11] C. Eiras et al., Quim. Nova (2007) 1158.[12] M.A. Piza et al., Polymer (2003) 5663.[13] PEAK fitting module, Northampton: OriginLab Corporation, One Roundhouse
Plaza, 2002.[14] A. Lebail, H. Duroy, J.L. Fourquet, Mater. Res. Bull. (1988) 447.[15] E.A. Sanches, L.C.A. Gomes, J.C. Soares, G.R. da Silva, Y.P. Mascarenhas, J. Mol.
Struct. (2014) 336.[16] E.A. Sanches, J.C. Soares, A.C. Mafud, et al., J. Mol. Struct. (2013) 121.[17] J. Rodríguez-Carvajal, Recent Developments of the Program FullProf,
Commission on Powder Diffraction, IUCr, Newsletter, 2001.[18] G.S. Pawley, J. Appl. Crystallogr. (1981) 357.[19] P. Thompson, D. Cox, J. Hastings, J. Appl. Crystallogr. (1987) 79.[20] M. Evain et al., Acta Crystallogr. E: Struct. Rep. Online (2002) o343.[21] N.C. Popa, J. Appl. Crystallogr. (1998) 176.[22] R. Robert, S.M. Berleze, Rev. Bras. Ensino e Física (2007) 15.[23] R.M. Silverstein, F.X. Webster, D.J. Kiemle, Spectrometric Identification of
Organic Compounds, seventh ed., Jonh Wiley & Sons, New York, 2005.[24] J.M. Hollas, Modern Spectroscopy, fourth ed., John Wiley & Sons, United
Kingston, 2004.[25] F.L. Leite et al., Mater. Sci. Process. (2008) 537.[26] J.P. Pouget et al., Macromolecules (1991) 779.[27] L.H.C. Mattoso et al., J. Polym. Sci., Part A: Polym. Chem. (1993) 1227.[28] W. Fosong et al., Mol. Cryst. Liq. Cryst. (1998) 175.[29] C. Ozdemir, J. Appl. Polym. Sci. (2006) 2182.[30] S. Bhadra, N.K. Singha, D. Khastgir, J. Appl. Polym. Sci. (2007) 1900.[31] L. Akcelrud, Fundamentos da ciência dos polímeros, Manole, Barueri, 2007.[32] S.V. Canevarolo Jr., Ciências dos polímeros: Um texto básico para tecnólogos e
engenheiros, Artliber, São Paulo, 2002.[33] J. Gonzalez-Platas, J. Rodríguez-Carvajal, GFourier: A Windows/Linux program
to Calculate and Display Fourier Maps, Program available within the FullProfSuite.
[34] J. Wang, R.M. Wolf, J.W. Caldwell, P.A. Kollman, D.A. Case, J. Comput. Chem.(2004) 1157.
[35] J. Gasteiger, M. Marsili, Tetrahedron (1980) 3219.[36] S. Nogueira et al., Synth. Met. (1995) 259.[37] W.A. Gazotti, M.A. De Paoli, Synth. Met. (1996) 263.
Fig. 7. SEM images of POEA-ES.
Adriano de S. Silva et al. / Journal of Molecular Structure 1071 (2014) 1–5 5