Embed Size (px)
Citation preview
Structural and kinetic characterization of the mechanism of regulation of
phosphoenolpyruvate carboxykinase by anions
by
Sarah Barwell
A thesis
presented to the University of Waterloo
in fulfilment of the
thesis requirement for the degree of
Master of Science
in
Biology
Waterloo, Ontario, Canada, 2019
© Sarah Barwell 2019

ii
Author’s declaration
I hereby declare that I am the sole author of this thesis. This is a true copy of the thesis, including
any required final revisions, as accepted by my examiners.
I understand that my thesis may be made electronically available to the public.
iii
Abstract
Phosphoenolpyruvate carboxykinase (PEPCK) catalyses a reaction that is known to be
thermodynamically reversible. In contrast to this thermodynamic reversibility, in eukaryotes, PEPCK is
observed to primarily catalyze the forward direction, converting oxaloacetic acid to phosphoenolpyruvate
as one of the principle steps in gluconeogenesis. Based upon these seemingly conflicting pieces of data,
we hypothesize that there must be an underlying mechanism regulating the kinetic reversibility of the
catalyzed reaction in vivo.
To this end, we present structural and kinetic evidence for the presence of an allosteric site in PEPCK,
which we propose binds negatively charged ions such as chloride which is found in abundance in vivo.
This allosteric regulation serves to inhibit catalysis in the reverse direction and contribute to the observed
unidirectionality in the direction of PEP synthesis in vivo. As supporting evidence for this hypothesis, we
have collected anomalous diffraction data on several PEPCK crystals that have been exposed to a range of
iodide concentrations. From the corresponding anomalous signals at each concentration, we were able to
analyze anomalous peak heights and generate binding isotherms for various anion binding sites on
PEPCK. Importantly, one of these anion binding sites was observed to titrate with increasing iodide
concentration, yielding an apparent binding constant similar to that obtained from our kinetic inhibition
studies. This site was in contrast to the others which were shown to not titrate over the same range of
iodide concentrations.
The anomalous data in combination with the kinetic data were essential in assigning the allosteric
mechanism of regulation as the origin of the observed inhibition. This result was in contrast to
preliminary anomalous maps calculated at saturating concentrations of iodide which suggested anions
binding to the active site in a purely competitive fashion. This allosteric mechanism of inhibition was
further validated through additional anomalous diffraction and kinetic studies on three mutant enzyme
variants, giving strong support for the proposed mechanism of regulation, an effect that has interesting
biological ramifications for the in vivo functioning of PEPCK.

iv
Acknowledgements
I would first like to thank my supervisor, Dr. Todd Holyoak, for allowing me to complete my Masters
degree by doing my research project in his lab. I am grateful for the opportunity to attend graduate school,
which would not be an option without the funding and guidance provided by Todd. Although busy with
his own responsibilities as a professor and an undergraduate advisor, he always made time for us graduate
students, and encouraged our progress through weekly meetings with everyone in the lab.
I would also like to thank my committee members, Dr. David Rose and Dr. Elizabeth Meiering, for
offering their unique perspectives and advice towards my thesis project, as well as finding time in their
schedules to attend meetings, answer emails and read my reports. My thesis would not complete without
their feedback and critiques.
Special thanks go to April Wettig, the administrative coordinator of graduate studies for the Department
of Biology. She was always quick to answer emails and very easy to approach in person, and was
essential in ensuring I met degree requirements on time.
Acknowledgements would not be complete without a nod towards my fellow graduate students, both in
the Holyoak lab as well as the Rose lab, our sister lab next door. They were quick to lend a hand
explaining new techniques and how to use laboratory equipment when I first began my degree, and we
still bounce ideas off each other to this day. My peers were essential in creating a friendly and supportive
environment, and it was a wonderful experience attending monthly coffee hours and other social events
run by the BGSA.

v
Dedication
I dedicate my thesis to my mother, for her support and enthusiasm towards the sciences. Though
she has passed, I know she would be proud of how far I’ve come.
vi
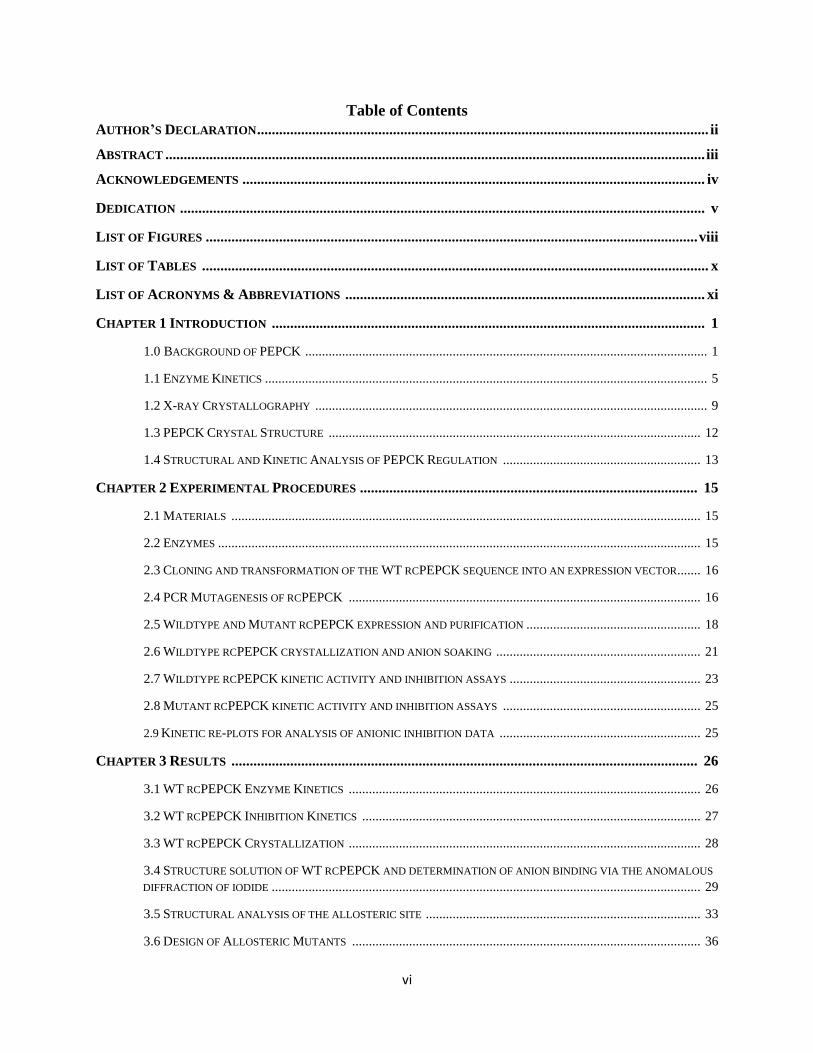
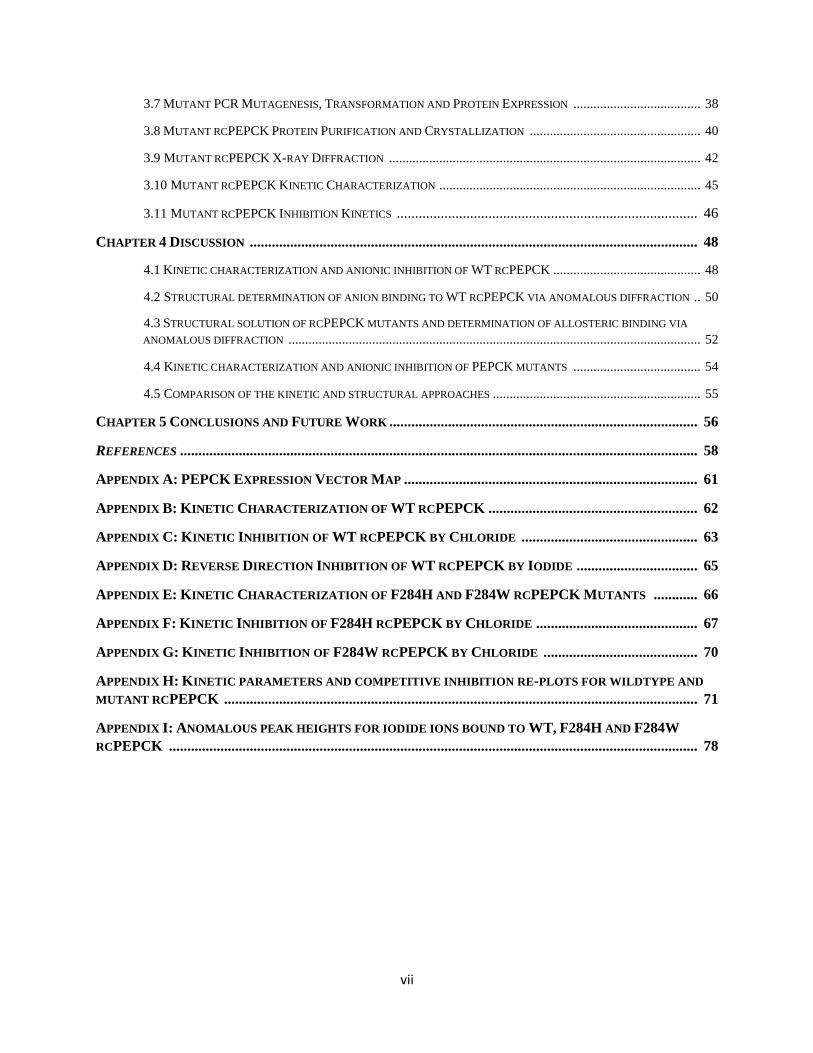
Table of Contents
AUTHOR’S DECLARATION ........................................................................................................................... ii
ABSTRACT ................................................................................................................................................... iii
ACKNOWLEDGEMENTS .............................................................................................................................. iv
DEDICATION ............................................................................................................................................... v
LIST OF FIGURES ...................................................................................................................................... viii
LIST OF TABLES .......................................................................................................................................... x
LIST OF ACRONYMS & ABBREVIATIONS .................................................................................................. xi
CHAPTER 1 INTRODUCTION ...................................................................................................................... 1
1.0 BACKGROUND OF PEPCK ........................................................................................................................ 1
1.1 ENZYME KINETICS .................................................................................................................................... 5
1.2 X-RAY CRYSTALLOGRAPHY ..................................................................................................................... 9
1.3 PEPCK CRYSTAL STRUCTURE ............................................................................................................... 12
1.4 STRUCTURAL AND KINETIC ANALYSIS OF PEPCK REGULATION ........................................................... 13
CHAPTER 2 EXPERIMENTAL PROCEDURES ............................................................................................ 15
2.1 MATERIALS ............................................................................................................................................ 15
2.2 ENZYMES ................................................................................................................................................ 15
2.3 CLONING AND TRANSFORMATION OF THE WT RCPEPCK SEQUENCE INTO AN EXPRESSION VECTOR ....... 16
2.4 PCR MUTAGENESIS OF RCPEPCK ......................................................................................................... 16
2.5 WILDTYPE AND MUTANT RCPEPCK EXPRESSION AND PURIFICATION .................................................... 18
2.6 WILDTYPE RCPEPCK CRYSTALLIZATION AND ANION SOAKING ............................................................. 21
2.7 WILDTYPE RCPEPCK KINETIC ACTIVITY AND INHIBITION ASSAYS ......................................................... 23
2.8 MUTANT RCPEPCK KINETIC ACTIVITY AND INHIBITION ASSAYS ........................................................... 25
2.9 KINETIC RE-PLOTS FOR ANALYSIS OF ANIONIC INHIBITION DATA ............................................................ 25
CHAPTER 3 RESULTS ............................................................................................................................... 26
3.1 WT RCPEPCK ENZYME KINETICS ......................................................................................................... 26
3.2 WT RCPEPCK INHIBITION KINETICS ..................................................................................................... 27
3.3 WT RCPEPCK CRYSTALLIZATION ......................................................................................................... 28
3.4 STRUCTURE SOLUTION OF WT RCPEPCK AND DETERMINATION OF ANION BINDING VIA THE ANOMALOUS
DIFFRACTION OF IODIDE ................................................................................................................................ 29
3.5 STRUCTURAL ANALYSIS OF THE ALLOSTERIC SITE .................................................................................. 33
3.6 DESIGN OF ALLOSTERIC MUTANTS ........................................................................................................ 36
vii
3.7 MUTANT PCR MUTAGENESIS, TRANSFORMATION AND PROTEIN EXPRESSION ...................................... 38
3.8 MUTANT RCPEPCK PROTEIN PURIFICATION AND CRYSTALLIZATION ................................................... 40
3.9 MUTANT RCPEPCK X-RAY DIFFRACTION ............................................................................................. 42
3.10 MUTANT RCPEPCK KINETIC CHARACTERIZATION .............................................................................. 45
3.11 MUTANT RCPEPCK INHIBITION KINETICS .................................................................................. 46
CHAPTER 4 DISCUSSION .......................................................................................................................... 48
4.1 KINETIC CHARACTERIZATION AND ANIONIC INHIBITION OF WT RCPEPCK ............................................ 48
4.2 STRUCTURAL DETERMINATION OF ANION BINDING TO WT RCPEPCK VIA ANOMALOUS DIFFRACTION .. 50
4.3 STRUCTURAL SOLUTION OF RCPEPCK MUTANTS AND DETERMINATION OF ALLOSTERIC BINDING VIA
ANOMALOUS DIFFRACTION ........................................................................................................................... 52
4.4 KINETIC CHARACTERIZATION AND ANIONIC INHIBITION OF PEPCK MUTANTS ...................................... 54
4.5 COMPARISON OF THE KINETIC AND STRUCTURAL APPROACHES .............................................................. 55
CHAPTER 5 CONCLUSIONS AND FUTURE WORK .................................................................................... 56
REFERENCES ............................................................................................................................................. 58
APPENDIX A: PEPCK EXPRESSION VECTOR MAP ................................................................................ 61
APPENDIX B: KINETIC CHARACTERIZATION OF WT RCPEPCK ......................................................... 62
APPENDIX C: KINETIC INHIBITION OF WT RCPEPCK BY CHLORIDE ................................................ 63
APPENDIX D: REVERSE DIRECTION INHIBITION OF WT RCPEPCK BY IODIDE ................................. 65
APPENDIX E: KINETIC CHARACTERIZATION OF F284H AND F284W RCPEPCK MUTANTS ............ 66
APPENDIX F: KINETIC INHIBITION OF F284H RCPEPCK BY CHLORIDE ............................................ 67
APPENDIX G: KINETIC INHIBITION OF F284W RCPEPCK BY CHLORIDE .......................................... 70
APPENDIX H: KINETIC PARAMETERS AND COMPETITIVE INHIBITION RE-PLOTS FOR WILDTYPE AND
MUTANT RCPEPCK ................................................................................................................................. 71
APPENDIX I: ANOMALOUS PEAK HEIGHTS FOR IODIDE IONS BOUND TO WT, F284H AND F284W
RCPEPCK ................................................................................................................................................ 78
viii
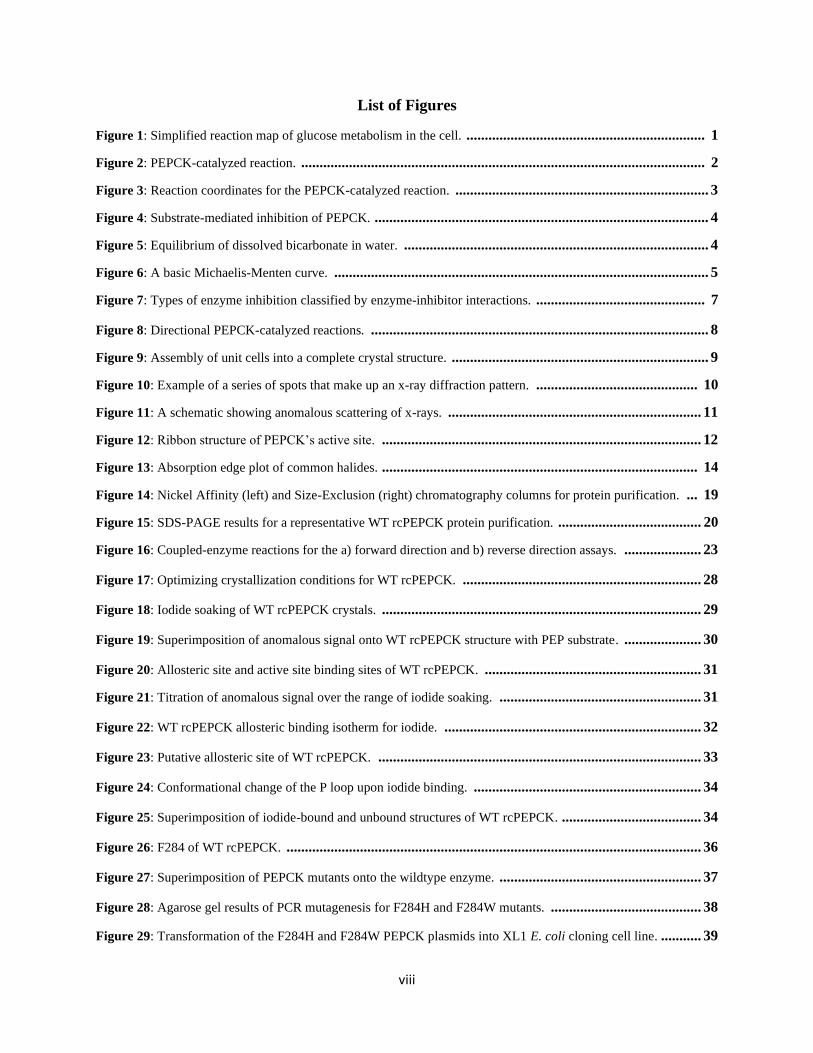
List of Figures
Figure 1: Simplified reaction map of glucose metabolism in the cell. ................................................................. 1
Figure 2: PEPCK-catalyzed reaction. .............................................................................................................. 2
Figure 3: Reaction coordinates for the PEPCK-catalyzed reaction. ..................................................................... 3
Figure 4: Substrate-mediated inhibition of PEPCK. ........................................................................................... 4
Figure 5: Equilibrium of dissolved bicarbonate in water. ................................................................................... 4
Figure 6: A basic Michaelis-Menten curve. ...................................................................................................... 5
Figure 7: Types of enzyme inhibition classified by enzyme-inhibitor interactions. .............................................. 7
Figure 8: Directional PEPCK-catalyzed reactions. ............................................................................................ 8
Figure 9: Assembly of unit cells into a complete crystal structure. ...................................................................... 9
Figure 10: Example of a series of spots that make up an x-ray diffraction pattern. ............................................ 10
Figure 11: A schematic showing anomalous scattering of x-rays. ..................................................................... 11
Figure 12: Ribbon structure of PEPCK’s active site. ....................................................................................... 12
Figure 13: Absorption edge plot of common halides. ...................................................................................... 14
Figure 14: Nickel Affinity (left) and Size-Exclusion (right) chromatography columns for protein purification. ... 19
Figure 15: SDS-PAGE results for a representative WT rcPEPCK protein purification. ....................................... 20
Figure 16: Coupled-enzyme reactions for the a) forward direction and b) reverse direction assays. ..................... 23
Figure 17: Optimizing crystallization conditions for WT rcPEPCK. ................................................................. 28
Figure 18: Iodide soaking of WT rcPEPCK crystals. ....................................................................................... 29
Figure 19: Superimposition of anomalous signal onto WT rcPEPCK structure with PEP substrate. ..................... 30
Figure 20: Allosteric site and active site binding sites of WT rcPEPCK. ........................................................... 31
Figure 21: Titration of anomalous signal over the range of iodide soaking. ....................................................... 31
Figure 22: WT rcPEPCK allosteric binding isotherm for iodide. ...................................................................... 32
Figure 23: Putative allosteric site of WT rcPEPCK. ........................................................................................ 33
Figure 24: Conformational change of the P loop upon iodide binding. .............................................................. 34
Figure 25: Superimposition of iodide-bound and unbound structures of WT rcPEPCK. ...................................... 34
Figure 26: F284 of WT rcPEPCK. ................................................................................................................. 36
Figure 27: Superimposition of PEPCK mutants onto the wildtype enzyme. ....................................................... 37
Figure 28: Agarose gel results of PCR mutagenesis for F284H and F284W mutants. ......................................... 38
Figure 29: Transformation of the F284H and F284W PEPCK plasmids into XL1 E. coli cloning cell line. ........... 39

ix
Figure 30: Transformation of F284H and F284W rcPEPCK plasmids into BL21 E. coli expression cell line. ....... 39
Figure 31: Mutant crystals harvested and soaked in cryoprotectant. .................................................................. 40
Figure 32: F284H (left) and F284W (right) rcPEPCK crystals after seeding. ..................................................... 41
Figure 33: Anomalous signal at the allosteric site for WT and mutant rcPEPCK. ............................................... 44
x
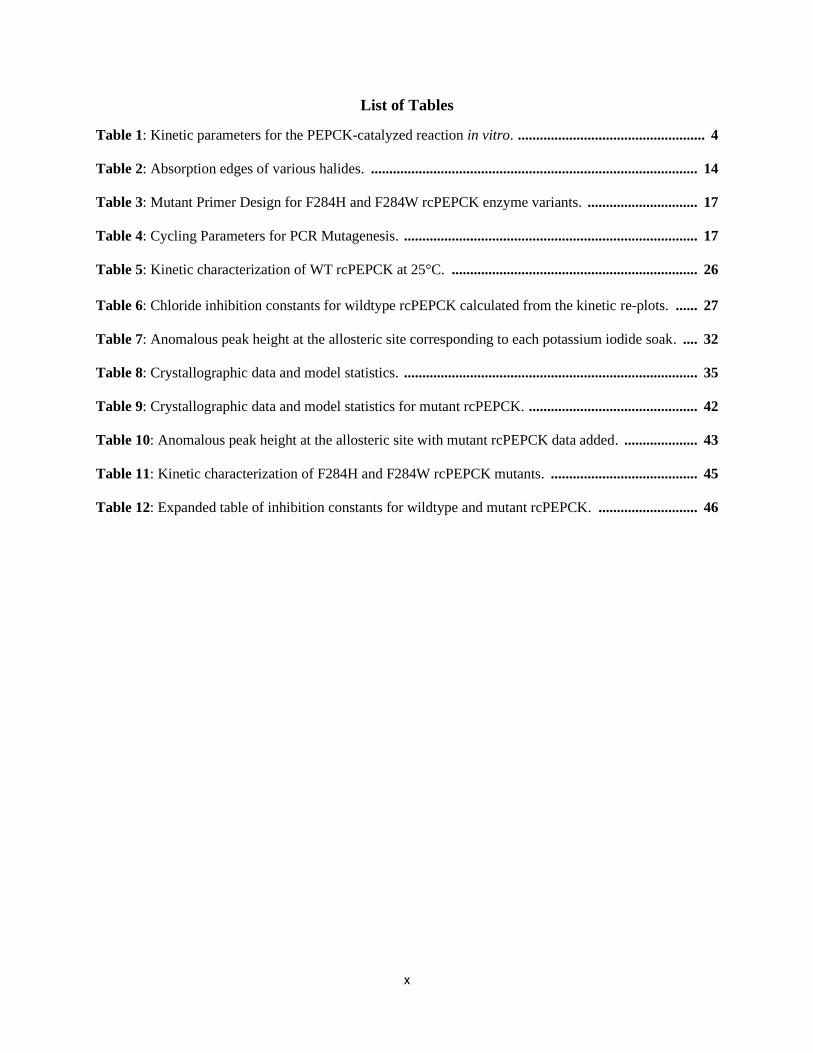
List of Tables
Table 1: Kinetic parameters for the PEPCK-catalyzed reaction in vitro. ................................................... 4
Table 2: Absorption edges of various halides. ......................................................................................... 14
Table 3: Mutant Primer Design for F284H and F284W rcPEPCK enzyme variants. .............................. 17
Table 4: Cycling Parameters for PCR Mutagenesis. ................................................................................ 17
Table 5: Kinetic characterization of WT rcPEPCK at 25°C. ................................................................... 26
Table 6: Chloride inhibition constants for wildtype rcPEPCK calculated from the kinetic re-plots. ...... 27
Table 7: Anomalous peak height at the allosteric site corresponding to each potassium iodide soak. .... 32
Table 8: Crystallographic data and model statistics. ................................................................................ 35
Table 9: Crystallographic data and model statistics for mutant rcPEPCK. .............................................. 42
Table 10: Anomalous peak height at the allosteric site with mutant rcPEPCK data added. .................... 43
Table 11: Kinetic characterization of F284H and F284W rcPEPCK mutants. ........................................ 45
Table 12: Expanded table of inhibition constants for wildtype and mutant rcPEPCK. ........................... 46
xi
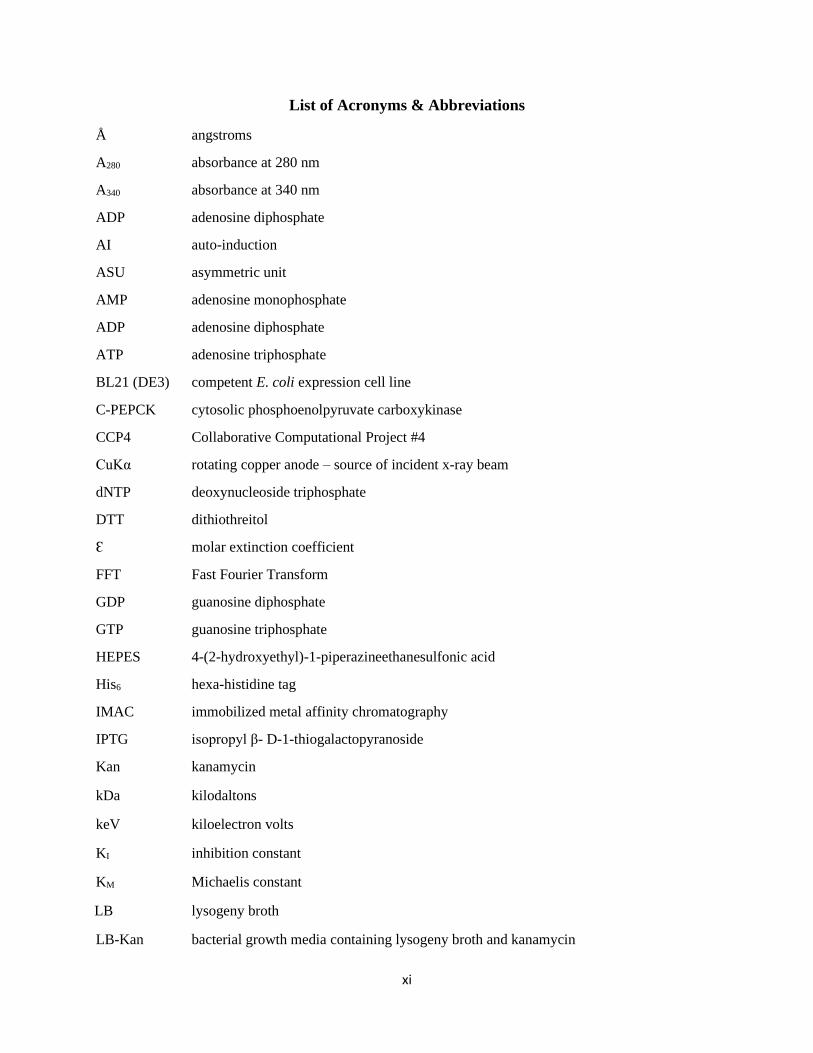
List of Acronyms & Abbreviations
Å angstroms
A280 absorbance at 280 nm
A340 absorbance at 340 nm
ADP adenosine diphosphate
AI auto-induction
ASU asymmetric unit
AMP adenosine monophosphate
ADP adenosine diphosphate
ATP adenosine triphosphate
BL21 (DE3) competent E. coli expression cell line
C-PEPCK cytosolic phosphoenolpyruvate carboxykinase
CCP4 Collaborative Computational Project #4
CuKα rotating copper anode – source of incident x-ray beam
dNTP deoxynucleoside triphosphate
DTT dithiothreitol
Ɛ molar extinction coefficient
FFT Fast Fourier Transform
GDP guanosine diphosphate
GTP guanosine triphosphate
HEPES 4-(2-hydroxyethyl)-1-piperazineethanesulfonic acid
His6 hexa-histidine tag
IMAC immobilized metal affinity chromatography
IPTG isopropyl β- D-1-thiogalactopyranoside
Kan kanamycin
kDa kilodaltons
keV kiloelectron volts
KI inhibition constant
KM Michaelis constant
LB lysogeny broth
LB-Kan bacterial growth media containing lysogeny broth and kanamycin
xii
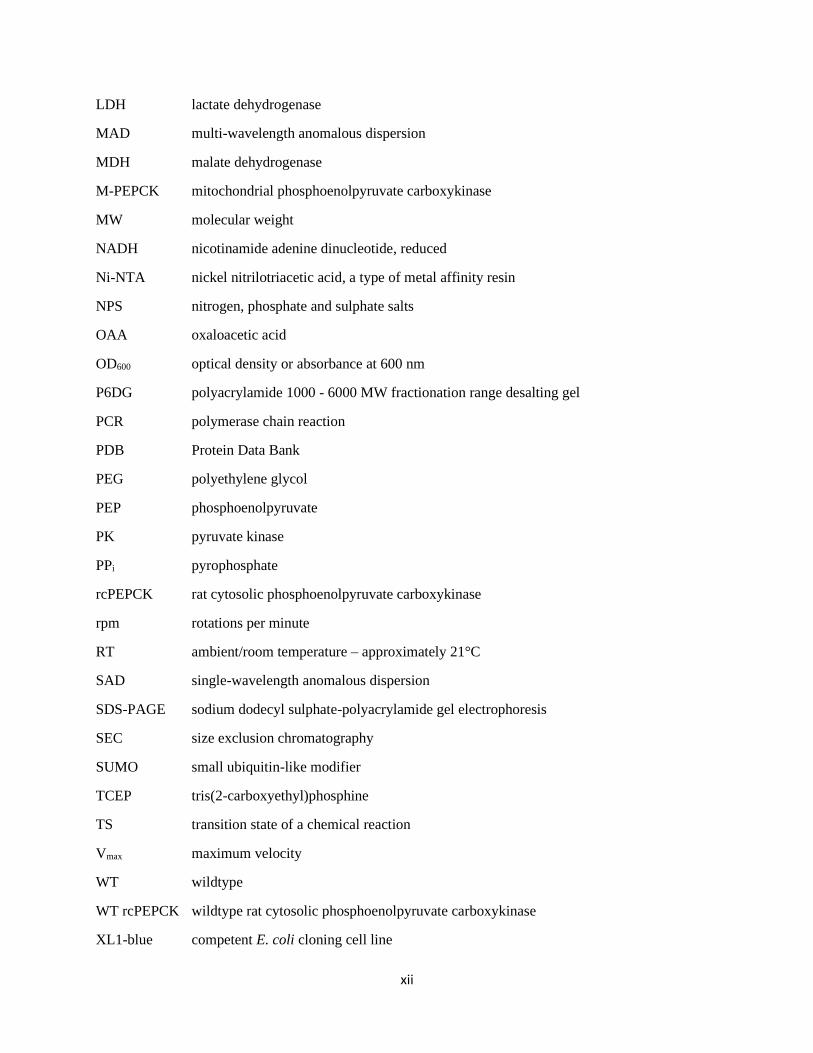
LDH lactate dehydrogenase
MAD multi-wavelength anomalous dispersion
MDH malate dehydrogenase
M-PEPCK mitochondrial phosphoenolpyruvate carboxykinase
MW molecular weight
NADH nicotinamide adenine dinucleotide, reduced
Ni-NTA nickel nitrilotriacetic acid, a type of metal affinity resin
NPS nitrogen, phosphate and sulphate salts
OAA oxaloacetic acid
OD600 optical density or absorbance at 600 nm
P6DG polyacrylamide 1000 - 6000 MW fractionation range desalting gel
PCR polymerase chain reaction
PDB Protein Data Bank
PEG polyethylene glycol
PEP phosphoenolpyruvate
PK pyruvate kinase
PPi pyrophosphate
rcPEPCK rat cytosolic phosphoenolpyruvate carboxykinase
rpm rotations per minute
RT ambient/room temperature – approximately 21°C
SAD single-wavelength anomalous dispersion
SDS-PAGE sodium dodecyl sulphate-polyacrylamide gel electrophoresis
SEC size exclusion chromatography
SUMO small ubiquitin-like modifier
TCEP tris(2-carboxyethyl)phosphine
TS transition state of a chemical reaction
Vmax maximum velocity
WT wildtype
WT rcPEPCK wildtype rat cytosolic phosphoenolpyruvate carboxykinase
XL1-blue competent E. coli cloning cell line
1
Chapter 1: Introduction
1.0 Background of PEPCK
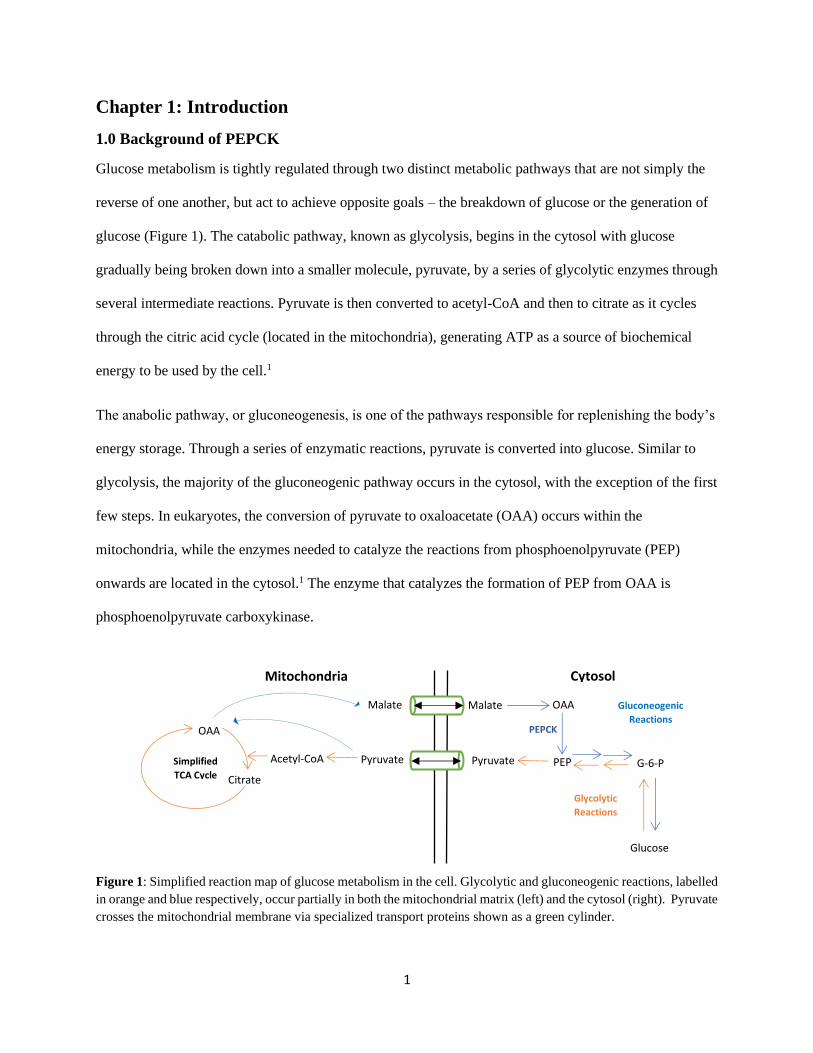
Glucose metabolism is tightly regulated through two distinct metabolic pathways that are not simply the
reverse of one another, but act to achieve opposite goals – the breakdown of glucose or the generation of
glucose (Figure 1). The catabolic pathway, known as glycolysis, begins in the cytosol with glucose
gradually being broken down into a smaller molecule, pyruvate, by a series of glycolytic enzymes through
several intermediate reactions. Pyruvate is then converted to acetyl-CoA and then to citrate as it cycles
through the citric acid cycle (located in the mitochondria), generating ATP as a source of biochemical
energy to be used by the cell.1
The anabolic pathway, or gluconeogenesis, is one of the pathways responsible for replenishing the body’s
energy storage. Through a series of enzymatic reactions, pyruvate is converted into glucose. Similar to
glycolysis, the majority of the gluconeogenic pathway occurs in the cytosol, with the exception of the first
few steps. In eukaryotes, the conversion of pyruvate to oxaloacetate (OAA) occurs within the
mitochondria, while the enzymes needed to catalyze the reactions from phosphoenolpyruvate (PEP)
onwards are located in the cytosol.1 The enzyme that catalyzes the formation of PEP from OAA is
phosphoenolpyruvate carboxykinase.
Figure 1: Simplified reaction map of glucose metabolism in the cell. Glycolytic and gluconeogenic reactions, labelled
in orange and blue respectively, occur partially in both the mitochondrial matrix (left) and the cytosol (right). Pyruvate
crosses the mitochondrial membrane via specialized transport proteins shown as a green cylinder.
Simplified
TCA Cycle
Glycolytic
Reactions
Gluconeogenic
Reactions
Pyruvate PEP G-6-P Pyruvate Acetyl-CoA
OAA
Citrate
Mitochondria Cytosol
Glucose
PEPCK
OAA Malate Malate
2
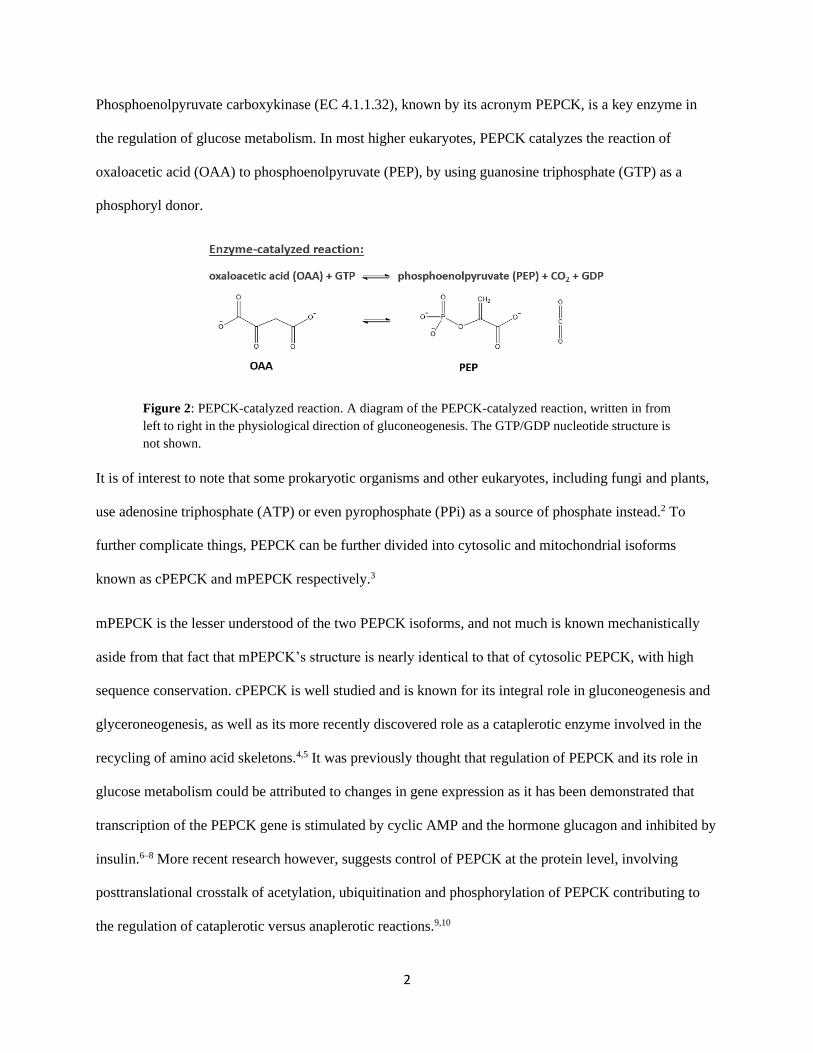
Phosphoenolpyruvate carboxykinase (EC 4.1.1.32), known by its acronym PEPCK, is a key enzyme in
the regulation of glucose metabolism. In most higher eukaryotes, PEPCK catalyzes the reaction of
oxaloacetic acid (OAA) to phosphoenolpyruvate (PEP), by using guanosine triphosphate (GTP) as a
phosphoryl donor.
Figure 2: PEPCK-catalyzed reaction. A diagram of the PEPCK-catalyzed reaction, written in from
left to right in the physiological direction of gluconeogenesis. The GTP/GDP nucleotide structure is
not shown.
It is of interest to note that some prokaryotic organisms and other eukaryotes, including fungi and plants,
use adenosine triphosphate (ATP) or even pyrophosphate (PPi) as a source of phosphate instead.2 To
further complicate things, PEPCK can be further divided into cytosolic and mitochondrial isoforms
known as cPEPCK and mPEPCK respectively.3
mPEPCK is the lesser understood of the two PEPCK isoforms, and not much is known mechanistically
aside from that fact that mPEPCK’s structure is nearly identical to that of cytosolic PEPCK, with high
sequence conservation. cPEPCK is well studied and is known for its integral role in gluconeogenesis and
glyceroneogenesis, as well as its more recently discovered role as a cataplerotic enzyme involved in the
recycling of amino acid skeletons.4,5 It was previously thought that regulation of PEPCK and its role in
glucose metabolism could be attributed to changes in gene expression as it has been demonstrated that
transcription of the PEPCK gene is stimulated by cyclic AMP and the hormone glucagon and inhibited by
insulin.6–8 More recent research however, suggests control of PEPCK at the protein level, involving
posttranslational crosstalk of acetylation, ubiquitination and phosphorylation of PEPCK contributing to
the regulation of cataplerotic versus anaplerotic reactions.9,10
3
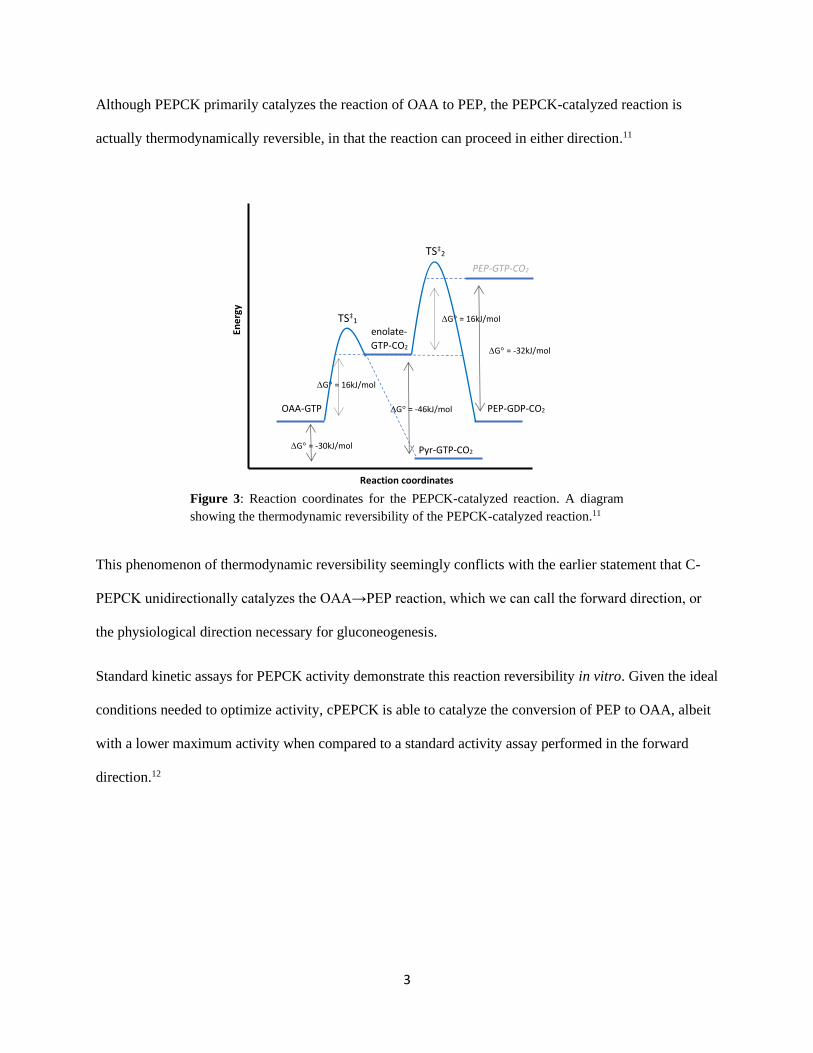
Although PEPCK primarily catalyzes the reaction of OAA to PEP, the PEPCK-catalyzed reaction is
actually thermodynamically reversible, in that the reaction can proceed in either direction.11
Figure 3: Reaction coordinates for the PEPCK-catalyzed reaction. A diagram
showing the thermodynamic reversibility of the PEPCK-catalyzed reaction.11
This phenomenon of thermodynamic reversibility seemingly conflicts with the earlier statement that C-
PEPCK unidirectionally catalyzes the OAA→PEP reaction, which we can call the forward direction, or
the physiological direction necessary for gluconeogenesis.
Standard kinetic assays for PEPCK activity demonstrate this reaction reversibility in vitro. Given the ideal
conditions needed to optimize activity, cPEPCK is able to catalyze the conversion of PEP to OAA, albeit
with a lower maximum activity when compared to a standard activity assay performed in the forward
direction.12
OAA-GTP
enolate-
GTP-CO2
PEP-GDP-CO2
TS‡1
TS‡2
∆G° = 16kJ/mol
∆G° = 16kJ/mol
∆G° = -32kJ/mol
Reaction coordinates
Ene
rgy
PEP-GTP-CO2
Pyr-GTP-CO2
∆G° = -46kJ/mol
∆G° = -30kJ/mol
4
Table 1: Kinetic parameters for the PEPCK-catalyzed reaction in vitro.12
kcat (s-1) kcat/KM (M-1 s-1)
(OAA/PEP) kcat/KM (M-1 s-1)
(GTP/GDP) OAA → PEP 52 ± 1 1.0 x 10⁶ 9.5 x 10⁶
PEP → OAA 19 ± 1 3.7 x 10⁴ 9.2 x 10⁴
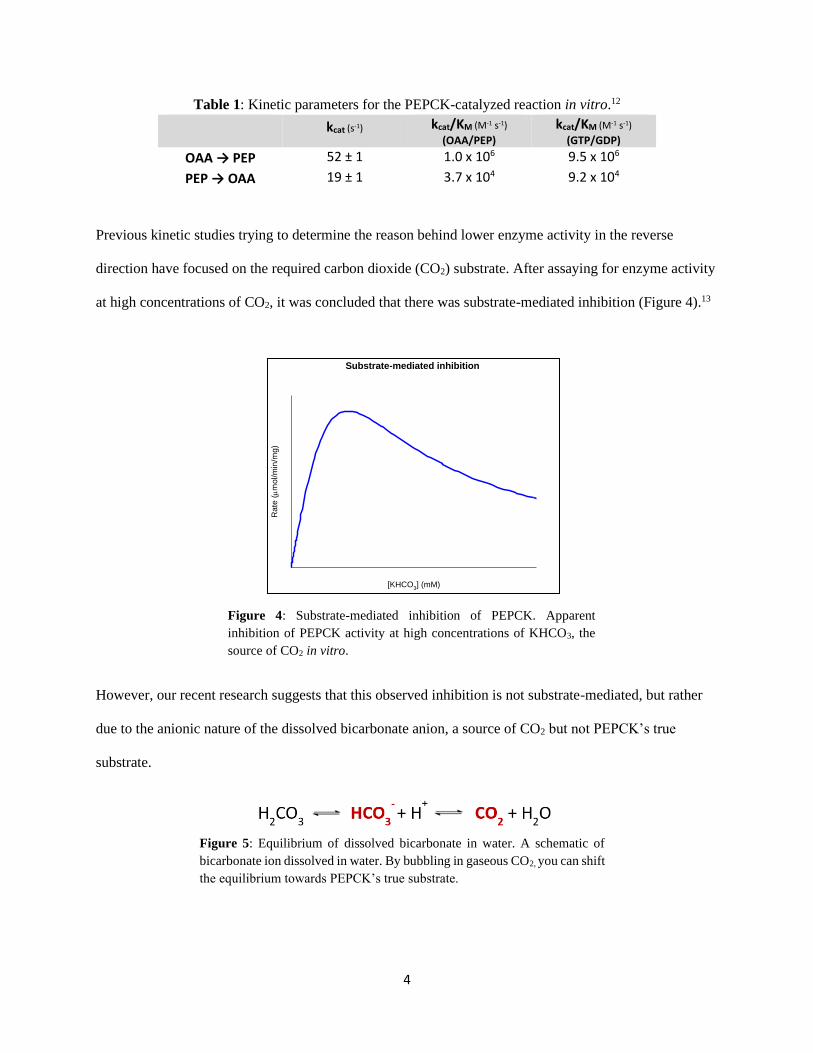
Previous kinetic studies trying to determine the reason behind lower enzyme activity in the reverse
direction have focused on the required carbon dioxide (CO2) substrate. After assaying for enzyme activity
at high concentrations of CO2, it was concluded that there was substrate-mediated inhibition (Figure 4).13
Figure 4: Substrate-mediated inhibition of PEPCK. Apparent
inhibition of PEPCK activity at high concentrations of KHCO3, the
source of CO2 in vitro.
However, our recent research suggests that this observed inhibition is not substrate-mediated, but rather
due to the anionic nature of the dissolved bicarbonate anion, a source of CO2 but not PEPCK’s true
substrate.
Figure 5: Equilibrium of dissolved bicarbonate in water. A schematic of
bicarbonate ion dissolved in water. By bubbling in gaseous CO2, you can shift
the equilibrium towards PEPCK’s true substrate.
Substrate-mediated inhibition
[KHCO3] (mM)
Rate
(
mol/m
in/m
g)
5
Investigation into the potential regulatory properties of anions is necessary in order to determine the
underlying cause behind the unidirectionality of the PEPCK-catalyzed reaction in vivo. It is important to
note that through the optimization of standard activity assays in vitro, the majority of salts that would be
found in biological systems are removed. It is therefore accurate to say that cPEPCK would be subjected
to much higher concentrations of various anionic species in vivo, which could have an adverse effect on
enzyme function.
1.1 Enzyme Kinetics
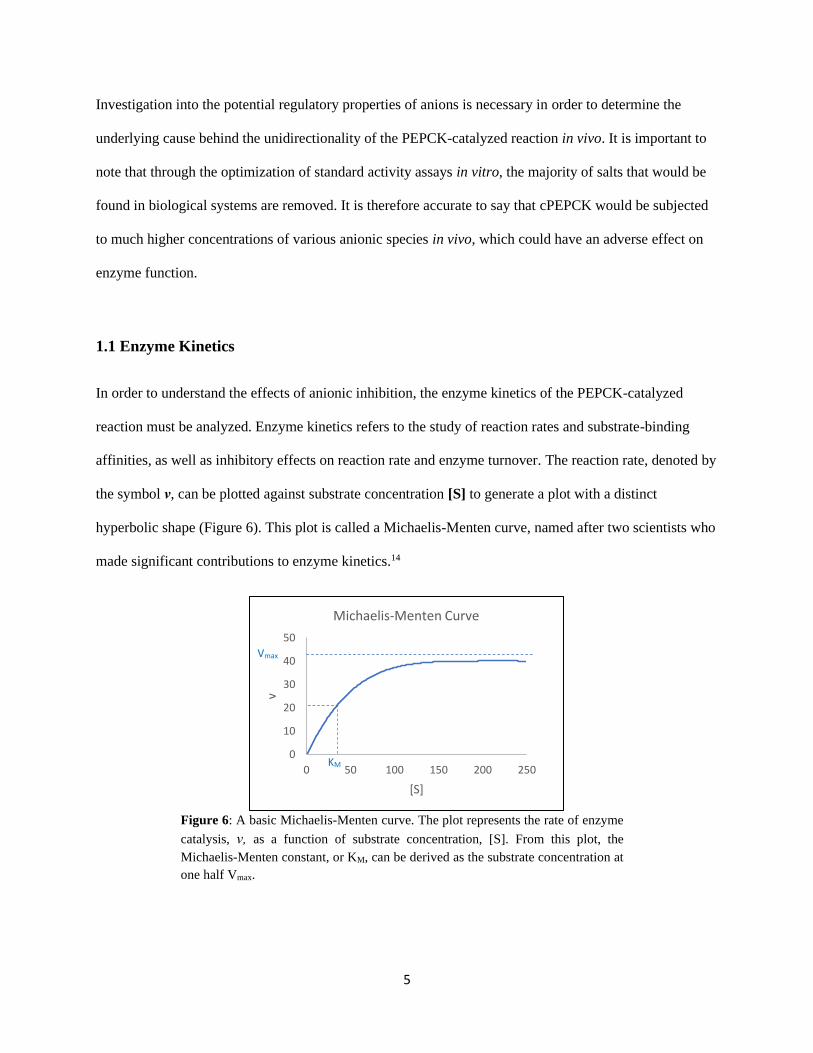
In order to understand the effects of anionic inhibition, the enzyme kinetics of the PEPCK-catalyzed
reaction must be analyzed. Enzyme kinetics refers to the study of reaction rates and substrate-binding
affinities, as well as inhibitory effects on reaction rate and enzyme turnover. The reaction rate, denoted by
the symbol ν, can be plotted against substrate concentration [S] to generate a plot with a distinct
hyperbolic shape (Figure 6). This plot is called a Michaelis-Menten curve, named after two scientists who
made significant contributions to enzyme kinetics.14
Figure 6: A basic Michaelis-Menten curve. The plot represents the rate of enzyme
catalysis, ν, as a function of substrate concentration, [S]. From this plot, the
Michaelis-Menten constant, or KM, can be derived as the substrate concentration at
one half Vmax.
0
10
20
30
40
50
0 50 100 150 200 250
v
[S]
Michaelis-Menten Curve
Vmax
KM

6
Michaelis-Menten kinetics allows us to determine the maximum reaction rate, Vmax, and the Michaelis-
Menten constant, or KM. The KM can be calculated as the substrate concentration at half the Vmax,
representing the enzyme’s affinity for that particular substrate. However, this is often only an apparent
affinity, as many other factors affect the KM, and may be masking the true binding affinity of the substrate
to the enzyme. A more accurate definition of the Michaelis constant is the concentration of substrate at
which the time required for substrate capture is equal to the time for product release.15 The addition of an
inhibitor can affect both the Vmax and the KM, depending on the type of inhibition and mechanism of
inhibitor binding.16
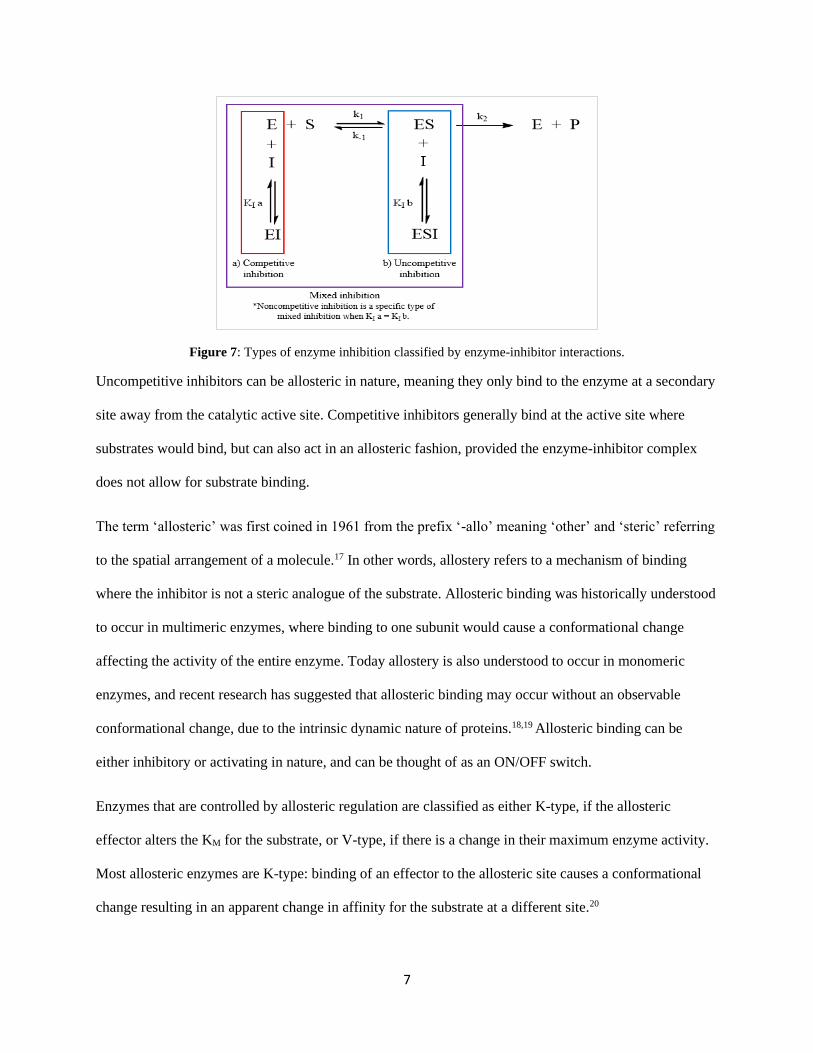
Enzyme inhibition can be categorized into three different classes: competitive, uncompetitive, or mixed
inhibition, which is sometimes referred to as non-competitive inhibition in certain cases where the
inhibitor can bind equally to the enzyme or enzyme-substrate complex. Inhibitors are classified into these
different groups by the mechanism in which they interact with the enzyme or enzyme-substrate complex
(Figure 7).
Competitive inhibitors only bind to free enzyme without substrate bound, lowering the apparent substrate
affinity or KM while leaving the overall reaction rate (Vmax) unchanged.1 The effect on apparent KM
requires adding additional substrate to the assay mix to ensure saturating substrate concentrations.
Uncompetitive inhibitors bind to the enzyme-substrate complex, due to a conformational change that
occurs upon the substrate binding, therefore adding additional substrate has no effect. Both the apparent
Vmax and KM are affected. Mixed inhibitors have the properties of both competitive and uncompetitive
inhibition, in that the inhibitor binds to both the free enzyme and the enzyme-substrate complex.1
7
Figure 7: Types of enzyme inhibition classified by enzyme-inhibitor interactions.
Uncompetitive inhibitors can be allosteric in nature, meaning they only bind to the enzyme at a secondary
site away from the catalytic active site. Competitive inhibitors generally bind at the active site where
substrates would bind, but can also act in an allosteric fashion, provided the enzyme-inhibitor complex
does not allow for substrate binding.
The term ‘allosteric’ was first coined in 1961 from the prefix ‘-allo’ meaning ‘other’ and ‘steric’ referring
to the spatial arrangement of a molecule.17 In other words, allostery refers to a mechanism of binding
where the inhibitor is not a steric analogue of the substrate. Allosteric binding was historically understood
to occur in multimeric enzymes, where binding to one subunit would cause a conformational change
affecting the activity of the entire enzyme. Today allostery is also understood to occur in monomeric
enzymes, and recent research has suggested that allosteric binding may occur without an observable
conformational change, due to the intrinsic dynamic nature of proteins.18,19 Allosteric binding can be
either inhibitory or activating in nature, and can be thought of as an ON/OFF switch.
Enzymes that are controlled by allosteric regulation are classified as either K-type, if the allosteric
effector alters the KM for the substrate, or V-type, if there is a change in their maximum enzyme activity.
Most allosteric enzymes are K-type: binding of an effector to the allosteric site causes a conformational
change resulting in an apparent change in affinity for the substrate at a different site.20
8
Multiple kinetic studies have already shown various different types of substrate-analogues can act as
competitive inhibitors of cPEPCK and related enzymes.21,22 Only a few allosteric inhibitors of PEPCK
have been identified, including 3-mercaptopicolinate, previously identified only as an active site
inhibitor.23–25 Michaelis-Menten curves can be used to show the various forms of enzyme inhibition, in
this case competitive inhibition. Through a series of kinetic inhibition assays, an inhibition constant, or
KI, can be calculated, which is a representation of the inhibition strength of that compound. An inverse
relationship exists between the KI and the strength of the inhibitor, such that the lower the KI, the stronger
the inhibitor and vice versa.
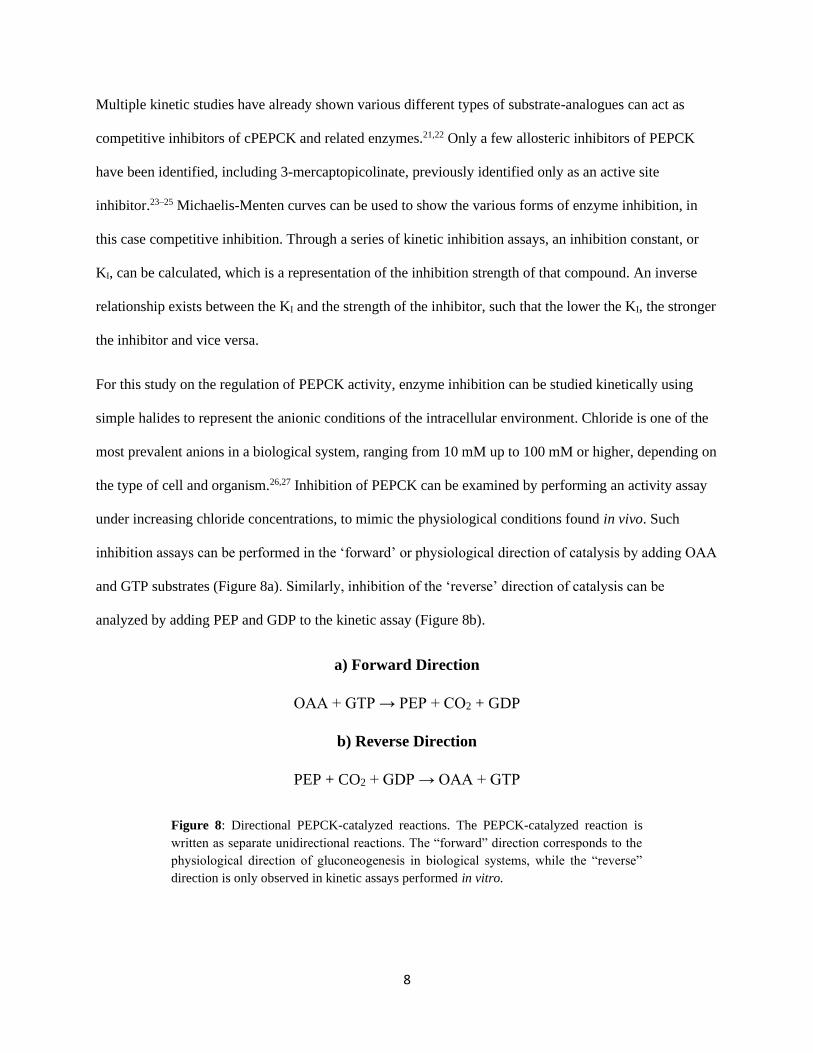
For this study on the regulation of PEPCK activity, enzyme inhibition can be studied kinetically using
simple halides to represent the anionic conditions of the intracellular environment. Chloride is one of the
most prevalent anions in a biological system, ranging from 10 mM up to 100 mM or higher, depending on
the type of cell and organism.26,27 Inhibition of PEPCK can be examined by performing an activity assay
under increasing chloride concentrations, to mimic the physiological conditions found in vivo. Such
inhibition assays can be performed in the ‘forward’ or physiological direction of catalysis by adding OAA
and GTP substrates (Figure 8a). Similarly, inhibition of the ‘reverse’ direction of catalysis can be
analyzed by adding PEP and GDP to the kinetic assay (Figure 8b).
a) Forward Direction
OAA + GTP → PEP + CO2 + GDP
b) Reverse Direction
PEP + CO2 + GDP → OAA + GTP
Figure 8: Directional PEPCK-catalyzed reactions. The PEPCK-catalyzed reaction is
written as separate unidirectional reactions. The “forward” direction corresponds to the
physiological direction of gluconeogenesis in biological systems, while the “reverse”
direction is only observed in kinetic assays performed in vitro.
9
1.2 X-ray Crystallography
Enzyme function can also be analyzed through a structural approach, using protein crystallography.
Crystallography involves the growth of protein crystals large enough to be viewed under a microscope,
ideally a couple hundred microns (µm) in length. Growing crystals is a delicate process typically
performed using vapour diffusion to achieve a slow and gradual removal of water from the protein
sample, moving from soluble to crystalline on the protein solubility curve without causing the protein to
precipitate out of solution.
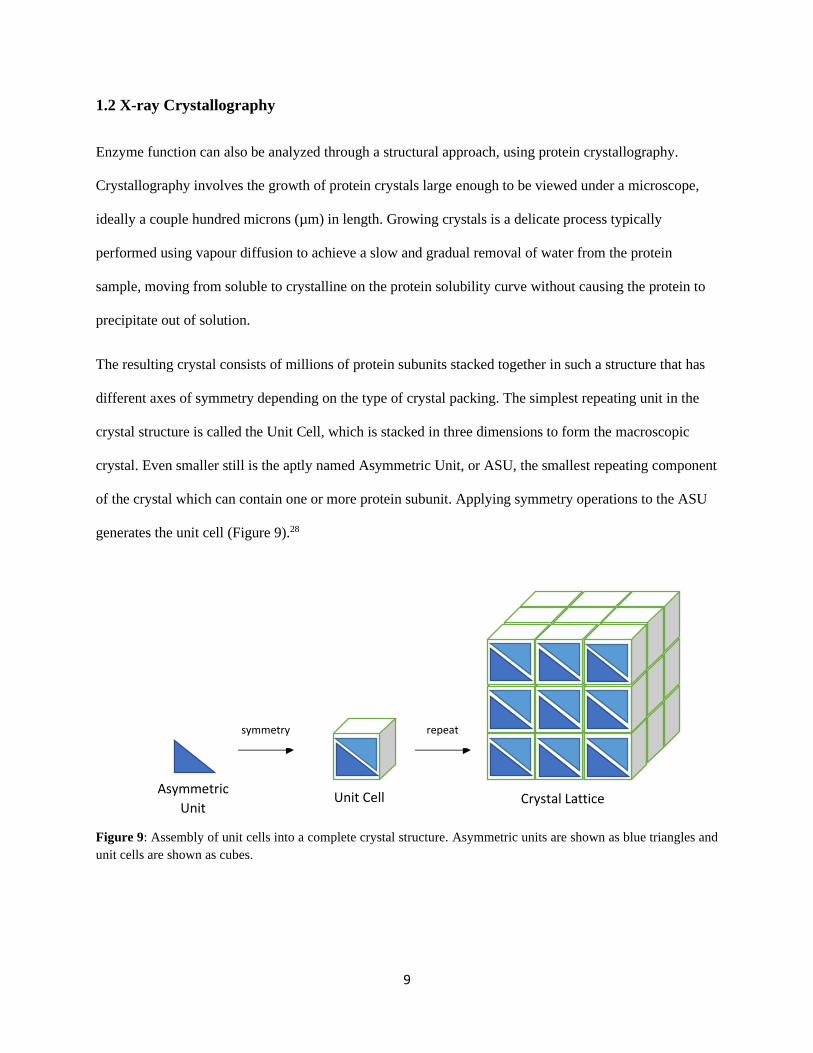
The resulting crystal consists of millions of protein subunits stacked together in such a structure that has
different axes of symmetry depending on the type of crystal packing. The simplest repeating unit in the
crystal structure is called the Unit Cell, which is stacked in three dimensions to form the macroscopic
crystal. Even smaller still is the aptly named Asymmetric Unit, or ASU, the smallest repeating component
of the crystal which can contain one or more protein subunit. Applying symmetry operations to the ASU
generates the unit cell (Figure 9).28
Figure 9: Assembly of unit cells into a complete crystal structure. Asymmetric units are shown as blue triangles and
unit cells are shown as cubes.
Crystal Lattice Unit Cell Asymmetric
Unit
symmetry repeat
10
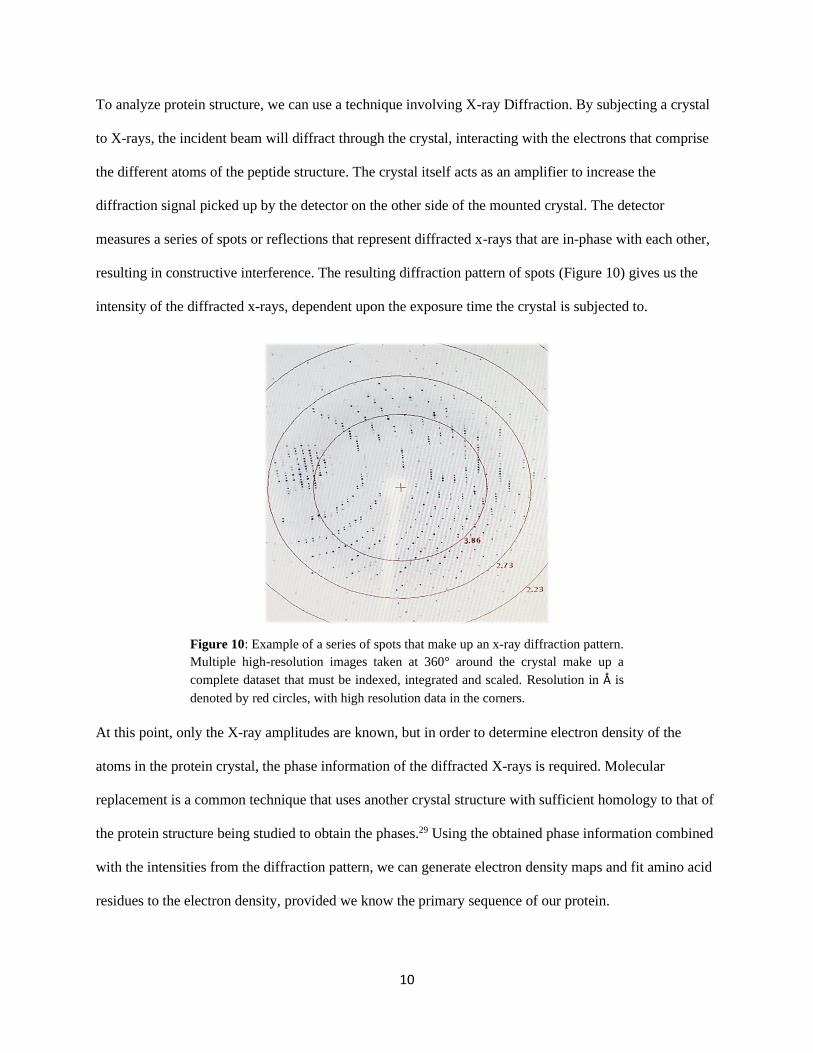
To analyze protein structure, we can use a technique involving X-ray Diffraction. By subjecting a crystal
to X-rays, the incident beam will diffract through the crystal, interacting with the electrons that comprise
the different atoms of the peptide structure. The crystal itself acts as an amplifier to increase the
diffraction signal picked up by the detector on the other side of the mounted crystal. The detector
measures a series of spots or reflections that represent diffracted x-rays that are in-phase with each other,
resulting in constructive interference. The resulting diffraction pattern of spots (Figure 10) gives us the
intensity of the diffracted x-rays, dependent upon the exposure time the crystal is subjected to.
Figure 10: Example of a series of spots that make up an x-ray diffraction pattern.
Multiple high-resolution images taken at 360° around the crystal make up a
complete dataset that must be indexed, integrated and scaled. Resolution in Å is
denoted by red circles, with high resolution data in the corners.
At this point, only the X-ray amplitudes are known, but in order to determine electron density of the
atoms in the protein crystal, the phase information of the diffracted X-rays is required. Molecular
replacement is a common technique that uses another crystal structure with sufficient homology to that of
the protein structure being studied to obtain the phases.29 Using the obtained phase information combined
with the intensities from the diffraction pattern, we can generate electron density maps and fit amino acid
residues to the electron density, provided we know the primary sequence of our protein.
11
When trying to solve a new crystal structure, often the PDB database will not contain any structures with
sufficient homology to the protein being studied. In this case, molecular replacement is not an option, and
another solution to the phase problem must be determined.
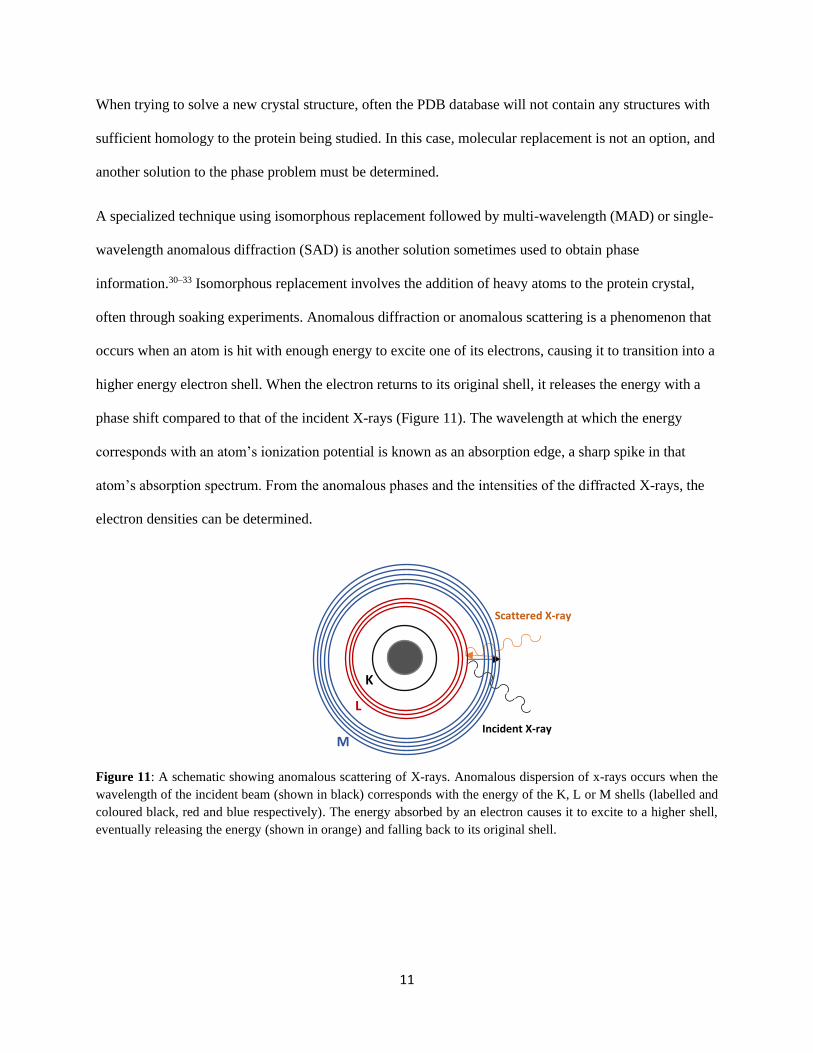
A specialized technique using isomorphous replacement followed by multi-wavelength (MAD) or single-
wavelength anomalous diffraction (SAD) is another solution sometimes used to obtain phase
information.30–33 Isomorphous replacement involves the addition of heavy atoms to the protein crystal,
often through soaking experiments. Anomalous diffraction or anomalous scattering is a phenomenon that
occurs when an atom is hit with enough energy to excite one of its electrons, causing it to transition into a
higher energy electron shell. When the electron returns to its original shell, it releases the energy with a
phase shift compared to that of the incident X-rays (Figure 11). The wavelength at which the energy
corresponds with an atom’s ionization potential is known as an absorption edge, a sharp spike in that
atom’s absorption spectrum. From the anomalous phases and the intensities of the diffracted X-rays, the
electron densities can be determined.
Figure 11: A schematic showing anomalous scattering of X-rays. Anomalous dispersion of x-rays occurs when the
wavelength of the incident beam (shown in black) corresponds with the energy of the K, L or M shells (labelled and
coloured black, red and blue respectively). The energy absorbed by an electron causes it to excite to a higher shell,
eventually releasing the energy (shown in orange) and falling back to its original shell.
Scattered X-ray
Incident X-ray
K
L
M
12
1.3 PEPCK Crystal Structure
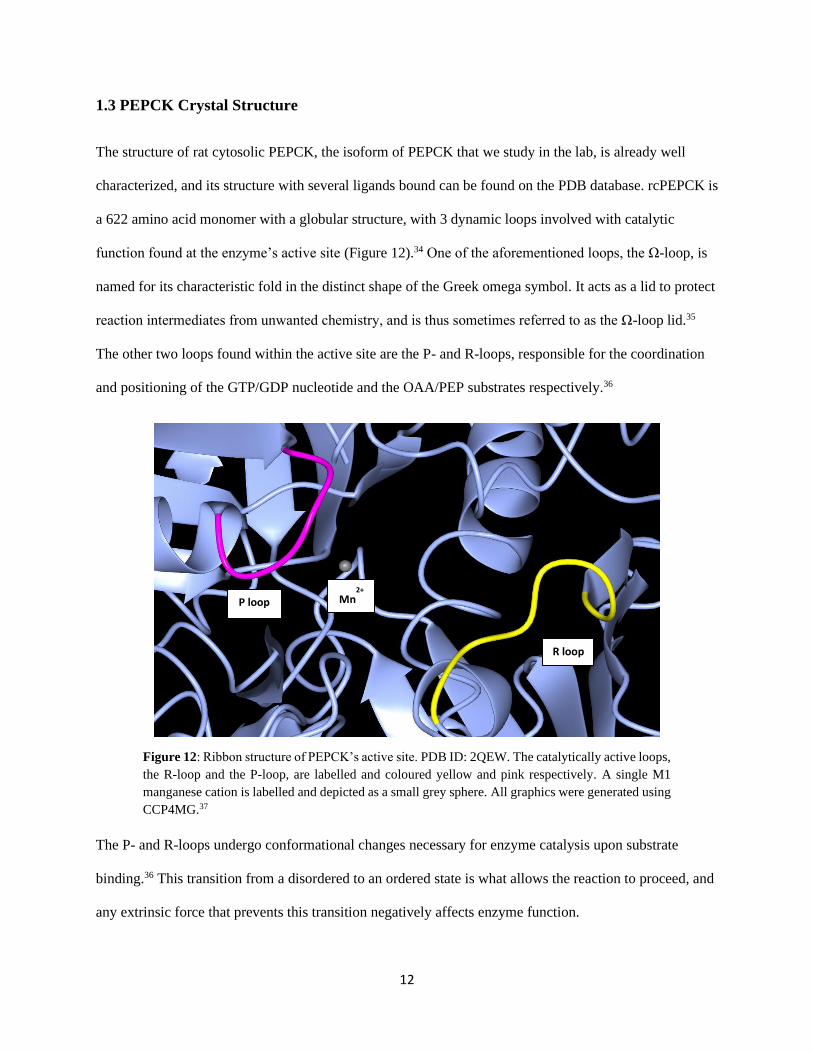
The structure of rat cytosolic PEPCK, the isoform of PEPCK that we study in the lab, is already well
characterized, and its structure with several ligands bound can be found on the PDB database. rcPEPCK is
a 622 amino acid monomer with a globular structure, with 3 dynamic loops involved with catalytic
function found at the enzyme’s active site (Figure 12).34 One of the aforementioned loops, the Ω-loop, is
named for its characteristic fold in the distinct shape of the Greek omega symbol. It acts as a lid to protect
reaction intermediates from unwanted chemistry, and is thus sometimes referred to as the Ω-loop lid.35
The other two loops found within the active site are the P- and R-loops, responsible for the coordination
and positioning of the GTP/GDP nucleotide and the OAA/PEP substrates respectively.36
Figure 12: Ribbon structure of PEPCK’s active site. PDB ID: 2QEW. The catalytically active loops,
the R-loop and the P-loop, are labelled and coloured yellow and pink respectively. A single M1
manganese cation is labelled and depicted as a small grey sphere. All graphics were generated using
CCP4MG.37
The P- and R-loops undergo conformational changes necessary for enzyme catalysis upon substrate
binding.36 This transition from a disordered to an ordered state is what allows the reaction to proceed, and
any extrinsic force that prevents this transition negatively affects enzyme function.
Mn2+
P loop
R loop
13
1.4 Structural and Kinetic Analysis of PEPCK Regulation
Now that the two different approaches of enzyme characterization have been introduced, we can proceed
to ask the question: although thermodynamically reversible, what factors may contribute to the typically
observed unidirectionality of the PEPCK-catalyzed reaction in vivo? Our objective is to use a combined
structural and kinetic approach to determine the possibility of the regulation of PEPCK activity in vivo by
anions.
From kinetic data found in the literature, as well as previous kinetic assays done in our lab38,39, it can be
observed that PEPCK is catalytically active in both directions in vitro, which seemingly conflicts the
aforementioned statement that only the “forward” direction is catalyzed in biological systems.
Interestingly, although kinetic assays performed in the lab indeed show activity in the “reverse” direction,
the maximum rate of catalysis is significantly lower, roughly by a factor of two when compared to assays
performed in the “forward” or physiological direction of catalysis.12
From the aforementioned study13, we hypothesized that anionic inhibition was occurring in the reverse
direction of catalysis, leading to the observed decrease in reaction rate in that direction. Logically, this
inhibitory effect would be greater in vivo, where PEPCK is subjected to higher concentrations of salts.
Chloride is an obvious choice to study enzyme inhibition in vitro, due to its physiological relevance and
abundance in biological systems.
For a structural approach, iodide was chosen as the inhibitor instead of chloride, due to its unique
anomalous properties (Table 2). Of all of the halides we had at our disposal in the laboratory, iodide has
the closest absorption edge to the wavelength generated by our home source’s rotating copper anode
(CuKα = 1.54Å). Iodide has an absorption edge around 2.4Å, or 5.2 keV, corresponding to its L-I shell.40
Based on these intrinsic properties, we can use single-wavelength anomalous dispersion (SAD) to detect
where iodide, as our anionic inhibitor, is binding to PEPCK.
14
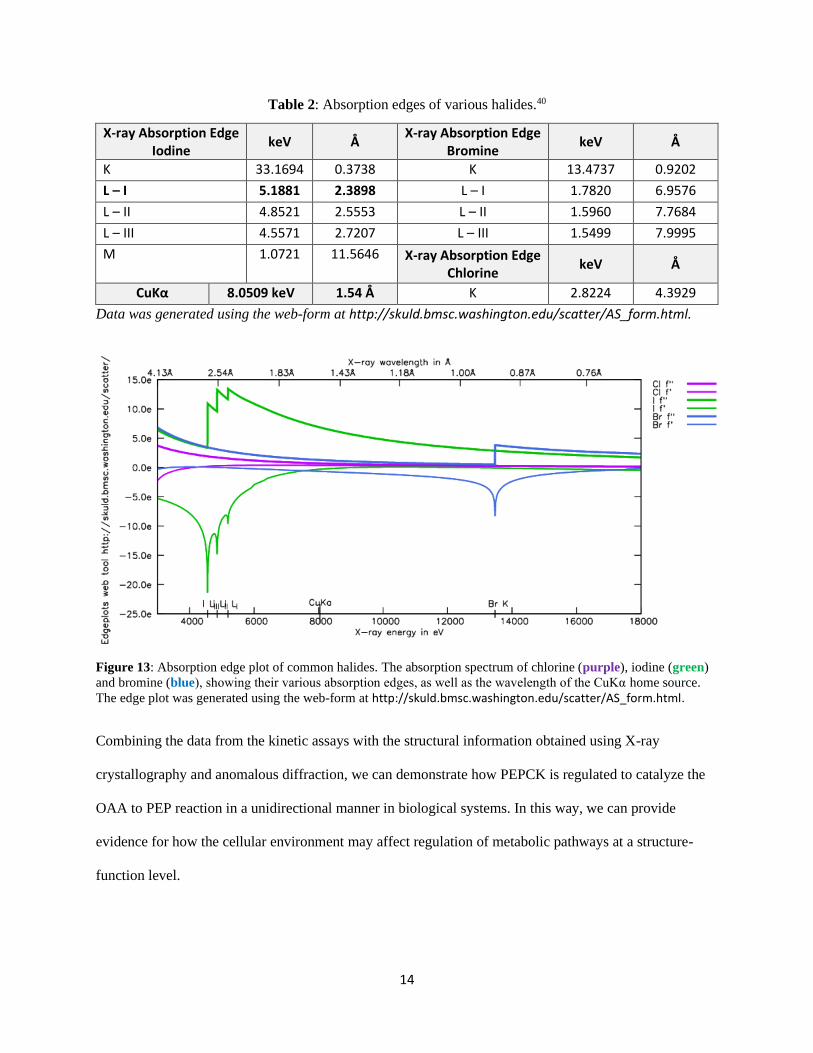
Table 2: Absorption edges of various halides.40
X-ray Absorption Edge Iodine
keV Å X-ray Absorption Edge
Bromine keV Å
K 33.1694 0.3738 K 13.4737 0.9202
L – I 5.1881 2.3898 L – I 1.7820 6.9576
L – II 4.8521 2.5553 L – II 1.5960 7.7684
L – III 4.5571 2.7207 L – III 1.5499 7.9995
M 1.0721 11.5646 X-ray Absorption Edge Chlorine
keV Å
CuKα 8.0509 keV 1.54 Å K 2.8224 4.3929
Data was generated using the web-form at http://skuld.bmsc.washington.edu/scatter/AS_form.html.
Figure 13: Absorption edge plot of common halides. The absorption spectrum of chlorine (purple), iodine (green)
and bromine (blue), showing their various absorption edges, as well as the wavelength of the CuKα home source.
The edge plot was generated using the web-form at http://skuld.bmsc.washington.edu/scatter/AS_form.html.
Combining the data from the kinetic assays with the structural information obtained using X-ray
crystallography and anomalous diffraction, we can demonstrate how PEPCK is regulated to catalyze the
OAA to PEP reaction in a unidirectional manner in biological systems. In this way, we can provide
evidence for how the cellular environment may affect regulation of metabolic pathways at a structure-
function level.

15
Chapter 2: Experimental Procedures
2.1 Materials
GDP and ADP were purchased from Combi Blocks and BioShop respectively. GTP, PEP, and NADH
were purchased from Chem-Impex International, and OAA was purchased from Millipore Sigma
(CalBioChem). Co-NTA resin was purchased from UBP Bio and regenerated in the laboratory as Ni-NTA
resin. P6DG and Chelex resin were purchased from BioRad. TCEP and DTT reducing agents were
purchased from GoldBio.
2.2 Enzymes
The enzymes used in the coupled-enzyme assay for PEPCK activity, pyruvate kinase, lactate
dehydrogenase and malate dehydrogenase, were used as provided by the supplier (Calzyme). The plasmid
expressing His6-SUMO protease was a gift from C. Lima (Sloan-Kettering Institute, New York, NY). The
SUMO protease was expressed and purified via the protocol below.
A 50 mL culture of BL21 E. coli cells containing the His6-SUMO plasmid was grown overnight at 37°C
and 225 rpm in LB media containing 50 µL of 50 mg/mL kanamycin. The overnight culture was added to
inoculate 1L of fresh LB-Kan media. The culture was incubated at 37°C until the OD600 reached 2.0. The
incubation temperature was lowered to 30°C and expression was induced by adding IPTG to a final
concentration of 0.75 mM (10 mL of 75 mM IPTG). Cells continued to grow under these conditions for
an additional 4 hours, then were spun down at 6000 rpm, room temperature for 15 minutes. The
supernatant was discarded and the resulting cell pellet was resuspended in buffer containing 25 mM
HEPES pH 8.0, 350 mM NaCl, 2 mM TCEP and 20 mM imidazole. The resuspended cells were lysed via
two passes through a French Press, then centrifuged at 12 000 x g for 30 minutes at 4°C. The pellet was
discarded and the supernatant was incubated for 1 hour at 4°C with Ni-NTA resin that had been pre-
equilibrated with the same resuspension buffer. The Ni-NTA resin was washed with buffer until the flow
through reached an A280 < 0.1. The SUMO protease was then eluted from the resin using an elution buffer
containing 25 mM HEPES pH 8.0, 350 mM NaCl, 2 mM TCEP and 400 mM imidazole. The eluate was
16
concentrated to 5 mg/mL (ε280 = 1.18 mL mg-1) and 50% glycerol was added to a final volume of 25%
(v/v). The final protease solution (2.5 mg/mL) was flash-frozen in small aliquots by immersion in liquid
nitrogen and stored at -80°C.
2.3 Cloning and transformation of the WT rcPEPCK DNA sequence into an expression
vector
The gene encoding for WT rat cytosolic PEPCK was cloned into a pSUMO-star expression vector as
previously described.35 The entire plasmid was then subsequently transformed using heat shock into the
BL21 E. coli cell line, and stored at -80°C as a common laboratory cell stock.
The WT rcPEPCK plasmid was purified using a High-Speed Plasmid Mini Kit by Geneaid. The miniprep
protocol was followed as provided by the supplier, and the purified plasmid was stored at -20°C. The
purified plasmid was used as the template sequence for PCR mutagenesis.
2.4 PCR mutagenesis of rcPEPCK
Forward and reverse primers were designed to introduce the F284H and F284W mutations into the
PEPCK DNA sequence. An E. coli codon usage chart was used to determine the ideal single-base pair
substitution to mutate the phenylalanine residue at position 284 into a histidine or a tryptophan. The
resultant mutant DNA primers were subsequently synthesized by Sigma-Genosys (Table 3).
17
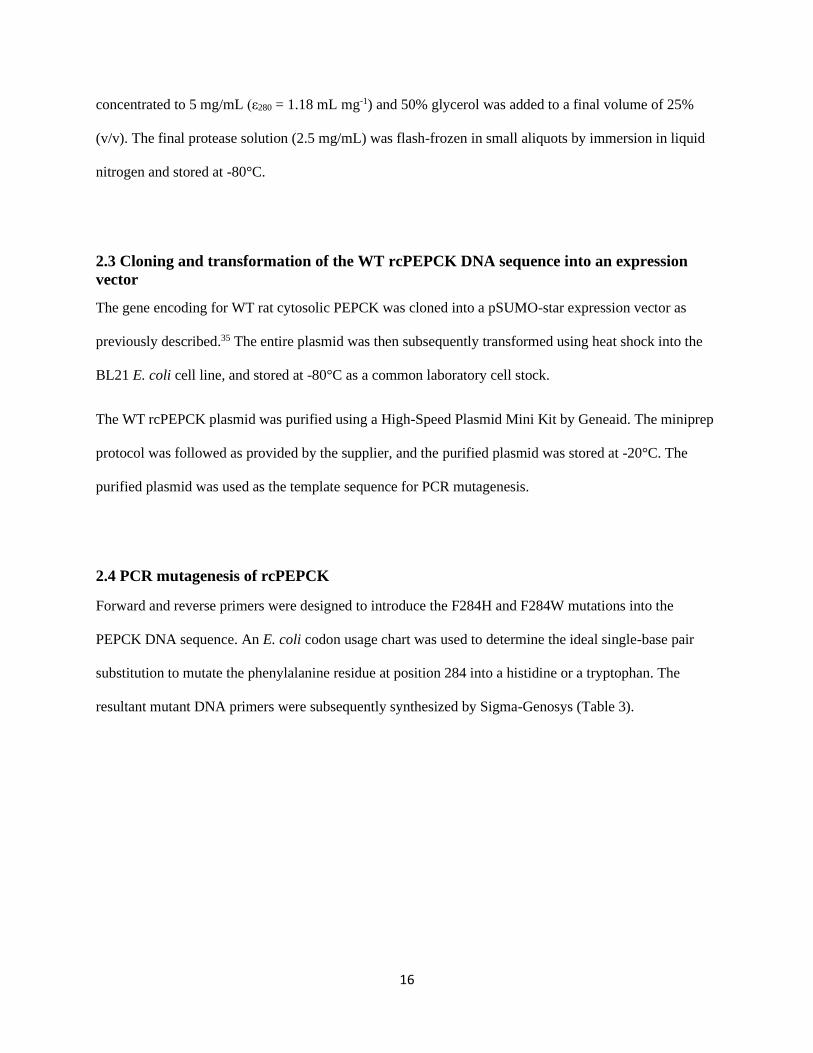
Table 3: Mutant Primer Design for F284H and F284W rcPEPCK enzyme variants*
Primer Name Length (nt.) Tm (°C)
t993c_t994a forward 27 79.46
t993c_t994a reverse 27 79.46
Mutation
F284H
Primer Name Length (nt.) Tm (°C)
t994g_c995g forward 27 79.46
t994g_c995g reverse 27 79.46
Mutation
F284W
*The codons in blue represent the changes in the wildtype DNA sequence for mutagenesis.
PCR mutagenesis was performed using 1 µL of each of the mutant primers at 100 ng/µL, 0.5 µL of
Phusion high fidelity polymerase (Thermo Scientific), 5 µL of dNTPs, 10 µL of 5X reaction buffer
(Thermo Scientific), and 5 µL the WT PEPCK SUMOstar expression vector (100 ng/ µL) as the DNA
template. The thermocycler parameters were set as shown in Table 4. After amplification, the PCR
products were digested with Dpn1 for 1 hour to degrade the WT plasmid template.
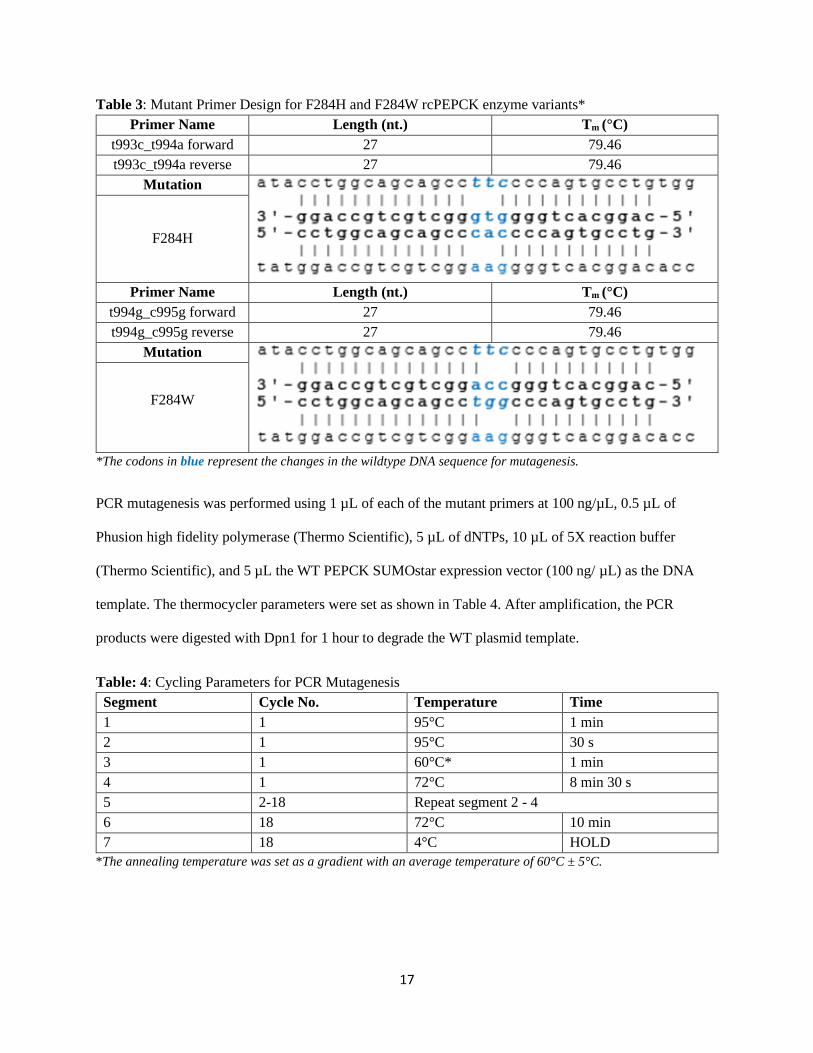
Table: 4: Cycling Parameters for PCR Mutagenesis
Segment Cycle No. Temperature Time
1 1 95°C 1 min
2 1 95°C 30 s
3 1 60°C* 1 min
4 1 72°C 8 min 30 s
5 2-18 Repeat segment 2 - 4
6 18 72°C 10 min
7 18 4°C HOLD
*The annealing temperature was set as a gradient with an average temperature of 60°C ± 5°C.
18
The PCR products were run on an agarose gel to confirm successful DNA amplification, then transformed
into chemically-competent XL1 E. coli cells via heat shock.41,42 The resultant cell culture was plated onto
LB-Kanamycin agar plates using the streak-plate method. Colonies that successfully grew on the
kanamycin plates were harvested and used to inoculate new LB-Kan media, and stored at -80°C as mutant
PEPCK cell stocks. The mutant rcPEPCK plasmids were miniprepped using the same procedure as the
WT plasmid miniprep, then sent to Robarts Research (London, ON, Canada) for sequencing to confirm
the mutation of the corresponding codons and absence of unintended mutation of the remaining gene.
2.5 Wildtype and Mutant rcPEPCK expression and purification
The cell stock of BL21 E. coli containing the expression vector was used to inoculate four Erlenmeyer
flasks of 50mL of LB-kanamycin media, which were left to incubate at 37°C while mixing overnight. The
culture flasks were then each added to four separate flasks of 950mL autoinduction media, for a total of
4L culture volume. The autoinduction media contains 50 µg/mL of kanamycin for antibiotic selection of
pSUMO-star-containing cells. Autoinduction media also contains MgSO4, NPS salts, trace elements,
glucose and lactose sugars for induction of the T7 lac promoter on the expression vector.43 The
autoinduction flasks were incubated for 20-24 hrs at 20°C to induce expression of the His6-SUMO-
rcPEPCK fusion protein.
The autoinduction media was then centrifuged at RT, 5000 x g for 15 minutes and the supernatant was
discarded. The resulting cell pellet was resuspended in wash buffer containing 10% glycerol, 300 mM
NaCl, 10 mM imidazole, 25 mM HEPES pH 7.5, and 2 mM TCEP-HCl. The resuspended cells were then
lysed via two passes through a French Press, then spun down at 4°C, 12 000 x g for 1 hour. All protein
purification from this point onwards was performed at 4°C. The protein-containing supernatant was added
to Ni-NTA affinity resin that had been pre-equilibrated with 200 mL of wash buffer, and incubated with
gentle shaking for a minimum of 1 hour.
19
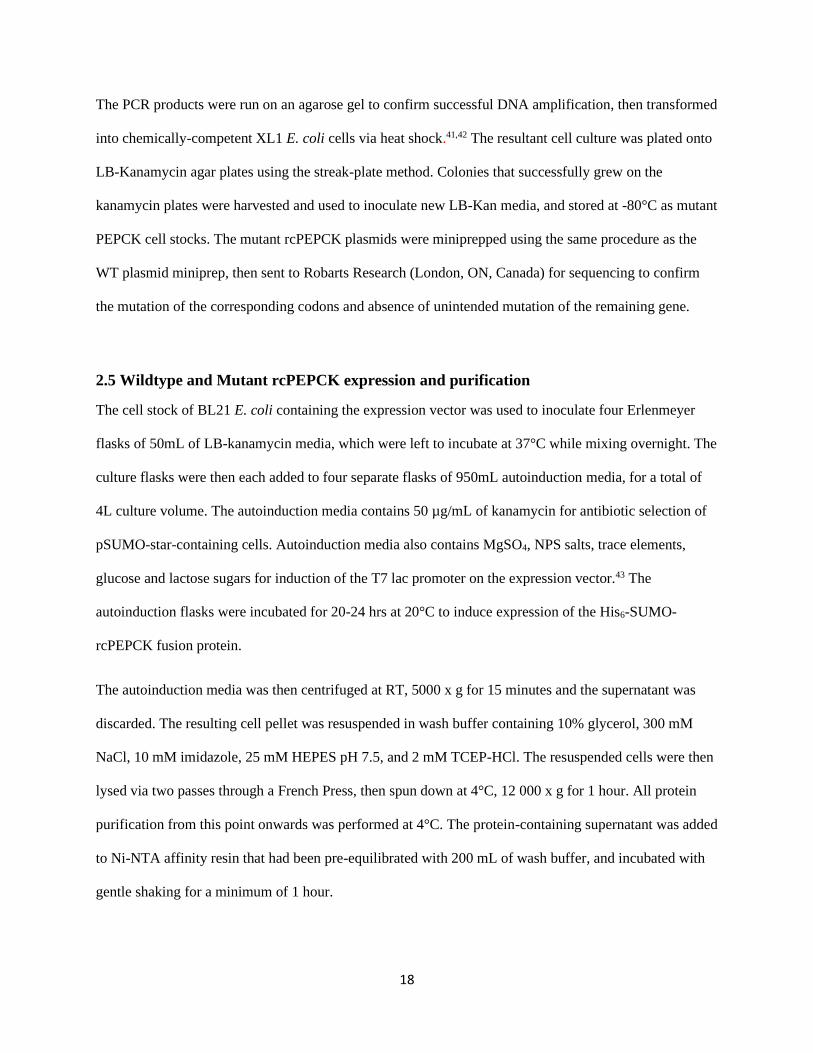
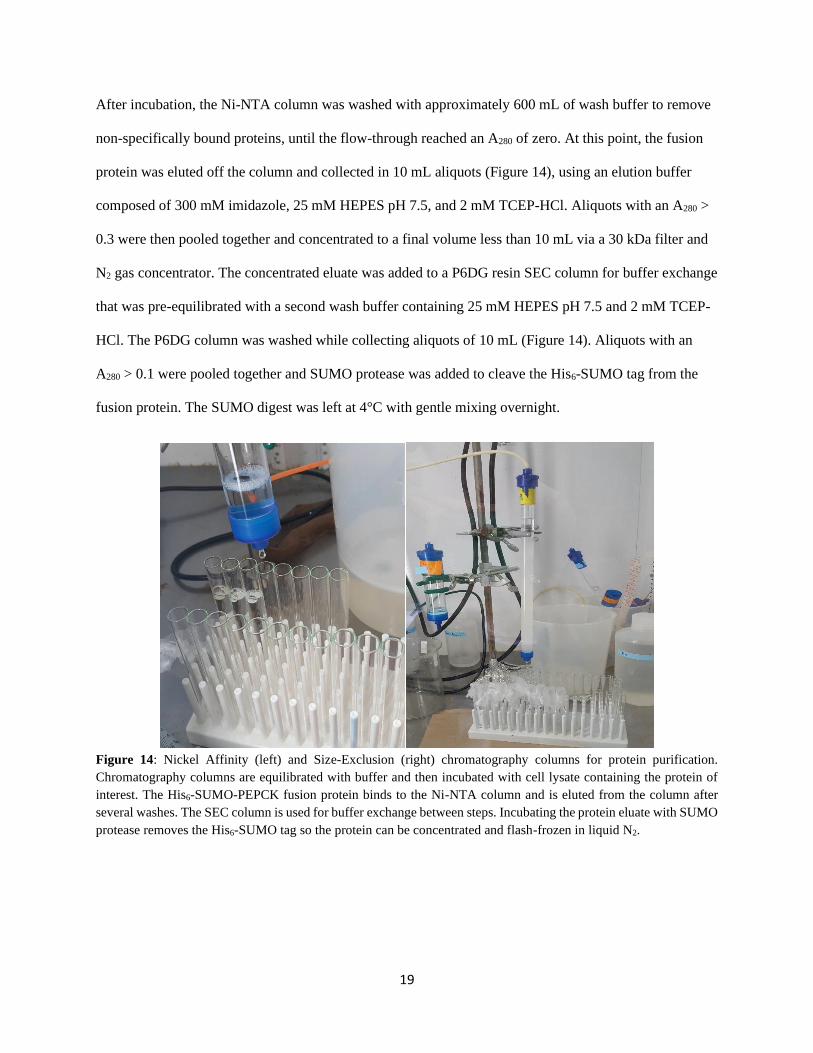
After incubation, the Ni-NTA column was washed with approximately 600 mL of wash buffer to remove
non-specifically bound proteins, until the flow-through reached an A280 of zero. At this point, the fusion
protein was eluted off the column and collected in 10 mL aliquots (Figure 14), using an elution buffer
composed of 300 mM imidazole, 25 mM HEPES pH 7.5, and 2 mM TCEP-HCl. Aliquots with an A280 >
0.3 were then pooled together and concentrated to a final volume less than 10 mL via a 30 kDa filter and
N2 gas concentrator. The concentrated eluate was added to a P6DG resin SEC column for buffer exchange
that was pre-equilibrated with a second wash buffer containing 25 mM HEPES pH 7.5 and 2 mM TCEP-
HCl. The P6DG column was washed while collecting aliquots of 10 mL (Figure 14). Aliquots with an
A280 > 0.1 were pooled together and SUMO protease was added to cleave the His6-SUMO tag from the
fusion protein. The SUMO digest was left at 4°C with gentle mixing overnight.
Figure 14: Nickel Affinity (left) and Size-Exclusion (right) chromatography columns for protein purification.
Chromatography columns are equilibrated with buffer and then incubated with cell lysate containing the protein of
interest. The His6-SUMO-PEPCK fusion protein binds to the Ni-NTA column and is eluted from the column after
several washes. The SEC column is used for buffer exchange between steps. Incubating the protein eluate with SUMO
protease removes the His6-SUMO tag so the protein can be concentrated and flash-frozen in liquid N2.
20
The SUMO-digested sample was then added to the Ni-NTA column, pre-equilibrated with 200 mL of
wash buffer. The protein sample flowed through the column while the cleaved His6-SUMO tag remained
bound to the column. Aliquots of 10 mL were collected once more, pooled together if A280 > 0.1, and
concentrated to a final volume of less than 10 mL via a 30 kDa filter and N2 gas concentrator. The
concentrated protein sample was added to a P6DG resin SEC column that had been pre-equilibrated with
the final buffer, containing 25 mM HEPES pH 7.5 and 10 mM DTT for long-term stability and storage of
the protein at -80°C. Aliquots containing protein were collected from the P6DG column, pooled together
if A280 > 0.1, and concentrated to a final concentration of 10 mg/mL via 30 kDa filter centrifugation at
4°C, 3500 x g, at 10 minute intervals. Protein concentration was determined using a NanoDrop
spectrophotometer and an ε280 = 1.7 mL mg-1, using the final storage buffer as a blank.
The final concentrated rcPEPCK sample was flash-frozen into 25 µL aliquots by pipetting directly into a
liquid nitrogen-containing vial, and then storing the entire sample (roughly 1 to 1.5 mL total volume) at -
80°C, leaving the nitrogen to evaporate overnight.
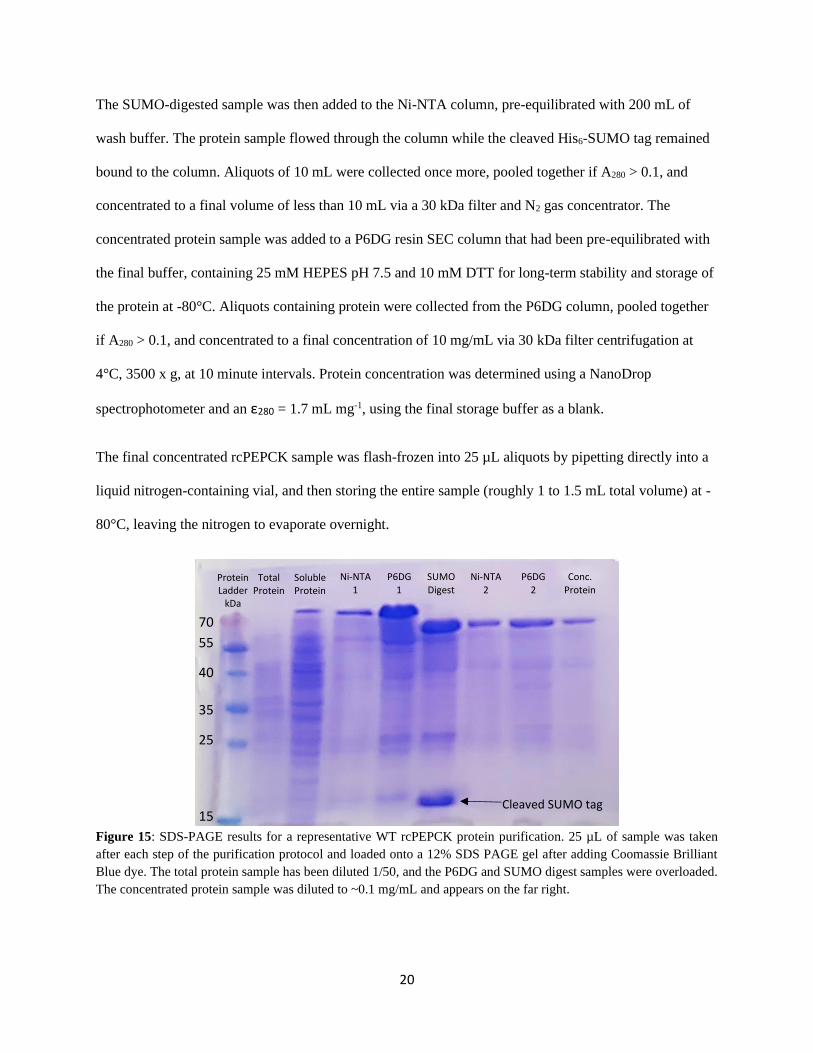
Figure 15: SDS-PAGE results for a representative WT rcPEPCK protein purification. 25 µL of sample was taken
after each step of the purification protocol and loaded onto a 12% SDS PAGE gel after adding Coomassie Brilliant
Blue dye. The total protein sample has been diluted 1/50, and the P6DG and SUMO digest samples were overloaded.
The concentrated protein sample was diluted to ~0.1 mg/mL and appears on the far right.
Protein Ladder
kDa
Total Protein
Soluble Protein
Ni-NTA 1
P6DG 1
SUMO Digest
Ni-NTA 2
P6DG 2
Conc. Protein
70
55
40
35
25
15 Cleaved SUMO tag
21
2.6 Wildtype rcPEPCK crystallization and anion soaking
WT PEPCK crystals were grown using both sitting-drop and hanging-drop vapour diffusion methods, at
14 – 24% PEG 3350, 75 mM MnCl2, 100 mM HEPES pH 7.5, and 10 mg/mL protein. Crystals grew
within a few days, with a rod-shaped morphology, and were harvested up to three days post crystallization
as it was observed that the diffraction quality would begin to deteriorate with older crystals.
WT PEPCK crystals were incubated in cryoprotectant containing a solution identical to the mother liquor,
with the addition of 10% PEG 400 and potassium iodide ranging from 0 to 500 mM. Starting with 0 mM
KI, the protein crystals were instantly dipped into 20 µL of cryoprotectant in a gradual, step-wise fashion
to prevent cracking progressing through a range of: 0 mM, 10 mM, 25 mM, 50 mM, 100 mM, 250 mM,
and 500 mM KI with the final KI concentration reflecting the final concentration of the salt the crystals
were exposed to. Regardless of the final KI concentration, the crystals were incubated in the final KI
solution for precisely 10 minutes. After incubation, the crystals were cryocooled by direct immersion in
liquid nitrogen and mounted on the diffractometer. Our home source uses a rotating copper anode (CuKα
= 1.54Å) to generate incident X-rays, and a Rigaku detector to read the resulting diffraction patterns.
The detector was set roughly 160 mm away from the mounted crystal, and the crystal was centered in the
X-ray beam and cryostream through careful adjustment of the goniometer. Each of the crystals were
exposed to X-rays for 120 seconds, and diffraction patterns were collected at 1° intervals around the
crystal, for a complete 360° dataset. Six different datasets were collected, one for each crystal soaked at
each of the above listed KI concentrations.
Each of the datasets were indexed as a primitive monoclinic Bravais lattice, integrated and scaled both
anomalously and non-anomalously in a P21 spacegroup using HKL-2000.44 The resulting scalepack files
were converted into .mtz files using CCP445, with only one PEPCK molecule in the ASU. The non-
anomalous datasets were used for structure solution as follows: molecular replacement was done via the
MOLREP program using the WT rcPEPCK structure found on the PDB database (PDB ID: 2QEW).46
Refinement was done using both CCP4 and Coot.47 Lastly, anomalous difference maps were generated by
22
scaling the diffraction data in an anomalous fashion and generating the resultant anomalous data file using
CCP4. The anomalous data within this .mtz file was combined with amplitudes and phases from the
refined structure, using the CAD program in CCP4 to merge the two files. Subsequently, this .mtz file
was used as the input data for the FFT program to perform a Fourier transform, generating the anomalous
difference map. The FFT program also has an option called ‘Peak Search’ that calculates anomalous peak
heights above a certain intensity and lists them in a .pdb file. Using Coot to visualize the anomalous
difference maps and the peak heights in the .pdb file, anomalous peak heights were assigned to PEPCK’s
allosteric site for each dataset, corresponding to the allosteric anion occupancy for PEPCK crystals
soaked at each iodide concentration. An allosteric binding isotherm was created by plotting the
anomalous peak heights against the KI concentration.
F284H and F284W rcPEPCK crystals were grown under the same crystallization conditions as the WT
rcPEPCK crystals, with the additional step of seeding. A seed stock was created from a WT rcPEPCK
crystal, and further seed stocks were created via serial dilutions of this initial solution. The seed stocks
were created using a stabilizing solution of PEG 3350, PEG 400, HEPES and MnCl2 to mimic the
reservoir solution. Mutant rcPEPCK crystals were grown at lower protein concentration ranging from 2 –
6 mg/mL, and seeded with seed stocks diluted between 103 - 104. Mutant rcPEPCK crystals were
subjected to the same iodide soaking protocol as the WT, albeit only a 250 mM potassium iodide dataset
was collected on each of the mutant crystals.
23
2.7 Wildtype rcPEPCK kinetic activity and inhibition assays
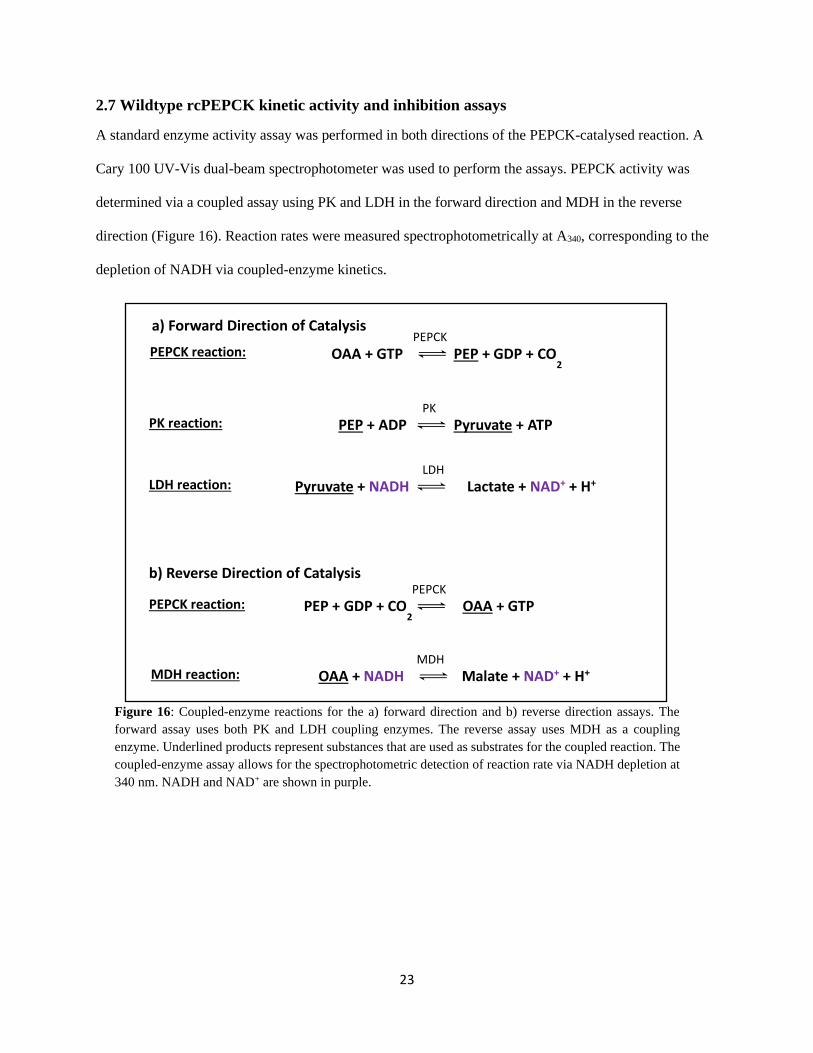
A standard enzyme activity assay was performed in both directions of the PEPCK-catalysed reaction. A
Cary 100 UV-Vis dual-beam spectrophotometer was used to perform the assays. PEPCK activity was
determined via a coupled assay using PK and LDH in the forward direction and MDH in the reverse
direction (Figure 16). Reaction rates were measured spectrophotometrically at A340, corresponding to the
depletion of NADH via coupled-enzyme kinetics.
Figure 16: Coupled-enzyme reactions for the a) forward direction and b) reverse direction assays. The
forward assay uses both PK and LDH coupling enzymes. The reverse assay uses MDH as a coupling
enzyme. Underlined products represent substances that are used as substrates for the coupled reaction. The
coupled-enzyme assay allows for the spectrophotometric detection of reaction rate via NADH depletion at
340 nm. NADH and NAD+ are shown in purple.
PEP + GDP + CO2
OAA + GTP PEPCK reaction:
PEPCK
OAA + NADH Malate + NAD+ + H+ MDH reaction:
MDH
b) Reverse Direction of Catalysis
OAA + GTP PEP + GDP + CO2
PEPCK reaction:
PEPCK
PEP + ADP Pyruvate + ATP PK reaction:
PK
Pyruvate + NADH Lactate + NAD+ + H+ LDH reaction:
LDH
a) Forward Direction of Catalysis
24
The assay mix in the forward direction contained 100 mM HEPES pH 7.5, 10 mM DTT, 4 mM MgCl2,
100 µM MnCl2, 0.5 mM GTP, 1 mM ADP, 300 µM NADH, and 350 µM OAA, as well as 10 U of PK, 30
U of LDH, and 2.5 µg of PEPCK at 0.5 mg/mL. The total assay volume was 1 mL. For the ‘reverse’
direction assay, concentrations of HEPES, DTT, NADH, MgCl2, MnCl2 and PEPCK remain the same,
while 1 mM GDP, 4 mM PEP, 500 mM KHCO3 and 10 U of MDH are added instead.
Assays were performed while varying each of the 4 possible substrates and keeping the rest of the
substrates at a fixed and saturating concentration (at least 5 times the KM value). For the ‘forward’
direction, Michaelis-Menten curves were generated for both the OAA substrate and the GTP nucleotide,
while curves for the ‘reverse’ direction were created for the PEP substrate and the GDP nucleotide.
Anionic inhibition assays were also performed on WT PEPCK, by adding increasing amounts of
potassium chloride. A series of five inhibition curves were plotted, one for each KCl concentration: 0
mM, 5 mM, 15 mM, 25 mM, and 40 mM KCl in the ‘forward’ direction assay, and 0 mM, 10 mM, 25
mM, 40 mM, and 100 mM KCl in the ‘reverse’ direction assay. The same anionic inhibition assay was
repeated on the wildtype in the ‘reverse’ direction using iodide for comparison of the two anionic
inhibitors. SigmaPlot’s Enzyme Kinetics module was used to generate the Michaelis-Menten curves, as
well as calculate kinetic parameters including Vmax, KM and KI.
25
2.8 Mutant rcPEPCK kinetic activity and inhibition assays
F284H and F284W rcPEPCK were characterized to determine new kinetic parameters for the nucleotides
in both reaction directions as due to the proximity of the mutation to the nucleotide binding site it was
possible that the KM value may have been increased in these enzyme variants. A standard activity assay as
described above for the WT enzyme was performed in both the forward and reverse direction of catalysis,
varying nucleotide concentration while keeping the other substrates constant (with the exception of
MgCl2, which was kept at a 4:1 ratio with the varied nucleotide to form the metal-nucleotide substrate
complex). Once the ideal concentration of GTP or GDP nucleotide was determined for maximum enzyme
activity, inhibition assays were performed as described above for WT rcPEPCK. The chloride inhibition
was determined for the F284H and F284W mutant isoforms up to a maximum concentration of 200 mM
KCl.
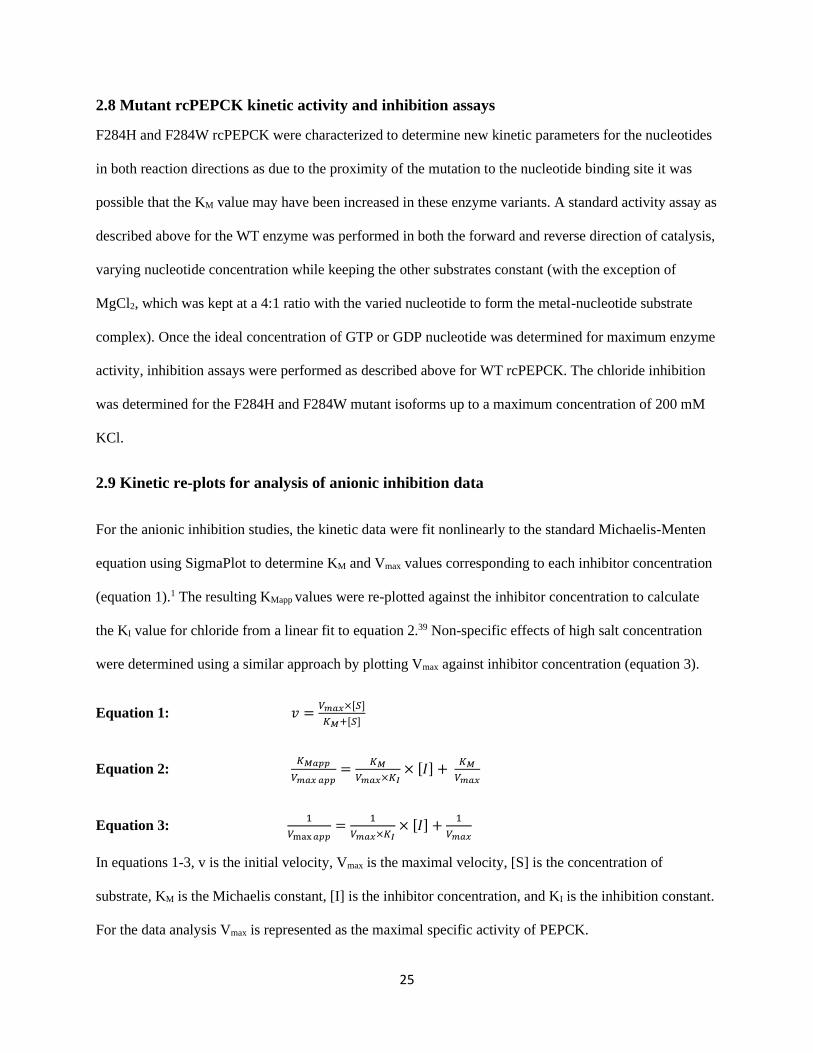
2.9 Kinetic re-plots for analysis of anionic inhibition data
For the anionic inhibition studies, the kinetic data were fit nonlinearly to the standard Michaelis-Menten
equation using SigmaPlot to determine KM and Vmax values corresponding to each inhibitor concentration
(equation 1).1 The resulting KMapp values were re-plotted against the inhibitor concentration to calculate
the KI value for chloride from a linear fit to equation 2.39 Non-specific effects of high salt concentration
were determined using a similar approach by plotting Vmax against inhibitor concentration (equation 3).
Equation 1: 𝑣 =𝑉𝑚𝑎𝑥×[𝑆]
𝐾𝑀+[𝑆]
Equation 2: 𝐾𝑀𝑎𝑝𝑝
𝑉𝑚𝑎𝑥 𝑎𝑝𝑝=
𝐾𝑀
𝑉𝑚𝑎𝑥×𝐾𝐼× [𝐼] +
𝐾𝑀
𝑉𝑚𝑎𝑥
Equation 3: 1
𝑉max 𝑎𝑝𝑝=
1
𝑉𝑚𝑎𝑥×𝐾𝐼× [𝐼] +
1
𝑉𝑚𝑎𝑥
In equations 1-3, v is the initial velocity, Vmax is the maximal velocity, [S] is the concentration of
substrate, KM is the Michaelis constant, [I] is the inhibitor concentration, and KI is the inhibition constant.
For the data analysis Vmax is represented as the maximal specific activity of PEPCK.
26
Chapter 3: Results
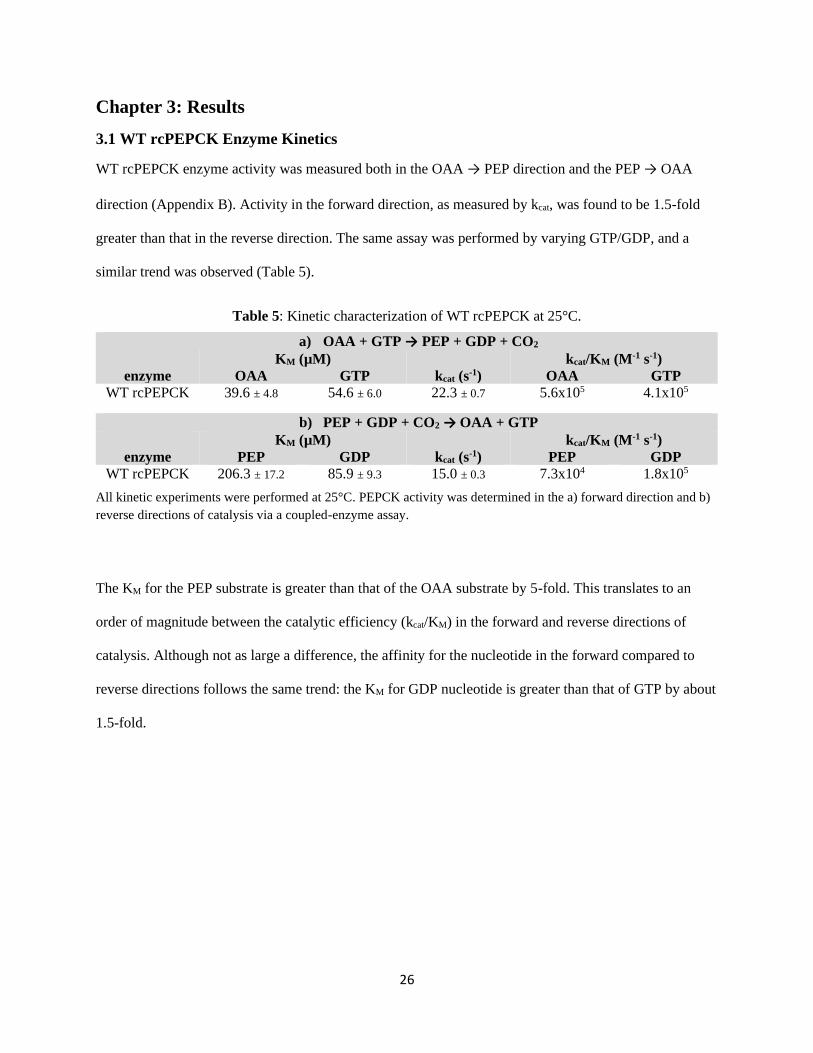
3.1 WT rcPEPCK Enzyme Kinetics
WT rcPEPCK enzyme activity was measured both in the OAA → PEP direction and the PEP → OAA
direction (Appendix B). Activity in the forward direction, as measured by kcat, was found to be 1.5-fold
greater than that in the reverse direction. The same assay was performed by varying GTP/GDP, and a
similar trend was observed (Table 5).
Table 5: Kinetic characterization of WT rcPEPCK at 25°C.
a) OAA + GTP → PEP + GDP + CO2
KM (µM) kcat/KM (M-1 s-1)
enzyme OAA GTP kcat (s-1) OAA GTP
WT rcPEPCK 39.6 ± 4.8 54.6 ± 6.0 22.3 ± 0.7 5.6x10⁵ 4.1x10⁵
b) PEP + GDP + CO2 → OAA + GTP
KM (µM) kcat/KM (M-1 s-1)
enzyme PEP GDP kcat (s-1) PEP GDP
WT rcPEPCK 206.3 ± 17.2 85.9 ± 9.3 15.0 ± 0.3 7.3x10⁴ 1.8x10⁵
All kinetic experiments were performed at 25°C. PEPCK activity was determined in the a) forward direction and b)
reverse directions of catalysis via a coupled-enzyme assay.
The KM for the PEP substrate is greater than that of the OAA substrate by 5-fold. This translates to an
order of magnitude between the catalytic efficiency (kcat/KM) in the forward and reverse directions of
catalysis. Although not as large a difference, the affinity for the nucleotide in the forward compared to
reverse directions follows the same trend: the KM for GDP nucleotide is greater than that of GTP by about
1.5-fold.
27
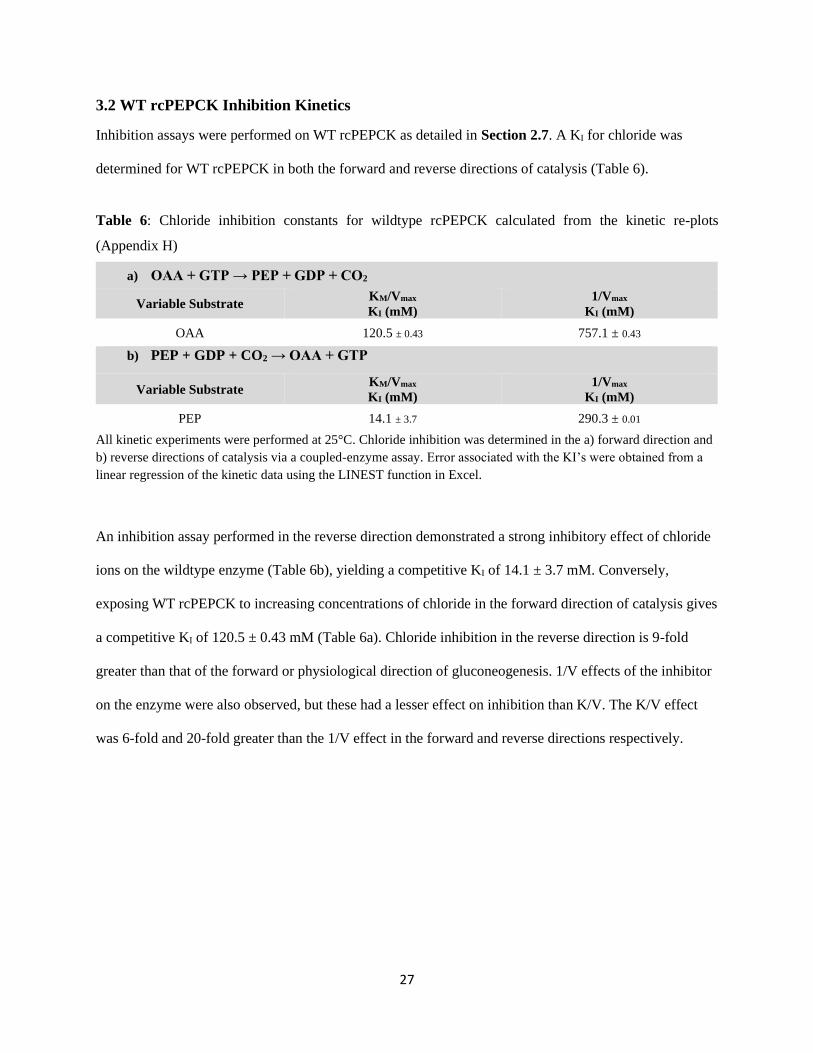
3.2 WT rcPEPCK Inhibition Kinetics
Inhibition assays were performed on WT rcPEPCK as detailed in Section 2.7. A KI for chloride was
determined for WT rcPEPCK in both the forward and reverse directions of catalysis (Table 6).
Table 6: Chloride inhibition constants for wildtype rcPEPCK calculated from the kinetic re-plots
(Appendix H)
a) OAA + GTP → PEP + GDP + CO2
Variable Substrate KM/Vmax
KI (mM)
1/Vmax
KI (mM)
OAA 120.5 ± 0.43 757.1 ± 0.43
b) PEP + GDP + CO2 → OAA + GTP
Variable Substrate KM/Vmax
KI (mM)
1/Vmax
KI (mM)
PEP 14.1 ± 3.7 290.3 ± 0.01
All kinetic experiments were performed at 25°C. Chloride inhibition was determined in the a) forward direction and
b) reverse directions of catalysis via a coupled-enzyme assay. Error associated with the KI’s were obtained from a
linear regression of the kinetic data using the LINEST function in Excel.
An inhibition assay performed in the reverse direction demonstrated a strong inhibitory effect of chloride
ions on the wildtype enzyme (Table 6b), yielding a competitive KI of 14.1 ± 3.7 mM. Conversely,
exposing WT rcPEPCK to increasing concentrations of chloride in the forward direction of catalysis gives
a competitive KI of 120.5 ± 0.43 mM (Table 6a). Chloride inhibition in the reverse direction is 9-fold
greater than that of the forward or physiological direction of gluconeogenesis. 1/V effects of the inhibitor
on the enzyme were also observed, but these had a lesser effect on inhibition than K/V. The K/V effect
was 6-fold and 20-fold greater than the 1/V effect in the forward and reverse directions respectively.
28
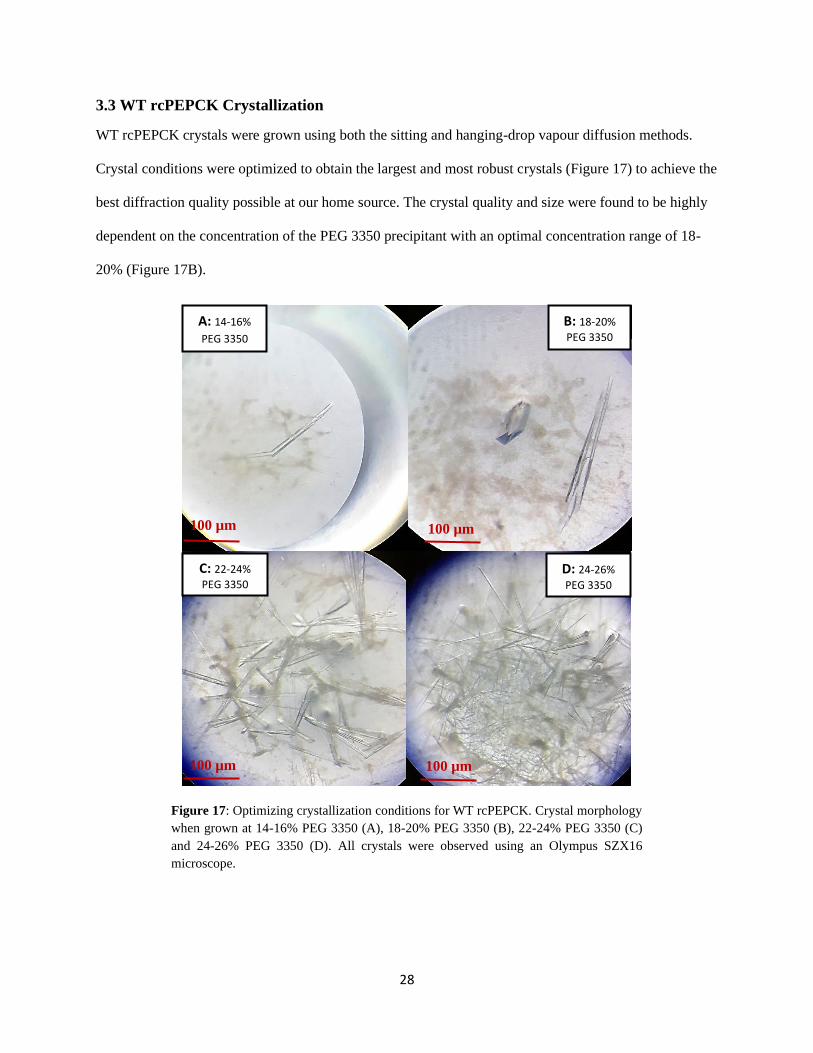
3.3 WT rcPEPCK Crystallization
WT rcPEPCK crystals were grown using both the sitting and hanging-drop vapour diffusion methods.
Crystal conditions were optimized to obtain the largest and most robust crystals (Figure 17) to achieve the
best diffraction quality possible at our home source. The crystal quality and size were found to be highly
dependent on the concentration of the PEG 3350 precipitant with an optimal concentration range of 18-
20% (Figure 17B).
Figure 17: Optimizing crystallization conditions for WT rcPEPCK. Crystal morphology
when grown at 14-16% PEG 3350 (A), 18-20% PEG 3350 (B), 22-24% PEG 3350 (C)
and 24-26% PEG 3350 (D). All crystals were observed using an Olympus SZX16
microscope.
A: 14-16%
PEG 3350
B: 18-20%
PEG 3350
C: 22-24%
PEG 3350
D: 24-26%
PEG 3350
100 µm 100 µm
100 µm 100 µm
29
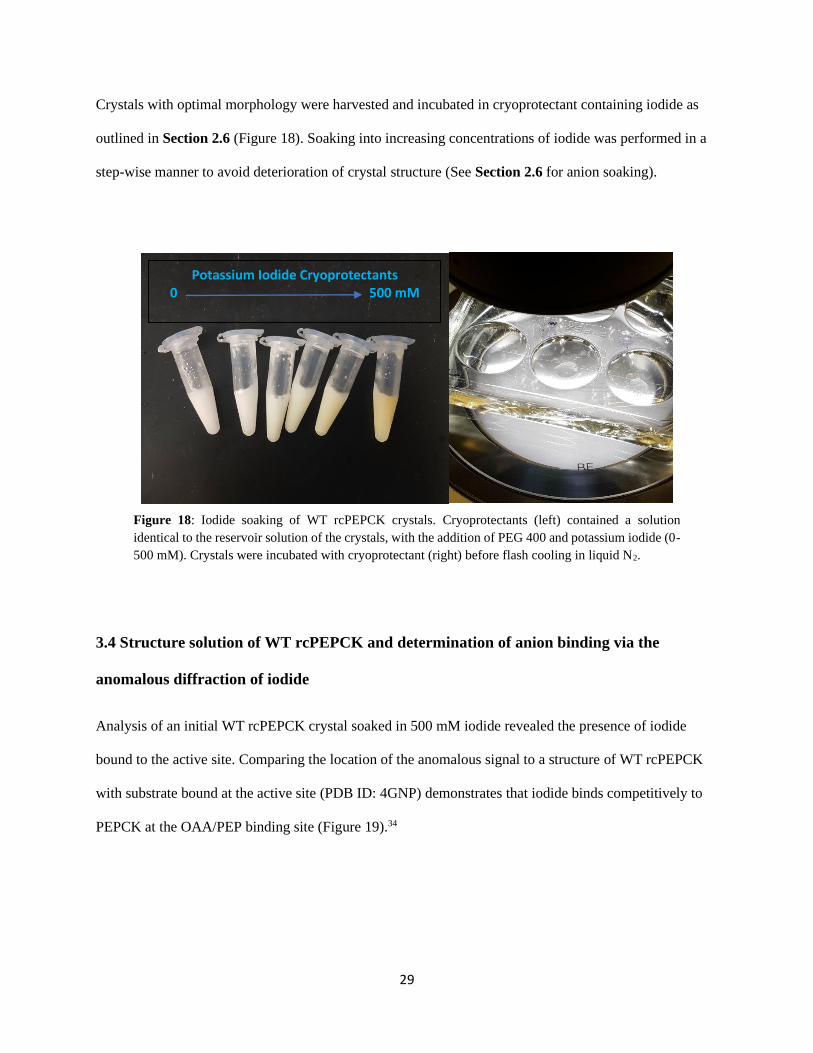
Crystals with optimal morphology were harvested and incubated in cryoprotectant containing iodide as
outlined in Section 2.6 (Figure 18). Soaking into increasing concentrations of iodide was performed in a
step-wise manner to avoid deterioration of crystal structure (See Section 2.6 for anion soaking).
Figure 18: Iodide soaking of WT rcPEPCK crystals. Cryoprotectants (left) contained a solution
identical to the reservoir solution of the crystals, with the addition of PEG 400 and potassium iodide (0-
500 mM). Crystals were incubated with cryoprotectant (right) before flash cooling in liquid N2.
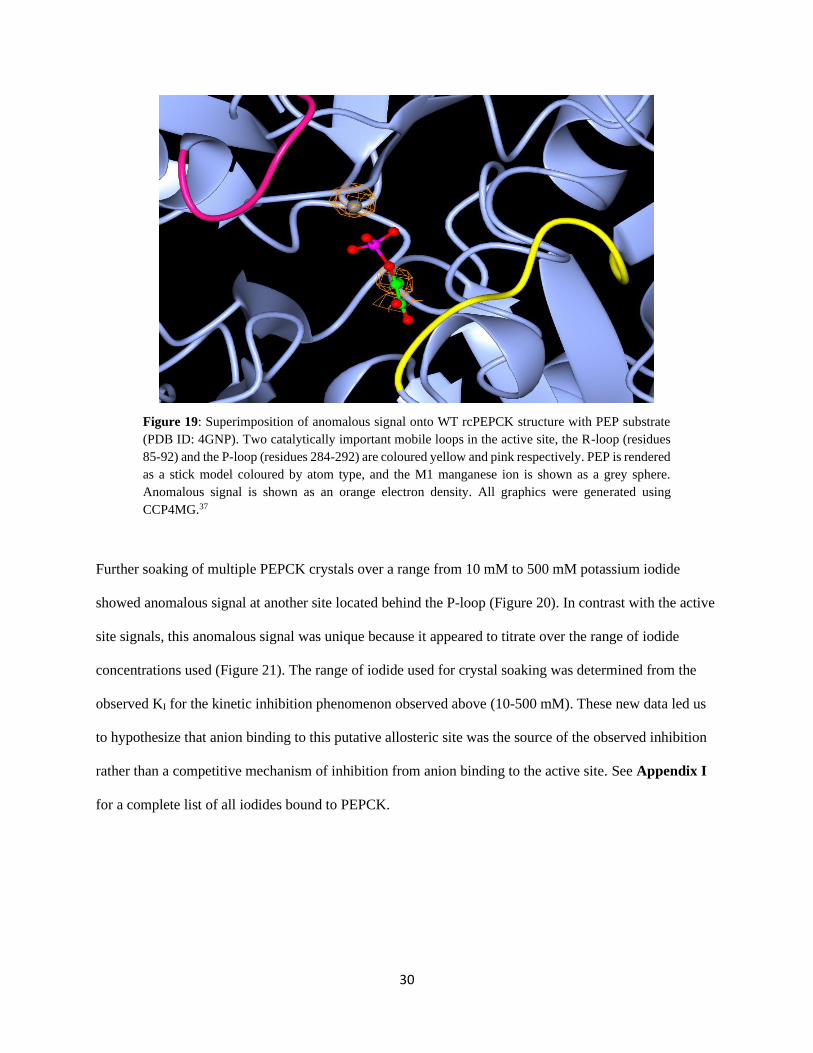
3.4 Structure solution of WT rcPEPCK and determination of anion binding via the
anomalous diffraction of iodide
Analysis of an initial WT rcPEPCK crystal soaked in 500 mM iodide revealed the presence of iodide
bound to the active site. Comparing the location of the anomalous signal to a structure of WT rcPEPCK
with substrate bound at the active site (PDB ID: 4GNP) demonstrates that iodide binds competitively to
PEPCK at the OAA/PEP binding site (Figure 19).34
Potassium Iodide Cryoprotectants 0 500 mM
30
Figure 19: Superimposition of anomalous signal onto WT rcPEPCK structure with PEP substrate
(PDB ID: 4GNP). Two catalytically important mobile loops in the active site, the R-loop (residues
85-92) and the P-loop (residues 284-292) are coloured yellow and pink respectively. PEP is rendered
as a stick model coloured by atom type, and the M1 manganese ion is shown as a grey sphere.
Anomalous signal is shown as an orange electron density. All graphics were generated using
CCP4MG.37
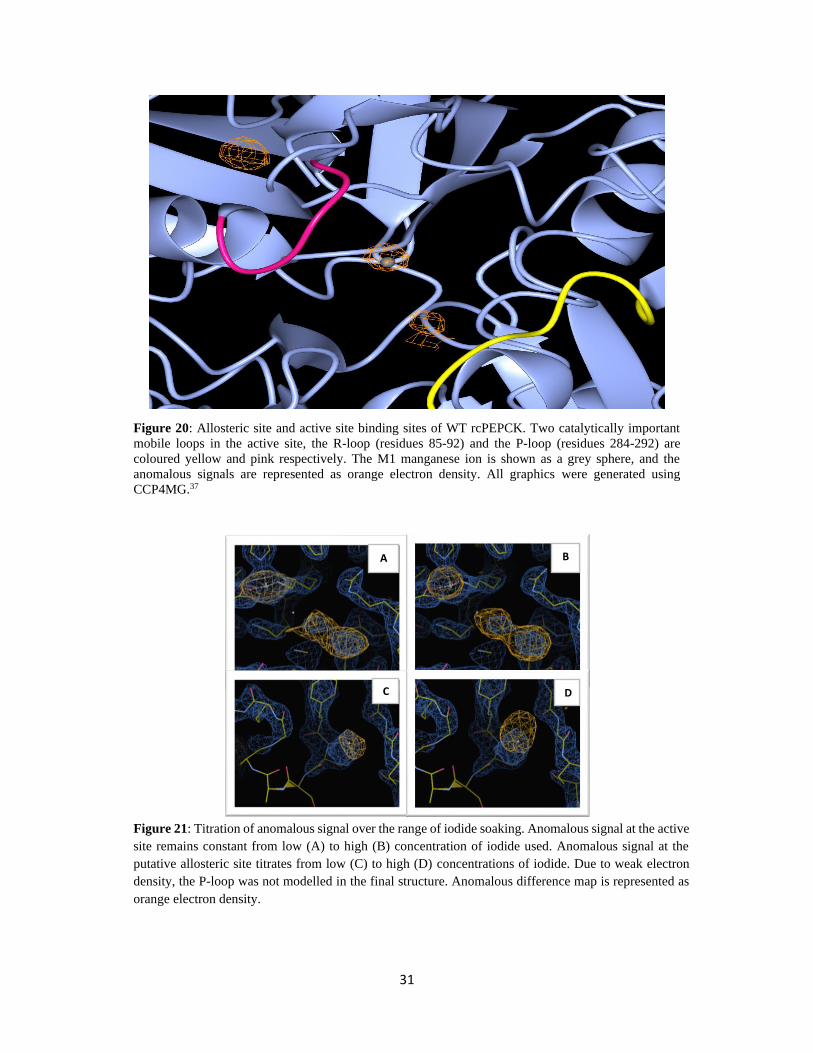
Further soaking of multiple PEPCK crystals over a range from 10 mM to 500 mM potassium iodide
showed anomalous signal at another site located behind the P-loop (Figure 20). In contrast with the active
site signals, this anomalous signal was unique because it appeared to titrate over the range of iodide
concentrations used (Figure 21). The range of iodide used for crystal soaking was determined from the
observed KI for the kinetic inhibition phenomenon observed above (10-500 mM). These new data led us
to hypothesize that anion binding to this putative allosteric site was the source of the observed inhibition
rather than a competitive mechanism of inhibition from anion binding to the active site. See Appendix I
for a complete list of all iodides bound to PEPCK.
31
Figure 20: Allosteric site and active site binding sites of WT rcPEPCK. Two catalytically important
mobile loops in the active site, the R-loop (residues 85-92) and the P-loop (residues 284-292) are
coloured yellow and pink respectively. The M1 manganese ion is shown as a grey sphere, and the
anomalous signals are represented as orange electron density. All graphics were generated using
CCP4MG.37
Figure 21: Titration of anomalous signal over the range of iodide soaking. Anomalous signal at the active
site remains constant from low (A) to high (B) concentration of iodide used. Anomalous signal at the
putative allosteric site titrates from low (C) to high (D) concentrations of iodide. Due to weak electron
density, the P-loop was not modelled in the final structure. Anomalous difference map is represented as
orange electron density.
A
C
B
D
32
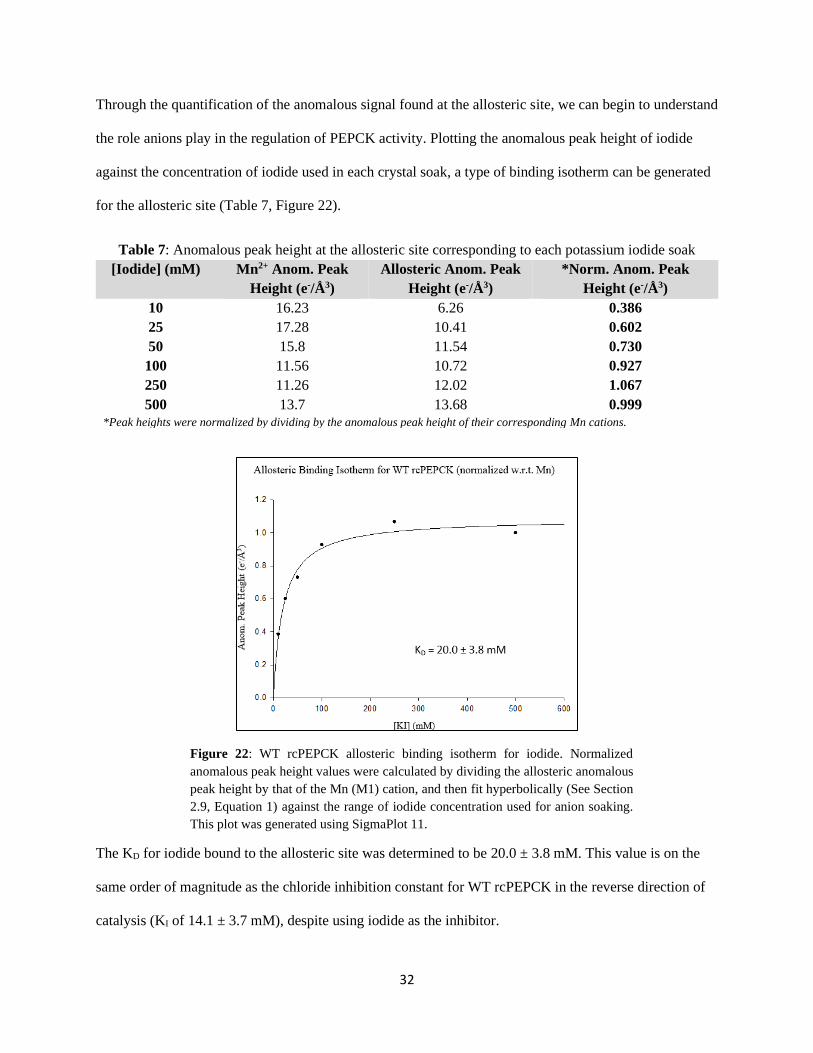
Through the quantification of the anomalous signal found at the allosteric site, we can begin to understand
the role anions play in the regulation of PEPCK activity. Plotting the anomalous peak height of iodide
against the concentration of iodide used in each crystal soak, a type of binding isotherm can be generated
for the allosteric site (Table 7, Figure 22).
Table 7: Anomalous peak height at the allosteric site corresponding to each potassium iodide soak
[Iodide] (mM) Mn2+ Anom. Peak
Height (e-/Å3)
Allosteric Anom. Peak
Height (e-/Å3)
*Norm. Anom. Peak
Height (e-/Å3)
10 16.23 6.26 0.386
25 17.28 10.41 0.602
50 15.8 11.54 0.730
100 11.56 10.72 0.927
250 11.26 12.02 1.067
500 13.7 13.68 0.999
*Peak heights were normalized by dividing by the anomalous peak height of their corresponding Mn cations.
Figure 22: WT rcPEPCK allosteric binding isotherm for iodide. Normalized
anomalous peak height values were calculated by dividing the allosteric anomalous
peak height by that of the Mn (M1) cation, and then fit hyperbolically (See Section
2.9, Equation 1) against the range of iodide concentration used for anion soaking.
This plot was generated using SigmaPlot 11.
The KD for iodide bound to the allosteric site was determined to be 20.0 ± 3.8 mM. This value is on the
same order of magnitude as the chloride inhibition constant for WT rcPEPCK in the reverse direction of
catalysis (KI of 14.1 ± 3.7 mM), despite using iodide as the inhibitor.
KD = 19.9 ± 1.9 mM
33
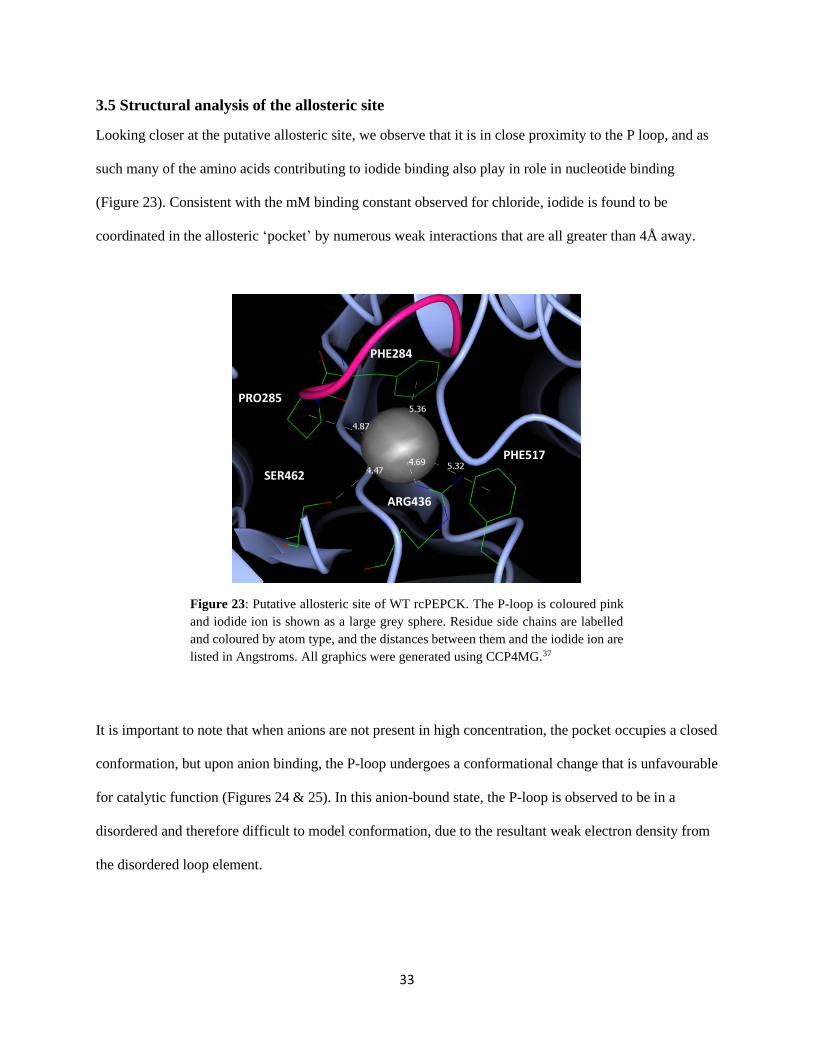
3.5 Structural analysis of the allosteric site
Looking closer at the putative allosteric site, we observe that it is in close proximity to the P loop, and as
such many of the amino acids contributing to iodide binding also play in role in nucleotide binding
(Figure 23). Consistent with the mM binding constant observed for chloride, iodide is found to be
coordinated in the allosteric ‘pocket’ by numerous weak interactions that are all greater than 4Å away.
Figure 23: Putative allosteric site of WT rcPEPCK. The P-loop is coloured pink
and iodide ion is shown as a large grey sphere. Residue side chains are labelled
and coloured by atom type, and the distances between them and the iodide ion are
listed in Angstroms. All graphics were generated using CCP4MG.37
It is important to note that when anions are not present in high concentration, the pocket occupies a closed
conformation, but upon anion binding, the P-loop undergoes a conformational change that is unfavourable
for catalytic function (Figures 24 & 25). In this anion-bound state, the P-loop is observed to be in a
disordered and therefore difficult to model conformation, due to the resultant weak electron density from
the disordered loop element.
PHE284
PRO285
PHE517
SER462
ARG436
34
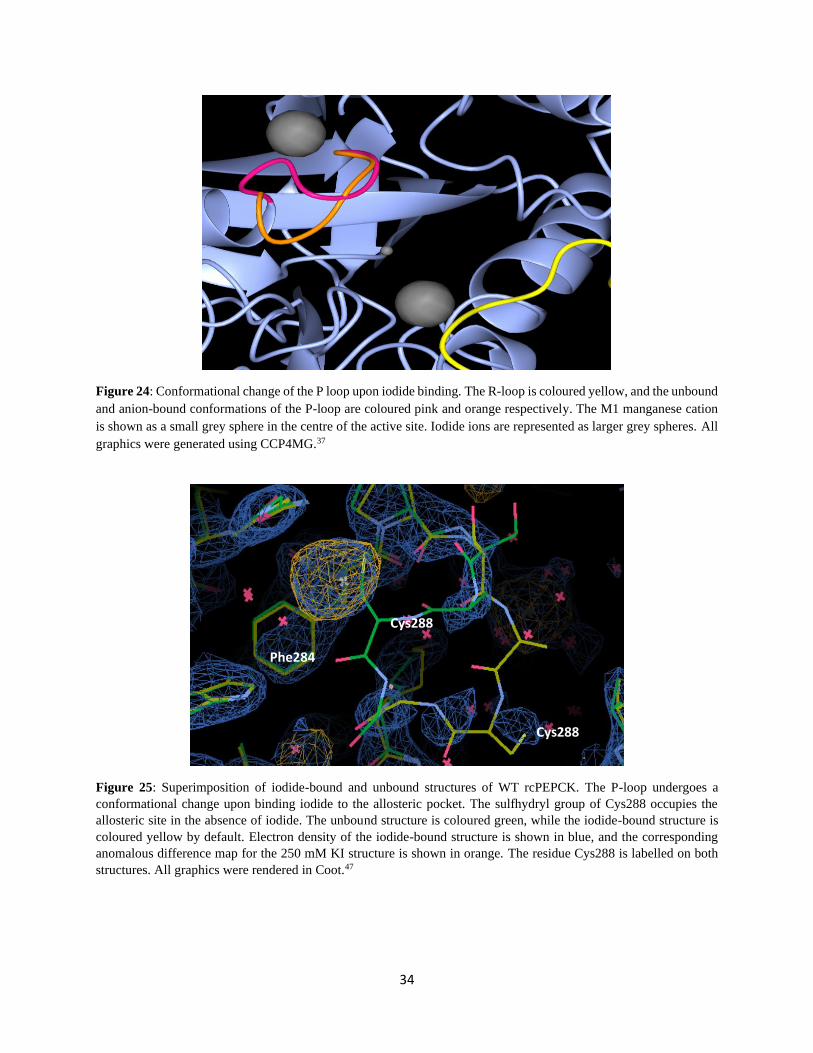
Figure 24: Conformational change of the P loop upon iodide binding. The R-loop is coloured yellow, and the unbound
and anion-bound conformations of the P-loop are coloured pink and orange respectively. The M1 manganese cation
is shown as a small grey sphere in the centre of the active site. Iodide ions are represented as larger grey spheres. All
graphics were generated using CCP4MG.37
Figure 25: Superimposition of iodide-bound and unbound structures of WT rcPEPCK. The P-loop undergoes a
conformational change upon binding iodide to the allosteric pocket. The sulfhydryl group of Cys288 occupies the
allosteric site in the absence of iodide. The unbound structure is coloured green, while the iodide-bound structure is
coloured yellow by default. Electron density of the iodide-bound structure is shown in blue, and the corresponding
anomalous difference map for the 250 mM KI structure is shown in orange. The residue Cys288 is labelled on both
structures. All graphics were rendered in Coot.47
Cys288
Cys288
Phe284
35
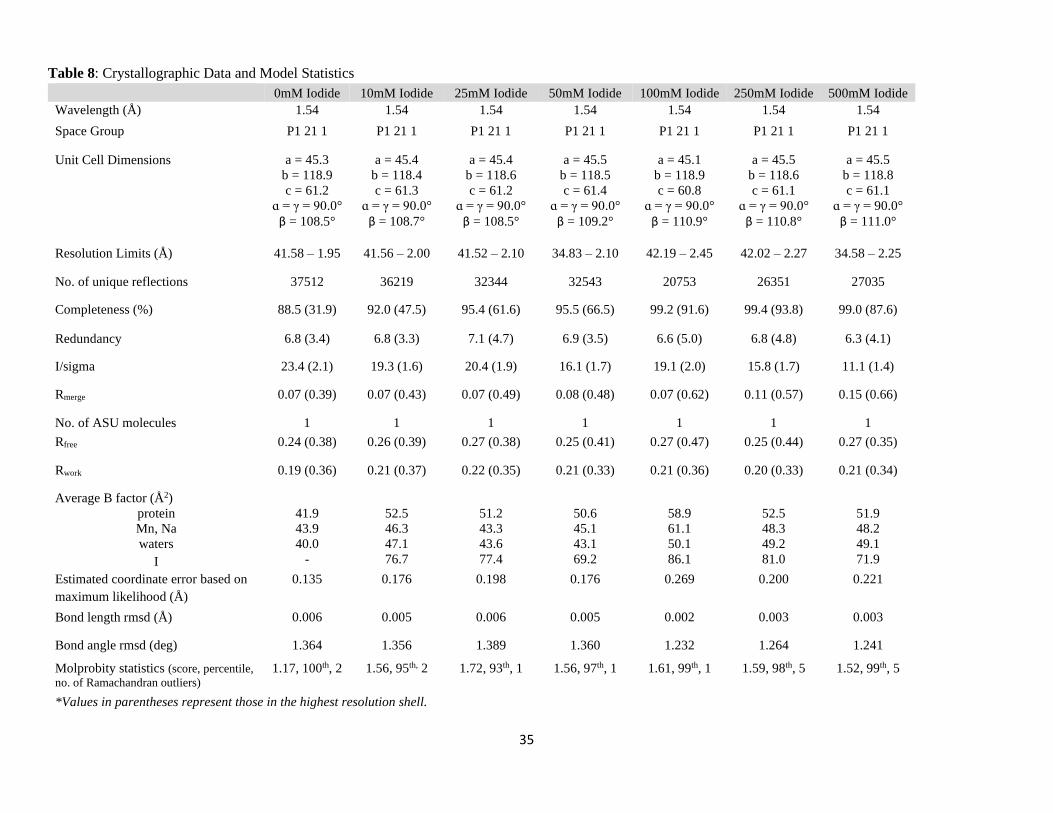
Table 8: Crystallographic Data and Model Statistics
0mM Iodide 10mM Iodide 25mM Iodide 50mM Iodide 100mM Iodide 250mM Iodide 500mM Iodide
Wavelength (Å) 1.54 1.54 1.54 1.54 1.54 1.54 1.54
Space Group P1 21 1 P1 21 1 P1 21 1 P1 21 1 P1 21 1 P1 21 1 P1 21 1
Unit Cell Dimensions a = 45.3
b = 118.9
c = 61.2
ɑ = γ = 90.0°
β = 108.5°
a = 45.4
b = 118.4
c = 61.3
ɑ = γ = 90.0°
β = 108.7°
a = 45.4
b = 118.6
c = 61.2
ɑ = γ = 90.0°
β = 108.5°
a = 45.5
b = 118.5
c = 61.4
ɑ = γ = 90.0°
β = 109.2°
a = 45.1
b = 118.9
c = 60.8
ɑ = γ = 90.0°
β = 110.9°
a = 45.5
b = 118.6
c = 61.1
ɑ = γ = 90.0°
β = 110.8°
a = 45.5
b = 118.8
c = 61.1
ɑ = γ = 90.0°
β = 111.0°
Resolution Limits (Å) 41.58 – 1.95 41.56 – 2.00 41.52 – 2.10 34.83 – 2.10 42.19 – 2.45 42.02 – 2.27 34.58 – 2.25
No. of unique reflections 37512 36219 32344 32543 20753 26351 27035
Completeness (%) 88.5 (31.9) 92.0 (47.5) 95.4 (61.6) 95.5 (66.5) 99.2 (91.6) 99.4 (93.8) 99.0 (87.6)
Redundancy 6.8 (3.4) 6.8 (3.3) 7.1 (4.7) 6.9 (3.5) 6.6 (5.0) 6.8 (4.8) 6.3 (4.1)
I/sigma 23.4 (2.1) 19.3 (1.6) 20.4 (1.9) 16.1 (1.7) 19.1 (2.0) 15.8 (1.7) 11.1 (1.4)
Rmerge 0.07 (0.39) 0.07 (0.43) 0.07 (0.49) 0.08 (0.48) 0.07 (0.62) 0.11 (0.57) 0.15 (0.66)
No. of ASU molecules 1 1 1 1 1 1 1
Rfree 0.24 (0.38) 0.26 (0.39) 0.27 (0.38) 0.25 (0.41) 0.27 (0.47) 0.25 (0.44) 0.27 (0.35)
Rwork 0.19 (0.36) 0.21 (0.37) 0.22 (0.35) 0.21 (0.33) 0.21 (0.36) 0.20 (0.33) 0.21 (0.34)
Average B factor (Å2)
protein
Mn, Na
waters
I
41.9
43.9
40.0
-
52.5
46.3
47.1
76.7
51.2
43.3
43.6
77.4
50.6
45.1
43.1
69.2
58.9
61.1
50.1
86.1
52.5
48.3
49.2
81.0
51.9
48.2
49.1
71.9
Estimated coordinate error based on
maximum likelihood (Å)
0.135 0.176 0.198 0.176 0.269 0.200 0.221
Bond length rmsd (Å) 0.006 0.005 0.006 0.005 0.002 0.003 0.003
Bond angle rmsd (deg) 1.364 1.356 1.389 1.360 1.232 1.264 1.241
Molprobity statistics (score, percentile,
no. of Ramachandran outliers) 1.17, 100th, 2 1.56, 95th, 2 1.72, 93th, 1 1.56, 97th, 1 1.61, 99th, 1 1.59, 98th, 5 1.52, 99th, 5
*Values in parentheses represent those in the highest resolution shell.
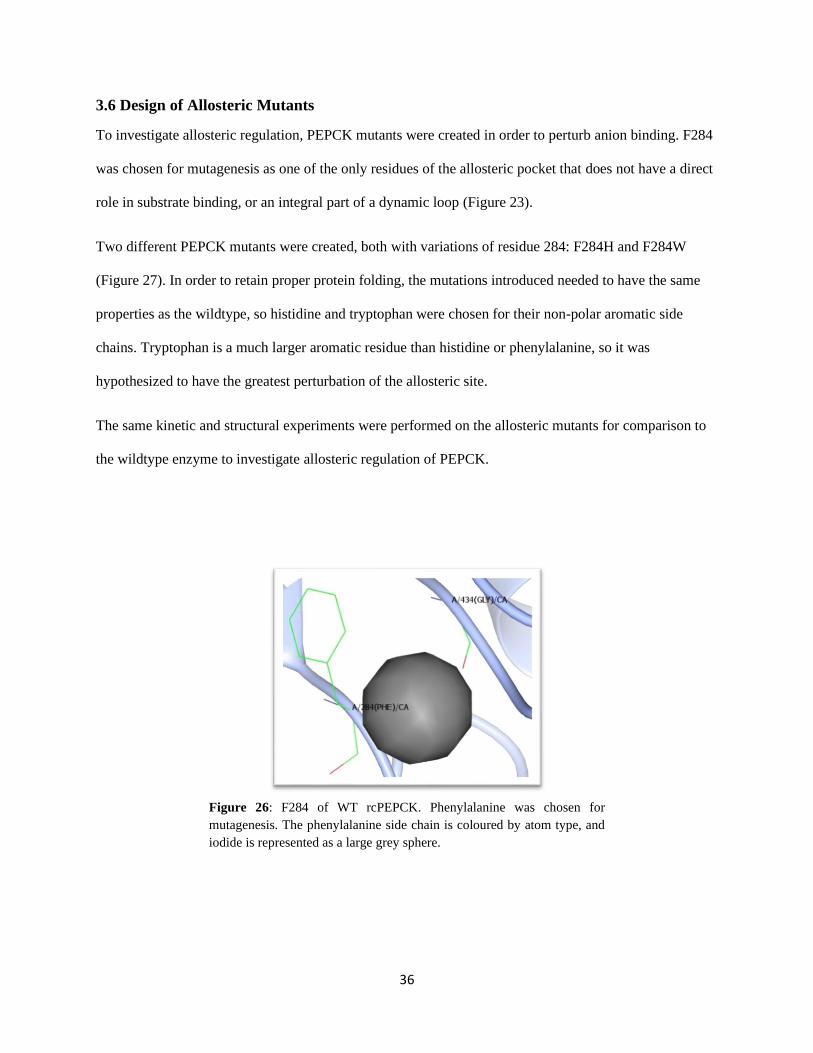
36
3.6 Design of Allosteric Mutants
To investigate allosteric regulation, PEPCK mutants were created in order to perturb anion binding. F284
was chosen for mutagenesis as one of the only residues of the allosteric pocket that does not have a direct
role in substrate binding, or an integral part of a dynamic loop (Figure 23).
Two different PEPCK mutants were created, both with variations of residue 284: F284H and F284W
(Figure 27). In order to retain proper protein folding, the mutations introduced needed to have the same
properties as the wildtype, so histidine and tryptophan were chosen for their non-polar aromatic side
chains. Tryptophan is a much larger aromatic residue than histidine or phenylalanine, so it was
hypothesized to have the greatest perturbation of the allosteric site.
The same kinetic and structural experiments were performed on the allosteric mutants for comparison to
the wildtype enzyme to investigate allosteric regulation of PEPCK.
Figure 26: F284 of WT rcPEPCK. Phenylalanine was chosen for
mutagenesis. The phenylalanine side chain is coloured by atom type, and
iodide is represented as a large grey sphere.
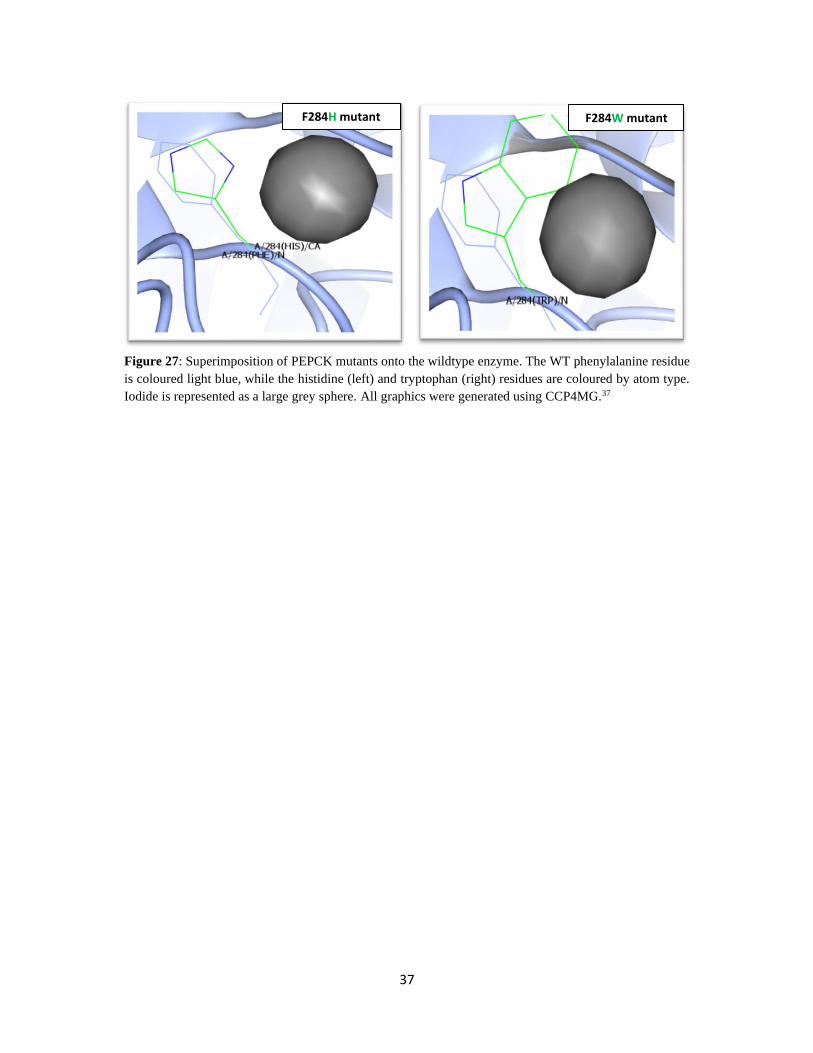
37
Figure 27: Superimposition of PEPCK mutants onto the wildtype enzyme. The WT phenylalanine residue
is coloured light blue, while the histidine (left) and tryptophan (right) residues are coloured by atom type.
Iodide is represented as a large grey sphere. All graphics were generated using CCP4MG.37
F284H mutant F284W mutant
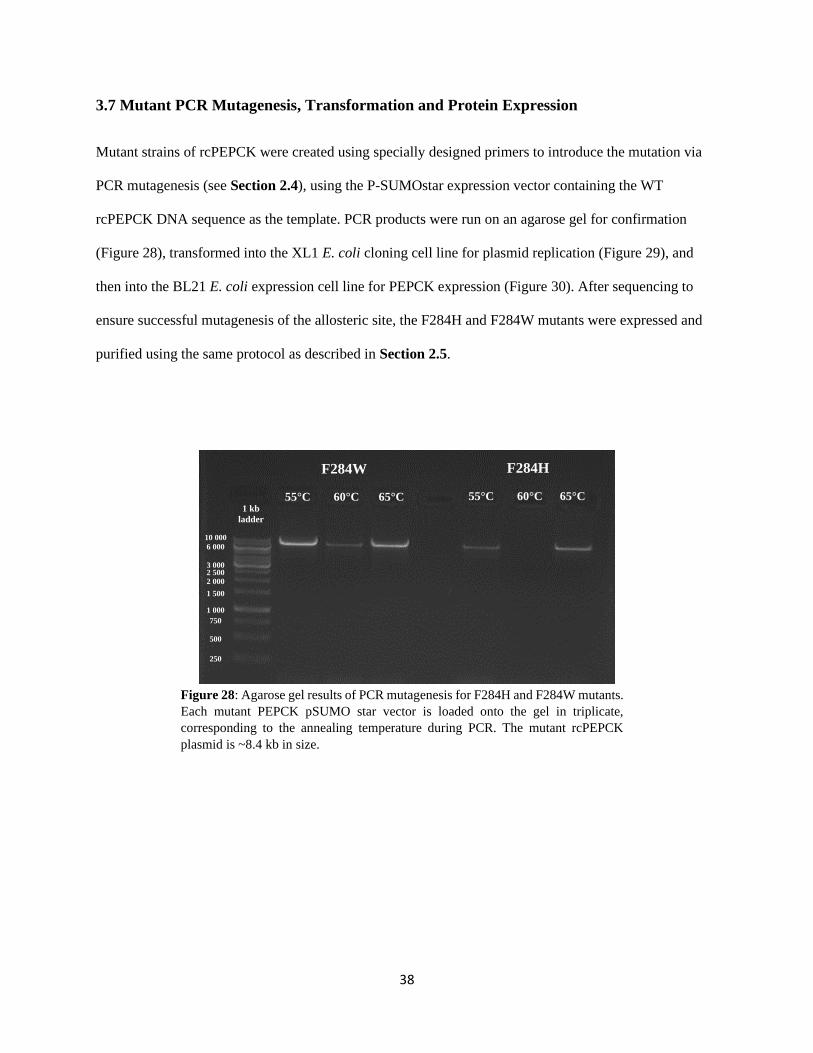
38
3.7 Mutant PCR Mutagenesis, Transformation and Protein Expression
Mutant strains of rcPEPCK were created using specially designed primers to introduce the mutation via
PCR mutagenesis (see Section 2.4), using the P-SUMOstar expression vector containing the WT
rcPEPCK DNA sequence as the template. PCR products were run on an agarose gel for confirmation
(Figure 28), transformed into the XL1 E. coli cloning cell line for plasmid replication (Figure 29), and
then into the BL21 E. coli expression cell line for PEPCK expression (Figure 30). After sequencing to
ensure successful mutagenesis of the allosteric site, the F284H and F284W mutants were expressed and
purified using the same protocol as described in Section 2.5.
Figure 28: Agarose gel results of PCR mutagenesis for F284H and F284W mutants.
Each mutant PEPCK pSUMO star vector is loaded onto the gel in triplicate,
corresponding to the annealing temperature during PCR. The mutant rcPEPCK
plasmid is ~8.4 kb in size.
F284H F284W
55°C 55°C 60°C 60°C 65°C 65°C 1 kb
ladder
1 000
750
500
250
10 000
6 000
3 000 2 500
2 000
1 500
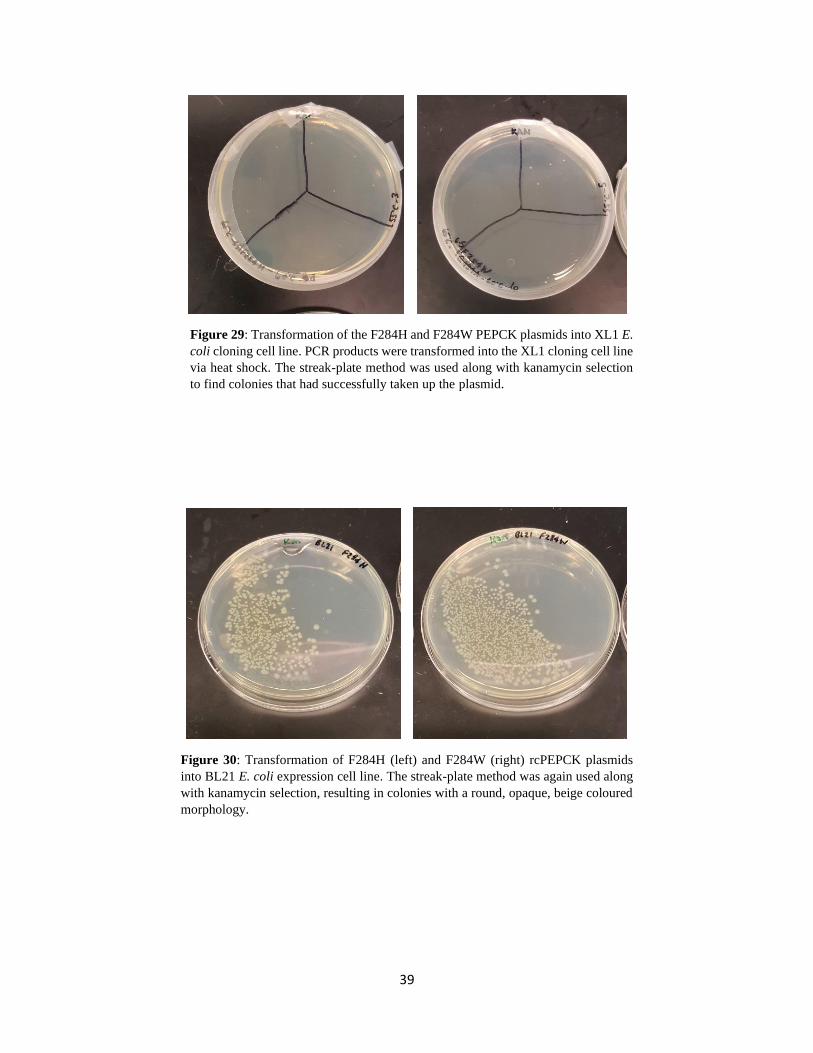
39
Figure 29: Transformation of the F284H and F284W PEPCK plasmids into XL1 E.
coli cloning cell line. PCR products were transformed into the XL1 cloning cell line
via heat shock. The streak-plate method was used along with kanamycin selection
to find colonies that had successfully taken up the plasmid.
Figure 30: Transformation of F284H (left) and F284W (right) rcPEPCK plasmids
into BL21 E. coli expression cell line. The streak-plate method was again used along
with kanamycin selection, resulting in colonies with a round, opaque, beige coloured
morphology.
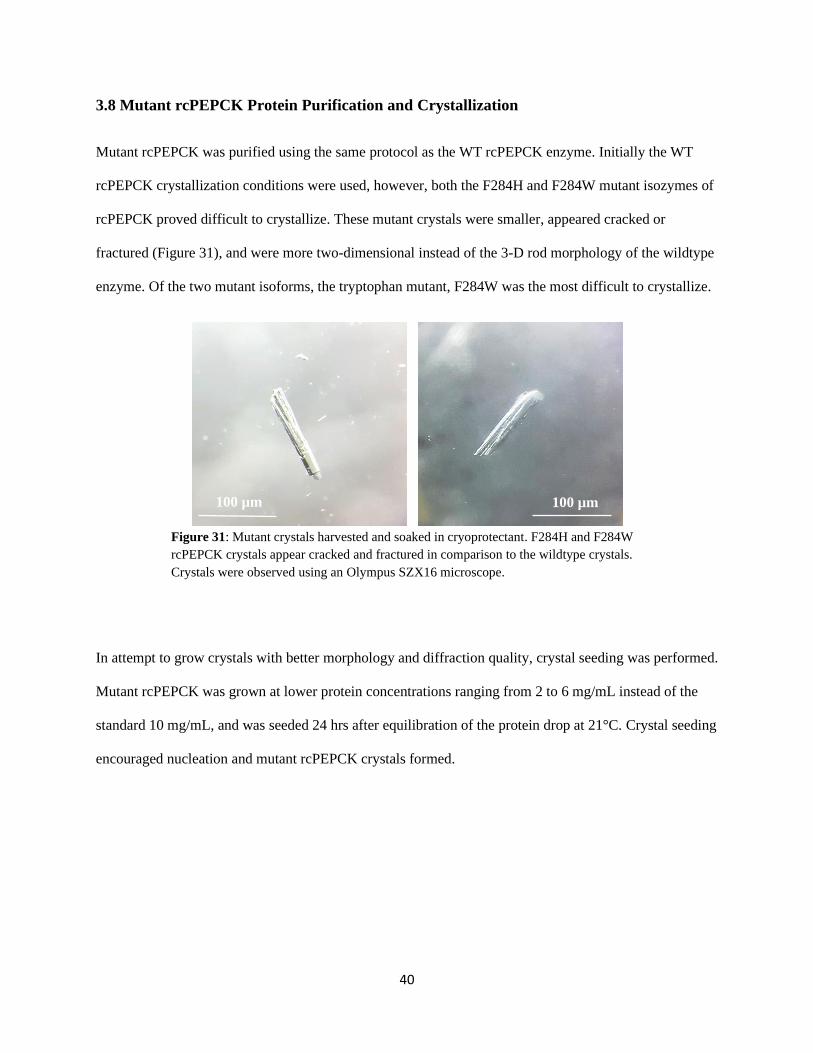
40
3.8 Mutant rcPEPCK Protein Purification and Crystallization
Mutant rcPEPCK was purified using the same protocol as the WT rcPEPCK enzyme. Initially the WT
rcPEPCK crystallization conditions were used, however, both the F284H and F284W mutant isozymes of
rcPEPCK proved difficult to crystallize. These mutant crystals were smaller, appeared cracked or
fractured (Figure 31), and were more two-dimensional instead of the 3-D rod morphology of the wildtype
enzyme. Of the two mutant isoforms, the tryptophan mutant, F284W was the most difficult to crystallize.
Figure 31: Mutant crystals harvested and soaked in cryoprotectant. F284H and F284W
rcPEPCK crystals appear cracked and fractured in comparison to the wildtype crystals.
Crystals were observed using an Olympus SZX16 microscope.
In attempt to grow crystals with better morphology and diffraction quality, crystal seeding was performed.
Mutant rcPEPCK was grown at lower protein concentrations ranging from 2 to 6 mg/mL instead of the
standard 10 mg/mL, and was seeded 24 hrs after equilibration of the protein drop at 21°C. Crystal seeding
encouraged nucleation and mutant rcPEPCK crystals formed.
100 µm 100 µm
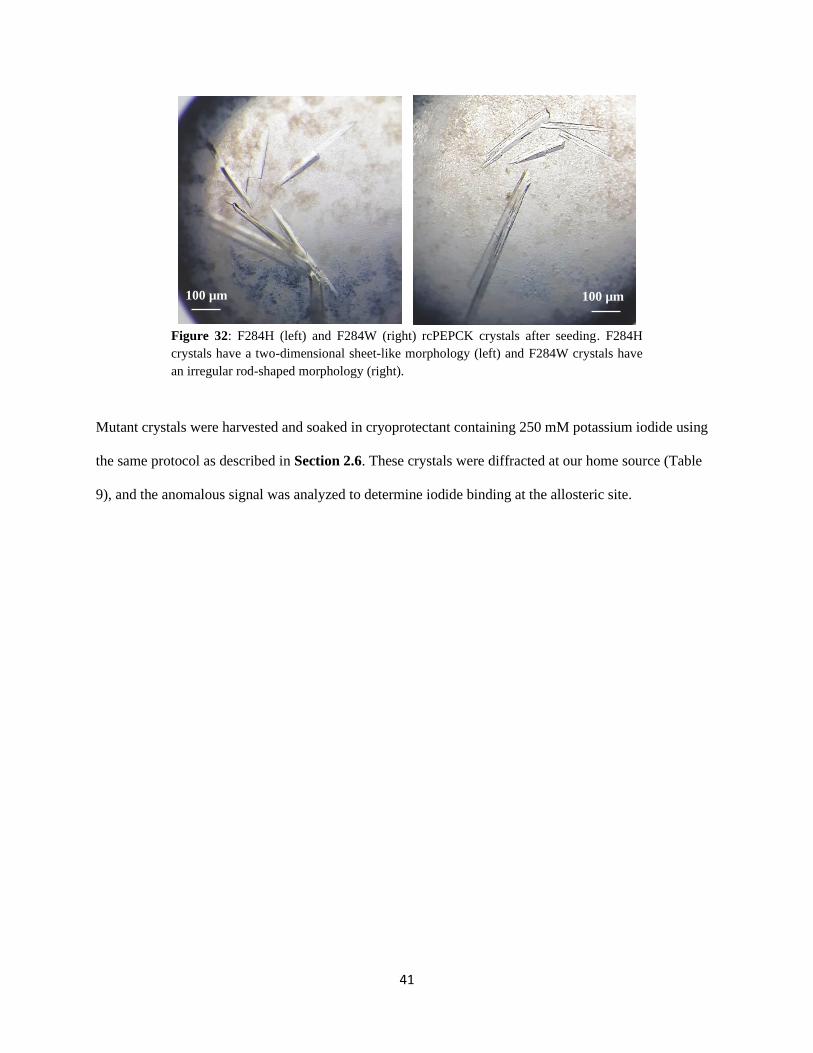
41
Figure 32: F284H (left) and F284W (right) rcPEPCK crystals after seeding. F284H
crystals have a two-dimensional sheet-like morphology (left) and F284W crystals have
an irregular rod-shaped morphology (right).
Mutant crystals were harvested and soaked in cryoprotectant containing 250 mM potassium iodide using
the same protocol as described in Section 2.6. These crystals were diffracted at our home source (Table
9), and the anomalous signal was analyzed to determine iodide binding at the allosteric site.
100 µm 100 µm
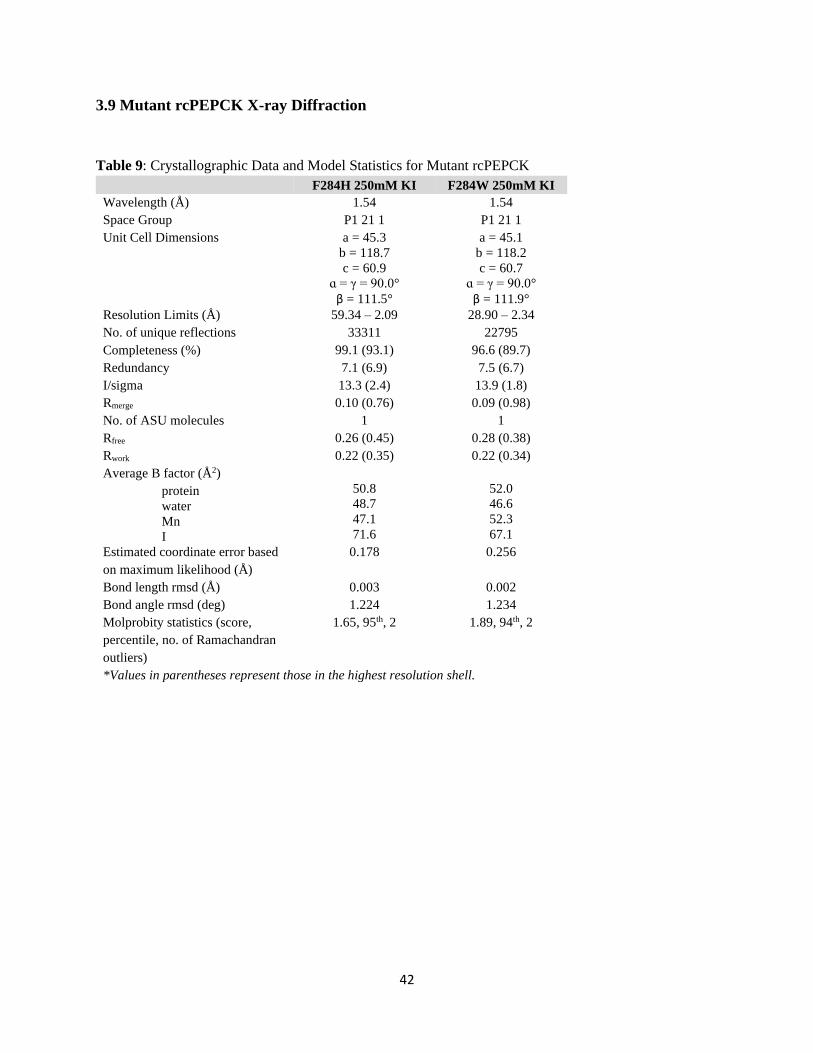
42
3.9 Mutant rcPEPCK X-ray Diffraction
Table 9: Crystallographic Data and Model Statistics for Mutant rcPEPCK
F284H 250mM KI F284W 250mM KI
Wavelength (Å) 1.54 1.54
Space Group P1 21 1 P1 21 1
Unit Cell Dimensions a = 45.3
b = 118.7
c = 60.9
ɑ = γ = 90.0°
β = 111.5°
a = 45.1
b = 118.2
c = 60.7
ɑ = γ = 90.0°
β = 111.9°
Resolution Limits (Å) 59.34 – 2.09 28.90 – 2.34
No. of unique reflections 33311 22795
Completeness (%) 99.1 (93.1) 96.6 (89.7)
Redundancy 7.1 (6.9) 7.5 (6.7)
I/sigma 13.3 (2.4) 13.9 (1.8)
Rmerge 0.10 (0.76) 0.09 (0.98)
No. of ASU molecules 1 1
Rfree 0.26 (0.45) 0.28 (0.38)
Rwork 0.22 (0.35) 0.22 (0.34)
Average B factor (Å2)
protein
water
Mn
I
50.8
48.7
47.1
71.6
52.0
46.6
52.3
67.1
Estimated coordinate error based
on maximum likelihood (Å)
0.178 0.256
Bond length rmsd (Å) 0.003 0.002
Bond angle rmsd (deg) 1.224 1.234
Molprobity statistics (score,
percentile, no. of Ramachandran
outliers)
1.65, 95th, 2 1.89, 94th, 2
*Values in parentheses represent those in the highest resolution shell.
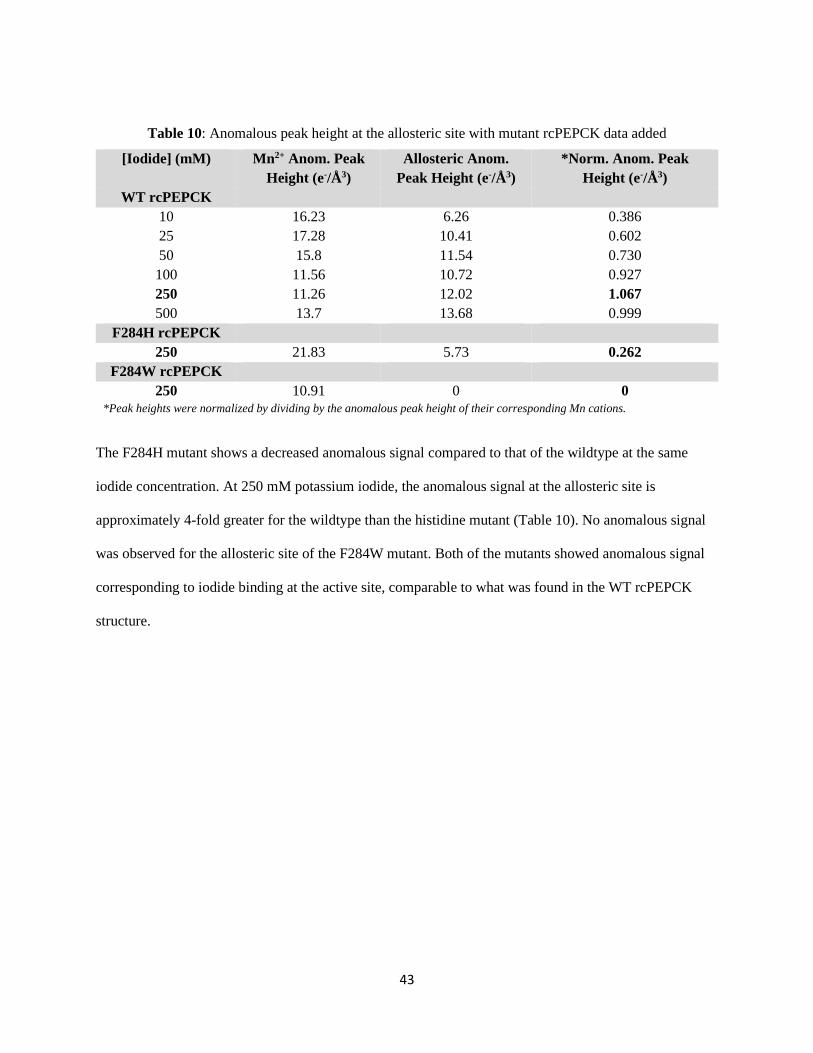
43
Table 10: Anomalous peak height at the allosteric site with mutant rcPEPCK data added
[Iodide] (mM) Mn2+ Anom. Peak
Height (e-/Å3)
Allosteric Anom.
Peak Height (e-/Å3)
*Norm. Anom. Peak
Height (e-/Å3)
WT rcPEPCK
10 16.23 6.26 0.386
25 17.28 10.41 0.602
50 15.8 11.54 0.730
100 11.56 10.72 0.927
250 11.26 12.02 1.067
500 13.7 13.68 0.999
F284H rcPEPCK
250 21.83 5.73 0.262
F284W rcPEPCK
250 10.91 0 0
*Peak heights were normalized by dividing by the anomalous peak height of their corresponding Mn cations.
The F284H mutant shows a decreased anomalous signal compared to that of the wildtype at the same
iodide concentration. At 250 mM potassium iodide, the anomalous signal at the allosteric site is
approximately 4-fold greater for the wildtype than the histidine mutant (Table 10). No anomalous signal
was observed for the allosteric site of the F284W mutant. Both of the mutants showed anomalous signal
corresponding to iodide binding at the active site, comparable to what was found in the WT rcPEPCK
structure.
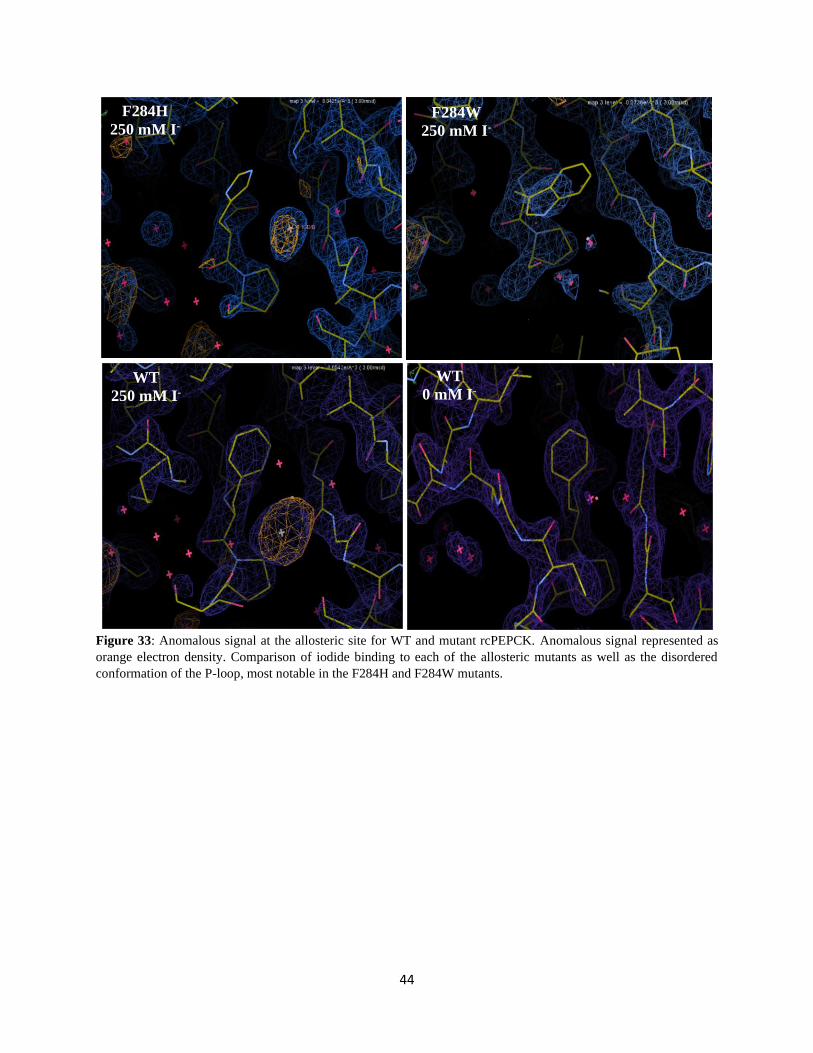
44
Figure 33: Anomalous signal at the allosteric site for WT and mutant rcPEPCK. Anomalous signal represented as
orange electron density. Comparison of iodide binding to each of the allosteric mutants as well as the disordered
conformation of the P-loop, most notable in the F284H and F284W mutants.
F284H
250 mM I- F284W
250 mM I-
WT
250 mM I-
WT
0 mM I-
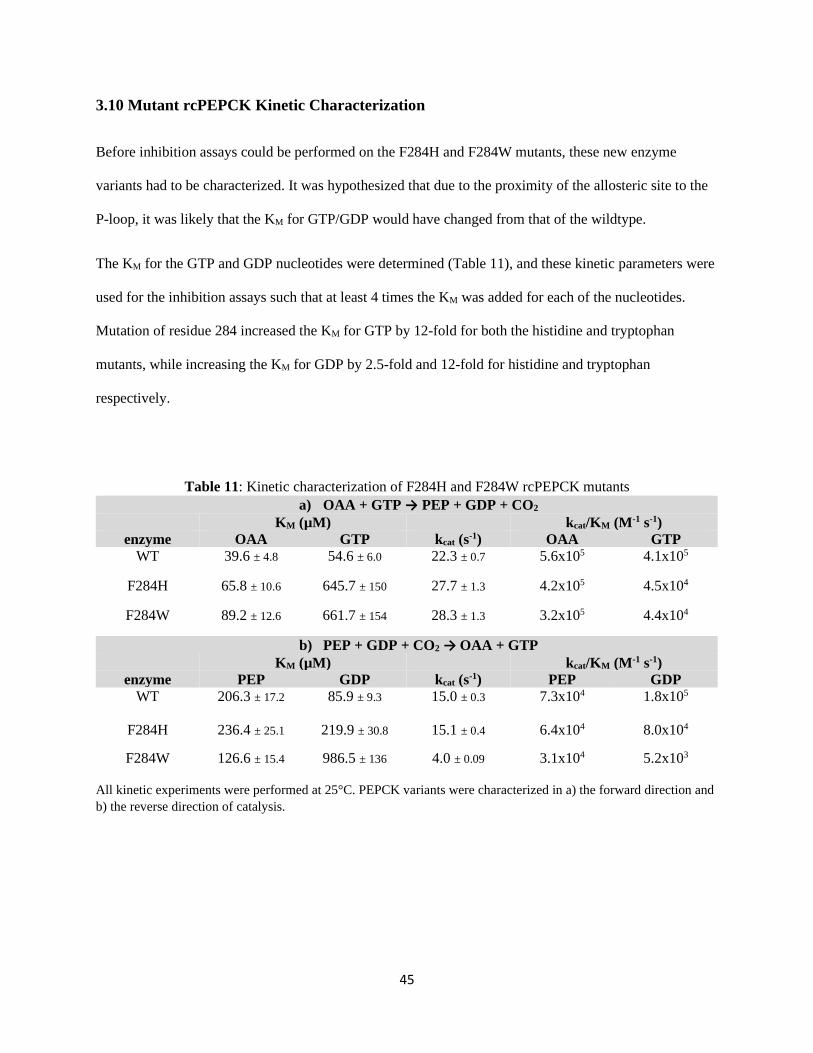
45
3.10 Mutant rcPEPCK Kinetic Characterization
Before inhibition assays could be performed on the F284H and F284W mutants, these new enzyme
variants had to be characterized. It was hypothesized that due to the proximity of the allosteric site to the
P-loop, it was likely that the KM for GTP/GDP would have changed from that of the wildtype.
The KM for the GTP and GDP nucleotides were determined (Table 11), and these kinetic parameters were
used for the inhibition assays such that at least 4 times the KM was added for each of the nucleotides.
Mutation of residue 284 increased the KM for GTP by 12-fold for both the histidine and tryptophan
mutants, while increasing the KM for GDP by 2.5-fold and 12-fold for histidine and tryptophan
respectively.
Table 11: Kinetic characterization of F284H and F284W rcPEPCK mutants
a) OAA + GTP → PEP + GDP + CO2
KM (µM) kcat/KM (M-1 s-1)
enzyme OAA GTP kcat (s-1) OAA GTP
WT 39.6 ± 4.8 54.6 ± 6.0 22.3 ± 0.7 5.6x10⁵ 4.1x10⁵
F284H 65.8 ± 10.6 645.7 ± 150 27.7 ± 1.3 4.2x10⁵ 4.5x10⁴
F284W 89.2 ± 12.6 661.7 ± 154 28.3 ± 1.3 3.2x10⁵ 4.4x10⁴
b) PEP + GDP + CO2 → OAA + GTP
KM (µM) kcat/KM (M-1 s-1)
enzyme PEP GDP kcat (s-1) PEP GDP
WT 206.3 ± 17.2 85.9 ± 9.3 15.0 ± 0.3 7.3x10⁴ 1.8x10⁵
F284H 236.4 ± 25.1 219.9 ± 30.8 15.1 ± 0.4 6.4x10⁴ 8.0x10⁴
F284W 126.6 ± 15.4 986.5 ± 136 4.0 ± 0.09 3.1x10⁴ 5.2x10³
All kinetic experiments were performed at 25°C. PEPCK variants were characterized in a) the forward direction and
b) the reverse direction of catalysis.
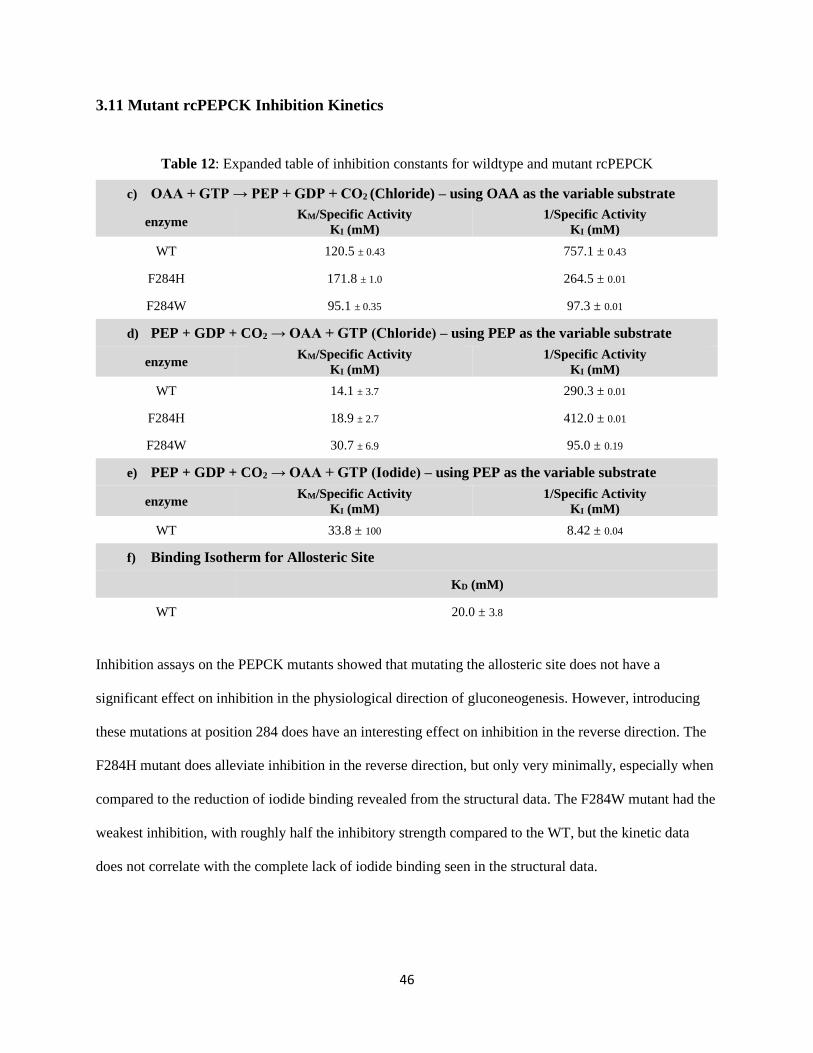
46
3.11 Mutant rcPEPCK Inhibition Kinetics
Table 12: Expanded table of inhibition constants for wildtype and mutant rcPEPCK
c) OAA + GTP → PEP + GDP + CO2 (Chloride) – using OAA as the variable substrate
enzyme KM/Specific Activity
KI (mM)
1/Specific Activity
KI (mM)
WT 120.5 ± 0.43 757.1 ± 0.43
F284H 171.8 ± 1.0 264.5 ± 0.01
F284W 95.1 ± 0.35 97.3 ± 0.01
d) PEP + GDP + CO2 → OAA + GTP (Chloride) – using PEP as the variable substrate
enzyme KM/Specific Activity
KI (mM)
1/Specific Activity
KI (mM)
WT 14.1 ± 3.7 290.3 ± 0.01
F284H 18.9 ± 2.7 412.0 ± 0.01
F284W 30.7 ± 6.9 95.0 ± 0.19
e) PEP + GDP + CO2 → OAA + GTP (Iodide) – using PEP as the variable substrate
enzyme KM/Specific Activity
KI (mM)
1/Specific Activity
KI (mM)
WT 33.8 ± 100 8.42 ± 0.04
f) Binding Isotherm for Allosteric Site
KD (mM)
WT 20.0 ± 3.8
Inhibition assays on the PEPCK mutants showed that mutating the allosteric site does not have a
significant effect on inhibition in the physiological direction of gluconeogenesis. However, introducing
these mutations at position 284 does have an interesting effect on inhibition in the reverse direction. The
F284H mutant does alleviate inhibition in the reverse direction, but only very minimally, especially when
compared to the reduction of iodide binding revealed from the structural data. The F284W mutant had the
weakest inhibition, with roughly half the inhibitory strength compared to the WT, but the kinetic data
does not correlate with the complete lack of iodide binding seen in the structural data.
47
There is a notable discrepancy between the kinetic and structural data due to the use of two different
anions: chloride for the kinetic inhibition assays, and iodide for the structural approach. To attempt to tie
the data together, the kinetic inhibition assays were repeated on the WT rcPEPCK enzyme, this time using
iodide. The inhibition constant was determined for iodide in the reverse direction, and was compared to
its chloride counterpart. It was discovered that chloride is the stronger competitive inhibitor (KI of 14.1
mM)(Figure H1) and despite being the smaller of the two anions, chloride is approximately twice as
effective at inhibiting PEPCK activity compared to iodide (KI of 33.8 mM)(Figure H7).
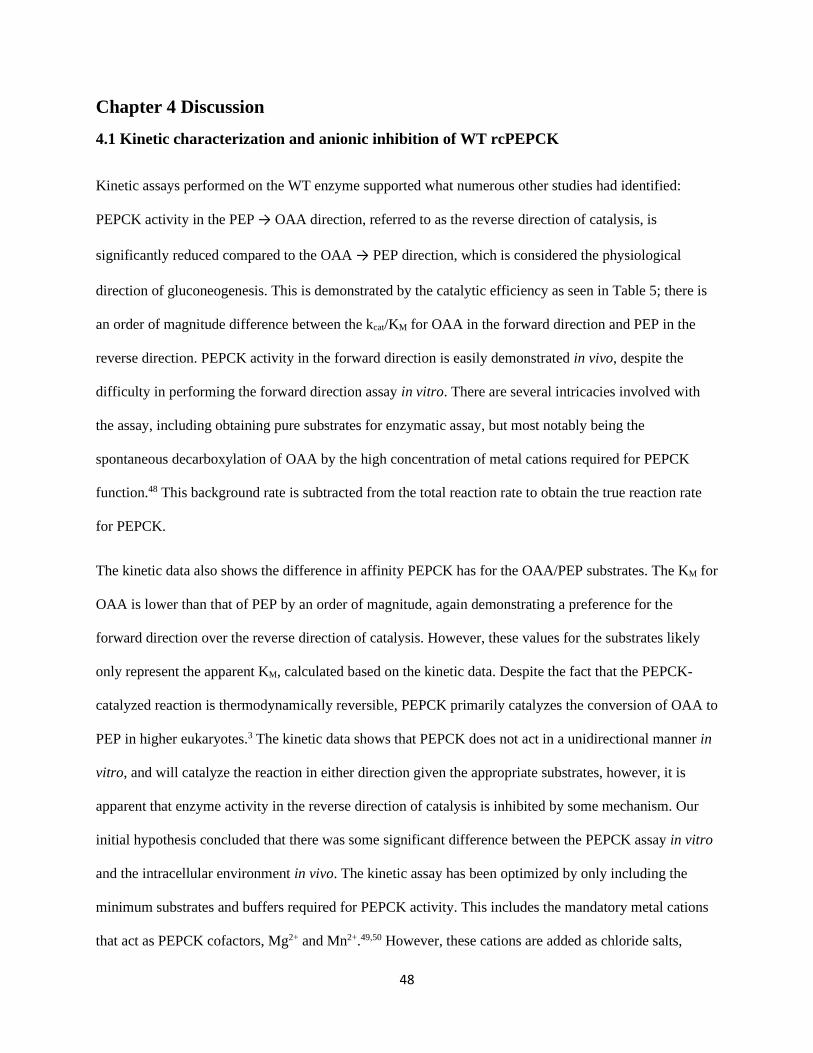
48
Chapter 4 Discussion
4.1 Kinetic characterization and anionic inhibition of WT rcPEPCK
Kinetic assays performed on the WT enzyme supported what numerous other studies had identified:
PEPCK activity in the PEP → OAA direction, referred to as the reverse direction of catalysis, is
significantly reduced compared to the OAA → PEP direction, which is considered the physiological
direction of gluconeogenesis. This is demonstrated by the catalytic efficiency as seen in Table 5; there is
an order of magnitude difference between the kcat/KM for OAA in the forward direction and PEP in the
reverse direction. PEPCK activity in the forward direction is easily demonstrated in vivo, despite the
difficulty in performing the forward direction assay in vitro. There are several intricacies involved with
the assay, including obtaining pure substrates for enzymatic assay, but most notably being the
spontaneous decarboxylation of OAA by the high concentration of metal cations required for PEPCK
function.48 This background rate is subtracted from the total reaction rate to obtain the true reaction rate
for PEPCK.
The kinetic data also shows the difference in affinity PEPCK has for the OAA/PEP substrates. The KM for
OAA is lower than that of PEP by an order of magnitude, again demonstrating a preference for the
forward direction over the reverse direction of catalysis. However, these values for the substrates likely
only represent the apparent KM, calculated based on the kinetic data. Despite the fact that the PEPCK-
catalyzed reaction is thermodynamically reversible, PEPCK primarily catalyzes the conversion of OAA to
PEP in higher eukaryotes.3 The kinetic data shows that PEPCK does not act in a unidirectional manner in
vitro, and will catalyze the reaction in either direction given the appropriate substrates, however, it is
apparent that enzyme activity in the reverse direction of catalysis is inhibited by some mechanism. Our
initial hypothesis concluded that there was some significant difference between the PEPCK assay in vitro
and the intracellular environment in vivo. The kinetic assay has been optimized by only including the
minimum substrates and buffers required for PEPCK activity. This includes the mandatory metal cations
that act as PEPCK cofactors, Mg2+ and Mn2+.49,50 However, these cations are added as chloride salts,
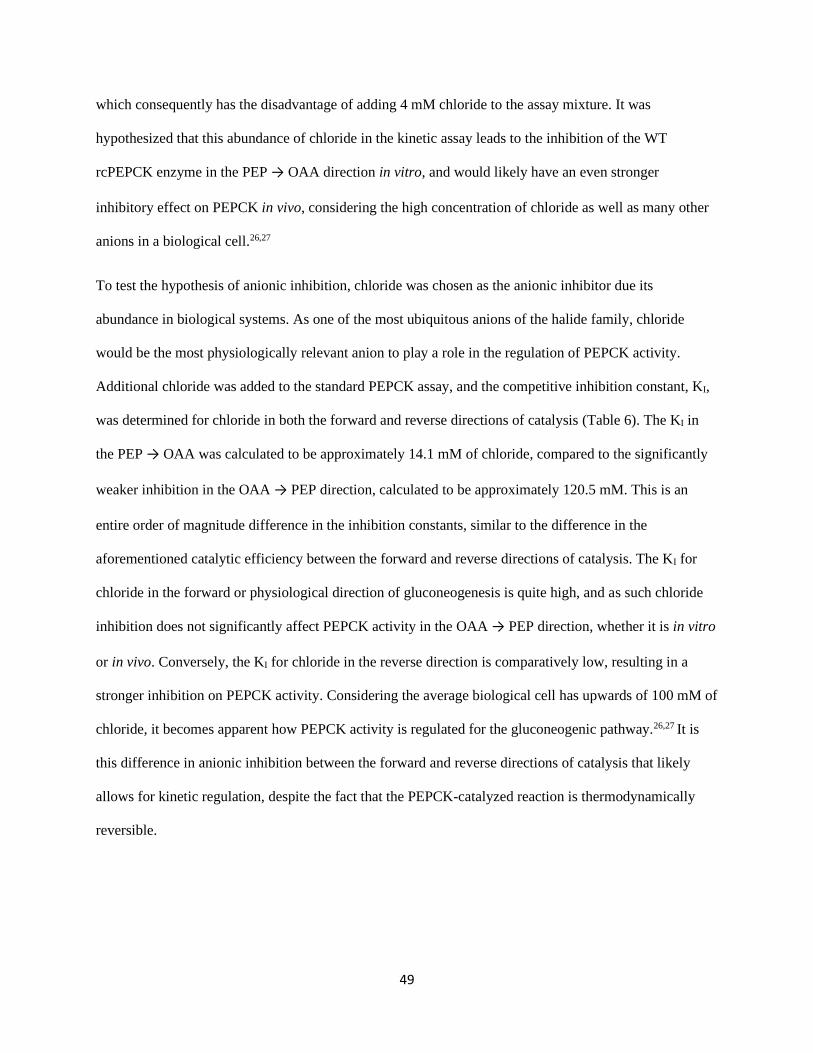
49
which consequently has the disadvantage of adding 4 mM chloride to the assay mixture. It was
hypothesized that this abundance of chloride in the kinetic assay leads to the inhibition of the WT
rcPEPCK enzyme in the PEP → OAA direction in vitro, and would likely have an even stronger
inhibitory effect on PEPCK in vivo, considering the high concentration of chloride as well as many other
anions in a biological cell.26,27
To test the hypothesis of anionic inhibition, chloride was chosen as the anionic inhibitor due its
abundance in biological systems. As one of the most ubiquitous anions of the halide family, chloride
would be the most physiologically relevant anion to play a role in the regulation of PEPCK activity.
Additional chloride was added to the standard PEPCK assay, and the competitive inhibition constant, KI,
was determined for chloride in both the forward and reverse directions of catalysis (Table 6). The KI in
the PEP → OAA was calculated to be approximately 14.1 mM of chloride, compared to the significantly
weaker inhibition in the OAA → PEP direction, calculated to be approximately 120.5 mM. This is an
entire order of magnitude difference in the inhibition constants, similar to the difference in the
aforementioned catalytic efficiency between the forward and reverse directions of catalysis. The KI for
chloride in the forward or physiological direction of gluconeogenesis is quite high, and as such chloride
inhibition does not significantly affect PEPCK activity in the OAA → PEP direction, whether it is in vitro
or in vivo. Conversely, the KI for chloride in the reverse direction is comparatively low, resulting in a
stronger inhibition on PEPCK activity. Considering the average biological cell has upwards of 100 mM of
chloride, it becomes apparent how PEPCK activity is regulated for the gluconeogenic pathway.26,27 It is
this difference in anionic inhibition between the forward and reverse directions of catalysis that likely
allows for kinetic regulation, despite the fact that the PEPCK-catalyzed reaction is thermodynamically
reversible.
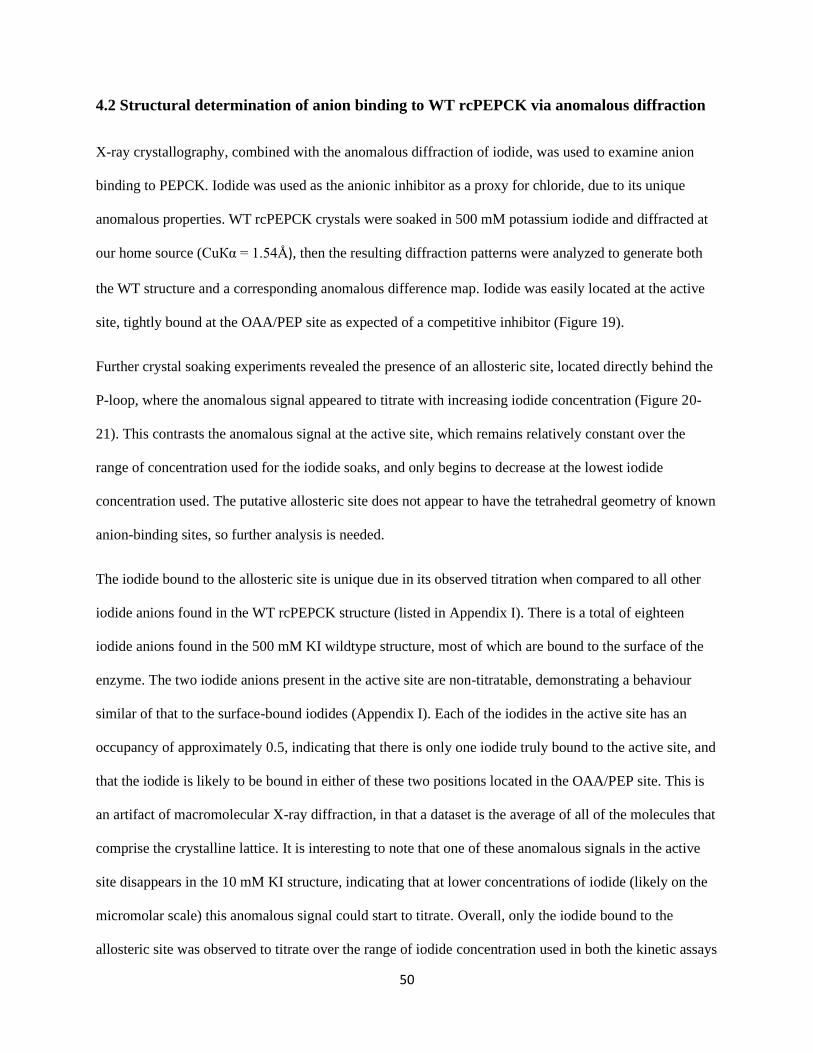
50
4.2 Structural determination of anion binding to WT rcPEPCK via anomalous diffraction
X-ray crystallography, combined with the anomalous diffraction of iodide, was used to examine anion
binding to PEPCK. Iodide was used as the anionic inhibitor as a proxy for chloride, due to its unique
anomalous properties. WT rcPEPCK crystals were soaked in 500 mM potassium iodide and diffracted at
our home source (CuКα = 1.54Å), then the resulting diffraction patterns were analyzed to generate both
the WT structure and a corresponding anomalous difference map. Iodide was easily located at the active
site, tightly bound at the OAA/PEP site as expected of a competitive inhibitor (Figure 19).
Further crystal soaking experiments revealed the presence of an allosteric site, located directly behind the
P-loop, where the anomalous signal appeared to titrate with increasing iodide concentration (Figure 20-
21). This contrasts the anomalous signal at the active site, which remains relatively constant over the
range of concentration used for the iodide soaks, and only begins to decrease at the lowest iodide
concentration used. The putative allosteric site does not appear to have the tetrahedral geometry of known
anion-binding sites, so further analysis is needed.
The iodide bound to the allosteric site is unique due in its observed titration when compared to all other
iodide anions found in the WT rcPEPCK structure (listed in Appendix I). There is a total of eighteen
iodide anions found in the 500 mM KI wildtype structure, most of which are bound to the surface of the
enzyme. The two iodide anions present in the active site are non-titratable, demonstrating a behaviour
similar of that to the surface-bound iodides (Appendix I). Each of the iodides in the active site has an
occupancy of approximately 0.5, indicating that there is only one iodide truly bound to the active site, and
that the iodide is likely to be bound in either of these two positions located in the OAA/PEP site. This is
an artifact of macromolecular X-ray diffraction, in that a dataset is the average of all of the molecules that
comprise the crystalline lattice. It is interesting to note that one of these anomalous signals in the active
site disappears in the 10 mM KI structure, indicating that at lower concentrations of iodide (likely on the
micromolar scale) this anomalous signal could start to titrate. Overall, only the iodide bound to the
allosteric site was observed to titrate over the range of iodide concentration used in both the kinetic assays
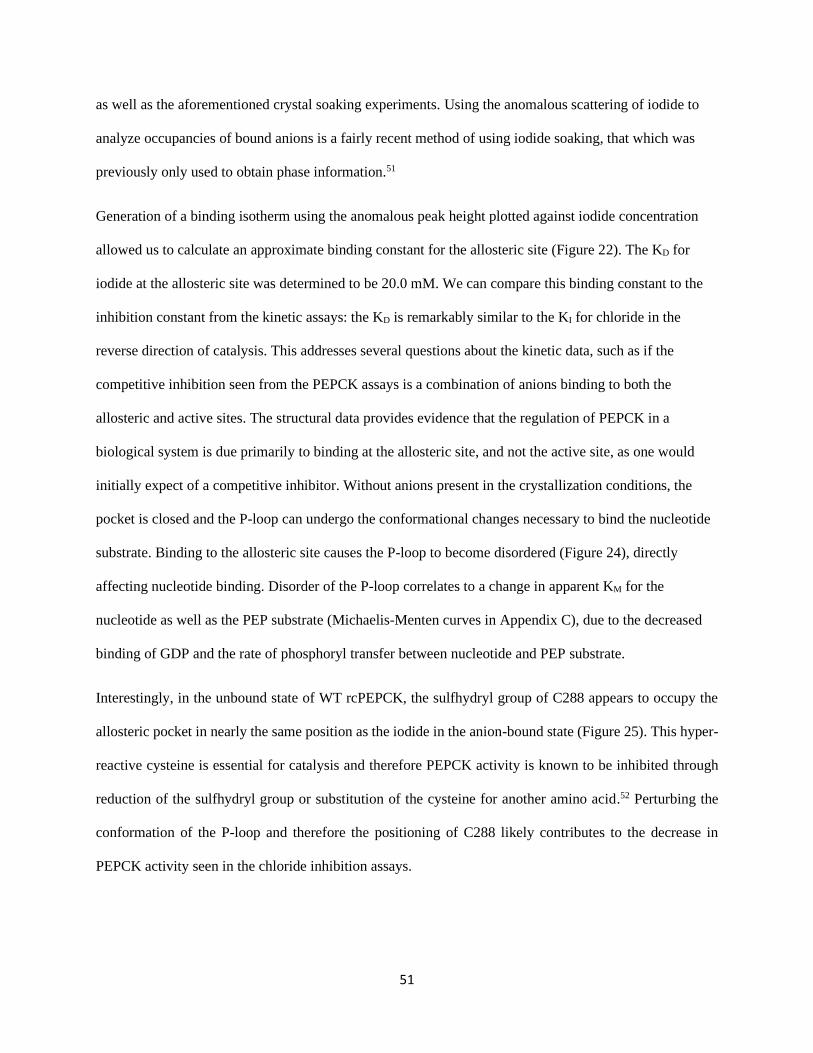
51
as well as the aforementioned crystal soaking experiments. Using the anomalous scattering of iodide to
analyze occupancies of bound anions is a fairly recent method of using iodide soaking, that which was
previously only used to obtain phase information.51
Generation of a binding isotherm using the anomalous peak height plotted against iodide concentration
allowed us to calculate an approximate binding constant for the allosteric site (Figure 22). The KD for
iodide at the allosteric site was determined to be 20.0 mM. We can compare this binding constant to the
inhibition constant from the kinetic assays: the KD is remarkably similar to the KI for chloride in the
reverse direction of catalysis. This addresses several questions about the kinetic data, such as if the
competitive inhibition seen from the PEPCK assays is a combination of anions binding to both the
allosteric and active sites. The structural data provides evidence that the regulation of PEPCK in a
biological system is due primarily to binding at the allosteric site, and not the active site, as one would
initially expect of a competitive inhibitor. Without anions present in the crystallization conditions, the
pocket is closed and the P-loop can undergo the conformational changes necessary to bind the nucleotide
substrate. Binding to the allosteric site causes the P-loop to become disordered (Figure 24), directly
affecting nucleotide binding. Disorder of the P-loop correlates to a change in apparent KM for the
nucleotide as well as the PEP substrate (Michaelis-Menten curves in Appendix C), due to the decreased
binding of GDP and the rate of phosphoryl transfer between nucleotide and PEP substrate.
Interestingly, in the unbound state of WT rcPEPCK, the sulfhydryl group of C288 appears to occupy the
allosteric pocket in nearly the same position as the iodide in the anion-bound state (Figure 25). This hyper-
reactive cysteine is essential for catalysis and therefore PEPCK activity is known to be inhibited through
reduction of the sulfhydryl group or substitution of the cysteine for another amino acid.52 Perturbing the
conformation of the P-loop and therefore the positioning of C288 likely contributes to the decrease in
PEPCK activity seen in the chloride inhibition assays.
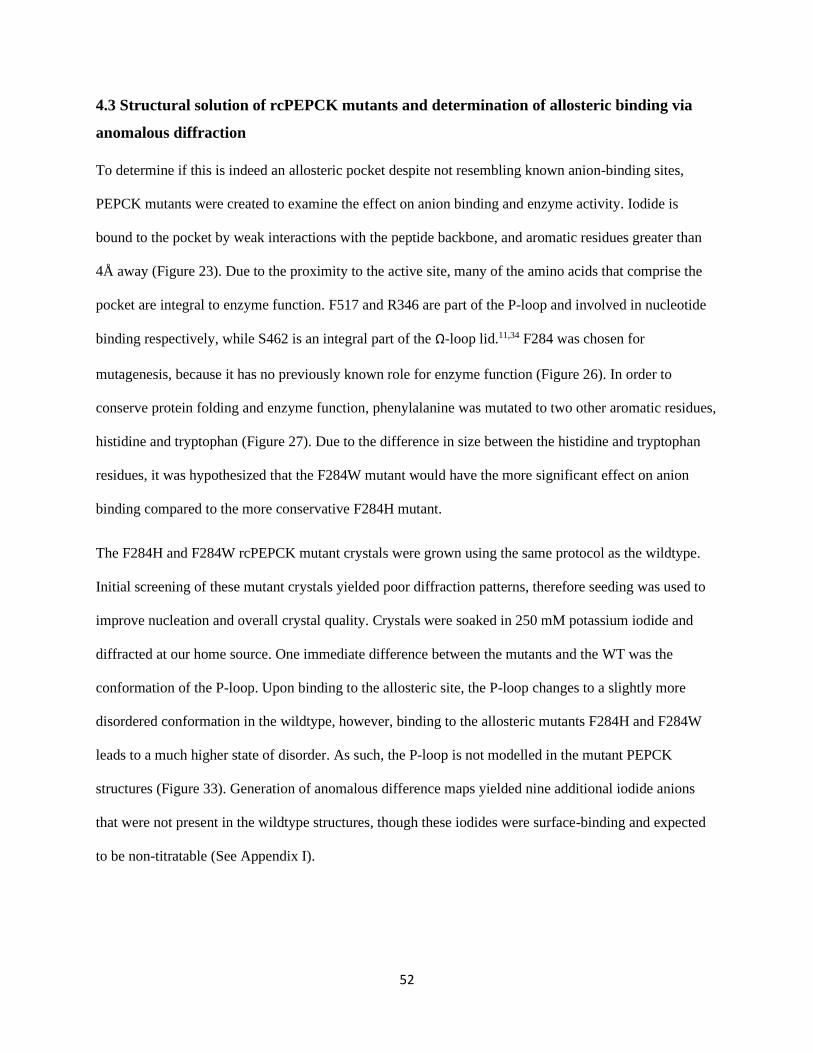
52
4.3 Structural solution of rcPEPCK mutants and determination of allosteric binding via
anomalous diffraction
To determine if this is indeed an allosteric pocket despite not resembling known anion-binding sites,
PEPCK mutants were created to examine the effect on anion binding and enzyme activity. Iodide is
bound to the pocket by weak interactions with the peptide backbone, and aromatic residues greater than
4Å away (Figure 23). Due to the proximity to the active site, many of the amino acids that comprise the
pocket are integral to enzyme function. F517 and R346 are part of the P-loop and involved in nucleotide
binding respectively, while S462 is an integral part of the Ω-loop lid.11,34 F284 was chosen for
mutagenesis, because it has no previously known role for enzyme function (Figure 26). In order to
conserve protein folding and enzyme function, phenylalanine was mutated to two other aromatic residues,
histidine and tryptophan (Figure 27). Due to the difference in size between the histidine and tryptophan
residues, it was hypothesized that the F284W mutant would have the more significant effect on anion
binding compared to the more conservative F284H mutant.
The F284H and F284W rcPEPCK mutant crystals were grown using the same protocol as the wildtype.
Initial screening of these mutant crystals yielded poor diffraction patterns, therefore seeding was used to
improve nucleation and overall crystal quality. Crystals were soaked in 250 mM potassium iodide and
diffracted at our home source. One immediate difference between the mutants and the WT was the
conformation of the P-loop. Upon binding to the allosteric site, the P-loop changes to a slightly more
disordered conformation in the wildtype, however, binding to the allosteric mutants F284H and F284W
leads to a much higher state of disorder. As such, the P-loop is not modelled in the mutant PEPCK
structures (Figure 33). Generation of anomalous difference maps yielded nine additional iodide anions
that were not present in the wildtype structures, though these iodides were surface-binding and expected
to be non-titratable (See Appendix I).
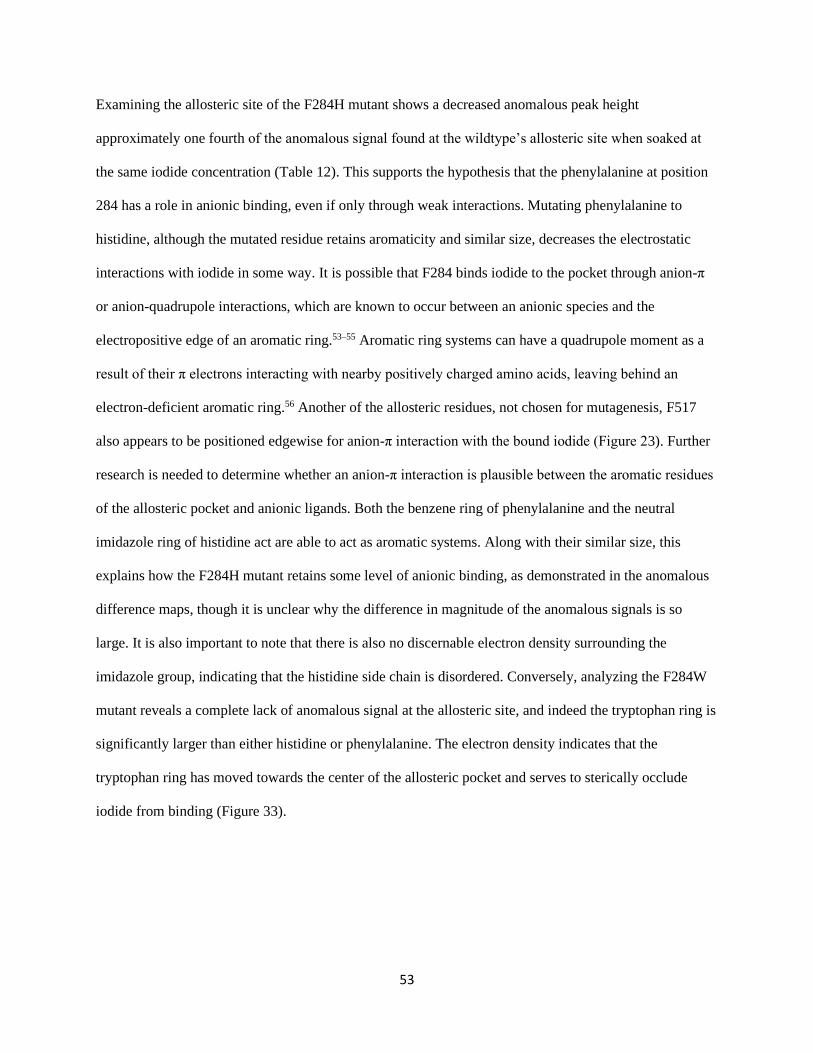
53
Examining the allosteric site of the F284H mutant shows a decreased anomalous peak height
approximately one fourth of the anomalous signal found at the wildtype’s allosteric site when soaked at
the same iodide concentration (Table 12). This supports the hypothesis that the phenylalanine at position
284 has a role in anionic binding, even if only through weak interactions. Mutating phenylalanine to
histidine, although the mutated residue retains aromaticity and similar size, decreases the electrostatic
interactions with iodide in some way. It is possible that F284 binds iodide to the pocket through anion-π
or anion-quadrupole interactions, which are known to occur between an anionic species and the
electropositive edge of an aromatic ring.53–55 Aromatic ring systems can have a quadrupole moment as a
result of their π electrons interacting with nearby positively charged amino acids, leaving behind an
electron-deficient aromatic ring.56 Another of the allosteric residues, not chosen for mutagenesis, F517
also appears to be positioned edgewise for anion-π interaction with the bound iodide (Figure 23). Further
research is needed to determine whether an anion-π interaction is plausible between the aromatic residues
of the allosteric pocket and anionic ligands. Both the benzene ring of phenylalanine and the neutral
imidazole ring of histidine act are able to act as aromatic systems. Along with their similar size, this
explains how the F284H mutant retains some level of anionic binding, as demonstrated in the anomalous
difference maps, though it is unclear why the difference in magnitude of the anomalous signals is so
large. It is also important to note that there is also no discernable electron density surrounding the
imidazole group, indicating that the histidine side chain is disordered. Conversely, analyzing the F284W
mutant reveals a complete lack of anomalous signal at the allosteric site, and indeed the tryptophan ring is
significantly larger than either histidine or phenylalanine. The electron density indicates that the
tryptophan ring has moved towards the center of the allosteric pocket and serves to sterically occlude
iodide from binding (Figure 33).
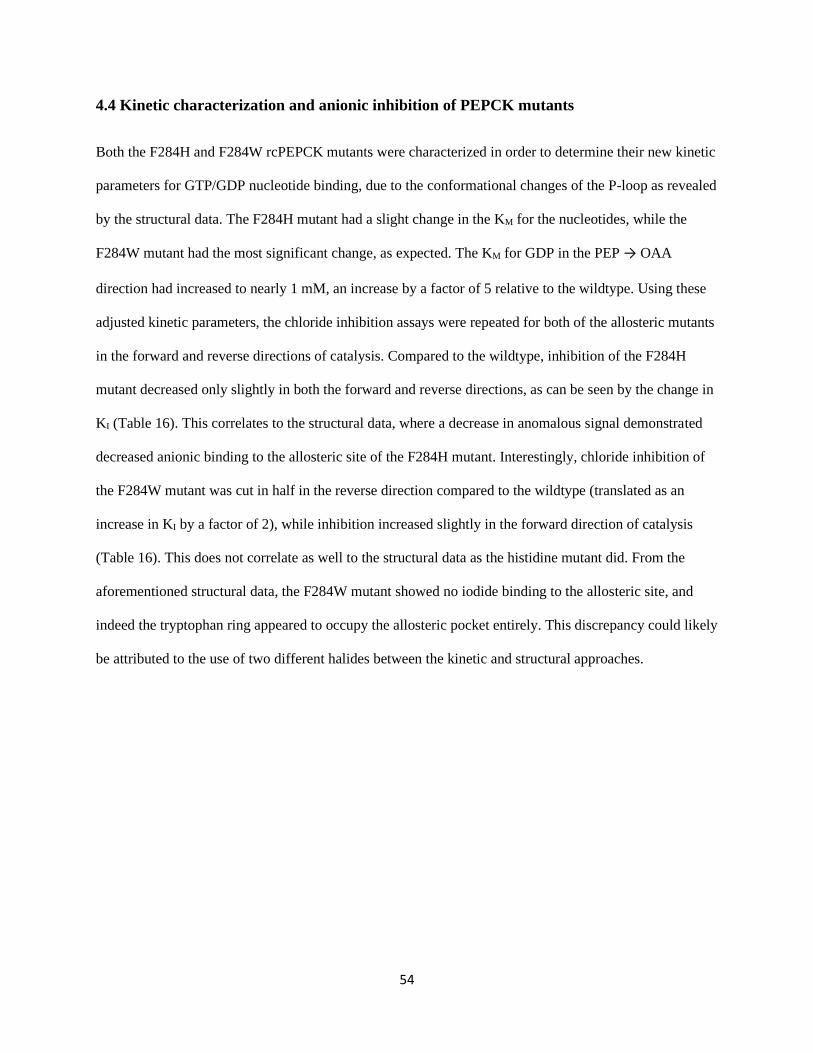
54
4.4 Kinetic characterization and anionic inhibition of PEPCK mutants
Both the F284H and F284W rcPEPCK mutants were characterized in order to determine their new kinetic
parameters for GTP/GDP nucleotide binding, due to the conformational changes of the P-loop as revealed
by the structural data. The F284H mutant had a slight change in the KM for the nucleotides, while the
F284W mutant had the most significant change, as expected. The KM for GDP in the PEP → OAA
direction had increased to nearly 1 mM, an increase by a factor of 5 relative to the wildtype. Using these
adjusted kinetic parameters, the chloride inhibition assays were repeated for both of the allosteric mutants
in the forward and reverse directions of catalysis. Compared to the wildtype, inhibition of the F284H
mutant decreased only slightly in both the forward and reverse directions, as can be seen by the change in
KI (Table 16). This correlates to the structural data, where a decrease in anomalous signal demonstrated
decreased anionic binding to the allosteric site of the F284H mutant. Interestingly, chloride inhibition of
the F284W mutant was cut in half in the reverse direction compared to the wildtype (translated as an
increase in KI by a factor of 2), while inhibition increased slightly in the forward direction of catalysis
(Table 16). This does not correlate as well to the structural data as the histidine mutant did. From the
aforementioned structural data, the F284W mutant showed no iodide binding to the allosteric site, and
indeed the tryptophan ring appeared to occupy the allosteric pocket entirely. This discrepancy could likely
be attributed to the use of two different halides between the kinetic and structural approaches.
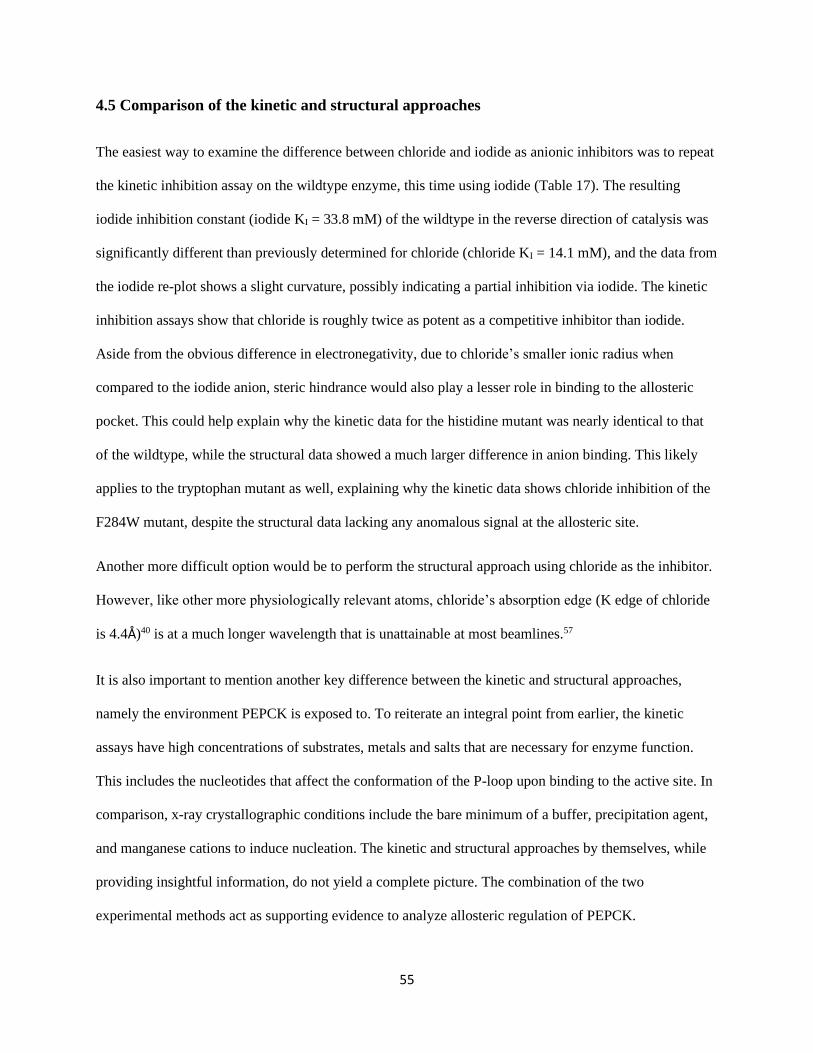
55
4.5 Comparison of the kinetic and structural approaches
The easiest way to examine the difference between chloride and iodide as anionic inhibitors was to repeat
the kinetic inhibition assay on the wildtype enzyme, this time using iodide (Table 17). The resulting
iodide inhibition constant (iodide KI = 33.8 mM) of the wildtype in the reverse direction of catalysis was
significantly different than previously determined for chloride (chloride KI = 14.1 mM), and the data from
the iodide re-plot shows a slight curvature, possibly indicating a partial inhibition via iodide. The kinetic
inhibition assays show that chloride is roughly twice as potent as a competitive inhibitor than iodide.
Aside from the obvious difference in electronegativity, due to chloride’s smaller ionic radius when
compared to the iodide anion, steric hindrance would also play a lesser role in binding to the allosteric
pocket. This could help explain why the kinetic data for the histidine mutant was nearly identical to that
of the wildtype, while the structural data showed a much larger difference in anion binding. This likely
applies to the tryptophan mutant as well, explaining why the kinetic data shows chloride inhibition of the
F284W mutant, despite the structural data lacking any anomalous signal at the allosteric site.
Another more difficult option would be to perform the structural approach using chloride as the inhibitor.
However, like other more physiologically relevant atoms, chloride’s absorption edge (K edge of chloride
is 4.4Å)40 is at a much longer wavelength that is unattainable at most beamlines.57
It is also important to mention another key difference between the kinetic and structural approaches,
namely the environment PEPCK is exposed to. To reiterate an integral point from earlier, the kinetic
assays have high concentrations of substrates, metals and salts that are necessary for enzyme function.
This includes the nucleotides that affect the conformation of the P-loop upon binding to the active site. In
comparison, x-ray crystallographic conditions include the bare minimum of a buffer, precipitation agent,
and manganese cations to induce nucleation. The kinetic and structural approaches by themselves, while
providing insightful information, do not yield a complete picture. The combination of the two
experimental methods act as supporting evidence to analyze allosteric regulation of PEPCK.
56
Chapter 5 Conclusions and Future Work
Kinetic assays performed on the wildtype enzyme reinforced the fact that PEPCK activity is lower in the
reverse direction of catalysis. Chloride inhibition assays demonstrated inhibition in the reverse direction
to be significantly stronger than that of the forward direction by an order of magnitude. The resulting KI
in the reverse direction determined the mM range of iodide concentration which would then be used in the
subsequent crystal soaking experiments. WT rcPEPCK crystals were soaked over the 0 to 500 mM iodide
concentration range, and the resulting anomalous signal found at the allosteric site was used to generate a
binding isotherm, yielding a KD similar to that of the KI from the kinetic data. A combination of the
kinetic and structural data provides evidence to suggest that binding to the allosteric site regulates enzyme
activity in vivo, and ensures that PEPCK primarily catalyzes the reaction in the OAA→PEP direction
needed for the gluconeogenic pathway despite being a thermodynamically reversible reaction.
Analysis of the allosteric site reveals key residues that form the pocket. Mutagenesis of one of these
residues, along with the complementary kinetic and structural approaches used for the wildtype, shows
the role F284 plays in anion binding. It is hypothesized that non-covalent interactions with the protein
backbone, and well as weak anion-π interactions with aromatic residues serve to bind anions to this
pocket. Substituting for another amino acid, even another aromatic residue of similar size like histidine,
affects anionic binding and therefore decreases the anionic inhibition of rcPEPCK.
Structural comparisons between the wildtype and mutant enzyme variants demonstrate how binding to the
allosteric site might affect nucleotide binding and therefore enzyme function. The close proximity of the
allosteric site to that of the GTP/GDP nucleotide binding site causes any ligand binding at the allosteric
site to directly inhibit enzyme activity by impeding nucleotide binding. In this way, anions that bind to the
allosteric site can be classified as competitive inhibitors, since they alter apparent the KM and prevent the
nucleotide from binding. Binding to the allosteric site causes the P-loop to become highly disordered,
making it more difficult for the enzyme to adapt the correct conformation for nucleotide binding.
57
As with other reversible competitive inhibitors, inhibition can be overcome provided substrate is added at
saturating conditions. Under high substrate concentrations, there is a greater probability that the
nucleotide can bind to the active site, and the P-loop can adopt the appropriate conformation required for
catalysis. The difference in affinity for the different nucleotides in the forward and reverse directions of
catalysis can help explain why PEPCK inhibition is stronger in the reverse direction. The GTP nucleotide
is preferred over GDP, as evidenced by the KM’s and binding affinities. Due to PEPCK’s greater affinity
for the GTP, inhibition in the forward direction is relatively insignificant compared to that of the reverse
direction.
Combining a kinetic approach studying chloride inhibition, and a structural approach analyzing the
binding of iodide via anomalous signal, we can hypothesize that the inhibition of PEPCK activity in the
reverse direction can be mostly attributed to allosteric regulation. In this way, binding to the allosteric site
is proposed to result in the unidirectional nature of the PEPCK-catalyzed reaction in higher eukaryotes,
ensuring gluconeogenesis can occur.
Further research is necessary to determine at what micromolar concentration of iodide will the active site
begin to titrate in comparison to the millimolar scale of the allosteric site. X-ray diffraction at a
specialized beamline with a longer wavelength would allow for the anomalous diffraction of chloride and
a direct comparison with the chloride inhibition assays.57 Further kinetic assays on the wildtype should to
be performed using other anions for a more detailed understanding of the cellular environment in vivo.
Extended mutagenesis on the rat cytosolic enzyme and repeated experiments on other PEPCK isoforms
could be done to observe the effects of anionic inhibition on enzymes involved in the key regulatory steps
of metabolic pathways.
58
References
(1) Voet, D., Voet, J. G. (2011) Biochemistry 4th ed. John Wiley & Sons, Hoboken, New Jersey.
(2) Chiba, Y., Kamikawa, R., Nakada-Tsukui, K., Saito-Nakano, Y., and Nozaki, T. (2015) Discovery of PP-type
phosphoenolpyruvate carboxykinase genes in Eukaryotes and Bacteria. J. Biol. Chem. 290, 23960–23970.
(3) Hanson, R. W., and Garber, A. J. (1972, October) Phosphoenolpyruvate carboxykinase. I. Its role in gluconeogenesis. Am. J.
Clin. Nutr.
(4) Forest, C., Tordjman, J., Glorian, M., Duplus, E., Chauvet, G., Quette, J., Beale, E. G., and Antoine, B. (2003) Fatty acid
recycling in adipocytes: A role for glyceroneogenesis and phosphoenolpyruvate carboxykinase. Biochem. Soc. Trans. 31, 1125–
1129.
(5) Tannen, R. L. (1978) Ammonia metabolism. Am. J. Physiol. 235, 265–277.
(6) Granner, D., Andreone, T., Sasaki, K., and Beale, E. (1983) Inhibition of transcription of the phosphoenolpyruvate
carboxykinase gene by insulin. Nature 305, 549–551.
(7) O’Brien, R. M., Lucas, P. C., Forest, C. D., Magnuson, M. A., Granner, D. K. (1990) Identification of a sequence in the
PEPCK gene that mediates a negative effect of insulin on trancription. Science (80-. ). 249, 533–537.
(8) Liu, J., Park, E. A., Gurney, A. L., Roesler, W. J., and Hanson, R. W. (1991) Cyclic AMP induction of phosphoenolpyruvate
carboxykinase (GTP) gene transcription is mediated by multiple promoter elements. J. Biol. Chem. 266, 19095–19102.
(9) Xiong, Y., Lei, Q. Y., Zhao, S., and Guan, K. L. (2011) Regulation of glycolysis and gluconeogenesis by acetylation of PKM
and PEPCK. Cold Spring Harb. Symp. Quant. Biol. 76, 285–289.
(10) Latorre-Muro, P., Baeza, J., Armstrong, E. A., Hurtado-Guerrero, R., Corzana, F., Wu, L. E., Sinclair, D. A., Lopez-Buesa,
P., Carrodeguas, J. A., Denu, J. M. (2018) Dynamic acetylation of cytosolic phosphoenolpyruvate carboxykinase toggles enzyme
activity between gluconeogenic and anaplerotic reactions. Mol Cell. 71, 718–732.
(11) Carlson, G. M., and Holyoak, T. (2009) Structural Insights into the Mechanism of Phosphoenolpyruvate Carboxykinase
Catalysis. J. Biol. Chem. 284, 27037–27041.
(12) Cui, D. S., Broom, A., McLeod, M. J., Meiering, E. M., and Holyoak, T. (2017) Asymmetric anchoring is required for
efficient Ω-loop opening and closing in cytosolic phosphoenolpyruvate carboxykinase. Biochemistry 56, 2106–2115.
(13) Case, C. L., and Mukhopadhyay, B. (2007) Kinetic characterization of recombinant human cytosolic phosphoenolpyruvate
carboxykinase with and without a His10-tag. Biochim. Biophys. Acta - Gen. Subj. 1770, 1576–1584.
(14) Johnson, K. A., and Goody, R. S. (2011) The original Michaelis constant: Translation of the 1913 Michaelis-Menten Paper.
Biochemistry 50, 8264–8269.
(15) Northrop, D. B. (1998) On the meaning of Km and V/K in enzyme kinetics. J. Chem. Educ. 75, 1153–1157.
(16) Waldrop, G. L. (2009, January) A qualitative approach to enzyme inhibition. Biochem. Mol. Biol. Educ.
(17) Monod, J. F. (1961) Teleonomic mechanisms in cellular metabolism, growth and differentiation. Cold Spring Harb. Symp.
Quant. Biol. 26, 389–401.
(18) Nussinov, R., and Tsai, C. J. (2015, February 1) Allostery without a conformational change? Revisiting the paradigm. Curr.
Opin. Struct. Biol. Elsevier Ltd.
(19) Gunasekaran, K., Ma, B., and Nussinov, R. (2004, November 15) Is allostery an intrinsic property of all dynamic proteins?
Proteins Struct. Funct. Genet.
(20) Fenton, A. W. (2008) Allostery: an illustrated definition for the “second secret of life.” Trends Biochem Sci 23, 420–425.
(21) Stiffin, R. M., Sullivan, S. M., Carlson, G. M., and Holyoak, T. (2008) Differential inhibition of cytosolic PEPCK by
substrate analogues. Kinetic and structural characterization of inhibitor recognition. Biochemistry 47, 2099–2109.
(22) Izui, K., Matusda, Y., Kameshita, I., Katsuki, H., Woods, A. E. (1983) Phosphoenolpyruvate carboxylase of Escherichia
coli. Inhibition by various analogs and homologs of phosphoenolpyruvate. J. Biochem. 94, 1789–1795.
(23) Robinson, B. H., and Oei, J. (1975) 3-Mercaptopicolinic acid, a preferential inhibitor of the cytosolic phosphoenolpyruvate
carboxykinase. FEBS Lett. 58, 12–15.
59
(24) Makinen, A. L., and Nowak, T. (1983) 3-Mercaptopicolinate. A reversible active site inhibitor of avian liver
phosphoenolpyruvate carboxykinase. J. Biol. Chem. 258, 11654–11662.
(25) Balan, M. D., McLeod, M. J., Lotosky, W. R., Ghaly, M., and Holyoak, T. (2015) Inhibition and Allosteric Regulation of
Monomeric Phosphoenolpyruvate Carboxykinase by 3-Mercaptopicolinic Acid. Biochemistry 54, 5878–5887.
(26) Kretsinger, R. H., Uversky, V. N., Permyakov, E. A. (2013) Cellular Electrolyte Metabolism. Encycl. Met. Springer.
(27) Frausto de Silva, J. J. R., Williams, R. J. P. (2001) Sodium, potassium, and chlorine osmotic control, electrolytic equilibria,
and currents. Biol. Chem. Elem. Inorg. Chem. Life. Oxford University Press.
(28) Krissinel, E., and Henrick, K. (2007) Inference of Macromolecular Assemblies from Crystalline State. J. Mol. Biol. 372,
774–797.
(29) Rossmann, M. G. (1990) The molecular replacement method. Acta Crystallogr. Sect. A 46, 73–82.
(30) Hendrickson, W. A. (1985) Analysis of protein structure from diffraction measurement at multiple wavelengths. Trans. Am.
Cryst. Assoc. 21, 11–21.
(31) Smith, J. L. (1991) Determination of three-dimensional structure by multiwavelength anomalous diffraction. Curr. Opin.
Struct. Biol. 1, 1002–1011.
(32) Hendrickson, W. A. (2014) Anomalous diffraction in crystallographic phase evaluation. Q. Rev. Biophys. Cambridge
University Press.
(33) Rose, J. P., and Wang, B. C. (2016) SAD phasing: History, current impact and future opportunities. Arch. Biochem. Biophys.
602, 80–94.
(34) Sullivan, S. M., and Holyoak, T. (2007) Structures of rat cytosolic PEPCK: Insight into the mechanism of phosphorylation
and decarboxylation of oxaloacetic acid. Biochemistry 46, 10078–10088.
(35) Troy A. Johnson, T. H. (2012) The Ω‑Loop Lid Domain of Phosphoenolpyruvate Carboxykinase Is Essential for Catalytic
Function. Biochemistry 51, 9547–9559.
(36) Holyoak, T., Sullivan, S. M., and Nowak, T. (2006) Structural insights into the mechanism of PEPCK catalysis.
Biochemistry 45, 8254–8263.
(37) McNicholas, S., Potterton, E., Wilson, K. S., and Noble, M. E. M. (2011) Presenting your structures: The CCP4mg
molecular-graphics software. Acta Crystallogr. Sect. D Biol. Crystallogr. 67, 386–394.
(38) Johnson, T. A., McLeod, M. J., and Holyoak, T. (2016) Utilization of Substrate Intrinsic Binding Energy for Conformational
Change and Catalytic Function in Phosphoenolpyruvate Carboxykinase. Biochemistry 55, 575–587.
(39) Troy A. Johnson, T. H. (2010) Increasing the conformational entropy of the Ω-loop lid domain in PEPCK impairs catalysis
and decreases catalytic fidelity. Biochemistry 49, 5176–5187.
(40) Brennan, S., Cowan, P. L. (1992) A suite of programs for calculating x-ray absorption, reflection and diffraction
performance for a variety of materials at arbitrary wavelengths. Rev. Sci. Instrum. 63, 850.
(41) Dubnau, D. (1999) DNA Uptake in Bacteria. Annu. Rev. Microbiol. 53, 217–244.
(42) Lorenz, M. G., Wackernagel, W. (1994) Bacterial Gene Transfer by Natural Genetic Transformation in the Environment.
Microbiol. Rev. 58, 563–602.
(43) Studier, F. W. (2005) Protein Production by Auto-Induction in High-Density Shaking Cultures. Protein Expr. Purif. 41,
207–234.
(44) Otwinowski, Z., Minor, W. (1997) Processing of x-ray diffraction data collected in oscillation mode. Methods Enzym. 276,
307–326.
(45) Collaborative Computational Project, Number 4. (1994) The CCP4 suite: programs for protein crystallography. Acta
Crystallogr. Sect. D Biol. Crystallogr. 50, 760–763.
(46) Vagin, A., Teplyakov, A. (1997) MOLREP: an Automated Program for Molecular Replacement. J. Appl. Crystallogr. 30,
1022–1025.
(47) Emsley, P., Lohkamp, B., Scott, W. G., Cowtan, K. (2010) Features and development of Coot. Acta Crystallogr. Sect. D
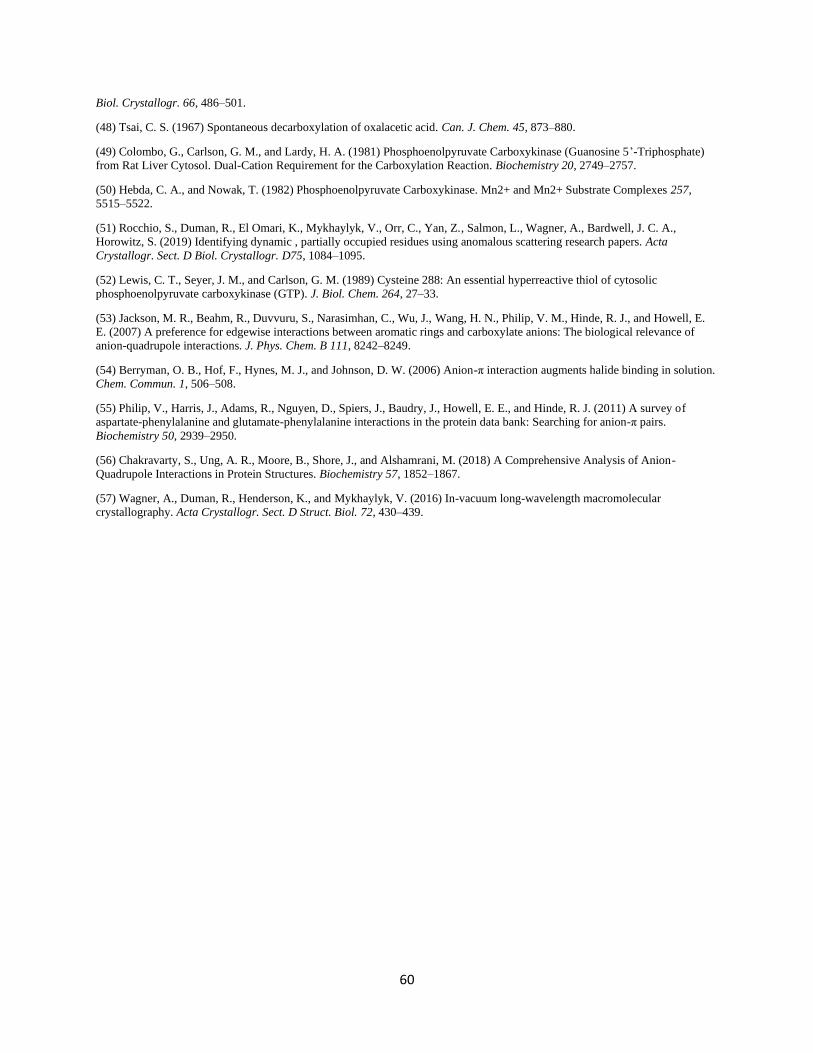
60
Biol. Crystallogr. 66, 486–501.
(48) Tsai, C. S. (1967) Spontaneous decarboxylation of oxalacetic acid. Can. J. Chem. 45, 873–880.
(49) Colombo, G., Carlson, G. M., and Lardy, H. A. (1981) Phosphoenolpyruvate Carboxykinase (Guanosine 5’-Triphosphate)
from Rat Liver Cytosol. Dual-Cation Requirement for the Carboxylation Reaction. Biochemistry 20, 2749–2757.
(50) Hebda, C. A., and Nowak, T. (1982) Phosphoenolpyruvate Carboxykinase. Mn2+ and Mn2+ Substrate Complexes 257,
5515–5522.
(51) Rocchio, S., Duman, R., El Omari, K., Mykhaylyk, V., Orr, C., Yan, Z., Salmon, L., Wagner, A., Bardwell, J. C. A.,
Horowitz, S. (2019) Identifying dynamic , partially occupied residues using anomalous scattering research papers. Acta
Crystallogr. Sect. D Biol. Crystallogr. D75, 1084–1095.
(52) Lewis, C. T., Seyer, J. M., and Carlson, G. M. (1989) Cysteine 288: An essential hyperreactive thiol of cytosolic
phosphoenolpyruvate carboxykinase (GTP). J. Biol. Chem. 264, 27–33.
(53) Jackson, M. R., Beahm, R., Duvvuru, S., Narasimhan, C., Wu, J., Wang, H. N., Philip, V. M., Hinde, R. J., and Howell, E.
E. (2007) A preference for edgewise interactions between aromatic rings and carboxylate anions: The biological relevance of
anion-quadrupole interactions. J. Phys. Chem. B 111, 8242–8249.
(54) Berryman, O. B., Hof, F., Hynes, M. J., and Johnson, D. W. (2006) Anion-π interaction augments halide binding in solution.
Chem. Commun. 1, 506–508.
(55) Philip, V., Harris, J., Adams, R., Nguyen, D., Spiers, J., Baudry, J., Howell, E. E., and Hinde, R. J. (2011) A survey of
aspartate-phenylalanine and glutamate-phenylalanine interactions in the protein data bank: Searching for anion-π pairs.
Biochemistry 50, 2939–2950.
(56) Chakravarty, S., Ung, A. R., Moore, B., Shore, J., and Alshamrani, M. (2018) A Comprehensive Analysis of Anion-
Quadrupole Interactions in Protein Structures. Biochemistry 57, 1852–1867.
(57) Wagner, A., Duman, R., Henderson, K., and Mykhaylyk, V. (2016) In-vacuum long-wavelength macromolecular
crystallography. Acta Crystallogr. Sect. D Struct. Biol. 72, 430–439.
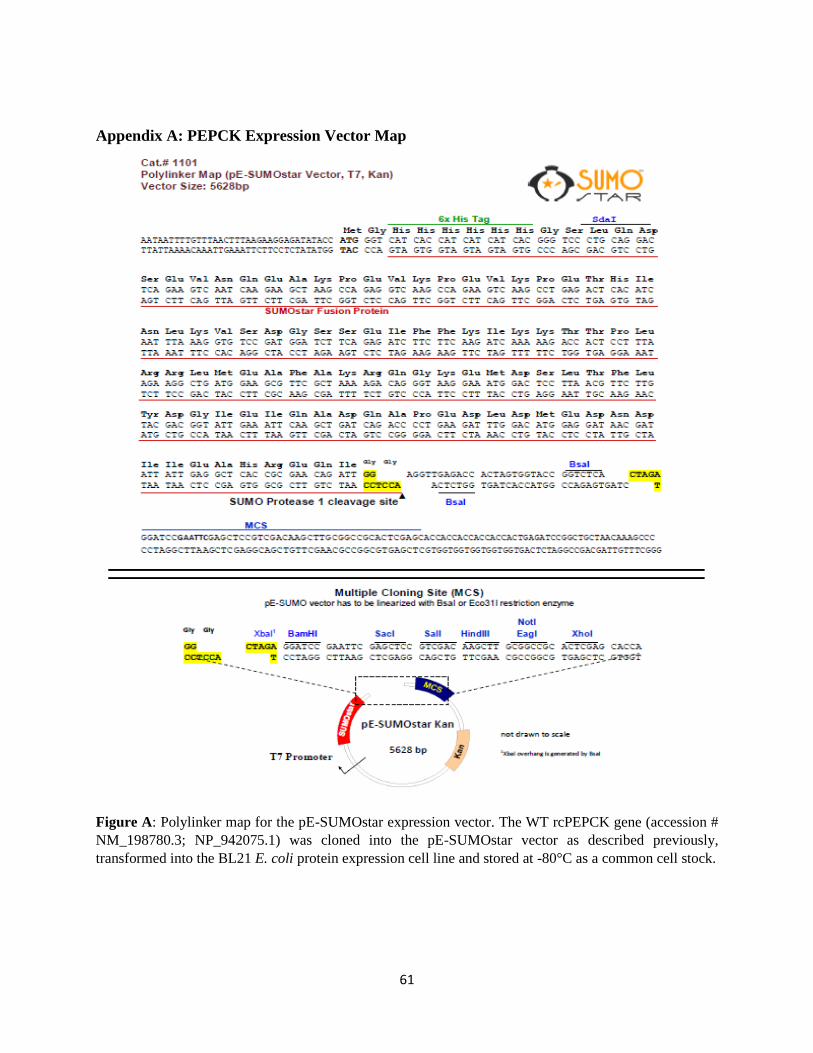
61
Appendix A: PEPCK Expression Vector Map
Figure A: Polylinker map for the pE-SUMOstar expression vector. The WT rcPEPCK gene (accession #
NM_198780.3; NP_942075.1) was cloned into the pE-SUMOstar vector as described previously,
transformed into the BL21 E. coli protein expression cell line and stored at -80°C as a common cell stock.
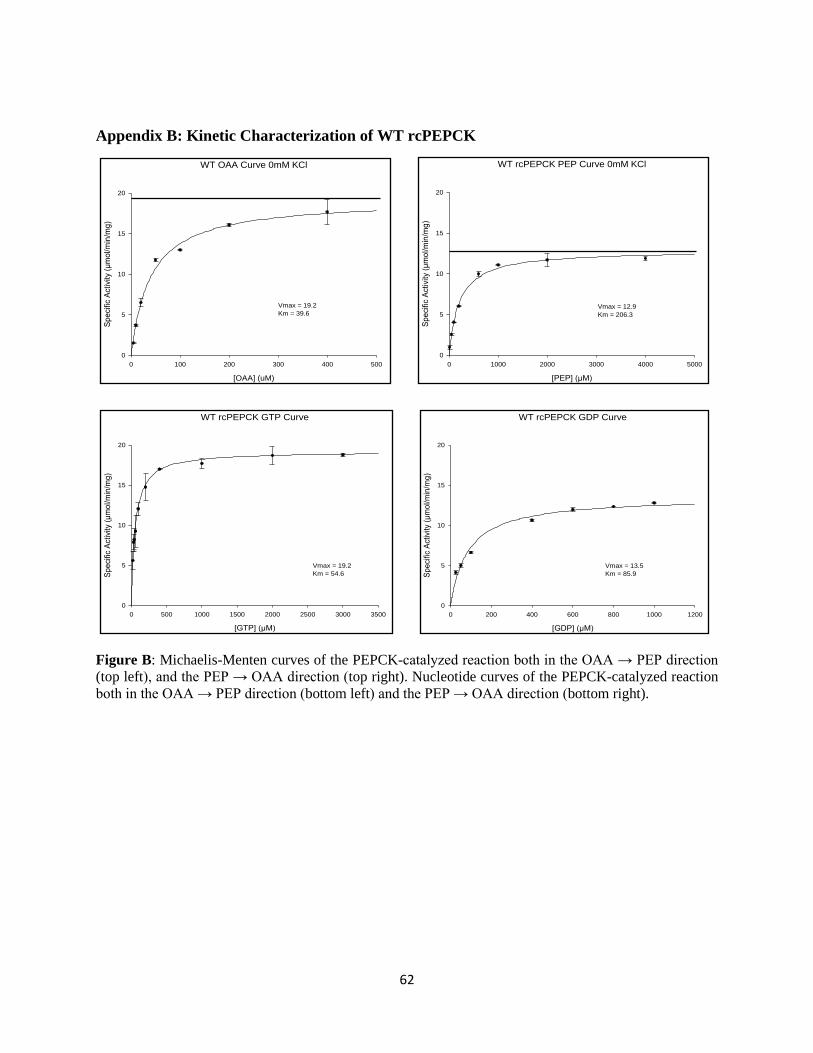
62
Appendix B: Kinetic Characterization of WT rcPEPCK
Figure B: Michaelis-Menten curves of the PEPCK-catalyzed reaction both in the OAA → PEP direction
(top left), and the PEP → OAA direction (top right). Nucleotide curves of the PEPCK-catalyzed reaction
both in the OAA → PEP direction (bottom left) and the PEP → OAA direction (bottom right).
WT OAA Curve 0mM KCl
[OAA] (uM)
0 100 200 300 400 500
Spe
cific
Act
ivity
(µm
ol/m
in/m
g)
0
5
10
15
20
Vmax = 19.2
Km = 39.6
WT rcPEPCK PEP Curve 0mM KCl
[PEP] (µM)
0 1000 2000 3000 4000 5000
Sp
ecific
Activi
ty (
µm
ol/m
in/m
g)
0
5
10
15
20
Vmax = 12.9
Km = 206.3
WT rcPEPCK GDP Curve
[GDP] (µM)
0 200 400 600 800 1000 1200
Sp
eci
fic
Act
ivity
(µ
mo
l/m
in/m
g)
0
5
10
15
20
Vmax = 13.5
Km = 85.9
WT rcPEPCK GTP Curve
[GTP] (µM)
0 500 1000 1500 2000 2500 3000 3500
Sp
eci
fic
Act
ivity
(µ
mo
l/min
/mg)
0
5
10
15
20
Vmax = 19.2
Km = 54.6
63
Appendix C: Kinetic Inhibition of WT rcPEPCK by Chloride
Figure C1: WT rcPEPCK reverse direction kinetic inhibition assays under increasing chloride
concentrations.
WT rcPEPCK PEP Curve 0mM KCl
[PEP] (µM)
0 1000 2000 3000 4000 5000
Specific
Activity (
µm
ol/m
in/m
g)
0
2
4
6
8
10
12
14
Vmax = 12.9
Km = 206.3
WT rcPEPCK PEP Curve 5 mM KCl
[PEP] (µM)
0 1000 2000 3000 4000 5000
Rate
(µ
mol/m
in/m
g)
0
2
4
6
8
10
12
14
Vmax = 12.1
Km = 205.1
WT rcPEPCK PEP Curve 15mM KCl
[PEP] (µM)
0 1000 2000 3000 4000 5000
Spe
cific
Activity (
µm
ol/m
in/m
g)
0
2
4
6
8
10
12
14
Vmax = 10.1
Km = 225.7
WT rcPEPCK PEP Curve 25mM KCl
[PEP] (µM)
0 1000 2000 3000 4000 5000
Spe
cific
Activity (
µm
ol/m
in/m
g)
0
2
4
6
8
10
12
14
Vmax = 9.9
Km = 304.7
WT rcPEPCK PEP Curve 40mM KCl
[PEP] (µM)
0 1000 2000 3000 4000 5000
Spe
cific
Activity (
µm
ol/m
in/m
g)
0
2
4
6
8
10
12
14
Vmax = 9.4
Km = 376.
WT rcPEPCK PEP Curve 100mM KCl
[PEP] (uM)
0 1000 2000 3000 4000 5000
Spe
cific
Activity (
µm
ol/m
in/m
g)
0
2
4
6
8
10
12
14
Vmax = 8.9
Km = 862.5
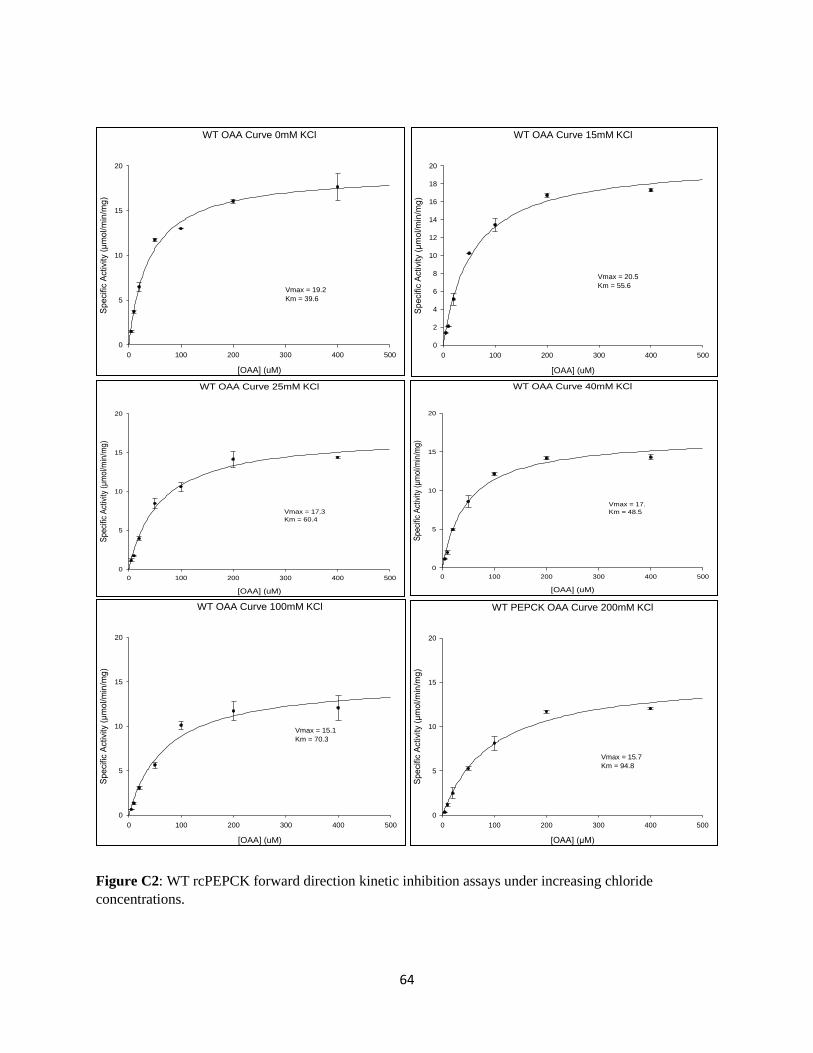
64
Figure C2: WT rcPEPCK forward direction kinetic inhibition assays under increasing chloride
concentrations.
WT OAA Curve 0mM KCl
[OAA] (uM)
0 100 200 300 400 500
Spe
cific
Activity (
µm
ol/m
in/m
g)
0
5
10
15
20
Vmax = 19.2
Km = 39.6
WT OAA Curve 15mM KCl
[OAA] (uM)
0 100 200 300 400 500
Sp
ecific
Activity (
µm
ol/m
in/m
g)
0
2
4
6
8
10
12
14
16
18
20
Vmax = 20.5
Km = 55.6
WT OAA Curve 25mM KCl
[OAA] (uM)
0 100 200 300 400 500
Sp
eci
fic A
ctiv
ity (
µm
ol/m
in/m
g)
0
5
10
15
20
Vmax = 17.3
Km = 60.4
WT OAA Curve 40mM KCl
[OAA] (uM)
0 100 200 300 400 500
Speci
fic A
ctiv
ity (
µm
ol/m
in/m
g)
0
5
10
15
20
Vmax = 17.
Km = 48.5
WT OAA Curve 100mM KCl
[OAA] (uM)
0 100 200 300 400 500
Spe
cific
Activity (
µm
ol/m
in/m
g)
0
5
10
15
20
Vmax = 15.1
Km = 70.3
WT PEPCK OAA Curve 200mM KCl
[OAA] (µM)
0 100 200 300 400 500
Sp
ecific
Activity (
µm
ol/m
in/m
g)
0
5
10
15
20
Vmax = 15.7
Km = 94.8
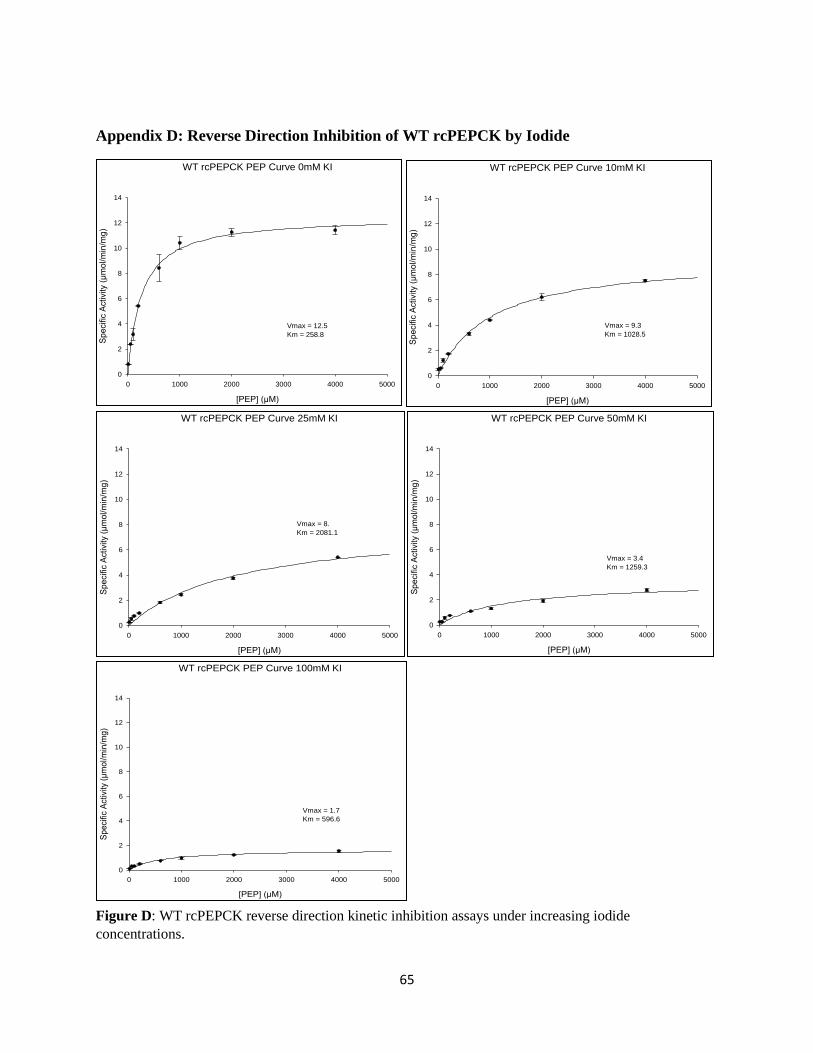
65
Appendix D: Reverse Direction Inhibition of WT rcPEPCK by Iodide
Iodide Inhibitor (KI)
Figure D: WT rcPEPCK reverse direction kinetic inhibition assays under increasing iodide
concentrations.
WT rcPEPCK PEP Curve 0mM KI
[PEP] (µM)
0 1000 2000 3000 4000 5000
Specific
Activity (
µm
ol/m
in/m
g)
0
2
4
6
8
10
12
14
Vmax = 12.5
Km = 258.8
WT rcPEPCK PEP Curve 10mM KI
[PEP] (µM)
0 1000 2000 3000 4000 5000
Sp
ecific
Activity (
µm
ol/m
in/m
g)
0
2
4
6
8
10
12
14
Vmax = 9.3
Km = 1028.5
WT rcPEPCK PEP Curve 25mM KI
[PEP] (µM)
0 1000 2000 3000 4000 5000
Specific
Activity (
µm
ol/m
in/m
g)
0
2
4
6
8
10
12
14
Vmax = 8.
Km = 2081.1
WT rcPEPCK PEP Curve 50mM KI
[PEP] (µM)
0 1000 2000 3000 4000 5000
Sp
ecific
Activity (
µm
ol/m
in/m
g)
0
2
4
6
8
10
12
14
Vmax = 3.4
Km = 1259.3
WT rcPEPCK PEP Curve 100mM KI
[PEP] (µM)
0 1000 2000 3000 4000 5000
Speci
fic
Act
ivity
(µ
mol/m
in/m
g)
0
2
4
6
8
10
12
14
Vmax = 1.7
Km = 596.6
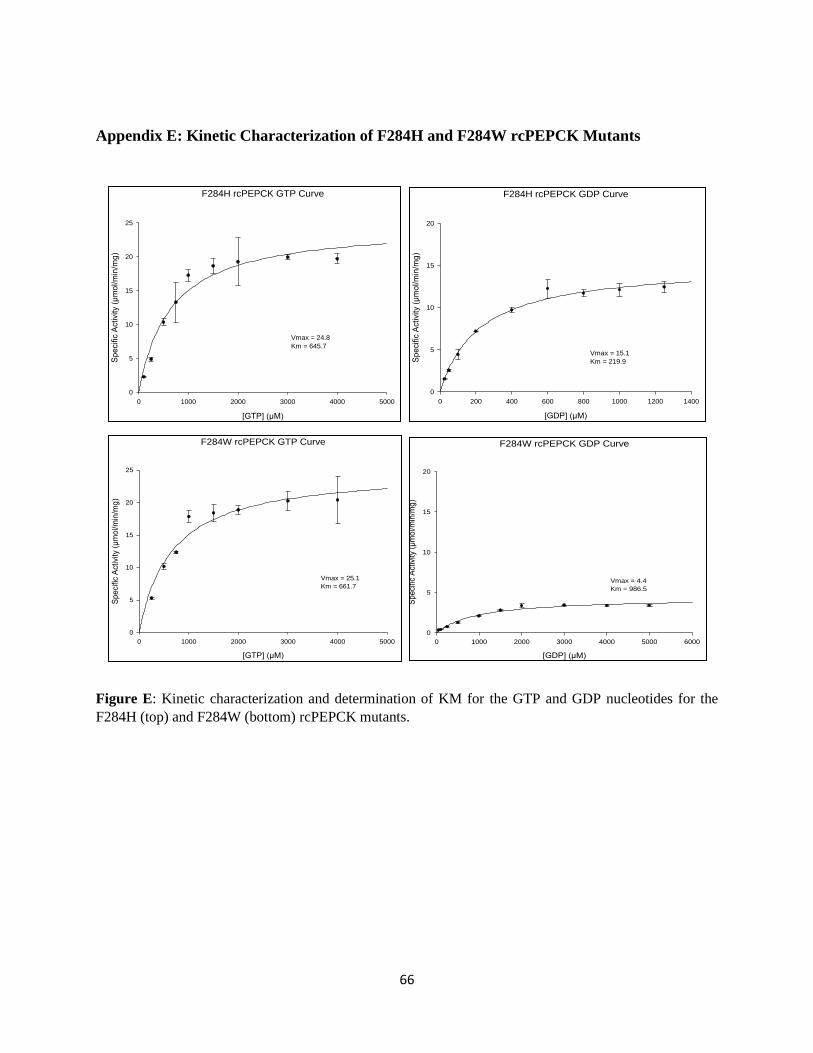
66
Appendix E: Kinetic Characterization of F284H and F284W rcPEPCK Mutants
Figure E: Kinetic characterization and determination of KM for the GTP and GDP nucleotides for the
F284H (top) and F284W (bottom) rcPEPCK mutants.
F284H rcPEPCK GTP Curve
[GTP] (µM)
0 1000 2000 3000 4000 5000
Sp
ecific
Activity (
µm
ol/m
in/m
g)
0
5
10
15
20
25
Vmax = 24.8
Km = 645.7
F284H rcPEPCK GDP Curve
[GDP] (µM)
0 200 400 600 800 1000 1200 1400
Sp
ecific
Activity (
µm
ol/m
in/m
g)
0
5
10
15
20
Vmax = 15.1
Km = 219.9
F284W rcPEPCK GTP Curve
[GTP] (µM)
0 1000 2000 3000 4000 5000
Speci
fic
Act
ivity
(µ
mol/m
in/m
g)
0
5
10
15
20
25
Vmax = 25.1
Km = 661.7
F284W rcPEPCK GDP Curve
[GDP] (µM)
0 1000 2000 3000 4000 5000 6000
Spe
cific
Act
ivity
(µ
mol/m
in/m
g)
0
5
10
15
20
Vmax = 4.4
Km = 986.5
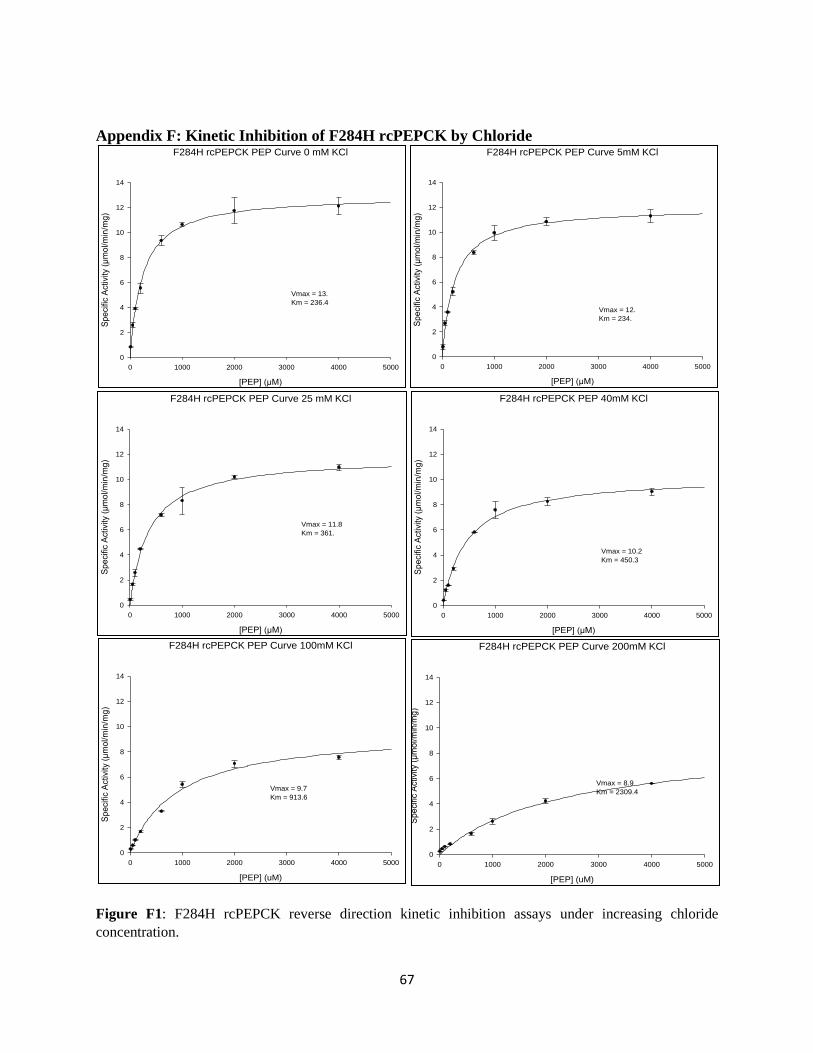
67
Appendix F: Kinetic Inhibition of F284H rcPEPCK by Chloride
Figure F1: F284H rcPEPCK reverse direction kinetic inhibition assays under increasing chloride
concentration.
F284H rcPEPCK PEP Curve 25 mM KCl
[PEP] (µM)
0 1000 2000 3000 4000 5000
Sp
ecific
Activity (
µm
ol/m
in/m
g)
0
2
4
6
8
10
12
14
Vmax = 11.8
Km = 361.
F284H rcPEPCK PEP 40mM KCl
[PEP] (µM)
0 1000 2000 3000 4000 5000
Spe
cific
Activity (
µm
ol/m
in/m
g)
0
2
4
6
8
10
12
14
Vmax = 10.2
Km = 450.3
F284H rcPEPCK PEP Curve 100mM KCl
[PEP] (uM)
0 1000 2000 3000 4000 5000
Spe
cific
Activity (
µm
ol/m
in/m
g)
0
2
4
6
8
10
12
14
Vmax = 9.7
Km = 913.6
F284H rcPEPCK PEP Curve 0 mM KCl
[PEP] (µM)
0 1000 2000 3000 4000 5000
Sp
ecific
Activity (
µm
ol/m
in/m
g)
0
2
4
6
8
10
12
14
Vmax = 13.
Km = 236.4
F284H rcPEPCK PEP Curve 5mM KCl
[PEP] (µM)
0 1000 2000 3000 4000 5000
Specific
Activity (
µm
ol/m
in/m
g)
0
2
4
6
8
10
12
14
Vmax = 12.
Km = 234.
F284H rcPEPCK PEP Curve 200mM KCl
[PEP] (uM)
0 1000 2000 3000 4000 5000
Sp
ecific
Activi
ty (
µm
ol/m
in/m
g)
0
2
4
6
8
10
12
14
Vmax = 8.9
Km = 2309.4
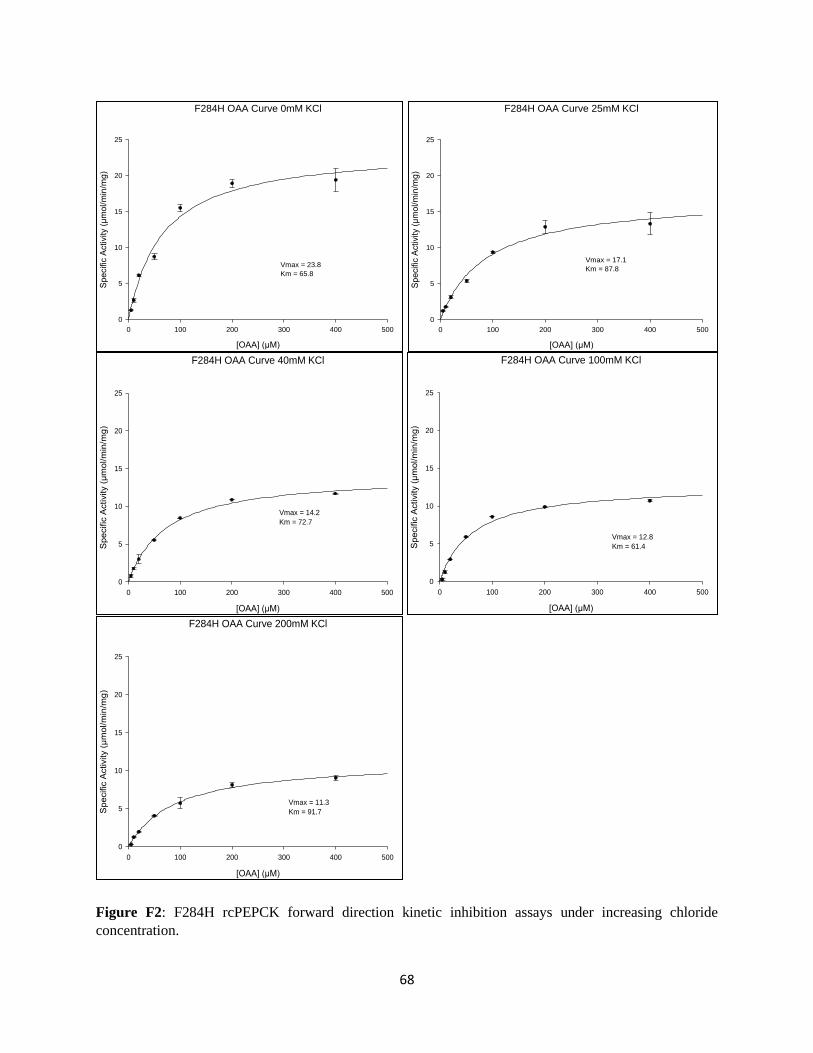
68
Figure F2: F284H rcPEPCK forward direction kinetic inhibition assays under increasing chloride
concentration.
F284H OAA Curve 0mM KCl
[OAA] (µM)
0 100 200 300 400 500
Specific
Activity (
µm
ol/m
in/m
g)
0
5
10
15
20
25
Vmax = 23.8
Km = 65.8
F284H OAA Curve 25mM KCl
[OAA] (µM)
0 100 200 300 400 500
Specific
Activity (
µm
ol/m
in/m
g)
0
5
10
15
20
25
Vmax = 17.1
Km = 87.8
F284H OAA Curve 40mM KCl
[OAA] (µM)
0 100 200 300 400 500
Spe
cific
Activity (
µm
ol/m
in/m
g)
0
5
10
15
20
25
Vmax = 14.2
Km = 72.7
F284H OAA Curve 100mM KCl
[OAA] (µM)
0 100 200 300 400 500
Specific
Activity (
µm
ol/m
in/m
g)
0
5
10
15
20
25
Vmax = 12.8
Km = 61.4
F284H OAA Curve 200mM KCl
[OAA] (µM)
0 100 200 300 400 500
Specific
Activity (
µm
ol/m
in/m
g)
0
5
10
15
20
25
Vmax = 11.3
Km = 91.7
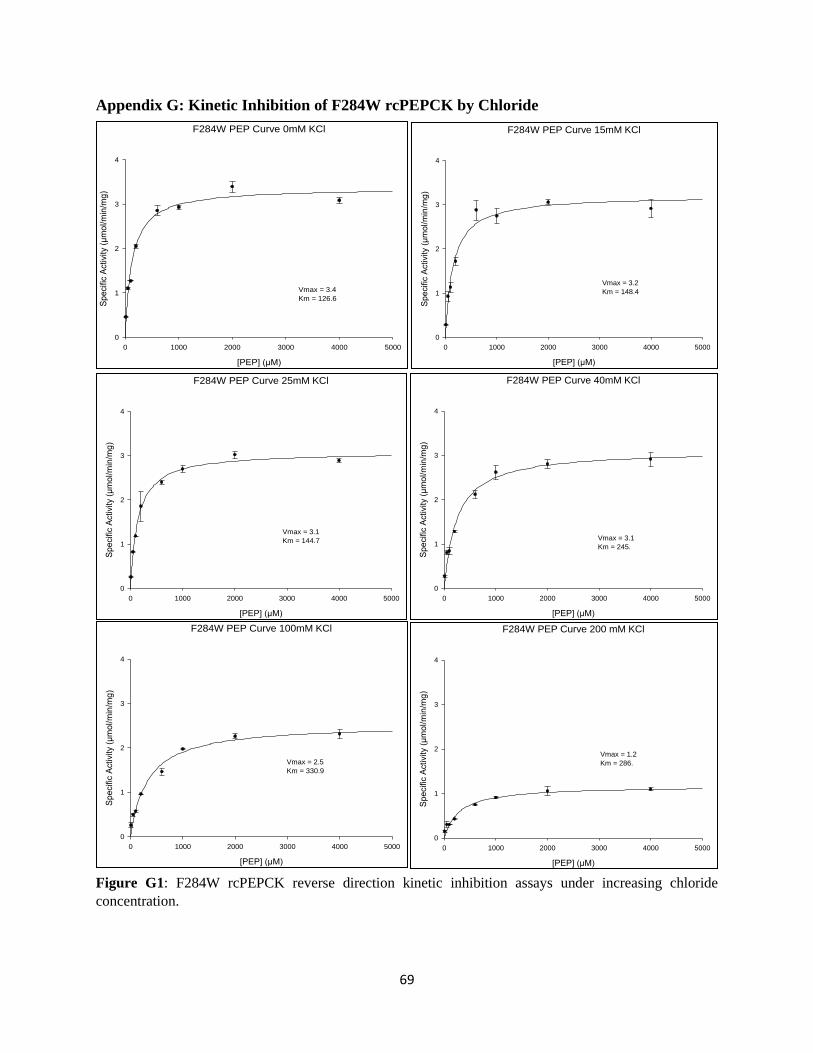
69
Appendix G: Kinetic Inhibition of F284W rcPEPCK by Chloride
Figure G1: F284W rcPEPCK reverse direction kinetic inhibition assays under increasing chloride
concentration.
F284W PEP Curve 0mM KCl
[PEP] (µM)
0 1000 2000 3000 4000 5000
Sp
ecific
Activi
ty (
µm
ol/m
in/m
g)
0
1
2
3
4
Vmax = 3.4
Km = 126.6
F284W PEP Curve 15mM KCl
[PEP] (µM)
0 1000 2000 3000 4000 5000
Spe
cific
Activity (
µm
ol/m
in/m
g)
0
1
2
3
4
Vmax = 3.2
Km = 148.4
F284W PEP Curve 25mM KCl
[PEP] (µM)
0 1000 2000 3000 4000 5000
Spe
cific
Activity (
µm
ol/m
in/m
g)
0
1
2
3
4
Vmax = 3.1
Km = 144.7
F284W PEP Curve 40mM KCl
[PEP] (µM)
0 1000 2000 3000 4000 5000
Sp
ecific
Activity (
µm
ol/m
in/m
g)
0
1
2
3
4
Vmax = 3.1
Km = 245.
F284W PEP Curve 100mM KCl
[PEP] (µM)
0 1000 2000 3000 4000 5000
Sp
ecific
Activity (
µm
ol/m
in/m
g)
0
1
2
3
4
Vmax = 2.5
Km = 330.9
F284W PEP Curve 200 mM KCl
[PEP] (µM)
0 1000 2000 3000 4000 5000
Spe
cific
Activity (
µm
ol/m
in/m
g)
0
1
2
3
4
Vmax = 1.2
Km = 286.
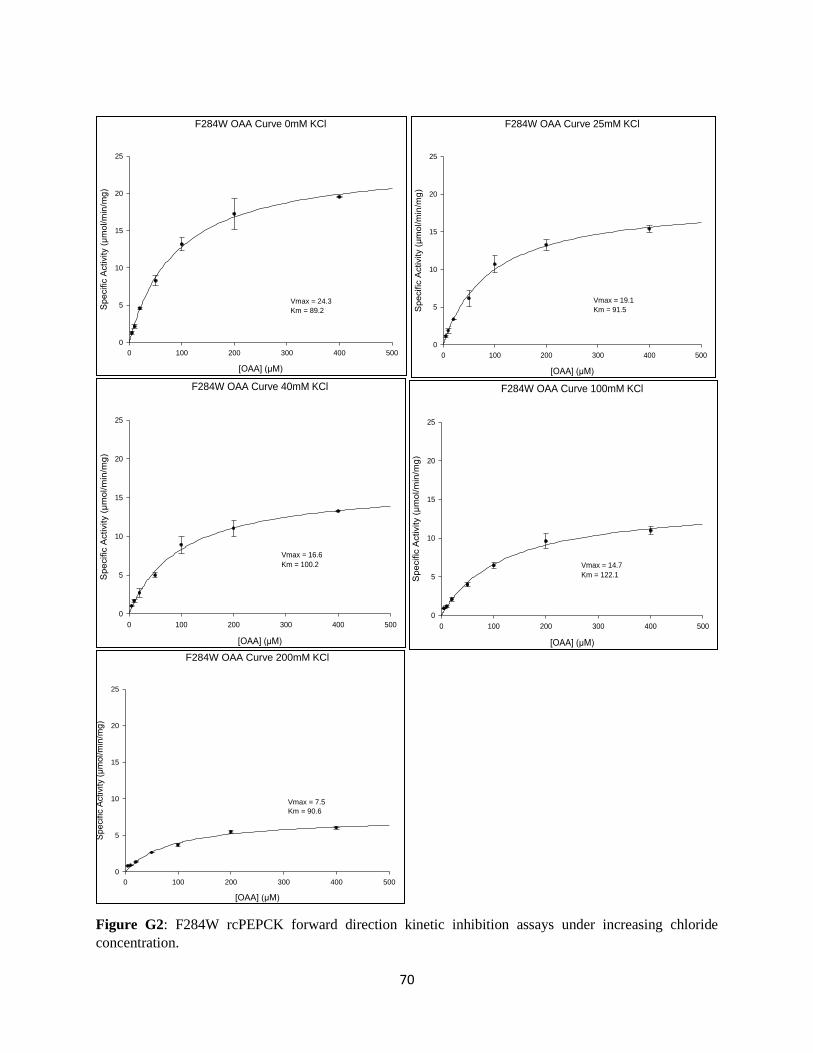
70
Figure G2: F284W rcPEPCK forward direction kinetic inhibition assays under increasing chloride
concentration.
F284W OAA Curve 0mM KCl
[OAA] (µM)
0 100 200 300 400 500
Sp
ecific
Activity (
µm
ol/m
in/m
g)
0
5
10
15
20
25
Vmax = 24.3
Km = 89.2
F284W OAA Curve 25mM KCl
[OAA] (µM)
0 100 200 300 400 500
Sp
ecific
Activity (
µm
ol/m
in/m
g)
0
5
10
15
20
25
Vmax = 19.1
Km = 91.5
F284W OAA Curve 40mM KCl
[OAA] (µM)
0 100 200 300 400 500
Sp
ecific
Activity (
µm
ol/m
in/m
g)
0
5
10
15
20
25
Vmax = 16.6
Km = 100.2
F284W OAA Curve 100mM KCl
[OAA] (µM)
0 100 200 300 400 500
Specific
Activity (
µm
ol/m
in/m
g)
0
5
10
15
20
25
Vmax = 14.7
Km = 122.1
F284W OAA Curve 200mM KCl
[OAA] (µM)
0 100 200 300 400 500
Spe
cific
Activity (
µm
ol/m
in/m
g)
0
5
10
15
20
25
Vmax = 7.5
Km = 90.6
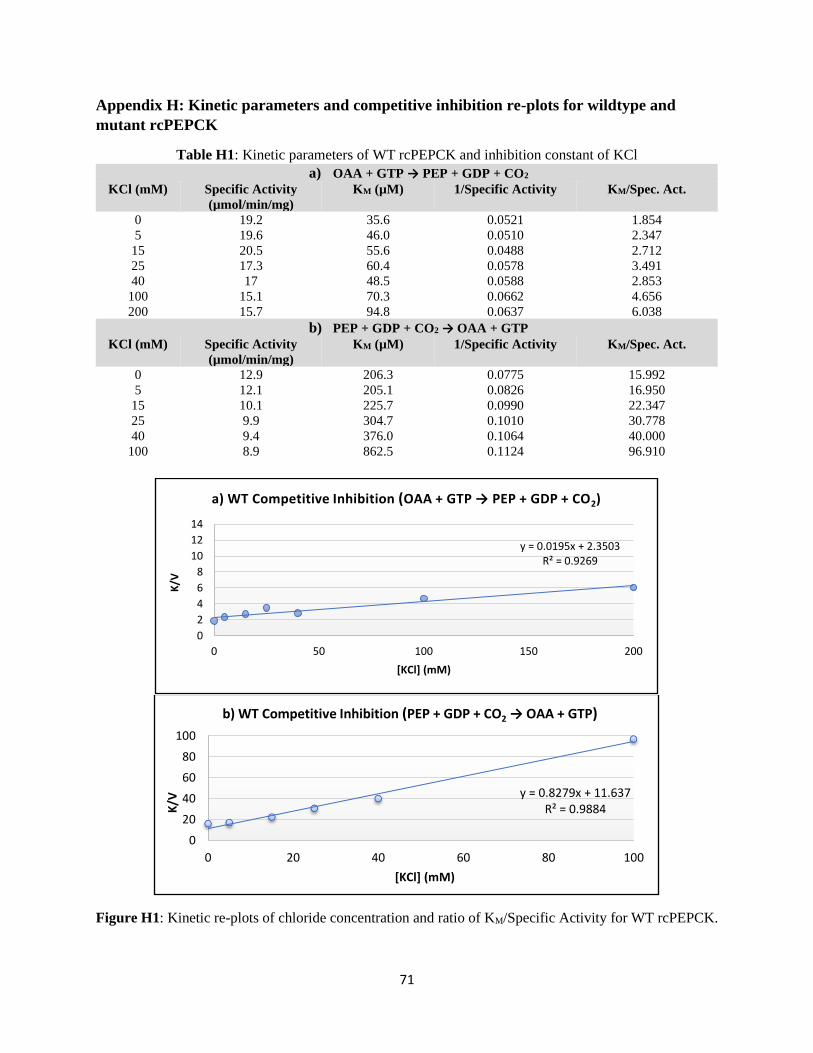
71
Appendix H: Kinetic parameters and competitive inhibition re-plots for wildtype and
mutant rcPEPCK
Table H1: Kinetic parameters of WT rcPEPCK and inhibition constant of KCl
a) OAA + GTP → PEP + GDP + CO2
KCl (mM) Specific Activity
(µmol/min/mg)
KM (µM) 1/Specific Activity KM/Spec. Act.
0 19.2 35.6 0.0521 1.854
5 19.6 46.0 0.0510 2.347
15 20.5 55.6 0.0488 2.712
25 17.3 60.4 0.0578 3.491
40 17 48.5 0.0588 2.853
100 15.1 70.3 0.0662 4.656
200 15.7 94.8 0.0637 6.038
b) PEP + GDP + CO2 → OAA + GTP
KCl (mM) Specific Activity
(µmol/min/mg)
KM (µM) 1/Specific Activity KM/Spec. Act.
0 12.9 206.3 0.0775 15.992
5 12.1 205.1 0.0826 16.950
15 10.1 225.7 0.0990 22.347
25 9.9 304.7 0.1010 30.778
40 9.4 376.0 0.1064 40.000
100 8.9 862.5 0.1124 96.910
Figure H1: Kinetic re-plots of chloride concentration and ratio of KM/Specific Activity for WT rcPEPCK.
y = 0.0195x + 2.3503R² = 0.9269
0
2
4
6
8
10
12
14
0 50 100 150 200
K/V
[KCl] (mM)
a) WT Competitive Inhibition (OAA + GTP → PEP + GDP + CO2)
y = 0.8279x + 11.637R² = 0.9884
0
20
40
60
80
100
0 20 40 60 80 100
K/V
[KCl] (mM)
b) WT Competitive Inhibition (PEP + GDP + CO2 → OAA + GTP)
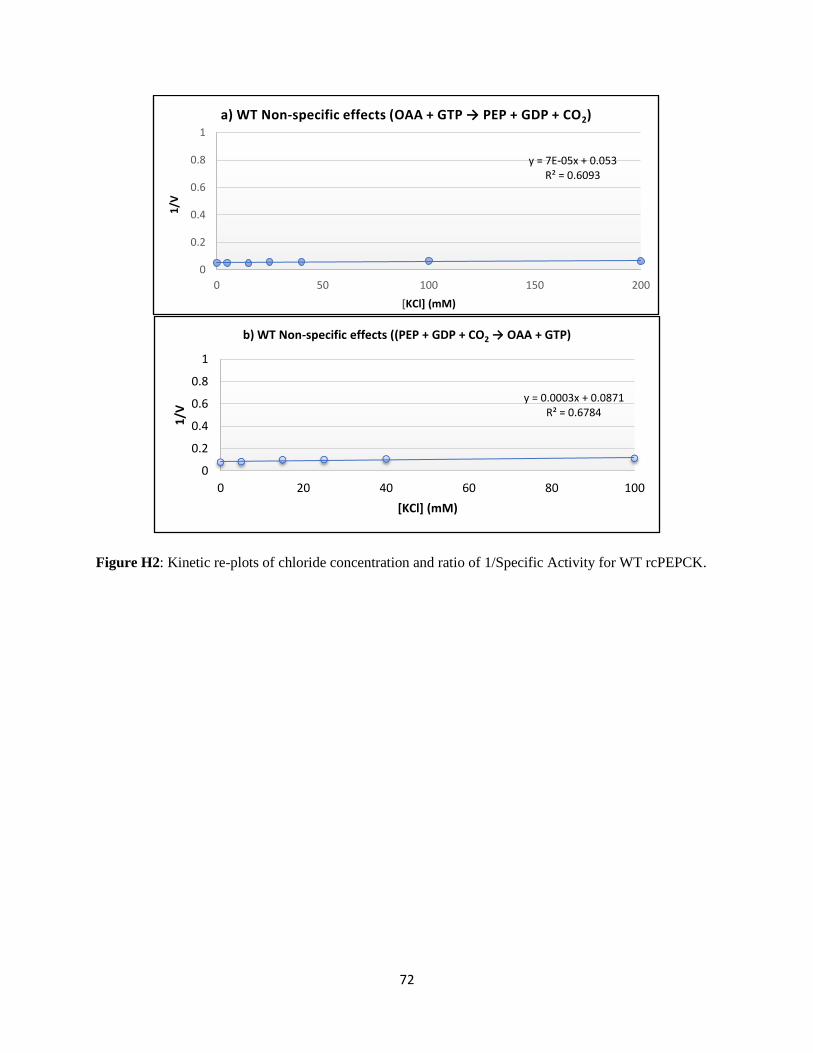
72
Figure H2: Kinetic re-plots of chloride concentration and ratio of 1/Specific Activity for WT rcPEPCK.
y = 7E-05x + 0.053R² = 0.6093
0
0.2
0.4
0.6
0.8
1
0 50 100 150 200
1/V
[KCl] (mM)
a) WT Non-specific effects (OAA + GTP → PEP + GDP + CO2)
y = 0.0003x + 0.0871R² = 0.6784
0
0.2
0.4
0.6
0.8
1
0 20 40 60 80 100
1/V
[KCl] (mM)
b) WT Non-specific effects ((PEP + GDP + CO2 → OAA + GTP)
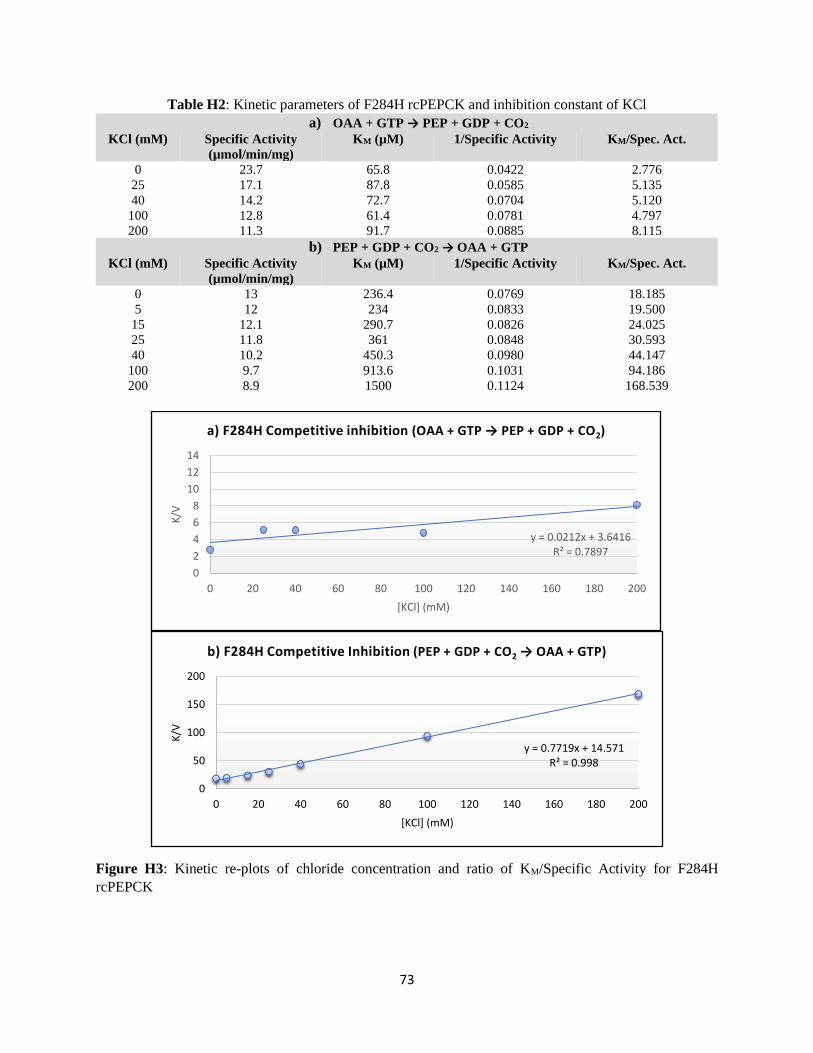
73
Table H2: Kinetic parameters of F284H rcPEPCK and inhibition constant of KCl
a) OAA + GTP → PEP + GDP + CO2
KCl (mM) Specific Activity
(µmol/min/mg)
KM (µM) 1/Specific Activity KM/Spec. Act.
0 23.7 65.8 0.0422 2.776
25 17.1 87.8 0.0585 5.135
40 14.2 72.7 0.0704 5.120
100 12.8 61.4 0.0781 4.797
200 11.3 91.7 0.0885 8.115
b) PEP + GDP + CO2 → OAA + GTP
KCl (mM) Specific Activity
(µmol/min/mg)
KM (µM) 1/Specific Activity KM/Spec. Act.
0 13 236.4 0.0769 18.185
5 12 234 0.0833 19.500
15 12.1 290.7 0.0826 24.025
25 11.8 361 0.0848 30.593
40 10.2 450.3 0.0980 44.147
100 9.7 913.6 0.1031 94.186
200 8.9 1500 0.1124 168.539
Figure H3: Kinetic re-plots of chloride concentration and ratio of KM/Specific Activity for F284H
rcPEPCK
y = 0.0212x + 3.6416R² = 0.7897
0
2
4
6
8
10
12
14
0 20 40 60 80 100 120 140 160 180 200
K/V
[KCl] (mM)
a) F284H Competitive inhibition (OAA + GTP → PEP + GDP + CO2)
y = 0.7719x + 14.571R² = 0.998
0
50
100
150
200
0 20 40 60 80 100 120 140 160 180 200
K/V
[KCl] (mM)
b) F284H Competitive Inhibition (PEP + GDP + CO2 → OAA + GTP)
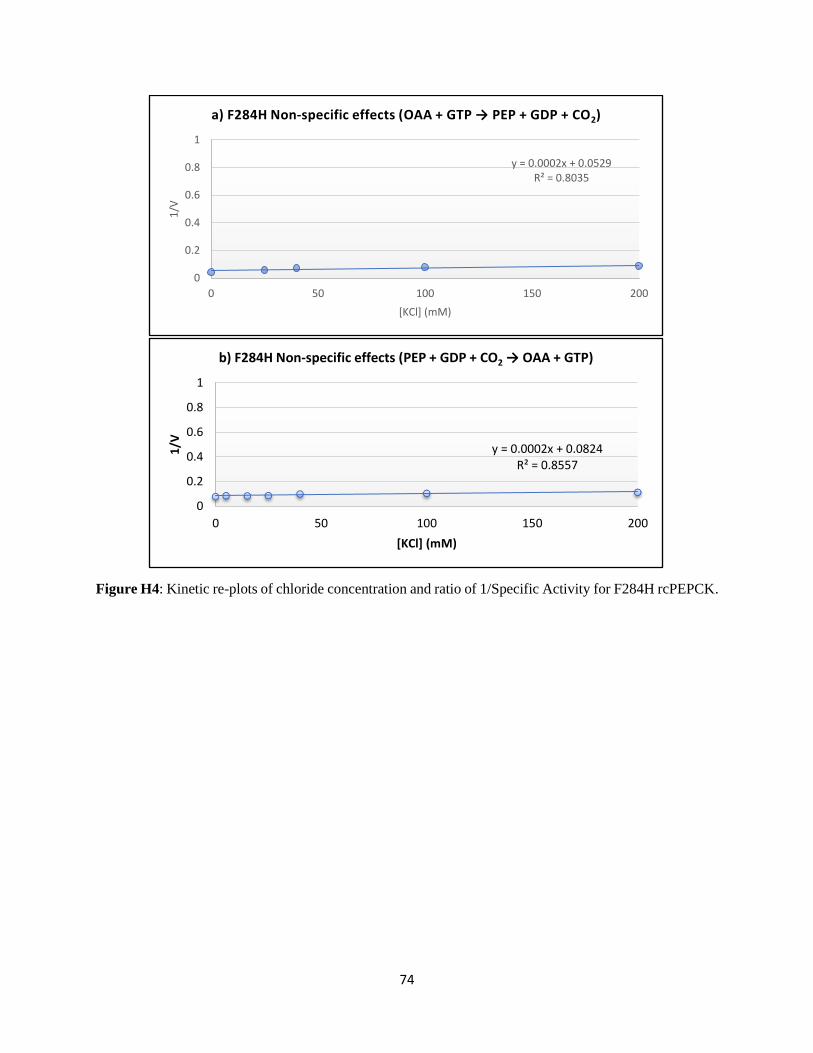
74
Figure H4: Kinetic re-plots of chloride concentration and ratio of 1/Specific Activity for F284H rcPEPCK.
y = 0.0002x + 0.0529R² = 0.8035
0
0.2
0.4
0.6
0.8
1
0 50 100 150 200
1/V
[KCl] (mM)
a) F284H Non-specific effects (OAA + GTP → PEP + GDP + CO2)
y = 0.0002x + 0.0824R² = 0.8557
0
0.2
0.4
0.6
0.8
1
0 50 100 150 200
1/V
[KCl] (mM)
b) F284H Non-specific effects (PEP + GDP + CO2 → OAA + GTP)
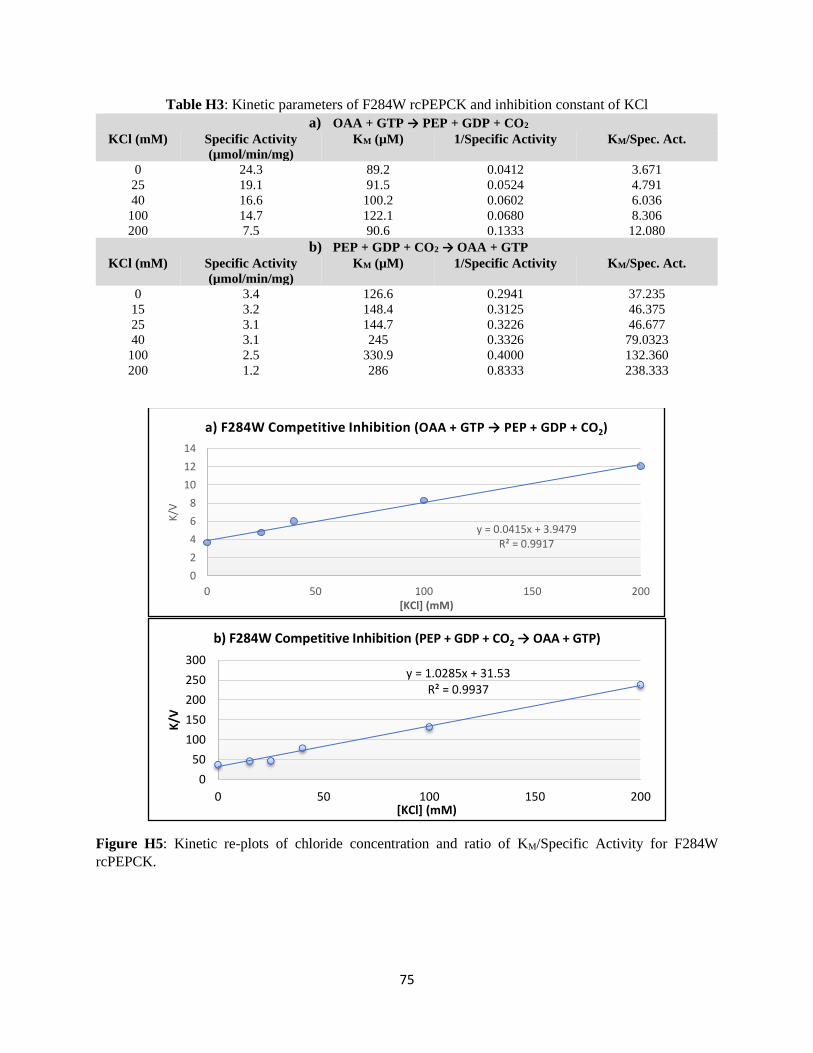
75
Table H3: Kinetic parameters of F284W rcPEPCK and inhibition constant of KCl
a) OAA + GTP → PEP + GDP + CO2
KCl (mM) Specific Activity
(µmol/min/mg)
KM (µM) 1/Specific Activity KM/Spec. Act.
0 24.3 89.2 0.0412 3.671
25 19.1 91.5 0.0524 4.791
40 16.6 100.2 0.0602 6.036
100 14.7 122.1 0.0680 8.306
200 7.5 90.6 0.1333 12.080
b) PEP + GDP + CO2 → OAA + GTP
KCl (mM) Specific Activity
(µmol/min/mg)
KM (µM) 1/Specific Activity KM/Spec. Act.
0 3.4 126.6 0.2941 37.235
15 3.2 148.4 0.3125 46.375
25 3.1 144.7 0.3226 46.677
40 3.1 245 0.3326 79.0323
100 2.5 330.9 0.4000 132.360
200 1.2 286 0.8333 238.333
Figure H5: Kinetic re-plots of chloride concentration and ratio of KM/Specific Activity for F284W
rcPEPCK.
y = 0.0415x + 3.9479R² = 0.9917
0
2
4
6
8
10
12
14
0 50 100 150 200
K/V
[KCl] (mM)
a) F284W Competitive Inhibition (OAA + GTP → PEP + GDP + CO2)
y = 1.0285x + 31.53R² = 0.9937
0
50
100
150
200
250
300
0 50 100 150 200
K/V
[KCl] (mM)
b) F284W Competitive Inhibition (PEP + GDP + CO2 → OAA + GTP)
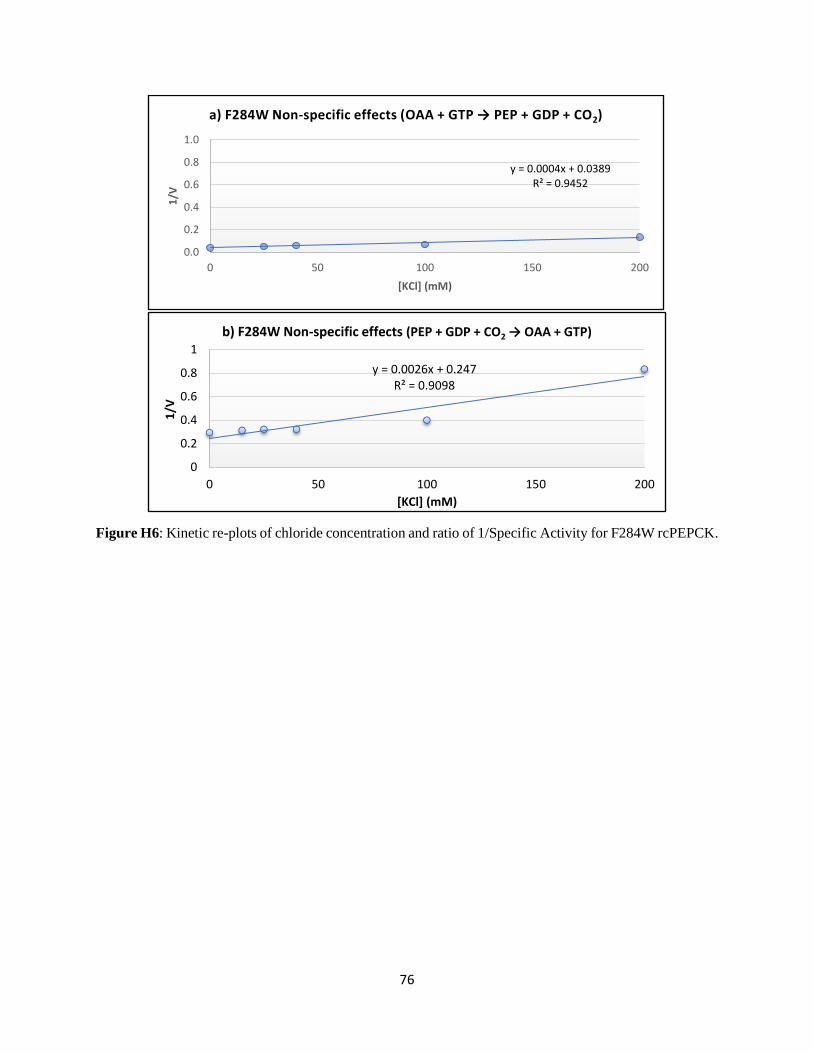
76
Figure H6: Kinetic re-plots of chloride concentration and ratio of 1/Specific Activity for F284W rcPEPCK.
y = 0.0004x + 0.0389R² = 0.9452
0.0
0.2
0.4
0.6
0.8
1.0
0 50 100 150 200
1/V
[KCl] (mM)
a) F284W Non-specific effects (OAA + GTP → PEP + GDP + CO2)
y = 0.0026x + 0.247R² = 0.9098
0
0.2
0.4
0.6
0.8
1
0 50 100 150 200
1/V
[KCl] (mM)
b) F284W Non-specific effects (PEP + GDP + CO2 → OAA + GTP)
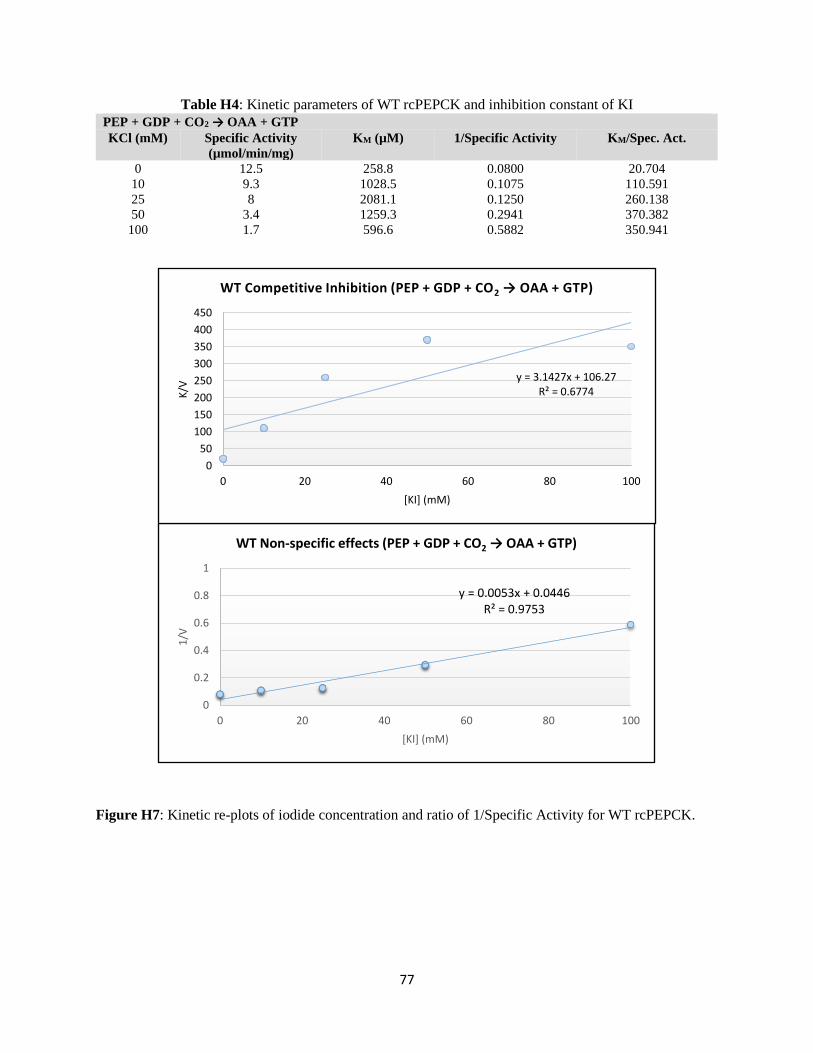
77
Table H4: Kinetic parameters of WT rcPEPCK and inhibition constant of KI PEP + GDP + CO2 → OAA + GTP
KCl (mM) Specific Activity
(µmol/min/mg)
KM (µM) 1/Specific Activity KM/Spec. Act.
0 12.5 258.8 0.0800 20.704
10 9.3 1028.5 0.1075 110.591
25 8 2081.1 0.1250 260.138
50 3.4 1259.3 0.2941 370.382
100 1.7 596.6 0.5882 350.941
Figure H7: Kinetic re-plots of iodide concentration and ratio of 1/Specific Activity for WT rcPEPCK.
y = 0.0053x + 0.0446R² = 0.9753
0
0.2
0.4
0.6
0.8
1
0 20 40 60 80 100
1/V
[KI] (mM)
WT Non-specific effects (PEP + GDP + CO2 → OAA + GTP)
y = 3.1427x + 106.27R² = 0.6774
0
50
100
150
200
250
300
350
400
450
0 20 40 60 80 100
K/V
[KI] (mM)
WT Competitive Inhibition (PEP + GDP + CO2 → OAA + GTP)
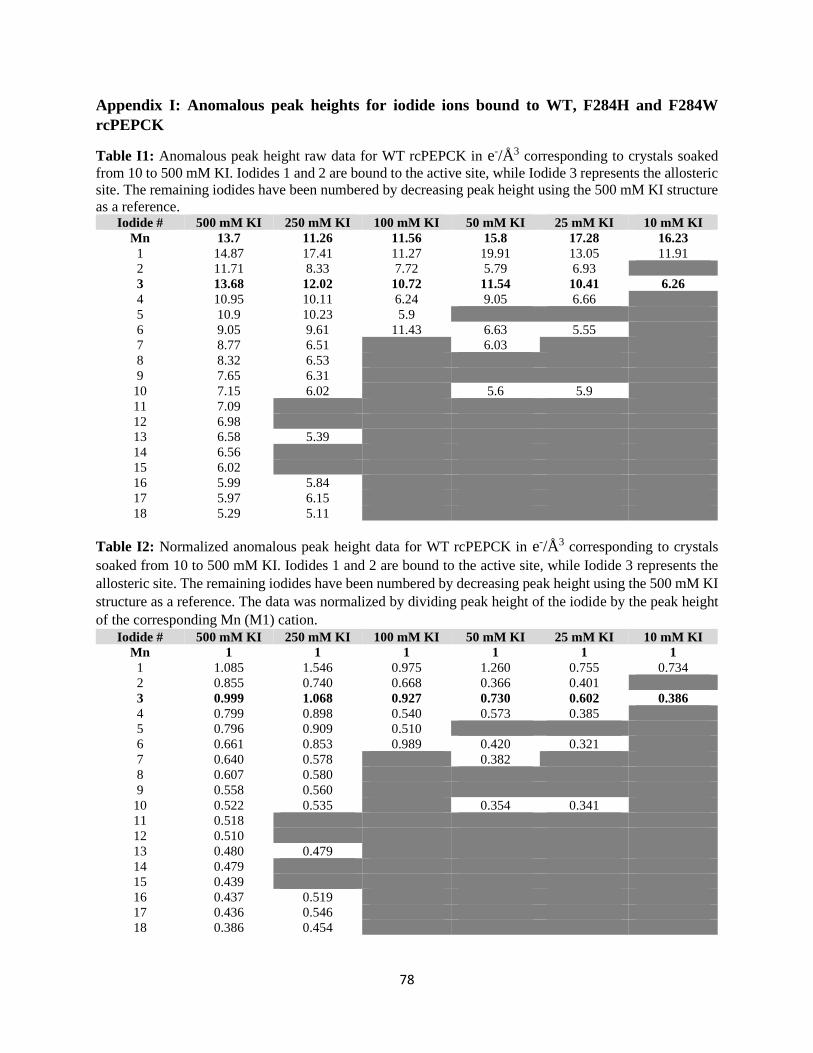
78
Appendix I: Anomalous peak heights for iodide ions bound to WT, F284H and F284W
rcPEPCK
Table I1: Anomalous peak height raw data for WT rcPEPCK in e-/Å3 corresponding to crystals soaked
from 10 to 500 mM KI. Iodides 1 and 2 are bound to the active site, while Iodide 3 represents the allosteric
site. The remaining iodides have been numbered by decreasing peak height using the 500 mM KI structure
as a reference. Iodide # 500 mM KI 250 mM KI 100 mM KI 50 mM KI 25 mM KI 10 mM KI
Mn 13.7 11.26 11.56 15.8 17.28 16.23
1 14.87 17.41 11.27 19.91 13.05 11.91
2 11.71 8.33 7.72 5.79 6.93
3 13.68 12.02 10.72 11.54 10.41 6.26
4 10.95 10.11 6.24 9.05 6.66
5 10.9 10.23 5.9
6 9.05 9.61 11.43 6.63 5.55
7 8.77 6.51 6.03
8 8.32 6.53
9 7.65 6.31
10 7.15 6.02 5.6 5.9
11 7.09
12 6.98
13 6.58 5.39
14 6.56
15 6.02
16 5.99 5.84
17 5.97 6.15
18 5.29 5.11
Table I2: Normalized anomalous peak height data for WT rcPEPCK in e-/Å3 corresponding to crystals
soaked from 10 to 500 mM KI. Iodides 1 and 2 are bound to the active site, while Iodide 3 represents the
allosteric site. The remaining iodides have been numbered by decreasing peak height using the 500 mM KI
structure as a reference. The data was normalized by dividing peak height of the iodide by the peak height
of the corresponding Mn (M1) cation.
Iodide # 500 mM KI 250 mM KI 100 mM KI 50 mM KI 25 mM KI 10 mM KI
Mn 1 1 1 1 1 1
1 1.085 1.546 0.975 1.260 0.755 0.734
2 0.855 0.740 0.668 0.366 0.401
3 0.999 1.068 0.927 0.730 0.602 0.386
4 0.799 0.898 0.540 0.573 0.385
5 0.796 0.909 0.510
6 0.661 0.853 0.989 0.420 0.321
7 0.640 0.578 0.382
8 0.607 0.580
9 0.558 0.560
10 0.522 0.535 0.354 0.341
11 0.518
12 0.510
13 0.480 0.479
14 0.479
15 0.439
16 0.437 0.519
17 0.436 0.546
18 0.386 0.454
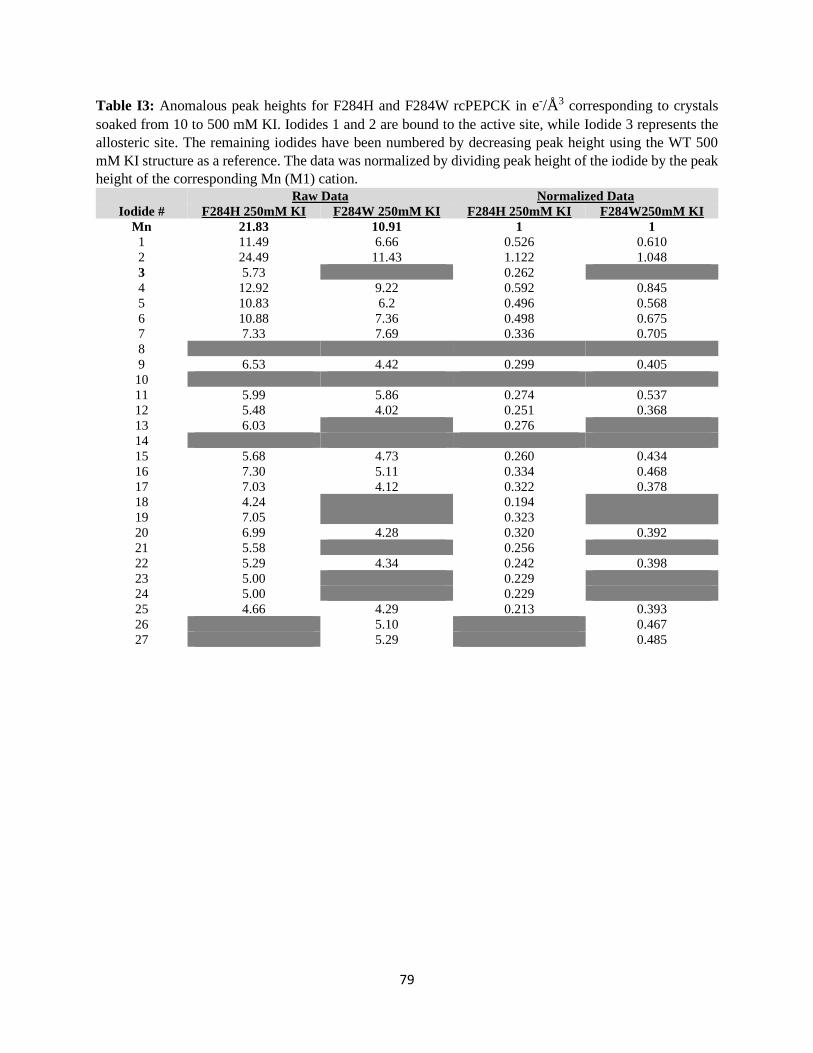
79
Table I3: Anomalous peak heights for F284H and F284W rcPEPCK in e-/Å3 corresponding to crystals
soaked from 10 to 500 mM KI. Iodides 1 and 2 are bound to the active site, while Iodide 3 represents the
allosteric site. The remaining iodides have been numbered by decreasing peak height using the WT 500
mM KI structure as a reference. The data was normalized by dividing peak height of the iodide by the peak
height of the corresponding Mn (M1) cation.
Raw Data Normalized Data
Iodide # F284H 250mM KI F284W 250mM KI F284H 250mM KI F284W250mM KI
Mn 21.83 10.91 1 1
1 11.49 6.66 0.526 0.610
2 24.49 11.43 1.122 1.048
3 5.73 0.262
4 12.92 9.22 0.592 0.845
5 10.83 6.2 0.496 0.568
6 10.88 7.36 0.498 0.675
7 7.33 7.69 0.336 0.705
8
9 6.53 4.42 0.299 0.405
10
11 5.99 5.86 0.274 0.537
12 5.48 4.02 0.251 0.368
13 6.03 0.276
14
15 5.68 4.73 0.260 0.434
16 7.30 5.11 0.334 0.468
17 7.03 4.12 0.322 0.378
18 4.24 0.194
19 7.05 0.323
20 6.99 4.28 0.320 0.392
21 5.58 0.256
22 5.29 4.34 0.242 0.398
23 5.00 0.229
24 5.00 0.229
25 4.66 4.29 0.213 0.393
26 5.10 0.467
27 5.29 0.485
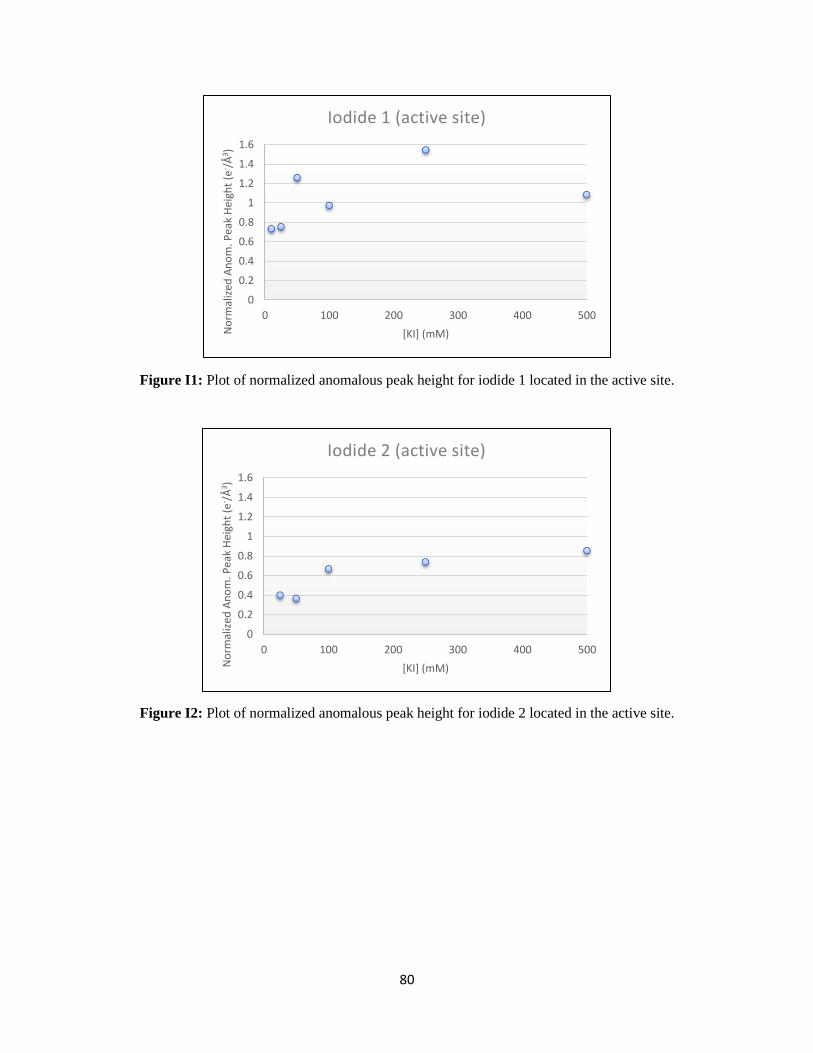
80
Figure I1: Plot of normalized anomalous peak height for iodide 1 located in the active site.
Figure I2: Plot of normalized anomalous peak height for iodide 2 located in the active site.
0
0.2
0.4
0.6
0.8
1
1.2
1.4
1.6
0 100 200 300 400 500
No
rmal
ized
An
om
. Pea
k H
eigh
t (e
- /Å
3 )
[KI] (mM)
Iodide 1 (active site)
0
0.2
0.4
0.6
0.8
1
1.2
1.4
1.6
0 100 200 300 400 500
No
rmal
ized
An
om
. Pea
k H
eigh
t (e
- /Å
3 )
[KI] (mM)
Iodide 2 (active site)
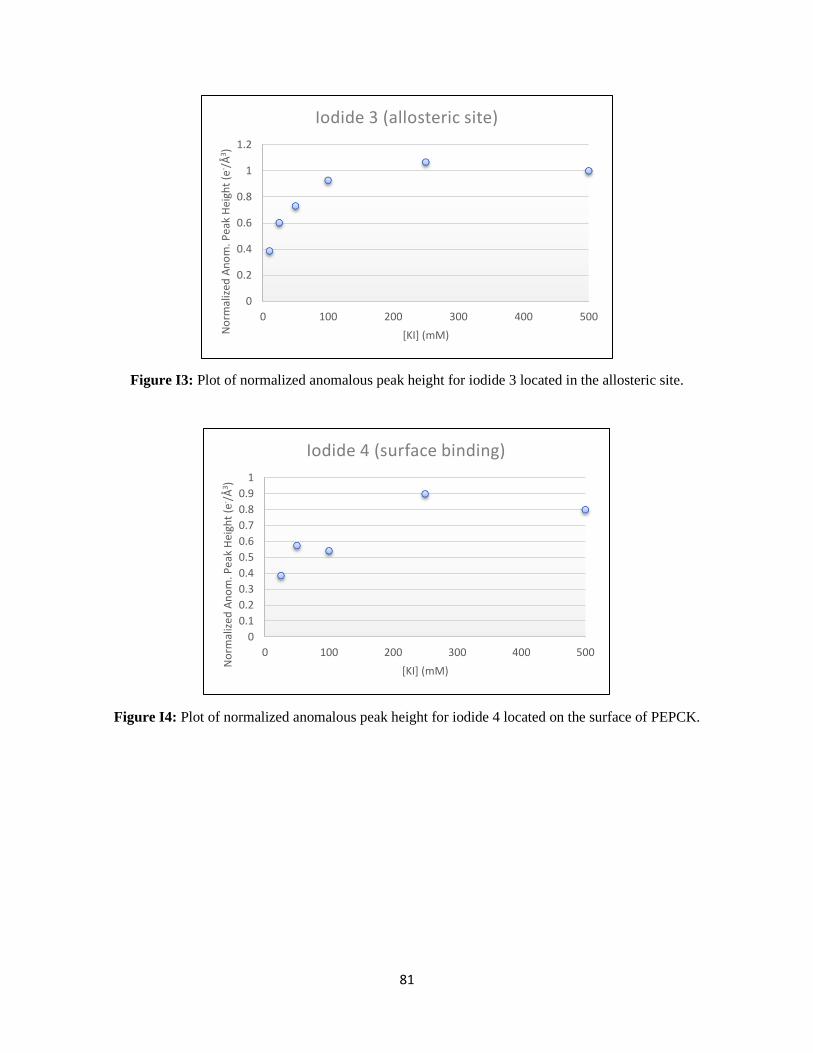
81
Figure I3: Plot of normalized anomalous peak height for iodide 3 located in the allosteric site.
Figure I4: Plot of normalized anomalous peak height for iodide 4 located on the surface of PEPCK.
0
0.2
0.4
0.6
0.8
1
1.2
0 100 200 300 400 500
No
rmal
ized
An
om
. Pea
k H
eigh
t (e
- /Å
3 )
[KI] (mM)
Iodide 3 (allosteric site)
0
0.1
0.2
0.3
0.4
0.5
0.6
0.7
0.8
0.9
1
0 100 200 300 400 500
No
rmal
ized
An
om
. Pea
k H
eigh
t (e
- /Å
3 )
[KI] (mM)
Iodide 4 (surface binding)
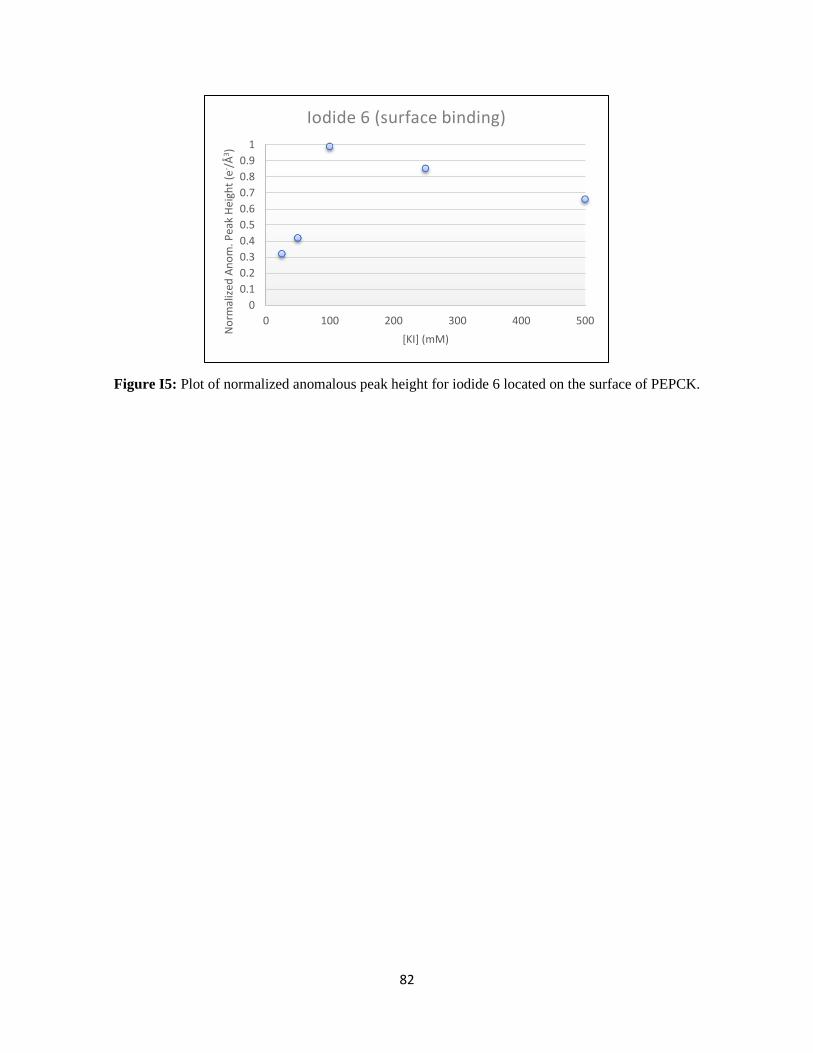
82
Figure I5: Plot of normalized anomalous peak height for iodide 6 located on the surface of PEPCK.
0
0.1
0.2
0.3
0.4
0.5
0.6
0.7
0.8
0.9
1
0 100 200 300 400 500
No
rmal
ized
An
om
. Pea
k H
eigh
t (e
- /Å
3 )
[KI] (mM)
Iodide 6 (surface binding)