Embed Size (px)
Citation preview
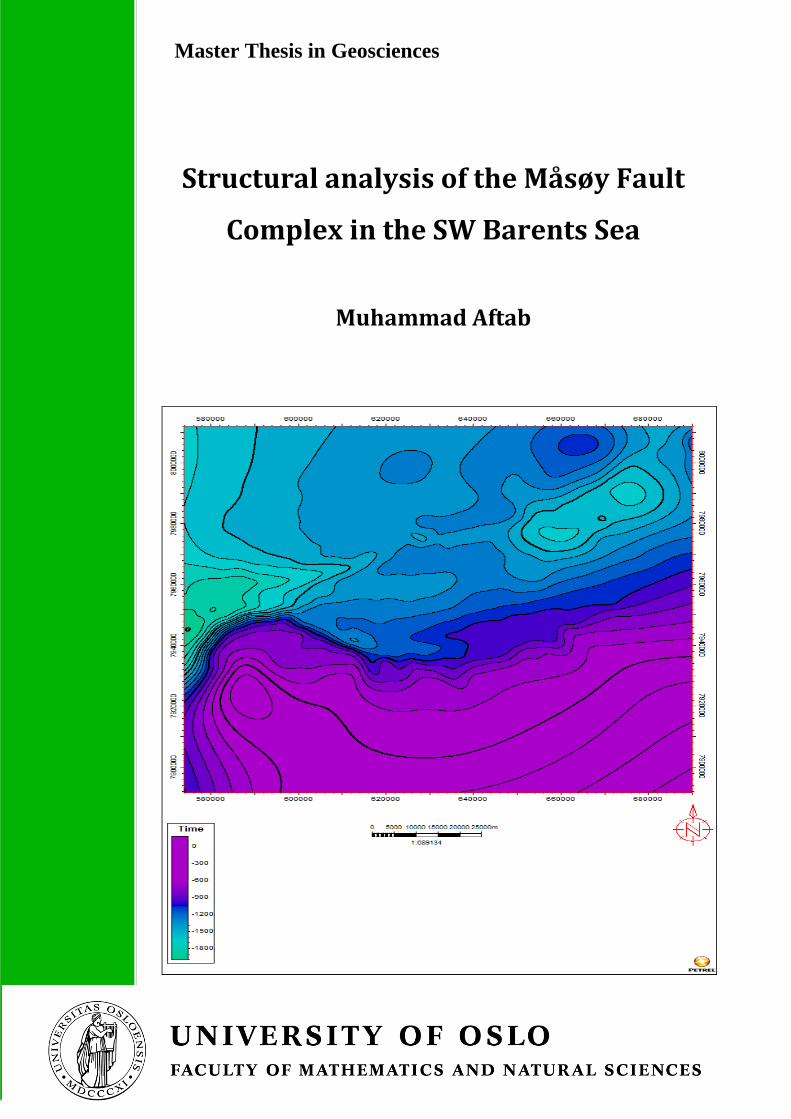
Structural analysis of the Måsøy Fault
Complex in the SW Barents Sea
Muhammad Aftab
Master Thesis in Geosciences

Structural analysis of the Måsøy Fault
Complex in the SW Barents Sea.
Muhammad Aftab
Master Thesis in Geosciences
Discipline: Petroleum Geology and Geophysics
Department of Geosciences
Faculty of Mathematics and Natural Sciences
UNIVERSITY OF OSLO
30th June, 2011


© Muhammad Aftab, 2011
Tutor(s): Professor Roy Helge Gabrielsen, Professor Jan Inge Faleide and Dr. Michael
Heeremans,UIO
This work is published digitally through DUO – Digitale Utgivelser ved UiO
http://www.duo.uio.no
It is also catalogued in BIBSYS (http://www.bibsys.no/english)
All rights reserved. No part of this publication may be reproduced or transmitted, in any form or by any means,
without permission.

Acknowledgements
I feel instigated from within to extend my thanks to “Allmighty Allah” who’s
magnanimous and chivalrous enabled me to perceive and pursue my ambitions and
objectives. Special praises to “Prophet Mohammad (PBUH)” how is bellwether for
humanity as a whole.
I offer my sincerest gratitude to my supervisors Professor Roy Helge Gabrielsen,
Professor Jan Inge Faleide and Dr. Michael Heeremans as they supported me
throughout my thesis with their patience and knowledge whilst allowing me the room
to work in my own way. I attribute the level of my Masters Degree to their
encouragement and effort and without them this thesis, too, would not have been
completed or written.
Special thanks to TGS-Nopec for providing seismic data set in order to proceed with
the work.
In the end my whole hearted and incessant gratitude to my loving parents and all my
family members who always prayed for me, appreciated, encouraged, and helped me
during my studies.
Abstract
Study area for this thesis work is the Måsøy Fault Complex located in the SW Barents
Sea, which is the southern basin marginal fault of the Nordkapp Basin. It represents
the structural separation between the Nordkapp Basin and the Finnmark Platform.
For the detailed structural analysis of the study area 2D and 3D seismic data have
been used along with three different wells in order to have a proper Stratigraphic
control. All interpretation work has been carried out using Petrel (edition 2009).
The Måsøy Fault Complex is basically an extensional structure and is characterized by
one major high-angle normal fault indicated by three contrasting strikes from west to
east. On the basis of different strikes the fault complex can be divided into three
segments. In segment 1 the strike is SW-NE, in segment 2 the strike is NW-SE and
segment 3 has a SW-NE strike. The hanging wall of the major fault is more deformed
as compared to the footwall. The entire area is dominated by normal faults along with
minor influence of inversion. Partial impact of halokenesis has also been observed.
The dominant striking trend of the minor faults is NE-SW.
On the basis of results and previous studies it has been noticed that Måsøy Fault
Complex is associated with thick skin tectonics. The study area underwent two
different rift phases. The first rift phase initiated during Late Devonian to Early
Carboniferous and the second rifting event took place during Mid Jurassic to Early
Cretaceous. During the tectonic evolution of the Måsøy Fault Complex it has been
observed that major fault was active during different times resulting in fault
controlled subsidence.
Key words: Måsøy Fault Complex, SW Barents Sea, Nordkapp Basin, Finnmark
Platform, major normal fault, thick skin tectonics, halokinesis, inversion.
Contents
1. INTRODUCTION…………………………………………………………-………1.
2. REGIONAL TECTONIC SETTING………...……………………………-……..3.
2.1 GeologicalEvolution……………………………….……………………………3.
2.1.1 Devonian to Carboniferous..…….…………………….…………--……3.
2.1.2 Middle Carboniferous to Permian………………….….…….……--……4.
2.1.3 Triassic to Jurassic…………………………………….…….……………4.
2.1.4 Late Jurassic to Early Cretaceous……………………….………………..4.
2.1.5 Tertiary Deformation………………………………….…….……………5.
2.2 SOUTH WEST BARENTS SEA….…………………………….….……………6.
2.2.1 Oceanic Basin.……………………………………………...…………….7.
2.2.2 Continent ocean transition….…………………………….….…………..7.
2.2.3 Tertiary marginal basin……………………………….….………………7.
2.2.4 Cretaceous basins………………………………………….……………..8.
2.2.5 Intrabasinal highs…………………..……………………………………8.
2.2.6 Cretaceous boundary faults………………………………..…………….9.
2.2.7 Eastern platform region………………………………...….…………….9.
2.3 STRATIGRAPHY………………………….…………………….………….….11.
2.3.1 Pre-middle Jurassic……………………………….…….……..…..….12.
2.3.2 Middle-upper Jurassic…………………………….….……….….…..12.
2.3.3 Lower Cretaceous…………………...……………….…….….……...12.
2.3.4 Upper Cretaceous…………………………………….…….…...…….13.
2.3.5 Palaeogene………………………………………….…….…….…..…13.
2.3.6 Neogene-Quaternary………………………………….………..…….13.
2.4 THE STUDY AREA………………..………………………………………….14.
3. DATA AND METHOD…………………..………………………………….……16.
3.1 SEISMIC DATA………….……………………….……………………………16.
3.2 WELL DATA…………………………………………………………….……..17.
3.2.1 Well 7125/4-1……………………………...…………………………….17.
3.2.2 Well 7125/4-1………………………..……………………….………….18.
3.2.3 Well 7124/3-1…………………………...…………….…………………18.
3.3 METHOD…………………………………………………….…………………21.
3.3.1 Data import……………………………………………………………..21.
3.3.2 Seismic interpretation..………………..……………….………..……..21.
3.3.3 Map generation.……….…………………………….……………...….22.
4. SEISMIC INTERPRETATION……………………...…………………………..23.
4.1 SEISMIC TO WELL TIE……………………………….………….……….….23.
4.2 SELECTED SEISMIC REFLECTIONS………………………….……..……..27.
4.2.1 C2……………………………………………………….………..…….27.
4.2.2 C1……………………………………………….……….…………..….30.
4.2.3 LP…………………………………………….………….…………..….30.
4.2.4 ET…………………………………………….…………….…….…….32.
4.2.5 BC…………………………………………….……………….…….….32.
4.3 SELECTED PROFILES…………………………….…………….……………33.
4.3.1 Seismic line E……………………………….…………………………..33.
4.3.2 Seismic line B…………………………………………………………..34.
4.3.3 Seismic line A…………………………………………………………..35.
4.4 STRUCTURAL MAPS……………………………..…………………………..37.
4.4.1 C2…………………….…………………………………………………37.
4.4.2 C1…………………………….…………………………………………38.
4.4.3 LP……………………………………………………………………….40.
4.4.4 ET……………………………………………………………………….42.
4.4.5 BC……………………………………………………………………….44
4.5 FAULT ACTIVITY……….………………….……………………………..….47.
4.5.1 Major fault.….…………………………………………………………..47.
4.5.2 Structural style………………………………….………………………56.
4.5.3 Structures at interpreted horizons………………………………………59.
4.6 HALOKINESIS………………………………………………………………..61.
5. DISCUSSION…………………………...…………………………………………63.
5.1 EVOLUTION OF THE MÅSØY FAULT COMPLEX………………….…….63.
5.1.1 Devonian to Early Carboniferous………………………………………63.
5.1.2 Mid Carboniferous to Mid Permain………………………………..…..64.
5.1.3 Late Permian to Mid Jurassic……………….………………………….66.
5.1.4 Late Jurassic to Early Cretaceous……………….……………..….……67.
5.1.5 Late Cretaceous to Recent………………………………..…….………68.
5.2 FAULT GENESIS……………………….…………………….……………….71.
5.2.1 Early to Late Carboniferous.………………………….……………….71.
5.2.2 Late Carboniferous to Late Permian…………………………….……..71.
5.2.3 Late Permian to Early Triassic…………………………….…..………71.
5.2.4 Early Triassic to Early Cretaceous…………………………..…..……72.

6. CONCLUSION…………………………………………………………………..73.
7. REFERENCE………..…………………………..………………………….……74.

Chapter 1 Introduction
1
1. INTRODUCTION
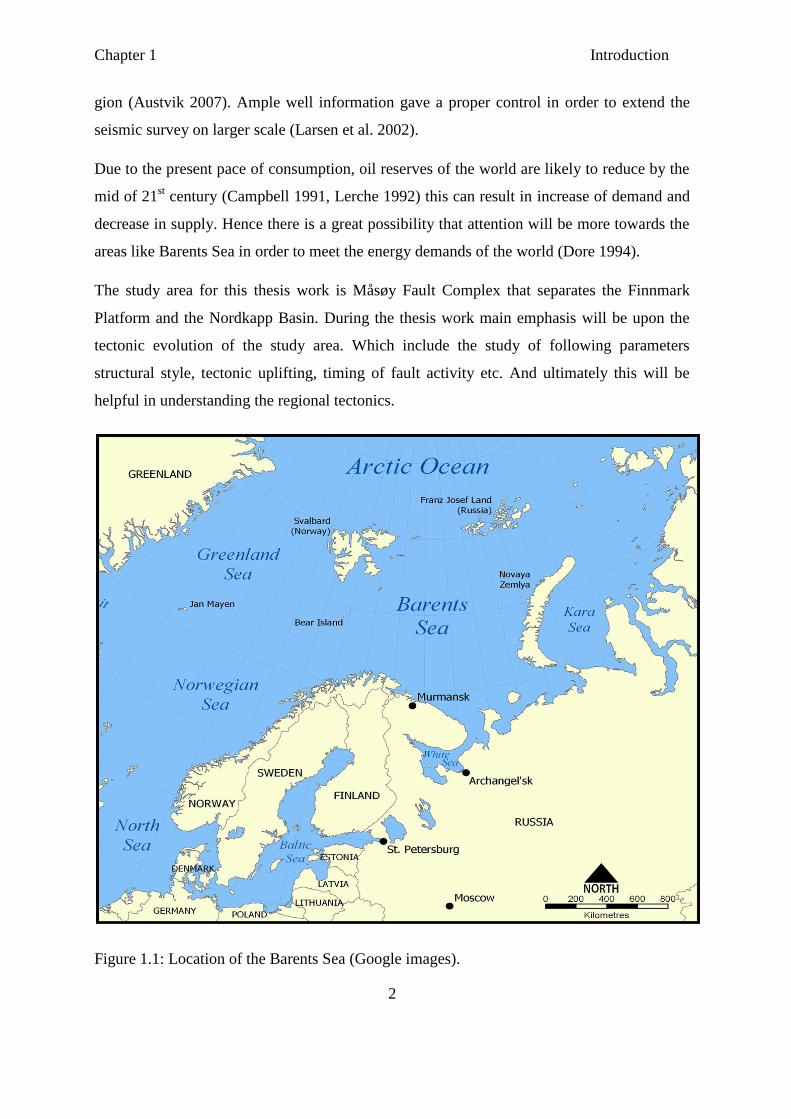
Barents Sea is an epicontinental sea located on the NW margin of the Eurasian continental
shelf. It is surrounded to the north and west by passive margins that are relatively younger in
age. These margins were formed due to the opening of the Norwegian-Greenland Sea and
the Eurasian Basin during Cenozoic time. The northern part of mainland Norway delineates
the Barents Sea to the south and Novaya Zemlya to the east (Faleide et al. 1993) (Figure
1.1).
In terms of geology the Barents Sea is a complicated merge of basins and platforms. The
sedimentation in the area started in Devonian times. The formation of Barents Sea is
associated with two major continental collision events. First event was the Caledonian
orogeny that ended about 400 million years ago. The result of this collision was the
arrangement of the Baltic Plate and Laurentian plate with the Laurasian continent. Second
event was the collision of Laurasian continent and Western Siberia that ended about 240
million years ago and resulted in the formation of eastern margin of Barents Sea (Dore
1994).
There are some deep sedimentary basins present in the southwestern Barents Sea. Formation
of these basins is related to the regional tectonic events that took place within North Atlantic
and Arctic areas (Faleide et al. 1993). Western part of the Barents Sea show more
pronounced tectonic activity throughout Mesozoic and Cenozoic times. On the other hand
eastern and northeastern areas since Late Carboniferous are marked by rather stable
platforms and show less tectonism. Tectonic history of the area prior to Carboniferous is not
well known however it is assumed that major structural development started in Devonian
times and also some of the tectonic events could be associated with Caledonian Orogeny
(Gabrielsen et al. 1990).
In terms of petroleum potential the Barents Sea is considered to be important. The petroleum
activities in Barents Sea started in early 1980’s. And since then large amount of data has
been acquired and also drilling has been carried out at many places (Gabrielsen et al. 1990).
Sea and land regions in the European Arctic area are occupied by Russia and Norway.
Considering the both countries more than 100 wells have been drilled in the Barents Sea
Chapter 1 Introduction
2
gion (Austvik 2007). Ample well information gave a proper control in order to extend the
seismic survey on larger scale (Larsen et al. 2002).
Due to the present pace of consumption, oil reserves of the world are likely to reduce by the
mid of 21st century (Campbell 1991, Lerche 1992) this can result in increase of demand and
decrease in supply. Hence there is a great possibility that attention will be more towards the
areas like Barents Sea in order to meet the energy demands of the world (Dore 1994).
The study area for this thesis work is Måsøy Fault Complex that separates the Finnmark
Platform and the Nordkapp Basin. During the thesis work main emphasis will be upon the
tectonic evolution of the study area. Which include the study of following parameters
structural style, tectonic uplifting, timing of fault activity etc. And ultimately this will be
helpful in understanding the regional tectonics.
Figure 1.1: Location of the Barents Sea (Google images).
Chapter 2 Regional tectonic setting
3
2. Regional tectonic setting
North Greenland, Svalbard and Barents Sea areas are associated with the formation of two
different rift networks. These rift systems were developed during Late Paleozoic and the
sediments were deposited in relatively stable platforms and subsiding basins (Stemmerik &
Worsley 2005). These rift systems are associated with the tectonic activities that took place
in North Atlantic and Arctic areas. Ultimately both of these regions were connected through
a mega rift zone known as the De Geer Zone (Faleide et al. 1993).
Most important sedimentary basins in terms of extent and sedimentation are present on the
western side of Novaya Zemlya. These basins are North Barents Sea, North Novaya Zemlya
Basin and South Barents Sea. These basins acted as major sites of deposition of sediments
which were sourced by Urals during Late Paleozoic to Mesozoic times (Gramberg 1988).
About 12 km thick Permian and younger rocks are present in these basins. The line of these
basins ends in the SE Barents Sea where the thickness of Permian sediments is about 2 to 3
km. This area is characterized as a structural extension of onshore Timan-Pechora Basin and
is described by a NW to SE tectonic style associated with Late Precambrian tectonic activity
(Dore 1994).
The structural development of the Barents Sea is associated with numerous tectonic events.
The major structural trends associated with continental shelf of the Barent Sea are, ENE-
WSW to NE-SW and NNE-SSW along with the limited effect of WNW-ESE trend. To the
south an area which has an ENE-WSW trend is marked by major fault zones bordering the
Nordkapp and Hammerfest basins (Gabrielsen et al. 1990) (Figure 2.1).
2.1 Geological evolution
2.1.1 Devonian to Carboniferous
After the Caledonian Orogeny, Late Silurian to Early Devonian was a time of large scale
erosion due to the exposure of sediments (Smelror et al. 2009). Late Devonian to Early
Carboniferous is marked by a change in stress system, from compressional regime to
extensional regime. In result rift basins were formed followed by the deposition of
continental sediments (Faleide et al. 1984).
Chapter 2 Regional tectonic setting
4
Late Devonian to Early Carboniferous extension associated with the initial rifting between
Greenland and Norway is the oldest event that can be observed in the western Barents Sea.
The formation of Nordkapp Basin, Maud, Fingerdjupet, Tromsø and Ottar basins is
associated with this age, along with Hammerfest Basin which could be originated during the
same time (Gudlaugsson et al. 1998).
2.1.2 Middle Carboniferous to Permian
Most of the Barents Sea was stable in terms of tectonic activity from Late Carboniferous to
Permian times. Tectonic activity was restricted to the western part. In the western part the
main structural trend was NNE to SSW and NE to SW (Gabrielsen et al. 1990).
Carboniferous is characterized by N-S trending faults. The rotated fault blocks of
Carboniferous age at Bjørnøya were covered by Early Pemian carbonates (Riis et al. 1986).
During Late Permian there was a regional subsidence along with the development of sag
basin in the Barents Sea. At the same time faulting associated with rifting was also active
(Glørstad – Clark et al. 2010).
2.1.3 Triassic to Jurassic
Two main events were dominant during Middle to Late Jurassic, including extension on
regional scale and slight strike-slip activity along the older faults (Faleide et al. 1993).
Different tectonic activities resulted in normal faulting, tilting, uplifting and erosion during
Late Permian to Early Triassic. Up till Middle to Late Jurassic the tectonic activity was less.
During the Middle and Late Triassic the Loppa High was leveled off and got buried (Riis et
al. 1986).
2.1.4 Late Jurassic to Early Cretaceous
Exact dating of tectonic activity younger than the Triassic is a bit difficult in most areas of
the Barents Sea due to erosion. However in southern and western areas most of the
sediments are preserved. In the Middle to Late Jurassic tectonic activity started in the Troms
area, this resulted in block faulting that were having SW to NE and E to W trends. There is a
possibility that N to S trending subsidence of Bjørnøya and Tromsø basins was originated
during the same time (Riis et al. 1986).
Chapter 2 Regional tectonic setting
5
Along with the formation of Senja Ridge the deformation sustained in the Early Cretaceous.
During the same time tectonic activity continued along the transition zone between eastern
stable platform and the western Cretaceous basins. The major Cretaceous tectonic stage is
indicated by the folding and faulting in the Senja Ridge. In the Late Cretaceous this activity
was ended, followed by the uplift (Riis et al. 1986).
2.1.5 Tertiary Deformation
Wrench movements along the SW to NE trends sustained in the early Tertiary. This phase of
wrenching during Tertiary can be associated with the opening of the Norwegian-Greenland
Sea. Due to a changed spreading pattern in Oligocene there was a significant uplift (Talwani
& Eldholm 1977, Myhre et al. 1982). There was a deposition of sedimentary wedge which
was followed by erosion. The massive part of this wedge is present on the Senja Ridge and
in the western portion of the Bjørnøya Basin (Riis et al. 1986).
In the entire Barents Sea during Neogene there was erosion associated with uplift followed
by the deposition of thick sequences into the oceanic basins to the north and west. This was
resulted due to the glaciations in northern hemisphere (Faleide et al. 1996).
Chapter 2 Regional tectonic setting
6
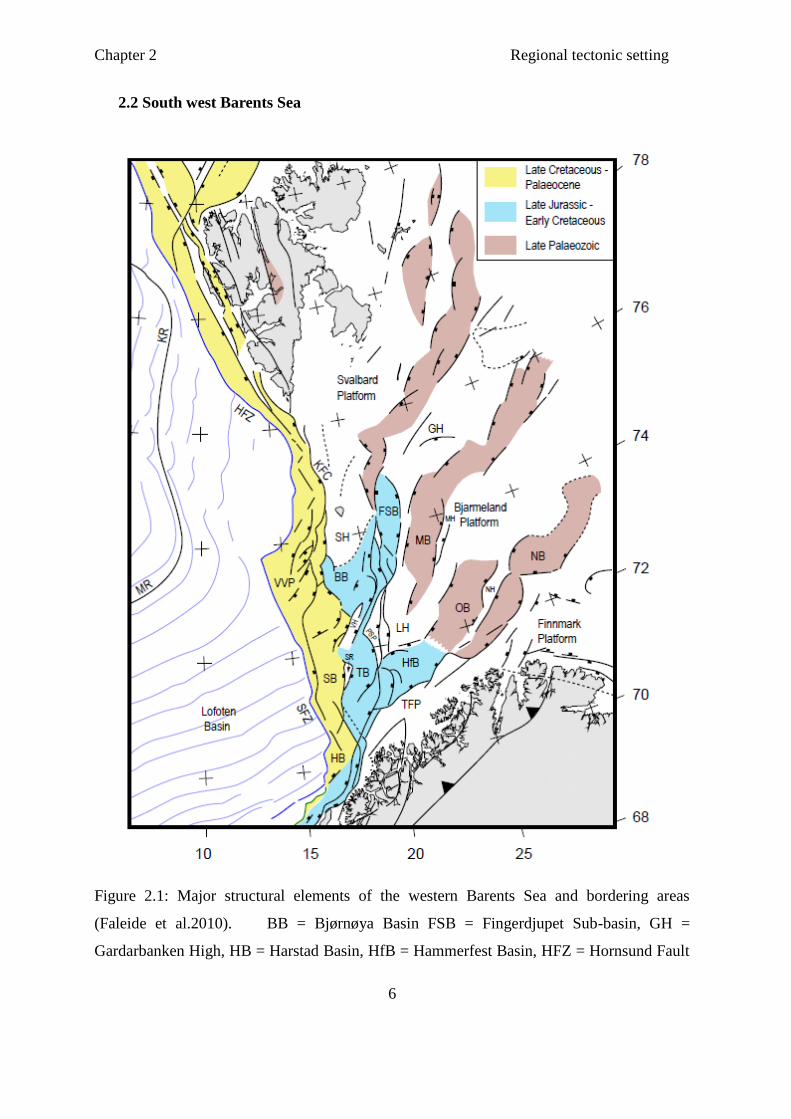
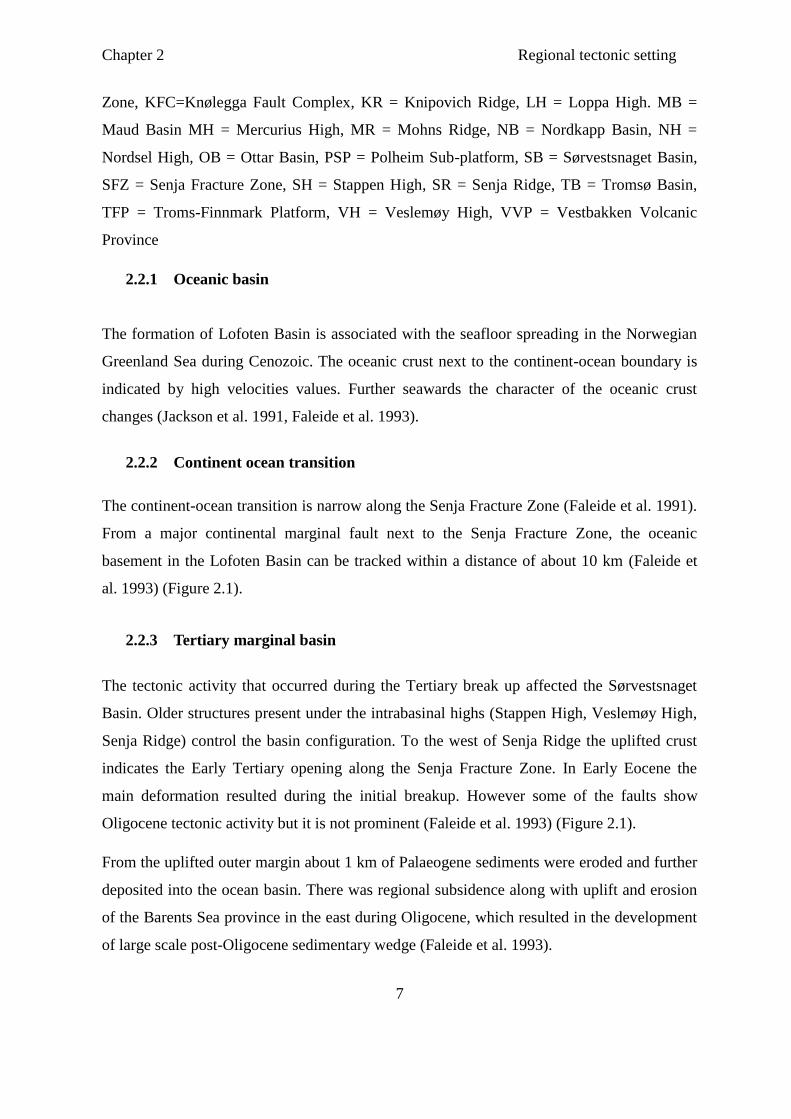
2.2 South west Barents Sea
Figure 2.1: Major structural elements of the western Barents Sea and bordering areas
(Faleide et al.2010). BB = Bjørnøya Basin FSB = Fingerdjupet Sub-basin, GH =
Gardarbanken High, HB = Harstad Basin, HfB = Hammerfest Basin, HFZ = Hornsund Fault
Chapter 2 Regional tectonic setting
7
Zone, KFC=Knølegga Fault Complex, KR = Knipovich Ridge, LH = Loppa High. MB =
Maud Basin MH = Mercurius High, MR = Mohns Ridge, NB = Nordkapp Basin, NH =
Nordsel High, OB = Ottar Basin, PSP = Polheim Sub-platform, SB = Sørvestsnaget Basin,
SFZ = Senja Fracture Zone, SH = Stappen High, SR = Senja Ridge, TB = Tromsø Basin,
TFP = Troms-Finnmark Platform, VH = Veslemøy High, VVP = Vestbakken Volcanic
Province
2.2.1 Oceanic basin
The formation of Lofoten Basin is associated with the seafloor spreading in the Norwegian
Greenland Sea during Cenozoic. The oceanic crust next to the continent-ocean boundary is
indicated by high velocities values. Further seawards the character of the oceanic crust
changes (Jackson et al. 1991, Faleide et al. 1993).
2.2.2 Continent ocean transition
The continent-ocean transition is narrow along the Senja Fracture Zone (Faleide et al. 1991).
From a major continental marginal fault next to the Senja Fracture Zone, the oceanic
basement in the Lofoten Basin can be tracked within a distance of about 10 km (Faleide et
al. 1993) (Figure 2.1).
2.2.3 Tertiary marginal basin
The tectonic activity that occurred during the Tertiary break up affected the Sørvestsnaget
Basin. Older structures present under the intrabasinal highs (Stappen High, Veslemøy High,
Senja Ridge) control the basin configuration. To the west of Senja Ridge the uplifted crust
indicates the Early Tertiary opening along the Senja Fracture Zone. In Early Eocene the
main deformation resulted during the initial breakup. However some of the faults show
Oligocene tectonic activity but it is not prominent (Faleide et al. 1993) (Figure 2.1).
From the uplifted outer margin about 1 km of Palaeogene sediments were eroded and further
deposited into the ocean basin. There was regional subsidence along with uplift and erosion
of the Barents Sea province in the east during Oligocene, which resulted in the development
of large scale post-Oligocene sedimentary wedge (Faleide et al. 1993).
Chapter 2 Regional tectonic setting
8
2.2.4 Cretaceous basins
There was a massive sedimentation and subsidence during Cretaceous in the Tromsø,
Harstad and Bjørnøya basins. Regional studies (Rønnevik and Jacobsen. 1984, Faleide et al.
1984) along with the halokinesis in the Sørvestsnaget and Tromsø basins indicate that pre-
Middle Jurassic succession may contain massive Triassic and Jurassic clastic sediments,
along with Permo-Carboniferous evaporates and mixed carbonates (Faleide et al. 1993)
(figure 2.1).
The sediments in the Harstad Basin are disturbed due to the numerous stages of extensional
tectonics, which perhaps initiated in the Middle Jurassic and sustained during the phase of
main subsidence in the Early Cretaceous. Particularly to the south of the basin there is a
large scale listric faulting which is associated with the hanging wall rollover anticlines.
Further in Late Cretaceous and Tertiary normal faulting started again (Faleide et al. 1993).
2.2.5 Intrabasinal highs
In the SW Barents Sea intrabasinal highs are not completely understood. During several
tectonic events these highs were active and later on within the Cretaceous basin province
these were affected by inversion events during Late Cretaceous and Early Tertiary tectonic
stages and differential subsidence (Faleide et al. 1993) (Figure 2.1).
The Velsemøy High divides the Bjørnøya and Tromsø basins. It is associated with deep
rooted westward oriented faults and these faults mark the southwards extension of the
Bjørnøyrenna Fault Complex. The effects of tectonic inversion in Velsemøy High and Senja
Ridge are associated with the strike-slip tectonic events along the Bjørnøyrenna Fault
Complex (Faleide et al. 1993) (Figure 2.1).
Bjørnøya is delimited by Stappen High. From Late Palaeozoic to Jurassic times in the
western Barents Sea Stappen High was a part of N-S trending uplifted area. The tectonic
activity along the De Geer Zone directly affected the local Cretaceous subsidence and
Tertiary uplift. The southern border of the Stappen High was formed due to the partial
Tertiary inversion of the Bjørnøya Basin (Faleide et. al. 1993) (Figure 2.1).
Chapter 2 Regional tectonic setting
9
2.2.6 Cretaceous boundary faults
The eastern boundary faults were originated during Early Cretaceous representing the
extensional tectonics. The structural trend changes along the strike, and listric faults
dominate the Bjørnøyrenna Fault Complex and the southern Troms-Finnmark Fault
Complex. The major stage of subsidence initiated in the Middle Jurassic and ended in the
Early Cretaceous. There is an indication of reactivation of tectonic activity in the Late
Cretaceous along with minor compressional factor. This faulting has also affected Tertiary
rocks (Gabrielsen et al. 1990, Faleide et al. 1993) (Figure 2.1).
The southern part that is bordering the Harstad Basin can be considered as a part of the
Troms-Finnmark Fault Complex (Gabrielsen et al. 1990). However in terms of tectonic
extension and basin formation in Mesozoic, this part must be regarded as southern extension
of the Ringvassøy-Loppa Fault Complex (Faleide et al. 1993) (Figure 2.1).
The rotated fault blocks that characterize the Ringvassøy-Loppa Fault Complex are
indicating a terrace which is cross cutting the Hammerfest Basin (Gabrielsen et al. 1984).
Further north listric fault geometry characterizes the Bjørnøyrenna Fault Complex, and in
Permian rocks this listric fault geometry seems to be flattening into a detachment (Faleide et
al. 1993).
Bjørnøya Basin is separated by the Leirdjupet Fault Complex and it is divided into two
different zones, shallow eastern zone and deep western zone. To the south this zone is
marked by a major fault that is characterized by drag and flexures events. This fault divides
into smaller rotated fault blocks further north (Faleide et al. 1993).
2.2.7 Eastern platform region
This region includes the Finnmark Platform, Loppa High, eastern Bjørnøya Basin and the
Hammerfest Basin. The Hammerfest Basin is characterized by two different fault trends,
listric faults detached within or above the Permian succession in the center of the basin and
steep faults next to the basin edge. In the basin during Late Jurassic to Early Cretaceous
extensional tectonic events were dominant along with slight strike-slip movements
(Berglund et al. 1986, Sund et al. 1986, Gabrielsen and Faerseth 1988, 1989). During Middle
Jurassic to Early Cretaceous rifting a gentle dome developed parallel to the basin axis which

Chapter 2 Regional tectonic setting
10
later on finished due to the end of rifting in Early Barremian times (Faleide et al. 1993)
(Figure 2.1).
Chapter 2 Regional tectonic setting
11
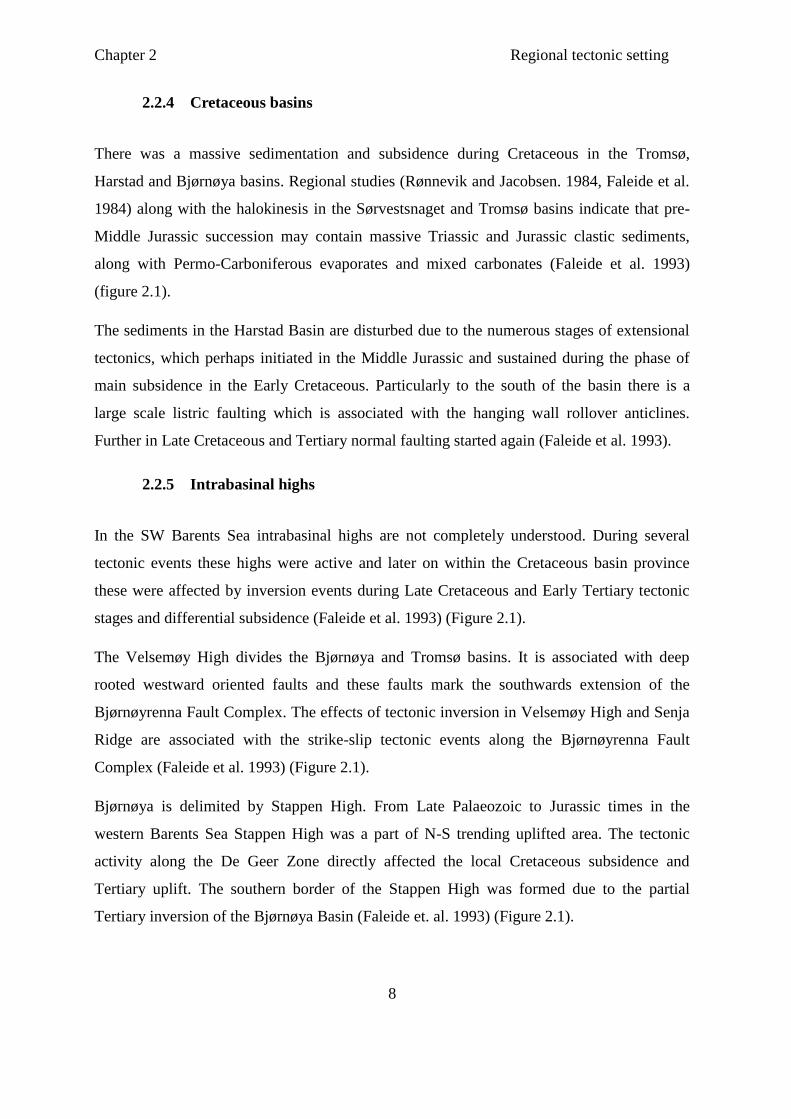
2.3 Stratigraphy
Figure 2.2: Lithostratigraphy of the western Barents Sea (Glørstad-Clark et al. 2010).
Chapter 2 Regional tectonic setting
12
2.3.1 Pre-middle Jurassic
On the basis of well information Permo-Carboniferous rocks are mapable in the entire
Barents Sea. These rocks are likely to be similar to those of Svalbard, Bjørnøya and NE
Greenland (Stemmerik and Worsley 1989). Massive Triassic strata is present throughout the
Barents Sea, it shows coarsening upward sequences thus representing transgressions and
regressions (Mørk et al. 1989). Sandstone is the dominant lithology in the middle lower
Jurassic part which is present allover in the Hammerfest Basin and its thickness is increasing
towards the Tromsø Basin. Also these sediments are present in the Finnmark Platform along
with Loppa High, however these sediments were moderately eroded due to tectonic activity
at some later stage. In the Hammerfest Basin these sandstones represent the major reservoir
(Olaussen et al. 1984, Berglund et al. 1986, Grung Olsen and Hanssen 1987, Faleide et al.
1993) (Figure 2.2).
2.3.2 Middle-Upper Jurassic
Teistengrunnen Group is bounded by key unconformities, and the age of these
unconformities ranges from Callovian to late Berriasian. The start of rifting in the SW
Barents Sea is indicated by the Late Middle Jurassic reflector which is the basal
unconformity. On the other hand unconformities present in this group represent interaction
between sea level change and Late Jurassic tectonic events. The thickness of the group is
minor due to which it is almost impossible to interpret these unconformities on the seismic
data. Lithology is dolomitic limestone and few siltstone or sandstone, are interbedded with in
shales and claystones. This situation represents calm and deep water settings (Worsley et al.
1988, Faleide et al. 1993) (Figure 2.2).
2.3.3 Lower Cretaceous
The Nordvestbanken Group consists of three formations from the Valanginian to the
Cenomanian. To the north and south the group becomes thick before it onlaps against the
Loppa High and Finnmark Platform. Main lithology is claystones and shales that have thin
interbedded dolomite, siltstone and limestone (Faleide et al. 1993) (Figure 2.2).
Chapter 2 Regional tectonic setting
13
2.3.4 Upper Cretaceous
A thin Upper Cretaceous succession shows dominant salt related subsidence and structuring
during Late Cretaceous times in the Sørvestsnaget and Tromsø basins. It has been observed
that the Nygrunnen Group shows a variation in thickness in the Tromsø Basin. In Tromsø
Basin and western part of Hammerfest Basin the lithology is thin limestone along with
claystones that transform into sandy succession on the eastern side (Worsley et al. 1988,
Faleide et al. 1993) (Figure 2.2).
2.3.5 Palaeogene
The Sotbakken Group and Nygrunnen Group have unconformable contact. This Cretaceous-
Tertiary unconformity represents a major break in deposition and is present all over the SW
Barents Sea (Worsley et al. 1988). Lithology of the Palaeogene succession is dominated by
interbedded siltstones, claystones, carbonates and tuffs (Faleide et al. 1993) (Figure 2.2).
2.3.6 Neogene-Quaternary
The Nordland Group that is of Neogene and Quaternary age lies unconformably on the
Paleogene and Mesozoic rocks. The analysis of wells in the Senja Ridge area shows that it
has glacial origin (Eidvin and Riis, 1989). Also that the sediments that are about 100-200 m
thick in Hammerfest Basin, show great thickness contrast at the Senja Ridge where they
have thickness more than 700 m. Further in Lofoten Basin, these sediments extend up to
4000 m (Faleide et al. 1996) (Figure 2.2).
Chapter 2 Regional tectonic setting
14
2.4 The study area
The study area for this thesis work is the western part of the Måsøy Fault Complex. It is one
of the basin margin faults located in the SW of the Nordkapp Basin and represents the
structural separation between the Nordkapp Basin and Finnmark Platform. The fault zone is
an extensional structure. The major fault trend in the area is NE-SW, indicating en echelon
trend and are associated with major dip slip elements. There are few traces of local
compressional events. There is significant flexuring along the fault zone due to the
asymmetric subsidence of Nordkapp Basin. The age of the main fault activity is
recommended to be Early Carboniferous (Gabrielsen et al. 1990) (Figure 2.3).
The zones of weakness in the basement are associated with the Caledonian Orogeny
(Gudlaugsson et al. 1998). These comments may describe the idea of Gabrielsen et al. (1990)
that under the Måsøy Fault Complex there are deep rooted faults that are possibly originated
from the basement (Ritzmann & Faleide 2007).
The Måsøy Fault Complex was considered to be a part of Troms-Finnmark Fault Complex
(Gabrielsen et al. 1984) but further studies in the area showed that there is not any
association between these structures. The subsidence was initiated before Permian times.
The hanging wall of the major fault in the area is reported to be severely damaged and may
indicate inversion (Gabrielsen & Faerseth 1989).
The Måsøy Fault Complex is partly affected by halokinesis (Gabrielsen et al. 1990). This
can be explained by the association of Måsøy Fault Complex with the Nordkapp Basin,
which is characterized by massive salt deposits.
The SW part of the Nordkapp Basin was created due to the Carboniferous rifting in which
Caledonian structures were reactivated (Johansen et al. 1993 & Gudlaugsson et al. 1998).
During Late Jurassic to Early Cretaceous and Tertiary there was an episodic reactivation of
Carboniferous faults as the basin subsided due to the extension (Gabrielsen et al. 1990).
During Late Carboniferous rifting was reduced, further movements were associated with
basin marginal faults. The slip along the deep rooted faults caused the deformation of
overburden rocks, no matter what their position was with respect to the deep rooted faults. In
the Nordkapp Basin the extensional faults present in the younger sediments are associated
with the reactivation of deep rooted faults present along the basin margins (Koyi et al. 1993).
Chapter 2 Regional tectonic setting
15
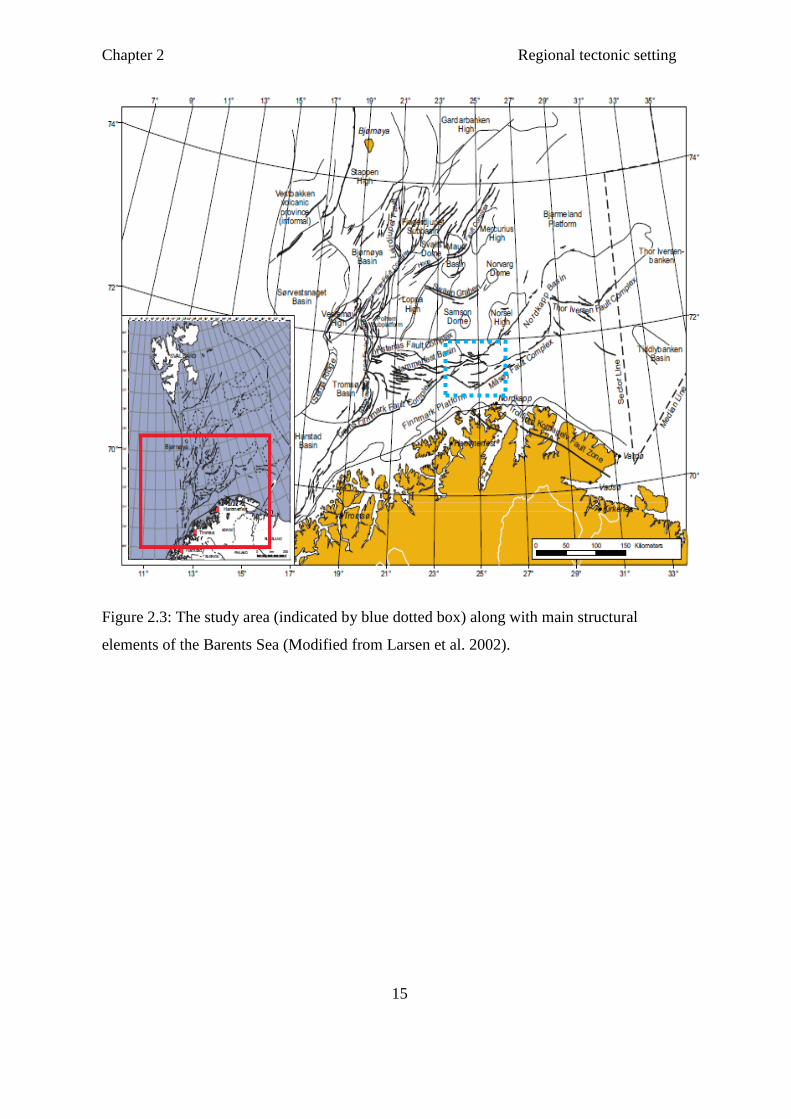
Figure 2.3: The study area (indicated by blue dotted box) along with main structural
elements of the Barents Sea (Modified from Larsen et al. 2002).
Chapter 3 Data and method
16
3 Data and method
Following are the data sets that have been used for this thesis.
1. Regional 2D seismic data.
2. 3D seismic data.
3. Data from three different wells.
3.1 Seismic data
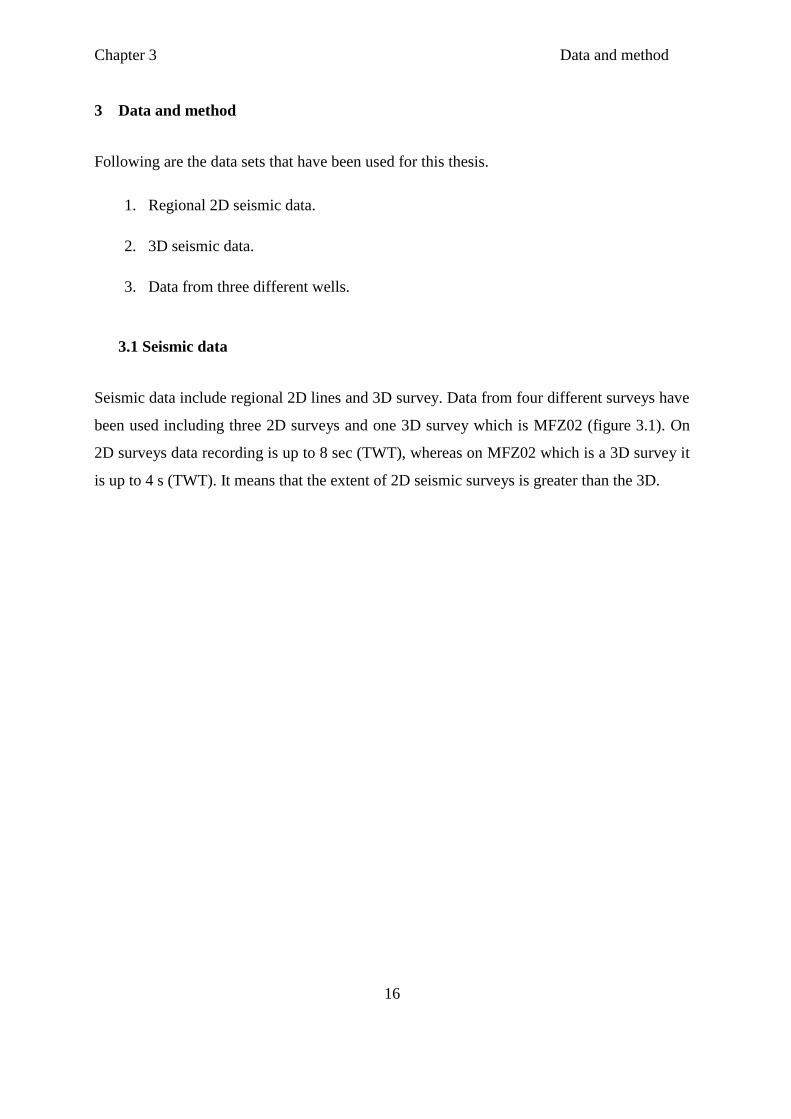
Seismic data include regional 2D lines and 3D survey. Data from four different surveys have
been used including three 2D surveys and one 3D survey which is MFZ02 (figure 3.1). On
2D surveys data recording is up to 8 sec (TWT), whereas on MFZ02 which is a 3D survey it
is up to 4 s (TWT). It means that the extent of 2D seismic surveys is greater than the 3D.
Chapter 3 Data and method
17
Figure 3.1: 2D/3D seismic surveys along with well locations (for location of study area see
Figure 2.3).
3.2 Well data
Data from three different wells have been used. The wells are 7125/4 -1, 7125/4-2 and
7124/3-1 (Figure 3.1). All of the wells are present within the extent of seismic data.
3.2.1 Well 7125/4-1
A wildcat well that was drilled in the area of Måsøy Fault Complex located in the Barents
Sea. The main purpose was to look for the commercial hydrocarbons within the Nucula
prospect, which represents a fault related structural trap. The structure contains reservoir
within the Middle Jurassic to Late Triassic Realgrunnen Group, and Late to Middle Triassic
Snadd Formation and the Middle Triassic Kobbe (www.npd.no) (Table 3.1).
Chapter 3 Data and method
18
3.2.2 Well 7125/4-2
This well was drilled in the area of Måsøy Fault Complex located in the Barents Sea. The
purpose of this well was to look for oil and gas, and the target was B segment of Nucula
Prospect. Primary target was Kapp Toscana Group sands having age from Late Triassic to
Middle Jurassic and the secondary target was lower Kobbe Formation of Middle Triassic
(www.npd.no) (Table 3.1).
3.2.3 Well 7124/3-1
This well is located on the eastern side of Hammerfest Basin on the Nysleppen Fault
Complex. The main purpose was to understand the source rock potential of the Triassic
rocks, identification of whole stratigraphy from seabed down to 4500 m and to perform tests
on hydrocarbons at two different levels. The reservoir rocks of Middle Jurassic age was the
primary target and Late Carboniferous rocks were secondary target (www.npd.no) (Table
3.1).
Chapter 3 Data and method
19
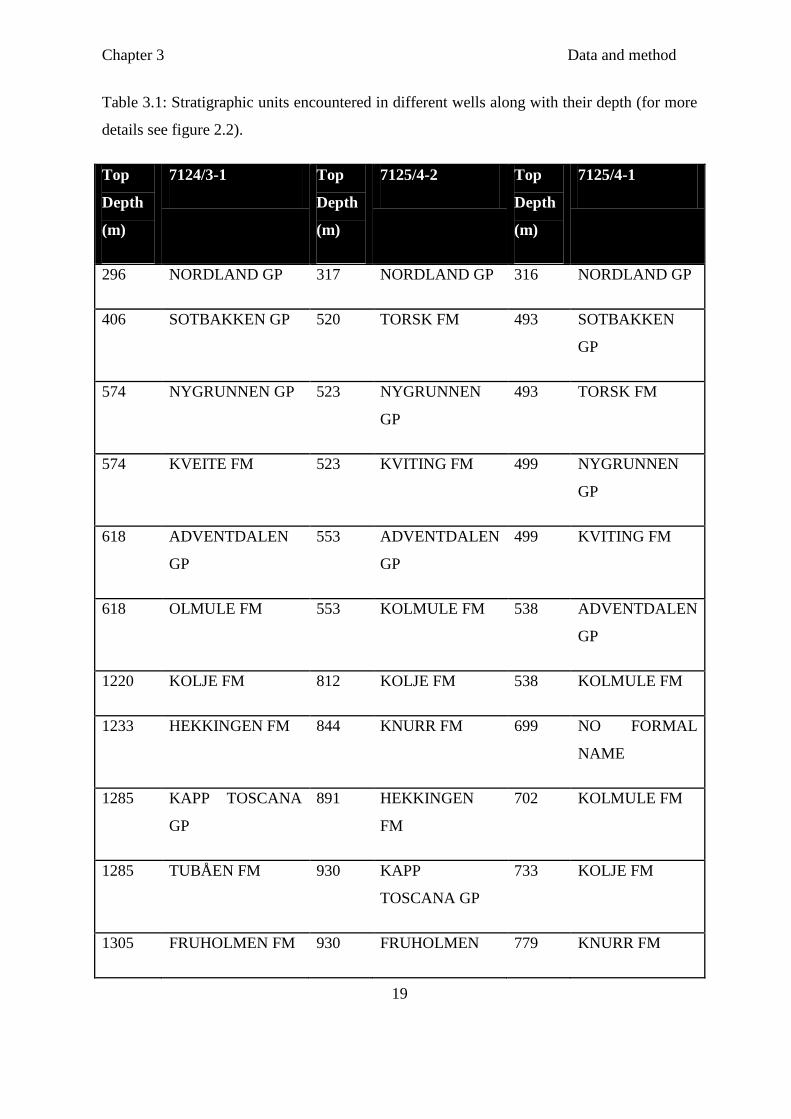
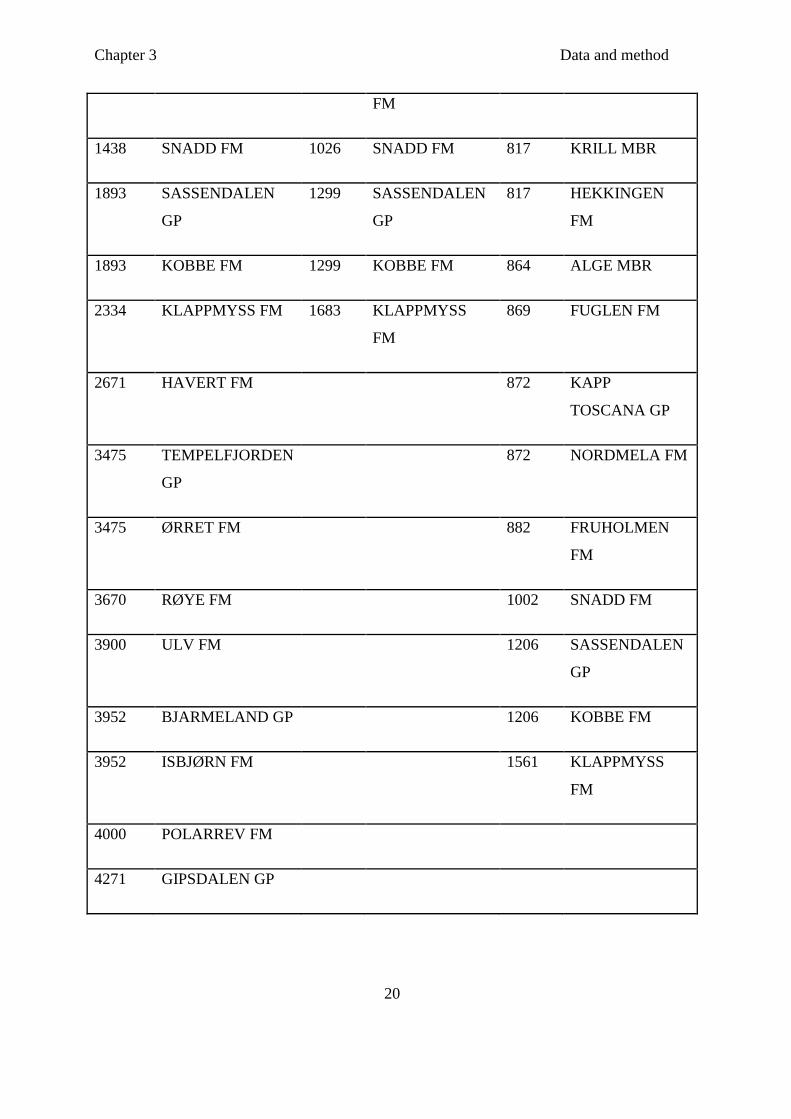
Table 3.1: Stratigraphic units encountered in different wells along with their depth (for more
details see figure 2.2).
Top
Depth
(m)
7124/3-1 Top
Depth
(m)
7125/4-2 Top
Depth
(m)
7125/4-1
296 NORDLAND GP 317 NORDLAND GP 316 NORDLAND GP
406 SOTBAKKEN GP 520 TORSK FM 493 SOTBAKKEN
GP
574 NYGRUNNEN GP 523 NYGRUNNEN
GP
493 TORSK FM
574 KVEITE FM 523 KVITING FM 499 NYGRUNNEN
GP
618 ADVENTDALEN
GP
553 ADVENTDALEN
GP
499 KVITING FM
618 OLMULE FM 553 KOLMULE FM 538 ADVENTDALEN
GP
1220 KOLJE FM 812 KOLJE FM 538 KOLMULE FM
1233 HEKKINGEN FM 844 KNURR FM 699 NO FORMAL
NAME
1285 KAPP TOSCANA
GP
891 HEKKINGEN
FM
702 KOLMULE FM
1285 TUBÅEN FM 930 KAPP
TOSCANA GP
733 KOLJE FM
1305 FRUHOLMEN FM 930 FRUHOLMEN 779 KNURR FM
Chapter 3 Data and method
20
FM
1438 SNADD FM 1026 SNADD FM 817 KRILL MBR
1893 SASSENDALEN
GP
1299 SASSENDALEN
GP
817 HEKKINGEN
FM
1893 KOBBE FM 1299 KOBBE FM 864 ALGE MBR
2334 KLAPPMYSS FM 1683 KLAPPMYSS
FM
869 FUGLEN FM
2671 HAVERT FM 872 KAPP
TOSCANA GP
3475 TEMPELFJORDEN
GP
872 NORDMELA FM
3475 ØRRET FM 882 FRUHOLMEN
FM
3670 RØYE FM 1002 SNADD FM
3900 ULV FM 1206 SASSENDALEN
GP
3952 BJARMELAND GP 1206 KOBBE FM
3952 ISBJØRN FM 1561 KLAPPMYSS
FM
4000 POLARREV FM
4271 GIPSDALEN GP
Chapter 3 Data and method
21
3.3 Method
Petrel has been used for this thesis. This software is window based and is assets of
Schlumberger. Petrel can perform various operations, including interpretation of seismic
data, well correlation, can generate reservoir models, calculation of volumes etc. For this
thesis work petrel version 2009 has been used. Following are the features of petrel that are
used during the work (www.slb.com).
3.3.1 Data import
This process involves the loading of data in to the software. That includes well data and 2D /
3D seismic data which is loaded in SEG-Y format. For the import of well data first step is to
insert a new well. Then to give coordinates for the particular well along with the kelly
bushing value. To enter well tops, well tops folder has to be generated. Further well tops can
be imported to the database. Similarly check shot data can be imported into the data base.
For loading of the 2D / 3D seismic data initially new seismic main folder has to be generated
using insert option. Then a subfolder has to be generated named as seismic survey. And
finally all kind of seismic data can be stored into the software as a SEG-Y format.
3.3.2 Seismic interpretation
Before starting the seismic interpretation process it is necessary to do seismic to well tie.
This is important because on the basis of this step interpretation of a certain horizon can be
carried out. Seismic interpretation can be performed on any kind of seismic line. That can
be simply 2D line, inline, cross line etc. There are two kinds of windows which are used to
perform seismic interpretation. These are 3D window and Interpretation window. But it is
recommended that interpretation should be carried out by using Interpretation window.
However 3D window can be used for the 3D view of different results regarding
interpretation. Horizons can be interpreted by four different ways. These are
Guided auto tracking
Seeded 2D auto tracking
Seeded 3D auto tracking
Manual interpretation
Chapter 3 Data and method
22
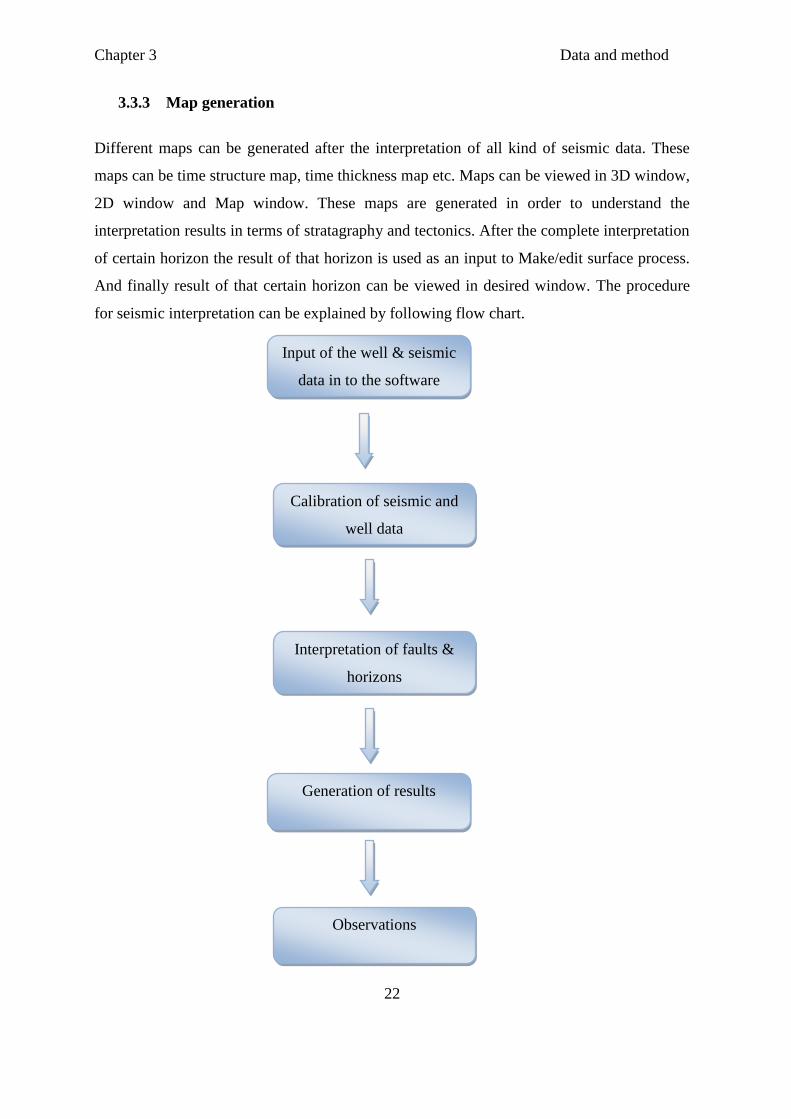
3.3.3 Map generation
Different maps can be generated after the interpretation of all kind of seismic data. These
maps can be time structure map, time thickness map etc. Maps can be viewed in 3D window,
2D window and Map window. These maps are generated in order to understand the
interpretation results in terms of stratagraphy and tectonics. After the complete interpretation
of certain horizon the result of that horizon is used as an input to Make/edit surface process.
And finally result of that certain horizon can be viewed in desired window. The procedure
for seismic interpretation can be explained by following flow chart.
Input of the well & seismic
data in to the software
Calibration of seismic and
well data
Interpretation of faults &
horizons
Generation of results
Observations
Chapter 4 Seismic interpretation
23
4 Seismic interpretation
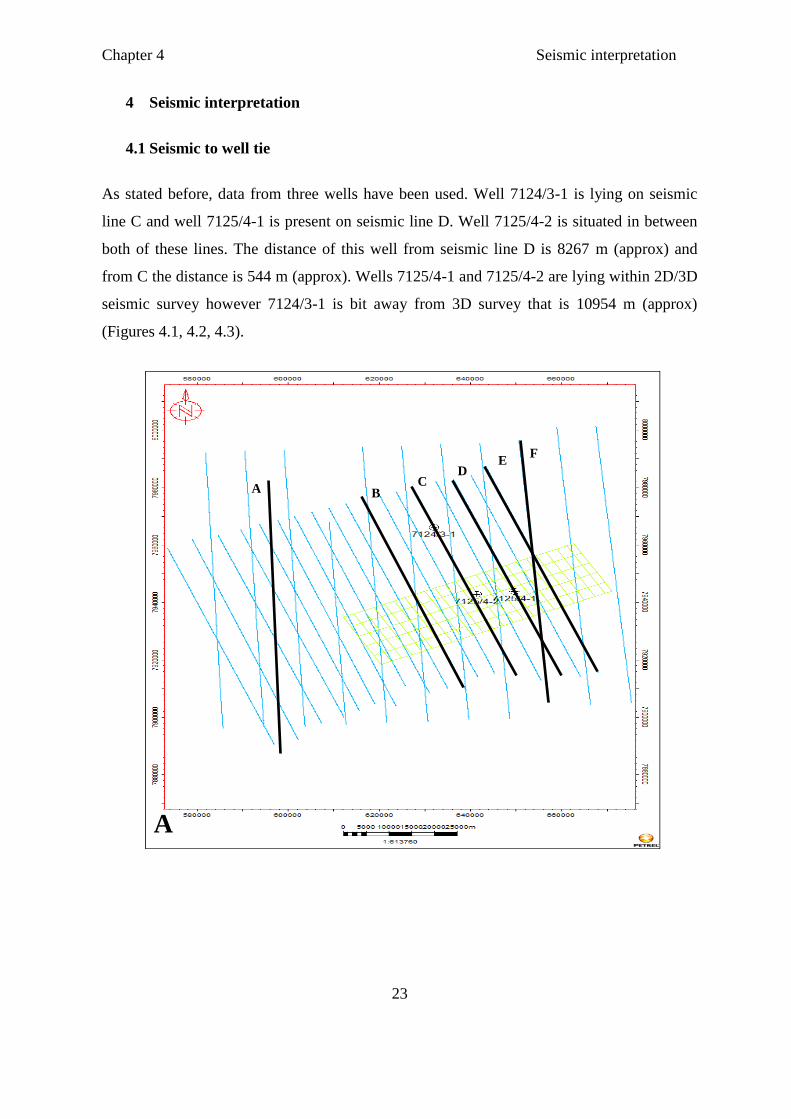
4.1 Seismic to well tie
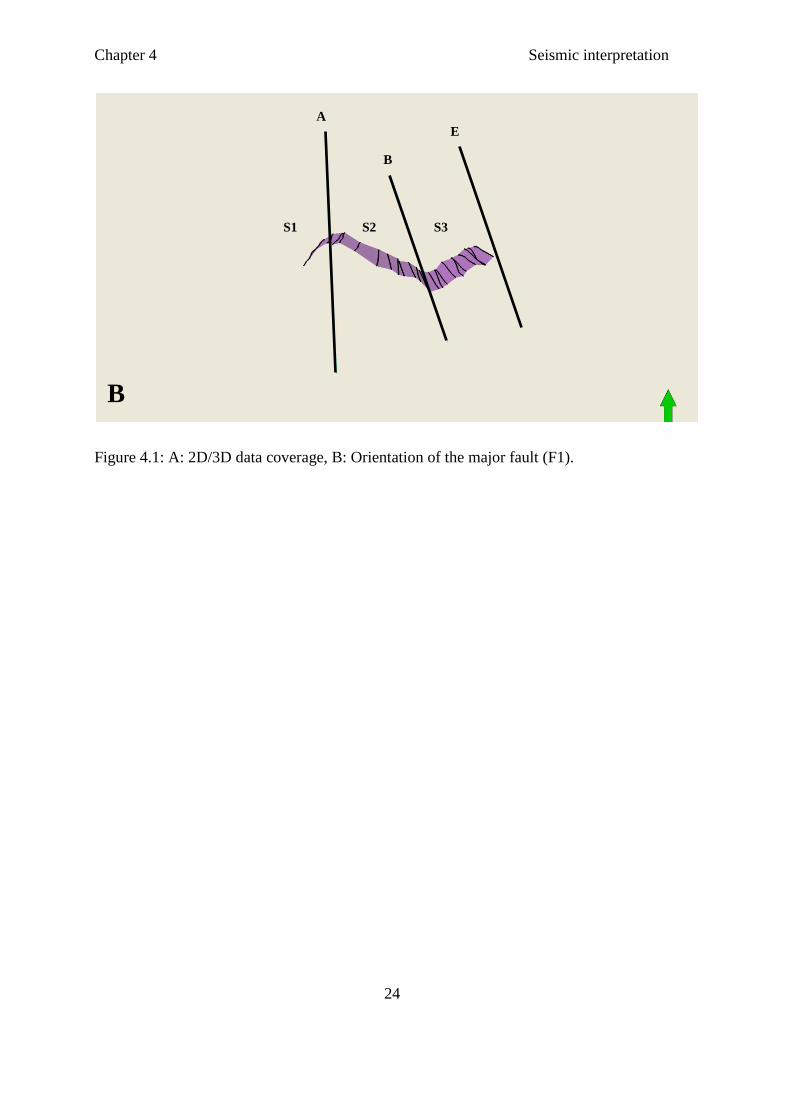
As stated before, data from three wells have been used. Well 7124/3-1 is lying on seismic
line C and well 7125/4-1 is present on seismic line D. Well 7125/4-2 is situated in between
both of these lines. The distance of this well from seismic line D is 8267 m (approx) and
from C the distance is 544 m (approx). Wells 7125/4-1 and 7125/4-2 are lying within 2D/3D
seismic survey however 7124/3-1 is bit away from 3D survey that is 10954 m (approx)
(Figures 4.1, 4.2, 4.3).
A C
D
B
E F
A
Chapter 4 Seismic interpretation
24
Figure 4.1: A: 2D/3D data coverage, B: Orientation of the major fault (F1).
A
B
E
S1 S2 S3
B
Chapter 4 Seismic interpretation
25
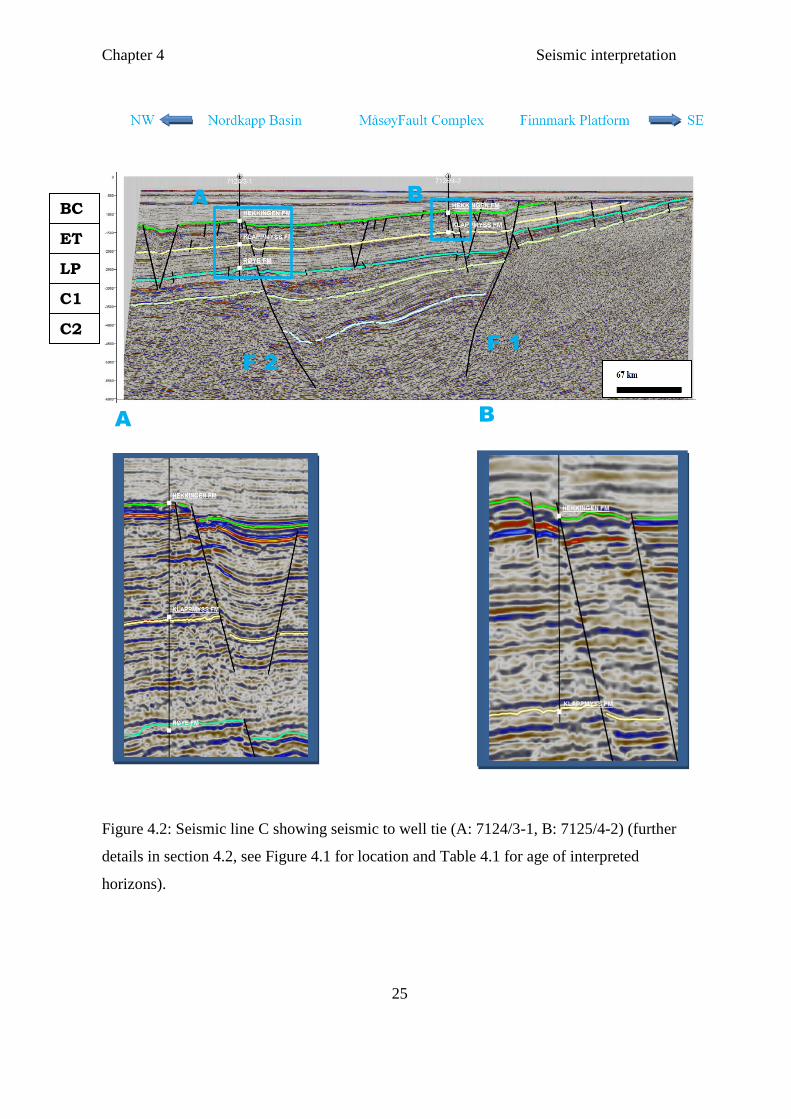
Figure 4.2: Seismic line C showing seismic to well tie (A: 7124/3-1, B: 7125/4-2) (further
details in section 4.2, see Figure 4.1 for location and Table 4.1 for age of interpreted
horizons).
B A
B A BC
C2
C1
LP
ET
F 1
F 2
Chapter 4 Seismic interpretation
26
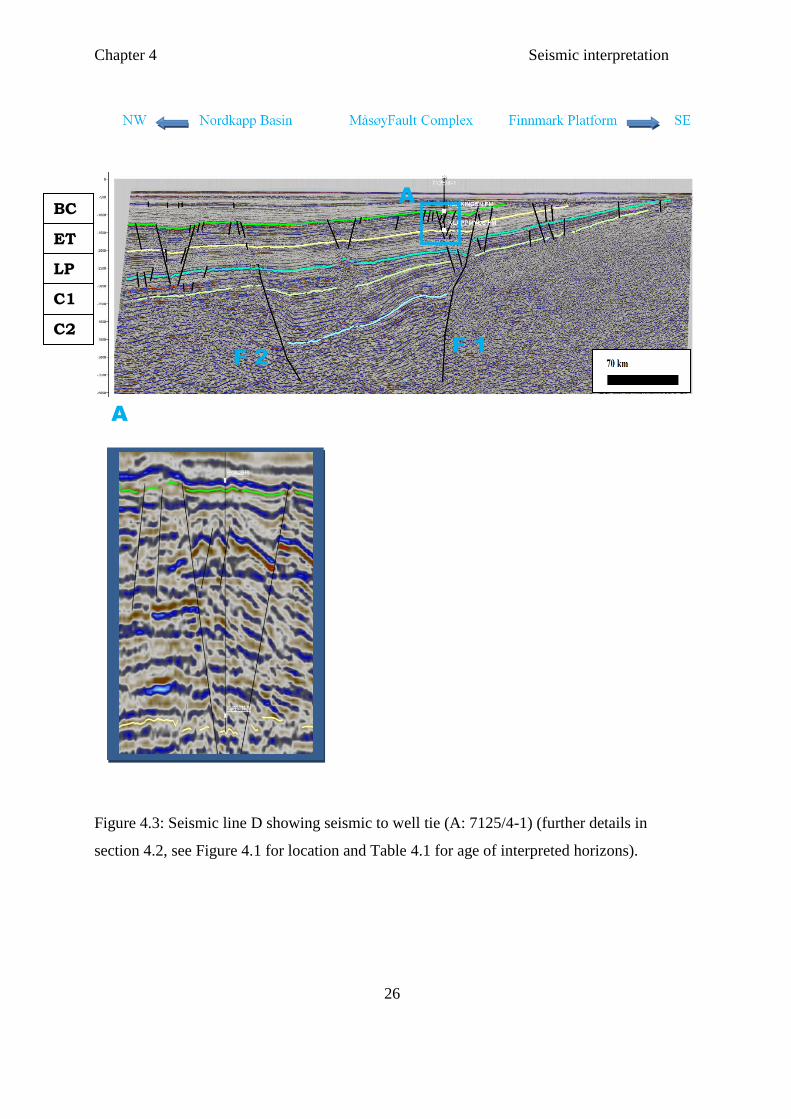
Figure 4.3: Seismic line D showing seismic to well tie (A: 7125/4-1) (further details in
section 4.2, see Figure 4.1 for location and Table 4.1 for age of interpreted horizons).
A
A
ET
LP
C1
C2
BC
F 2 F 1
Chapter 4 Seismic interpretation
27
4.2 Selected seismic reflections
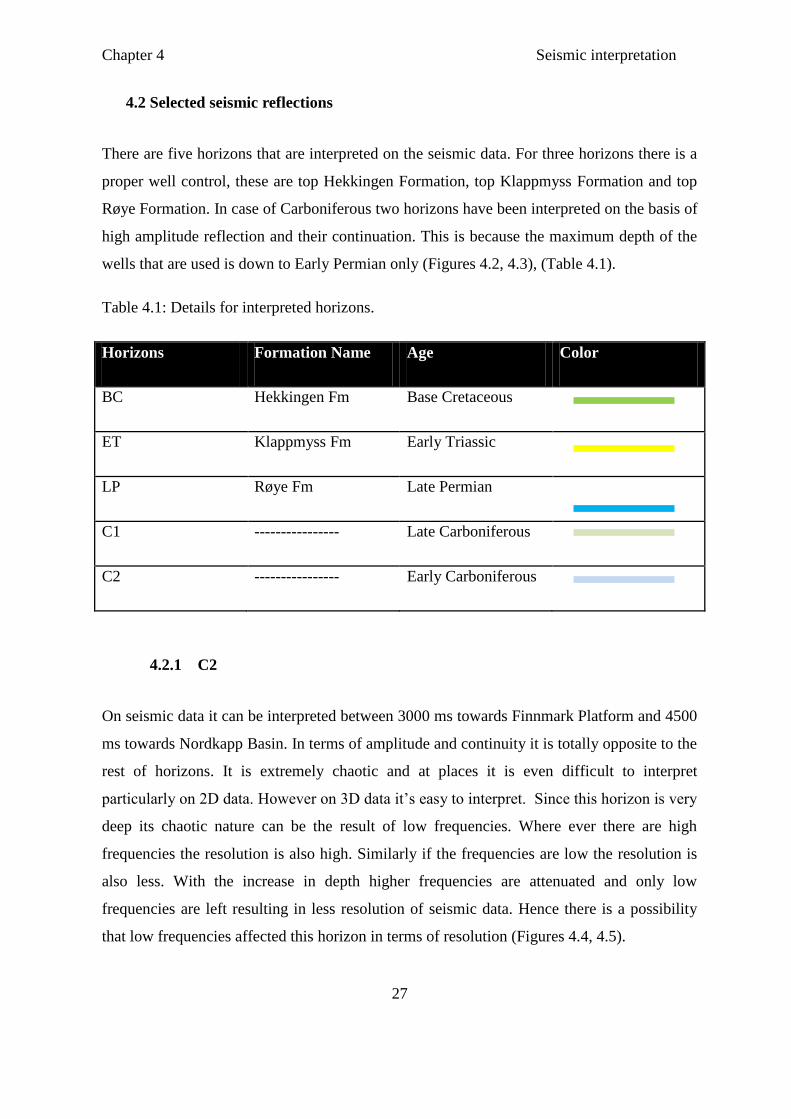
There are five horizons that are interpreted on the seismic data. For three horizons there is a
proper well control, these are top Hekkingen Formation, top Klappmyss Formation and top
Røye Formation. In case of Carboniferous two horizons have been interpreted on the basis of
high amplitude reflection and their continuation. This is because the maximum depth of the
wells that are used is down to Early Permian only (Figures 4.2, 4.3), (Table 4.1).
Table 4.1: Details for interpreted horizons.
Horizons Formation Name Age Color
BC Hekkingen Fm Base Cretaceous
ET Klappmyss Fm Early Triassic
LP Røye Fm Late Permian
C1 ---------------- Late Carboniferous
C2 ---------------- Early Carboniferous
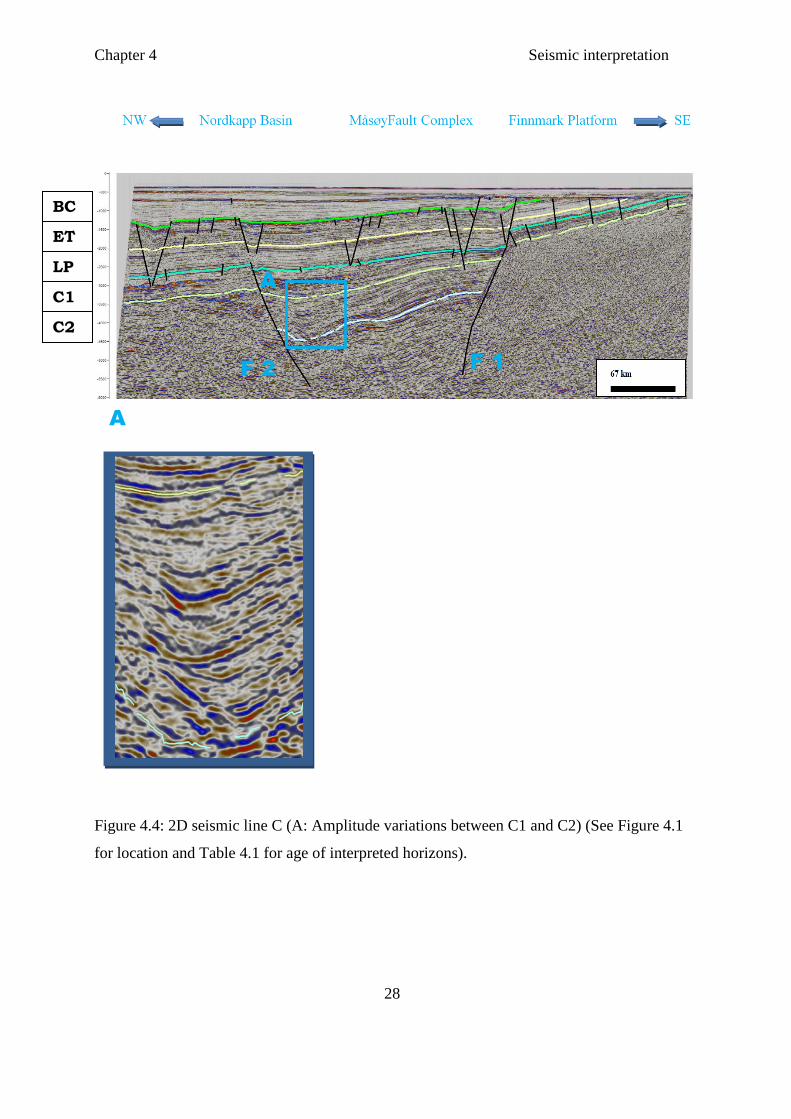
4.2.1 C2
On seismic data it can be interpreted between 3000 ms towards Finnmark Platform and 4500
ms towards Nordkapp Basin. In terms of amplitude and continuity it is totally opposite to the
rest of horizons. It is extremely chaotic and at places it is even difficult to interpret
particularly on 2D data. However on 3D data it’s easy to interpret. Since this horizon is very
deep its chaotic nature can be the result of low frequencies. Where ever there are high
frequencies the resolution is also high. Similarly if the frequencies are low the resolution is
also less. With the increase in depth higher frequencies are attenuated and only low
frequencies are left resulting in less resolution of seismic data. Hence there is a possibility
that low frequencies affected this horizon in terms of resolution (Figures 4.4, 4.5).
Chapter 4 Seismic interpretation
28
Figure 4.4: 2D seismic line C (A: Amplitude variations between C1 and C2) (See Figure 4.1
for location and Table 4.1 for age of interpreted horizons).
A
A
F 1
ET
LP
C1
C2
BC
F 2
Chapter 4 Seismic interpretation
29
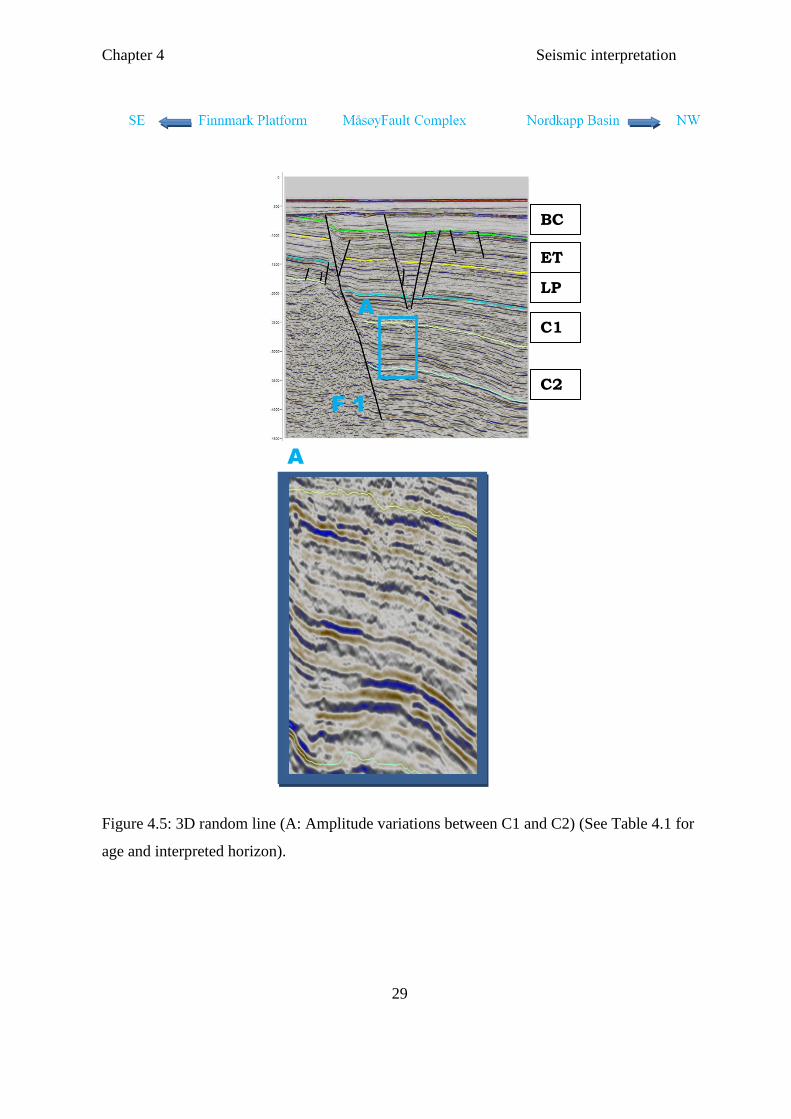
Figure 4.5: 3D random line (A: Amplitude variations between C1 and C2) (See Table 4.1 for
age and interpreted horizon).
A
A
F 1
BC
C2
C1
LP
ET
Chapter 4 Seismic interpretation
30
4.2.2 C1
Like C2 the interpretation has been carried out on the basis of high amplitude and continuity
of the reflections at Late Carboniferous level. On seismic data it has been interpreted
between 750 ms towards Finnmark Platform and 3500 ms towards Nordkapp Basin. It is
characterized by medium to high frequency. It has a very chaotic nature and at places it is
very hard to interpret on 2D seismic data particularly on the footwall. However on 3D data
the reflections are easy to interpret at this level. This horizon has not been eroded (Figures
4.4, 4.5).
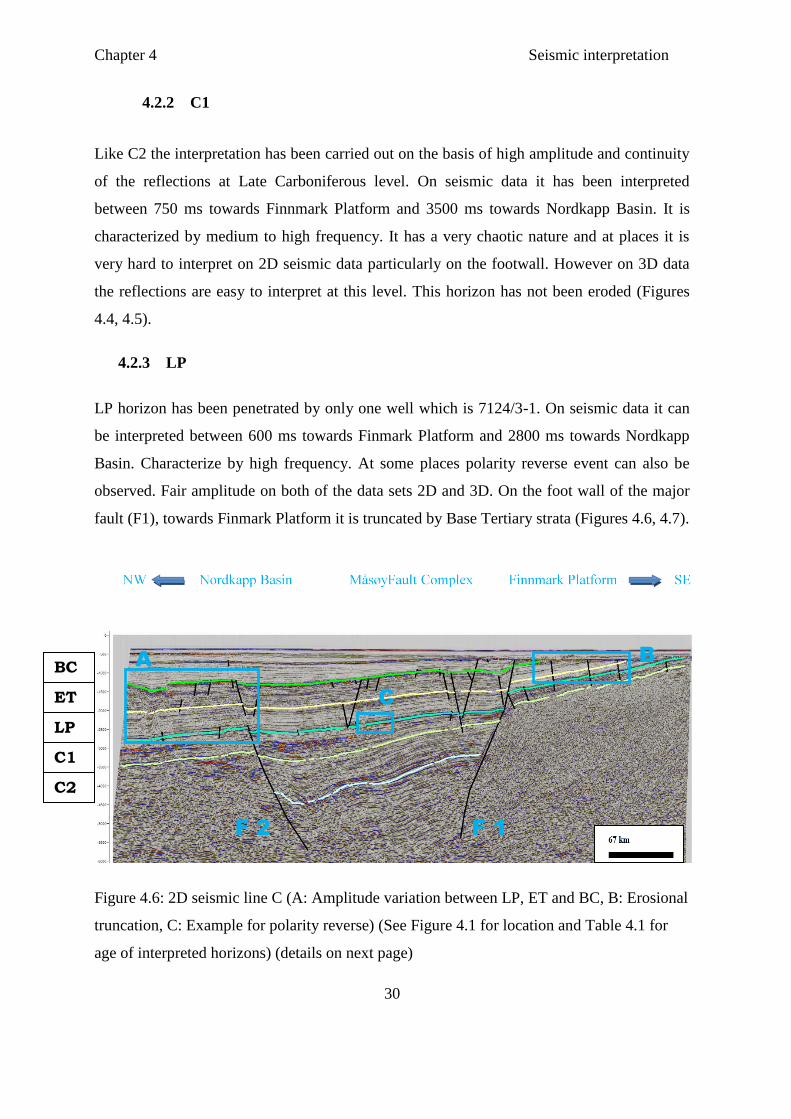
4.2.3 LP
LP horizon has been penetrated by only one well which is 7124/3-1. On seismic data it can
be interpreted between 600 ms towards Finmark Platform and 2800 ms towards Nordkapp
Basin. Characterize by high frequency. At some places polarity reverse event can also be
observed. Fair amplitude on both of the data sets 2D and 3D. On the foot wall of the major
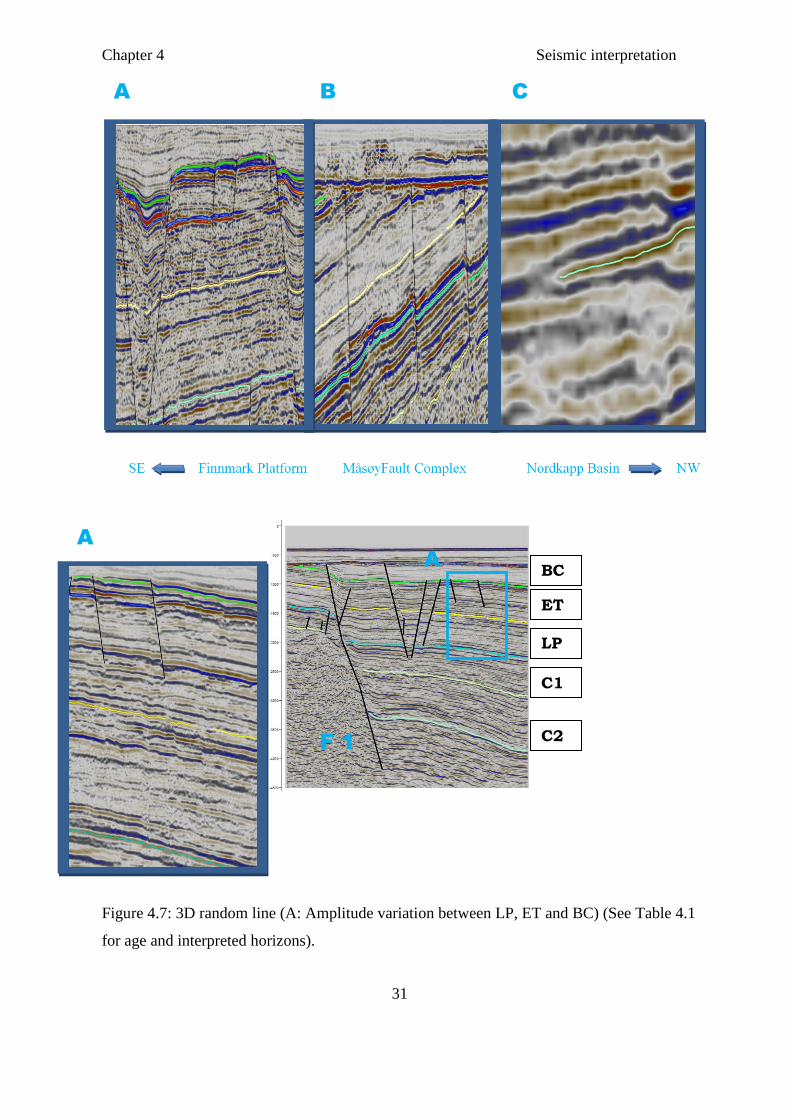
fault (F1), towards Finmark Platform it is truncated by Base Tertiary strata (Figures 4.6, 4.7).
Figure 4.6: 2D seismic line C (A: Amplitude variation between LP, ET and BC, B: Erosional
truncation, C: Example for polarity reverse) (See Figure 4.1 for location and Table 4.1 for
age of interpreted horizons) (details on next page)
A
C
B
F 1
C2
C1
LP
ET
BC
F 2
Chapter 4 Seismic interpretation
31
Figure 4.7: 3D random line (A: Amplitude variation between LP, ET and BC) (See Table 4.1
for age and interpreted horizons).
A B C
A
A
C2
C1
LP
ET
BC
F 1
Chapter 4 Seismic interpretation
32
4.2.4 ET
It has been penetrated by all of the wells. ET is the last horizon encountered in wells 7125/4-
1 and 7125/4-2. On seismic data it can be interpreted between 650 ms towards Finnmark
Platform and 2100 ms towards Nordkapp Basin. ET has strong amplitude on both 2D and 3D
data sets along with high frequency. Towards the Finmark Platform amplitude is a bit low
but still it can be easily interpreted. Although it has been cut by many faults still it is
continuous on both of the data sets. On the hanging wall side of the major fault (F1) the
formation is affected by erosion and it is truncated by Base Tertiary sediments. At places
there are chaotic reflections along with polarity reverse features. This can be the effect of
fault activity and lithology variations within the formation (Figures 4.6, 4.7).
4.2.5 BC
BC has been penetrated by all of the three wells. On seismic data it can be interpreted
between 600 ms towards Finmark Platform and 1400 ms towards Nordkapp Basin. At some
places polarity reverse event can also be observed. It has high amplitude and frequency on
both of the data sets 2D and 3D. Towards Nordkapp Basin it is stable in term of amplitude
and continuity. However it has a very disturbed amplitude and continuity towards Finnmark
Platform where it is mostly absent due to erosion. On the footwall of the major fault (F1),
towards Finnmark Platform it is truncated by Base Tertiary sediments (Figures 4.6, 4.7).
Chapter 4 Seismic interpretation
33
4.3 Selected profiles
Following are the seismic lines that are selected on the basis of the orientation of the major
fault that is changing from west to east and to point out the structural differences (Figure
4.1).
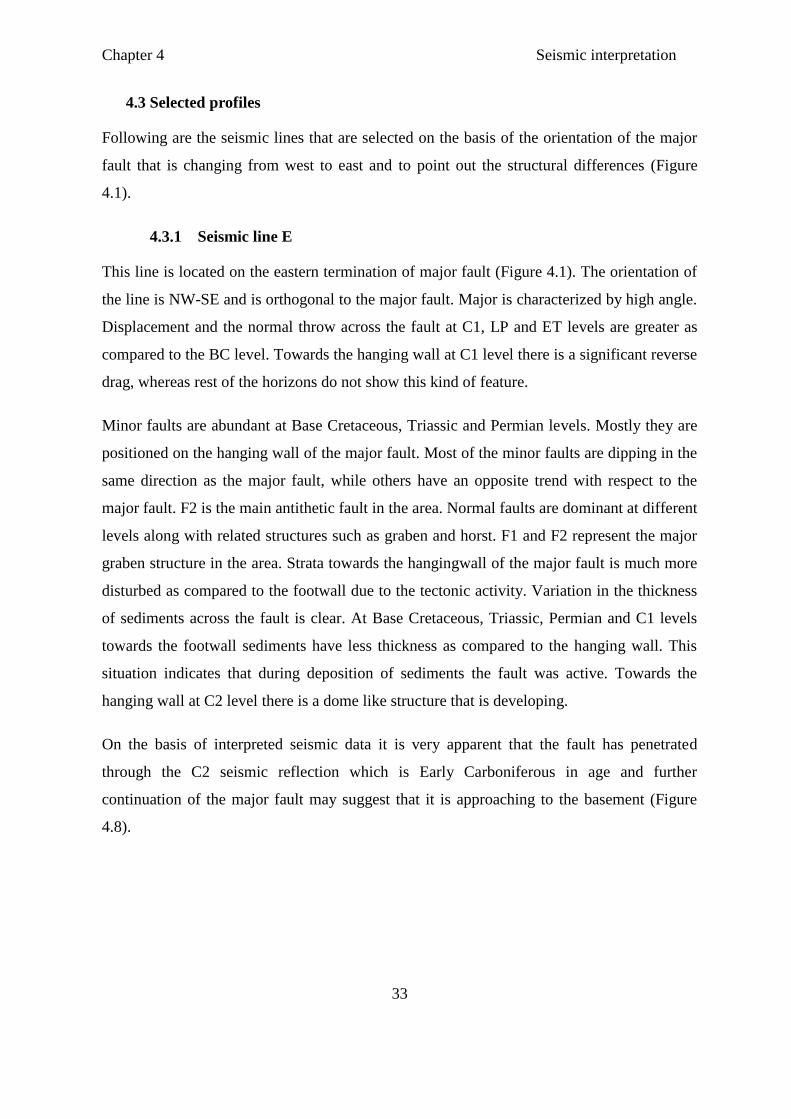
4.3.1 Seismic line E
This line is located on the eastern termination of major fault (Figure 4.1). The orientation of
the line is NW-SE and is orthogonal to the major fault. Major is characterized by high angle.
Displacement and the normal throw across the fault at C1, LP and ET levels are greater as
compared to the BC level. Towards the hanging wall at C1 level there is a significant reverse
drag, whereas rest of the horizons do not show this kind of feature.
Minor faults are abundant at Base Cretaceous, Triassic and Permian levels. Mostly they are
positioned on the hanging wall of the major fault. Most of the minor faults are dipping in the
same direction as the major fault, while others have an opposite trend with respect to the
major fault. F2 is the main antithetic fault in the area. Normal faults are dominant at different
levels along with related structures such as graben and horst. F1 and F2 represent the major
graben structure in the area. Strata towards the hangingwall of the major fault is much more
disturbed as compared to the footwall due to the tectonic activity. Variation in the thickness
of sediments across the fault is clear. At Base Cretaceous, Triassic, Permian and C1 levels
towards the footwall sediments have less thickness as compared to the hanging wall. This
situation indicates that during deposition of sediments the fault was active. Towards the
hanging wall at C2 level there is a dome like structure that is developing.
On the basis of interpreted seismic data it is very apparent that the fault has penetrated
through the C2 seismic reflection which is Early Carboniferous in age and further
continuation of the major fault may suggest that it is approaching to the basement (Figure
4.8).
Chapter 4 Seismic interpretation
34
Figure 4.8: Interpreted seismic line E (See Figure 4.1 for location and Table 4.1 for age of
interpreted horizons).
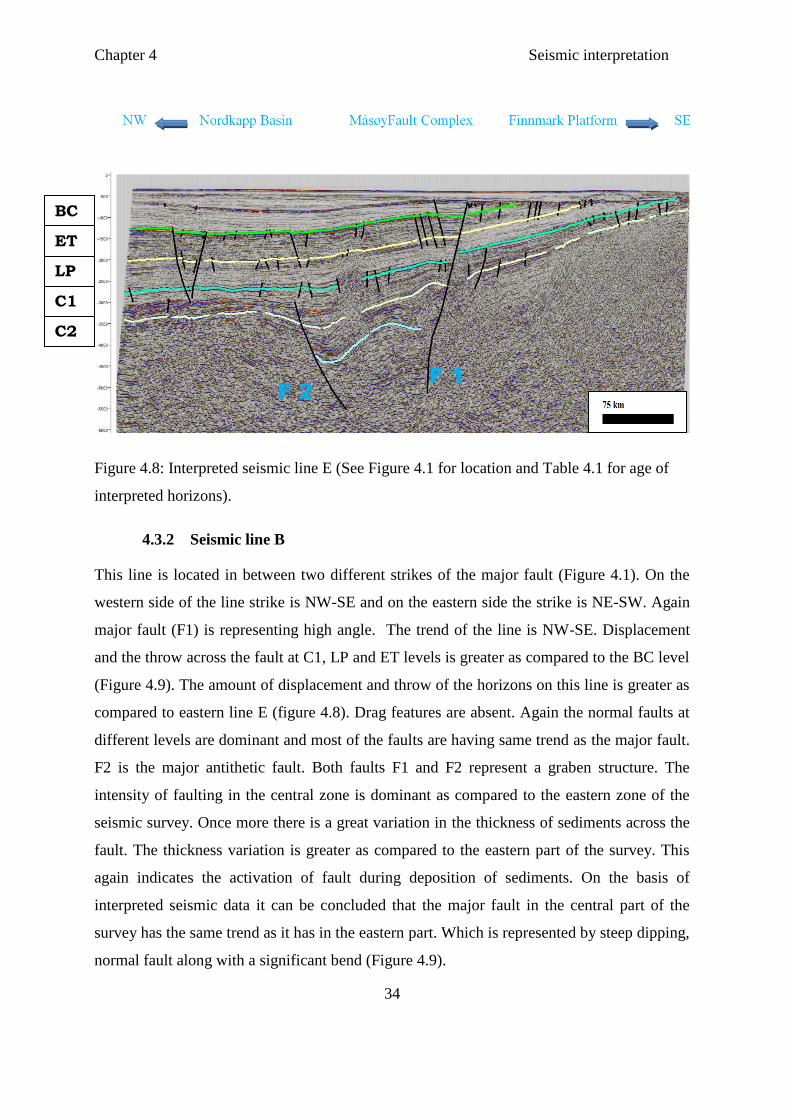
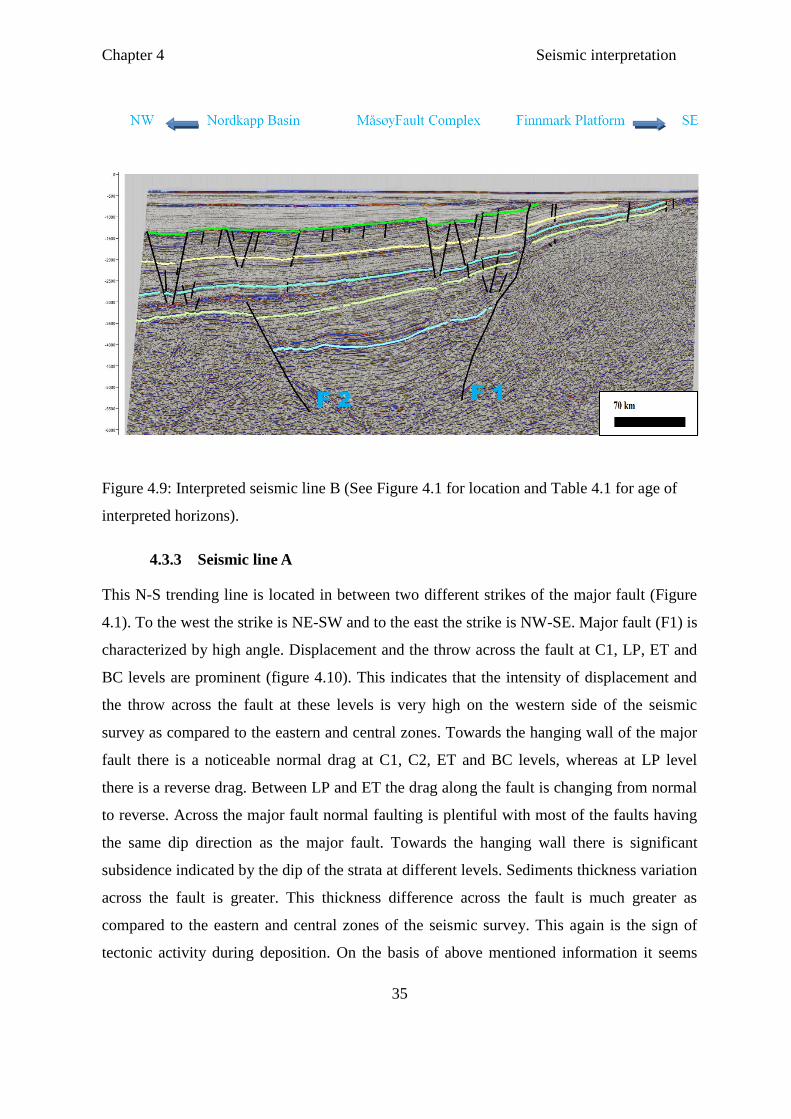
4.3.2 Seismic line B
This line is located in between two different strikes of the major fault (Figure 4.1). On the
western side of the line strike is NW-SE and on the eastern side the strike is NE-SW. Again
major fault (F1) is representing high angle. The trend of the line is NW-SE. Displacement
and the throw across the fault at C1, LP and ET levels is greater as compared to the BC level
(Figure 4.9). The amount of displacement and throw of the horizons on this line is greater as
compared to eastern line E (figure 4.8). Drag features are absent. Again the normal faults at
different levels are dominant and most of the faults are having same trend as the major fault.
F2 is the major antithetic fault. Both faults F1 and F2 represent a graben structure. The
intensity of faulting in the central zone is dominant as compared to the eastern zone of the
seismic survey. Once more there is a great variation in the thickness of sediments across the
fault. The thickness variation is greater as compared to the eastern part of the survey. This
again indicates the activation of fault during deposition of sediments. On the basis of
interpreted seismic data it can be concluded that the major fault in the central part of the
survey has the same trend as it has in the eastern part. Which is represented by steep dipping,
normal fault along with a significant bend (Figure 4.9).
F 1
C2
C1
LP
ET
BC
F 2
Chapter 4 Seismic interpretation
35
Figure 4.9: Interpreted seismic line B (See Figure 4.1 for location and Table 4.1 for age of
interpreted horizons).
4.3.3 Seismic line A
This N-S trending line is located in between two different strikes of the major fault (Figure
4.1). To the west the strike is NE-SW and to the east the strike is NW-SE. Major fault (F1) is
characterized by high angle. Displacement and the throw across the fault at C1, LP, ET and
BC levels are prominent (figure 4.10). This indicates that the intensity of displacement and
the throw across the fault at these levels is very high on the western side of the seismic
survey as compared to the eastern and central zones. Towards the hanging wall of the major
fault there is a noticeable normal drag at C1, C2, ET and BC levels, whereas at LP level
there is a reverse drag. Between LP and ET the drag along the fault is changing from normal
to reverse. Across the major fault normal faulting is plentiful with most of the faults having
the same dip direction as the major fault. Towards the hanging wall there is significant
subsidence indicated by the dip of the strata at different levels. Sediments thickness variation
across the fault is greater. This thickness difference across the fault is much greater as
compared to the eastern and central zones of the seismic survey. This again is the sign of
tectonic activity during deposition. On the basis of above mentioned information it seems
F 1
F 2
Chapter 4 Seismic interpretation
36
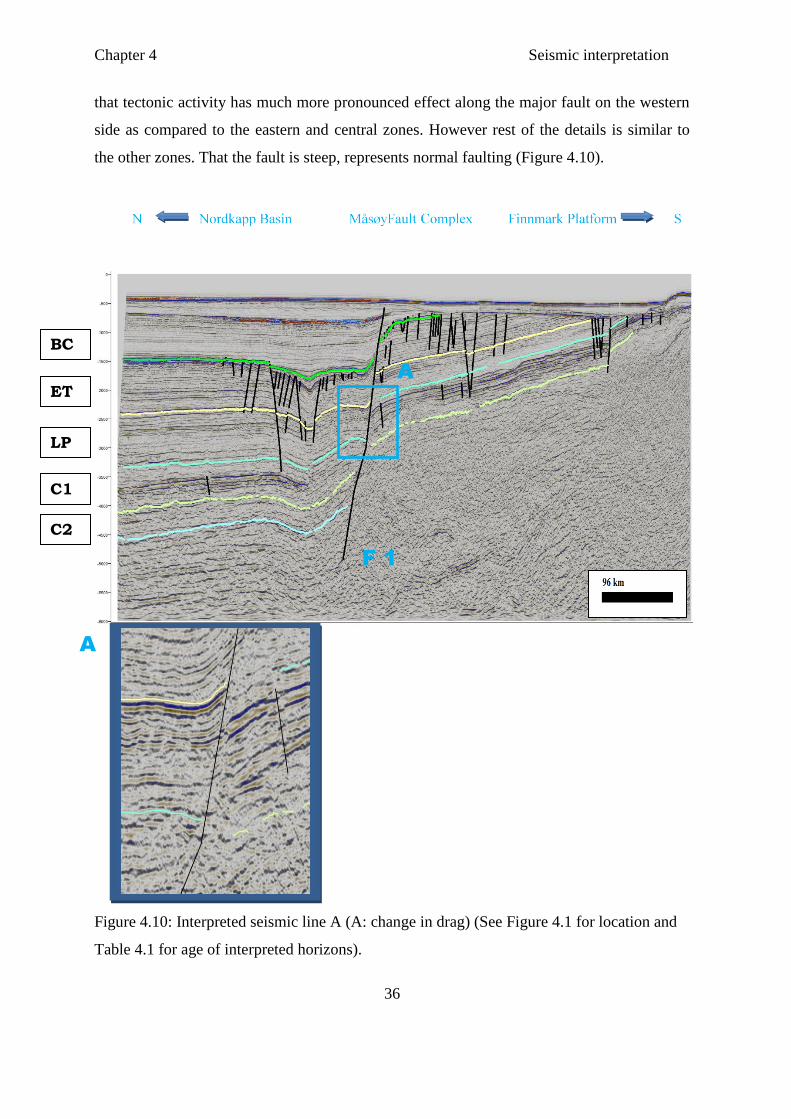
that tectonic activity has much more pronounced effect along the major fault on the western
side as compared to the eastern and central zones. However rest of the details is similar to
the other zones. That the fault is steep, represents normal faulting (Figure 4.10).
Figure 4.10: Interpreted seismic line A (A: change in drag) (See Figure 4.1 for location and
Table 4.1 for age of interpreted horizons).
F 1
A
A
C2
C1
LP
ET
BC
Chapter 4 Seismic interpretation
37
4.4 Structural maps
Following are the structural maps of interpreted horizons. Time-structure maps were
generated using the software, whereas structural trend maps were generated manually on the
basis of information extracted from interpreted seismic sections.
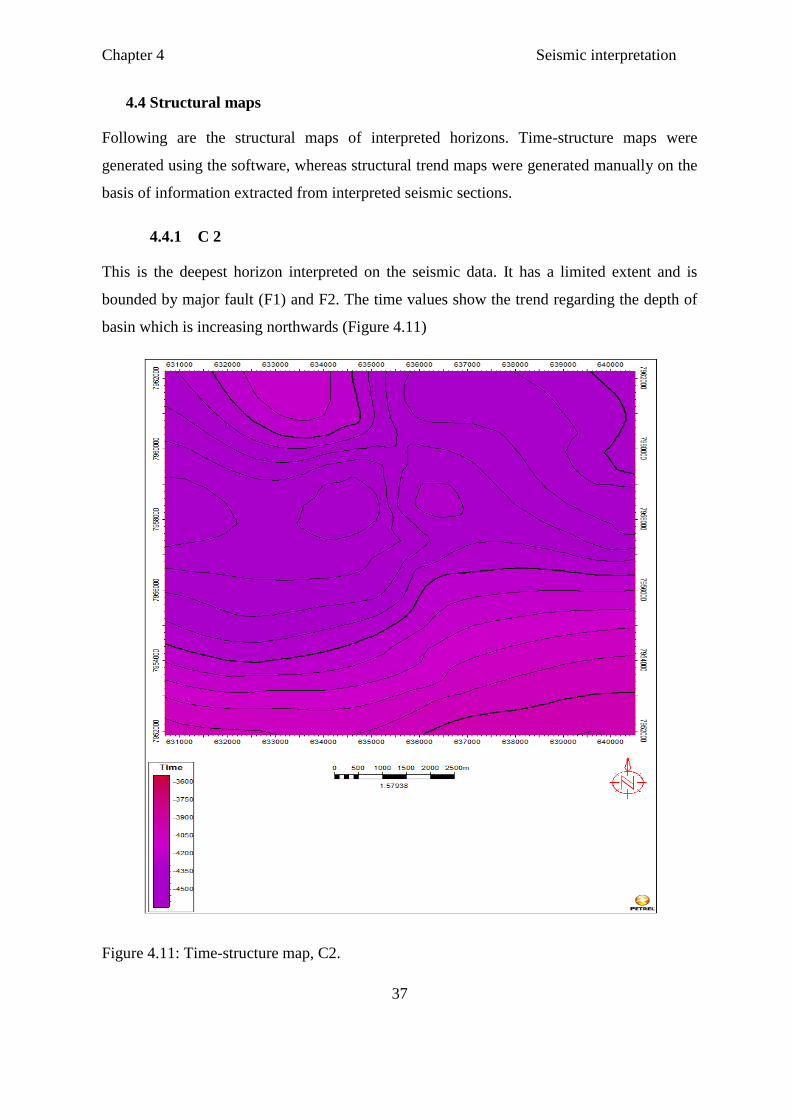
4.4.1 C 2
This is the deepest horizon interpreted on the seismic data. It has a limited extent and is
bounded by major fault (F1) and F2. The time values show the trend regarding the depth of
basin which is increasing northwards (Figure 4.11)
Figure 4.11: Time-structure map, C2.
Chapter 4 Seismic interpretation
38
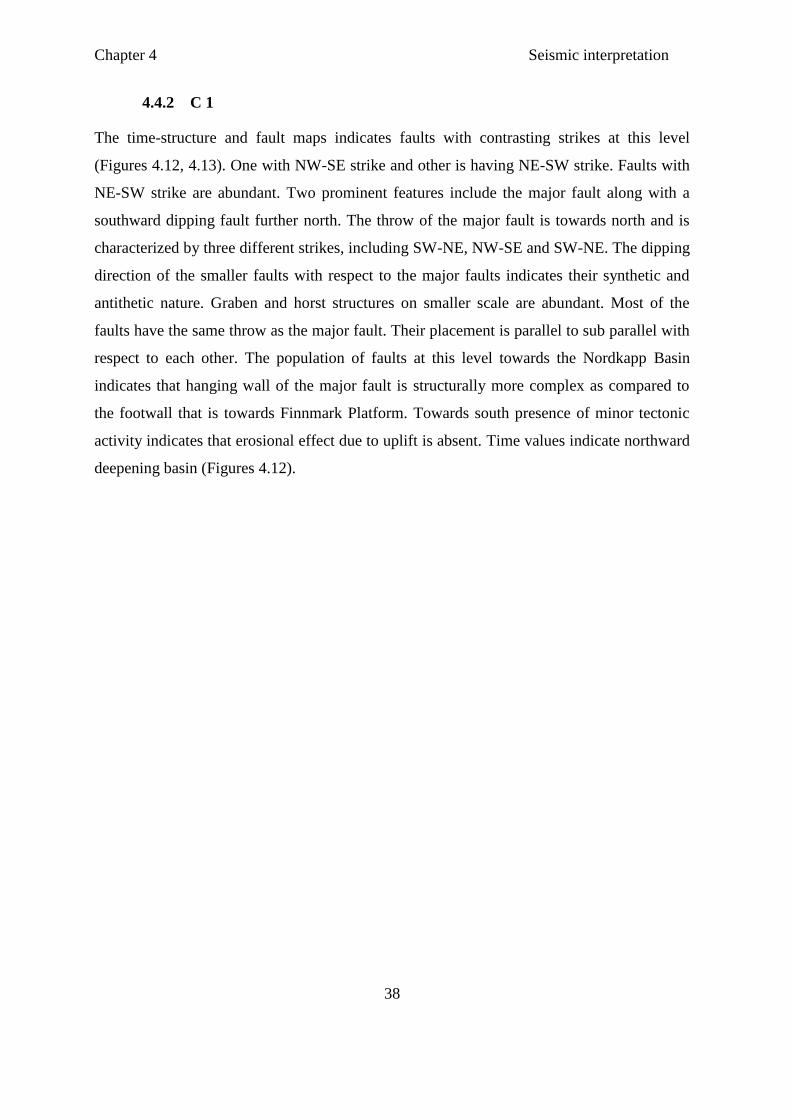
4.4.2 C 1
The time-structure and fault maps indicates faults with contrasting strikes at this level
(Figures 4.12, 4.13). One with NW-SE strike and other is having NE-SW strike. Faults with
NE-SW strike are abundant. Two prominent features include the major fault along with a
southward dipping fault further north. The throw of the major fault is towards north and is
characterized by three different strikes, including SW-NE, NW-SE and SW-NE. The dipping
direction of the smaller faults with respect to the major faults indicates their synthetic and
antithetic nature. Graben and horst structures on smaller scale are abundant. Most of the
faults have the same throw as the major fault. Their placement is parallel to sub parallel with
respect to each other. The population of faults at this level towards the Nordkapp Basin
indicates that hanging wall of the major fault is structurally more complex as compared to
the footwall that is towards Finnmark Platform. Towards south presence of minor tectonic
activity indicates that erosional effect due to uplift is absent. Time values indicate northward
deepening basin (Figures 4.12).
Chapter 4 Seismic interpretation
39
Figure 4.12: Time-structure map, C1.
Chapter 4 Seismic interpretation
40
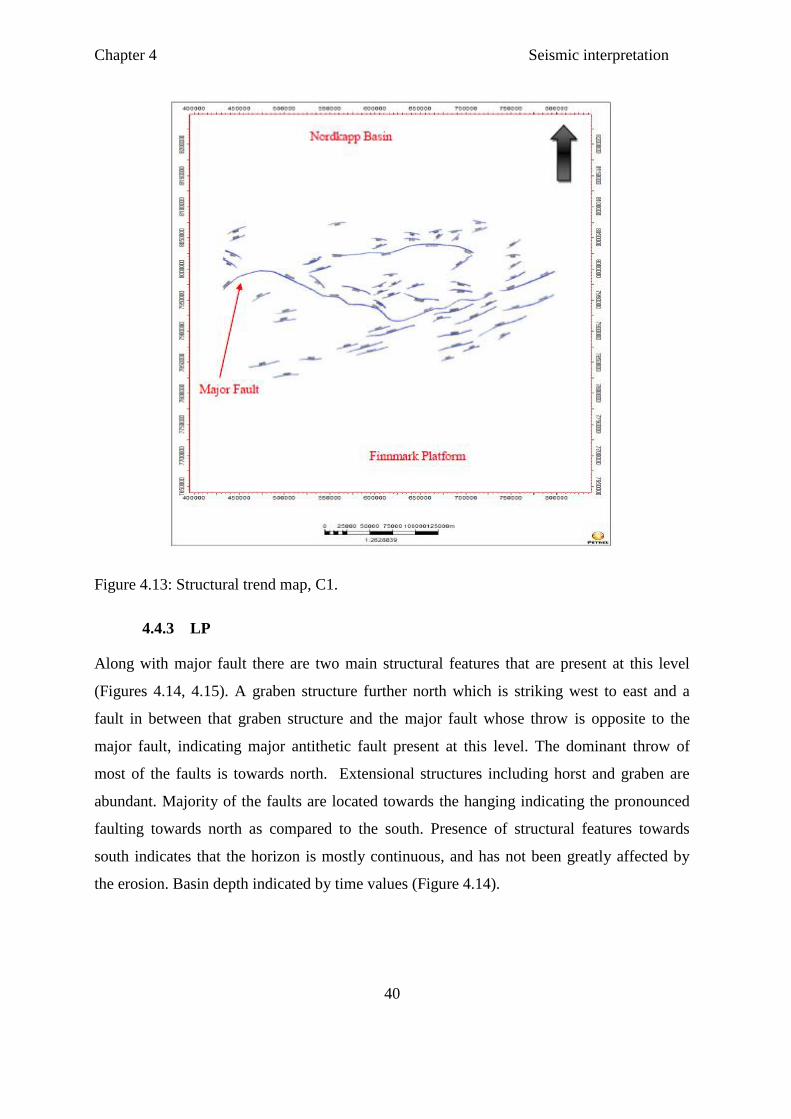
Figure 4.13: Structural trend map, C1.
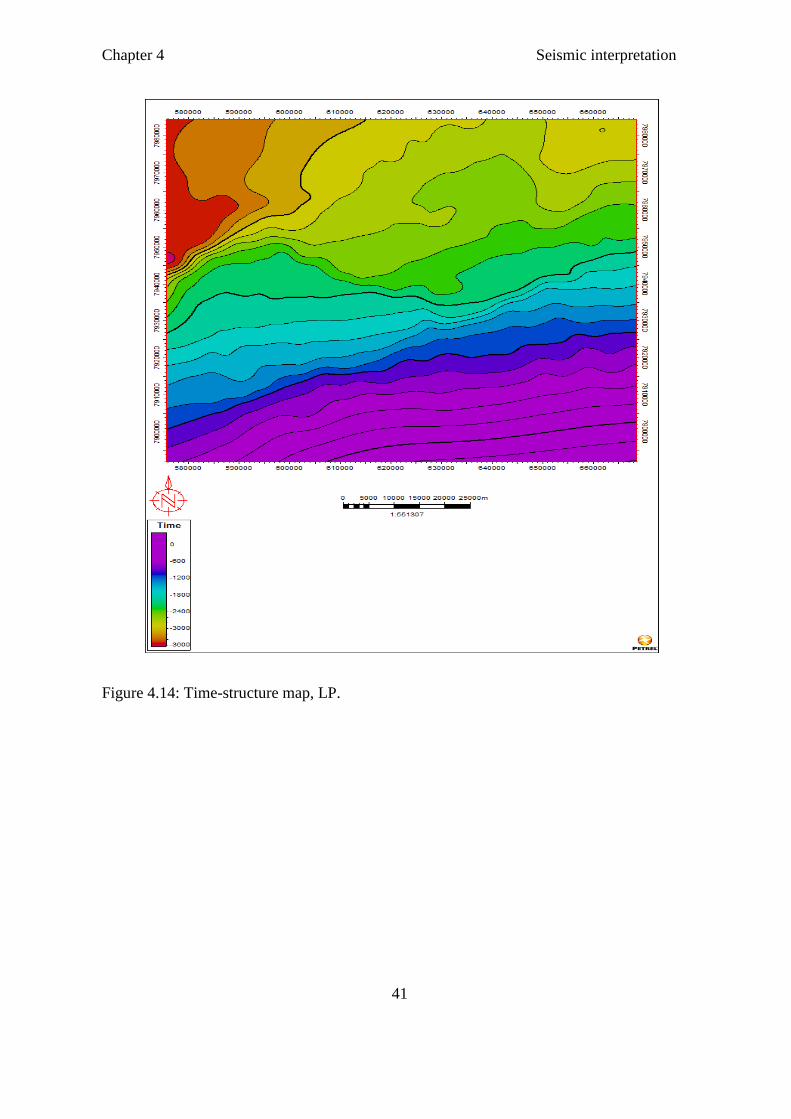
4.4.3 LP
Along with major fault there are two main structural features that are present at this level
(Figures 4.14, 4.15). A graben structure further north which is striking west to east and a
fault in between that graben structure and the major fault whose throw is opposite to the
major fault, indicating major antithetic fault present at this level. The dominant throw of
most of the faults is towards north. Extensional structures including horst and graben are
abundant. Majority of the faults are located towards the hanging indicating the pronounced
faulting towards north as compared to the south. Presence of structural features towards
south indicates that the horizon is mostly continuous, and has not been greatly affected by
the erosion. Basin depth indicated by time values (Figure 4.14).
Chapter 4 Seismic interpretation
41
Figure 4.14: Time-structure map, LP.
Chapter 4 Seismic interpretation
42
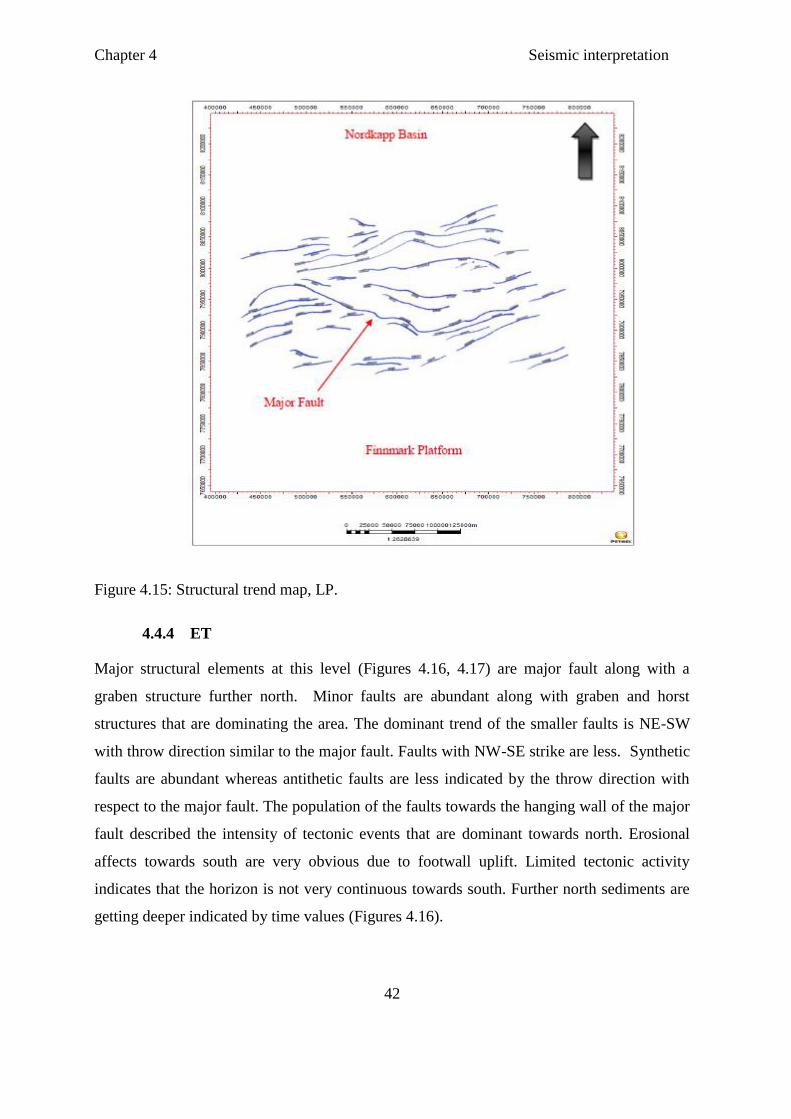
Figure 4.15: Structural trend map, LP.
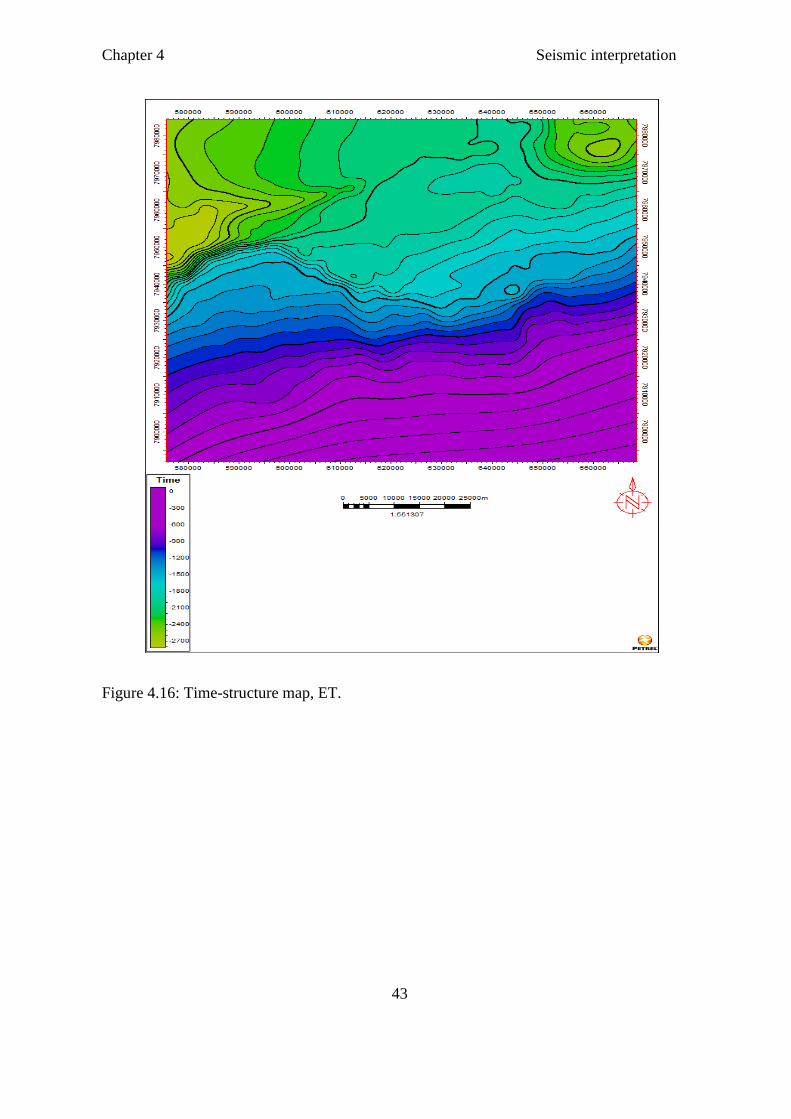
4.4.4 ET
Major structural elements at this level (Figures 4.16, 4.17) are major fault along with a
graben structure further north. Minor faults are abundant along with graben and horst
structures that are dominating the area. The dominant trend of the smaller faults is NE-SW
with throw direction similar to the major fault. Faults with NW-SE strike are less. Synthetic
faults are abundant whereas antithetic faults are less indicated by the throw direction with
respect to the major fault. The population of the faults towards the hanging wall of the major
fault described the intensity of tectonic events that are dominant towards north. Erosional
affects towards south are very obvious due to footwall uplift. Limited tectonic activity
indicates that the horizon is not very continuous towards south. Further north sediments are
getting deeper indicated by time values (Figures 4.16).
Chapter 4 Seismic interpretation
43
Figure 4.16: Time-structure map, ET.
Chapter 4 Seismic interpretation
44
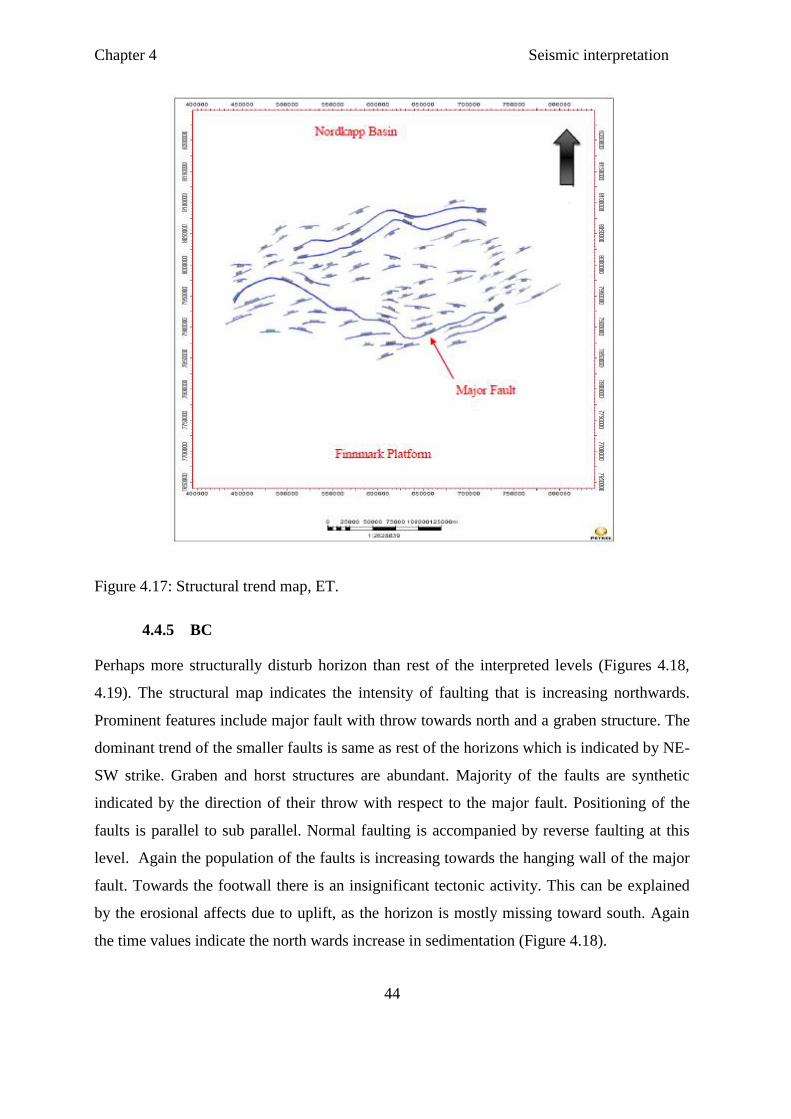
Figure 4.17: Structural trend map, ET.
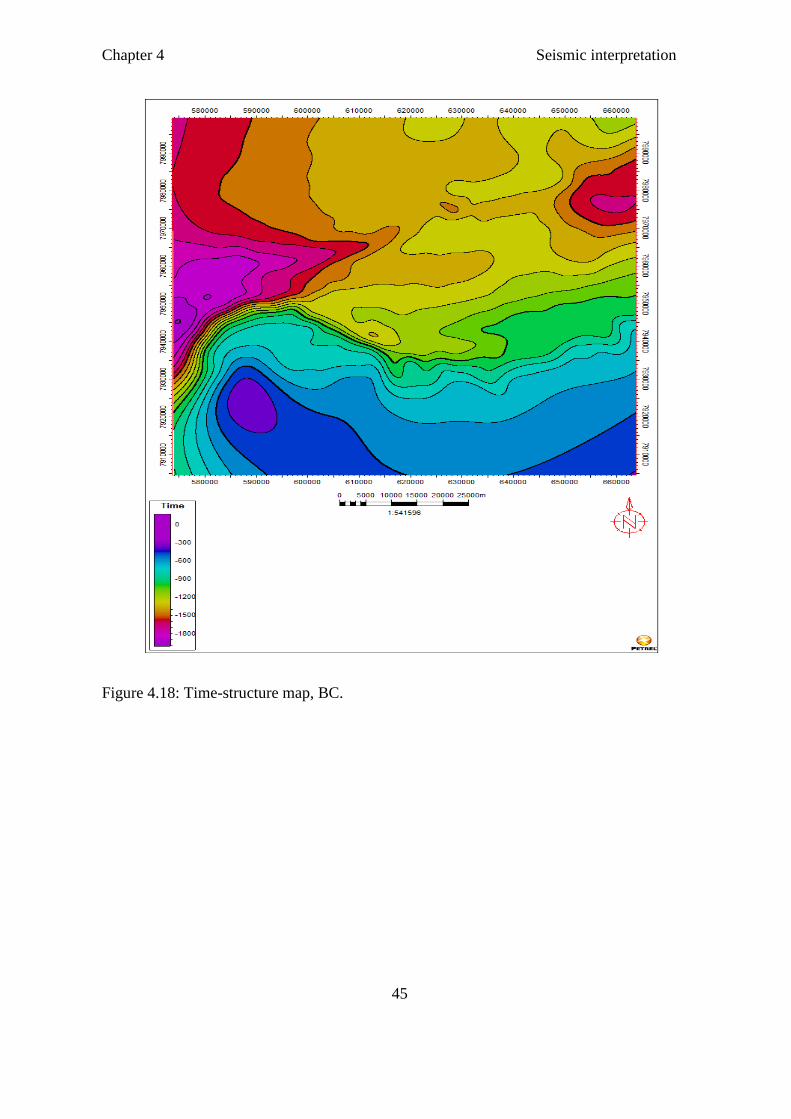
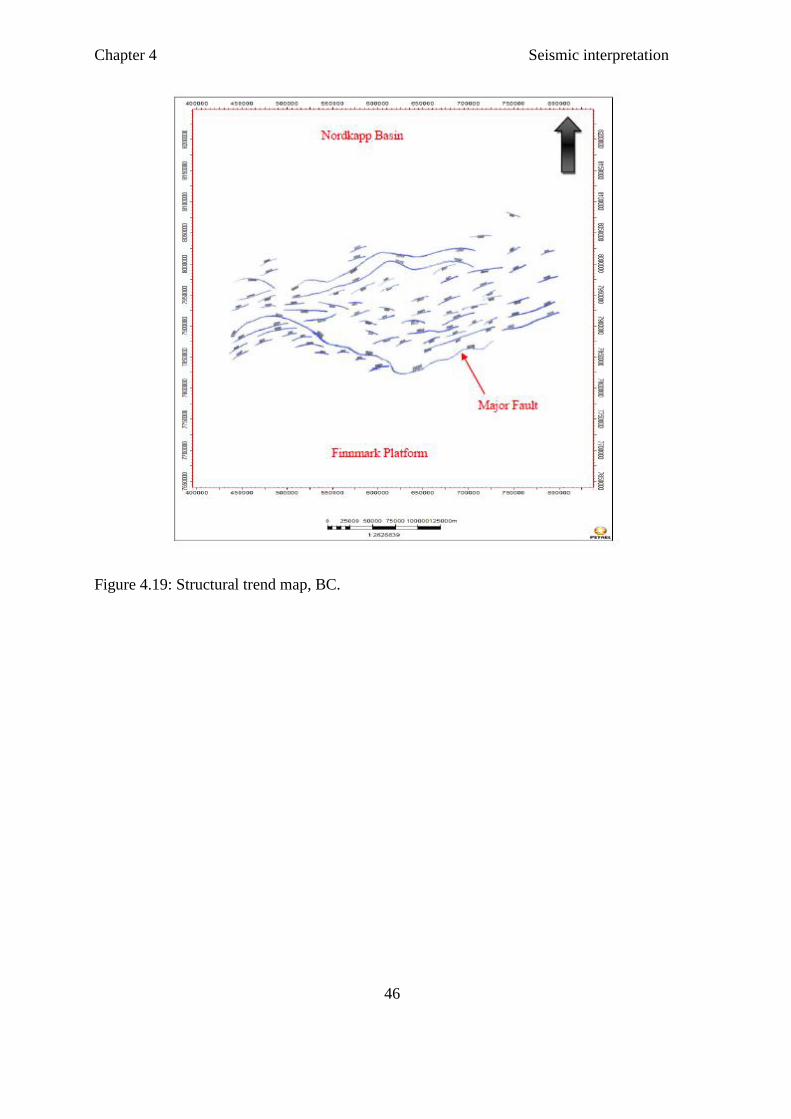
4.4.5 BC
Perhaps more structurally disturb horizon than rest of the interpreted levels (Figures 4.18,
4.19). The structural map indicates the intensity of faulting that is increasing northwards.
Prominent features include major fault with throw towards north and a graben structure. The
dominant trend of the smaller faults is same as rest of the horizons which is indicated by NE-
SW strike. Graben and horst structures are abundant. Majority of the faults are synthetic
indicated by the direction of their throw with respect to the major fault. Positioning of the
faults is parallel to sub parallel. Normal faulting is accompanied by reverse faulting at this
level. Again the population of the faults is increasing towards the hanging wall of the major
fault. Towards the footwall there is an insignificant tectonic activity. This can be explained
by the erosional affects due to uplift, as the horizon is mostly missing toward south. Again
the time values indicate the north wards increase in sedimentation (Figure 4.18).
Chapter 4 Seismic interpretation
45
Figure 4.18: Time-structure map, BC.
Chapter 4 Seismic interpretation
46
Figure 4.19: Structural trend map, BC.
Chapter 4 Seismic interpretation
47
4.5 Fault activity
There are several faults that are interpreted on the seismic data. Along with smaller faults
there is one major fault (F1) that can be interpreted on all of the seismic data (2D & 3D) and
that fault has penetrated through all of the interpreted horizons. Most of the structures are
present between 500 ms and 2000 ms on the seismic data. At the levels deeper that intra
Carboniferous 2 there is no pronounced tectonic activity. Nearly all of the faults that are
interpreted represent normal faulting. Along with fault activities there are also salt related
tectonic events that are observed on some of the 2D seismic lines.
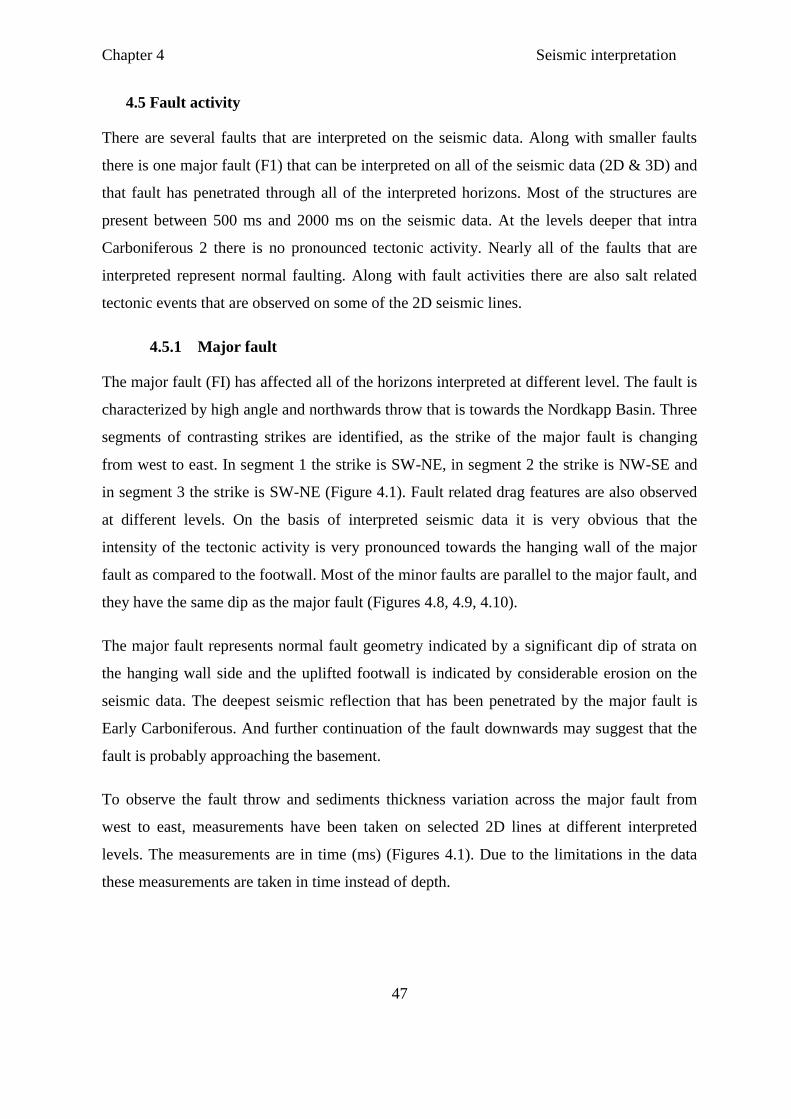
4.5.1 Major fault
The major fault (FI) has affected all of the horizons interpreted at different level. The fault is
characterized by high angle and northwards throw that is towards the Nordkapp Basin. Three
segments of contrasting strikes are identified, as the strike of the major fault is changing
from west to east. In segment 1 the strike is SW-NE, in segment 2 the strike is NW-SE and
in segment 3 the strike is SW-NE (Figure 4.1). Fault related drag features are also observed
at different levels. On the basis of interpreted seismic data it is very obvious that the
intensity of the tectonic activity is very pronounced towards the hanging wall of the major
fault as compared to the footwall. Most of the minor faults are parallel to the major fault, and
they have the same dip as the major fault (Figures 4.8, 4.9, 4.10).
The major fault represents normal fault geometry indicated by a significant dip of strata on
the hanging wall side and the uplifted footwall is indicated by considerable erosion on the
seismic data. The deepest seismic reflection that has been penetrated by the major fault is
Early Carboniferous. And further continuation of the fault downwards may suggest that the
fault is probably approaching the basement.
To observe the fault throw and sediments thickness variation across the major fault from
west to east, measurements have been taken on selected 2D lines at different interpreted
levels. The measurements are in time (ms) (Figures 4.1). Due to the limitations in the data
these measurements are taken in time instead of depth.
Chapter 4 Seismic interpretation
48
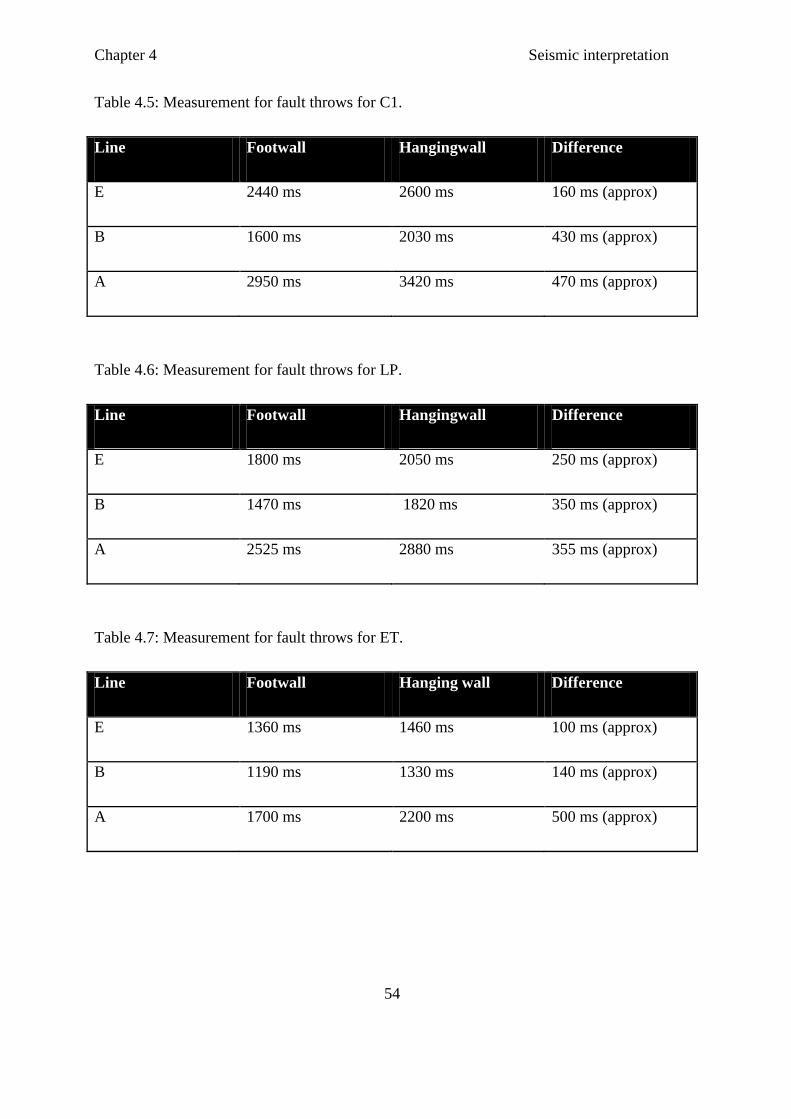
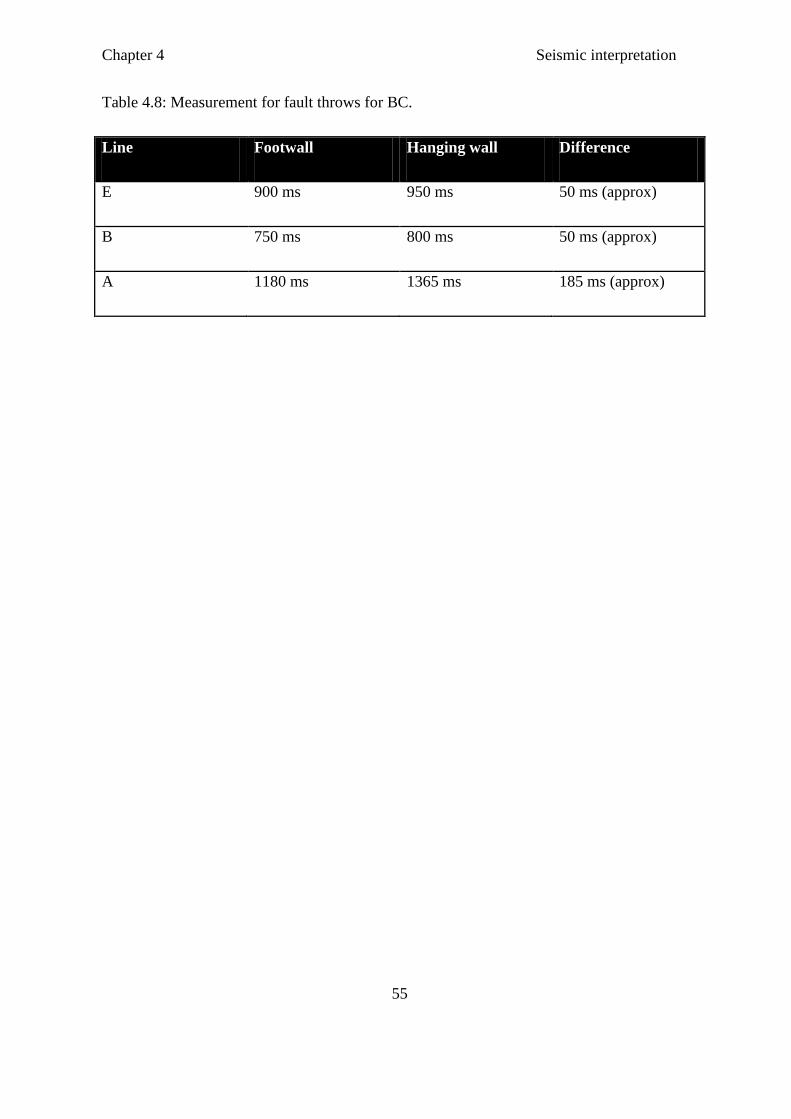
In case of fault throw, results show that on the eastern side there are low values for the fault
throw at different interpreted levels. While on the western side at same levels values are
high. This indicated that that the throw of the fault is increasing from east to west. Which
shows the tectonic activity is more pronounced along the major fault on the western side as
compared to the eastern side. (Tables 4.6, 4.7, 4.8, Figures 4.8, 4.9, 4.10).
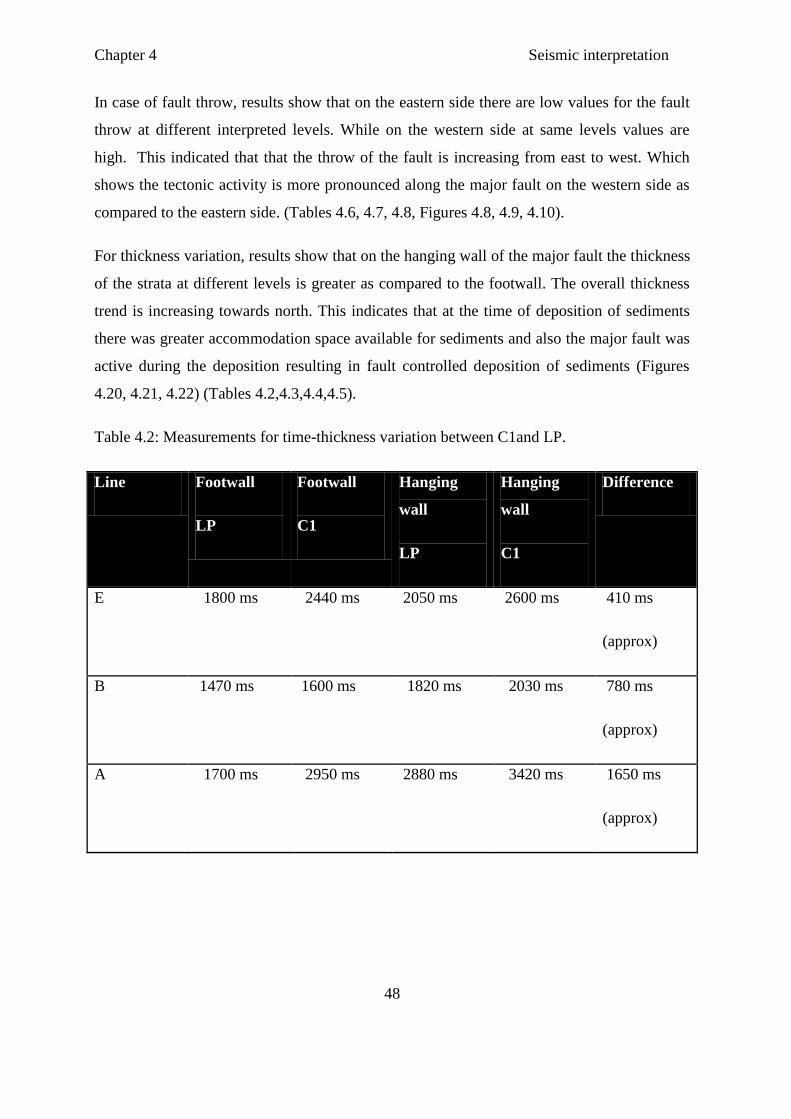
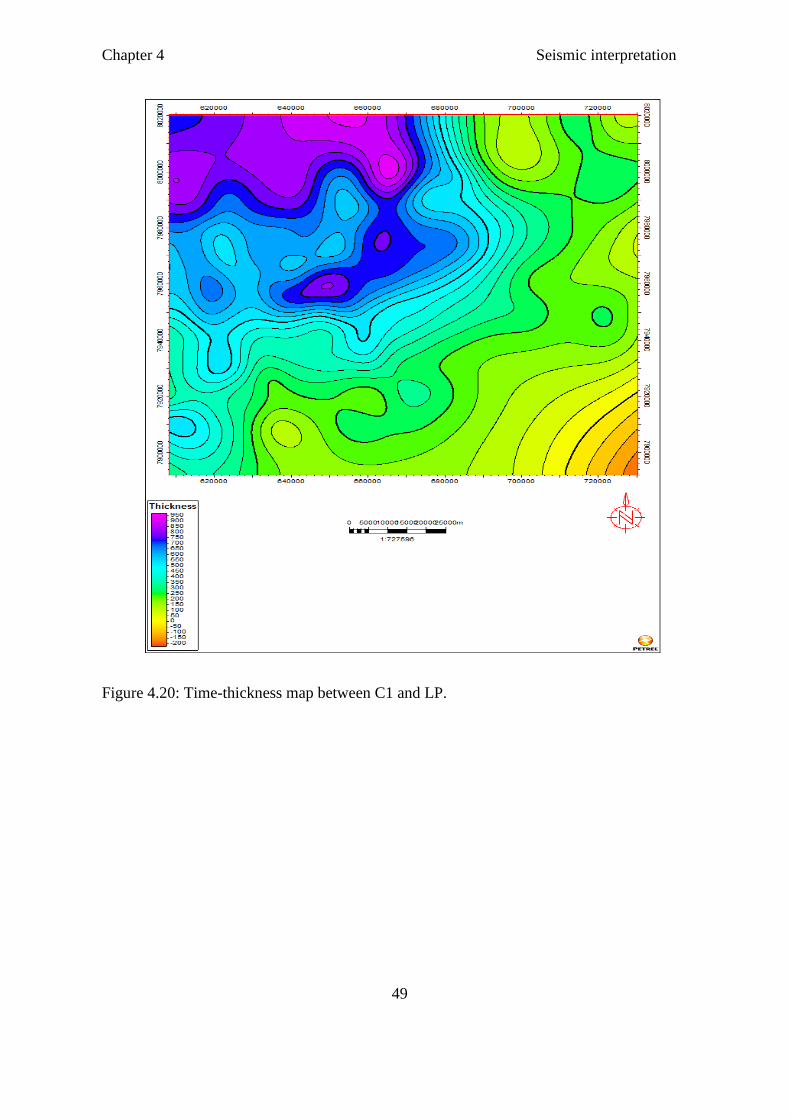
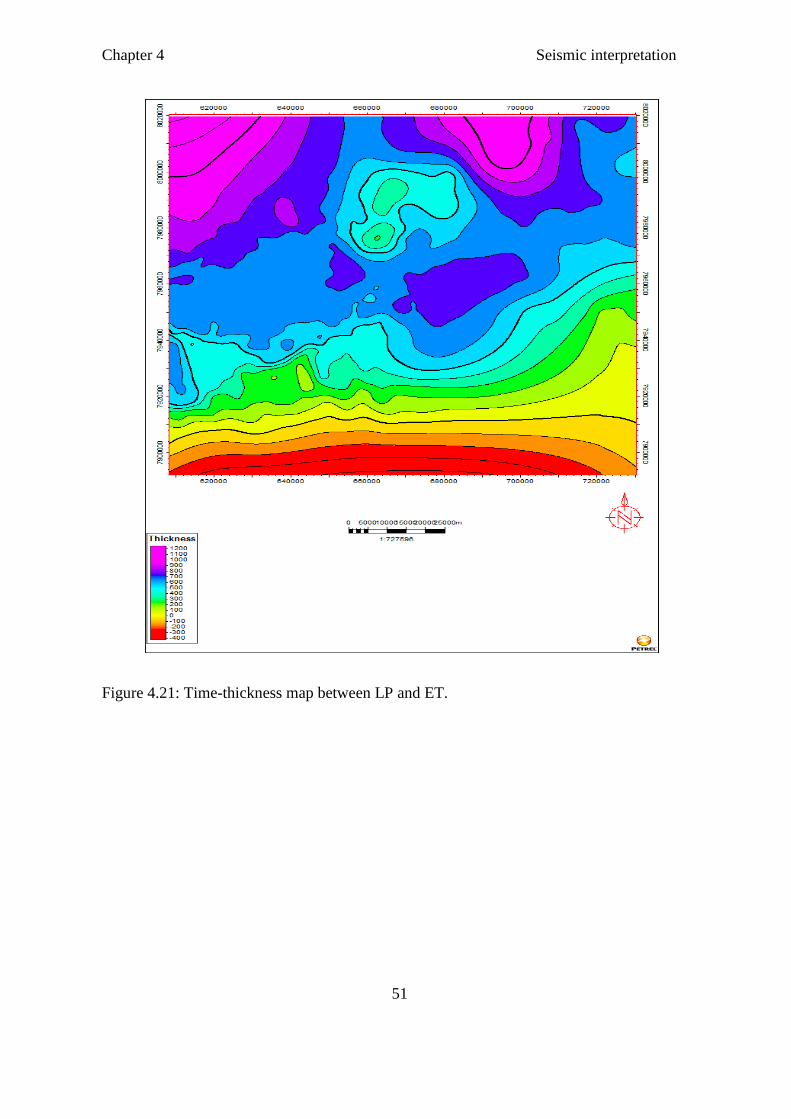
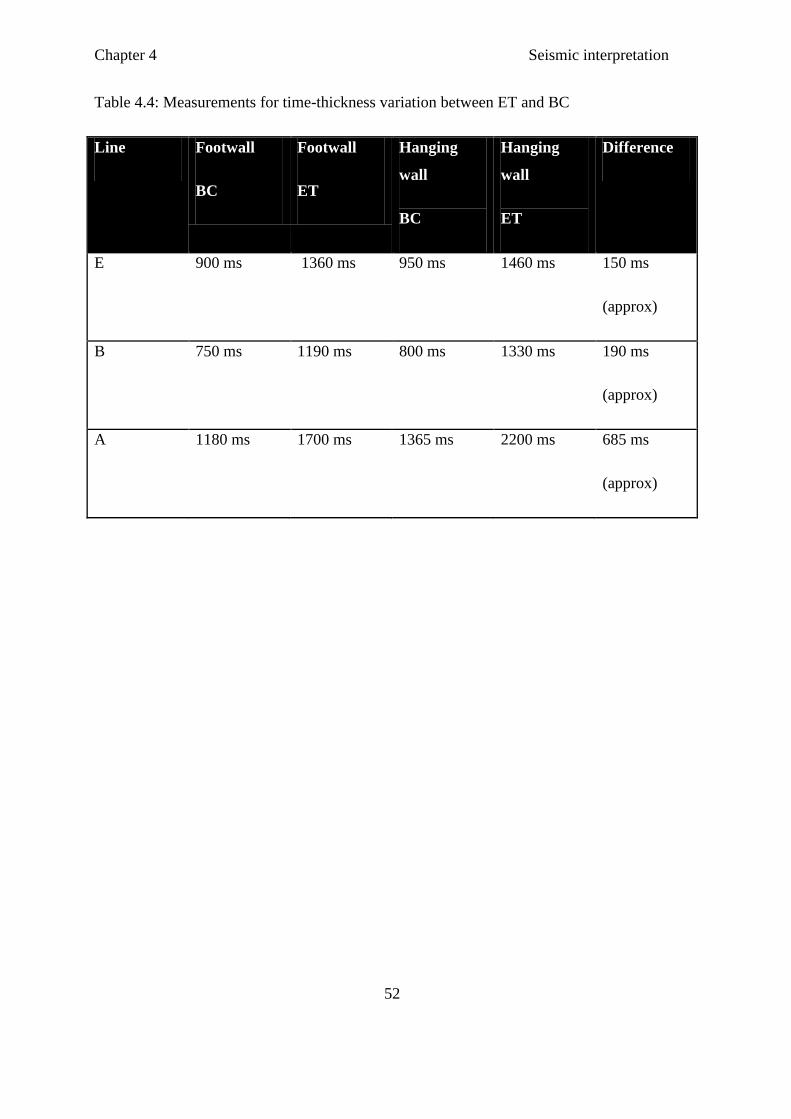
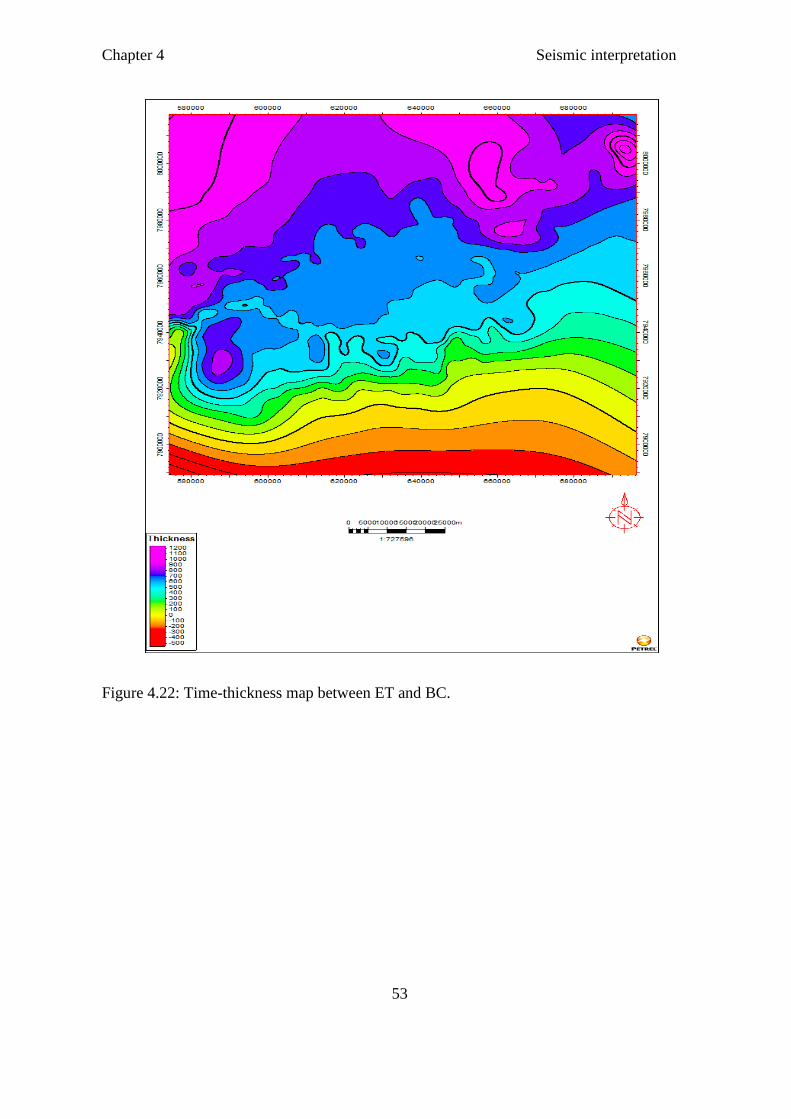
For thickness variation, results show that on the hanging wall of the major fault the thickness
of the strata at different levels is greater as compared to the footwall. The overall thickness
trend is increasing towards north. This indicates that at the time of deposition of sediments
there was greater accommodation space available for sediments and also the major fault was
active during the deposition resulting in fault controlled deposition of sediments (Figures
4.20, 4.21, 4.22) (Tables 4.2,4.3,4.4,4.5).
Table 4.2: Measurements for time-thickness variation between C1and LP.
Line Footwall
LP
Footwall
C1
Hanging
wall
LP
Hanging
wall
C1
Difference
E 1800 ms 2440 ms 2050 ms 2600 ms 410 ms
(approx)
B 1470 ms 1600 ms 1820 ms 2030 ms 780 ms
(approx)
A 1700 ms 2950 ms 2880 ms 3420 ms 1650 ms
(approx)
Chapter 4 Seismic interpretation
49
Figure 4.20: Time-thickness map between C1 and LP.
Chapter 4 Seismic interpretation
50
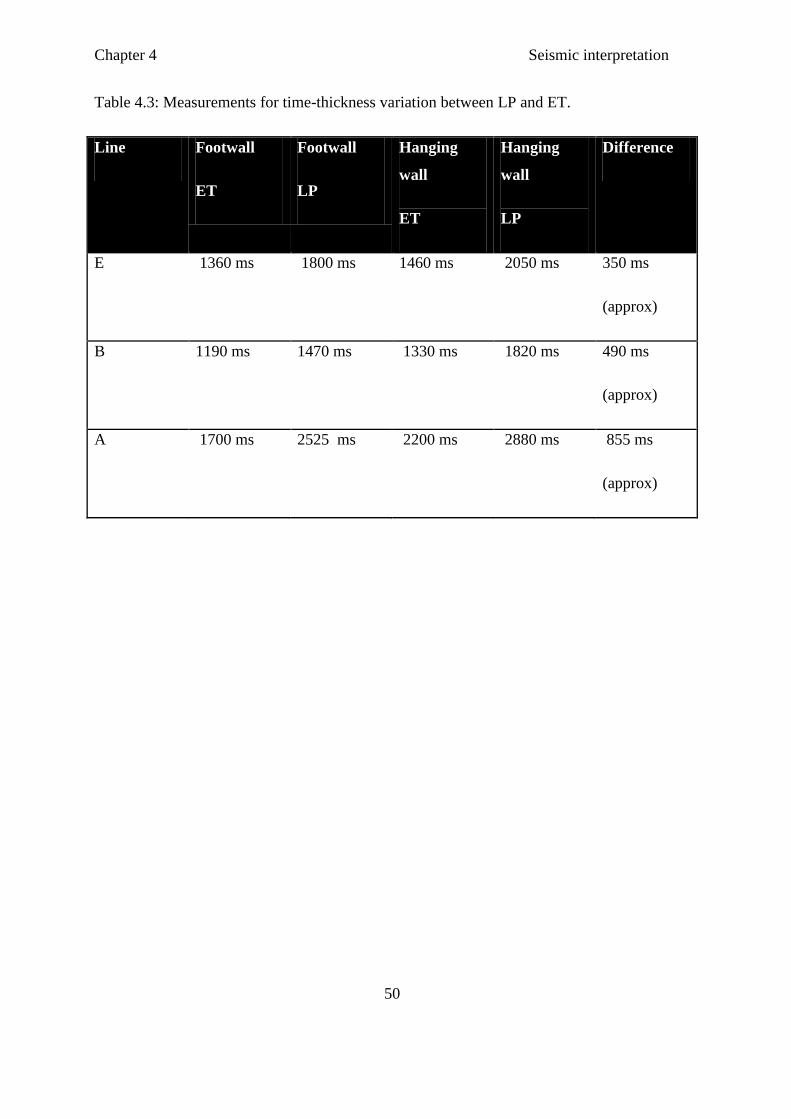
Table 4.3: Measurements for time-thickness variation between LP and ET.
Line Footwall
ET
Footwall
LP
Hanging
wall
ET
Hanging
wall
LP
Difference
E 1360 ms 1800 ms 1460 ms 2050 ms 350 ms
(approx)
B 1190 ms 1470 ms 1330 ms 1820 ms 490 ms
(approx)
A 1700 ms 2525 ms 2200 ms 2880 ms 855 ms
(approx)
Chapter 4 Seismic interpretation
51
Figure 4.21: Time-thickness map between LP and ET.
Chapter 4 Seismic interpretation
52
Table 4.4: Measurements for time-thickness variation between ET and BC
Line Footwall
BC
Footwall
ET
Hanging
wall
BC
Hanging
wall
ET
Difference
E 900 ms 1360 ms 950 ms 1460 ms 150 ms
(approx)
B 750 ms 1190 ms 800 ms 1330 ms 190 ms
(approx)
A 1180 ms 1700 ms 1365 ms 2200 ms 685 ms
(approx)
Chapter 4 Seismic interpretation
53
Figure 4.22: Time-thickness map between ET and BC.
Chapter 4 Seismic interpretation
54
Table 4.5: Measurement for fault throws for C1.
Line Footwall Hangingwall Difference
E 2440 ms 2600 ms 160 ms (approx)
B 1600 ms 2030 ms 430 ms (approx)
A 2950 ms 3420 ms 470 ms (approx)
Table 4.6: Measurement for fault throws for LP.
Line Footwall Hangingwall Difference
E 1800 ms 2050 ms 250 ms (approx)
B 1470 ms 1820 ms 350 ms (approx)
A 2525 ms 2880 ms 355 ms (approx)
Table 4.7: Measurement for fault throws for ET.
Line Footwall Hanging wall Difference
E 1360 ms 1460 ms 100 ms (approx)
B 1190 ms 1330 ms 140 ms (approx)
A 1700 ms 2200 ms 500 ms (approx)
Chapter 4 Seismic interpretation
55
Table 4.8: Measurement for fault throws for BC.
Line Footwall Hanging wall Difference
E 900 ms 950 ms 50 ms (approx)
B 750 ms 800 ms 50 ms (approx)
A 1180 ms 1365 ms 185 ms (approx)
Chapter 4 Seismic interpretation
56
4.5.2 Structural style
To study the fault activity across the study area, it has been divided into three different
segments on the basis of the orientation of major fault (F1) (Figure 4.1).
4.5.2.1 Segment 1
This segment represents the western part of the study are (Figure 4.1). Along the major fault
there is a significant displacement at different interpreted levels. At CI, LP, ET and BC
levels, sediments thickness across the fault is varying a lot. Towards the footwall the
thickness of sediments is less as compared to the hanging wall. This can be the result of fault
activation during sedimentation. The major fault has penetrated through the deepest seismic
reflection that belongs to the Early Carboniferous times. This may indicate that the fault may
have originated from the basement. In this segment there is a pronounced subsidence
occurred indicated by the sediments thickness and the dip of the strata along the major fault
(Section 4.5.1, Figure 4.8, 4.9, 4.10).
Minor fault activity is restricted down to Early Triassic level. Below this level due to poor
data quality structures are hard to recognize. Most of the faults are dominant at Base
Cretaceous level. Normal faults are abundant along with associated structures such as horst
and graben. The dominant strike of the minor faults is NE-SW. On the hanging close to the
major fault at Base Cretaceous level there are rotated fault blocks associated with rift events.
Synthetic faults are dominant along with antithetic faults that are rare indicated by the dip
direction with respect to the major fault (Figures 4.13, 4.15, 4.17, 4.19).
Segment 1 can be divided into two parts.
S1-A: Characterize the footwall of the major fault (F1). Most faults are present
between Base Cretaceous and Triassic levels. Synthetic normal faults are dominant
along with few graben structures. Cretaceous, Triassic and Permian sediments are
eroded. Abundant NE-SW striking faults along with few NW-SE strikes.
Chapter 4 Seismic interpretation
57
S1-B: Marks the hanging wall of the major fault (F1). There is a northwards
flexuring of strata, presence of sedimentary wedges along with thick sedimentary
sequences in between different interpreted levels. Rotation of fault blocks associated
with rifting and few signs of inversion at Base Cretaceous level. Most of the fault
activity is between Base Cretaceous and Late Permian. Several graben structures
along with horst structures. Few antithetic faults along with synthetic faults which are
abundant. NE-SW strike of the minor is dominant. Few signs of inversion indicated
by small scale reverse faults at Base Cretaceous level.
4.5.2.2 Segment 2
The segment is located in the centre of the study area (Figure 4.1). The displacement along
the major fault at different level is apparent. The thickness of sediment towards the hanging
wall is greater as compared t the footwall. However this thickness variation across the fault
is less as compared to the segment 1. Here again Early Carboniferous seismic horizon has
been penetrated by the major fault. As compared to the segment 1 the subsidence along the
major fault is less (Section 4.5.1, Figure 4.8, 4.9, 4.10).
The intensity of faulting is greater in this segment as compared to the segment 1 apparent by
the faults population on the hanging wall and the foot wall. Fault activity is dominant on the
hanging wall, whereas on the foot wall there are few faults. Normal faults are plentiful along
with Graben structures. Except C2 almost all of the interpreted levels show considerable
tectonic activity. Two contrasting striking trends of smaller faults are present, NW-SE and
NE-SW. Most of the faults are synthetic indicated by their dip with respect to the major
fault (Figures 4.13, 4.15, 4.17, 4.19).
Segment 2 can be divided into two parts.
S2-A: Characterize the footwall of the major fault (F1). Except Early Cretaceous rest
of the horizons show significant tectonic activity. Synthetic normal faults are
dominant along with few graben structures. Cretaceous, Triassic and Permian
sediments are eroded. Abundant NE-SW striking faults along with few NW-SE
strikes.
Chapter 4 Seismic interpretation
58
S2-B: Marks the hanging wall of the major fault (F1). There is a northwards
flexuring of strata, presence of sedimentary wedges along with thick sedimentary
sequences in between different interpreted levels. Rotation of fault blocks associated
with rifting along with minor indication of inversion at Base Cretaceous level. Like
footwall Except Early Cretaceous rest of the horizons show significant tectonic
activity. Plentiful graben structures along with horst structures. Few antithetic faults
along with synthetic faults which are abundant. NE-SW strike of the minor is
dominant. Few signs of inversion at Base Cretaceous level marked by small scale
reverse faults. S2-B seems to be more tectonically disturb as compared to the S1-B.
4.5.2.3 Segment 3
This segment marks the eastern part of the study area (Figure 4.1). As compared to the
segments 1 and 2 the displacement along the major fault in this segment is less. However
again the sediments thickness is greater towards the hanging wall relative to the footwall.
This can be the result of fault activation during sedimentation. The amount of subsidence
relative to the segment 1 and 2 is less (Section 4.5.1, Figure 4.8, 4.9, 4.10).
The deformation style is almost similar to the segment 2. Hanging wall seems to be very
deformed. The dominant strike of the smaller fault is NE-SW. There are two main features
that are recognized in this segment. A dome shaped structures at Early Carboniferous level
towards the hanging wall of the major fault and Halokinesis. On the basis of structural trend
the segment can be divided into two parts (Figures 4.13, 4.15, 4.17, 4.19).
S3-A: Describes the footwall of the major fault (F1). Scattered fault pattern from
Base Cretaceous to Late Permian. Very few graben structures. Plentiful synthetic
faults. Trassic and Base Cretaceous horizons seems to be more affected by erosion
then rest of the levels.
S3-B: Characterize the hanging wall of the major fault (F1). Tectonic deformation of
S3-B seems to be similar to the S2-B. There are few signs of compressional events
along with Halokinesis.
Chapter 4 Seismic interpretation
59
4.5.3 Structures at interpreted horizons
Horizon interpreted at Early Carboniferous level is different from the others. Since it has
been interpreted at greater depth its extent is limited between major fault F1 and F2. On
smaller scale there are no prominent structural activities observed at this level. However on
few seismic lines there is a dome like structure that is observed on the hanging wall side of
the major fault which is very clear particularly on 3D data (Figure 4.23).
At Late Carboniferous level there is no prominent tectonic activity on smaller scale. On the
footwall side of major fault (F1) there are few normal faults present at this level. Also the
strata is cut by major fault F1 and F2 resulting in the formation of graben structure on larger
scale. The throw along the major fault at this level is high (Figures 4.13, 4.25).
LP is tectonically less disturbed. It is also dominated by normal faults and graben structures
on smaller scale. Most of the faults and other structures at this level are dominant on the
hanging wall side of the major fault that is towards the Nordkapp Basin. On the footwall side
of the major fault it has been cut by many normal faults but still it’s very much continuous
on the seismic data. Throw of the major fault at this level is greater. It has been also affected
by salt movements (Figures 4.15, 4.25).
ET has almost the same structural trend as LP. Normal faults are abundant along with graben
structures. Tectonic activity is dominant on the hanging wall of the major fault at this level.
On the footwall there are few normal faults however there is no prominent tectonic activity
at this level. Throw along the fault at this level is high. The effect of salt related movements
can also be observed at this level (Figures 4.17, 4.25).
BC is a structurally disturbed horizon but still can be easily interpreted on the seismic data. It
is dominated by normal faults and graben structures along with horst structures which are
rare. Presence of few reverse faults is observed. Rotation of fault blocks can be observed
near to the major fault at this level along with sediments wedge on few seismic lines. Most
of the faults and other structures at this level are dominant on the hanging wall side of the
major fault that is towards the Nordkapp Basin. On the footwall side of the major fault the
horizon is mostly missing on the seismic data because of the erosion which resulted due to
the uplift. Throw of the major fault at this level is moderate. On some of the seismic data salt
related tectonic activity has also been observed at this level (Figure 4.19, 4.25).
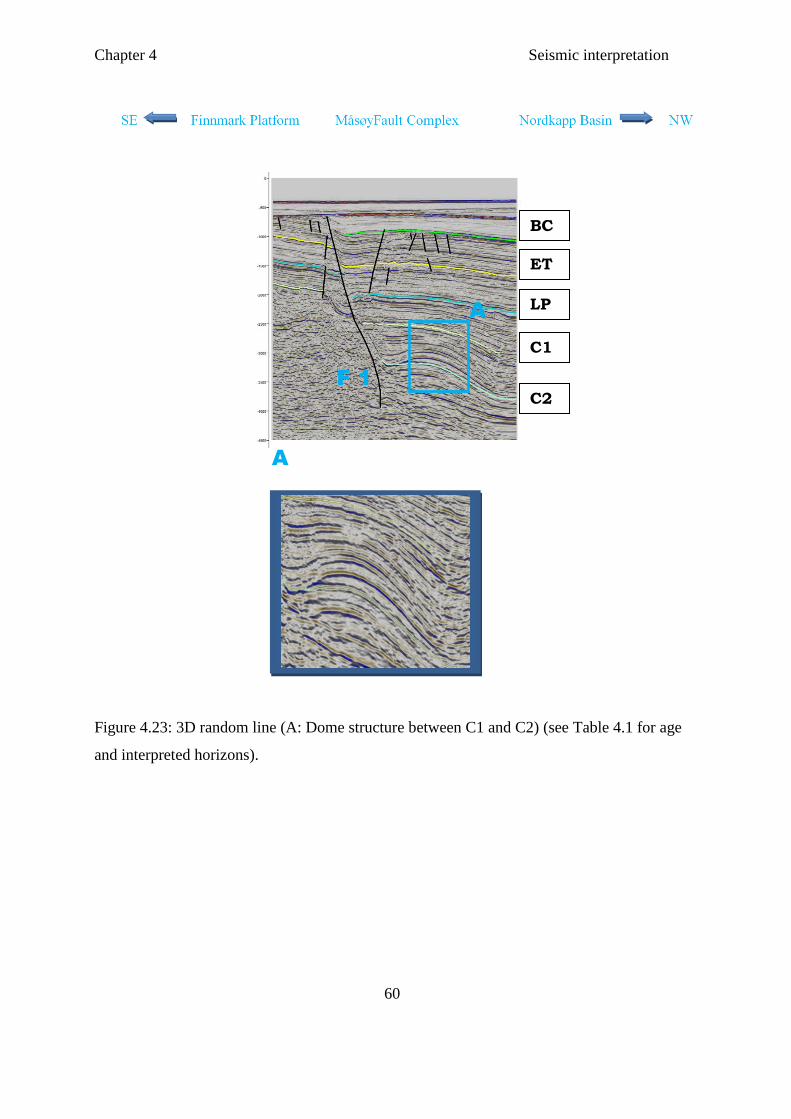
Chapter 4 Seismic interpretation
60
Figure 4.23: 3D random line (A: Dome structure between C1 and C2) (see Table 4.1 for age
and interpreted horizons).
F 1
A
A
C2
C1
LP
ET
BC
Chapter 4 Seismic interpretation
61
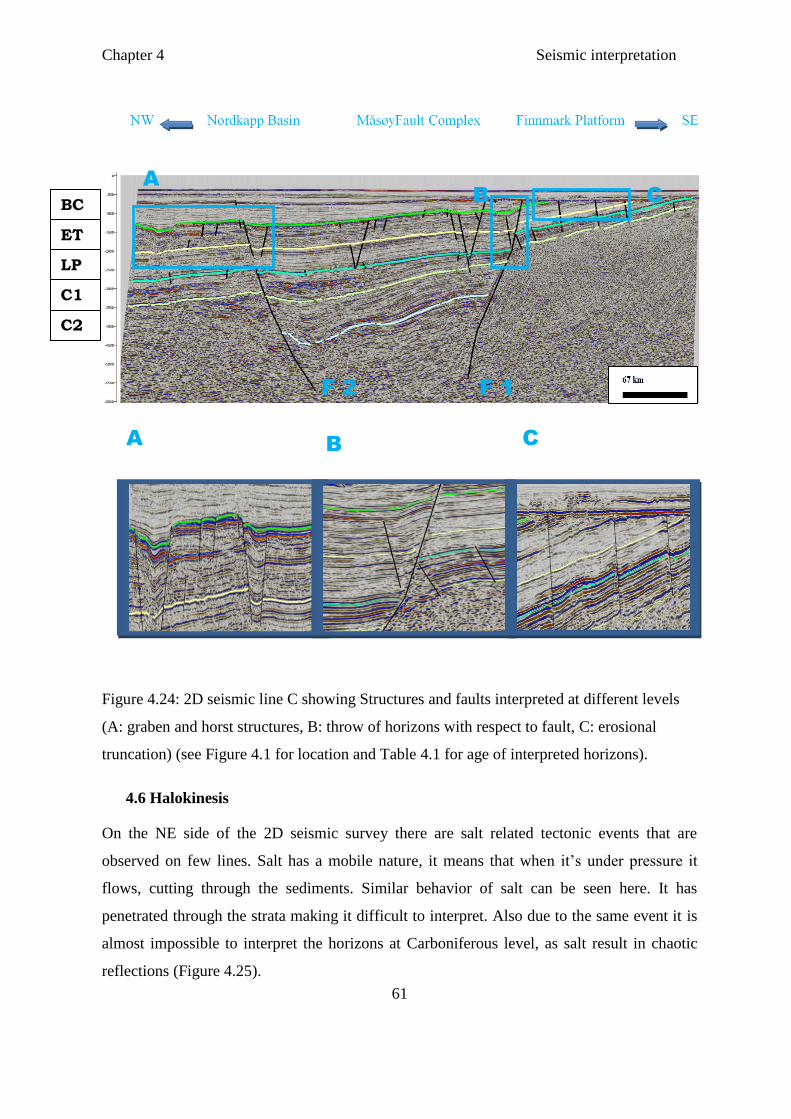
Figure 4.24: 2D seismic line C showing Structures and faults interpreted at different levels
(A: graben and horst structures, B: throw of horizons with respect to fault, C: erosional
truncation) (see Figure 4.1 for location and Table 4.1 for age of interpreted horizons).
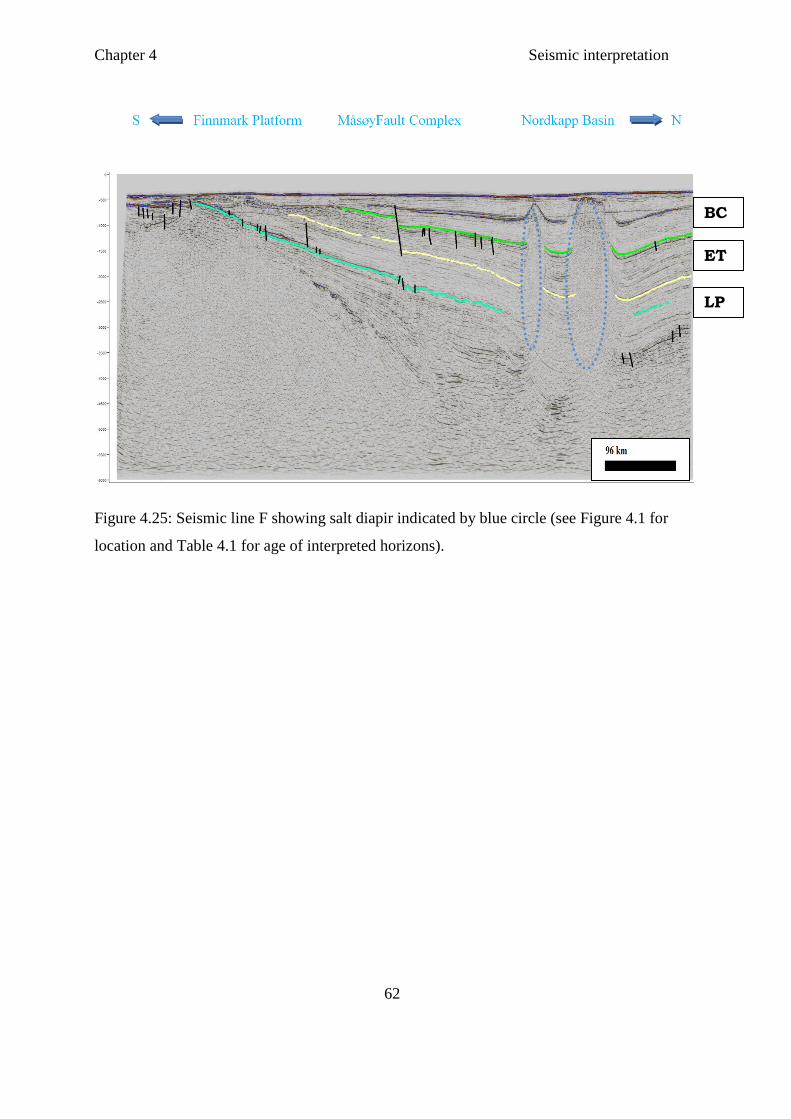
4.6 Halokinesis
On the NE side of the 2D seismic survey there are salt related tectonic events that are
observed on few lines. Salt has a mobile nature, it means that when it’s under pressure it
flows, cutting through the sediments. Similar behavior of salt can be seen here. It has
penetrated through the strata making it difficult to interpret. Also due to the same event it is
almost impossible to interpret the horizons at Carboniferous level, as salt result in chaotic
reflections (Figure 4.25).
A
B C
A B
C
F 2 F 1
BC
C2
C1
LP
ET
Chapter 4 Seismic interpretation
62
Figure 4.25: Seismic line F showing salt diapir indicated by blue circle (see Figure 4.1 for
location and Table 4.1 for age of interpreted horizons).
BC
ET
LP
Chapter 5 Discussion
63
5 Discussion
This chapter involves the study of tectonic evolution of the Måsøy Fault Complex,
associated with regional tectonic events using present results and previous studies. Main
focus will be upon following parameters.
1. Master fault reactivation.
2. Subsidence.
3. Impact of halokinesis.
4. Fault genesis.
5.1 Evolution of the Måsøy Fault Complex
5.1.1 Devonian to Early Carboniferous
Gabrielsen et al. (1990) suggested that the Måsøy Fault Complex is associated with
basement involved tectonic activity. Their proposition can be illustrated by the fact that the
deepest seismic reflection interpreted on the seismic data is Early Carboniferous and further
continuation of the master fault below this level is observed. The formation of Nordkapp
Basin is associated with Late Devonian to Early Carboniferous tectonic events (Koyi et al.
1993) and the Måsøy Fault Complex is one of the basin marginal faults of the Nordkapp
Basin. These remarks clarify the origin of the Måsøy Fault Complex. Faleide et al. (1984)
proposed that the rifting initiated in Late Devonian to Early Carboniferous. Similar
comments are illustrated by Glørstad-Clark et al. (2010). The onset of rifting is marked by
the deep penetration of the master fault below Early Carboniferous level. There is not any
significant vertical displacement along the master fault at this level. The sediments are very
uniform and the hanging wall strata are bending away from the fault plane (Figure 4.9, 5.4).

Chapter 5 Discussion
64
5.1.2 Mid Carboniferous to Mid Permian
Glørstad-Clark et al. (2010) suggested Late Carboniferous to Late Permian as second phase
of rifting. Active streaching stage is indicated by significant displacement along the master
fault.
Several normal and reverse drag features are observed at different levels. In normal drag
strata is convex towards the slip direction, typically results due to the resistance to slip
(Hamblin 1965, Biddle and Christie-Blick 1985). In case of reverse drag the strata is
concave towards the slip direction (Hamblin 1965). Similar behavior has been observed in
the study area. Presence of drag features is another indication of the activation of master
fault also they may indicate the existence of various types of folds associated normal faulting
(Figure 4.10). Since the master fault was active during different times there is a possibility
that these drag features were formed due to friction induced drag.
In the study area between Early to Late Carboniferous there are dome like structures marked
by reverse drag (Figure 4.23). Since Måsøy Fault Complex is associated with Nordkapp
Basin there is a possibility that these structures may represent halokinesis. Tectonic activity
is partially influenced by halokinesis (Gabrielsen et al. 1990). Above stated dome structure is
observed towards the hangingwall of the major fault. Further association of the halokinesis
with the Måsøy Fault Complex can be justified by following comment of Koyi et al. (1993),
they suggested that during Late Carboniferous a salt layer precipitated in the basin and traces
of that salt are present towards the basin margins. Considering the 2D seismic survey in the
study area the orientation of these salt related dome structures is towards the NE termination
of the master fault. Koyi et al. (1993) proposed that salt structures are oriented NE-SW and
are present parallel to the basin margin faults that are associated with thick skin tectonics.
Salt has a mobile nature, it means that when it is under pressure it flows, resulting in
compression or faulting of the strata. Same nature of salt has been observed in the study
area. Koyi et al. (1993) commented that reactivation of deep rooted faults associated with the
Nordkapp Basin confined and deformed the salt structures near or above the basement
involved faults.
Chapter 5 Discussion
65
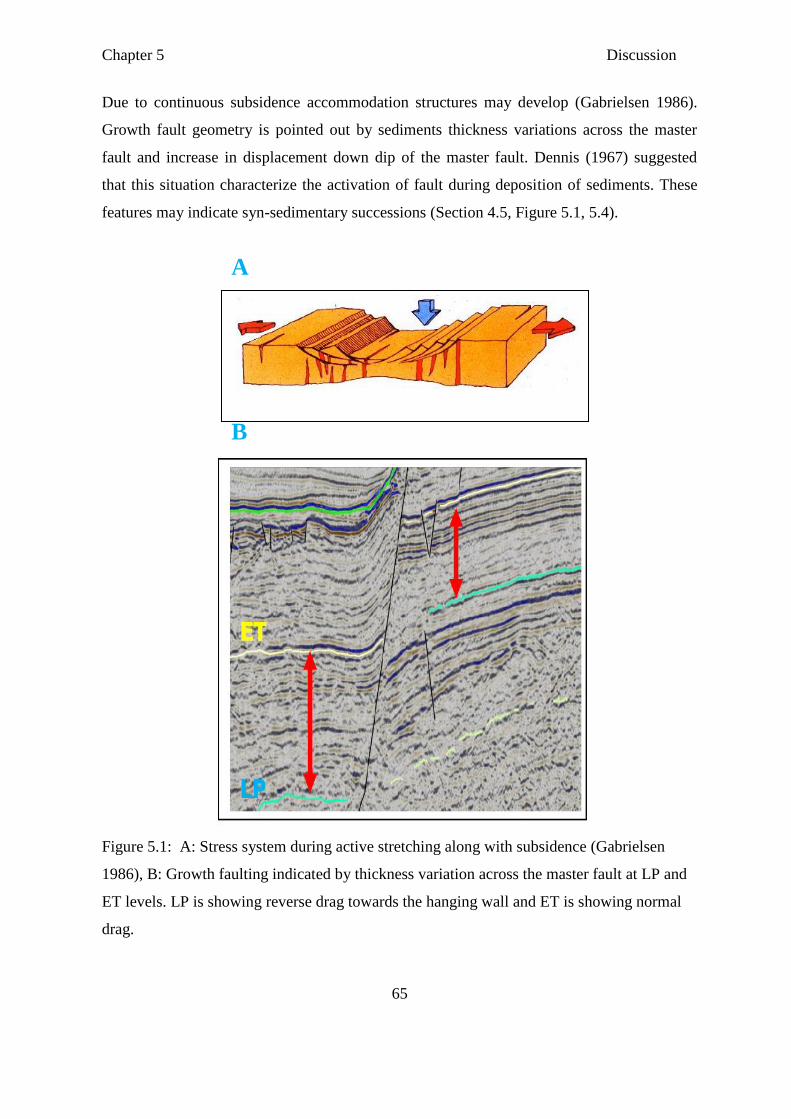
Due to continuous subsidence accommodation structures may develop (Gabrielsen 1986).
Growth fault geometry is pointed out by sediments thickness variations across the master
fault and increase in displacement down dip of the master fault. Dennis (1967) suggested
that this situation characterize the activation of fault during deposition of sediments. These
features may indicate syn-sedimentary successions (Section 4.5, Figure 5.1, 5.4).
Figure 5.1: A: Stress system during active stretching along with subsidence (Gabrielsen
1986), B: Growth faulting indicated by thickness variation across the master fault at LP and
ET levels. LP is showing reverse drag towards the hanging wall and ET is showing normal
drag.
A
B
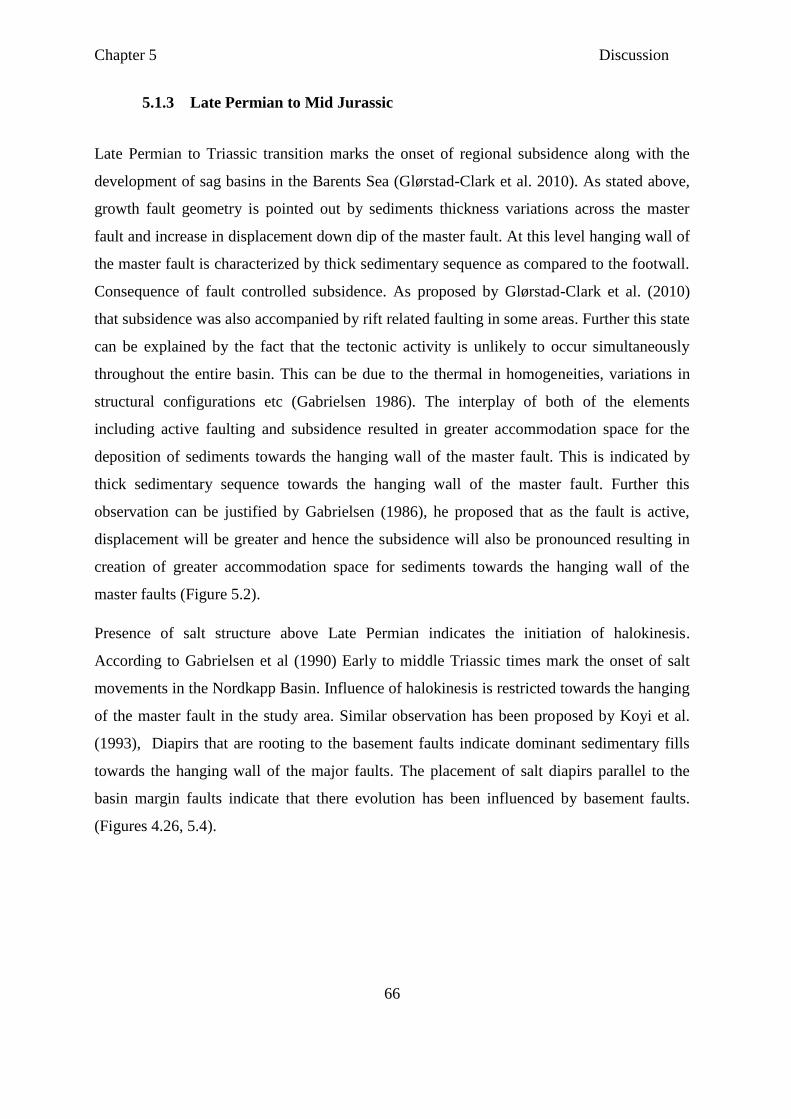
Chapter 5 Discussion
66
5.1.3 Late Permian to Mid Jurassic
Late Permian to Triassic transition marks the onset of regional subsidence along with the
development of sag basins in the Barents Sea (Glørstad-Clark et al. 2010). As stated above,
growth fault geometry is pointed out by sediments thickness variations across the master
fault and increase in displacement down dip of the master fault. At this level hanging wall of
the master fault is characterized by thick sedimentary sequence as compared to the footwall.
Consequence of fault controlled subsidence. As proposed by Glørstad-Clark et al. (2010)
that subsidence was also accompanied by rift related faulting in some areas. Further this state
can be explained by the fact that the tectonic activity is unlikely to occur simultaneously
throughout the entire basin. This can be due to the thermal in homogeneities, variations in
structural configurations etc (Gabrielsen 1986). The interplay of both of the elements
including active faulting and subsidence resulted in greater accommodation space for the
deposition of sediments towards the hanging wall of the master fault. This is indicated by
thick sedimentary sequence towards the hanging wall of the master fault. Further this
observation can be justified by Gabrielsen (1986), he proposed that as the fault is active,
displacement will be greater and hence the subsidence will also be pronounced resulting in
creation of greater accommodation space for sediments towards the hanging wall of the
master faults (Figure 5.2).
Presence of salt structure above Late Permian indicates the initiation of halokinesis.
According to Gabrielsen et al (1990) Early to middle Triassic times mark the onset of salt
movements in the Nordkapp Basin. Influence of halokinesis is restricted towards the hanging
of the master fault in the study area. Similar observation has been proposed by Koyi et al.
(1993), Diapirs that are rooting to the basement faults indicate dominant sedimentary fills
towards the hanging wall of the major faults. The placement of salt diapirs parallel to the
basin margin faults indicate that there evolution has been influenced by basement faults.
(Figures 4.26, 5.4).
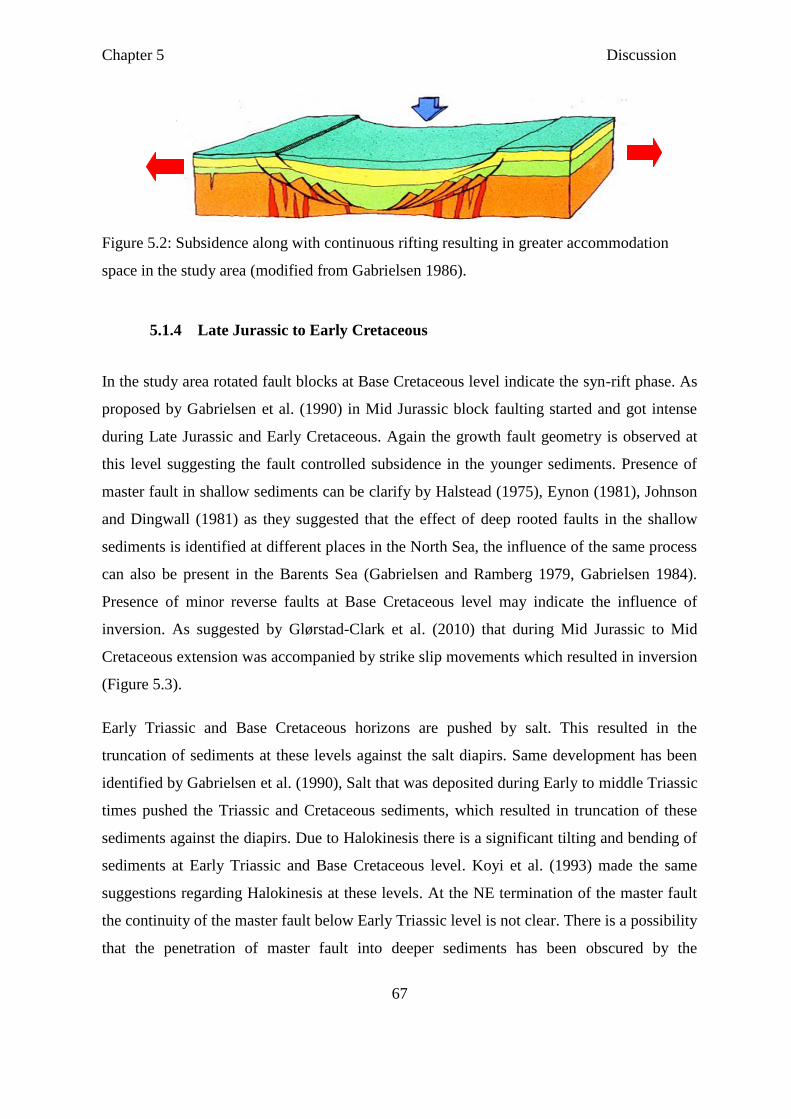
Chapter 5 Discussion
67
Figure 5.2: Subsidence along with continuous rifting resulting in greater accommodation
space in the study area (modified from Gabrielsen 1986).
5.1.4 Late Jurassic to Early Cretaceous
In the study area rotated fault blocks at Base Cretaceous level indicate the syn-rift phase. As
proposed by Gabrielsen et al. (1990) in Mid Jurassic block faulting started and got intense
during Late Jurassic and Early Cretaceous. Again the growth fault geometry is observed at
this level suggesting the fault controlled subsidence in the younger sediments. Presence of
master fault in shallow sediments can be clarify by Halstead (1975), Eynon (1981), Johnson
and Dingwall (1981) as they suggested that the effect of deep rooted faults in the shallow
sediments is identified at different places in the North Sea, the influence of the same process
can also be present in the Barents Sea (Gabrielsen and Ramberg 1979, Gabrielsen 1984).
Presence of minor reverse faults at Base Cretaceous level may indicate the influence of
inversion. As suggested by Glørstad-Clark et al. (2010) that during Mid Jurassic to Mid
Cretaceous extension was accompanied by strike slip movements which resulted in inversion
(Figure 5.3).
Early Triassic and Base Cretaceous horizons are pushed by salt. This resulted in the
truncation of sediments at these levels against the salt diapirs. Same development has been
identified by Gabrielsen et al. (1990), Salt that was deposited during Early to middle Triassic
times pushed the Triassic and Cretaceous sediments, which resulted in truncation of these
sediments against the diapirs. Due to Halokinesis there is a significant tilting and bending of
sediments at Early Triassic and Base Cretaceous level. Koyi et al. (1993) made the same
suggestions regarding Halokinesis at these levels. At the NE termination of the master fault
the continuity of the master fault below Early Triassic level is not clear. There is a possibility
that the penetration of master fault into deeper sediments has been obscured by the
Chapter 5 Discussion
68
Halokinesis. Koyi et al. (1993) proposed the same comment that the influence of basement
involved marginal faults of the Nordkapp Basin is affected by the existence of Halokinesis.
(Figures 5.3, 4.26, 5.4).
Figure 5.3: Growth faulting at ET and BC levels, sediments thicknesses across the fault are
indicated by the arrow. Normal drag at both levels.
5.1.5 Late Cretaceous to Recent
Cretaceous to Paleocene transition is marked by platform uplift (Glørstad et al. 2010). This
resulted into footwall uplift of the master fault in the study area. Thick post rift strata got
eroded along with partial erosion of Late Permian, Early Triassic and Base Cretaceous
sediments, resulting in an unconformable contact of these sediments with the Tertiary strata.
The unconformity that created due to erosional uplift is very well defined on the seismic data
(Figures 4.25, 5.4).
Chapter 5 Discussion
69
Rapid sedimentation of Cretaceous and Tertiary times, influence the shape of salt diapirs as
they coned upward into the sediments. Similar behavior has been reported by (Koyi et al.
1993) (Figure 4.26, 5.4).
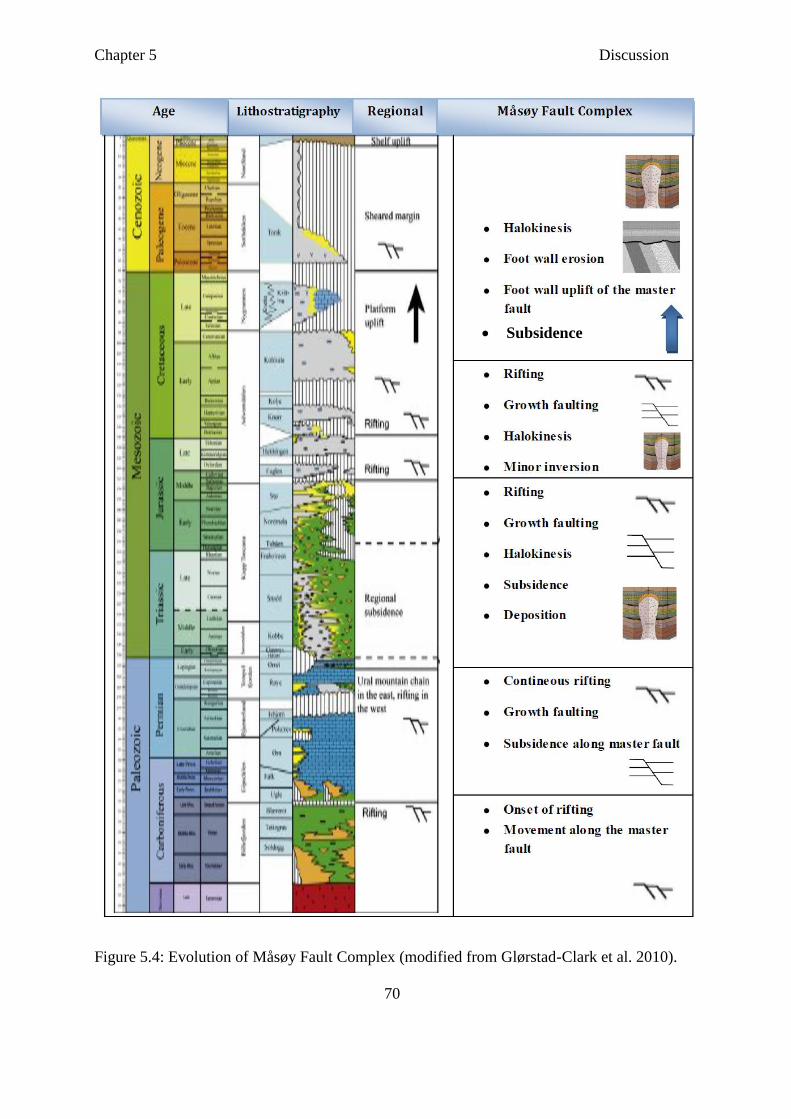
Chapter 5 Discussion
70
Figure 5.4: Evolution of Måsøy Fault Complex (modified from Glørstad-Clark et al. 2010).
Subsidence
Chapter 5 Discussion
71
5.2 Fault genesis
Following study has been carried out in order to figure out the local impact of regional
tectonics. Only hanging wall and the foot wall of the master fault are considered in this case.
5.2.1 Early to Late Carboniferous
In the study area at this level strata are bounded by two faults, including major fault (F1) and
F2. The presence of these faults at this level may suggest the initial tectonic activity that took
place in the area. Gudlaugsson et al. (1998) proposed that Late Devonian to Early
Carboniferous extension associated with the initial rifting between Greenland and Norway is
the oldest event that can be observed in the western Barents Sea. Due to limitation in data
quality minor tectonic structures are difficult to interpret (Figure 4.8).
5.2.2 Late Carboniferous to Late Permian
This level marks the onset of minor fault activity in the study area. Faults of two contrasting
strikes are observed including NW-SE and NE-SW. Gabrielsen et al. (1990) suggested that
during Late Carboniferous to Early Permian main structural elements in the western part
were oriented NE-SW and NNE-SSW. Concentration of fault activity is more towards the
hanging wall as compared to the footwall. Most of the faults present at this level indicate
synthetic behavior and positioned parallel to sub parallel with respect to each other. Active
stretching stage results in complex hanging wall geometry (Gabrielsen 1986) (Figures 4.8,
4.13, 4.15).
5.2.3 Late Permian to Early Triassic
Late Permian was associated with regional subsidence (Glørstad-Clark et al. 2010). This
period is marked by increase in faulting along with the development of horst and graben
structures which are abundant. Due to constant subsidence next to the major fault graben
may develop parallel to the major fault (Gabrielsen 1986). Planer normal faults are dominant
at this level. The dominant fault orientation is marked by NE-SW strike (Figures 4.8, 4.15,
4.17).
Chapter 5 Discussion
72
5.2.4 Early Triassic to Early Cretaceous
Structurally complex level in the study area characterized by plentiful faulting activity along
with horst and graben structures. Gabrielsen et al. (1990) proposed that in Mid Jurassic block
faulting started and got intense during Late Jurassic and Early Cretaceous. Similar features
are been observed in the study area. During early cretaceous there was a local influence of
inversion (Gabrielsen et al. 1990). Presence of reverse faults at this level may provide the
evidence of inversion. The existence of reverse faulting in an extensional regime indicates
reverse reactivation of normal faults (Gabrielsen 1986). Williams et al. (1989) recommended
that positive inversion is the result of contraction in an extensional regime. In the study area
at this level influence of tectonic activity is very pronounced towards the hangingwall as
compared to the footwall, which is apparent in the data. The hanging wall of the major fault
in the area is reported to be severely damaged and may indicate inversion (Gabrielsen &
Faerseth 1989). Again NE-SW oriented faults are dominant. Gabrielsen et al. (1990)
suggested the same comments (Figures 4.8, 4.17, 4.19).
Chapter 6 Conclusion
73
6. Conclusion
Results show that the Måsøy Fault Complex is an extentional structure. The study area
underwent two different rift phases. The first rift phase initiated during Late Devonian to
Early Carboniferous and the second rifting event took place during Mid Jurassic to Early
Cretaceous. On the basis of interpreted seismic data it is observed that the major fault in the
area is associated with thick skin tectonism. Gabrielsen et al. (1990) propose the same
remarks. On the basis of measurements that are taken across the fault (section 5.4) I would
suggest that the major fault in the area was active during different rift phases. Even at the
time of regional subsidence the fault complex show pronounced tectonic activity. Similar
observations were made by Glørstad-Clark et al. (2010).
As stated above that study area is influenced by two rift phases. The subsidence after each
rift phase was accompanied by rifting. First post rift stage show more pronounced effect of
subsidence and faulting as compared to the second rift phase indicated by the considerable
displacements towards the hanging wall below Jurassic level (Section 5.4). Towards the
hanging wall the trend of sediments displacement is increasing along the strike of the master
fault from east to west.
Partial impact of halokinesis has been observed in the study area. Salt activity is restricted
towards the NE part of the 2D seismic survey. Towards the NE termination of the major
fault the continuity of the fault below the Triassic level seems to be obscured by the presence
of halokinesis. Also due to chaotic reflections Carboniferous reflections are difficult to
interpret.
Considering the hanging wall and the foot wall of the master fault, hanging wall is more
deformed. Similar observation has been done by Gabrielsen and Færseth (1989). Impact of
inversion seems to be less and the dominant strike of the minor faults is NE-SW. Gabrielsen
et al (1990) proposed the same comments.
Chapter 7 Reference
74
7. Reference
Austvik, O. G., 2007. The geopolitics of Barents Sea oil and gas: the mouse and the bear.
P 19-23.
Berglund, L., Augustson, J., Færseth, R., Gjelberg, J. & Ramberg-Moe, H. 1986. The
Evolution of the Hammerfest Basin. . In: Habitat of Hydrocarbons on the Norwegian
Continental Shelf (Ed. by A. Spencer), 319-338.
Biddle, K. T., Christie-Blick, N., 1985. Glossary-strike-slip deformation, basin formation
and sedimentation. In: Biddle, K. T., Christie-Blick, N. (Eds), Strike-slip deformation. Basin
Formation and Sedimentation, Special Publication 37. Society of Economic Mineralogists,
pp. 375-386.
Campbell, C.J., 1991. Golden century of oil, 1950-2050: The depletion of a resource.
Dordrecht, Boston, London: Clair Academic Publishers. p. 345.
Dore, A. G., 1994. Barents Sea geology, petroleum resources and commercial potential. v.
48, P. 207-221.
Dennis, J.G. (Ed.), 1967. International Tectonic Dictionary. Memoir 7. American
Association of Petroleum Geologists.
Eidvin, T. and Riis, F. 1989. Nye dateringer av de tre vestligste borehullene i Barentshavet.
Resultater og konsekvenser for den terticere hevingen. Norwegian Petroleum Directorate
Contribution, 27-44 pp.
Eynon, G. 1981. Basin development and sedimentation in the middle Jurassic of the northern
North Sea. In: ILLING, L. W. & HOBSON, G.D (eds) Petroleum geology of the continental
shelf of North West Europe. Inst Petroleum London, 196-204.
Faleide, J. I., Vågnes Erling And Gudlaugsson, S. T. 1993. Late Mesozoic-Cenozoic
evolution of the south-western Barents Sea in a regional rift-shear tectonic setting. Marine
and Petroleum Geology,10, 186-187.

Chapter 7 Reference
75
Faleide, J.I., Gudlaugsson, S. T. and Jacquart, G., 1984a. Evolution of the western Barents
Sea. Mare. Pet. Geol., 1: 123-150
Faleide, J. I., Solheim, A., Fiedler, A., Hjelstuen B.O., Andersen, E.S., Vanneste, K. 1996.
Late Cenozoic evolution of the western Barents Sea-Svalbard continental margin. Global
and Planetary Change, 12, 53-74.
Faliede, J.I., Bjørlykke, K., & Gabrielsen, R.H. ―Geology of the Norwegian Continental
Shelf. In Bjørlykke, K. 2010. PetroleumGeoscience: From Sedimentary Environment to
Rock Physics, Berlin, Heidelberg, Springeræ-Varalg Berlin Heidelberg. p, 467-501.
Faleide, J. I., Gudlaugsson, S. T., Eldholm. O., Mhyre, A. M. and Jackson H. R. 1991. Deep
seismic transects across the sheared western Barents Sea-Svalbard continental margin.
Tectonophysics 189, 73-89.
Gabrielsen, R. H., Færseth, R. B. Jensen, L. N. Kalheim, J. E. and Riis F., 1990, Structural
elements of the Norwegian continental shelf, Part I: The Barents Sea Region: Norwegian
Petroleum Directorate Bulletin, 6, 47.
Gudlaugsson, S. T., J. I. Faleide, S. E. Johansen, And A. J. Breivik. 1998. Late Palaeozoic
structural development of the South-western Barents Sea. Marine and Petroleum Geology,
15, 73-102.
GRAMBERG, I.S., ed. 1988. The Barents Shelf Platform. PGO Sevmorgeologia. Leningrad:
Nedra. 263 p.
Glørstad-Clark, E., Faleide, J. I., Lundschien, B. A. and Nystuen, J.P. 2010. Triassic seismic
sequence stratigraphy and paleogeography of the western Barents Sea area. Marine and
Petroleum Geology. v . 27, p 1448-1475
Gabrielsen, R.H. 1984. Long-lived fault zones and their influence on the tectonic
development of the southwestern Barents Sea. Journal of the Geological Society London,
141, 651-662.
Chapter 7 Reference
76
Gabrielsen, R. H., FÆrseth, R.B. 1989. The inner shelf of the North Cape, Norway and its
implications for the Barents Shelf-Finnmark Caledonide boundary. A comment Norsk Geol.
Tidsskr. 69, 57-62.
Gabrielsen, R. H., FÆrseth, R.B. 1988. Cretaceous and Tertiary reactivation of master fault
zones of the Barents Sea. Norsk Polarinstitutt Rapp. v. 46, p 93-97.
Gabrielsen, R.H. 1986. Structural elements in graben systems and their influence on
hydrocarbon trap types. In: Spencer, A.M. et al. (eds.), Habitat of hydrocarbons on the
Norwegian Continental Shelf. Norwegian Petroleum Society. Graham & Trotman, London,
pp. 55-60.
GABRIELSEN, R. H. & RAMBERG, I. B. 1979. fracture patterns in Norway from
LANDSAT imagery: results and potential use. Proc. Norwegian Sea Symp., Tromsø 1979,
Norw. Petrol. Soc. NSS/23, 1-28.
Grung olsen, R. and Hanssen, O. K. 1987 Part VIII-Hammerfest Basin 37 Askeladd. In:
Geology of the Norwegian Oil and Gas Fields (Ed. A. M. Spencer), Graham & Trotman,
London, pp. 419-428.
Hamblin, W.K., 1965. Origin of “reverse drag” on the downthrow side of the normal faults.
Geological Society Of America Bulletin 76, 1145-1164.
HALSTEADT, . P. 1975. Northern North Sea faulting. Proc. Jurassic Northern North Sea
Symp., Stavanger 1975,Norw. Petrol. Soc. JNNSS/10, 1-38.
JOHNSON, R. J. & DINGWALL., G. 1981. The Caledonides: their influence on the
stratigraphy of the Northwest European continental shelf. In: ILLING, L. V. & HOBSON,
G. D. (eds): Petroleum geology of the continental shelf of North-West Europe. Inst.
Petroleum London, 85-97.
Johansen, S. E., B. K. Ostisky, Ø. Birkeland, Y. F. Federovsky, V. N. Martirosjan, B.
Christensen, S. I. Cheredeev, E. A. Ignatenko, and L. S. Margulis, 1993, Hydrocarbon
potential in the Barents Sea region: play distribution and potential, in T. O. Vorren et al.,
eds., Arctic geology and petroleum potential: Elsevier, Norwegian Petroleum Society, p.
273–320.
Chapter 7 Reference
77
Jackson, H. R., Faleide, J.I. and Eldholm,O. (1991) crustal structure of the sheared southwest
Barents Sea continental margin. In: Arctic Geoscience (Eds J. R. weber, D.A. Forsyth, A.F.
Embry and S. M. Blasco), Mar. geol. v 93, p 119-146.
Koyi, H., Talbot, C. J. and Tørudbakken, B. O. 1993. Salt diapirs of the southwest Nordkapp
Basin: analogue modeling. Tectonophysics. v. 228, p 167-187.
Lerche, I. 1992. Oil exploration: Basin analysis and economics. San Diego: Academic Press
Inc. and HBJ. 178 p.
Larsen, G. B. Elvebakk, G. Henriksen, L. B. Kristensen, S.-E. Nilsson, I. Samuelsberg, T. J.
Svånå, T. A. Stemmerik, L. and Worsley, D. 2002. Upper Palaeozoic lithostratigraphy of
the southern Norwegian Barents Sea.
Myhre, A. M., Eldholm, O. and Sundvor, E. 1982. The margin between Senja and
Spitsbergen fracture zones: implications from plate tectonics: Tectonophysics, v. 89, p. 33-
50.
Mørk, A., Embry, A. F. And Weitschat, W. 1989. Triassic trans-gressive-regressive cycles in
the Sverdrup Basin, Svalbard and the Barents Shelf. In: Collinson, J. D. (ed.) Correlation in
Hydrocarbon Exploration. Graham & Trotman, London, 113-130.
Olaussen, S., Dalland, A., Gloppen, T. G. and Johannessen, E. 1984. Depositional
environment and diagenesis of Jurassic reservoir sandstones in the eastern part of Troms I
area. In: Spencer, A. M. (ed.) Petroleum Geology of the North European Margin. Graham &
Trotman, London, 61-79.
RIIS, F., VOLLSET, J., and SAND, M. 1986. Tectonic development of the western margin
of the Barents Sea and adjacent areas. American Association of Petroleum Geologists
Memoir 40.
661–676.
Rønnevik, H & Jacobsen, H.P. 1984. Structural Highs and Basins in the Western Barents
Sea. In: Petroleum Geology of North European Margin (Ed. by A. M. Spencer), Norwegian
Petroleum Society, 19-32. Graham & Trotman, London.
Chapter 7 Reference
78
Ritzmann, O., Faleide, J.I., 2007. Caledonian basement of the western Barents Sea.Tectonics
26, 417-435.
Stemmerik, L. and Worsley, D. 1989. Late Paleozoic sequence correlations, North
Greenland, Svallbard and the Barents Shelf. In: COLLINSON, J. D. (ed.) Correlation in
Hydrocarbon Exploration. Graham & Trotman, London, 99-111.
Smelror, M., Petrov, O.V., Larssen, G.B., Werner, S.C., 2009. Atlas: Geological History
of the Barents Sea. Geological Survey of Norway, Trondheim, Norway. p. 134.
Stemmerik, L. & Worsley, 2005 D.: 30 years on - Arctic Upper Palaeozoic stratigraphy,
depositional evolution and hydrocarbon prospectivity. Norwegian
Journal of Geology, Vol. 85, pp. 151-168.
Sund, T., Skarpnes, O., Jensen, L. N. and Larsen, R. M. (1986) Tectonic development and
the hydrocorbon potential offshore Troms, Northern Norway. In: Future petroleum provinces
of the world (Ed. M. T. Halbouty), Am. Assoc. Petrol. Geol. Mem. No. 40, pp. 615-627.
Talwani, M. and Eldholm, O. 1977. Evolution of the Norwegian-Greenland Sea. Geological
Society of America Bulletin, 88, 969-999.
Worsley, D., Johansen, R. And Kristensen, S. E. 1988. A Lithostratigraphic Scheme for
theMesozoic and Cenozoic Succession Offshore Mid and Northern Norway Norwegian
Petroleum Directorate Bulletin No.4, 42-65.
Williams, G.D., Powell, C.M., Cooper, M.A., 1989. Geometry and kinematics of inversion
tectonics. In: Cooper, M.A., Williams, G.D. (Eds.), Inversion Tectonics, Special Publication
44. Geological Society of London, pp. 3-15.
www.googleimages.com.
www.npd.no.
www.slb.com