Embed Size (px)
Citation preview
1
Structural analysis of the eurozone banking system in the period of the sovereign
debt crisis 1
Teófilo de Paula2
Abstract:
The sovereign debt crisis, which hit Europe as a consequence of the 2008 crisis, had a
very clear geographical delimitation, having affected mainly the southern economies.
This fact rekindles the debate on the relationship between heterogeneous economic
spaces, particularly regarding to the perspectives for reaching the balanced growth and
reducing regional disparities in the context of an increasing process of financialization
of the world economy. The aim of this study is to analyze the role of the banking system
in defining the regional particularities of the European debt crisis. The analysis is based
on the hypothesis that assets located or issued in peripheral regions/countries are
subjected to a relatively higher liquidity preference, with negative effects on the pace of
investment and, consequently, on the level of the regional economic growth. The
methodology consists in a structural analysis balance sheet based. Banks are sorted out
into classes of specialization, size and location, following a cluster analysis, for the
periods before and after the 2008 crisis, in order to identify patterns of balance sheet.
The results indicate evidence of distinct patterns of balance sheet linked to specifics
geographical spaces, suggesting the need for a monetary policy with regional concerns.
Key words: Regional Development; Liquidity Preference; Banking System.
Área 6. Dinheiro, finanças internacionais e crescimento.
1 This text presents some results of the postdoctoral research conducted at Leeds University – UK in
2016, sponsored by CAPES/Brazil.
2 Lecturer and researcher at Universidade Federal Rural do Rio de Janeiro – UFRRJ/Brazil.
2
1 Introduction
Since the introduction of the single currency the economy in the Eurozone has faced at
least two distinct phases. The first one, up to 2007, is characterized by a high liquidity,
which boosted growth in the area, particularly regarding to the less developed
economies. Nevertheless, the sub-prime crisis in 2008 had a negative impact on the
European economies, resulting in the sovereign debt crisis, which affected mainly the
economies of the so-called peripheral block. This fact rekindles the debate on the
relationship between heterogeneous economic spaces, particularly regarding the
perspectives for reaching the balanced growth and reducing regional disparities in the
context of an increasing financialization of the word economy.
The uneven development has been object of many branches of the economic thought
and many forces have been identified as taking part in this process, most of which
linked to the real sector of the economy. Nevertheless, the process of financialization
makes necessary to verify the extent to which strictly monetary dynamics take place in
this process. Therefore, the proposal of this study is to assess the way by which both the
structure and behavior of the banking system have determined the specific aspects of the
crisis in the Eurozone, with special attention to its regional effects. The analysis is based
on the hypothesis that assets located or issued in peripheral regions/countries are
subjected to a relatively higher liquidity preference with negative effects on the pace of
investment and economic growth.
The methodology consists in a structural analysis balance sheet based. Banks are sorted
out into classes of specialization, size and location, following a cluster analysis, for the
periods before and after the 2008 crisis, in order to identify patterns of balance sheet.
Doing so, it is expected to find evidence of distinct behavior or strategy of banks which
could be assigned to geographical spaces with distinct level of centrality.
This study is divided in 4 sections, including this introduction. Section 2 points out
some theoretical background. Section 3 presents the method, data and variables used.
The main results are shown in section 4, with some concluding remarks in the final
section.
3
2 Theoretical background
The international economy has been featured from the last decades by a dynamic
growth largely determined by the financial sphere which, since then, has expanded its
relevance quite consistently, in a process of increasing financialization (Epstein, 2005).
In 2007 started in North American financial sector one of the most severe crises of the
capitalism. Due the specific characteristics of financialization and financial
liberalization process in that country the crisis, which arises in a very well defined
geographical space, spreads rapidly not only across markets, but also between different
territories.
From the perspective of the general equilibrium framework cyclical fluctuations, caused
by external shocks, have instantaneous and proportional effect on the territory. In some
of its extensions, some models assign the eventually differentiated impacts to the
particularities of the regional productive structures or to the existence of market failures
(More & Hill, 1982; De Fina and Carlino, 1997). Such models have the following
characteristics: i) no active role is due to money in the determination of the employment
and income (the money neutrality hypothesis); and ii) the fluctuations are caused by
exogenous factors and their effects possibly differentiated in the territory are attributed
to the existence of obstacles that, once removed, the system tends to the equilibrium.
Nevertheless, the credit boom evidenced by the 2008 crisis is not necessarily the result
of a market failure but, as Chick at al (2013) points out, a consequence of the market
interplay between supply (financial intermediaries trying to increase their market share)
and demand (economic agents asking for finance in order to increase activities in
speculative markets). The authors are actually referring to the Financial Instability
Hypothesis of Minsky (1982) according to which the agents’ financial position
deteriorates naturally over the expansion phases. The deepening of this process leads at
some moment to the reversal of expectations, particularly in the financial system,
triggering the financial crisis.
Minsk’s proposal is, however, a-spatial. It assumes implicitly that the cycle develops in
a closed and homogeneous economy. According to Dymski (1998, p. 75), trade
4
imbalances and cross-border flows of factors must be taken into account, i.e., the
financial fragility can be intensified by imbalances in the flows of savings and factors
between regions. The possibility of raising a financial crisis, as well as the ability to
react to that, depends not only on the economic cycle, but the success of that economy
in mediating the tensions between the real and financial sectors inherent in economies
with borders. Such mediation in turn depends on the way the banking system is
structured in that region in order to contribute to channeling savings inflows and
reserves to investment. The author argues that the differences between countries/regions
concerning to the "boundary conditions" as well as to the structure of the banking sector
imply a need for spatializing the FIH. Furthermore, the Minskyan cycle can be
characterized as an increasing process of nominal appreciation over a given amount of
existing real assets. Avoiding or mitigating this process depends on how well positioned
is the economy for creating real assets, i.e., for transforming the resources inflow into
new assets, rather than mere property rights. To do so, a structurally strong banking
system is necessary: robust banks, well-established lender-borrower relationships, large
reserves or retained earnings to serve as funds to expansion and to new initiatives.
Conversely, one structurally weak banking system would be characterized by
undercapitalized banks, deficient lender-borrower relationships and inadequate sources
of funds.
A boom economy is featured by high inflows of resources (non-resident factors). When
the domestic banking system fails in transforming this inflow into real assets a boom
economy can be converted into a "bubble economy". The threat of capital flight
becomes latent and it limits the scope for managing the difficulties. This view is
consistent with the one presented in Chick et. al. (2013) where the authors use the term
"functional bank" to describe the ability of the banking system in contributing to
economic growth through an efficient transformation of existing savings into productive
investment. More specifically, the authors highlight the role of local banks, or more
broadly, a decentralized banking system, in financing small and medium local
businesses.
Although, in its most advanced functions, the financial system tends to be increasingly
a-spacial, the debt, specially that one that matters for the economic development,
remains local (e.g., house-purchase, construction, real estate, industry, durables). The
5
"functional distance" matters. While an asset bubble is characterized by an
overvaluation in asset prices in periods of economic expansion, the opposite occurs in
recessions. Both movements tend to be wider with respect to assets located or issued in
peripheral economies. That is considered by some authors as an implication of the
liquidity preference which is, on average, greater for peripherals. For instance,
Rodriguez-Fuentes & Dow (2003) analyze the regional impacts of the European
monetary unification by focusing the credit market stability in different regions of
Spain. Using panel data techniques and considering annual information for the period
1986-2001, they concluded that during periods of expansion the rate of credit growth in
the poorest regions was 69% higher than in rich regions, while in the period of low
growth it was 72% lower. The authors argue that these results support the post-
Keynesian theory, which claims a greater instability of credit expansion in less
developed regions along the business cycle. That pattern is explained by changes in
liquidity preference over the cycle. The competition induces banks to increase its
market share in the peripherals in periods of expansion, increasing preference for less
liquid portfolios. As expectations, about the levels of risk and return, are formed over
weaker bases in periphery, when a shift in the national income path is verified there is a
drastic contraction of credit in the periphery. Therefore, the instability of the credit is
not explained by structural differences in the real sector, but by changes in the behavior
of actors in the financial system, which are influenced by the current monetary policy
(Rodriguez-Fuentes & Dow, 2003, p. 977).
De Grawe (2012) presents some evidence that the financial agents’ strategies contain a
significant behavioral component that goes beyond of what could be expected from an
analysis strictly based on fundamentals. In a study about the impact of the ECB decision
in the middle 2012 of acting as a lender of last resort the author concluded that the risk
assessment process of financial agents depressed the peripheral asset prices more than
could be expected from the fundamentals theory.
Crocco et al (2005) links the regional liquidity preference to the concept of centrality.
Centrality is a fundamental concept in the Central Place Theory (Christaller, 1966)
which emphasizes that once a central function is provided by a central place it implies
immediately that it cannot be provided by the complementary region (the periphery).
As a greater centrality implies a greater supply of central goods, it is possible to assume
6
that this centrality will stimulate the diversification of both the industrial and the tertiary
sector. Such a diversification would open new investment possibilities for banks as they
could diversify their portfolio not only in terms of liquid and non-liquid assets, but also
regarding to different types of real assets. According to the authors, the greater the
centrality the lower the liquidity preference of financial and non financial agents.
Consequently, both demand and supply of credit will be greater in central regions,
implying cumulative process.
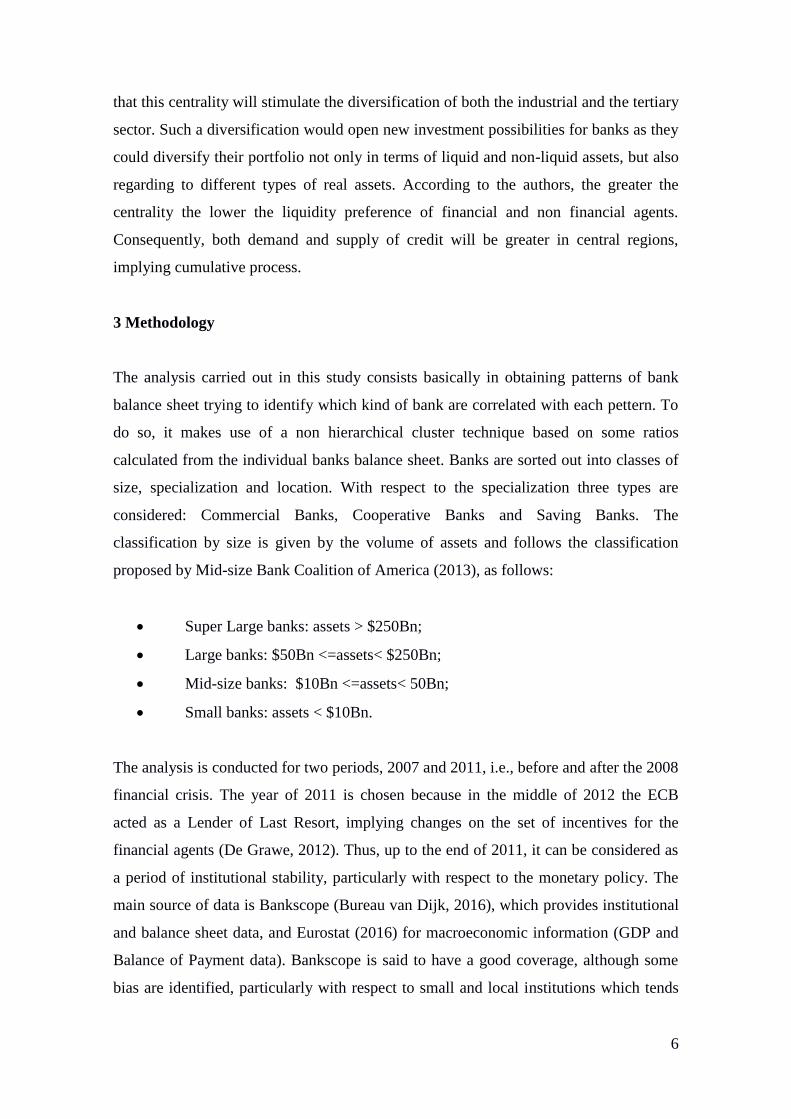
3 Methodology
The analysis carried out in this study consists basically in obtaining patterns of bank
balance sheet trying to identify which kind of bank are correlated with each pettern. To
do so, it makes use of a non hierarchical cluster technique based on some ratios
calculated from the individual banks balance sheet. Banks are sorted out into classes of
size, specialization and location. With respect to the specialization three types are
considered: Commercial Banks, Cooperative Banks and Saving Banks. The
classification by size is given by the volume of assets and follows the classification
proposed by Mid-size Bank Coalition of America (2013), as follows:
Super Large banks: assets > $250Bn;
Large banks: $50Bn <=assets< $250Bn;
Mid-size banks: $10Bn <=assets< 50Bn;
Small banks: assets < $10Bn.
The analysis is conducted for two periods, 2007 and 2011, i.e., before and after the 2008
financial crisis. The year of 2011 is chosen because in the middle of 2012 the ECB
acted as a Lender of Last Resort, implying changes on the set of incentives for the
financial agents (De Grawe, 2012). Thus, up to the end of 2011, it can be considered as
a period of institutional stability, particularly with respect to the monetary policy. The
main source of data is Bankscope (Bureau van Dijk, 2016), which provides institutional
and balance sheet data, and Eurostat (2016) for macroeconomic information (GDP and
Balance of Payment data). Bankscope is said to have a good coverage, although some
bias are identified, particularly with respect to small and local institutions which tends
7
to be underestimated (Bhattacharya, 2003). Moreover, due the existence of missing
data, the samples for 2007 and 2011 comprise 482 and 604 observations, respectively,
in a population of 3245 institutions (commercial, cooperative and savings banks).
For the cluster analysis a simplified bank balance sheet is proposed in Table 1. On the
asset side a short term asset (Derivatives) is faced to a long term one (Loans); on the
liability side a short term commitment (Deposits & Short Term Funding) is faced to a
long term one (Long Term Funding). Each item is taken as a percentage of the balance
sheet size, measured by the total assets (or total liabilities), resulting in the set of
variables listed in Table 2.
It is considered that the analysis of the current financial market should goes beyond a
theory of portifolio composition and take into account the investment as a tool of
capital reproduction. It is important to notice that the set of variables proposed is based
on that hypothesis and, doing so it could be taken as a proposal on how to capture
moviments of the liquidity preference.
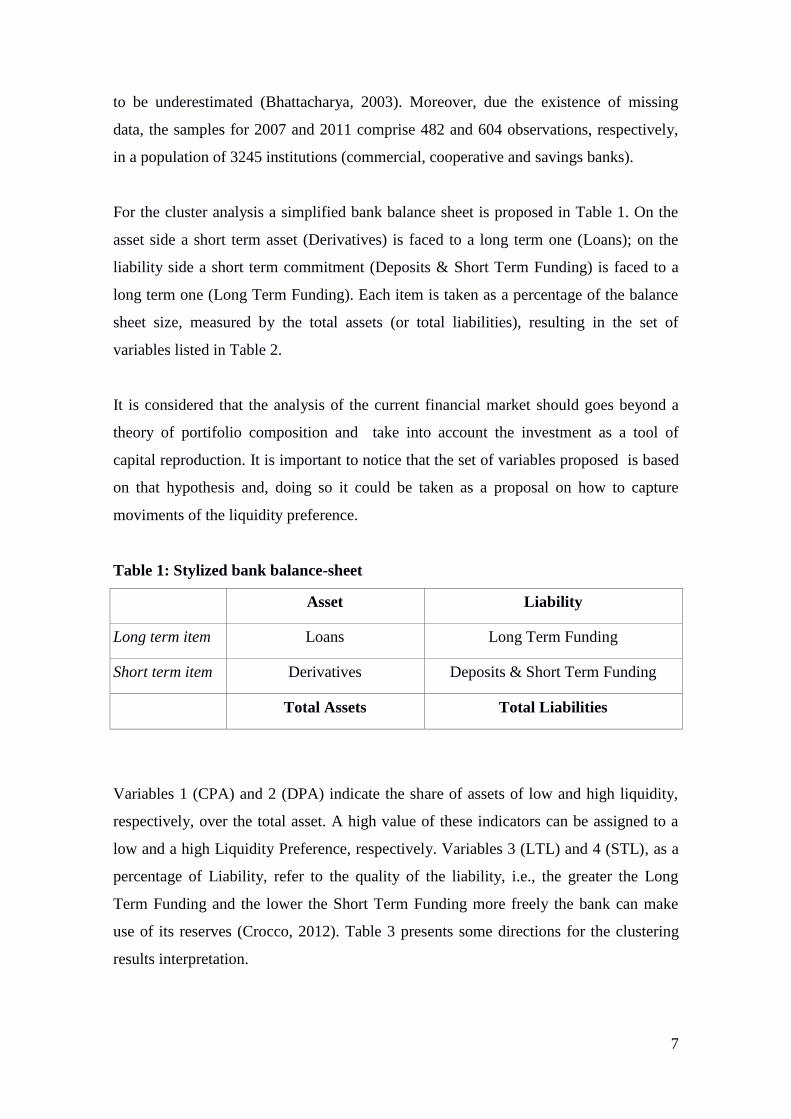
Table 1: Stylized bank balance-sheet
Asset Liability
Long term item Loans Long Term Funding
Short term item Derivatives Deposits & Short Term Funding
Total Assets Total Liabilities
Variables 1 (CPA) and 2 (DPA) indicate the share of assets of low and high liquidity,
respectively, over the total asset. A high value of these indicators can be assigned to a
low and a high Liquidity Preference, respectively. Variables 3 (LTL) and 4 (STL), as a
percentage of Liability, refer to the quality of the liability, i.e., the greater the Long
Term Funding and the lower the Short Term Funding more freely the bank can make
use of its reserves (Crocco, 2012). Table 3 presents some directions for the clustering
results interpretation.
8
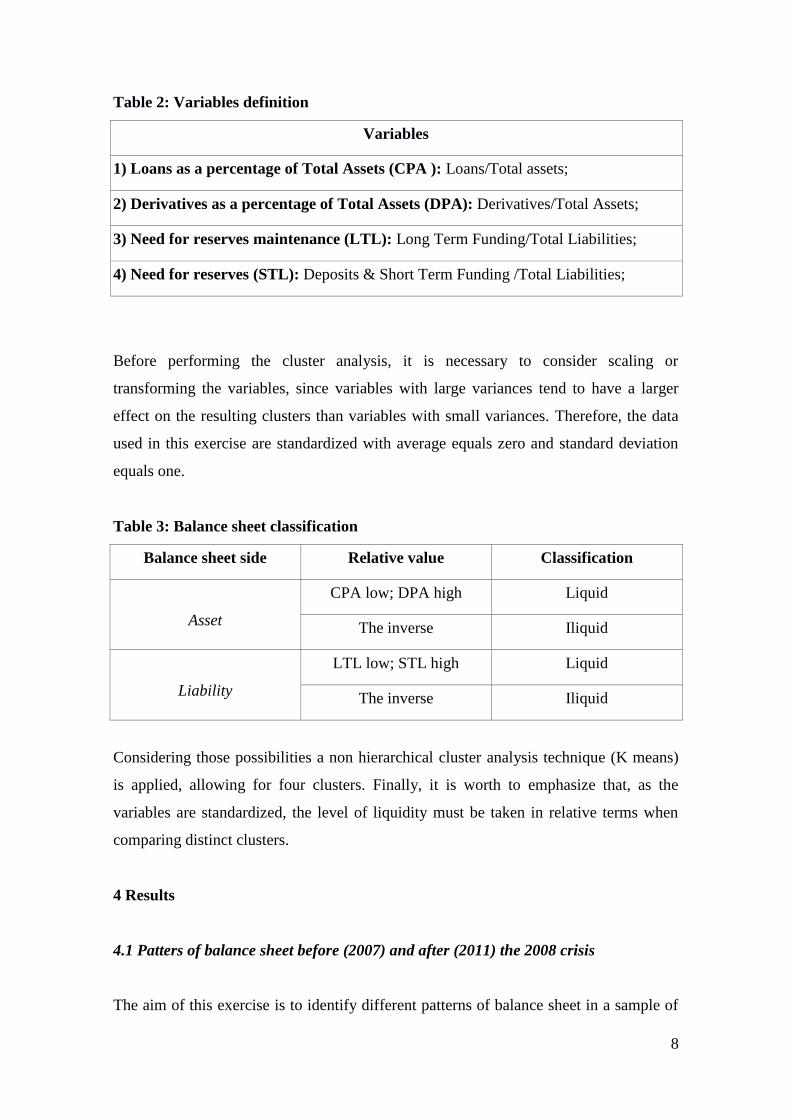
Table 2: Variables definition
Variables
1) Loans as a percentage of Total Assets (CPA ): Loans/Total assets;
2) Derivatives as a percentage of Total Assets (DPA): Derivatives/Total Assets;
3) Need for reserves maintenance (LTL): Long Term Funding/Total Liabilities;
4) Need for reserves (STL): Deposits & Short Term Funding /Total Liabilities;
Before performing the cluster analysis, it is necessary to consider scaling or
transforming the variables, since variables with large variances tend to have a larger
effect on the resulting clusters than variables with small variances. Therefore, the data
used in this exercise are standardized with average equals zero and standard deviation
equals one.
Table 3: Balance sheet classification
Balance sheet side Relative value Classification
Asset
CPA low; DPA high Liquid
The inverse Iliquid
Liability
LTL low; STL high Liquid
The inverse Iliquid
Considering those possibilities a non hierarchical cluster analysis technique (K means)
is applied, allowing for four clusters. Finally, it is worth to emphasize that, as the
variables are standardized, the level of liquidity must be taken in relative terms when
comparing distinct clusters.
4 Results
4.1 Patters of balance sheet before (2007) and after (2011) the 2008 crisis
The aim of this exercise is to identify different patterns of balance sheet in a sample of
9
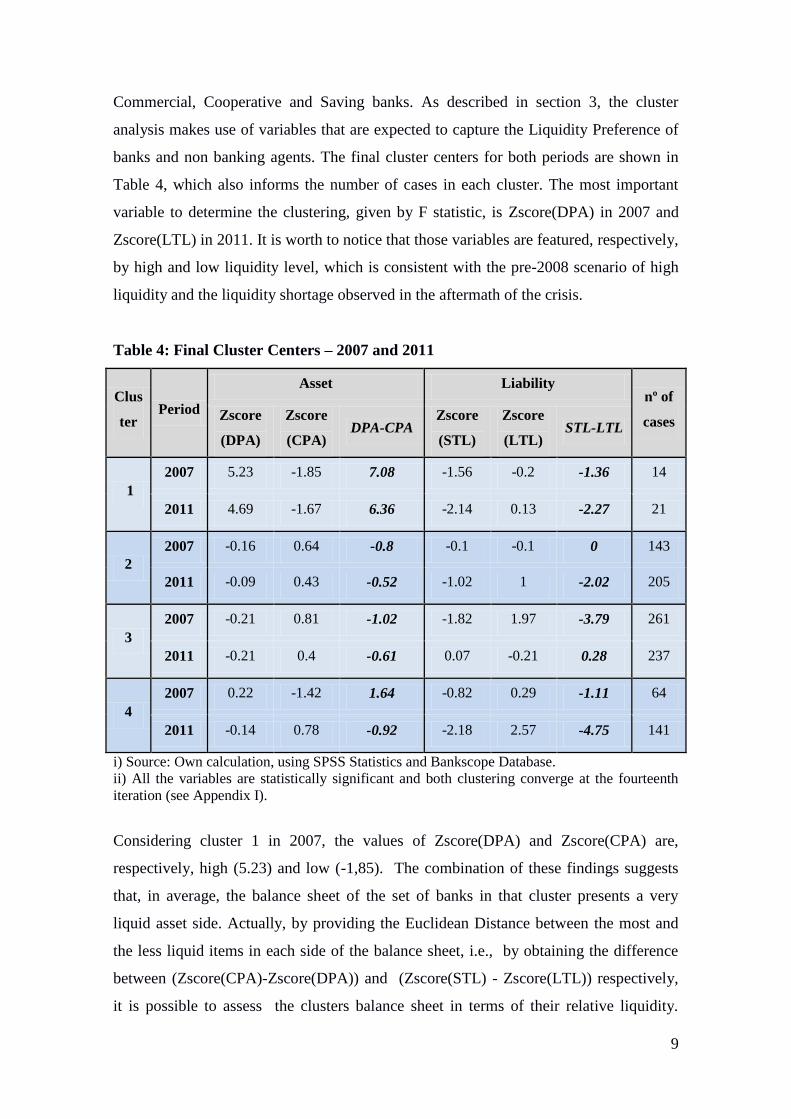
Commercial, Cooperative and Saving banks. As described in section 3, the cluster
analysis makes use of variables that are expected to capture the Liquidity Preference of
banks and non banking agents. The final cluster centers for both periods are shown in
Table 4, which also informs the number of cases in each cluster. The most important
variable to determine the clustering, given by F statistic, is Zscore(DPA) in 2007 and
Zscore(LTL) in 2011. It is worth to notice that those variables are featured, respectively,
by high and low liquidity level, which is consistent with the pre-2008 scenario of high
liquidity and the liquidity shortage observed in the aftermath of the crisis.
Table 4: Final Cluster Centers – 2007 and 2011
Clus
ter Period
Asset Liability nº of
cases Zscore
(DPA)
Zscore
(CPA) DPA-CPA
Zscore
(STL)
Zscore
(LTL) STL-LTL
1
2007 5.23 -1.85 7.08 -1.56 -0.2 -1.36 14
2011 4.69 -1.67 6.36 -2.14 0.13 -2.27 21
2
2007 -0.16 0.64 -0.8 -0.1 -0.1 0 143
2011 -0.09 0.43 -0.52 -1.02 1 -2.02 205
3
2007 -0.21 0.81 -1.02 -1.82 1.97 -3.79 261
2011 -0.21 0.4 -0.61 0.07 -0.21 0.28 237
4
2007 0.22 -1.42 1.64 -0.82 0.29 -1.11 64
2011 -0.14 0.78 -0.92 -2.18 2.57 -4.75 141
i) Source: Own calculation, using SPSS Statistics and Bankscope Database.
ii) All the variables are statistically significant and both clustering converge at the fourteenth
iteration (see Appendix I).
Considering cluster 1 in 2007, the values of Zscore(DPA) and Zscore(CPA) are,
respectively, high (5.23) and low (-1,85). The combination of these findings suggests
that, in average, the balance sheet of the set of banks in that cluster presents a very
liquid asset side. Actually, by providing the Euclidean Distance between the most and
the less liquid items in each side of the balance sheet, i.e., by obtaining the difference
between (Zscore(CPA)-Zscore(DPA)) and (Zscore(STL) - Zscore(LTL)) respectively,
it is possible to assess the clusters balance sheet in terms of their relative liquidity.
10
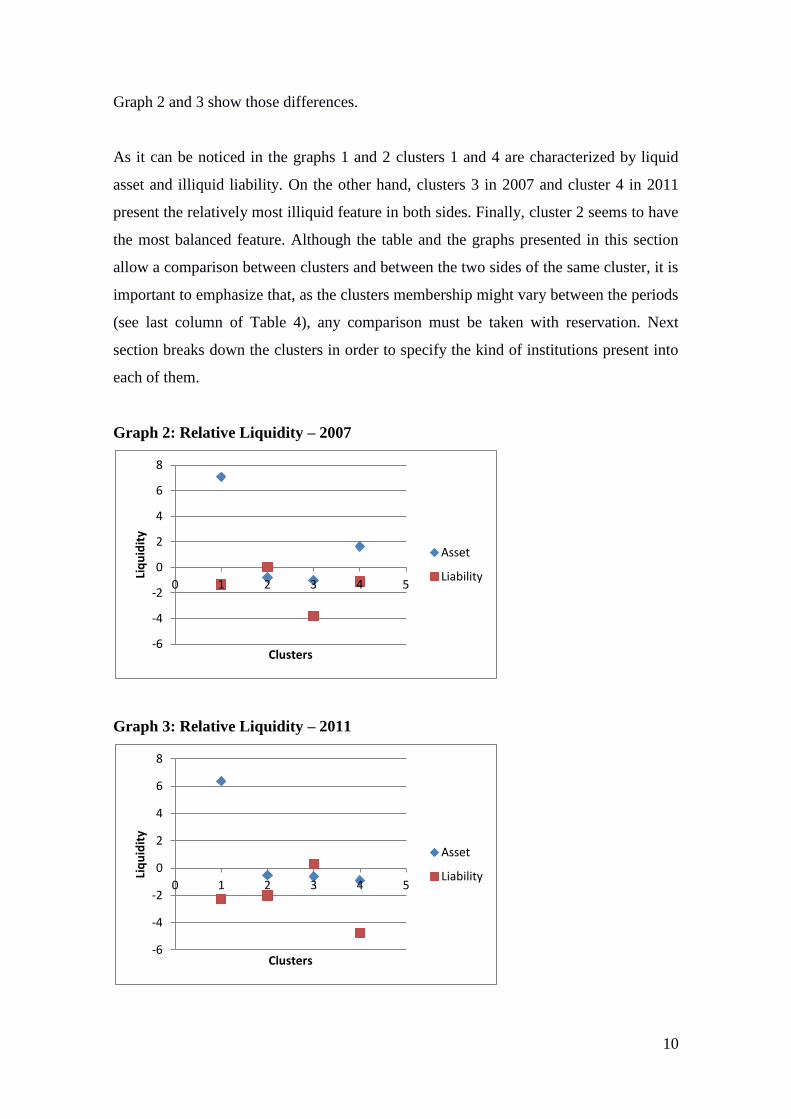
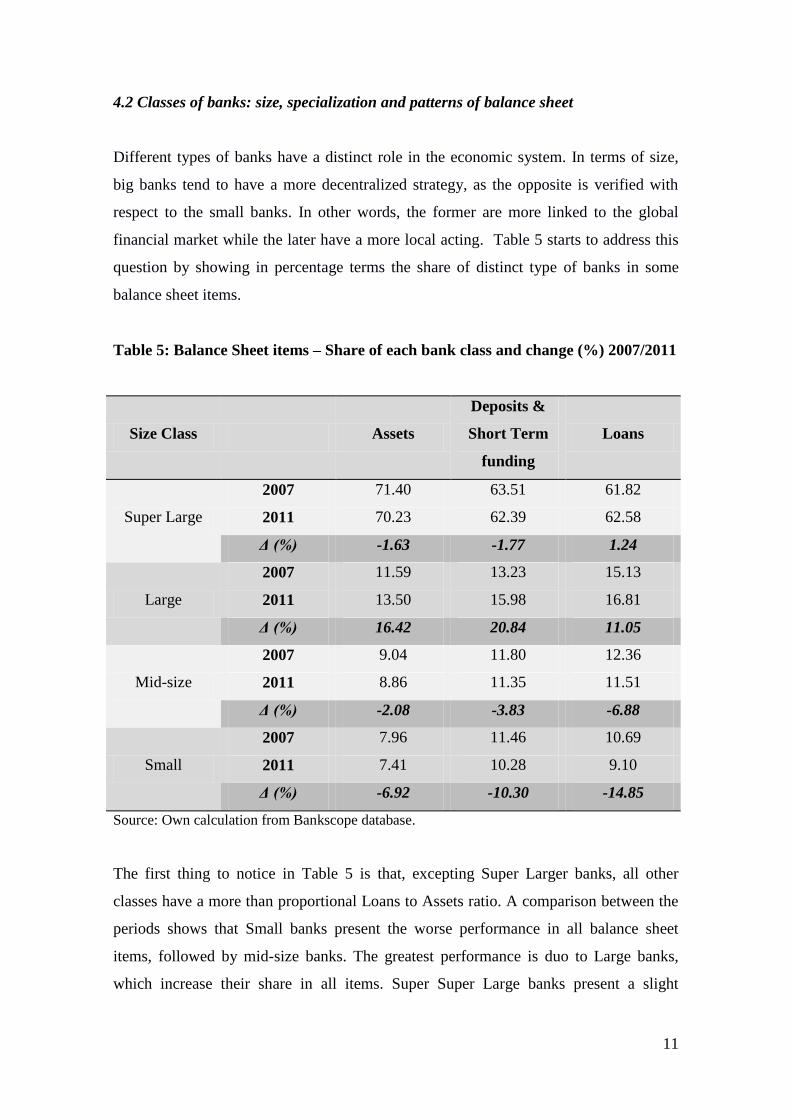
Graph 2 and 3 show those differences.
As it can be noticed in the graphs 1 and 2 clusters 1 and 4 are characterized by liquid
asset and illiquid liability. On the other hand, clusters 3 in 2007 and cluster 4 in 2011
present the relatively most illiquid feature in both sides. Finally, cluster 2 seems to have
the most balanced feature. Although the table and the graphs presented in this section
allow a comparison between clusters and between the two sides of the same cluster, it is
important to emphasize that, as the clusters membership might vary between the periods
(see last column of Table 4), any comparison must be taken with reservation. Next
section breaks down the clusters in order to specify the kind of institutions present into
each of them.
Graph 2: Relative Liquidity – 2007
Graph 3: Relative Liquidity – 2011
-6
-4
-2
0
2
4
6
8
0 1 2 3 4 5
Liq
uid
ity
Clusters
Asset
Liability
-6
-4
-2
0
2
4
6
8
0 1 2 3 4 5
Liq
uid
ity
Clusters
Asset
Liability
11
4.2 Classes of banks: size, specialization and patterns of balance sheet
Different types of banks have a distinct role in the economic system. In terms of size,
big banks tend to have a more decentralized strategy, as the opposite is verified with
respect to the small banks. In other words, the former are more linked to the global
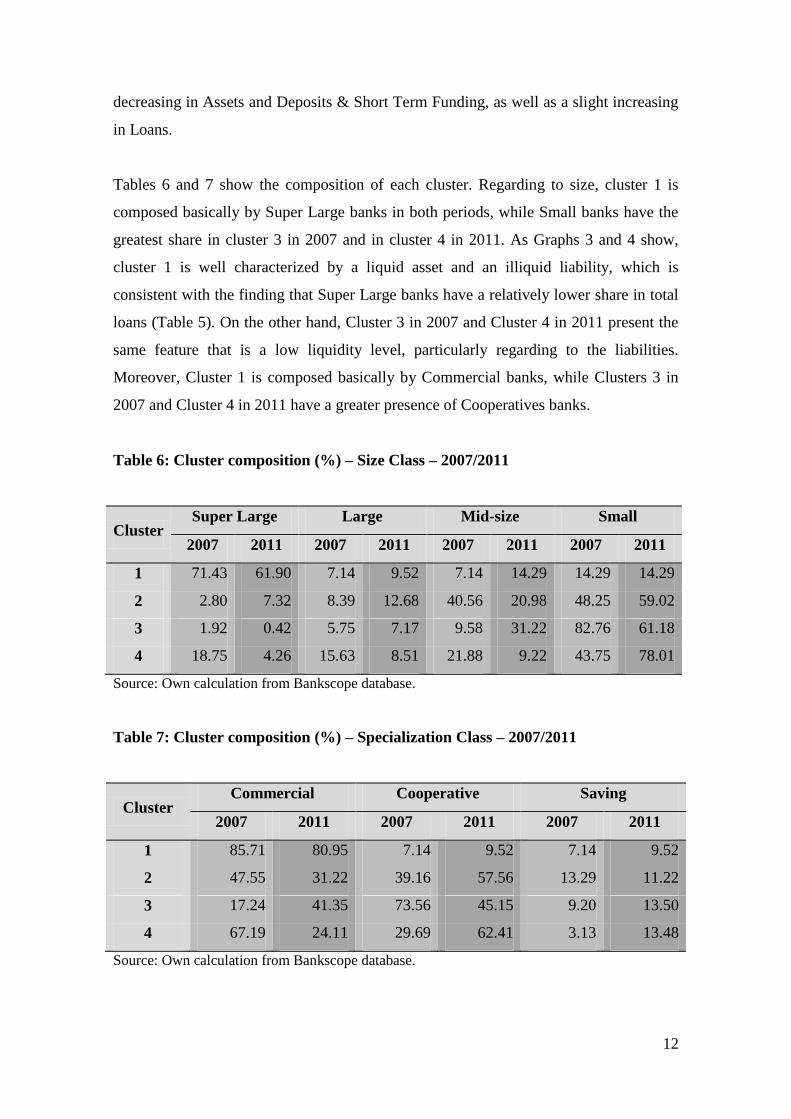
financial market while the later have a more local acting. Table 5 starts to address this
question by showing in percentage terms the share of distinct type of banks in some
balance sheet items.
Table 5: Balance Sheet items – Share of each bank class and change (%) 2007/2011
Size Class Assets
Deposits &
Short Term
funding
Loans
Super Large
2007 71.40 63.51 61.82
2011 70.23 62.39 62.58
Δ (%) -1.63 -1.77 1.24
Large
2007 11.59 13.23 15.13
2011 13.50 15.98 16.81
Δ (%) 16.42 20.84 11.05
Mid-size
2007 9.04 11.80 12.36
2011 8.86 11.35 11.51
Δ (%) -2.08 -3.83 -6.88
Small
2007 7.96 11.46 10.69
2011 7.41 10.28 9.10
Δ (%) -6.92 -10.30 -14.85
Source: Own calculation from Bankscope database.
The first thing to notice in Table 5 is that, excepting Super Larger banks, all other
classes have a more than proportional Loans to Assets ratio. A comparison between the
periods shows that Small banks present the worse performance in all balance sheet
items, followed by mid-size banks. The greatest performance is duo to Large banks,
which increase their share in all items. Super Super Large banks present a slight
12
decreasing in Assets and Deposits & Short Term Funding, as well as a slight increasing
in Loans.
Tables 6 and 7 show the composition of each cluster. Regarding to size, cluster 1 is
composed basically by Super Large banks in both periods, while Small banks have the
greatest share in cluster 3 in 2007 and in cluster 4 in 2011. As Graphs 3 and 4 show,
cluster 1 is well characterized by a liquid asset and an illiquid liability, which is
consistent with the finding that Super Large banks have a relatively lower share in total
loans (Table 5). On the other hand, Cluster 3 in 2007 and Cluster 4 in 2011 present the
same feature that is a low liquidity level, particularly regarding to the liabilities.
Moreover, Cluster 1 is composed basically by Commercial banks, while Clusters 3 in
2007 and Cluster 4 in 2011 have a greater presence of Cooperatives banks.
Table 6: Cluster composition (%) – Size Class – 2007/2011
Cluster Super Large Large Mid-size Small
2007 2011 2007 2011 2007 2011 2007 2011
1 71.43 61.90 7.14 9.52 7.14 14.29 14.29 14.29
2 2.80 7.32 8.39 12.68 40.56 20.98 48.25 59.02
3 1.92 0.42 5.75 7.17 9.58 31.22 82.76 61.18
4 18.75 4.26 15.63 8.51 21.88 9.22 43.75 78.01
Source: Own calculation from Bankscope database.
Table 7: Cluster composition (%) – Specialization Class – 2007/2011
Cluster Commercial Cooperative Saving
2007 2011 2007 2011 2007 2011
1 85.71 80.95 7.14 9.52 7.14 9.52
2 47.55 31.22 39.16 57.56 13.29 11.22
3 17.24 41.35 73.56 45.15 9.20 13.50
4 67.19 24.11 29.69 62.41 3.13 13.48
Source: Own calculation from Bankscope database.
13
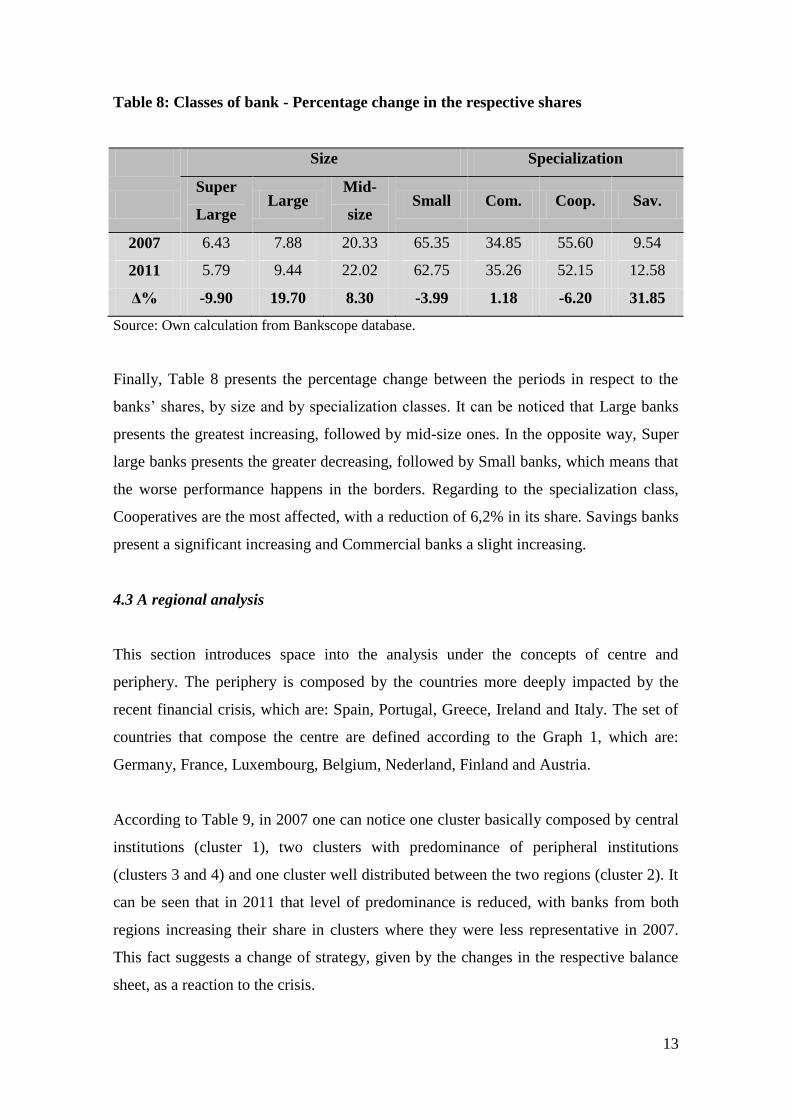
Table 8: Classes of bank - Percentage change in the respective shares
Size Specialization
Super
Large Large
Mid-
size Small Com. Coop. Sav.
2007 6.43 7.88 20.33 65.35 34.85 55.60 9.54
2011 5.79 9.44 22.02 62.75 35.26 52.15 12.58
Δ% -9.90 19.70 8.30 -3.99 1.18 -6.20 31.85
Source: Own calculation from Bankscope database.
Finally, Table 8 presents the percentage change between the periods in respect to the
banks’ shares, by size and by specialization classes. It can be noticed that Large banks
presents the greatest increasing, followed by mid-size ones. In the opposite way, Super
large banks presents the greater decreasing, followed by Small banks, which means that
the worse performance happens in the borders. Regarding to the specialization class,
Cooperatives are the most affected, with a reduction of 6,2% in its share. Savings banks
present a significant increasing and Commercial banks a slight increasing.
4.3 A regional analysis
This section introduces space into the analysis under the concepts of centre and
periphery. The periphery is composed by the countries more deeply impacted by the
recent financial crisis, which are: Spain, Portugal, Greece, Ireland and Italy. The set of
countries that compose the centre are defined according to the Graph 1, which are:
Germany, France, Luxembourg, Belgium, Nederland, Finland and Austria.
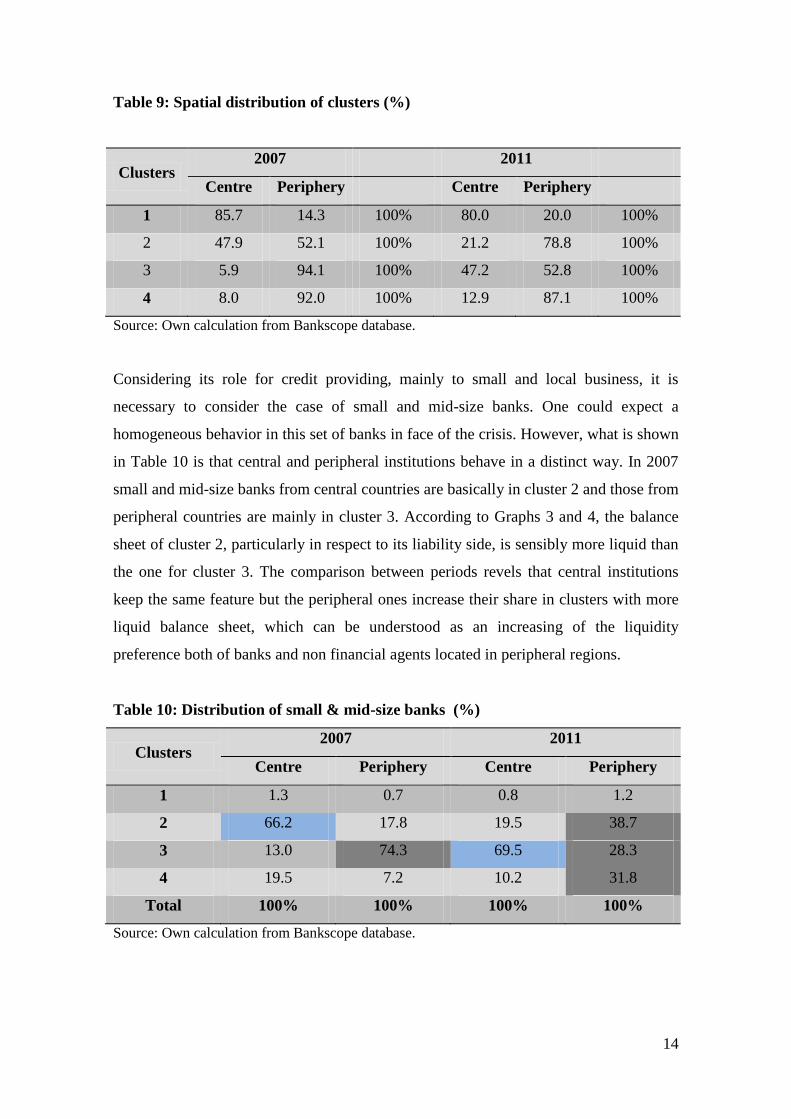
According to Table 9, in 2007 one can notice one cluster basically composed by central
institutions (cluster 1), two clusters with predominance of peripheral institutions
(clusters 3 and 4) and one cluster well distributed between the two regions (cluster 2). It
can be seen that in 2011 that level of predominance is reduced, with banks from both
regions increasing their share in clusters where they were less representative in 2007.
This fact suggests a change of strategy, given by the changes in the respective balance
sheet, as a reaction to the crisis.
14
Table 9: Spatial distribution of clusters (%)
Clusters 2007 2011
Centre Periphery Centre Periphery
1 85.7 14.3 100% 80.0 20.0 100%
2 47.9 52.1 100% 21.2 78.8 100%
3 5.9 94.1 100% 47.2 52.8 100%
4 8.0 92.0 100% 12.9 87.1 100%
Source: Own calculation from Bankscope database.
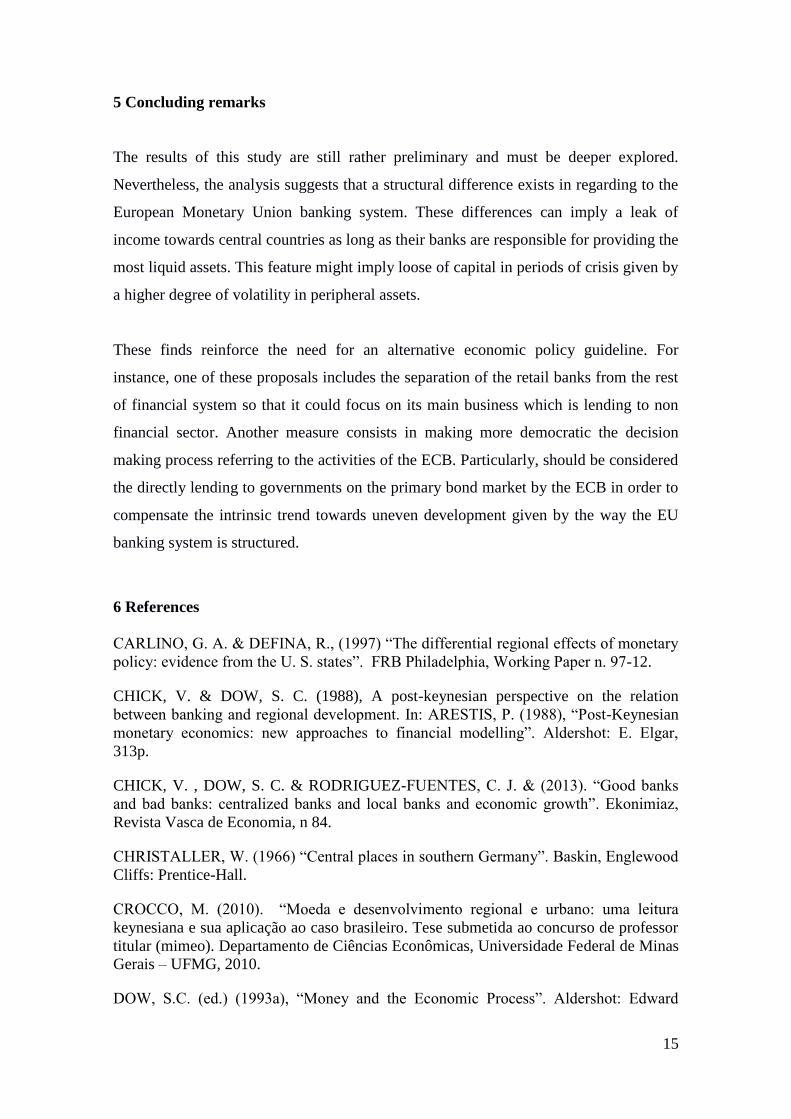
Considering its role for credit providing, mainly to small and local business, it is
necessary to consider the case of small and mid-size banks. One could expect a
homogeneous behavior in this set of banks in face of the crisis. However, what is shown
in Table 10 is that central and peripheral institutions behave in a distinct way. In 2007
small and mid-size banks from central countries are basically in cluster 2 and those from
peripheral countries are mainly in cluster 3. According to Graphs 3 and 4, the balance
sheet of cluster 2, particularly in respect to its liability side, is sensibly more liquid than
the one for cluster 3. The comparison between periods revels that central institutions
keep the same feature but the peripheral ones increase their share in clusters with more
liquid balance sheet, which can be understood as an increasing of the liquidity
preference both of banks and non financial agents located in peripheral regions.
Table 10: Distribution of small & mid-size banks (%)
Clusters 2007 2011
Centre Periphery Centre Periphery
1 1.3 0.7 0.8 1.2
2 66.2 17.8 19.5 38.7
3 13.0 74.3 69.5 28.3
4 19.5 7.2 10.2 31.8
Total 100% 100% 100% 100%
Source: Own calculation from Bankscope database.
15
5 Concluding remarks
The results of this study are still rather preliminary and must be deeper explored.
Nevertheless, the analysis suggests that a structural difference exists in regarding to the
European Monetary Union banking system. These differences can imply a leak of
income towards central countries as long as their banks are responsible for providing the
most liquid assets. This feature might imply loose of capital in periods of crisis given by
a higher degree of volatility in peripheral assets.
These finds reinforce the need for an alternative economic policy guideline. For
instance, one of these proposals includes the separation of the retail banks from the rest
of financial system so that it could focus on its main business which is lending to non
financial sector. Another measure consists in making more democratic the decision
making process referring to the activities of the ECB. Particularly, should be considered
the directly lending to governments on the primary bond market by the ECB in order to
compensate the intrinsic trend towards uneven development given by the way the EU
banking system is structured.
6 References
CARLINO, G. A. & DEFINA, R., (1997) “The differential regional effects of monetary
policy: evidence from the U. S. states”. FRB Philadelphia, Working Paper n. 97-12.
CHICK, V. & DOW, S. C. (1988), A post-keynesian perspective on the relation
between banking and regional development. In: ARESTIS, P. (1988), “Post-Keynesian
monetary economics: new approaches to financial modelling”. Aldershot: E. Elgar,
313p.
CHICK, V. , DOW, S. C. & RODRIGUEZ-FUENTES, C. J. & (2013). “Good banks
and bad banks: centralized banks and local banks and economic growth”. Ekonimiaz,
Revista Vasca de Economia, n 84.
CHRISTALLER, W. (1966) “Central places in southern Germany”. Baskin, Englewood
Cliffs: Prentice-Hall.
CROCCO, M. (2010). “Moeda e desenvolvimento regional e urbano: uma leitura
keynesiana e sua aplicação ao caso brasileiro. Tese submetida ao concurso de professor
titular (mimeo). Departamento de Ciências Econômicas, Universidade Federal de Minas
Gerais – UFMG, 2010.
DOW, S.C. (ed.) (1993a), “Money and the Economic Process”. Aldershot: Edward
16
Elgar Publishing.
DOW, S.C. (ed.) (1993b), “Money and the Economic Process”. Aldershot: Edward
Elgar Publishing. Cap. 6, The regional composition of the bank multiplier process, pp.
73-99.
DYMSKI, G. (1998). “Economia de bolha e crise financeira no Leste Asiático e na Califórnia: uma
perspectiva espacializada de Minsky”. Economia e Sociedade. Campinas, (11): 73-136.
EPSTEIN, G. (2005). “Financialization and the World Economy”. Cheltenham, UK and
Northampton, MA, USA: Edward Elgar.
EUROPEAN CENTRAL BANK (2014). Disponível em: https://www.ecb.europa.eu.
EUROSTAT (2014). European Comission. Disponível em:
http://epp.eurostat.ec.europa.eu
MINSKY, H. (1982) “Can “it” happen again? Essays on instability and finance”. New
York: M. E. Sharpe, 301p.
MINSKY, H., (1986), “Stabilizing an unstable economy”. New Haven: Yale University
Press, 353p.
MOORE, C. L. & HILL, J. M. (1982), “Interregional arbitrage and the supply of
loanable funds”. Journal of Regional Science, vol. 22, n. 4, pp. 397-404.
RODRIGUEZ-FUENTES, C. J. & DOW, S. C., (2003) “EMU and the Regional Impact
of Monetary Policy”. Regional Studies, vol. 37 (9), pp. 969–980.
DE GRAWE, P. & YUEMEI, J. (2013) Panic driven austerity in the Eurozone and its
implications. February 2013.
Mid-size Bank Coalition of America (2013). Research November 2013. Houlihan
Lokey. Available at: http://midsizebanks.com/.