Embed Size (px)
Citation preview
STROUD
Worked examples and exercises are in the text
PROGRAMME F4(from 6th Ed)
GRAPHS
(revised 29 Jan 14 – J.A.B.)
STROUD
Worked examples and exercises are in the text
Graphs of equations
(Using a spreadsheet)
Inequalities
Absolute values
Programme F4: Graphs
STROUD
Worked examples and exercises are in the text
Graphs of equations
Using a spreadsheet
Inequalities
Absolute values
Programme F4: Graphs
STROUD
Worked examples and exercises are in the text
Graphs of equations
Equations
Ordered pairs of numbers
Cartesian axes
Drawing a graph
Programme F4: Graphs
STROUD
Worked examples and exercises are in the text
Graphs of equations
Equations
Programme F4: Graphs
An equation in a single variable can be written as a subject variable (called the dependent variable) being equal to some expression in the single variable (called the independent variable).
A conditional equation is a statement of the equality of two expressions that is only true for restricted values of the symbols involved.
STROUD
Worked examples and exercises are in the text
Graphs of equations
Ordered pairs of numbers
Programme F4: Graphs
Evaluating an equation of a single independent variable enables a collection of ordered pairs of numbers to be constructed.
It is called an ordered pair because the first number of the pair is always the value of the independent variable and the second number is the corresponding value of the dependent variable.
STROUD
Worked examples and exercises are in the text
Graphs of equations
Cartesian axes
Programme F4: Graphs
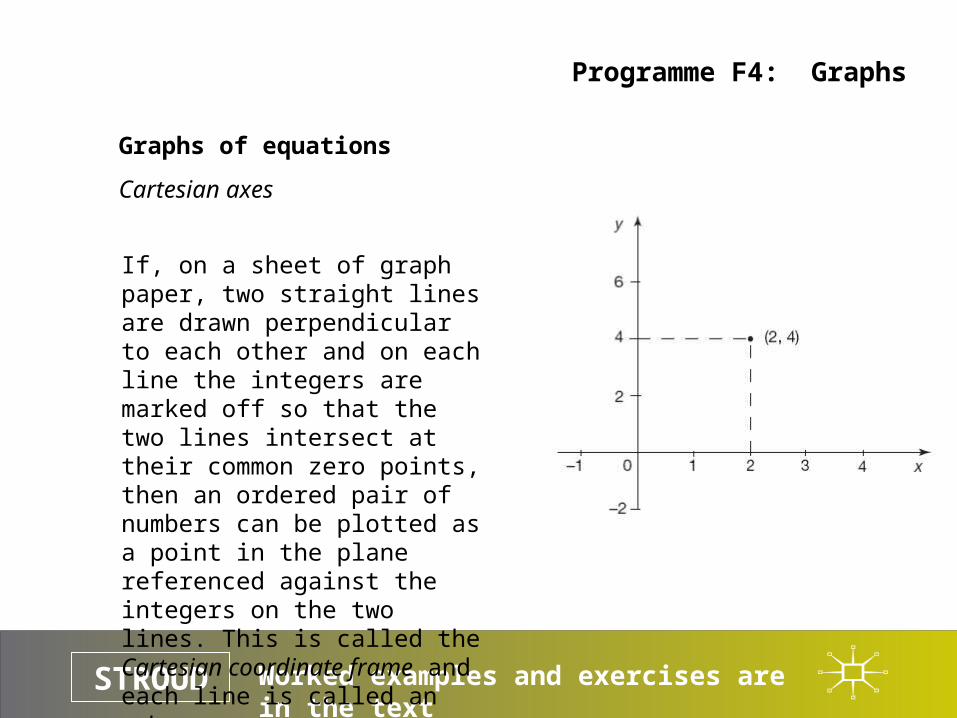
If, on a sheet of graph paper, two straight lines are drawn perpendicular to each other and on each line the integers are marked off so that the two lines intersect at their common zero points, then an ordered pair of numbers can be plotted as a point in the plane referenced against the integers on the two lines. This is called the Cartesian coordinate frame and each line is called an axis.
STROUD
Worked examples and exercises are in the text
Graphs of equations
Drawing a graph
Programme F4: Graphs
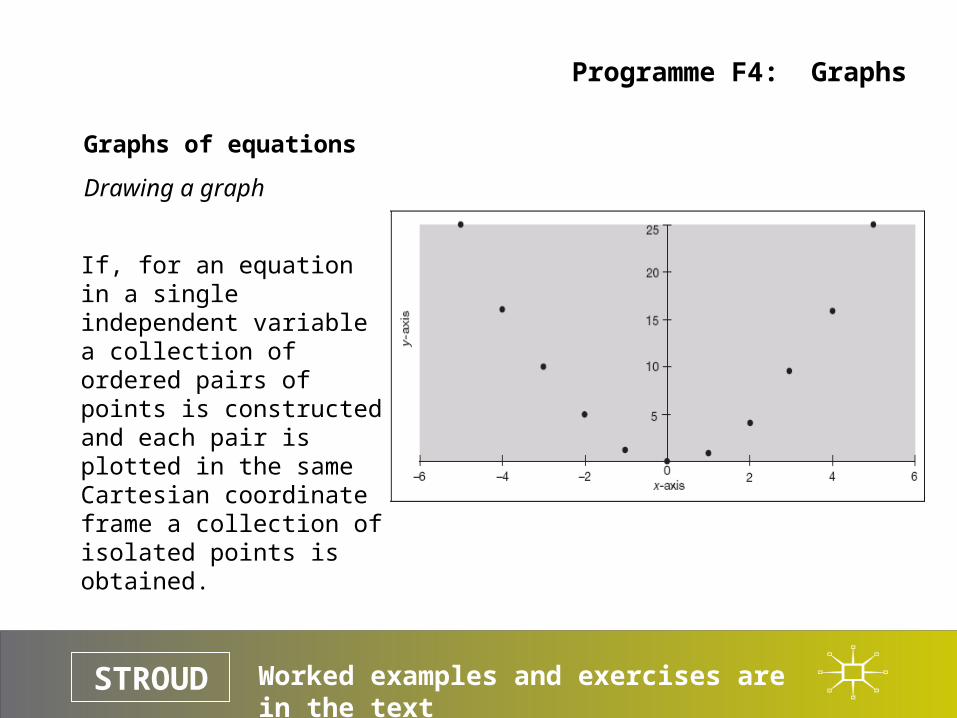
If, for an equation in a single independent variable a collection of ordered pairs of points is constructed and each pair is plotted in the same Cartesian coordinate frame a collection of isolated points is obtained.
STROUD
Worked examples and exercises are in the text
Graphs of equations
Drawing a graph
Programme F4: Graphs
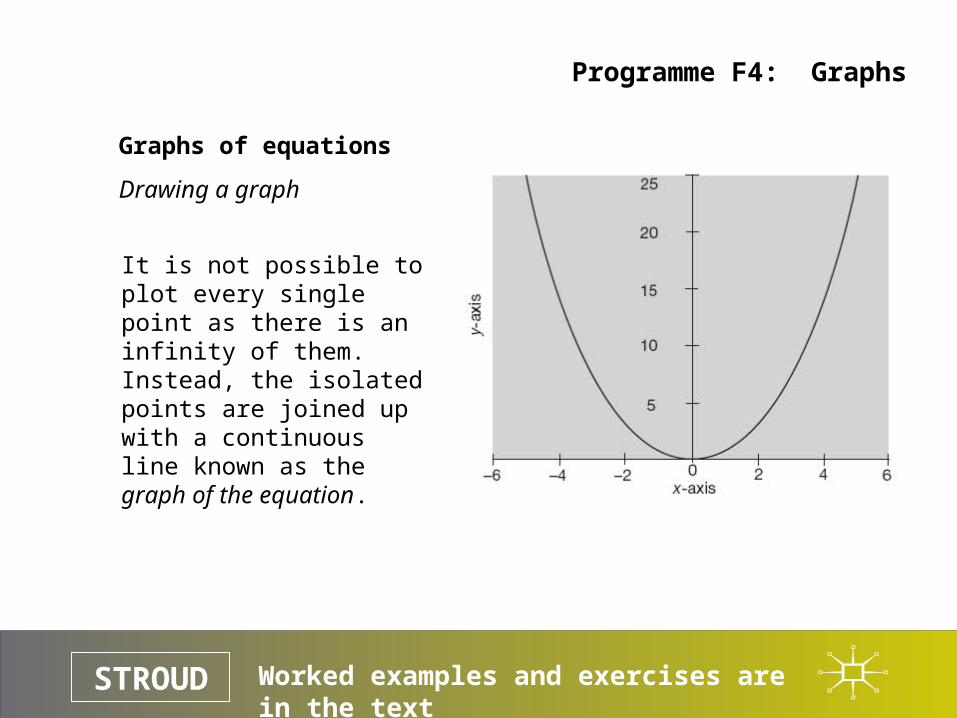
It is not possible to plot every single point as there is an infinity of them. Instead, the isolated points are joined up with a continuous line known as the graph of the equation.
STROUD
Worked examples and exercises are in the text
Equation of a straight line
Copied from 6th Ed Prog 8
(but in 7th Ed Prog 13)
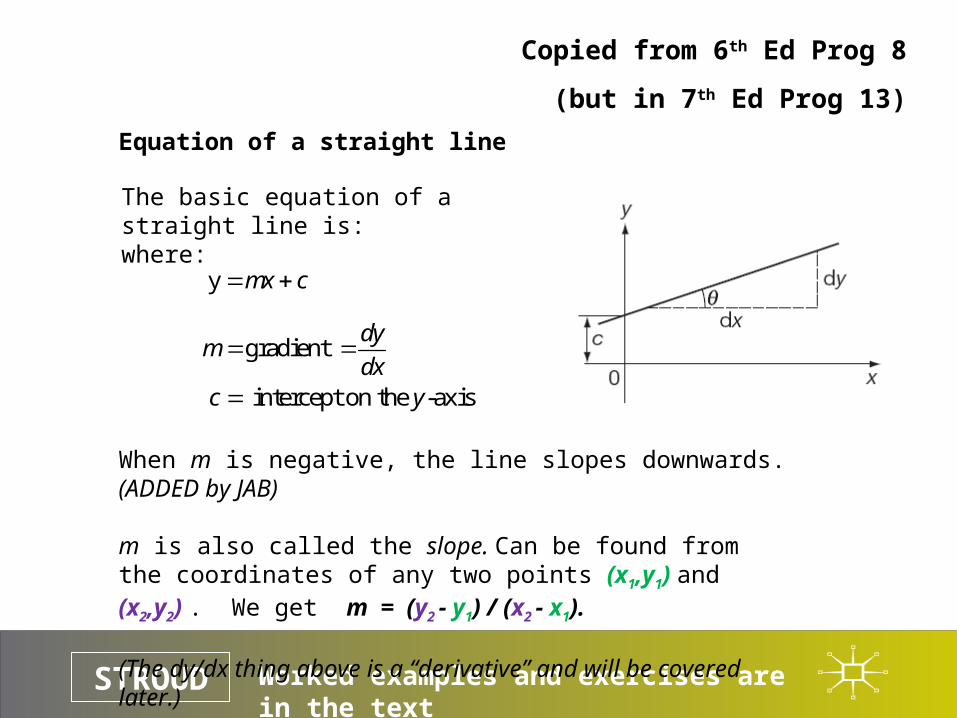
The basic equation of a straight line is:where:
y mx c
gradient
intercept on the -axis
dym
dxc y
When m is negative, the line slopes downwards. (ADDED by JAB)
m is also called the slope. Can be found from the coordinates of any two points (x1,y1) and (x2,y2) . We get m = (y2 - y1) / (x2 - x1).
(The dy/dx thing above is a “derivative” and will be covered later.)
STROUD
Worked examples and exercises are in the text
Graphs of equations
Using a spreadsheet (mostly removed – study in textbook if you wish)
Inequalities
Absolute values
Programme F4: Graphs
STROUD
Worked examples and exercises are in the text
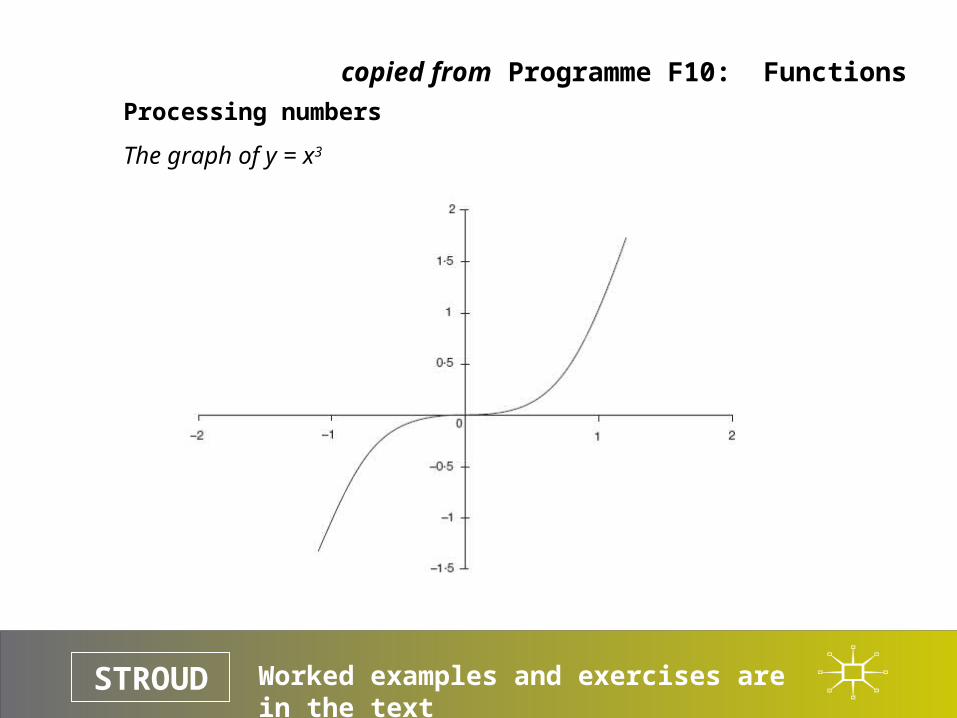
Processing numbers
The graph of y = x3
copied from Programme F10: Functions
STROUD
Worked examples and exercises are in the text
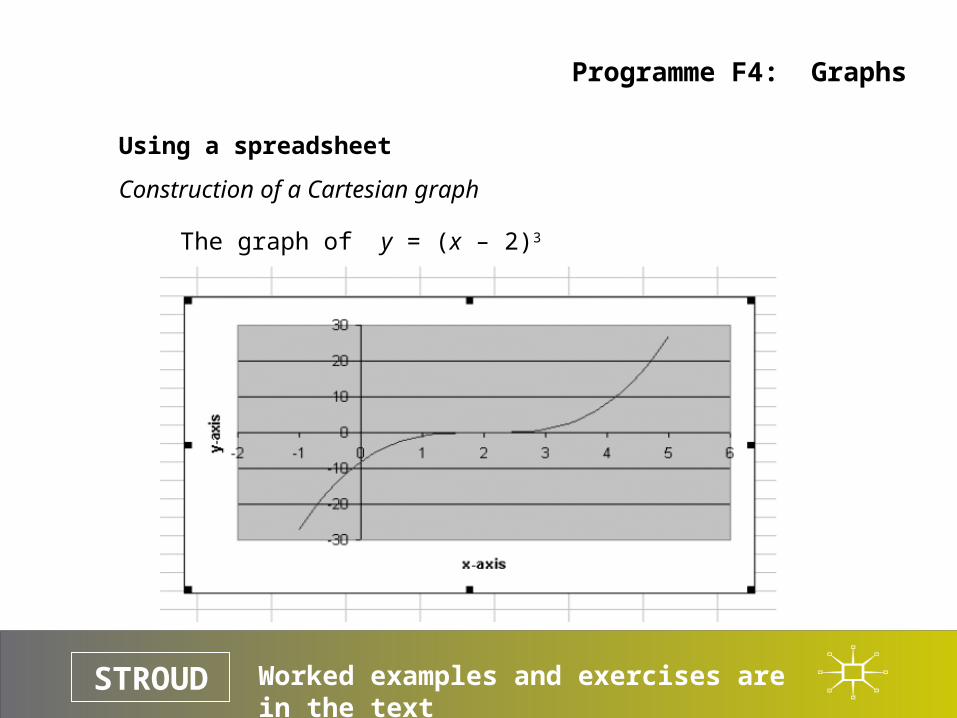
Using a spreadsheet
Construction of a Cartesian graph
Programme F4: Graphs
The graph of y = (x – 2)3
STROUD
Worked examples and exercises are in the text
Processing numbers
Graphs of inverses
copied from Programme F10: Functions
The ordered pairs of input-output numbers that are used to generate the graph of a function are reversed for the inverse function.
Consequently, the graph of the inverse of a function is the shape of the graph of the original function reflected in the line y = x.
STROUD
Worked examples and exercises are in the text
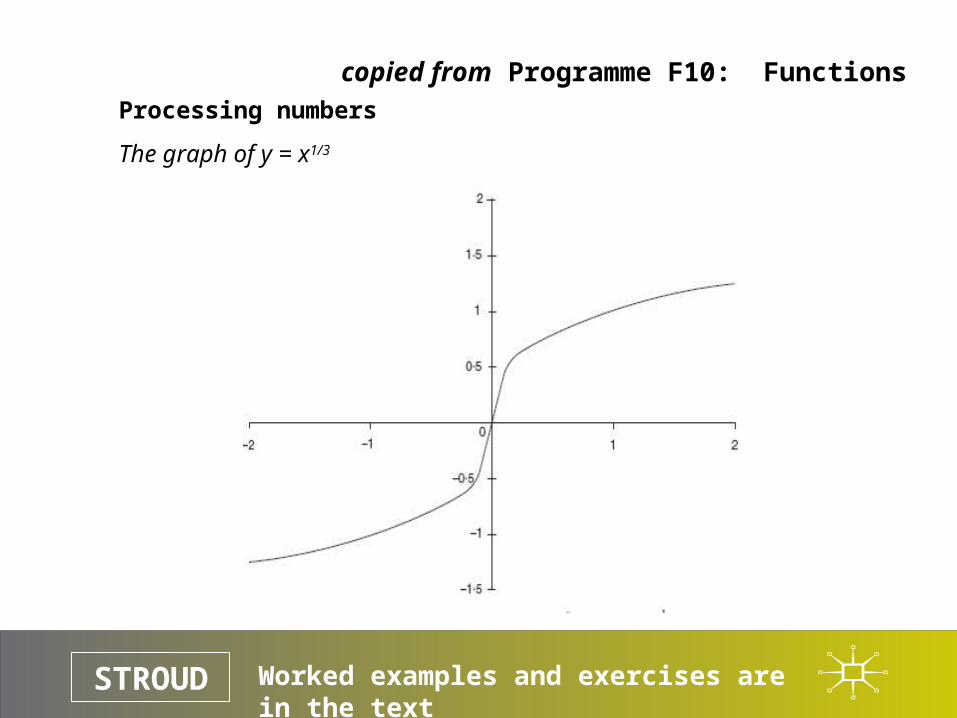
Processing numbers
The graph of y = x1/3
copied from Programme F10: Functions
STROUD
Worked examples and exercises are in the text
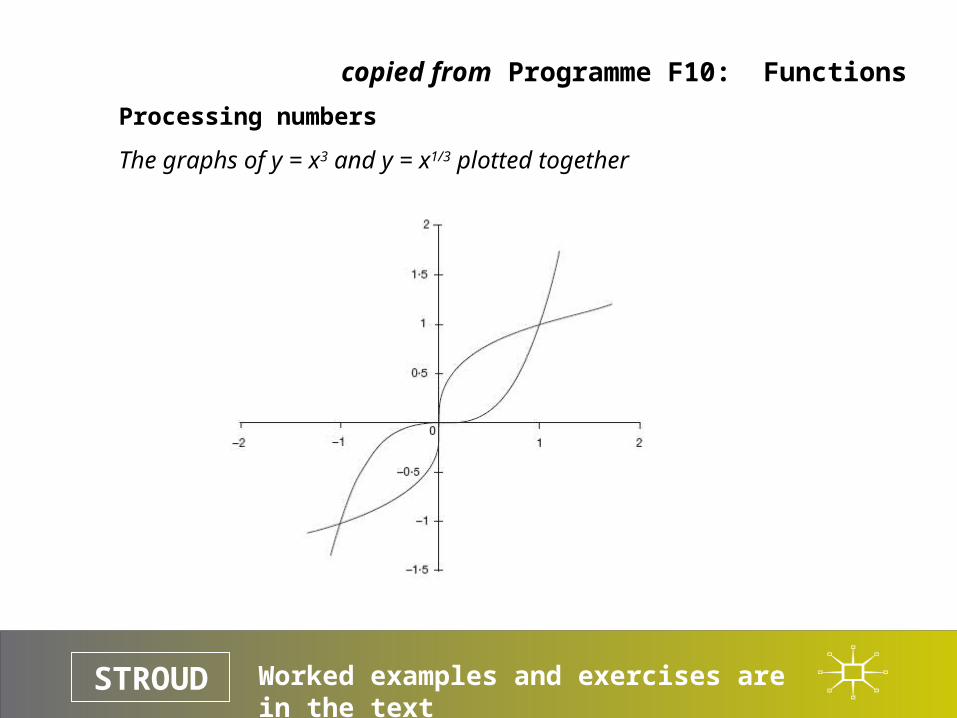
Processing numbers
The graphs of y = x3 and y = x1/3 plotted together
copied from Programme F10: Functions
STROUD
Worked examples and exercises are in the text
Variants of quadratic functions and cubic functions [ on board in class – J.A.B.]
I.e., various cases of:
y = ax2 + bx + c [quadratic]
y = ax3 + bx2 + cx + d [cubic]