Embed Size (px)
Citation preview
Because the polybutadiene sheet or emulsion is in- soluble in solvents useful in the region of the ana- lytical wavelengths, the lengthy procedure for casting the sample sheets is necessary for the success of the method.
Acknowledgments . The assistance of Ar thu r S. Ny- quist in the procurement of standards and typical samples and of Dr. Joseph/VL Schmitt in the casting of the sample sheets is gratefully acknowledged.
l~eeeived 30 Maroh 1965
1. "Chenfical Analysis of Synthetic Elastomers" [Solid Sty- renc-Butadiene Copolymers], (ASTM Designation: D 1416- 62a T) ASTM Std. 28, 665 (1965); and "Testing Syn- thetic Rubber Latices" [Styrene-Butadiene Copolymers], (ASTM Designation: D1417-61) ibid., p. 687.
2. F. T. King and R. C. Hirt, Anal. Chem. 24, 1545 (1952). 3. Committee E-13, Am. Soc. Testing Mater. Proc. 59, 622
(1959); and "Manual on Recommended Practices in Spec- trophotometry," ASTM Std., 1st ed. (Feb. 1966).
Strontium Content of Some Standard Samples*
Claude Huffman, Jr., and J. D. Mensik
U. S. Geological Survey, Denver, Colorado 80225
This paper presents strontium values determined by atomic absorption spectrophotometry on six NBS portland cements, six NBS standards, and the well- known G-1 and W-1. These samples represent a wide variety of rock or rocklike types with strontium rang- ing in concentration from about 0.0025% to 0.21%. Values on samples certified by the National Bureau of Standards are limited to six port land cements and one argillaceous limestone.
Because of the large variation of strontium values reported on " s t a n d a r d g ran i t e" G-1 and " s t a n d a r d diabase" W-l, 1 Turekian and Carr 2 pointed out the need for distributing other rock and mineral types for interlaboratory checks. They reported strontium values on five reference samples and 12 radium
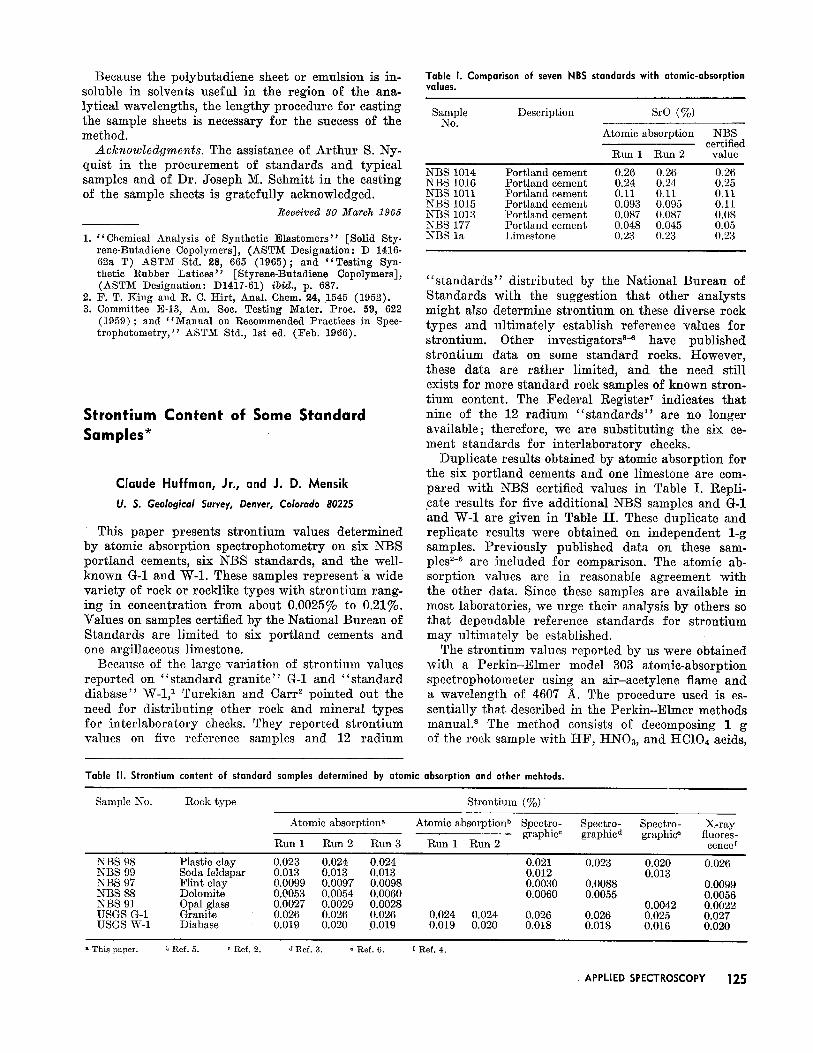
Table II. Strontium content of standard samples determined by atomic
Table I. Comparison of seven NBS standards with atomic-absorption values.
S a m p l e Description SrO (%) N o .
Atomic absorption NBS certified
Run 1 Run 2 value
NBS 1014 Portland cement 0.26 0.26 0.26 NBS 1016 Portland cement 0.24 0.24 0.25 NBS 1011 Portland cement 0.11 0.11 0.11 NBS 1015 Portland cement 0.093 0.095 0.11 NBS 1013 Portland cement 0.087 0.087 0.08 NBS 177 Portland cement 0.048 0.045 0.05 NBS la Limestone 0.23 0.23 0.23
" s t a n d a r d s " distributed by the National Bureau of Standards with the suggestion that other analysts might also determine strontium on these diverse rock types and ultimately establish reference values for strontium. Other investigators s-¢ have published strontium data on some standard rocks. However, these data are rather limited, and the need still exists for more standard rock samples of known stron- t ium content. The Federal Register T indicates tha t nine of the 12 radium " s t a n d a r d s " are no longer available; therefore, we are substituting the six ce- ment standards for interlaboratory checks.
Duplicate results obtained by atomic absorption for the six port land cements and one limestone are com- pared with NBS certified values in Table I. Repli- cate results for five additional NBS samples and G-1 and W-1 are given in Table I I . These duplicate and replicate results were obtained on independent 1-g samples. Previously published data on these sam- ples ~-s are included for comparison. The atomic ab- sorption values are in reasonable agreement with the other data. Since these samples are available in most laboratories, we urge their analysis by others so that dependable reference standards for strontium may ultimately be established.
The strontium values reported by us were obtained with a Perk in-Elmer model 303 atomic-absorption speetrophotometer using an air-acetylene flame and a wavelength of 4607 A. The procedure used is es- sentially that described in the Perk in-Elmer methods manual, s The method consists of decomposing 1 g of the rock sample with 1-IF, HN0a, and HCi04: acids,
absorption and other mehtods.
Sample No. Rock type Strontimn (%)
Atomic absorption ~
Run 1 Run 2 Run 3
Atomic absorption b Spectro- Spectro- Spectro- X-ray graphic c graphic d graphic e fluores-
Run 1 Run 2 cence ~
NBS 98 Plastic clay 0.023 0 . 0 2 4 0.024 NBS 99 Soda feldspar 0.013 0 . 0 1 3 0.01.3 NBS 97 Flint clay 0.0099 0.0097 0.0098 NBS 88 Dolomite 0.0053 0.0054 0.0060 NBS 91 Opal glass 0.0027 0.0029 0.0028 USGS G-1 Granite 0.026 0 . 0 2 6 0.026 USGS W-1 Diabase 0.019 0 . 0 2 0 .0.019
0.024 0.024 0.019 0.020
0.021 0.023 0.020 0.026 0.012 0.013 0.0030 0.0088 0.0099 0.0060 0.0055 0.0056
0.0042 0.0022 0.026 0.026 0.025 0.027 0.018 0.018 0.016 0.020
T h i s p a p e r , b R e f . 5 . ~ R e f . 2 . d R e f . 3. * R e f . 6 . ! R e f . 4 .
APPLIED SPECTROSCOPY 125
fuming to remove fluoride, and p repar ing 100 ml of a 5% volume/volume HC1 solution. More dilute solu- tions for aspirat ion were made by taking appropr ia te aliquots (2, 5, or 10 ml) , adding lan thanum chloride and acid, and diluting to 25 ml. The sample solutions and s t ront ium s tandards which were al ternately atomized into the flame contained 5% HC1 and 1% lanthanum. Two calibration curves were used for the determinat ion of s t ront ium in these samples; one ranging f rom 0.1-1 p p m Sr was read on the 5× ex- pansion scale and the other ranging f rom 1-5 p p m Sr was read with the 2× expansion scale.
tteceived 17 January 1966
*Publicatiou authorized by Director, U. S. Geological Survey.
1. i~I. Fleischer and R. E. Stevens, Geochim. Cosmoctfim. Aeta 26, 525 (1962).
2. K. K. Turekian and M. It. Carr, Geochim. Cosmochim. Acta, 24, (1961).
3. R. J. Grabowski and 1{. C. Unice, Anal. Chem. 80, 1374 (1958).
4. ~'I. J. Kaye, Geochim. Cosmochim. Acta 29, 139 (1965). 5. D. J. Trent and W. Slavln, Perkin-Elmer Atomic Absorp-
tion Newsletter 3, No. 9 (1964). 6. S. R. Taylor and P. Kolbe, Geoctfim. Cosmochlm. Acta, 28,
447 (1964). 7. Federal Register 30, 74, Part I I (1965). 8. "Analytical Methods for Atomic Absorption Spectropho-
tometry" (2erkin-Elmer Corporation, Norwalk, Conn., 1964).
Versatile Gas-Metering System for Controlled Atmospheres
D. L. Nash
Bell Telephone Laboratories, Incorporated, Murray Hill, New Jersey 07971
The use of controlled atmospheres in emission- spectrographic analysis has proved to be of great value in reducing background and in improving sen- si t ivi ty for some elements. I n most cases, the recom- mended atmosphere is a mixture of two gases such as argon and oxygen. One way of obtaining such mixtures is to purchase a cylinder of gas containing a definite rat io of the two gases desired. This method, however, allows no flexibility in va ry ing the rat io of the gases. Invest igat ions at this labora tory have shown tha t there is no one gas mix ture tha t will work for all analyses. Best results can only be achieved by vary ing the gas mix ture to obtain opti- m u m results for the par t icu lar problem.
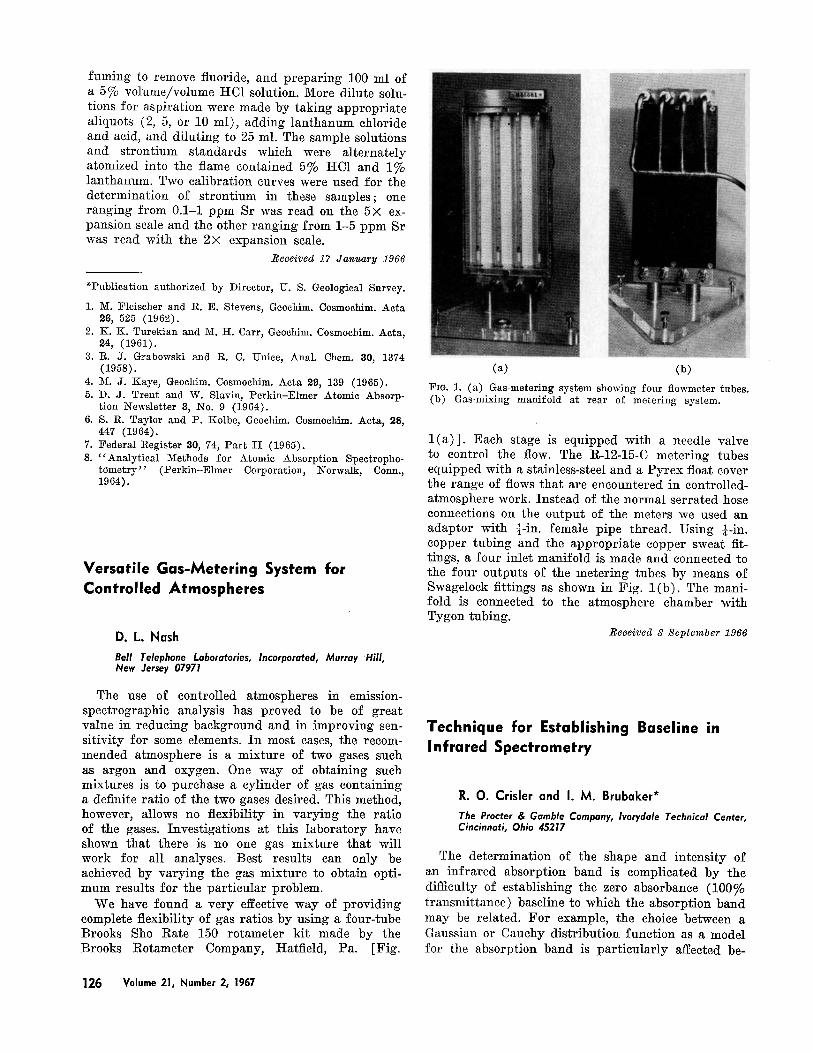
We have found a ve ry effective way of providing complete flexibility of gas ratios by using a four- tube Brooks Sho Rate 150 rotameter ki t made by the Brooks Rotameter Company, Hatfield, Pa. [Fig.
(a) (b)
Fia. 1. (a) Gas-metering system showing four flowmeter tubes. (b) Gas-mixing manifold at rear of metering system.
l ( a ) ] . Each stage is equipped with a needle valve to control the flow. The R-12-15-C meter ing tubes equipped with a stainless-steel and a Py rex float cover the range of flows tha t are encountered in controlled- atmosphere work. Ins tead of the normal serra ted hose connections on the output of the meters we used an adaptor with ¼-in. female pipe thread. Using ¼-in. copper tubing and the appropr ia te copper sweat fit- tings, a four inlet manifold is made and connected to the four outputs of the meter ing tubes by means of Swagelock fittings as shown in Fig. l ( b ) . The mani- fold is connected to the a tmosphere chamber with Tygon tubing.
tteoeived 8 September 2966
Technique for Establishing Baseline in Infrared Spectrometry
R. O. Crisler and I. M. Brubaker*
The Procter & Gamble Company, Ivorydale Technical Center, Cincinnati, Ohio 45217
The determinat ion of the shape and intensi ty of an in f ra red absorpt ion band is complicated by the difficulty of establishing the zero absorbance (100% t ransmit tance) baseline to which the absorpt ion band may be related. Fo r example, the choice between a Gaussian or Cauchy distr ibution funct ion as a model for the absorption band is par t i cu la r ly affected be-
126 Volume 21, Humber 2, 1967