Embed Size (px)
Citation preview

Strong Schools, Strong Communities for All SPPS Students
VisionCards SSSC 2.0 Monitoring and Reporting System
Regular Board of Education Meeting
9/23/14
Purpose
The purpose of this presentation is to:
• Provide an overview of the
VisionCard process and measures
for Strong Schools, Strong
Communities 2.0.
• Request Board approval of proposed
metrics and vision levels.
23 SEPT 14
Why VisionCards? • VisionCards serve several purposes
– Monitor and report on progress of SSSC 2.0 – Inform policy review, procedure development, targeted
interventions, resource allocation, etc.
• Will be presented at regular Board Meetings (October 2014 – August 2015)
23 SEPT 14
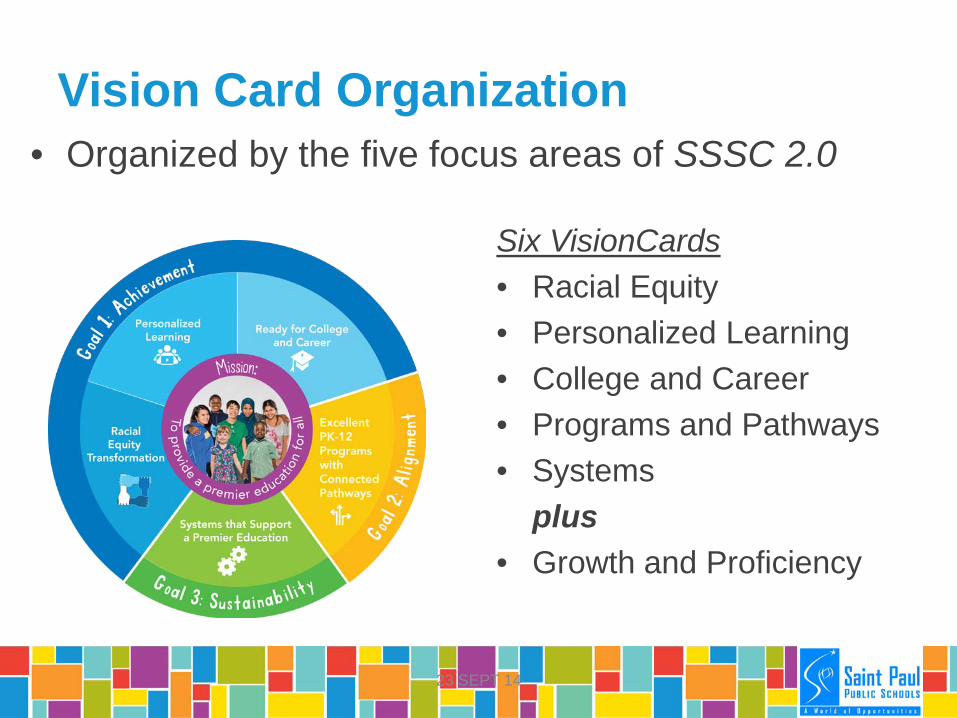
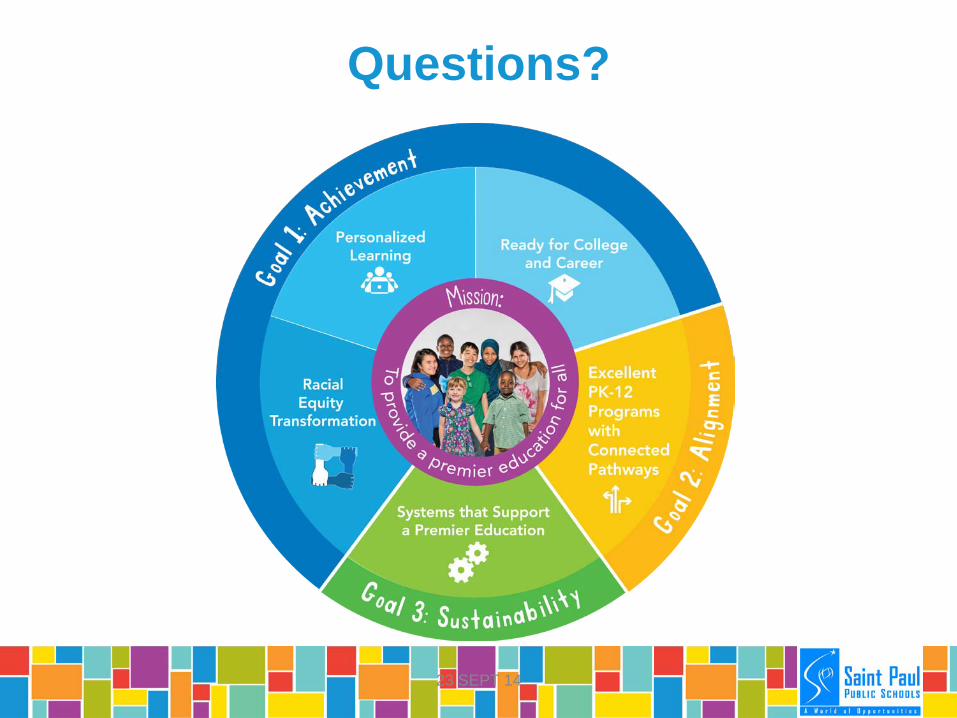
Vision Card Organization
Six VisionCards • Racial Equity • Personalized Learning • College and Career • Programs and Pathways • Systems plus • Growth and Proficiency
23 SEPT 14
• Organized by the five focus areas of SSSC 2.0
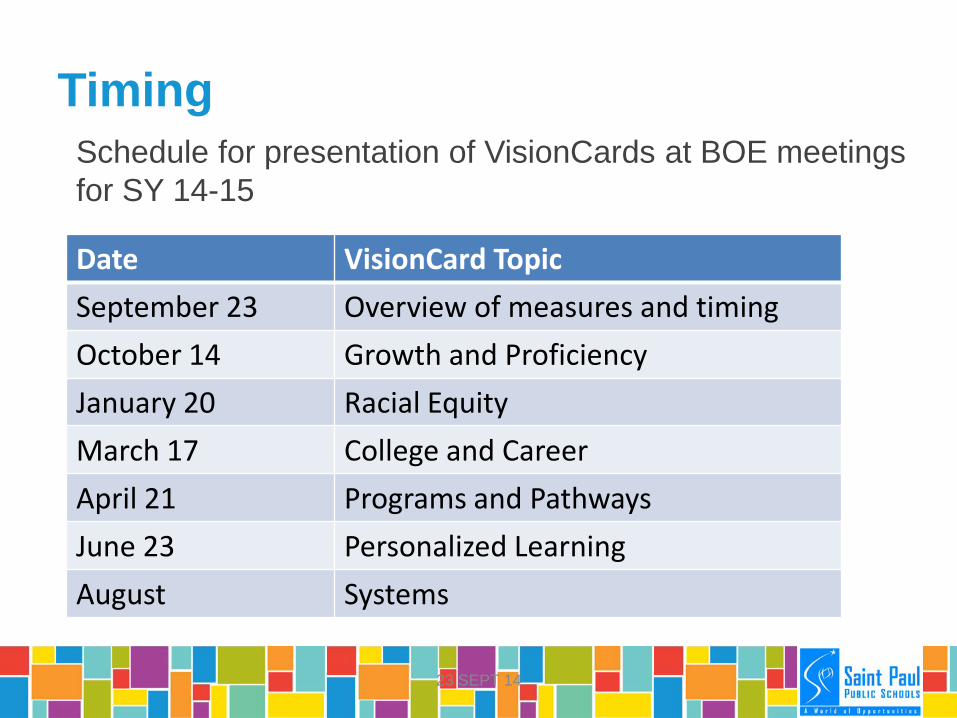
Timing
Date VisionCard Topic September 23 Overview of measures and timing October 14 Growth and Proficiency January 20 Racial Equity March 17 College and Career April 21 Programs and Pathways June 23 Personalized Learning August Systems
23 SEPT 14
Schedule for presentation of VisionCards at BOE meetings for SY 14-15
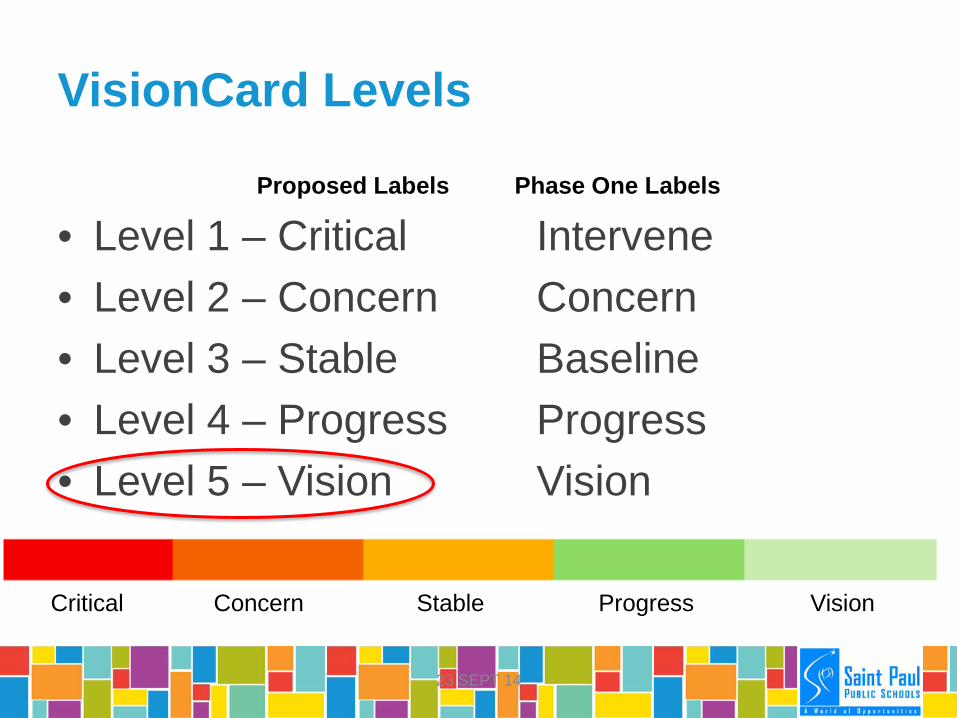
VisionCard Levels
• Level 1 – Critical Intervene • Level 2 – Concern Concern • Level 3 – Stable Baseline • Level 4 – Progress Progress • Level 5 – Vision Vision
23 SEPT 14
Critical Concern Stable Progress Vision
Proposed Labels Phase One Labels
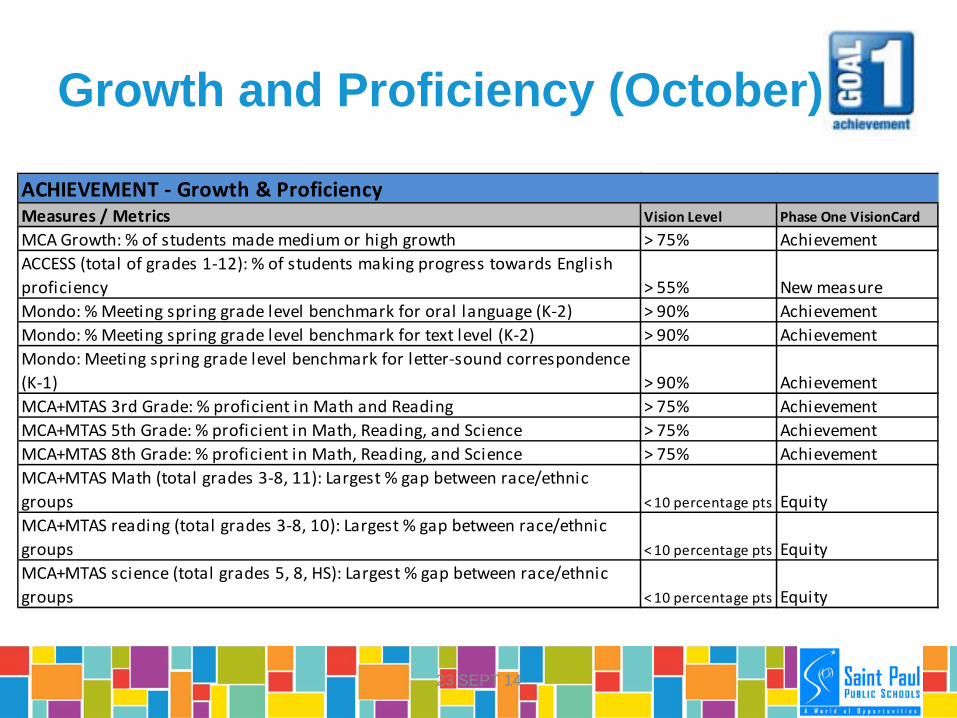
Growth and Proficiency (October)
23 SEPT 14
ACHIEVEMENT - Growth & ProficiencyMeasures / Metrics Vision Level Phase One VisionCardMCA Growth: % of students made medium or high growth > 75% AchievementACCESS (total of grades 1-12): % of students making progress towards English proficiency > 55% New measureMondo: % Meeting spring grade level benchmark for oral language (K-2) > 90% AchievementMondo: % Meeting spring grade level benchmark for text level (K-2) > 90% AchievementMondo: Meeting spring grade level benchmark for letter-sound correspondence (K-1) > 90% AchievementMCA+MTAS 3rd Grade: % proficient in Math and Reading > 75% AchievementMCA+MTAS 5th Grade: % proficient in Math, Reading, and Science > 75% AchievementMCA+MTAS 8th Grade: % proficient in Math, Reading, and Science > 75% AchievementMCA+MTAS Math (total grades 3-8, 11): Largest % gap between race/ethnic groups < 10 percentage pts EquityMCA+MTAS reading (total grades 3-8, 10): Largest % gap between race/ethnic groups < 10 percentage pts EquityMCA+MTAS science (total grades 5, 8, HS): Largest % gap between race/ethnic groups < 10 percentage pts Equity
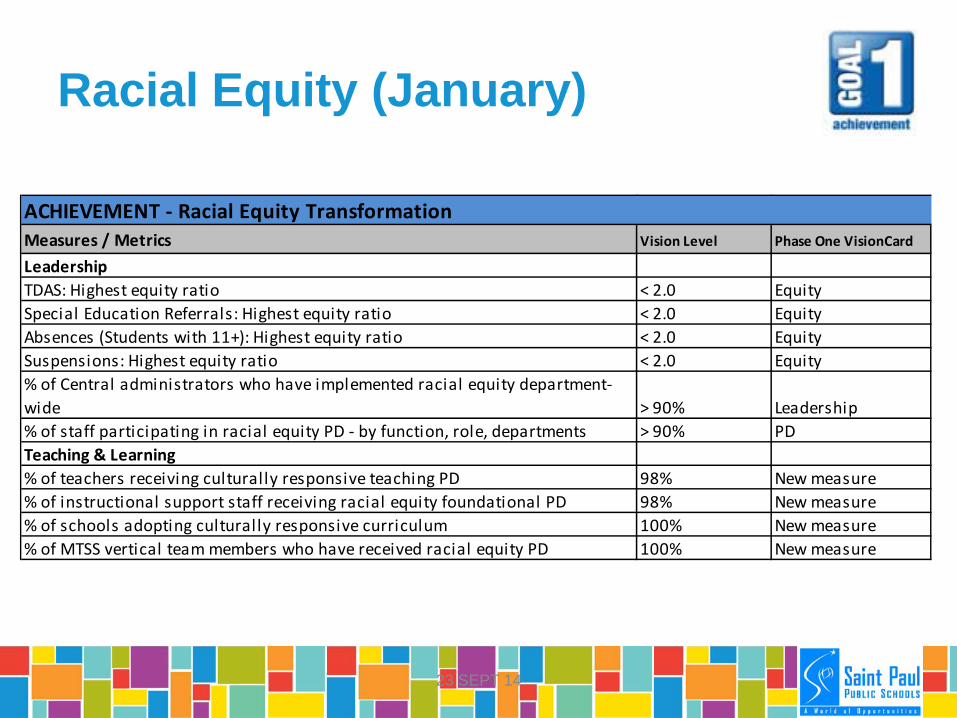
Racial Equity (January)
23 SEPT 14
ACHIEVEMENT - Racial Equity Transformation Measures / Metrics Vision Level Phase One VisionCard
LeadershipTDAS: Highest equity ratio < 2.0 Equity Special Education Referrals: Highest equity ratio < 2.0 Equity Absences (Students with 11+): Highest equity ratio < 2.0 Equity Suspensions: Highest equity ratio < 2.0 Equity % of Central administrators who have implemented racial equity department-wide > 90% Leadership% of staff participating in racial equity PD - by function, role, departments > 90% PD Teaching & Learning% of teachers receiving culturally responsive teaching PD 98% New measure% of instructional support staff receiving racial equity foundational PD 98% New measure% of schools adopting culturally responsive curriculum 100% New measure% of MTSS vertical team members who have received racial equity PD 100% New measure
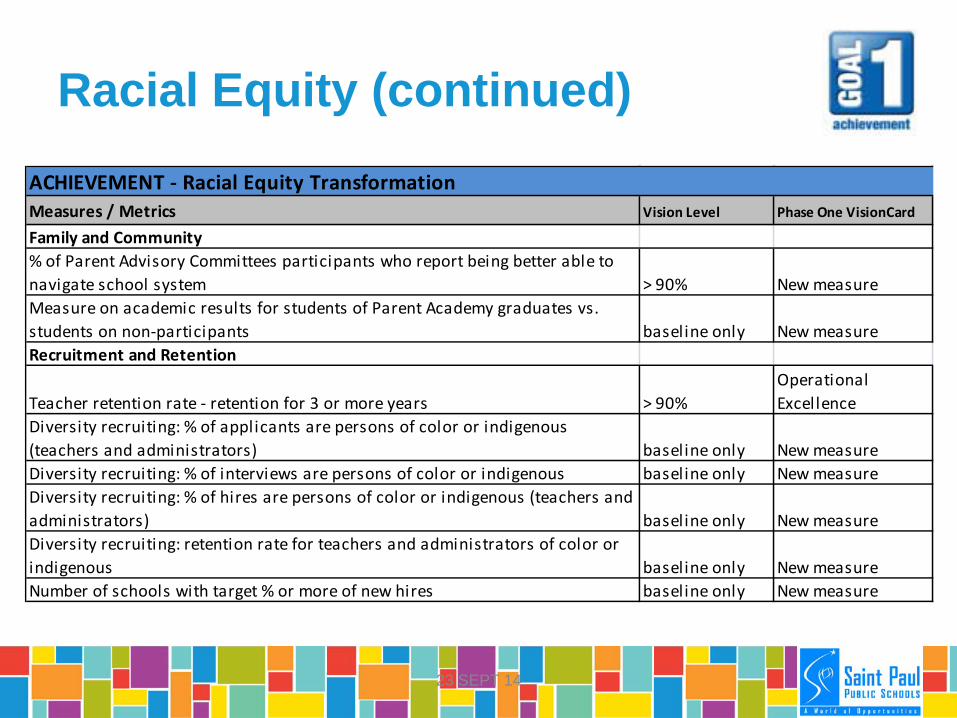
Racial Equity (continued)
23 SEPT 14
ACHIEVEMENT - Racial Equity Transformation Measures / Metrics Vision Level Phase One VisionCard
Family and Community% of Parent Advisory Committees participants who report being better able to navigate school system > 90% New measureMeasure on academic results for students of Parent Academy graduates vs. students on non-participants baseline only New measureRecruitment and Retention
Teacher retention rate - retention for 3 or more years > 90%
Operational Excellence
Diversity recruiting: % of applicants are persons of color or indigenous (teachers and administrators) baseline only New measureDiversity recruiting: % of interviews are persons of color or indigenous baseline only New measureDiversity recruiting: % of hires are persons of color or indigenous (teachers and administrators) baseline only New measureDiversity recruiting: retention rate for teachers and administrators of color or indigenous baseline only New measureNumber of schools with target % or more of new hires baseline only New measure

College and Career (March)
23 SEPT 14
ACHIEVEMENT - Ready for College and CareerMeasures / Metrics Vision Level Phase One VisionCardCoursesCTE: Number of students participating in out-of-school career programs and internships 1200 New measureCTE: Proportionality ratio (student group % of those in classes / % of student group in district) by race enrolled in advanced CTE courses All groups > 0.75 New measureAdvanced courses: Proportionality ratio (student group % of those in classes / % of student group in district) by race enrolled in advanced courses All groups > 0.75 New measureAdvanced courses: Proportionality ratio (student group % of those passing classes / % of student group in district) by race passing advanced courses All groups > 0.75 Equity8th Grade Algebra: % of students who passed Algebra by end of 8th grade > 80%8th Grade Algebra: Largest % gap in passing rates by race/ethnic groups < 10 % pts New measureMiddle school: % of students with two or more failed core classes < 15% New measure
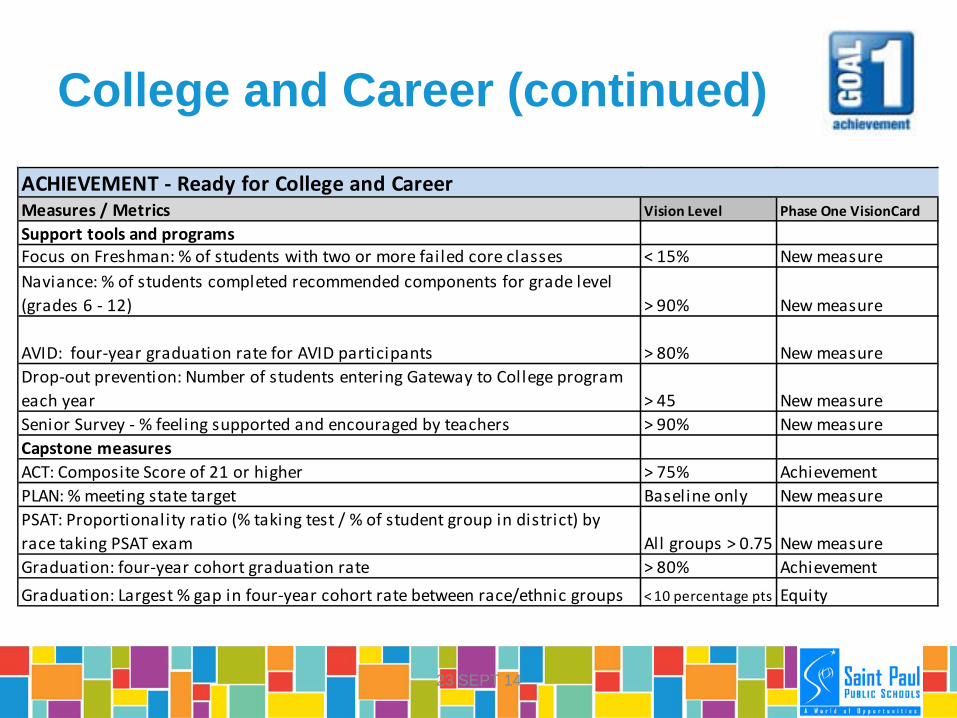
College and Career (continued)
23 SEPT 14
ACHIEVEMENT - Ready for College and CareerMeasures / Metrics Vision Level Phase One VisionCardSupport tools and programsFocus on Freshman: % of students with two or more failed core classes < 15% New measureNaviance: % of students completed recommended components for grade level (grades 6 - 12) > 90% New measure
AVID: four-year graduation rate for AVID participants > 80% New measureDrop-out prevention: Number of students entering Gateway to College program each year > 45 New measureSenior Survey - % feeling supported and encouraged by teachers > 90% New measureCapstone measuresACT: Composite Score of 21 or higher > 75% AchievementPLAN: % meeting state target Baseline only New measurePSAT: Proportionality ratio (% taking test / % of student group in district) by race taking PSAT exam All groups > 0.75 New measureGraduation: four-year cohort graduation rate > 80% AchievementGraduation: Largest % gap in four-year cohort rate between race/ethnic groups < 10 percentage pts Equity
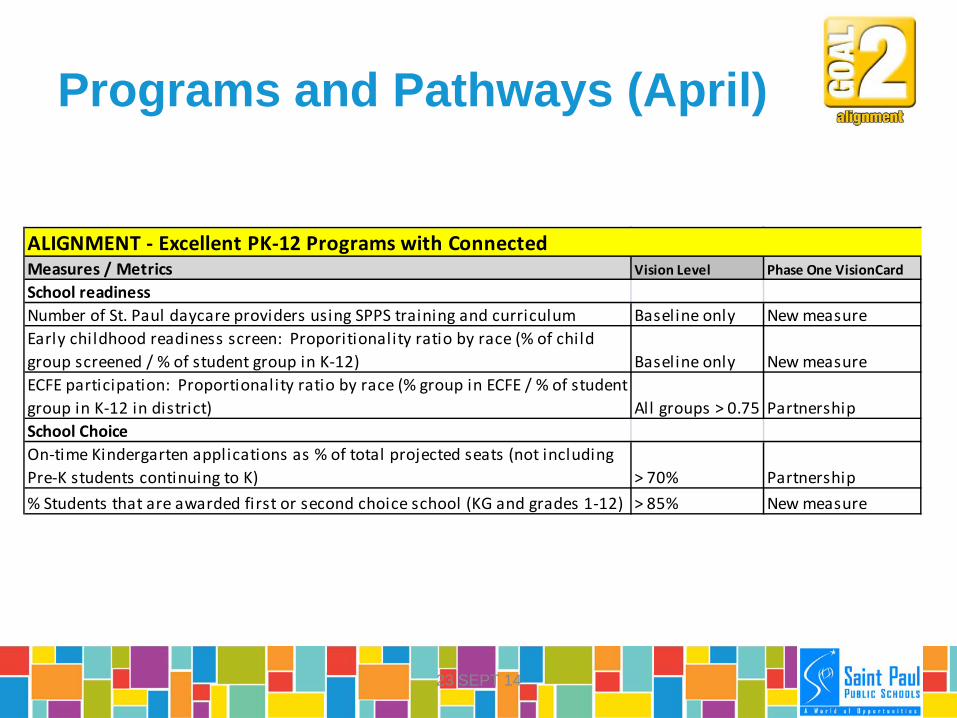
Programs and Pathways (April)
23 SEPT 14
ALIGNMENT - Excellent PK-12 Programs with Connected Measures / Metrics Vision Level Phase One VisionCardSchool readinessNumber of St. Paul daycare providers using SPPS training and curriculum Baseline only New measureEarly childhood readiness screen: Proporitionality ratio by race (% of child group screened / % of student group in K-12) Baseline only New measureECFE participation: Proportionality ratio by race (% group in ECFE / % of student group in K-12 in district) All groups > 0.75 PartnershipSchool Choice On-time Kindergarten applications as % of total projected seats (not including Pre-K students continuing to K) > 70% Partnership% Students that are awarded first or second choice school (KG and grades 1-12) > 85% New measure

Programs and Pathways (Cont.)
23 SEPT 14
ALIGNMENT - Excellent PK-12 Programs with Connected Measures / Metrics Vision Level Phase One VisionCardContinued Enrollment and Engagement% students staying enrolled in SPPS across transition grades (PreK to K, 5th to 6th grade, 8th to 9th grade) > 88%
Resources and Ops Excellence
% students staying enrolled in community or specialized program pathway across transition grades (5th to 6th grade, 8th to 9th grade) > 70% New measureAlternative Education: attendance rate of students enrolled in S Term > 80% New measureAlternative Education: attendance rate of students enrolled in Extended Day Learning (EDL) > 80% New measureExit interview measure: Number of interviews conducted Baseline only New measureExit interview measure: TBD measure based on baseline data collected 2016 measure New measure% of student involved in out-of-school activities Baseline only New measure
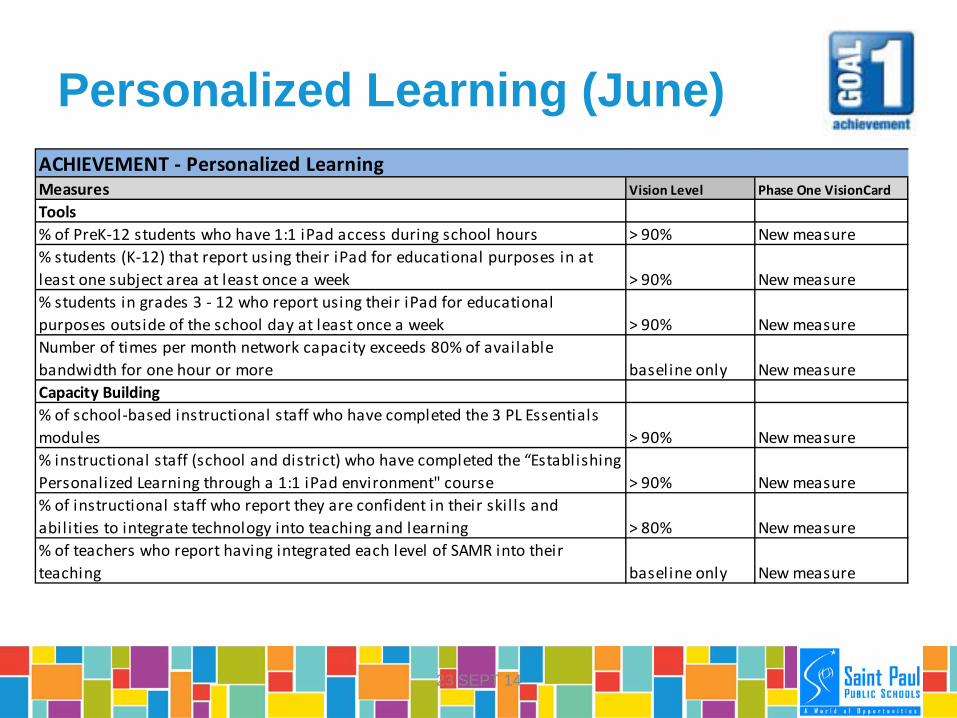
Personalized Learning (June)
23 SEPT 14
ACHIEVEMENT - Personalized LearningMeasures Vision Level Phase One VisionCardTools% of PreK-12 students who have 1:1 iPad access during school hours > 90% New measure% students (K-12) that report using their iPad for educational purposes in at least one subject area at least once a week > 90% New measure% students in grades 3 - 12 who report using their iPad for educational purposes outside of the school day at least once a week > 90% New measureNumber of times per month network capacity exceeds 80% of available bandwidth for one hour or more baseline only New measureCapacity Building% of school-based instructional staff who have completed the 3 PL Essentials modules > 90% New measure% instructional staff (school and district) who have completed the “Establishing Personalized Learning through a 1:1 iPad environment" course > 90% New measure% of instructional staff who report they are confident in their skil ls and abil ities to integrate technology into teaching and learning > 80% New measure% of teachers who report having integrated each level of SAMR into their teaching baseline only New measure
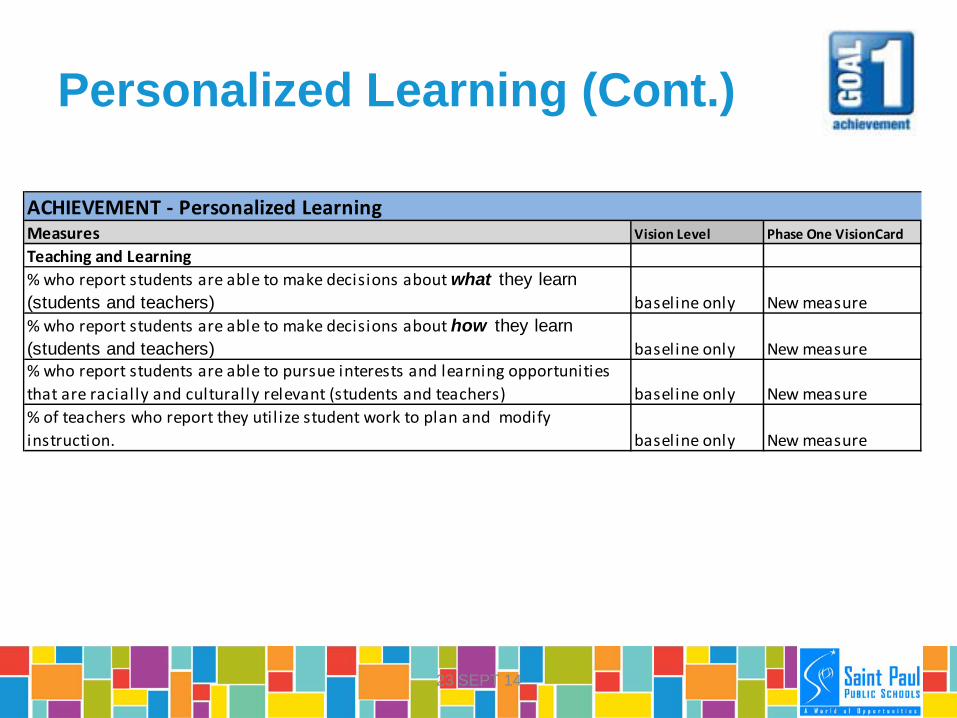
Personalized Learning (Cont.)
23 SEPT 14
ACHIEVEMENT - Personalized LearningMeasures Vision Level Phase One VisionCardTeaching and Learning% who report students are able to make decisions about what they learn (students and teachers) baseline only New measure% who report students are able to make decisions about how they learn (students and teachers) baseline only New measure% who report students are able to pursue interests and learning opportunities that are racially and culturally relevant (students and teachers) baseline only New measure% of teachers who report they util ize student work to plan and modify instruction. baseline only New measure
Systems (August)
23 SEPT 14
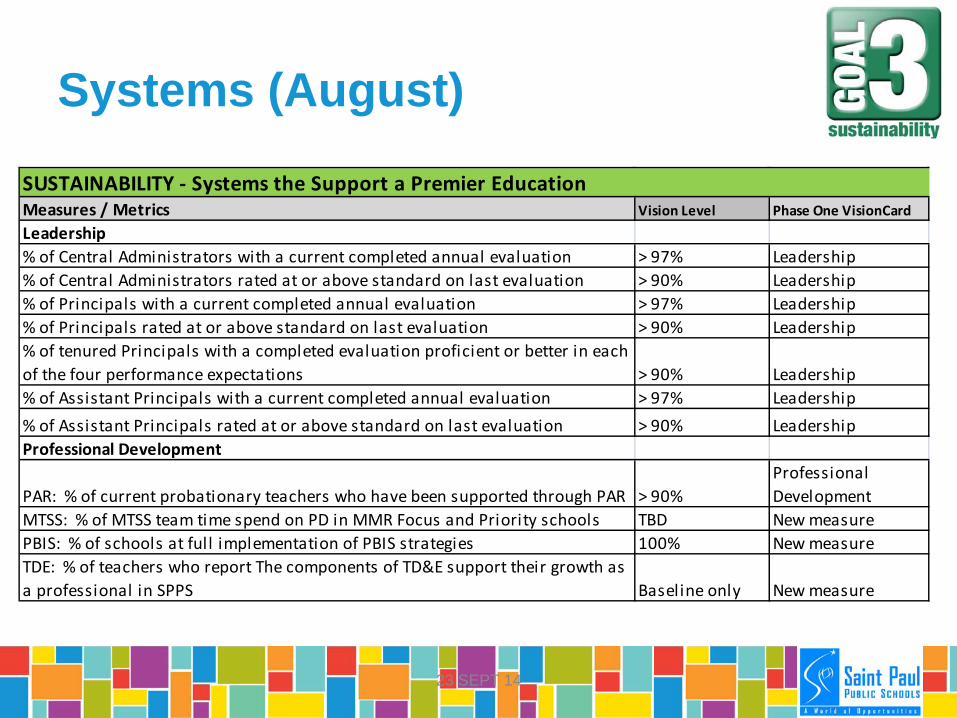
SUSTAINABILITY - Systems the Support a Premier EducationMeasures / Metrics Vision Level Phase One VisionCardLeadership% of Central Administrators with a current completed annual evaluation > 97% Leadership% of Central Administrators rated at or above standard on last evaluation > 90% Leadership% of Principals with a current completed annual evaluation > 97% Leadership% of Principals rated at or above standard on last evaluation > 90% Leadership% of tenured Principals with a completed evaluation proficient or better in each of the four performance expectations > 90% Leadership% of Assistant Principals with a current completed annual evaluation > 97% Leadership% of Assistant Principals rated at or above standard on last evaluation > 90% LeadershipProfessional Development
PAR: % of current probationary teachers who have been supported through PAR > 90% Professional Development
MTSS: % of MTSS team time spend on PD in MMR Focus and Priority schools TBD New measurePBIS: % of schools at full implementation of PBIS strategies 100% New measureTDE: % of teachers who report The components of TD&E support their growth as a professional in SPPS Baseline only New measure
Systems (Continued)
23 SEPT 14
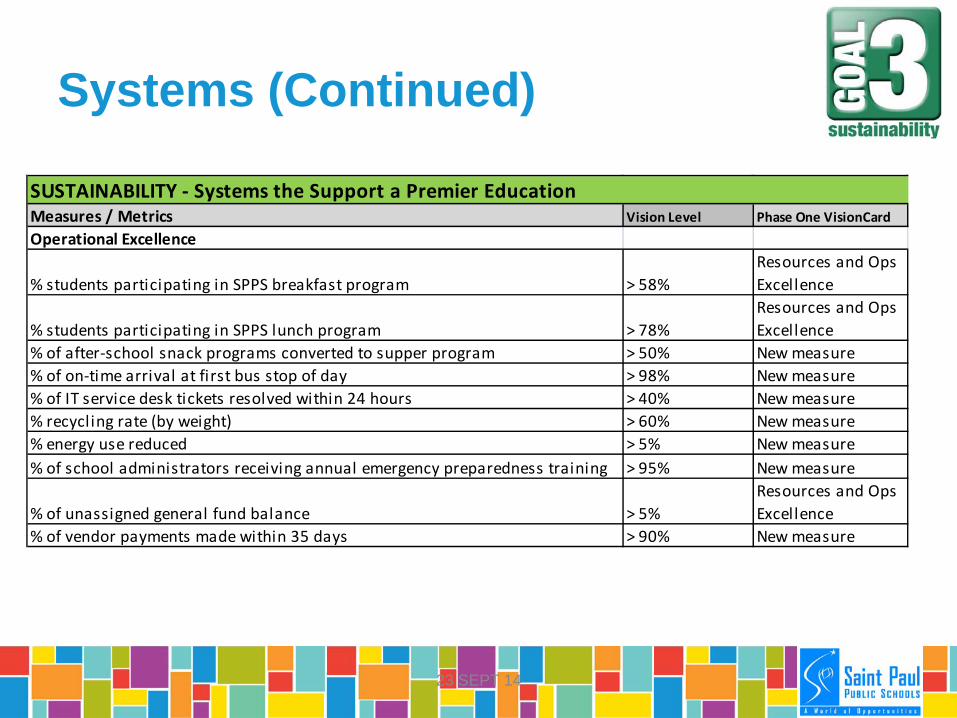
SUSTAINABILITY - Systems the Support a Premier EducationMeasures / Metrics Vision Level Phase One VisionCardOperational Excellence
% students participating in SPPS breakfast program > 58% Resources and Ops Excellence
% students participating in SPPS lunch program > 78% Resources and Ops Excellence
% of after-school snack programs converted to supper program > 50% New measure% of on-time arrival at first bus stop of day > 98% New measure% of IT service desk tickets resolved within 24 hours > 40% New measure% recycling rate (by weight) > 60% New measure% energy use reduced > 5% New measure% of school administrators receiving annual emergency preparedness training > 95% New measure
% of unassigned general fund balance > 5%Resources and Ops Excellence
% of vendor payments made within 35 days > 90% New measure
Questions?
23 SEPT 14