Embed Size (px)
Citation preview

Strong Foundation Expanding Capabilities Outstanding Potential
W E K E E P I N D U S T R Y R U N N I N G

Safe Harbor
2
This presentation contains statements that are forward-looking, as that term is defined by the Securities and Exchange Commission in itsrules, regulations and releases. Applied intends that such forward-looking statements be subject to the safe harbors created thereby.Forward-looking statements are often identified by qualifiers such as “expect,” “outlook,” “guidance,” “will” and derivative or similarexpressions. All forward-looking statements are based on current expectations regarding important risk factors including trends in theindustrial sector of the economy, and other risk factors identified in Applied's most recent periodic report and other filings made with theSecurities and Exchange Commission. Accordingly, actual results may differ materially from those expressed in the forward-lookingstatements, and the making of such statements should not be regarded as a representation by Applied or any other person that theresults expressed therein will be achieved. Applied assumes no obligation to update publicly or revise any forward-looking statements,whether due to new information, or events, or otherwise.
Non-GAAP Financial MeasuresThis presentation sets forth certain non-GAAP financial measures - Adjusted Earnings per Share (EPS), Adjusted Net Income, EBITDA,Adjusted EBITDA, Adjusted EBITDA Margin, Free Cash Flow - which are presented as supplemental disclosures to Net Income, Cashfrom Operations, Total Debt Outstanding, and reported results. Management believes these measures are useful indicators fornormalizing earnings for non-routine items and facilitating effective evaluation of operating performance. A presentation of the mostdirectly comparable GAAP measure and reconciliations of Adjusted EPS, Adjusted Net Income, EBITDA, Adjusted EBITDA, AdjustedEBITDA Margin, and Free Cash Flow are set forth in the appendix to this presentation.

Headquartered in Cleveland, OhioOperating for More Than 97 Years
Company Profile
3Products & Solutions that Enable Our Customers’ Success
We Are One Of The Largest Distributors And Service Providers Of Industrial Motion
And Control Technologies In The World Bearings & Power Transmission
Fluid Power
Specialty Flow Control
Robotics & Machinery Automation
(#2 industry position)
(#1 industry position)
(#1 industry position)
(Emerging provider)
$3.5B Revenue
$330M EBITDA
$2.7B Market Cap
7M+ Product SKUs
Providing Technical Products To Critical Areas of the Industrial Sector Through an Unmatched
Service and Solutions Oriented Model
Note: Revenue and EBITDA based on reported fiscal 2019
3,600+ Customer-Facing
Associates
600+ Service Facilities

Business Overview
4
Industry leader
with proven track record
Well-positionedin large, fragmented market
Strong cash generation
providing business flexibility & ability to
quickly de-lever
Strategicplan for accelerated growth
Driving Shareholder Value Creation viaBusiness Execution | Strategic Investments | Dividends | Share Repurchases
Strong Foundation, Expanding Business Capabilities, Outstanding Potential

Extensive Product & Service Offering for Diverse Industry Requirements
> 80% of sales in critical Bearing, PT, and
Fluid Power & Control segments;
> 50% in response to
critical “break / fix” requirements...
“We Keep Industry Moving!”
600+ Local facilities &
3,600+Customer-facing
associates providing immediate
product / technical support; serving
customers through 5
channels to market
LeadingProvider of
Engineered Fluid Power & Specialty
Flow Control solutions with leading
brands, technical expertise & value-added
services for OEMs & MRO end users
Critical Core Products
Geography & Channels
Customer Return Enhancing Solutions
Fluid Power & Flow Control
Leader
Wide Range of Technical
Services, including: Engineering Design, Assembly, Repair, Technical Support,
Storeroom Inventory Management & other solutions for a diverse
customer base
Enhanced Differentiation
5
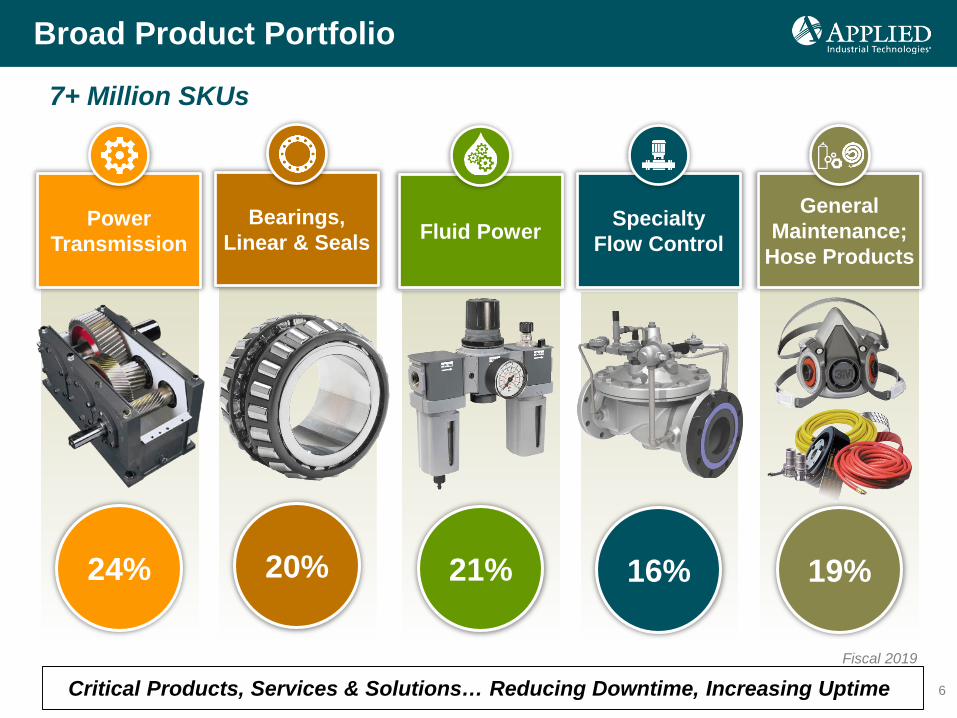
General Maintenance;
Hose Products
19%
Fluid Power
21%
Power Transmission
24%
Bearings, Linear & Seals
20%
Broad Product Portfolio
7+ Million SKUs
Critical Products, Services & Solutions… Reducing Downtime, Increasing Uptime
Specialty Flow Control
16%
6
Fiscal 2019
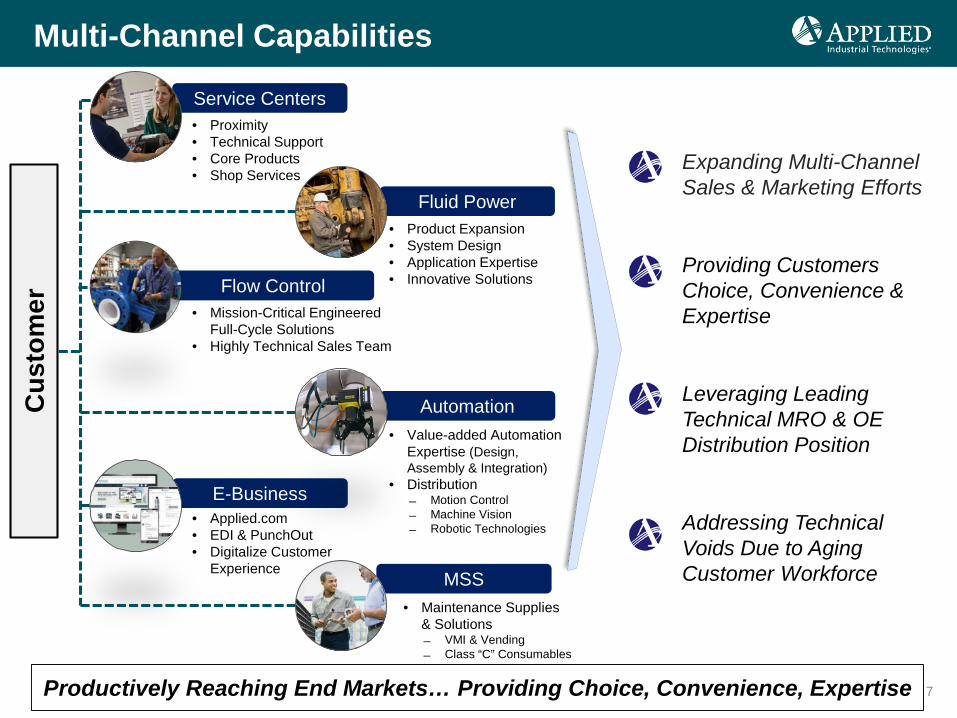
Multi-Channel Capabilities
7
Cus
tom
er
Service Centers
Fluid Power
E-Business
• Proximity• Technical Support• Core Products• Shop Services
• Product Expansion • System Design• Application Expertise• Innovative Solutions
o Expanding Multi-Channel Sales & Marketing Efforts
o Providing Customers Choice, Convenience & Expertise
o Leveraging Leading Technical MRO & OE Distribution Position
o Addressing Technical Voids Due to Aging Customer Workforce
• Applied.com• EDI & PunchOut• Digitalize Customer
Experience
Flow Control• Mission-Critical Engineered
Full-Cycle Solutions• Highly Technical Sales Team
Productively Reaching End Markets… Providing Choice, Convenience, Expertise
• Maintenance Supplies& Solutions̶ VMI & Vending̶ Class “C” Consumables
MSS
Automation• Value-added Automation
Expertise (Design, Assembly & Integration)
• Distribution̶ Motion Control̶ Machine Vision̶ Robotic Technologies

$0
$40
$80
$120
$160
$200
2004 2005 2006 2007 2008 2009 2010 2011 2012 2013 2014 2015 2016 2017 2018 2019
In M
illion
s
Fiscal Year
5-Year Rolling Average
0%
40%
80%
120%
160%
200%
2010 2011 2012 2013 2014 2015 2016 2017 2018Calendar Year
Peer GroupAverage
Historical Free Cash Generation
8Flexibility for Growth, Shareholder Returns & Balance Sheet Utilization Through the Cycle
Annual Free Cash
Free Cash as % of Net Income
Strong and improving free cash through various parts of the cycle
Free cash generation has improved this upcycle, and exceeded peers during the
2015-2016 downcycle
Note: Peer average includes W.W. Grainger, Fastenal, MSC Industrial Direct, and WESCO
Cash Flow Guidance - Fiscal 2020
$ in millions 2019
Cash from Operations $181 $220 - $245 29%
Free Cash Flow $162 $200 - $220 30%% of Net Income 94% 118% - 130%
YoY Chg
2020 Guidance
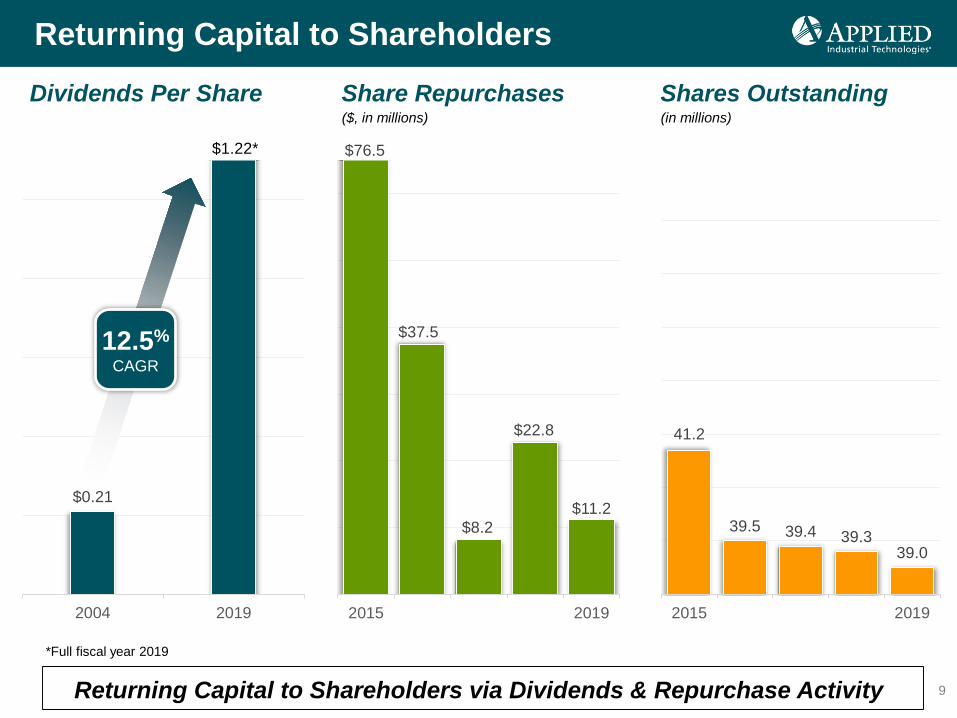
$0.21
2004 2019
Returning Capital to Shareholders
9
Dividends Per Share Share Repurchases Shares Outstanding($, in millions) (in millions)
Returning Capital to Shareholders via Dividends & Repurchase Activity
$37.5
$8.2
$22.8
$11.2
2015 2019
12.5%CAGR
$1.22* $76.5
41.2
39.5 39.4 39.339.0
2015 2019
*Full fiscal year 2019

Q2 FY20 Key Discussion Points
10Margin Execution and Free Cash Generation Balancing Slower Demand
Discussion Point Update DetailEnd-market demand remains subdued; trends weakened in Dec following stabilization in Oct and Nov
20 of top 30 industry verticals down YoY; most notable declines in metals, mining, oil & gas, and machinery verticals
Supplier price increases continue, but at more modest pace Q2 gross margin unchanged YoY
Working capital initiatives and slower demand environment driving strong cash generation
YTD Cash from Operations $105M; Free Cash Flow $93M = 119% of adjusted net income
Solid execution on recent cost actions and ongoing expense discipline in the current soft demand environment
SD&A expense down 3.4% YoY on an organic basis in Q2
Expect tepid demand near term as customers slowly rebound from an evolving trade/production backdrop
Organic daily sales trending down mid-single digits YoY Jan month-to-date
M&A top priority, but opportunistic with debt reduction, dividend increases, and share buybacks
M&A pipeline remains active, increased dividend for 11th time since 2010; cash generation provides ample flexibility
6. Capital Deployment
1. Industrial Demand
2. Inflation & Pricing
3. Cash Generation
4. Cost Control
5. Outlook

Fiscal 2020 Guidance – Updated January 2020
11
FY19Actual
$3.47BSales
FY20Guidance
$3.40B - $3.47B
$4.41*EPS $4.20 - $4.40**
-2% to 0%(-5% to -3% organic)
Assumes Cautious End-Market Outlook, But Strong Cash Generation
-5% to 0%
• FY19 reflects adjusted Non-GAAP EPS – excludes a Net $0.70/sh Non-Cash Intangible Impairment Charge and $0.04/sh of Restructuring Costs• ** FY20 reflects Non-GAAP EPS – excludes $0.02 of Non-Routine expense during Q1 FY20
$162MFree Cash $200M - $220M+23% to +36%
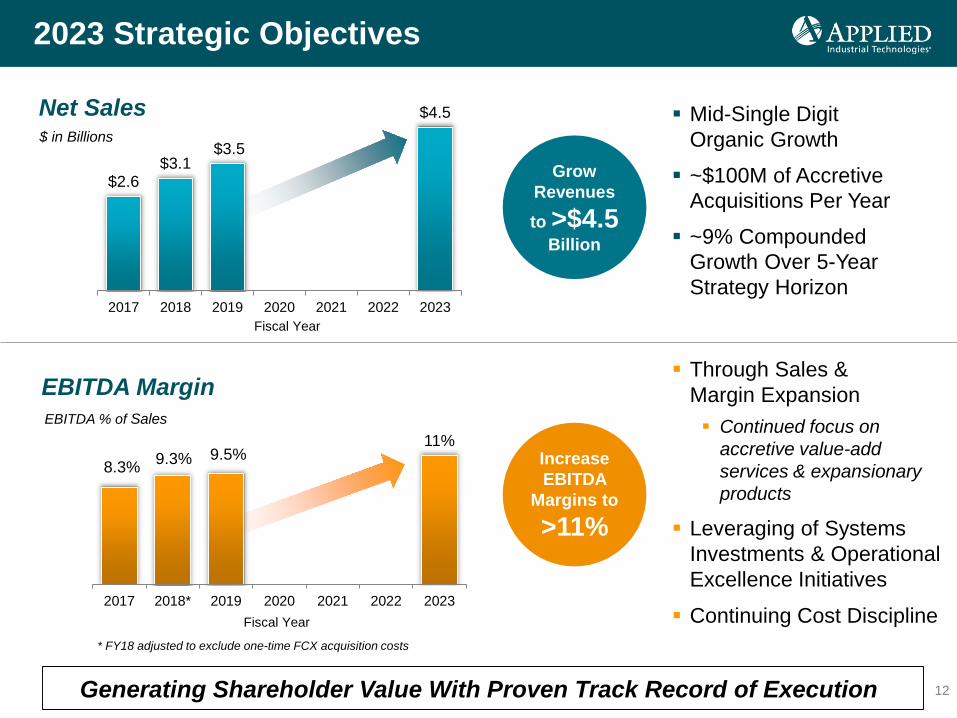
8.3% 9.3% 9.5%11%
2017 2018* 2019 2020 2021 2022 2023
$2.6$3.1
$3.5
$4.5
2017 2018 2019 2020 2021 2022 2023
Net Sales$ in Billions
2023 Strategic Objectives
12Generating Shareholder Value With Proven Track Record of Execution
Grow Revenues to >$4.5
Billion
Increase EBITDA
Margins to >11%
EBITDA MarginEBITDA % of Sales
Mid-Single Digit Organic Growth ~$100M of Accretive
Acquisitions Per Year ~9% Compounded
Growth Over 5-Year Strategy Horizon
Through Sales & Margin Expansion Continued focus on
accretive value-add services & expansionary products
Leveraging of Systems Investments & Operational Excellence Initiatives
Continuing Cost Discipline
Fiscal Year
Fiscal Year
* FY18 adjusted to exclude one-time FCX acquisition costs

Why Invest in Applied
13Strong Foundation, Expanding Capabilities, Outstanding Potential
IndustryLeader
with a long track record
Experiencedmanagement
team
Proven acquirer
well-positioned in large, fragmented
markets
Strong cash generation
Providing business flexibility & ability to
quickly de-leverSteady margin
expansionwith potential
for more
Excellent process controlswith new ERP tools
Clearplan
for accelerated
growth
Commitment to total
shareholder return
through dividend increases, share repurchases and
capital gains
Performance-Focused Distributor with Internal Growth &Margin Initiatives, Strong Cash Generation & Leading Positions
in Technically Critical Markets

Diverse Customer Base
14Diverse Customer Base… Opportunities for Further Market Penetration
General Industry
36%
Industrial Machinery
14%
Metals12%
Oil & Gas8%
Forest Products
7%
Chem /Petrochem
6%
Food8%
Cement & Aggregate 5%
Transportation 4%
Diverse customer accounts
across virtually all industries
Fiscal 2019

Broad Geographic Coverage
15A Leading Market Position & Excellent Geographic Coverage
430+ MRO-Focused Service Centers Supported by 11Distribution Centers Experienced Inside
Sales Associates Dedicated Outside
Sales Associates Overnight Replenishment,
Dedicated Delivery
70+ Fluid Power Sales & Service Facilities Industry Leader in
Fluid Power Solutions Leading Brands,
Value-Added Services
65+ Flow Control Sales & Service Locations Premier Provider in
Process Flow Control Leading Brands,
Value-Added Services
Global Operations24/7SERVICE
FCX location
Applied® fluid power subsidiary
Applied® service center location
Applied® distribution center

Strong Supplier Partners
16Leading Manufacturers… Winning in the Marketplace

MaintenancePRO®
Technical Support
Storeroom Services
Reducer Rebuild Program
Linear Shafting
Hose Assembly
Rubber Services
17
Customer Return Enhancing Capabilities
Increased Productivity
/ Uptime
Reduction of Maintenance
Costs
InventoryOptimization /Management
TechnicalSupport / Training
EnergySavings
Value-Added Services &
QualityProcesses
TransactionCost Savings
Cost Effective Alternatives / Solutions
Services & Solutions that Positively Impact Customers’ Owning / Operating Costs
Documented Value-Added® (DVA®)

Strategic Acquisitions
Growth Strategy
Accelerate Profitable Growth
18Clear Market-Driven Strategy to Accelerate Profitable Growth
Core Growth
Products & Services
Expansion
Fluid Power &
Flow Control
Operational Excellence

Core Growth
19
Driving Profitable Sales Growth
Utilizing the RIGHT
Processes
Reaching the RIGHT
Customers
Driving theRIGHTActions
Supported byRIGHT
Resources
LeadershipMD&P – Talent
Management Standards of
Work Training &
Development
Enhanced Sales Planning Plan Attainment Selling Tools
Retain, Penetrate & Add-Local Accounts-Strategic Accounts
Vertical Markets
Sales Growth-New Accounts-Product Expansion
DocumentedValue-Added®
(DVA®)Margin
Enhancement
Supply Chain & Logistics Suppliers Specialists FP Subs &
MSS Applied.com
Consistent Processes to Generate Above Market Sales & Margin Growth
Having theRIGHT
Associates

Leading Fluid Power & Flow Control Platform
20Leading Engineered Fluid Power & Flow Control Systems Provider
• Largest Provider of Fluid Power and Specialty Flow Control Solutions in North America
• Higher Margin and Faster Growing Area of Applied’s Business
• Focused on Highly Engineered, Technical MRO and OEM Solutions
• Solution Based Growth Strategy Tied to Mission Critical Areas of the Industrial Supply Chain
• Secular Tailwinds from Production & Process Efficiencies, Compliance Standards, Regulations, and Automation Trends
Fluid Power & Flow Control SegmentAnnual Sales
$60M$208M
$487M
$1,020M
FY00 FY07 FY14 FY19
4% 10% 20% 30%% of Sales

Fluid Power 101: Hydraulic and pneumatic technologies using liquids and gases under pressure to transmit power
Advantages: More power in smaller spaces than other forms of power transmissiono Hydraulics (uses liquids): high power-
to-weight ratio, high torque at low speed, reliability
o Pneumatics (uses gases): inexpensive, lightweight, clean, speed, precision
Secular Tailwinds: Electronic control integration, equipment power consumption, plant automation, emissions control, remote monitoring, machining advancements, IIoTintegration
Fluid Power: Overview and Industry Application
21Integral to the Industrial Sector’s Growth and Efficiency
The Leading Provider of an Unmatched Industrial Power & Efficiency Solution
Key Applications Across Market Focus
Off-Highway Mobile Industrial Technology

Fluid Power Platform
• Leading the Industry in Innovative Fluid Power Technology Solutions Through Highly Engineered Systems Design, Assembly, Integration & Value-Added Services
Integrating Electronic Controls for Precision Machine Performance Applying New Technology to Reduce Manufacturers’ Power
Consumption & CO2 Emissions Optimizing Plant & Equipment Efficiency Enabling Automation, Remote Monitoring, Data Analytics
22
Electro-Pneumatic /Hydraulic Control
Systems
Hydraulic Power Units
Hydraulic System & Manifold Design
Electronic Control Integration & Programming
Largest Fluid Power Distributor in the World
CentralizedLubrication
Systems
Fluid Power Repair
Services
Filtration / Purifier Systems
Hydraulic Hose Assembly
Fabrication• 70+ locations in U.S.,
Canada, Mexico & Singapore
• 1,000+ Associates• 350+ Premier
Product Lines
Fluid Power Capabilities… Components, Services & Solutions

System Build & Integration
Fluid Power Position and Value Proposition
23Fluid Power Capabilities… Components, Services & Solutions
We Provide Innovative Fluid Power Solutions Through Unmatched Engineered Systems Design, Assembly,
Integration & Service Capabilities
Service & RepairEngineering & Design
HFX48M (24 configurable inputs / 24 medium-current outputs)
• Customize fluid power systems for a diverse selection of customer applications
• Team of certified engineers and designers
• Utilize CAD software and 3D modeling
• Provide customer consultation, analysis
• Hydraulic Power Units, Cartridge Valve Manifolds, Lubrication & Filtration Systems
• Electronic Control Integration
• Sensor and Robotics Implementation
• Hydraulic Hose Assembly
• Leverage extensive service center network and fluid power specialists
• State-of-the-art repair facilities for pumps, motors, valves and cylinders
• Team of technicians
• Inspection and testing services

Flow Control 101: Products used to manage and control the flow of liquids and gases within an industrial facility or process industry
Product Detail: Includes flow handling (pumps, compressors), flow management (valves, actuators) and specialty equipment (instrumentation, filtration); typically engineered or customized for specific industry application; requires technical aftermarket support
Secular Tailwinds: Process industry infrastructure expansion, more stringent regulatory & compliance standards, customer technical labor constraints, automation, and IIoT
Flow Control: Overview and Industry Application
24Solutions Critical to Process Movement Across the Industrial Sector
Key Applications Across Market Focus
The Leading Provider of Specialty Flow Control Solutions to the Industrial Sector
Chemical OEM & Manufacturing Life Sciences
Food & Beverage Steel & Metals Water Infrastructure

Flow Control Platform
65+ Locations, 1,000+ Associates Focused on Designing, Repairing and Implementing Pumps
Valves and Related Instrumentation Across Mission-CriticalIndustrial Process Systems
Comprehensive Product Offering (100K+ SKUs) Value-Added Service & Repair Capabilities Highly Technical Sales Team
25
Leading Distributor of Specialty Flow Control Products & Services
Leading Solutions Provider for Engineered Flow Control Applications
Hose Fabrication
Compressed Air ServicesValve Repair
Actuator Repair Commissioning Services
Compliance Consulting
Pipe Fabrication
Instrument ServicesValve Actuation
Pump RepairSystems Integration Process Instrumentation

Flow Control Position and Value Proposition
26Leading Solutions Provider for Engineered Flow Control Applications
We Offer the Largest, Most Comprehensive Flow Control Product and Service Portfolio Focused on
Mission-Critical and Full-Cycle Solutions
Drivers of Competitive Position• Unmatched service and repair capabilities• Highly technical sales team• Long-term exclusive supplier relationships• Focused on MRO applications (75% of sales)
Strategic Rationale and Growth Strategy • Enhances leading technical MRO position• Higher margins from high-touch service capabilities• Significant cross-selling opportunity across Applied • “Acquirer of Choice” status with geographic expansion
potential in western U.S.
Providing Everything Along The Industrial Pipe

47,000+ SKUs
in stock
Applied MSSSM… Enhancing Our Industrial Product Offering
Maintenance Supplies & Solutions
A leading value-added National Distributor of C-Class Maintenance, Repair, Operating and Production (MROP) supplies specializing in fasteners; cutting tools & abrasives; paints & chemicals; tube, hose & fittings; electrical; safety; shop supplies and other industrial products serving customers in virtually every industry.
27
Vendor Managed Inventory Specialists
200+Sales & Service
Representatives
4Distribution
Centers
250,000+ SKUs
available

2010
Committed to pursuing opportunities that are aligned with our Strategic Priorities and generate Shareholder Value.
Proven Acquisition Record
28Disciplined, Strategic Acquirer… Accelerating Activity
41 since 2000
Select Acquisition Activity 2000-2019
FPR Group
PAI
Reliance, Knox, Ira
2008
TOPS
First Canadian Operations
GLM (Quebec)
2000
SCS (Ontario)
Reliance
First Mexican Operations
VYCMEX
Enol
SKF Distribution Businesses
2012
U.S. CANADA
2014
RODENSA
2001
2014 GSB /Northam
2015Atlantic Fasteners
2012
2013
S. G. Morris Co.
2016 HUB Industrial Supply
24 since 2012;~$1B
in annualized revenue
MEXICO AU/NZ
2016 Seals Unlimited
Fluid Power
Maintenance Supplies & Solutions
Oil & Gas Power Transmission /Bearings
2014
Rybalsa
2017 Sentinel Fluid Controls
2017 DICOFASA
2014
2005
2008
2003
2007
2018 FCX
Flow Control
Fluid Power Sales
2019MilRoc Distribution / Woodward SteelOlympus Controls
Automation

Deployed HR Information System for:− Recruitment− Performance Management− Career Development− SuccessionIntegrated System Enhancing the Hire-to-Retire Process
Launched Competency-Focused Career Website
Expanding Data Analytics for Selection & Development
Direct, Ongoing Communication to 30,000+ Candidates Through Our Talent Network
Competency-based Career Ladders & Focused Training Framework:− 70% On-the-Job Training− 20% Project-Based Training− 10% Formal Training
Talent Development
29
Strengthening Leadership & Organizational Capabilities
Linking Talent to Execute Business Strategy & Deliver Operating Plans
Management Development & Planning Expanding Organizational Vitality Enhancing Performance & Realizing Potential Creating Succession & Organizational Plans Top Talent – Development & Retention
– Best Team Wins!
MD&PProcess
Anticipate
Attract
RecruitDevelop
Retain

Environmental ● Social ● Governance
30
Integrity Respect Customer Focus
Commitment to Excellence
Accountability Innovation Continuous Improvement
Teamwork
Core Values• Reflect our foundation, present
and future
• Guide actions & reinforce required performance
• Represent collective business & individual responsibilities
Corporate Governance• Diverse, seasoned executives
• Accepted principles & practices
• Integrity & transparency in financial reporting
The value we provide can take many forms … actively advising our customers on how to save energy in their operations and reduce their overall environmental impact; implementing greener practices in our operations; promoting diversity and continuous learning across our organization; and supporting the well-being of our associates and our communities.
Supply Chain Management• Quality brands; world-class
manufacturers
• Supplier Diversity program
• Conflict Minerals reporting
Information & Technology• Established practices &
policies
• Enterprise class systems
• Data protection; cybersecurity
Environmental, Health & Safety• Emphasis & awareness
• Expectations, roles & responsibilities
• Established EHS Policy
Sustainability Initiatives• Comply with government
mandates
• Reduce environmental impact
• Provide eco-friendly products, knowledge & operations
Corporate Citizenship & Human Rights Statement• Equal employment
opportunities; equitable pay
• Continuous learning & training
• Employee wellness assistance; community partner
Demonstrated Commitment to Conducting Business Fairly, Honestly & Ethically

Core Values
31
Motivated and responsible for our actions and results
Honest and trustworthy in
all we do
Integrity
Accountability
Fair and ethical relations with
everyone
Creative in generating value; anticipating and
embracing change for new opportunities
Respect
Innovation
Dedicated to customer needs;
providing value-added
service at every touch point
Committed to becoming better, as individuals and
as a team
Customer Focus
Continuous Improvement
Quality in our products, service
and support
Working together, winning together
Commitment to Excellence
Teamwork
Reflect Our Foundation, Our Present & Our Future

Strong Foundation Expanding Capabilities Outstanding Potential
W E K E E P I N D U S T R Y R U N N I N G
Appendix

Appendix: Reconciliation of Adjusted. Net Income and EPS
33
2019 2018 2019 2018Net Income and Net Income Per Share 143,993$ 141,625$ 3.68$ 3.61$ Adjustments:
FCX one-time costs - 5,128 - 0.13 Canadian intangible impairment 23,109 - 0.59 - Canadian tax valuation allowance 3,785 - 0.10 - Restructuring costs 1,702 - 0.04 -
Adjusted Net Income and Adjusted EPS 172,589$ 146,753$ 4.41$ 3.74$
Net Income Impact Per Share - Diluted Impact Year Ended
June 30,Year Ended
June 30,
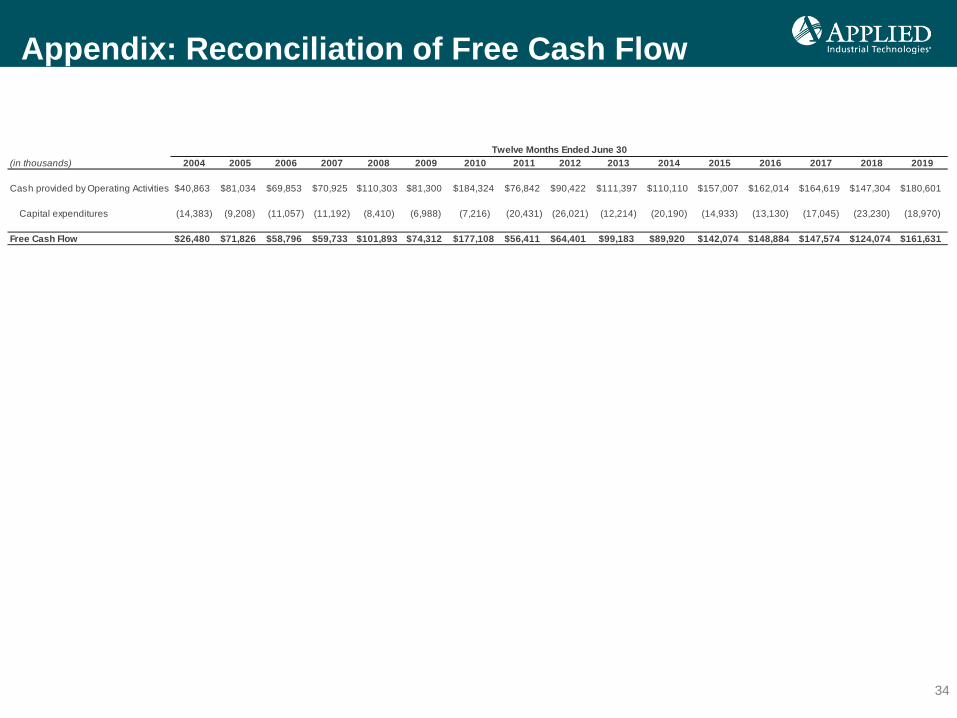
Appendix: Reconciliation of Free Cash Flow
34
(in thousands) 2004 2005 2006 2007 2008 2009 2010 2011 2012 2013 2014 2015 2016 2017 2018 2019
Cash provided by Operating Activities $40,863 $81,034 $69,853 $70,925 $110,303 $81,300 $184,324 $76,842 $90,422 $111,397 $110,110 $157,007 $162,014 $164,619 $147,304 $180,601
Capital expenditures (14,383) (9,208) (11,057) (11,192) (8,410) (6,988) (7,216) (20,431) (26,021) (12,214) (20,190) (14,933) (13,130) (17,045) (23,230) (18,970)
Free Cash Flow $26,480 $71,826 $58,796 $59,733 $101,893 $74,312 $177,108 $56,411 $64,401 $99,183 $89,920 $142,074 $148,884 $147,574 $124,074 $161,631
Twelve Months Ended June 30

Appendix: Reconciliation of EBITDA, Adjusted EBITDA, and Adjusted EBITDA Margin
35
(in thousands) 2011 2012 2013 2014 2015 2016 2017 2018 2019
Net Income $96,759 $108,779 $118,149 $112,821 $115,484 $29,577 $133,910 $141,625 $143,993Interest expense, net 1,668 (9) 165 249 7,869 8,763 8,541 23,485 40,188Income tax expense 56,129 58,047 59,516 53,441 60,387 49,401 33,056 63,093 50,488Depreciation and amortization of property 11,234 11,236 12,501 13,977 16,578 15,966 15,306 17,798 20,236Amortization of intangibles (including impairment) 11,382 11,465 13,233 14,023 25,797 90,374 24,371 32,065 73,477
EBITDA $177,172 $189,518 $203,564 $194,511 $226,115 $194,081 $215,184 $278,066 $328,382Non-routine costs 6,123 2,300
Adjusted EBITDA $177,172 $189,518 $203,564 $194,511 $226,115 $194,081 $215,184 $284,189 $330,682
Sales $2,212,849 $2,375,445 $2,462,171 $2,459,878 $2,751,561 $2,519,428 $2,593,746 $3,073,274 $3,472,739
Adjusted EBITDA Margin 8.0% 8.0% 8.3% 7.9% 8.2% 7.7% 8.3% 9.2% 9.5%
Twelve Months Ended June 30