Embed Size (px)
Citation preview
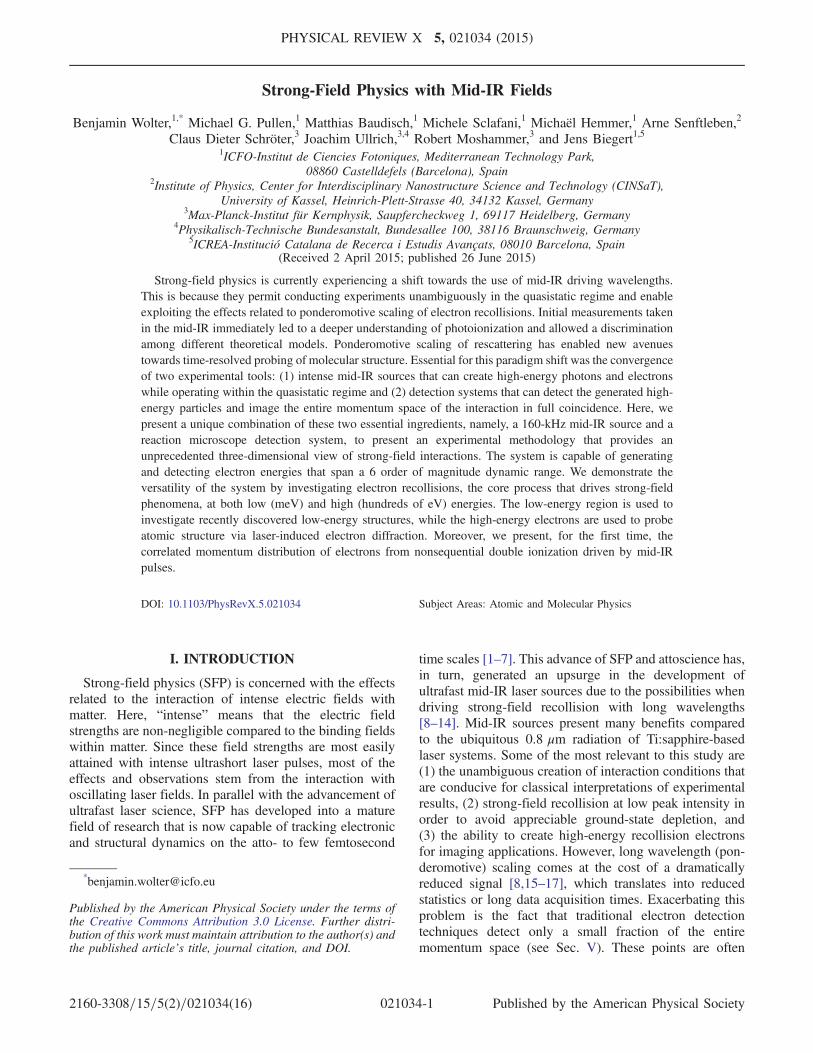
Strong-Field Physics with Mid-IR Fields
Benjamin Wolter,1,* Michael G. Pullen,1 Matthias Baudisch,1 Michele Sclafani,1 Michaël Hemmer,1 Arne Senftleben,2
Claus Dieter Schröter,3 Joachim Ullrich,3,4 Robert Moshammer,3 and Jens Biegert1,51ICFO-Institut de Ciencies Fotoniques, Mediterranean Technology Park,
08860 Castelldefels (Barcelona), Spain2Institute of Physics, Center for Interdisciplinary Nanostructure Science and Technology (CINSaT),
University of Kassel, Heinrich-Plett-Strasse 40, 34132 Kassel, Germany3Max-Planck-Institut für Kernphysik, Saupfercheckweg 1, 69117 Heidelberg, Germany
4Physikalisch-Technische Bundesanstalt, Bundesallee 100, 38116 Braunschweig, Germany5ICREA-Institució Catalana de Recerca i Estudis Avançats, 08010 Barcelona, Spain
(Received 2 April 2015; published 26 June 2015)
Strong-field physics is currently experiencing a shift towards the use of mid-IR driving wavelengths.This is because they permit conducting experiments unambiguously in the quasistatic regime and enableexploiting the effects related to ponderomotive scaling of electron recollisions. Initial measurements takenin the mid-IR immediately led to a deeper understanding of photoionization and allowed a discriminationamong different theoretical models. Ponderomotive scaling of rescattering has enabled new avenuestowards time-resolved probing of molecular structure. Essential for this paradigm shift was the convergenceof two experimental tools: (1) intense mid-IR sources that can create high-energy photons and electronswhile operating within the quasistatic regime and (2) detection systems that can detect the generated high-energy particles and image the entire momentum space of the interaction in full coincidence. Here, wepresent a unique combination of these two essential ingredients, namely, a 160-kHz mid-IR source and areaction microscope detection system, to present an experimental methodology that provides anunprecedented three-dimensional view of strong-field interactions. The system is capable of generatingand detecting electron energies that span a 6 order of magnitude dynamic range. We demonstrate theversatility of the system by investigating electron recollisions, the core process that drives strong-fieldphenomena, at both low (meV) and high (hundreds of eV) energies. The low-energy region is used toinvestigate recently discovered low-energy structures, while the high-energy electrons are used to probeatomic structure via laser-induced electron diffraction. Moreover, we present, for the first time, thecorrelated momentum distribution of electrons from nonsequential double ionization driven by mid-IRpulses.
DOI: 10.1103/PhysRevX.5.021034 Subject Areas: Atomic and Molecular Physics
I. INTRODUCTION
Strong-field physics (SFP) is concerned with the effectsrelated to the interaction of intense electric fields withmatter. Here, “intense” means that the electric fieldstrengths are non-negligible compared to the binding fieldswithin matter. Since these field strengths are most easilyattained with intense ultrashort laser pulses, most of theeffects and observations stem from the interaction withoscillating laser fields. In parallel with the advancement ofultrafast laser science, SFP has developed into a maturefield of research that is now capable of tracking electronicand structural dynamics on the atto- to few femtosecond
time scales [1–7]. This advance of SFP and attoscience has,in turn, generated an upsurge in the development ofultrafast mid-IR laser sources due to the possibilities whendriving strong-field recollision with long wavelengths[8–14]. Mid-IR sources present many benefits comparedto the ubiquitous 0.8 μm radiation of Ti:sapphire-basedlaser systems. Some of the most relevant to this study are(1) the unambiguous creation of interaction conditions thatare conducive for classical interpretations of experimentalresults, (2) strong-field recollision at low peak intensity inorder to avoid appreciable ground-state depletion, and(3) the ability to create high-energy recollision electronsfor imaging applications. However, long wavelength (pon-deromotive) scaling comes at the cost of a dramaticallyreduced signal [8,15–17], which translates into reducedstatistics or long data acquisition times. Exacerbating thisproblem is the fact that traditional electron detectiontechniques detect only a small fraction of the entiremomentum space (see Sec. V). These points are often
Published by the American Physical Society under the terms ofthe Creative Commons Attribution 3.0 License. Further distri-bution of this work must maintain attribution to the author(s) andthe published article’s title, journal citation, and DOI.
PHYSICAL REVIEW X 5, 021034 (2015)
2160-3308=15=5(2)=021034(16) 021034-1 Published by the American Physical Society
overlooked, but they present a significant roadblock to theadvancement of SFP. This is because experiments willeventually become untenable due to the required acquis-ition times exceeding the stability of the apparatus. Here,we present a methodology that overcomes these limitationsby combining two tools that are perfectly suited for mid-IRSFP: (1) an intense and high repetition rate optical para-metric chirped pulse amplification (OPCPA)-based mid-IR(3.1 μm) source [18] that creates ionization conditions deepin the quasistatic (QS) (tunneling) regime and that cangenerate electron energies above 1 keV and (2) a reactionmicroscope (ReMi) detection system that can image the 3Dmomentum space of the interaction in full particle coinci-dence. The apparatus is capable of generating and detectingelectron energies that span a 6 orders of magnitude rangeand thus provides an unprecedented 3D view of strong-fieldinteractions.The paper is structured as follows. We first discuss
relevant aspects of strong-field ionization (SFI) (Sec. II)when scaling the driving wavelength of the radiation andnot the peak intensity; the metric we use to describe suchscaling is the adiabaticity, or Keldysh, parameter (Sec. III).Next, the validity of the dipole approximation is discussedin the context of wavelength scaling (Sec. IV). We thenhighlight the critical role of detection systems with specificattention paid to molecular targets and the importance ofmeasuring all ionization fragments in full coincidence(Sec. V). We proceed to demonstrating the versatility ofour methodology (presented in detail in Sec. VI) byinvestigating electron recollision (Sec. VII) at the extremesof a 550-eV-wide electron spectrum. We highlight twocases: In Sec. VII A, the low-energy part of the spectrum(meV) reveals the recently discovered low-energy featuresfor both single and double ions, while in Sec. VII B, thehigh-energy portion (hundreds of eV) is used to extractaccurate differential cross sections (DCSs) over a widerange of recollision energies using laser-induced electrondiffraction (LIED). Finally, we discuss our methodology inthe context of the current status and expected direction ofSFP research.
II. STRONG-FIELD IONIZATION
Strong-field interactions can be qualitatively understoodby the semiclassical recollision model [19], whichdescribes the motion of an electron after strong-field-induced tunnel ionization. According to this model, theelectron is emitted close to the peak of the oscillating,linearly polarized laser electric field, after which it accel-erates within the field before recolliding with its parent ionroughly three-quarters of an optical cycle later. In therecollision model, returning electron trajectories can bedistinguished as long and short depending on the time theyspend accelerating in the field before returning to theirparent ion. The maximum return energy of Er;max ¼3.17UP (UP being the ponderomotive energy experienced
by the detached electron) is achieved when the electron isemitted at a phase of about 17° after the field maximum.This results in the electron returning to the ion at about255°. Electrons emitted before 17° return after 255° and areconsidered long trajectories, while those emitted after 17°return before 255° and are considered short trajectories. Themodel typically (1) neglects depletion of the ground stateand Stark shifts, (2) assumes that only one electronparticipates, and (3) omits the influence of the Coulombfield on the electron’s trajectory. Even with such assump-tions, numerous potential outcomes of the electron-ionrecollision can be qualitatively described: the returningelectron may recombine with the ion and emit a high-energy photon in a coherent frequency up-conversionprocess known as high-harmonic generation, it may inelas-tically scatter off the ion and cause nonsequential double(or multiple) ionization (NSDI), or it may elastically scatteroff the ion, resulting in a final kinetic energy Ekin that isdetermined by the energy Er at which it returns to theparent ion and the angle θr at which it scatters. The inset ofFig. 1 shows the dependence of Ekin on Er at θr ¼ 180° forlong and short electron trajectories. A framework to modelthe ionization step of such strong-field interactions wasproposed in Keldysh’s seminal work from 1965 [20]. Thedimensionless adiabaticity parameter γ that is commonlyused to describe the interaction conditions was introduced:
γ ¼ffiffiffiffiffiffiffiffiffiIP2UP
s∼
1ffiffiI
pλ: ð1Þ
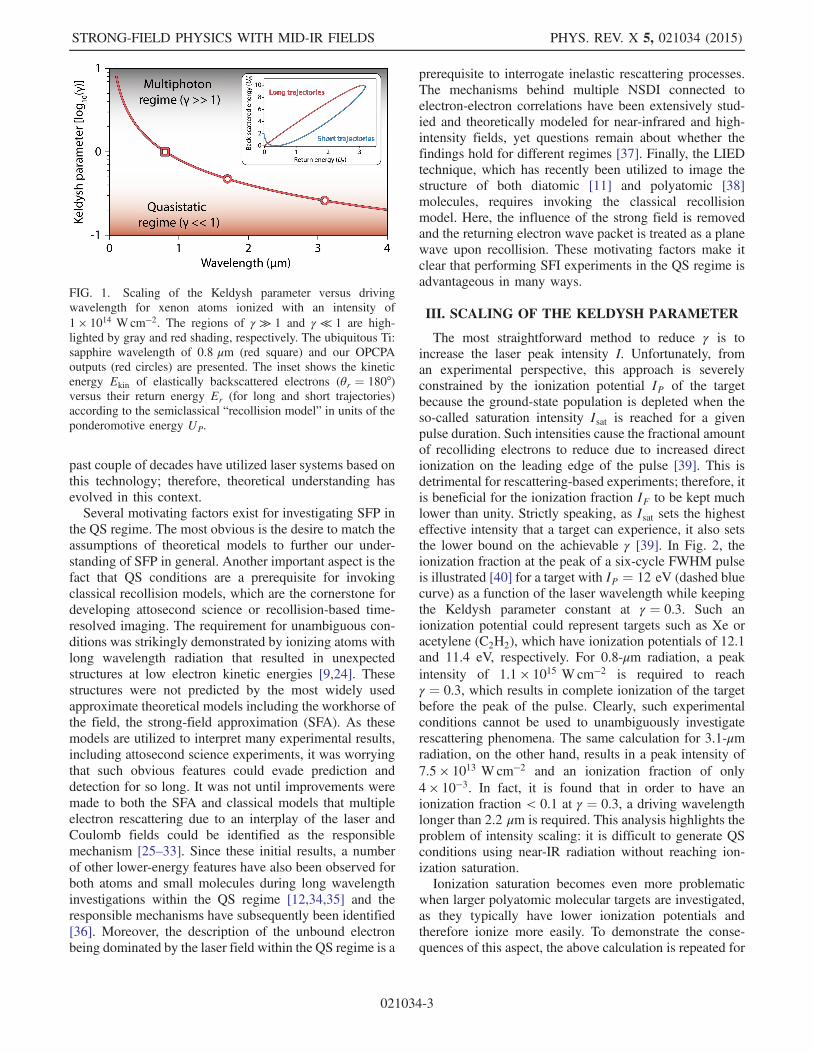
The Keldysh parameter γ is a function of the ponder-omotive energy UP ∝ Iλ2, where I is the laser peakintensity and λ is the central driving wavelength. Thescaling of the Keldysh parameter as a function of thedriving wavelength is presented in Fig. 1 for a typical peakintensity of 1 × 10¹⁴ Wcm−2 interacting with a xenon (Xe)atom (IP ≈ 12 eV). A rapid decrease of the Keldyshparameter can clearly be observed as the driving wave-length is increased from the visible (λ≲ 0.8 μm) throughthe near-IR (0.8 μm ≤ λ ≤ 3 μm) and into the mid-IR(λ ≥ 3 μm) [21]. The circular data points represent thewavelengths that are generated by our OPCPA source. Theconventional interpretation of γ is as a metric to distinguishbetween the extremes of two different descriptions ofionization: (1) the so-called “multiphoton” regime, whereγ ≫ 1 and experimental electron kinetic energy distribu-tions generally feature peaked behavior, and (2) the so-called “tunneling,” or to be precise “quasistatic,” regime,where γ ≪ 1 and the distributions typically exhibit con-tinuous behavior. The case when γ ≈ 1 is known as the“transition regime” and ionization is characterized byfeatures from both multiphoton and QS ionization [22].The square data point in Fig. 1 is within this region and itserves as a reference for the ubiquitous Ti:sapphire radi-ation at 0.8 μm. Most SFI experiments performed in the
BENJAMIN WOLTER et al. PHYS. REV. X 5, 021034 (2015)
021034-2
past couple of decades have utilized laser systems based onthis technology; therefore, theoretical understanding hasevolved in this context.Several motivating factors exist for investigating SFP in
the QS regime. The most obvious is the desire to match theassumptions of theoretical models to further our under-standing of SFP in general. Another important aspect is thefact that QS conditions are a prerequisite for invokingclassical recollision models, which are the cornerstone fordeveloping attosecond science or recollision-based time-resolved imaging. The requirement for unambiguous con-ditions was strikingly demonstrated by ionizing atoms withlong wavelength radiation that resulted in unexpectedstructures at low electron kinetic energies [9,24]. Thesestructures were not predicted by the most widely usedapproximate theoretical models including the workhorse ofthe field, the strong-field approximation (SFA). As thesemodels are utilized to interpret many experimental results,including attosecond science experiments, it was worryingthat such obvious features could evade prediction anddetection for so long. It was not until improvements weremade to both the SFA and classical models that multipleelectron rescattering due to an interplay of the laser andCoulomb fields could be identified as the responsiblemechanism [25–33]. Since these initial results, a numberof other lower-energy features have also been observed forboth atoms and small molecules during long wavelengthinvestigations within the QS regime [12,34,35] and theresponsible mechanisms have subsequently been identified[36]. Moreover, the description of the unbound electronbeing dominated by the laser field within the QS regime is a
prerequisite to interrogate inelastic rescattering processes.The mechanisms behind multiple NSDI connected toelectron-electron correlations have been extensively stud-ied and theoretically modeled for near-infrared and high-intensity fields, yet questions remain about whether thefindings hold for different regimes [37]. Finally, the LIEDtechnique, which has recently been utilized to image thestructure of both diatomic [11] and polyatomic [38]molecules, requires invoking the classical recollisionmodel. Here, the influence of the strong field is removedand the returning electron wave packet is treated as a planewave upon recollision. These motivating factors make itclear that performing SFI experiments in the QS regime isadvantageous in many ways.
III. SCALING OF THE KELDYSH PARAMETER
The most straightforward method to reduce γ is toincrease the laser peak intensity I. Unfortunately, froman experimental perspective, this approach is severelyconstrained by the ionization potential IP of the targetbecause the ground-state population is depleted when theso-called saturation intensity Isat is reached for a givenpulse duration. Such intensities cause the fractional amountof recolliding electrons to reduce due to increased directionization on the leading edge of the pulse [39]. This isdetrimental for rescattering-based experiments; therefore, itis beneficial for the ionization fraction IF to be kept muchlower than unity. Strictly speaking, as Isat sets the highesteffective intensity that a target can experience, it also setsthe lower bound on the achievable γ [39]. In Fig. 2, theionization fraction at the peak of a six-cycle FWHM pulseis illustrated [40] for a target with IP ¼ 12 eV (dashed bluecurve) as a function of the laser wavelength while keepingthe Keldysh parameter constant at γ ¼ 0.3. Such anionization potential could represent targets such as Xe oracetylene (C2H2), which have ionization potentials of 12.1and 11.4 eV, respectively. For 0.8-μm radiation, a peakintensity of 1.1 × 10¹⁵ Wcm−2 is required to reachγ ¼ 0.3, which results in complete ionization of the targetbefore the peak of the pulse. Clearly, such experimentalconditions cannot be used to unambiguously investigaterescattering phenomena. The same calculation for 3.1-μmradiation, on the other hand, results in a peak intensity of7.5 × 1013 Wcm−2 and an ionization fraction of only4 × 10−3. In fact, it is found that in order to have anionization fraction < 0.1 at γ ¼ 0.3, a driving wavelengthlonger than 2.2 μm is required. This analysis highlights theproblem of intensity scaling: it is difficult to generate QSconditions using near-IR radiation without reaching ion-ization saturation.Ionization saturation becomes even more problematic
when larger polyatomic molecular targets are investigated,as they typically have lower ionization potentials andtherefore ionize more easily. To demonstrate the conse-quences of this aspect, the above calculation is repeated for
FIG. 1. Scaling of the Keldysh parameter versus drivingwavelength for xenon atoms ionized with an intensity of1 × 1014 Wcm−2. The regions of γ ≫ 1 and γ ≪ 1 are high-lighted by gray and red shading, respectively. The ubiquitous Ti:sapphire wavelength of 0.8 μm (red square) and our OPCPAoutputs (red circles) are presented. The inset shows the kineticenergy Ekin of elastically backscattered electrons (θr ¼ 180°)versus their return energy Er (for long and short trajectories)according to the semiclassical “recollision model” in units of theponderomotive energy UP.
STRONG-FIELD PHYSICS WITH MID-IR FIELDS PHYS. REV. X 5, 021034 (2015)
021034-3
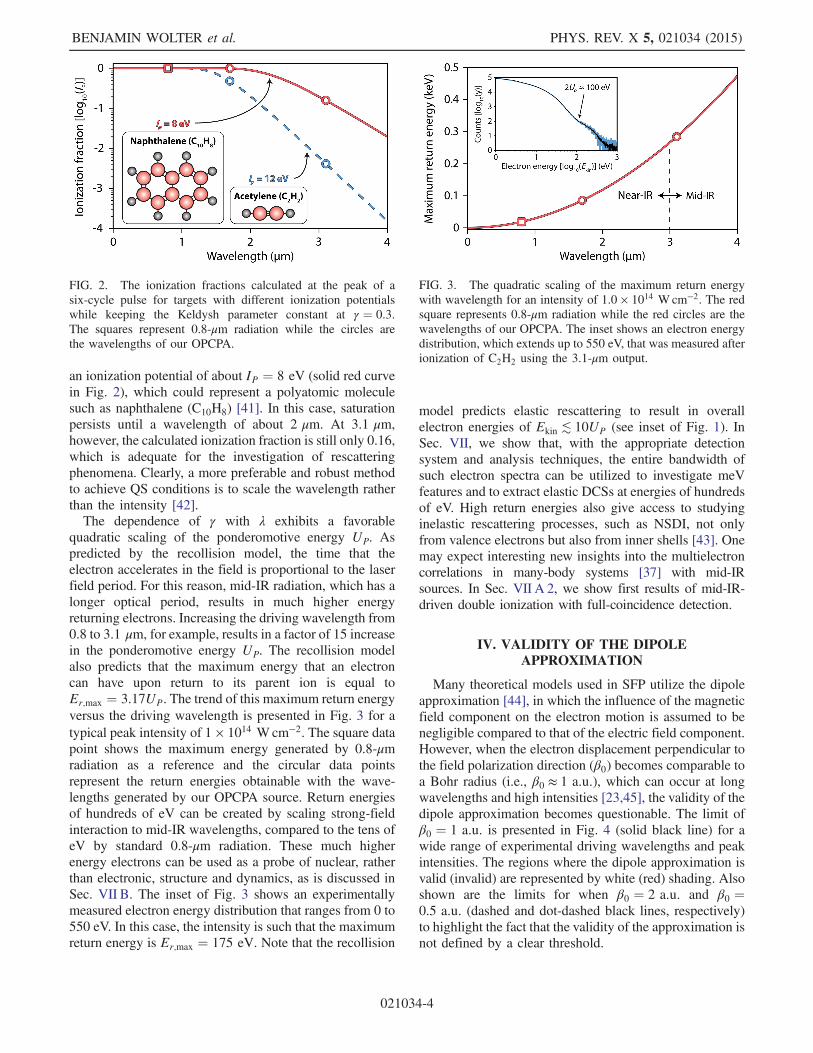
an ionization potential of about IP ¼ 8 eV (solid red curvein Fig. 2), which could represent a polyatomic moleculesuch as naphthalene (C10H8) [41]. In this case, saturationpersists until a wavelength of about 2 μm. At 3.1 μm,however, the calculated ionization fraction is still only 0.16,which is adequate for the investigation of rescatteringphenomena. Clearly, a more preferable and robust methodto achieve QS conditions is to scale the wavelength ratherthan the intensity [42].The dependence of γ with λ exhibits a favorable
quadratic scaling of the ponderomotive energy UP. Aspredicted by the recollision model, the time that theelectron accelerates in the field is proportional to the laserfield period. For this reason, mid-IR radiation, which has alonger optical period, results in much higher energyreturning electrons. Increasing the driving wavelength from0.8 to 3.1 μm, for example, results in a factor of 15 increasein the ponderomotive energy UP. The recollision modelalso predicts that the maximum energy that an electroncan have upon return to its parent ion is equal toEr;max ¼ 3.17UP. The trend of this maximum return energyversus the driving wavelength is presented in Fig. 3 for atypical peak intensity of 1 × 10¹⁴ Wcm−2. The square datapoint shows the maximum energy generated by 0.8-μmradiation as a reference and the circular data pointsrepresent the return energies obtainable with the wave-lengths generated by our OPCPA source. Return energiesof hundreds of eV can be created by scaling strong-fieldinteraction to mid-IR wavelengths, compared to the tens ofeV by standard 0.8-μm radiation. These much higherenergy electrons can be used as a probe of nuclear, ratherthan electronic, structure and dynamics, as is discussed inSec. VII B. The inset of Fig. 3 shows an experimentallymeasured electron energy distribution that ranges from 0 to550 eV. In this case, the intensity is such that the maximumreturn energy is Er;max ¼ 175 eV. Note that the recollision
model predicts elastic rescattering to result in overallelectron energies of Ekin ≲ 10UP (see inset of Fig. 1). InSec. VII, we show that, with the appropriate detectionsystem and analysis techniques, the entire bandwidth ofsuch electron spectra can be utilized to investigate meVfeatures and to extract elastic DCSs at energies of hundredsof eV. High return energies also give access to studyinginelastic rescattering processes, such as NSDI, not onlyfrom valence electrons but also from inner shells [43]. Onemay expect interesting new insights into the multielectroncorrelations in many-body systems [37] with mid-IRsources. In Sec. VII A 2, we show first results of mid-IR-driven double ionization with full-coincidence detection.
IV. VALIDITY OF THE DIPOLEAPPROXIMATION
Many theoretical models used in SFP utilize the dipoleapproximation [44], in which the influence of the magneticfield component on the electron motion is assumed to benegligible compared to that of the electric field component.However, when the electron displacement perpendicular tothe field polarization direction (β0) becomes comparable toa Bohr radius (i.e., β0 ≈ 1 a:u:), which can occur at longwavelengths and high intensities [23,45], the validity of thedipole approximation becomes questionable. The limit ofβ0 ¼ 1 a:u: is presented in Fig. 4 (solid black line) for awide range of experimental driving wavelengths and peakintensities. The regions where the dipole approximation isvalid (invalid) are represented by white (red) shading. Alsoshown are the limits for when β0 ¼ 2 a:u: and β0 ¼0.5 a:u: (dashed and dot-dashed black lines, respectively)to highlight the fact that the validity of the approximation isnot defined by a clear threshold.
FIG. 2. The ionization fractions calculated at the peak of asix-cycle pulse for targets with different ionization potentialswhile keeping the Keldysh parameter constant at γ ¼ 0.3.The squares represent 0.8-μm radiation while the circles arethe wavelengths of our OPCPA.
FIG. 3. The quadratic scaling of the maximum return energywith wavelength for an intensity of 1.0 × 10¹⁴ Wcm−2. The redsquare represents 0.8-μm radiation while the red circles are thewavelengths of our OPCPA. The inset shows an electron energydistribution, which extends up to 550 eV, that was measured afterionization of C2H2 using the 3.1-μm output.
BENJAMIN WOLTER et al. PHYS. REV. X 5, 021034 (2015)
021034-4
Most nonrelativistic experiments at the standard 0.8-μmwavelength are performed at intensities between 5 × 10¹³
and 5 × 10¹⁵ W cm−2 (red squares and dotted line), wherethe dipole approximation is generally assumed to be valid.At longer wavelengths, the limit of β0 ¼ 1 a:u: is reached atlower intensities, and a number of experimental measure-ments with conditions near or above this limit have alreadybeen reported in the literature (Ref. [8], green down-triangle; Ref [11], purple diamonds; Ref. [46], orangeupwards triangle; Ref. [47], white cross). Also shown arethe intensity ranges over which the 1.7 and 3.1 μm of ourOPCPA can be utilized for SFI experiments. The largeintensity range of our 3.1-μm radiation opens up thepossibility for investigations across the β0 < 1 a:u: → β0 >1 a:u: transition.
V. ON THE IMPORTANCE OF THEDETECTION SYSTEM
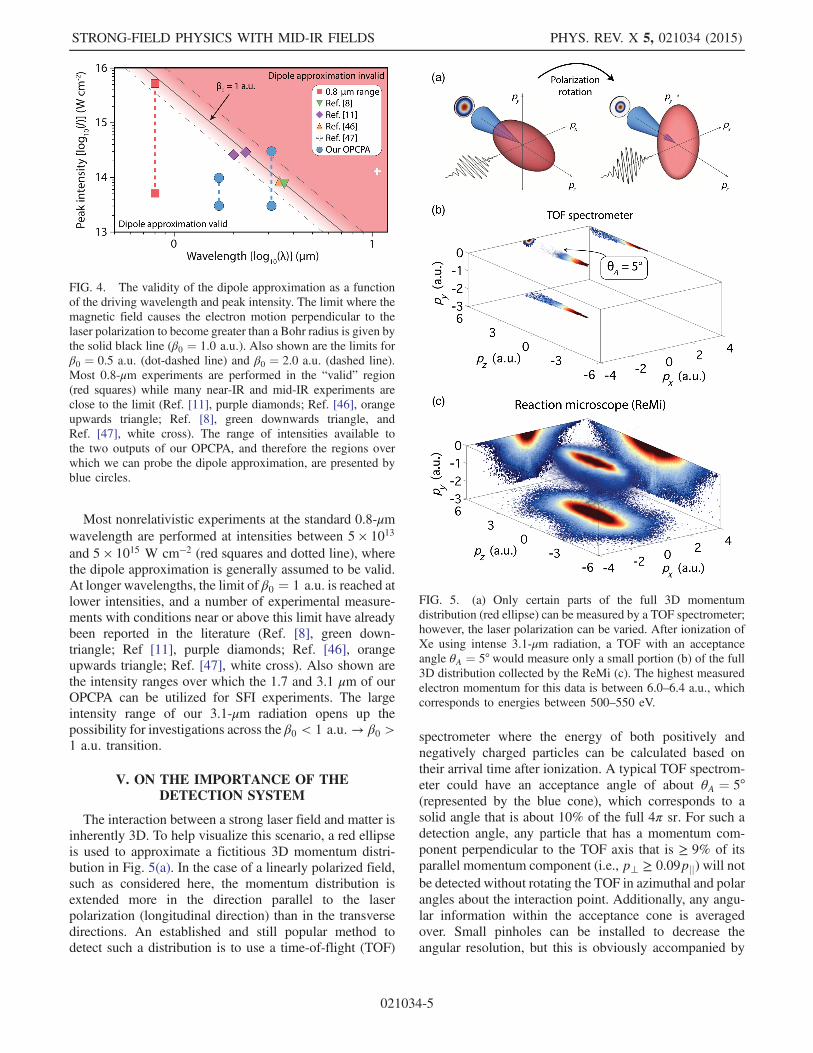
The interaction between a strong laser field and matter isinherently 3D. To help visualize this scenario, a red ellipseis used to approximate a fictitious 3D momentum distri-bution in Fig. 5(a). In the case of a linearly polarized field,such as considered here, the momentum distribution isextended more in the direction parallel to the laserpolarization (longitudinal direction) than in the transversedirections. An established and still popular method todetect such a distribution is to use a time-of-flight (TOF)
spectrometer where the energy of both positively andnegatively charged particles can be calculated based ontheir arrival time after ionization. A typical TOF spectrom-eter could have an acceptance angle of about θA ¼ 5°(represented by the blue cone), which corresponds to asolid angle that is about 10% of the full 4π sr. For such adetection angle, any particle that has a momentum com-ponent perpendicular to the TOF axis that is ≥ 9% of itsparallel momentum component (i.e., p⊥ ≥ 0.09pjj) will notbe detected without rotating the TOF in azimuthal and polarangles about the interaction point. Additionally, any angu-lar information within the acceptance cone is averagedover. Small pinholes can be installed to decrease theangular resolution, but this is obviously accompanied by
FIG. 4. The validity of the dipole approximation as a functionof the driving wavelength and peak intensity. The limit where themagnetic field causes the electron motion perpendicular to thelaser polarization to become greater than a Bohr radius is given bythe solid black line (β0 ¼ 1.0 a:u:). Also shown are the limits forβ0 ¼ 0.5 a:u: (dot-dashed line) and β0 ¼ 2.0 a:u: (dashed line).Most 0.8-μm experiments are performed in the “valid” region(red squares) while many near-IR and mid-IR experiments areclose to the limit (Ref. [11], purple diamonds; Ref. [46], orangeupwards triangle; Ref. [8], green downwards triangle, andRef. [47], white cross). The range of intensities available tothe two outputs of our OPCPA, and therefore the regions overwhich we can probe the dipole approximation, are presented byblue circles.
FIG. 5. (a) Only certain parts of the full 3D momentumdistribution (red ellipse) can be measured by a TOF spectrometer;however, the laser polarization can be varied. After ionization ofXe using intense 3.1-μm radiation, a TOF with an acceptanceangle θA ¼ 5° would measure only a small portion (b) of the full3D distribution collected by the ReMi (c). The highest measuredelectron momentum for this data is between 6.0–6.4 a.u., whichcorresponds to energies between 500–550 eV.
STRONG-FIELD PHYSICS WITH MID-IR FIELDS PHYS. REV. X 5, 021034 (2015)
021034-5
a dramatic drop in count rate. The laser polarization can becontinuously adjusted between parallel and perpendicular[as presented in Fig. 5(a)] to the detector axis so thatdifferent parts of the momentum cloud can be observed. Ifthis rotation is performed numerous times, a 2D “conicalcut” through the momentum distribution can be obtained[11]; however, the integration times required using thismethod are long. Recent investigations in the QS regimethat detected low electron energy (<1 eV) structures,where p⊥ ≈ pjj [12,34–36], have highlighted the limita-tions of the TOF measurement technique, as without the aidof high-resolution 3D detection, these structures evadedobservation.An example of the portion of a 3D momentum distri-
bution that would be measured by a TOF spectrometer ispresented in Fig. 5(b). These data are produced by takingthe actual 3D momentum distribution, which is measuredby our ReMi after the ionization of Xe gas using intense3.1-μm radiation [Fig. 5(c)], and keeping only those countsthat are found within the θA ¼ 5° cone around the laserpolarization direction. Only the regions of the distributionswith py < 0 are shown in order to highlight the highercounts near the origin. The projections of the three spatialdimensions are also presented for both measurementmethods. The color bar is valid for the 3D cloud but notfor the projections, as they have each been individuallyrescaled. Clearly, a TOF spectrometer collects only a smallportion of the full electron momentum distribution.Specifically, and as mentioned above, any electrons thathave a large transverse component are not detected. In fact,for an acceptance angle of θA ¼ 5°, only about 2% of allelectrons are collected. The lack of signal in the TOFprojections further highlights these issues. We note that theReMi and TOF spectrometer distributions should becompared in a qualitative manner only as it is possiblefor TOF spectrometers to have a different detection angle,to be utilized in a stereo configuration, and to be used forvarying laser polarization directions.In addition to momentum distributions being intrinsi-
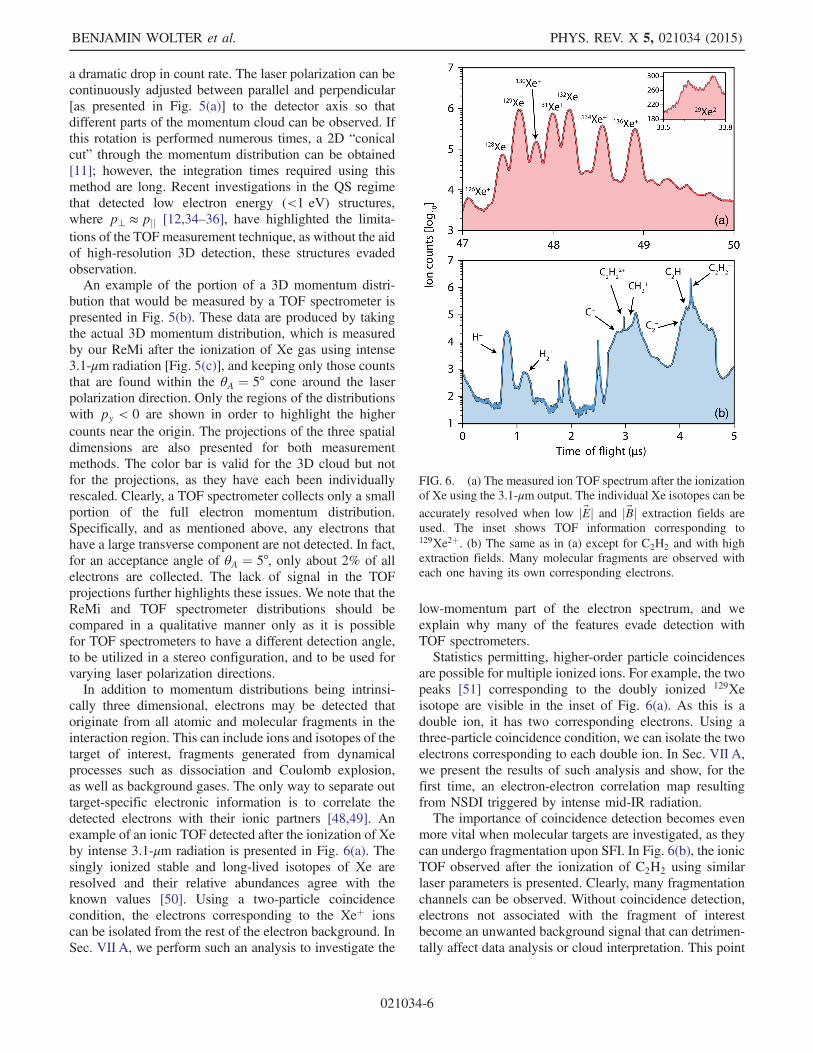
cally three dimensional, electrons may be detected thatoriginate from all atomic and molecular fragments in theinteraction region. This can include ions and isotopes of thetarget of interest, fragments generated from dynamicalprocesses such as dissociation and Coulomb explosion,as well as background gases. The only way to separate outtarget-specific electronic information is to correlate thedetected electrons with their ionic partners [48,49]. Anexample of an ionic TOF detected after the ionization of Xeby intense 3.1-μm radiation is presented in Fig. 6(a). Thesingly ionized stable and long-lived isotopes of Xe areresolved and their relative abundances agree with theknown values [50]. Using a two-particle coincidencecondition, the electrons corresponding to the Xeþ ionscan be isolated from the rest of the electron background. InSec. VII A, we perform such an analysis to investigate the
low-momentum part of the electron spectrum, and weexplain why many of the features evade detection withTOF spectrometers.Statistics permitting, higher-order particle coincidences
are possible for multiple ionized ions. For example, the twopeaks [51] corresponding to the doubly ionized 129Xeisotope are visible in the inset of Fig. 6(a). As this is adouble ion, it has two corresponding electrons. Using athree-particle coincidence condition, we can isolate the twoelectrons corresponding to each double ion. In Sec. VII A,we present the results of such analysis and show, for thefirst time, an electron-electron correlation map resultingfrom NSDI triggered by intense mid-IR radiation.The importance of coincidence detection becomes even
more vital when molecular targets are investigated, as theycan undergo fragmentation upon SFI. In Fig. 6(b), the ionicTOF observed after the ionization of C2H2 using similarlaser parameters is presented. Clearly, many fragmentationchannels can be observed. Without coincidence detection,electrons not associated with the fragment of interestbecome an unwanted background signal that can detrimen-tally affect data analysis or cloud interpretation. This point
FIG. 6. (a) The measured ion TOF spectrum after the ionizationof Xe using the 3.1-μm output. The individual Xe isotopes can be
accurately resolved when low j~Ej and j~Bj extraction fields areused. The inset shows TOF information corresponding to129Xe2þ. (b) The same as in (a) except for C2H2 and with highextraction fields. Many molecular fragments are observed witheach one having its own corresponding electrons.
BENJAMIN WOLTER et al. PHYS. REV. X 5, 021034 (2015)
021034-6
is discussed in detail with respect to performing LIEDon polyatomic molecular targets in Ref. [38]. As SFPcontinues to progress from atomic and simple homonucleardiatomics towards more complex molecular targets, coinci-dence detection will become increasingly vital to extractspecific information within a myriad of competingprocesses.There are currently two experimental methods that can
achieve 3D detection in full coincidence. First, velocitymap imaging (VMI) [52–54] is a technique where particleswith the same mass and initial velocity are mapped onto thesame position on a 2D detector. A VMI can provideelectronic and ionic kinetic energies and angular distribu-tions with full 4π-sr collection while achieving energyresolutions on the percent level [55]. Most VMI appara-tuses require cylindrical symmetry to transform thedetected projection into a slice through the center of the3D momentum distribution; however, in special implemen-tations, this is not necessarily the case [56–59]. Moreover,VMIs typically operate only in full particle coincidence inspecial circumstances [60] rather than by default. Thesecond option is to use a ReMi [61–63], as is the casein this article, which is based on cold-target recoil ionmomentum spectroscopy (COLTRIMS). The arrival timeand position of all charged particles is detected in order toreconstruct the full 3D doubly differential cross section ofthe interaction. The operating principle of a ReMi isdescribed in Sec. VI A.
VI. EXPERIMENTAL SYSTEM
Our experimental system consists of a high repetitionrate mid-IR OPCPA source with long-term power andcarrier-envelope phase (CEP) stability in combination witha ReMi detection system. The mid-IR source providesconditions in the QS regime while the ReMi images theentire 3D momentum distribution of the interaction in full
coincidence. Overall, the system is currently capable ofcreating and detecting electron energies over a 6 order ofmagnitude range and it provides the perfect conditions toinvestigate and utilize mid-IR SFI in the QS regime.
A. Reaction microscope (ReMi)
The functional principle of the ReMi detection system isas follows. The target gas is supersonically expanded intothe ultrahigh vacuum (10−11 mbar without gas load) and issubsequently skimmed in two successive stages beforereaching the ReMi. The expansion of the molecular beamthus features a decreased thermal motion of the particles,and internal temperatures to the milikelvin range are
feasible. Upon SFI, a combination of static electric (~E)
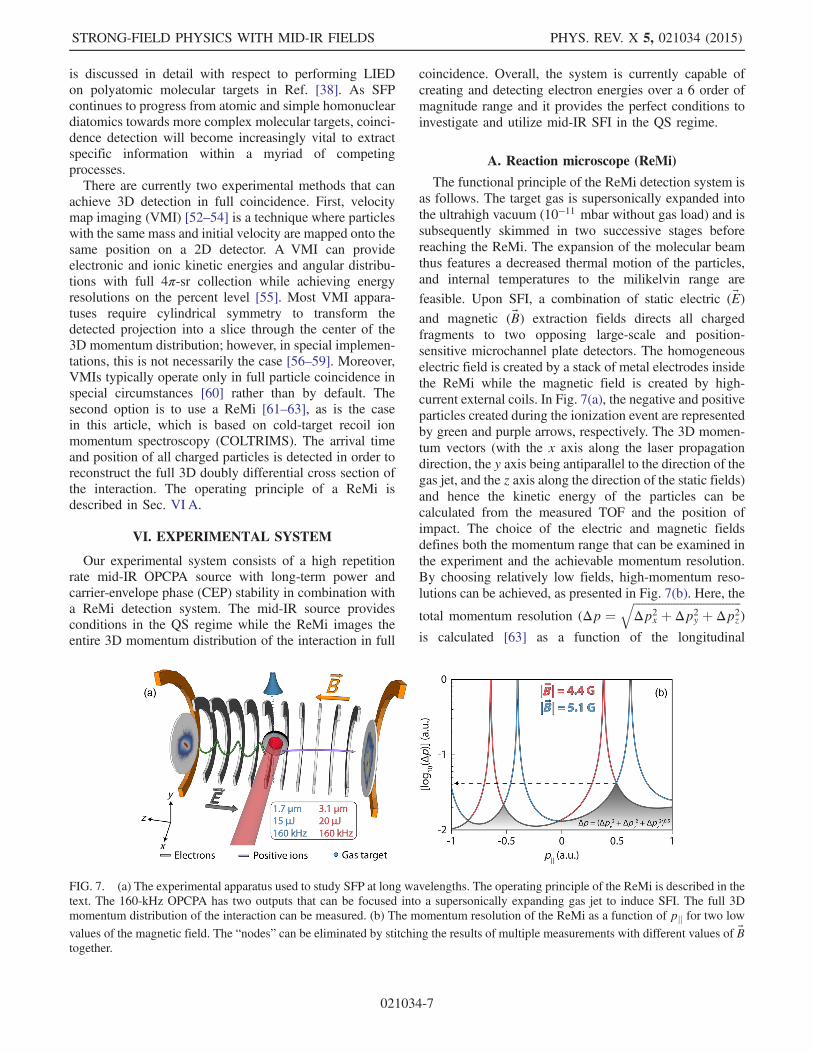
and magnetic (~B) extraction fields directs all chargedfragments to two opposing large-scale and position-sensitive microchannel plate detectors. The homogeneouselectric field is created by a stack of metal electrodes insidethe ReMi while the magnetic field is created by high-current external coils. In Fig. 7(a), the negative and positiveparticles created during the ionization event are representedby green and purple arrows, respectively. The 3D momen-tum vectors (with the x axis along the laser propagationdirection, the y axis being antiparallel to the direction of thegas jet, and the z axis along the direction of the static fields)and hence the kinetic energy of the particles can becalculated from the measured TOF and the position ofimpact. The choice of the electric and magnetic fieldsdefines both the momentum range that can be examined inthe experiment and the achievable momentum resolution.By choosing relatively low fields, high-momentum reso-lutions can be achieved, as presented in Fig. 7(b). Here, the
total momentum resolution (Δp ¼ffiffiffiffiffiffiffiffiffiffiffiffiffiffiffiffiffiffiffiffiffiffiffiffiffiffiffiffiffiffiffiffiffiffiffiffiffiΔp2
x þ Δp2y þ Δp2
z
q)
is calculated [63] as a function of the longitudinal
FIG. 7. (a) The experimental apparatus used to study SFP at long wavelengths. The operating principle of the ReMi is described in thetext. The 160-kHz OPCPA has two outputs that can be focused into a supersonically expanding gas jet to induce SFI. The full 3Dmomentum distribution of the interaction can be measured. (b) The momentum resolution of the ReMi as a function of pjj for two low
values of the magnetic field. The “nodes” can be eliminated by stitching the results of multiple measurements with different values of ~Btogether.
STRONG-FIELD PHYSICS WITH MID-IR FIELDS PHYS. REV. X 5, 021034 (2015)
021034-7
momentum (pjj ¼ pz) while j~Ej ¼ 1.3 V=cm is kept con-
stant for both j~Bj ¼ 4.4 G (red curve) and j~Bj ¼ 5.1 G(blue curve). The observed discontinuities for both mag-netic fields are due to electrons with integer multiples of thecyclotron frequency hitting the same position on thedetector. While these so-called “nodes” seem inconvenientat first, they turn out to be useful as they serve as anaccurate and straightforward measurement of j~Bj.Moreover, is it easy to remove these regions by takingtwo measurements with different magnetic fields andcombining the areas with the highest momentum resolu-tion. The results of this technique are represented by thegray shaded region in Fig. 7(b), where Δp ≤ 5 × 10⁻² a:u:for all values of pjj. In terms of energy, these valuescorrespond to detection resolutions of several meV. It isstraightforward to further reduce the electric and magneticfields to achieve even better momentum resolution. Bychoosing higher values of j~Ej and j~Bj, it is possible to detectrescattered electrons with kinetic energies of up to 1 keV.The magnitude of ~E controls the maximum detectablelongitudinal electron momentum component (pjj) while the
maximum transverse component (p⊥ ¼ffiffiffiffiffiffiffiffiffiffiffiffiffiffiffiffip2x þ p2
y
q) is
dependent on the magnitude of ~B. Figure 5(c) presents alogarithmically scaled 3D momentum distribution detectedunder these high static field conditions (j~Ej ¼ 51 V=cmand j~Bj ¼ 39 G), where electron energies of ≥ 500 eV aredetected.
B. Mid-IR OPCPA system
The OPCPA system [64,65] is based on a multicolorfiber front end with difference frequency generation (DFG)between the two outputs supplying broadband mid-IRpulses at 3.1-μm center wavelength. The DFG stage is acrucial component of the OPCPA as it provides passiveCEP stability optically. The intrinsic CEP stabilization is adecisive advantage over electronically stabilized systems,which manifests itself in unsurpassed long-time stability ofour system. The system provides both 1.7- and 3.1-μmradiation. At 3.1 μm, pulse durations below three opticalcycles FWHM are achieved (2.9 optical cycles) [66]. The3.1-μm output is passively CEP stable, and a stability of250 mrad rms over 11 min has been measured [64].Without any additional effort, pulse durations of 100 fsare reached for the signal at 1.7 μm. The 15- and 20-μJpulse energies of the 1.7- and 3.1-μm wavelengths,respectively, are focused with an on-axis, gold-coatedparaboloid (focal length of 50 mm) into the gas jet ofthe ReMi. Intensities in the range of 1014 Wcm−2 arereadily achieved for both wavelengths.
C. Importance of repetition rate and stability
A major challenge in performing SFP experiments withlong wavelength sources is quantum diffusion [67]. Here,
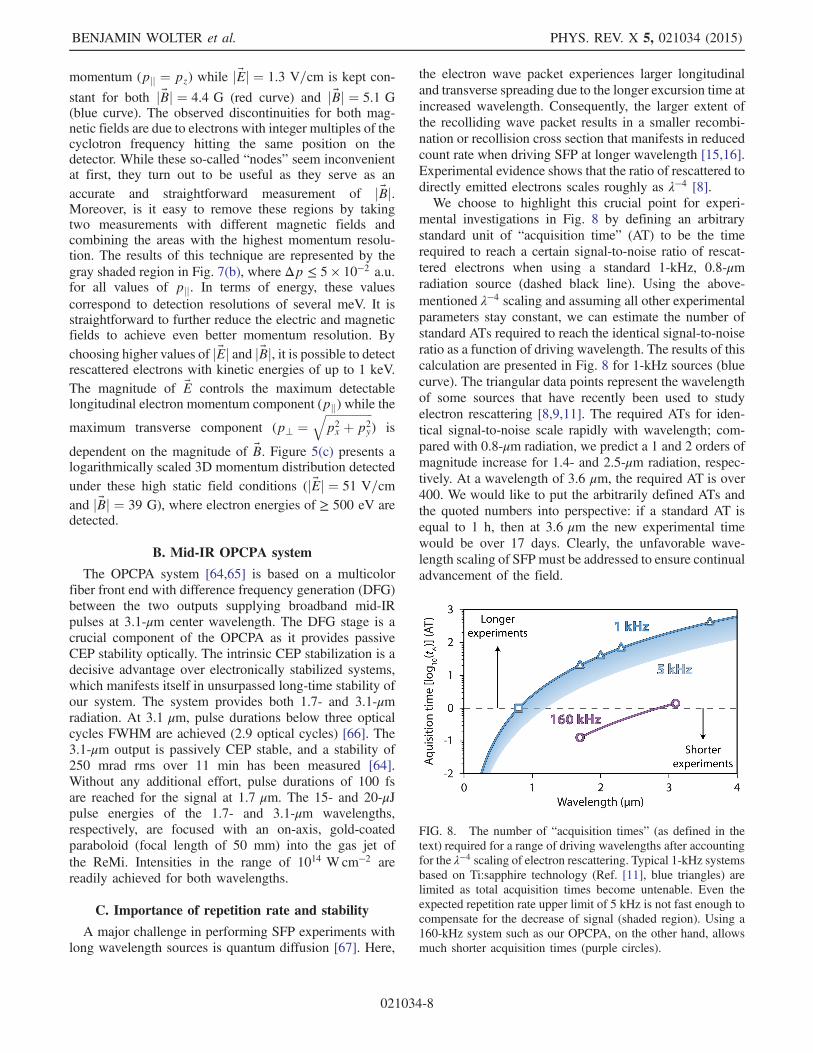
the electron wave packet experiences larger longitudinaland transverse spreading due to the longer excursion time atincreased wavelength. Consequently, the larger extent ofthe recolliding wave packet results in a smaller recombi-nation or recollision cross section that manifests in reducedcount rate when driving SFP at longer wavelength [15,16].Experimental evidence shows that the ratio of rescattered todirectly emitted electrons scales roughly as λ−4 [8].We choose to highlight this crucial point for experi-
mental investigations in Fig. 8 by defining an arbitrarystandard unit of “acquisition time” (AT) to be the timerequired to reach a certain signal-to-noise ratio of rescat-tered electrons when using a standard 1-kHz, 0.8-μmradiation source (dashed black line). Using the above-mentioned λ−4 scaling and assuming all other experimentalparameters stay constant, we can estimate the number ofstandard ATs required to reach the identical signal-to-noiseratio as a function of driving wavelength. The results of thiscalculation are presented in Fig. 8 for 1-kHz sources (bluecurve). The triangular data points represent the wavelengthof some sources that have recently been used to studyelectron rescattering [8,9,11]. The required ATs for iden-tical signal-to-noise scale rapidly with wavelength; com-pared with 0.8-μm radiation, we predict a 1 and 2 orders ofmagnitude increase for 1.4- and 2.5-μm radiation, respec-tively. At a wavelength of 3.6 μm, the required AT is over400. We would like to put the arbitrarily defined ATs andthe quoted numbers into perspective: if a standard AT isequal to 1 h, then at 3.6 μm the new experimental timewould be over 17 days. Clearly, the unfavorable wave-length scaling of SFP must be addressed to ensure continualadvancement of the field.
FIG. 8. The number of “acquisition times” (as defined in thetext) required for a range of driving wavelengths after accountingfor the λ−4 scaling of electron rescattering. Typical 1-kHz systemsbased on Ti:sapphire technology (Ref. [11], blue triangles) arelimited as total acquisition times become untenable. Even theexpected repetition rate upper limit of 5 kHz is not fast enough tocompensate for the decrease of signal (shaded region). Using a160-kHz system such as our OPCPA, on the other hand, allowsmuch shorter acquisition times (purple circles).
BENJAMIN WOLTER et al. PHYS. REV. X 5, 021034 (2015)
021034-8

An obvious solution to this dilemma is to increase therepetition rate of the driving laser [18,68–70]. Ti:sapphire-based laser systems [8,9,24,34] are typically limited to afew kHz; the range of acquisition times that can realisticallybe achieved with such systems is represented by the blueshaded region in Fig. 8. Mid-IR sources at much higherrepetition rates, i.e., above several tens of kilohertz, can berealized with a range of techniques, but so far only OPCPAhas provided a viable solution. High average power fiberlaser sources are operational, but additional down-conversion into the mid-IR carries a dramatic penalty inpulse energy. Moreover, few-cycle durations and CEPstability are not possible with such sources at highintensities (≥ 1013 W cm−2). Another approach could bebased on passive enhancement cavities [71] in the mid-IR,but such apparatuses are extremely challenging and are yetto be implemented outside of the near-IR. Because of thesetechnical problems, we devised a radically new platform[18,68] (summarized in Sec. VI B) that leverages theconcept of OPCPA to achieve the combination of mid-IR wavelength (3.1 μm), few-cycle pulse duration (≥ 2.9cycles) with CEP stability, SFP relevant intensities(≤ 3 × 10¹⁴ Wcm−1), 160 kHz repetition rate, and long-term stability (≤ 1% rms over 4.5 h) [65]. Additionally,parasitically generated wavelengths, such as the OPCPA’ssignal at 1.7 μm, can be used for further frequency down-conversion. When the above acquisition time analysis isapplied to the two wavelengths of our system, it is foundthat the required experimental time is actually an order ofmagnitude less than a standard AT for 1.7 μm and only40% longer for 3.1 μm (the purple circles in Fig. 8).Combining these points with the fact that the mid-IRsource can actually reach a γ < 0.2, it is clear that mid-IR OPCPA solves the problem of studying SFP at longerwavelengths.
VII. EXPERIMENTAL CAPABILITIES
We now demonstrate the capabilities of our approach byinvestigating strong-field electron recollision at low andhigh energies. We choose Xe as an example for which wemeasure a 550-eV-wide kinetic energy spectrum afterionization with intense 3.1-μm radiation. By optimizingthe electric and magnetic guiding fields of the ReMi, asdiscussed in Sec. VI, we investigate different parts of thespectrum. With low fields, we resolve meV features atenergies below 1 eV, while with high fields, we collect allejected electrons up to energies of hundreds of eV.
A. Low-energy recollisions
As already described briefly in Sec. II, experimentalinvestigation of SFI with longer wavelength laser sources(λ ≥ 1.5 μm) reveals unexpected behavior in the observedelectron energy spectra that deviate from SFA predictions[9,24]. In addition to the well-known form of the kinetic
energy spectrum and the drop in yield beyond directlyemitted electrons, a peaked structure at low energies(1–3 eV) is observed. This feature, dubbed the low-energystructure (LES), was found to result from the interplaybetween the Coulomb binding potential and the laserelectric field [25–27]. Additional features have beenobserved at even lower energies and were dubbed very-low-energy structures (VLES) [34]. In these cases, thedescription of the interaction using SFA-based modelsseemed to be missing crucial aspects of the postionizationbehavior of the electron in the laser field. It was found thatmultiple “revisits” of the electron close to the ionic core,and therefore within the influence of the Coulomb field,had the effect of bunching the oscillating electrons inmomentum space [28–33]. It is interesting to note thatclassical trajectory calculations that ignore the Coulombpotential were able to reproduce the LES features [72];however, the Coulomb potential markedly enhances theeffect. From an experimental point of view, it is importantto remark that the LES was originally measured using aTOF spectrometer, which, as explained in Sec. VI, detectsonly a small fraction of the entire momentum distribution.This restriction in detection translated into incompletecoverage of the momentum space, thereby missing a largefraction of information from the observed effects. Acomprehensive picture of the observed effects is gainedfrom our full 3D and high-resolution momentum measure-ments with a ReMi [12,35]. In these measurements, anadditional feature near zero momentum is observed andcalled the zero-energy structure (ZES). Recently, weperformed a combined experimental and theoretical inves-tigation [36] in which the origins of all three features werequantitatively confirmed to be due to two-dimensionalCoulomb focusing (for the LES and VLES) and postioni-zation recapture of electrons into high-lying Rydbergstates, also known as frustrated tunnel ionization (FTI)[73,74], with subsequent field ionization (for the ZES).
1. Singly ionized Xe
Figure 9 presents kinematically complete measurementsof single ionization of Xe using 3.1-μm radiation at a peakintensity of I ¼ 4 × 10¹³ Wcm−2 and a pulse duration of71 fs (7 optical cycles, γ ¼ 0.4). In Fig. 9(a), the resultingelectron momentum distribution corresponding to Xeþ ispresented in cylindrical coordinates after integration overthe azimuthal angle (see Fig. 11 for further details). Whilethe symmetric distribution shows similar characteristics tostudies performed on other targets, such as Ar [12,35,36],O2 [12] and N2 [35], more low-energy features seem to bevisible. We find a broad distribution of direct electrons withpronounced low-energy features, with the most distinctbeing the merged VLES and ZES near pjj ≈ 0 a:u: andp⊥ < 0.03 a:u: Note that, compared to Ar, O2, and N2, theZES in Xe does not appear as clearly (see Fig. 2 of Ref. [35]for a direct comparison). The experimental conditions for
STRONG-FIELD PHYSICS WITH MID-IR FIELDS PHYS. REV. X 5, 021034 (2015)
021034-9
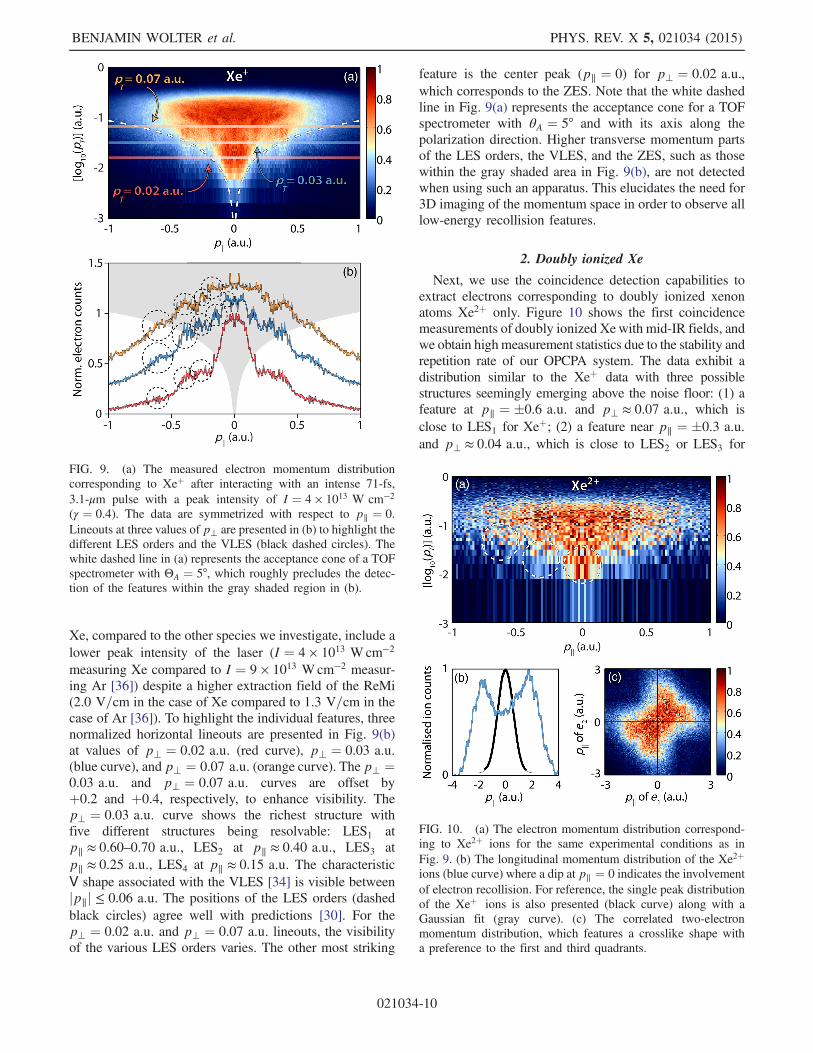
Xe, compared to the other species we investigate, include alower peak intensity of the laser (I ¼ 4 × 10¹³ Wcm−2measuring Xe compared to I ¼ 9 × 10¹³ Wcm−2 measur-ing Ar [36]) despite a higher extraction field of the ReMi(2.0 V=cm in the case of Xe compared to 1.3 V=cm in thecase of Ar [36]). To highlight the individual features, threenormalized horizontal lineouts are presented in Fig. 9(b)at values of p⊥ ¼ 0.02 a:u: (red curve), p⊥ ¼ 0.03 a:u:(blue curve), and p⊥ ¼ 0.07 a:u: (orange curve). The p⊥ ¼0.03 a:u: and p⊥ ¼ 0.07 a:u: curves are offset byþ0.2 and þ0.4, respectively, to enhance visibility. Thep⊥ ¼ 0.03 a:u: curve shows the richest structure withfive different structures being resolvable: LES1 atp∥ ≈ 0.60–0.70 a:u:, LES2 at p∥ ≈ 0.40 a:u:, LES3 atp∥ ≈ 0.25 a:u:, LES4 at p∥ ≈ 0.15 a:u: The characteristicV shape associated with the VLES [34] is visible betweenjp∥j ≤ 0.06 a:u: The positions of the LES orders (dashedblack circles) agree well with predictions [30]. For thep⊥ ¼ 0.02 a:u: and p⊥ ¼ 0.07 a:u: lineouts, the visibilityof the various LES orders varies. The other most striking
feature is the center peak (p∥ ¼ 0) for p⊥ ¼ 0.02 a:u:,which corresponds to the ZES. Note that the white dashedline in Fig. 9(a) represents the acceptance cone for a TOFspectrometer with θA ¼ 5° and with its axis along thepolarization direction. Higher transverse momentum partsof the LES orders, the VLES, and the ZES, such as thosewithin the gray shaded area in Fig. 9(b), are not detectedwhen using such an apparatus. This elucidates the need for3D imaging of the momentum space in order to observe alllow-energy recollision features.
2. Doubly ionized Xe
Next, we use the coincidence detection capabilities toextract electrons corresponding to doubly ionized xenonatoms Xe2þ only. Figure 10 shows the first coincidencemeasurements of doubly ionized Xewith mid-IR fields, andwe obtain highmeasurement statistics due to the stability andrepetition rate of our OPCPA system. The data exhibit adistribution similar to the Xeþ data with three possiblestructures seemingly emerging above the noise floor: (1) afeature at p∥ ¼ �0.6 a:u: and p⊥ ≈ 0.07 a:u:, which isclose to LES1 for Xeþ; (2) a feature near p∥ ¼ �0.3 a:u:and p⊥ ≈ 0.04 a:u:, which is close to LES2 or LES3 for
FIG. 9. (a) The measured electron momentum distributioncorresponding to Xeþ after interacting with an intense 71-fs,3.1-μm pulse with a peak intensity of I ¼ 4 × 10¹³ W cm−2(γ ¼ 0.4). The data are symmetrized with respect to p∥ ¼ 0.Lineouts at three values of p⊥ are presented in (b) to highlight thedifferent LES orders and the VLES (black dashed circles). Thewhite dashed line in (a) represents the acceptance cone of a TOFspectrometer with ΘA ¼ 5°, which roughly precludes the detec-tion of the features within the gray shaded region in (b).
FIG. 10. (a) The electron momentum distribution correspond-ing to Xe2þ ions for the same experimental conditions as inFig. 9. (b) The longitudinal momentum distribution of the Xe2þions (blue curve) where a dip at p∥ ¼ 0 indicates the involvementof electron recollision. For reference, the single peak distributionof the Xeþ ions is also presented (black curve) along with aGaussian fit (gray curve). (c) The correlated two-electronmomentum distribution, which features a crosslike shape witha preference to the first and third quadrants.
BENJAMIN WOLTER et al. PHYS. REV. X 5, 021034 (2015)
021034-10
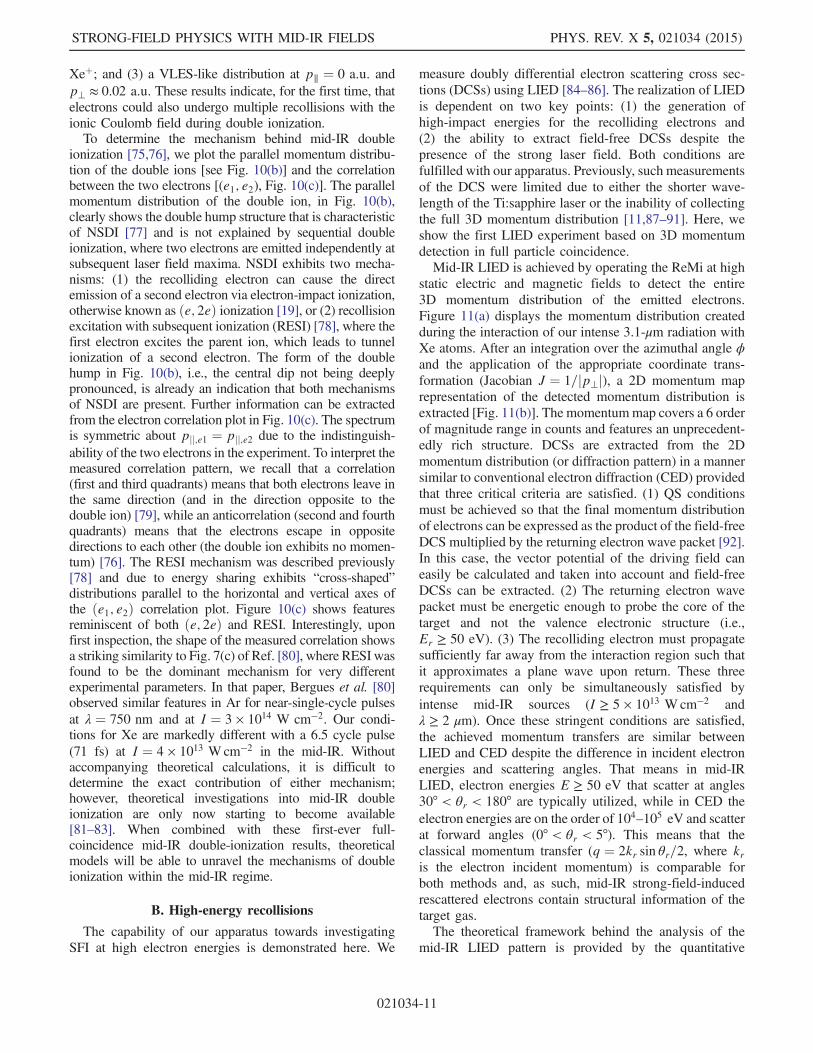
Xeþ; and (3) a VLES-like distribution at p∥ ¼ 0 a:u: andp⊥ ≈ 0.02 a:u: These results indicate, for the first time, thatelectrons could also undergo multiple recollisions with theionic Coulomb field during double ionization.To determine the mechanism behind mid-IR double
ionization [75,76], we plot the parallel momentum distribu-tion of the double ions [see Fig. 10(b)] and the correlationbetween the two electrons [(e1; e2), Fig. 10(c)]. The parallelmomentum distribution of the double ion, in Fig. 10(b),clearly shows the double hump structure that is characteristicof NSDI [77] and is not explained by sequential doubleionization, where two electrons are emitted independently atsubsequent laser field maxima. NSDI exhibits two mecha-nisms: (1) the recolliding electron can cause the directemission of a second electron via electron-impact ionization,otherwise known as ðe; 2eÞ ionization [19], or (2) recollisionexcitation with subsequent ionization (RESI) [78], where thefirst electron excites the parent ion, which leads to tunnelionization of a second electron. The form of the doublehump in Fig. 10(b), i.e., the central dip not being deeplypronounced, is already an indication that both mechanismsof NSDI are present. Further information can be extractedfrom the electron correlation plot in Fig. 10(c). The spectrumis symmetric about pjj;e1 ¼ pjj;e2 due to the indistinguish-ability of the two electrons in the experiment. To interpret themeasured correlation pattern, we recall that a correlation(first and third quadrants) means that both electrons leave inthe same direction (and in the direction opposite to thedouble ion) [79], while an anticorrelation (second and fourthquadrants) means that the electrons escape in oppositedirections to each other (the double ion exhibits no momen-tum) [76]. The RESI mechanism was described previously[78] and due to energy sharing exhibits “cross-shaped”distributions parallel to the horizontal and vertical axes ofthe ðe1; e2Þ correlation plot. Figure 10(c) shows featuresreminiscent of both ðe; 2eÞ and RESI. Interestingly, uponfirst inspection, the shape of the measured correlation showsa striking similarity to Fig. 7(c) of Ref. [80], where RESI wasfound to be the dominant mechanism for very differentexperimental parameters. In that paper, Bergues et al. [80]observed similar features in Ar for near-single-cycle pulsesat λ ¼ 750 nm and at I ¼ 3 × 10¹⁴ W cm−2. Our condi-tions for Xe are markedly different with a 6.5 cycle pulse(71 fs) at I ¼ 4 × 10¹³ Wcm−2 in the mid-IR. Withoutaccompanying theoretical calculations, it is difficult todetermine the exact contribution of either mechanism;however, theoretical investigations into mid-IR doubleionization are only now starting to become available[81–83]. When combined with these first-ever full-coincidence mid-IR double-ionization results, theoreticalmodels will be able to unravel the mechanisms of doubleionization within the mid-IR regime.
B. High-energy recollisions
The capability of our apparatus towards investigatingSFI at high electron energies is demonstrated here. We
measure doubly differential electron scattering cross sec-tions (DCSs) using LIED [84–86]. The realization of LIEDis dependent on two key points: (1) the generation ofhigh-impact energies for the recolliding electrons and(2) the ability to extract field-free DCSs despite thepresence of the strong laser field. Both conditions arefulfilled with our apparatus. Previously, such measurementsof the DCS were limited due to either the shorter wave-length of the Ti:sapphire laser or the inability of collectingthe full 3D momentum distribution [11,87–91]. Here, weshow the first LIED experiment based on 3D momentumdetection in full particle coincidence.Mid-IR LIED is achieved by operating the ReMi at high
static electric and magnetic fields to detect the entire3D momentum distribution of the emitted electrons.Figure 11(a) displays the momentum distribution createdduring the interaction of our intense 3.1-μm radiation withXe atoms. After an integration over the azimuthal angle ϕand the application of the appropriate coordinate trans-formation (Jacobian J ¼ 1=jp⊥j), a 2D momentum maprepresentation of the detected momentum distribution isextracted [Fig. 11(b)]. The momentummap covers a 6 orderof magnitude range in counts and features an unprecedent-edly rich structure. DCSs are extracted from the 2Dmomentum distribution (or diffraction pattern) in a mannersimilar to conventional electron diffraction (CED) providedthat three critical criteria are satisfied. (1) QS conditionsmust be achieved so that the final momentum distributionof electrons can be expressed as the product of the field-freeDCS multiplied by the returning electron wave packet [92].In this case, the vector potential of the driving field caneasily be calculated and taken into account and field-freeDCSs can be extracted. (2) The returning electron wavepacket must be energetic enough to probe the core of thetarget and not the valence electronic structure (i.e.,Er ≥ 50 eV). (3) The recolliding electron must propagatesufficiently far away from the interaction region such thatit approximates a plane wave upon return. These threerequirements can only be simultaneously satisfied byintense mid-IR sources (I ≥ 5 × 10¹³ Wcm−2 andλ ≥ 2 μm). Once these stringent conditions are satisfied,the achieved momentum transfers are similar betweenLIED and CED despite the difference in incident electronenergies and scattering angles. That means in mid-IRLIED, electron energies E ≥ 50 eV that scatter at angles30° < θr < 180° are typically utilized, while in CED theelectron energies are on the order of 104–105 eV and scatterat forward angles (0° < θr < 5°). This means that theclassical momentum transfer (q ¼ 2kr sin θr=2, where kris the electron incident momentum) is comparable forboth methods and, as such, mid-IR strong-field-inducedrescattered electrons contain structural information of thetarget gas.The theoretical framework behind the analysis of the
mid-IR LIED pattern is provided by the quantitative
STRONG-FIELD PHYSICS WITH MID-IR FIELDS PHYS. REV. X 5, 021034 (2015)
021034-11
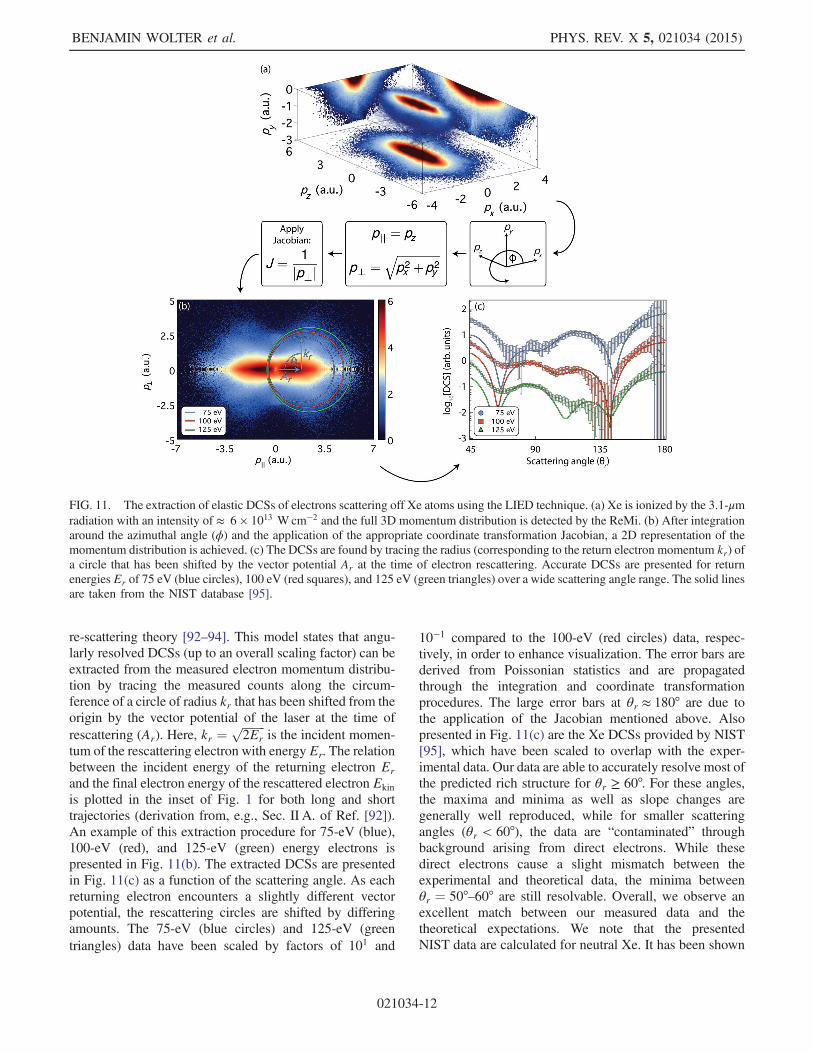
re-scattering theory [92–94]. This model states that angu-larly resolved DCSs (up to an overall scaling factor) can beextracted from the measured electron momentum distribu-tion by tracing the measured counts along the circum-ference of a circle of radius kr that has been shifted from theorigin by the vector potential of the laser at the time ofrescattering (Ar). Here, kr ¼
ffiffiffiffiffiffiffiffi2Er
pis the incident momen-
tum of the rescattering electron with energy Er. The relationbetween the incident energy of the returning electron Erand the final electron energy of the rescattered electron Ekinis plotted in the inset of Fig. 1 for both long and shorttrajectories (derivation from, e.g., Sec. II A. of Ref. [92]).An example of this extraction procedure for 75-eV (blue),100-eV (red), and 125-eV (green) energy electrons ispresented in Fig. 11(b). The extracted DCSs are presentedin Fig. 11(c) as a function of the scattering angle. As eachreturning electron encounters a slightly different vectorpotential, the rescattering circles are shifted by differingamounts. The 75-eV (blue circles) and 125-eV (greentriangles) data have been scaled by factors of 101 and
10−1 compared to the 100-eV (red circles) data, respec-tively, in order to enhance visualization. The error bars arederived from Poissonian statistics and are propagatedthrough the integration and coordinate transformationprocedures. The large error bars at θr ≈ 180° are due tothe application of the Jacobian mentioned above. Alsopresented in Fig. 11(c) are the Xe DCSs provided by NIST[95], which have been scaled to overlap with the exper-imental data. Our data are able to accurately resolve most ofthe predicted rich structure for θr ≥ 60°. For these angles,the maxima and minima as well as slope changes aregenerally well reproduced, while for smaller scatteringangles (θr < 60°), the data are “contaminated” throughbackground arising from direct electrons. While thesedirect electrons cause a slight mismatch between theexperimental and theoretical data, the minima betweenθr ¼ 50°–60° are still resolvable. Overall, we observe anexcellent match between our measured data and thetheoretical expectations. We note that the presentedNIST data are calculated for neutral Xe. It has been shown
FIG. 11. The extraction of elastic DCSs of electrons scattering off Xe atoms using the LIED technique. (a) Xe is ionized by the 3.1-μmradiation with an intensity of ≈ 6 × 10¹³ Wcm−2 and the full 3D momentum distribution is detected by the ReMi. (b) After integrationaround the azimuthal angle (ϕ) and the application of the appropriate coordinate transformation Jacobian, a 2D representation of themomentum distribution is achieved. (c) The DCSs are found by tracing the radius (corresponding to the return electron momentum kr) ofa circle that has been shifted by the vector potential Ar at the time of electron rescattering. Accurate DCSs are presented for returnenergies Er of 75 eV (blue circles), 100 eV (red squares), and 125 eV (green triangles) over a wide scattering angle range. The solid linesare taken from the NIST database [95].
BENJAMIN WOLTER et al. PHYS. REV. X 5, 021034 (2015)
021034-12
that the electron energies utilized here (Ekin > 50 eV) arecore penetrating and can be used to extract structuralinformation [38]. Therefore, the electronic structure ofthe target has a negligible effect on the extracted DCSsfor these experimental conditions. These results show thatfield-free DCSs can indeed be extracted over a wide range ofenergies and scattering angles at unprecedented accuracies.
VIII. SUMMARY AND OUTLOOK
We present a unique methodology to investigate mid-IR-driven SFP with a high repetition rate mid-IR OPCPAsystem in combination with a ReMi that is able to detectionization fragments over a 6 order of magnitude energyrange. This apparatus now permits unambiguous inves-tigations of SFI and related effects in the deep QS regime,thereby allowing experimental observations to be scruti-nized against theoretical descriptions. We demonstrate ourconcept across the entire accessible kinetic energy scale byinvestigating SFI and electron recollision with Xe atoms.We observe low-energy structures up to the fourth order,the VLES and the ZES in Xe, but find a much reduced ZESthat would arise from capture into Rydberg states andsubsequent ReMi field ionization. This surprising absenceof a strong ZES peak in Xe already warrants furtherinvestigation as it will prompt information about the FTIprocess. Next, first coincidence measurements of mid-IR-driven NSDI are shown. The analysis of the data hints atthe combined action of ðe; 2eÞ and RESI mechanisms.Interestingly, this very first ðe1; e2Þ correlation map in thedeep QS regime (γ ¼ 0.4) for a 6.5-cycle pulse exhibitsfeatures that were observed for entirely different conditionswith a near-single-cycle CEP-stable pulse at λ ¼ 750 nm inAr and for γ ¼ 0.7 [80]. Finally, we exploit the high-energydetection capabilities of our apparatus with mid-IR LIED.We achieve core penetrating conditions that permit extrac-tion of the doubly differential elastic electron scatteringcross section in Xe, and the retrieved DCSs matchpublished NIST data very well. Probing atomic structurewith mid-IR LIED carries clear potential for the realizationof femtosecond time-resolved imaging of molecular struc-ture and for tracking atomic constituents during structuralchanges such as isomerization or dissociation. In fact,recent results from our group show that the method canindeed be used to determine the entire conformation ofpolyatomic acetylene (C2H2) [38].
ACKNOWLEDGMENTS
We acknowledge support from the Spanish MinisterioDe Economia Y Competitividad (MINECO) through “PlanNacional” (FIS2011-30465-C02-01), the Catalan Agenciade Gestió d’Ajuts Universitaris i de Recerca (AGAUR)with SGR 2014-2016. This research has been supported byFundació Cellex Barcelona, LASERLAB-EUROPE GrantAgreement NO. 228334 and COSTAction MP1203. B.W.
was supported by AGAUR (FI-DGR 2013-2015). M. G. Pis supported by the ICFONESTþ program, partiallyfunded by the Marie Curie Co-funding of Regional,National and International Programmes–COFUND (FP7-PEOPLE-2013-COFUND) action of the EuropeanCommission, the “Severo Ochoa” Program of the SpanishMinistry of Economy and Competitiveness, and ICFO.B.W. and M. G. P. contributed equally to this work.
[1] M. Uiberacker, Th. Uphues, M. Schultze, A. J. Verhoef, V.Yakovlev, M. F. Kling, J. Rauschenberger, N.M. Kabachnik,H. Schröder, M. Lezius, K. L. Kompa, H.-G. Muller, M. J. J.Vrakking, S. Hendel, U. Kleineberg, U. Heinzmann, M.Drescher, and F. Krausz, Attosecond real-time observation ofelectron tunneling in atoms, Nature (London) 446, 627(2007).
[2] O. Smirnova, Y. Mairesse, S. Patchkovskii, N. Dudovich, D.Villeneuve, P. Corkum, and M. Yu. Ivanov, High harmonicinterferometry of multi-electron dynamics in molecules,Nature (London) 460, 972 (2009).
[3] G. Sansone et al., Electron Localization following atto-second molecular photoionization, Nature (London) 465,763 (2010).
[4] E. Goulielmakis, Z.-H. Loh, A. Wirth, R. Santra, N.Rohringer, V. S. Yakovlev, S. Zherebtsov, T. Pfeifer,A. M. Azzeer, M. F. Kling, S. R. Leone, and F. Krausz,Real-time observation of valence electron motion, Nature(London) 466, 739 (2010).
[5] A. H. Zewail, Four-dimensional electron microscopy,Science 328, 187 (2010).
[6] P. Hockett, C. Z. Bisgaard, O. J. Clarkin, and A. Stolow,Time-resolved imaging of purely valence-electron dynamicsduring a chemical reaction, Nat. Phys. 7, 612 (2011).
[7] R. J. D. Miller, Femtosecond crystallography with ultra-bright electrons and X-Rays: Capturing chemistry in action,Science 343, 1108 (2014).
[8] P. Colosimo, G. Doumy, C. I. Blaga, J. Wheeler, C. Hauri, F.Catoire, J. Tate, R. Chirla, A. M. March, G. G. Paulus, H. G.Muller, P. Agostini, and L. F. DiMauro, Scaling strong-fieldinteractions towards the classical limit, Nat. Phys. 4, 386(2008).
[9] C. I. Blaga, F. Catoire, P. Colosimo, G. G. Paulus, H. G.Muller, P. Agostini, and L. F. DiMauro, Strong field photo-ionization revisited, Nat. Phys. 5, 335 (2009).
[10] T. Popmintchev et al., Bright coherent ultrahigh harmonicsin the keV X-ray regime from mid-infrared femtosecondlasers, Science 336, 1287 (2012).
[11] C. I. Blaga, J. Xu, A. D. DiChiara, E. Sistrunk, K. Zhang,P. Agostini, T. A. Miller, L. F. DiMauro, and C. D. Lin,Imaging ultrafast molecular dynamics with laser-inducedelectron diffraction, Nature (London) 483, 194 (2012).
[12] J. Dura, N. Camus, A. Thai, A. Britz, M. Hemmer, M.Baudisch, A. Senftleben, C. D. Schröter, J. Ullrich, R.Moshammer, and J. Biegert, Ionization with low-frequencyfields in the tunneling regime, Sci. Rep. 3, 2675 (2013).
[13] N. Ishii, K. Kaneshima, K. Kitano, T. Kanai, S. Watanabe,and J. Itatani, Carrier-envelope phase-dependent high-
STRONG-FIELD PHYSICS WITH MID-IR FIELDS PHYS. REV. X 5, 021034 (2015)
021034-13
harmonic generation in the water window using a few-cycleinfrared light source, Nat. Commun. 5, 3331 (2014).
[14] S. L. Cousin, F. Silva, S. Teichmann, M. Hemmer, B.Buades, and J. Biegert,High-flux table-top soft X-ray sourcedriven by sub-2-cycle, CEP stable, 1.85-μm 1-kHz pulsesfor carbon K-edge spectroscopy, Opt. Lett. 39, 5383 (2014).
[15] J. Tate, T. Auguste, H. G. Muller, P. Saliéres, P. Agostini,and L. F. DiMauro, Scaling of Wave-Packet Dynamics in anIntense Midinfrared Field, Phys. Rev. Lett. 98, 013901(2007).
[16] M. Frolov, N. Manakov, and A. Starace,Wavelength Scalingof High-Harmonic Yield: Threshold Phenomena and BoundState Symmetry Dependence, Phys. Rev. Lett. 100, 173001(2008).
[17] D. Austin and J. Biegert, Strong-field approximation for thewavelength scaling of high-harmonic generation, Phys.Rev. A 86, 023813 (2012).
[18] O. Chalus, P. K. Bates, M. Smolarski, and J. Biegert,Mid-IRshort-pulse OPCPA with micro-Joule energy at 100 kHz,Opt. Express 17, 3587 (2009).
[19] P. B. Corkum, Plasma Perspective on Strong-Field Multi-photon Ionization, Phys. Rev. Lett. 71, 1994 (1993).
[20] L. V. Keldysh, Ionization in the field of a strong electro-magnetic wave, Zh. Eksp. Teor. Fiz. 47, 1945 (1964) [Sov.Phys. JETP 20, 1307 (1965)].
[21] International Organization for Standardization, ISO20473:2007, https://www.iso.org/obp/ui/#iso:std:iso:20473:ed‑1:v1:en.
[22] Note that since the Keldysh parameter only distinguishesbetween the extremes of MP (γ ≫ 1) and QS (γ ≪ 1)regimes, additional unitless parameters were introducedby Reiss [23] to more precisely define the interactionconditions. For completeness, the values corresponding tothe maximum 3.1 μm intensity used in this article are listedhere: γ ¼ 0.34, z ¼ 135, z1 ¼ 8.88, and zf ¼ 2 × 10⁻⁴.
[23] H. R. Reiss, Limits on Tunneling Theories of Strong-FieldIonization, Phys. Rev. Lett. 101, 043002 (2008).
[24] W. Quan, Z. Lin, M. Wu, H. Kang, H. Liu, X. Liu, J. Chen,J. Liu, X. T. He, S. G. Chen, H. Xiong, L. Guo, H. Xu, Y. Fu,Y. Cheng, and Z. Z. Xu, Classical Aspects in Above-Threshold Ionization with a Midinfrared Strong LaserField, Phys. Rev. Lett. 103, 093001 (2009).
[25] F. H. M. Faisal, Ionization surprise, Nat. Phys. 5, 319(2009).
[26] C. Liu and K. Z. Hatsagortsyan, Origin of Unexpected LowEnergy Structure in Photoelectron Spectra Induced byMidinfrared Strong Laser Fields, Phys. Rev. Lett. 105,113003 (2010).
[27] T.-M. Yan, S. V. Popruzhenko, M. J. J. Vrakking, andD. Bauer, Low-Energy Structures in Strong Field IonizationRevealed by Quantum Orbits, Phys. Rev. Lett. 105, 253002(2010).
[28] C. Lemell, K. I. Dimitriou, X.-M. Tong, S. Nagele, D. V.Kartashov, J. Burgdörfer, and S. Gräfe, Low-Energy peakstructure in strong-field ionization by midinfrared laserpulses: Two-dimensional focusing by the atomic potential,Phys. Rev. A 85, 011403(R) (2012).
[29] A. Kästner, U. Saalmann, and J. M. Rost, Electron-EnergyBunching in Laser-Driven Soft Recollisions, Phys. Rev.Lett. 108, 033201 (2012).
[30] A. Kästner, U. Saalmann, and J. M. Rost, Energy bunchingin soft recollisions revealed with long-wavelength few-cyclepulses, J. Phys. B 45, 074011 (2012).
[31] C. Lemell, J. Burgdörfer, S. Gräfe, K. I. Dimitriou, D. G.Arbó, and X.-M. Tong, Classical-quantum correspondencein atomic ionization by midinfrared pulses: Multiple peakand interference structures, Phys. Rev. A 87, 013421(2013).
[32] L. Guo, S. S. Han, X. Liu, Y. Cheng, Z. Z. Xu, J. Fan, J.Chen, S. G. Chen, W. Becker, C. I. Blaga, A. D. DiChiara,E. Sistrunk, P. Agostini, and L. F. DiMauro, Scaling of theLow-Energy Structure in Above-Threshold Ionization in theTunneling Regime: Theory and Experiment, Phys. Rev. Lett.110, 013001 (2013).
[33] Z.-Y. Lin, M-Y. Wu, W. Quan, X.-J. Liu, J. Chen, and Y.Cheng, The Coulomb effect on a low-energy structure inabove-threshold ionization spectra induced by mid-infraredlaser pulses, Chin. Phys. B 23, 023201 (2014).
[34] C. Y. Wu, Y. D. Yang, Y. Q. Liu, Q. H. Gong, M. Y. Wu, X.Liu, X. L. Hao, W. D. Li, X. T. He, and J. Chen, Character-istic Spectrum of Very Low-Energy Photoelectron fromAbove-Threshold Ionization in the Tunneling Regime, Phys.Rev. Lett. 109, 043001 (2012).
[35] M. G. Pullen, J. Dura, B. Wolter, M. Baudisch, M. Hemmer,N. Camus, A. Senftleben, C. D. Schröter, R. Moshammer, J.Ullrich, and J. Biegert, Kinematically complete measure-ments of strong field ionization with mid-IR pulses, J. Phys.B 47, 204010 (2014).
[36] B. Wolter, C. Lemell, M. Baudisch, M. G. Pullen, X.-M.Tong, M. Hemmer, A. Senftleben, C. D. Schröter, J. Ullrich,R. Moshammer, J. Biegert, and J. Burgdörfer, Formation ofvery-low-energy states crossing the ionization threshold ofargon atoms in strong mid-infrared fields, Phys. Rev. A 90,063424 (2014).
[37] C. Figueira de Morisson Faria and X. Liu, Electron-electroncorrelation in strong laser fields, J. Mod. Opt. 58, 1076(2011).
[38] M. G. Pullen, B. Wolter, A.-T. Le, M. Baudisch, M.Hemmer, A. Senftleben, C. D. Schröter, J. Ullrich, R.Moshammer, C. D. Lin, and J. Biegert, Imaging an alignedpolyatomic molecule with laser-induced electron diffrac-tion, Nat. Commun. 6, 7262 (2015).
[39] A. S. Alnaser, D. Comtois, A. T. Hasan, D. M. Villeneuve,J.-C. Kieffer, and I. V. Litvinyuk, Strong-field non-sequential double ionization: Wavelength dependence ofion momentum distributions for neon and argon, J. Phys. B41, 031001 (2008).
[40] S. Popruzhenko, V. Mur, V. Popov, and D. Bauer, StrongField Ionization Rate for Arbitrary Laser Frequencies,Phys. Rev. Lett. 101, 193003 (2008).
[41] D. Dimitrovski, J. Maurer, H. Stapelfeldt, and L. B. Madsen,Low-Energy Photoelectrons in Strong-Field Ionization byLaser Pulses with Large Ellipticity, Phys. Rev. Lett. 113,103005 (2014).
[42] It should be noted that these ionization fractions arecalculated for atomic targets [40] and should be comparedwith their molecular counterparts in an indicative manneronly. The point is not to accurately calculate molecularionization fractions but to illustrate that long wavelength
BENJAMIN WOLTER et al. PHYS. REV. X 5, 021034 (2015)
021034-14
sources are needed to probe polyatomic molecules withinthe QS regime.
[43] A. D. DiChiara, E. Sistrunk, C. I. Blaga, U. B. Szafruga, P.Agostini, and L. F. DiMauro, Inelastic Scattering of Broad-band Electron Wave Packets Driven by an Intense Mid-infrared Laser Field, Phys. Rev. Lett. 108, 033002 (2012).
[44] H. R. Reiss, Theoretical methods in quantum optics:S-matrix and Keldysh techniques for strong-field processes,Prog. Quantum Electron. 16, 1 (1992).
[45] H. R. Reiss, The tunnelling model of laser-induced ioniza-tion and its failure at low frequencies, J. Phys. B 47, 204006(2014).
[46] A. Ludwig, J. Maurer, B. Mayer, C. R. Phillips, L.Gallmann, and U. Keller, Breakdown of Dipole Approxi-mation in Strong Field Ionization, Phys. Rev. Lett. 113,243001 (2014).
[47] W. Xiong, F. Yergeau, S. L. Chin, and P. Lavigne, Multi-photon Ionization of rare gases by a CO2 laser: Electronspectroscopy, J. Phys. B 21, L159 (1988).
[48] R. Moshammer, J. Ullrich, M. Unverzagt, W. Schmidt, P.Jardin, R. E. Olson, R. Mann, R. Dörner, V. Mergel, U.Buck, and H. Schmidt-Böcking, Low-Energy Electrons andTheir Dynamical Correlation with Recoil Ions for SingleIonization of Helium by Fast, Heavy-Ion Impact, Phys. Rev.Lett. 75, 2631 (1995).
[49] L. J. Frasinski, K. Codling, and P. A. Hatherly, Covariancemapping: A correlation method applied to multiphotonmultiple ionization, Science 246, 1029 (1989).
[50] W.M. Haynes, CRC Handbook of Chemistry and Physics,95th ed. (Taylor & Francis, London, 2014), ISBN 1-4822-0867-9.
[51] The 129Xe2þ peak is composed of two peaks due to theNSDI mechanism (polarization along the static electric fieldof the ReMi) causing one recoil ion to go straight towardsthe detector and the other to initially go away from thedetector.
[52] A. T. J. B. Eppink and D. H. Parker, Velocity map imagingof ions and electrons using electrostatic lenses: Applicationin photoelectron and photofragment ion imaging of molecu-lar oxygen, Rev. Sci. Instrum. 68, 3477 (1997).
[53] M. Takahashi, J. P. Cave, and J. H. D. Eland, Velocityimaging photoionization coincidence apparatus for thestudy of angular correlations between electrons and frag-ment ions, Rev. Sci. Instrum. 71, 1337 (2000).
[54] J. Laksman, D. Céolin, E. P. Månsson, S. L. Sorensen, andM. Gisselbrecht, Development and characterization of amultiple-coincidence ion-momentum imaging spectrometer,Rev. Sci. Instrum. 84, 123113 (2013).
[55] O. Ghafur, W. Siu, P. Johnsson, M. F. Kling, M. Drescher,and M. J. J. Vrakking, A velocity map imaging detector withan integrated gas injection system, Rev. Sci. Instrum. 80,033110 (2009).
[56] C. R. Gebhardt, T. P. Rakitzis, P. C. Samartzis, V.Ladopoulos, and T. N. Kitsopoulos, Slice imaging: A newapproach to ion imaging and velocity mapping, Rev. Sci.Instrum. 72, 3848 (2001).
[57] B. J. Whitaker, Imaging in Chemical Dynamics (AmericanChemical Society, Washington, DC, 2000), p. 68.
[58] M. J. J. Vrakking, An iterative procedure for the inversionof two-dimensional ion/photoelectron imaging experiments,Rev. Sci. Instrum. 72, 4084 (2001).
[59] V. Dribinski, A. Ossadtchi, V. A. Mandelshtam, and H.Reisler, Reconstruction of Abel-transformable images: TheGaussian basis-set expansion Abel transform method, Rev.Sci. Instrum. 73, 2634 (2002).
[60] D. Rolles, Z. D. Pešić, M. Perri, R. C. Bilodeau, G. D.Ackerman, B. S. Rude, A. L. D. Kilcoyne, J. D. Bozek, andN. Berrah, A velocity map imaging spectrometer forelectron-ion and ion-ion coincidence experiments withsynchrotron radiation, Nucl. Instrum. Methods Phys.Res., Sect. B 261, 170 (2007).
[61] R. Moshammer, M. Unverzagt, W. Schmitt, J. Ullrich, andH. Schmidt-Böcking, A 4π Recoil-Ion Electron momentumanalyzer: A high-resolution “microscope” for the inves-tigation of the dynamics of atomic, molecular and nuclearreactions, Nucl. Instrum. Methods Phys. Res., Sect. B 108,425 (1996).
[62] R. Dörner, V. Mergel, O. Jagutzki, J. Ullrich, R. Moshammer,and H. Schmidt-Böcking, Cold target recoil ion momentumspectroscopy: A “momentum microscope” to view atomiccollision dynamics, Phys. Rep. 330, 95 (2000).
[63] J. Ullrich, R. Moshammer, A. Dorn, R. Dörner, L. Ph. H.Schmidt, and H. Schmidt-Böcking, Recoil-ion and electronmomentum spectroscopy: Reaction-microscopes, Rep.Prog. Phys. 66, 1463 (2003).
[64] A. Thai, M. Hemmer, P. K. Bates, O. Chalus, and J. Biegert,Sub-250-mrad, passively carrier-envelope-phase-stablemid-infrared OPCPA source at high repetition rate, Opt.Lett. 36, 3918 (2011).
[65] M. Hemmer, A. Thai, M. Baudisch, H. Ishizuki, T. Taira,and J. Biegert, 18-μJ Energy, 160-kHz repetition rate,250-MW peak power mid-IR OPCPA, Chin. Optic. Lett.11, 013202 (2013).
[66] M. Hemmer, M. Baudisch, A. Thai, A. Couairon, and J.Biegert, Self-compression to sub-3-cycle duration of mid-infrared optical pulses in dielectrics, Opt. Express 21,28095 (2013).
[67] J. B. Watson, A. Sanpera, K. Burnett, and P. L. Knight,Wave-packet recollision and pulse-shape effects in high-harmonic generation, Phys. Rev. A 55, 1224 (1997).
[68] O. Chalus, P. K. Bates, and J. Biegert, Design and simu-lation of few-cycle optical parametric chirped pulse am-plification at mid-IR wavelengths, Opt. Express 16, 21297(2008).
[69] F. J. Furch, S. Birkner, F. Kelkensberg, A. Giree, A.Anderson, C. P. Schulz, and M. J. J. Vrakking, Carrier-envelope phase stable few-cycle pulses at 400 kHz forelectron-ion coincidence experiments, Opt. Express 21,22671 (2013).
[70] J. Matyschok, T. Lang, T. Binhammer, O. Prochnow, S.Rausch, M. Schultze, A. Harth, P. Rudawski, C. L. Arnold,A. L’Huillier, and U. Morgner, Temporal and spatial effectsinside a compact and CEP stabilized, few-cycle OPCPAsystem at high repetition rates, Opt. Express 21, 29656(2013).
[71] I. Pupeza, T. Eidam, J. Rauschenberger, B. Bernhardt, A.Ozawa, E. Fill, A. Apolonski, T. Udem, J. Limpert, Z. A.Alahmed, A. M. Azzeer, A. Tünnermann, T. W. Hänsch, and
STRONG-FIELD PHYSICS WITH MID-IR FIELDS PHYS. REV. X 5, 021034 (2015)
021034-15
F. Krausz, Power scaling of a high-repetition-rate enhance-ment cavity, Opt. Lett. 35, 2052 (2010).
[72] W. Becker, S. P. Goreslavski, D. B. Milošević, and G. G.Paulus, Low-energy electron rescattering in laser-inducedionization, J. Phys. B 47, 204022 (2014).
[73] T. Nubbemeyer, K. Gorling, A. Saenz, U. Eichmann, andW. Sandner, Strong-field tunneling without ionization, Phys.Rev. Lett. 101, 233001 (2008).
[74] A. Landsman, A. N. Pfeiffer, C. Hofmann, M. Smolarski,C. Cirelli, and U. Keller, Rydberg state creation by tunnelionization, New J. Phys. 15, 013001 (2013).
[75] R. Kopold, W. Becker, H. Rottke, andW. Sandner, Routes toNonsequential Double Ionization, Phys. Rev. Lett. 85, 3781(2000).
[76] B. Feuerstein, R. Moshammer, D. Fischer, A. Dorn, C. D.Schröter, J. Deipenwisch, J. R. Crespo Lopez-Urrutia, C.Höhr, P. Neumayer, J. Ullrich, H. Rottke, M. Wittmann, G.Korn, and W. Sandner, Separation of Recollision Mecha-nisms in Nonsequential Strong Field Double Ionization ofAr: The Role of Excitation Tunneling, Phys. Rev. Lett. 87,043003 (2001).
[77] R. Moshammer, B. Feuerstein, W. Schmitt, A. Dorn, C. D.Schröter, J. Ullrich, H. Rottke, C. Trump, M. Wittmann, G.Korn, K. Hoffmann, and W. Sandner, Momentum Distribu-tions of Nenþ Ions Created by an Intense Ultrashort LaserPulse, Phys. Rev. Lett. 84, 447 (2000).
[78] T. Shaaran, M. T. Nygren, and C. Figueira de MorissonFaria, Laser-induced nonsequential double ionization atand above the recollision-excitation-tunneling threshold,Phys. Rev. A 81, 063413 (2010).
[79] T. Weber, H. Giessen, M. Weckenbrock, G. Urbasch, A.Staudte, L. Spielberger, O. Jagutzki, V. Mergel, M. Vollmer,and R. Dörner, Correlated electron emission in multiphotondouble ionization, Nature (London) 405, 658 (2000).
[80] B. Bergues, M. Kübel, N. G. Johnson, B. Fischer, N.Camus, K. J. Betsch, O. Herrwerth, A. Senftleben, A. M.Sayler, T. Rathje, T. Pfeifer, I. Ben-Itzhak, R. R. Jones, G. G.Paulus, F. Krausz, R. Moshammer, J. Ullrich, and M. F.Kling, Attosecond tracing of correlated electron-emission innon-sequential double ionization, Nat. Commun. 3, 813(2012).
[81] Q. Tang, Y. Zhou, C. Huang, Q. Liao, and P. Lu, Correlatedelectron dynamics in nonsequential double ionization ofmolecules by mid-infrared fields, Opt. Express 20, 19580(2012).
[82] D.-L. Zhang, Q.-B. Tang, and Y. Gao, Suppression ofrecollision-excitation ionization in nonsequential doubleionization of molecules by mid-infrared laser pulses, Chin.Phys. Lett. 30, 023203 (2013).
[83] Q.Tang, D. Zhang, M. Liu, Y. Gao, and B. Yu, Intensity-dependent transitions between different pathways of strong-field double ionization, Opt. Commun. 307, 32 (2013).
[84] T. Zuo, A. D. Bandrauk, and P. B. Corkum, Laser-inducedelectron diffraction: New tool for probing ultrafast molecu-lar dynamics, Chem. Phys. Lett. 259, 313 (1996).
[85] M. Spanner, O. Smirnova, P. B. Corkum, and M. Y. Ivanov,Reading diffraction images in strong field ionization ofdiatomic molecules, J. Phys. B 37, L243 (2004).
[86] S. N. Yurchenko, S. Patchkovskii, I. V. Litvinyuk, P. B.Corkum, and G. L. Yudin, Laser-Induced Interference,Focusing, and Diffraction of Rescattering Molecular Photo-electrons, Phys. Rev. Lett. 93, 223003 (2004).
[87] D. Ray, B. Ulrich, I. Bocharova, C. Maharjan, P. Ranitovic,B. Gramkow, M. Magrakvelidze, S. De, I. Litvinyuk, A. T.Le, T. Morishita, C. D. Lin, G. G. Paulus, and C. L. Cocke,Large-Angle Electron Diffraction Structure in Laser-Induced Rescattering from Rare Gases, Phys. Rev. Lett.100, 143002 (2008).
[88] M. Okunishi, T. Morishita, G. Prümper, K. Shimada, C. D.Lin, S. Watanabe, and K. Ueda, Experimental Retrieval ofTarget Structure Information from Laser-Induced Rescat-tered Photoelectron Momentum Distributions, Phys. Rev.Lett. 100, 143001 (2008).
[89] M. Okunishi, H. Niikura, R. R. Lucchese, T. Morishita, andK. Ueda, Extracting Electron-Ion Differential ScatteringCross Sections for Partially Aligned Molecules by Laser-Induced Rescattering Photoelectron Spectroscopy, Phys.Rev. Lett. 106, 063001 (2011).
[90] J. Xu, C. I. Blaga, A. D. DiChiara, E. Sistrunk, K. Zhang, Z.Chen, A.-T. Le, T. Morishita, C. D. Lin, P. Agostini, andL. F. Dimauro, Laser-Induced Electron Diffraction forProbing Rare Gas Atoms, Phys. Rev. Lett. 109, 233002(2012).
[91] M. Okunishi, R. R. Lucchese, T. Morishita, and K. Ueda,Rescattering photoelectron spectroscopy of small molecules,J. Electron Spectrosc. Relat. Phenom. 195, 313 (2014).
[92] Z. Chen, A.-T. Le, T. Morishita, and C. D. Lin, Quantitativerescattering theory for laser-induced high-energy plateauphotoelectron spectra, Phys. Rev. A 79, 033409 (2009).
[93] C. D. Lin, A.-T. Le, Z. Chen, T. Morishita, and R. Lucchese,Strong-field rescattering physics: Self-imaging of a mol-ecule by its own electrons, J. Phys. B 43, 122001 (2010).
[94] J. Xu, Z. Chen, A.-T. Le, and C. D. Lin, Self-imaging ofmolecules from diffraction spectra by laser-induced rescat-tering electrons, Phys. Rev. A 82, 033403 (2010).
[95] A. Jablonski, F. Salvat, and C. J. Powell, NIST ElectronElastic-Scattering Cross-Section Database, Version 3.2,SRD 64, National Institute of Standards and Technology(Gaithersburg, MD, 2010).
BENJAMIN WOLTER et al. PHYS. REV. X 5, 021034 (2015)
021034-16