Embed Size (px)
Citation preview
“Striving for Savings” – religion and individual
economic behavior
University of Lüneburg Working Paper Series in Economics
No. 162
January 2010
www.leuphana.de/institute/ivwl/publikationen/working-papers.html
ISSN 1860 - 5508
by Anja Klaubert
“Striving for Savings” – religion and individual economic behavior
Anja Klaubert
Leuphana University Lüneburg
Preliminary Draft: January, 2010
Abstract
In the Neoclassical growth model the saving ratio and human capital might be seen as the
most important factors fostering economic growth. At last since Weber [2005 (1904/05)] it
seems clear, that religious beliefs and involvement shapes both social and economic human
behavior. This paper tests the hypothesis whether religious belonging and believing influence
a household’s economic decision-making in the USA, which was found to foster economic
growth, namely the saving ratio at the individual level. Using data from the Panel Study of
Income Dynamics (PSID), we find religious effects on saving. Regarding the decision to save
money no large differences within the Christian religions, namely Protestants and Catholics,
were found. However, large differences exist compared to non-religious people as well as to
Non-Christians and Jews.
Key words - growth, religion, individual saving behavior
___________________
* Anja Klaubert, Leuphana University Lüneburg, Institute of Economics, e-mail: [email protected]. The data from the Panel Study of Income Dynamics (PSID) used in this paper are drawn from http://psidonline.isr.umich.edu/. For a full description of the data please see the Guide to interviewing procedures and codebooks. All analyses used Stata 10. Do-Files are available from the author on request.
1. Introduction “For man's character has been moulded by his every-day work, and the material resources which he thereby
procures, more than by any other influence unless it be that of his religious ideals; and the two great forming
agencies of the world's history have been the religious and the economic.” Alfred Marshall, Principles of
Economics
Since Adam Smith, many theories have been developed to discuss the causes of different
growth rates of per capita income between national economies. Until now, the focus usually
lay on the neoclassical growth theory, which emphasizes the role of initial income,
investment, and population growth, on institutions, which provide the necessary structures for
economic growth, and on geography, which counts for the endowment with natural resources
and prerequisites. However, countries not only differ in their geography, institutions, and
capital (physical, human and social), but also in their culture to use these possibilities
efficiently. For example, some cultures provide countries with the possibility to enhance
strong family ties, and other cultures enhance a strong propensity to save which seems to be
conductive to economic growth.
At last since Weber’s [2005 (1904/05)] Protestant Ethic it seems clear that religious
belief and involvement shape both social and economic behavior (see Iannaccone 1998).
Hence, it is not surprising that Guiso et al. (2003) found individual attitudes towards trust,
competition and thriftiness to be affected by one’s religious affiliation. They showed, based
on the World Values Survey for the years 1981 to 1997, that religious people, among others,
are less willing to break the law, believe more in the fairness of the market and have less
progressive attitudes towards working women. Moreover, they found that Protestants are
trusting others and favor incentives more, Catholics value thriftiness more and favor both
private property and competition more. Contrary to that, Muslims and Hindus are strongly
against competition. Although the authors claim that different behavioral outcomes are the
result of differing personal attitudes and the surrounding environment, it is important to note
that what is only to be observed are the actions of the individuals, and not their attitudes
behind. In general, large deviations often exist during the translation of values and beliefs into
concrete actions and behavior. For example, social pressure might cause an individual to
choose differently in public than in private (Kuran 1995). Moreover, their analysis did not
consider the impact of the attitude to be thrifty taught by the religion on the individual saving
ratio.
Not only the impact of religions on attitudes has been examined but also its impact on
aggregate economic outcomes. Studies employing cross-country growth-regression analysis
find empirical evidence for the impact of religious beliefs on (per capita) income, (per capita)
GDP growth, the saving ratio, and measures of institutional quality. Regarding the saving
ratio, Guiso et al. (2006), for example, replicate their paper from 2003 using data from the
General Social Survey for the USA. They found that the distinct positive attitude of Catholics
towards the value of teaching thriftiness, compared to Protestants and non-religious people,
have a positive impact on the national saving rate. However, they leave the question open how
far religious affiliation and activities might influence the individual decision to save.
Beside the studies of Carroll (1994), who compared the saving behavior of immigrants
to Canada from different cultural backgrounds using data from the Canadian Survey of
Family Expenditures for 1982 and 1986 and did not find any evidence for cultural factors
effecting the saving patterns, and Renneboog and Spaenjers (2009), there are no analysis of
the relationship between religion and the individual saving rate. The latter analyzed whether
and how religious denominations influence the financial decisions of Dutch households.
Covering the years 1995 to 2008, they use data from the DNB Household Survey. They
showed that religious households report more frequently that they have saved in the previous
year. Thereby the effect is similar in magnitude for Catholic and Protestant households, who
are about 3% more likely to save than non-religious households.
Recently, a gap in the literature can be stated in terms of empirical analyses that relate
the individual saving ratio to one’s religious choices. Although some studies find a impact of
religious beliefs and belonging on the saving ratio on the aggregate level and some studies
state a positive relationship between religious activities and thriftiness (Guiso et al. 2003,
2006), analysis on the microeconomic level are scarce. Moreover, a significant relationship
between religion and thriftiness does not automatically imply a similar relationship between
religion and the individual decision to save. The central question is whether religiosity has
any impact on economic relevant decisions on the microeconomic level of households and
individuals.
This paper focuses on the estimation of the effect of religiosity on a household’s saving
decision in the USA. The US religious market is a very interesting one for studying the effect
of religion on the individual decision-making process, for mainly two reasons. First, despite
the ongoing secularization trend and the growing tendency of private forms of religiosity
since the beginning of the 1990’s in the USA, the majority of the population is still religious
affiliated. Moreover, the American religious market is very dynamic and people often change
their religion. Following the U.S. Religious Landscape Survey (2008), more than a quarter of
adult Americans have left the faith in which they were raised in favor of another religion - or
no religion at all. If the changes within the several Protestant denominations are included,
44% of the adults have changed their religious affiliation. Second, the US is characterized by
a broad range of denominations. As a consequence of immigration, there is substantial variety
in the types of religious beliefs. According to the Pew Forum on Religion & Public Life
(2008), 51.3% of the American population is Protestant. However, their composition is not
uniform at all. Taken together, Evangelical Protestants account for 26.3% of all Protestants.
Mainline Protestants make up 18.1%, whereas 6.9% are Black Protestants. The second largest
denomination is the Roman Catholic Church. 23.9% of the interviewed people claim to be
Catholic. Jews, who are already widely considered in the literature, count for 1,7% of the
population. Muslims, Hindus and Buddhists, to which we refer as Non-Christian religions,
make up about 1.7% of the population in 2008. Almost 5% of the population belong to
another religion. The other 16% of the population in the USA does not formally belong to a
specific religion.
Following Carroll (1994), we examine the direct impact of religious involvement on the
individual decision to save. Next to the effects of belonging, measured by the religious
affiliation, on the saving behavior, the effects of believing, measured by church attendance,
will also be considered. Going to church is assumed to influence the real economic behavior
independently of whether the person indeed believes in the religion. In other words, we are
suggesting that no differences exist between intrinsic and extrinsic religiousness (Allport and
Ross 1967, Gorsuch 1988). Additionally, we will interpret our results with respect to the
behavior of non-religious people, since in the literature a shortcoming concerning the
inclusion of non-religious groups can be recognized.
The rest of the paper is structured as follows. In the next section a theoretical
background concerning the potential economic effects of religions is developed. Section 3
will explain the methods which are used to answer the question whether there is a distinctive
behavior between religious and non-religious people regarding their decision to save money.
The data as well as the results are analyzed in Section 4; and Section 5 concludes.
2. Theoretical considerations
The paper focuses on individuals who were generally referred to as religious people, i.e. who
share a core set of beliefs, activities, and institutions based on their faith in supernatural forces
(Stark and Bainbridge 1985). The decision why people believe in a supreme being, often
called God, is thereby seen as exogenous, and only the decision of how far an individual
wants to be involved in the religion is open to rational considerations. Religions are primarily
defined by their beliefs (e.g. about the structure of sins, piety and salvation), which shape the
individual behavior. These beliefs are anchoring in the institutional sources of the religion,
like canonical texts (the Old and New Testament, the Quran, or The Vedas), the
interpretations of religious teachers (priests, monks, gurus) and rituals. However, the effects
on values and individual actions not only depend on the shaped norms and values, but also on
their enforcement mechanisms. Briefly, different behavior patterns of religious people might
be rooted in distinct belief sets and enforcement mechanisms of the religions (Arruñada
2004).
Following McCleary (2007), a comparative analysis of Catholics, Protestants Jews and
Non-Christian religions, like Hinduism, Buddhism and Islam, “shows that each promotes
accumulation of wealth […], while discouraging idleness, debt, and poverty”. She argues that
the primary difference across the religions is with respect to distinctive opinions about the
concepts of salvation and the role of charity. Salvation, which is a spiritual goal, can be
obtained differently. If religious doctrines provide the possibility to earn salvation by one’s
own effort, people will be more likely to act according to the actions that contribute to
attaining salvation. As McCleary (2007) pointed out, religious doctrines concerning the
earning of salvation give incentives to the believer to take certain actions. Accordingly,
religious beliefs “have implications for behaviour”, such as saving money or not.
Another aspect of the differences between religious and non-religious people refers to
the planning horizon of religious people. Since religious people believe in an eternal life,
respectively rebirth, they seem to have a longer planning horizon. which also might influence
their decision to transfer current consumption in the future by saving money. Indeed, one
might argue the more religious the people are, the more money they save.
For example, when looking at the differences between Catholics and Protestants it
becomes clear that, although both religions are even based on the same religious scripture,
their main values, which are related to economic issues, are different (Cervellati et al. 2008).
Whereas Catholicism is based on the theology of salvation by works and faith in God,
Protestants believe in Predestination. They cannot earn salvation by good works or good
conduct alone, since the decision, who comes to heaven and who comes to hell, is taken solely
by God. Good works merely were seen as means to show one’s fate to others. Worldly
success served as a signal to be chosen by God; it was a mark of His blessing (Noland 2005).
In contrast, in Catholicism it is said that God do not want the believer to strive for fortune,
since “the use of the things of this world” and the “attachment to riches” is “against the spirit
of evangelical poverty” and “hinder them in their quest for perfect love” (Lumen gentium 42,
235). Furthermore, McCleary highlighted another way of salvation: charitable giving.
Although acts of charity are seen as increasing the grace for the doer, the Catholic Church
values the imitation of Christ “to the degree that one assumes a state of poverty or subjects
oneself to the will of another (forms of servitude)” (McCleary 2007:66) over giving to others.
To the contrary, Protestants see good works as obligatory, since they believe more in a
subjective relation to God, and that God acts in and through the people. universal charity is
seen as obligatory and the doer cannot earn salvation through it.
As Arruñada (2004) showed, another point which differentiates Catholics from
Protestants is with respect to the norm enforcing role of the religious institutions. Catholicism
provides the believers with the ability of private confession to the priest. However, this fact
lowers dramatically the positive effect of the system of salvation by good works. Whereas the
Roman Catholic church plays a central role in the enforcement of moral rules, the empathize
of salvation by grace alone reduces the role of the church as a mediating agent in
Protestantism, and fosters the enforcement of the rules by self-examination as well as by the
other religious group members. Religions not only differ concerning their enforcement
mechanisms, but also with respect to the strictness of the enforcement of the norms and rules.
What might these distinct beliefs and enforcement mechanisms mean with respect to the
saving decision? Religious people, in general, and especially Protestants have a “greater sense
of individual responsibility” (Guiso et. al. 2003). Because of this stronger external locus of
control inherent in Protestantism, which means that each individual has to decide on his own
what is right and wrong, Protestantism focus on the individual and social responsibly (Stolz
and Williamson 2003). Self-responsibility and Predestination, on the one side, which might
foster savings, and the concept of universal charity, on the other side, which might hamper
savings, seem to be reverse forces. With respect to Catholics, on the one hand, the possibility
of confessing one’s sins, and, on the other hand, the belief that the “imitation” of Jesus Christ
is more important than charitable giving limit the positive effects of good works on the saving
behavior. The relatively low self-responsibility seems therefore to have negative effects on the
saving of Catholics. To summarize, we are suggesting that there are no big differences
concerning the saving behavior of Protestants and Catholics, since it seems as if the positive
and negative impacts of the both religions on the decision to save are countervailing forces. In
any case, Catholics and Protestants should save more than non-religious people.
Although there are enormous differences across the Non-Christian religions, like Islam,
Hindus and Buddhists, unfortunately our data do neither outline differences in the Non-
Christian religions nor the differences between Non-Christians and non-religious people at all.
Nevertheless it is worth to mention some facts. For example, the Quran explicitly demands
that nobody should accumulate more wealth than that required to meet one’s needs (Quran
2:219 “They also ask you what to give to charity: say, "The excess.”). Moreover, living in
religious asceticism is prohibited and doing acts of charity, like performing zakat, is
obligatory. (Quran 2:277 “Truly those who believe, and do deeds of righteousness, […], and
give Zakat, they will have their reward with their Lord.”). Contrary to the Islam, in Buddhism
worldly success and wealth is seen as a result of good karma. Wealth on itself is not seen as
sinful, only the underlying intensions when using the resources can be good or bad (McCleary
2007) The next section is dealing with the data and methods which will be used to investigate
the influence of one’s religious belonging and believing on the decision to save.
3. Methodology
To measure the impact of religion on measures for economic growth, namely the individual
saving behavior, we estimate, depending on the nature of the dependent variable, two
different models. In general, our multivariate estimation equation is given as
(1) Y = βRi + γDi + εi
where Y is our dependent variable. It is a measure for the decision to save, namely the
net value of the amount which was saved by the family (SAVINGS), or the underlying
decision whether to save or not (SAVED). R and D are the vectors of different sets of
independent variables, and ε is a stochastic error. R is a vector of dummy variables for the
religious affiliation, i.e. being Catholic, Protestant, Jew, Non-Christian or non-religious; and
D is a vector of demographic variables. The subscript i indicates a specific individual head of
household from N random individuals. In the two models we will use cluster-robust standard
errors by person to deal with possible unobserved household effects, that is, that decisions of
the same individual might be correlated across time. (Petersen.2009).
Using Equation (1) we employ an Ordinary Least Squares (OLS) regression regarding
the variable SAVINGS. Therefore the usual assumptions about the independent variables and
the distribution of the stochastic error (Long 1997: 12) are assumed to be fulfilled.
In a second model we regress the religious variables and the controls on the underlying
decision to save (SAVED). Since saving money or not is seen as a dummy variable, we use a
probit model to estimate the probability that an individual will save money P(SB=1). This
model is fitted by the maximum likelihood (ML). After Long (1997) and Wooldrige (2002)
we re-specify Equation (1) and estimate the decision to save or not with the probit model
which is defined as
(2) ∫ ∞−≡==
βφβ
x
B duuxFxS ,)()()|1Pr( with )2
exp(21)(
2βπ
βφ xx −=
where F is the Φ cumulative distribution function for the normal distribution and φ is the
standard normal density. S is the binary dependent outcome variable, i.e. the decision to save
money or not, and xβ denotes the linear combination of all explanatory variables, i.e. religious
affiliation (R) and demographic variables (D), like age, gender, income, wealth, and
education, which might influence a person’s decision save. Thereby β, which is given by β1
through βk, specifies the strength of this influence. The probability of observing whether the
person saved money or not, given the different x’s, is the cumulative density evaluated at the
point xkβk.
Given the nonlinearity of probit models, which means that the relationship between a
change in the value of an independent variable and the estimated change in the probability of
a positive outcome cannot be discerned directly from the variable’s coefficient, not only a
probit model is estimated, but also the marginal effects. The marginal effect, i.e. the partial
change in the probability, is computed by taking the partial derivative of Equation (2) with
respect to xk:
(3) marginal effect of xk = k
B
xxSPR
∂=∂ )|1(
The marginal effect of an independent variable xk is the slope of the probability curve
relating xk to Pr(SB=1|x) holding all other x constant. Thus, the partial effect of xk on Pr(SB
=1|x) depends on x. The derivative is evaluated at a point that is usually, and by default, the
means of the independent variables. The marginal effect for a dummy variable is not obtained
by differentiation, but as a difference of the predicted value at 1 and the predicted value at 0.
4. Estimation
In this section, on the one hand, we explain the used data sets and the including variables, and,
on the other hand, we document our basic result: there exist a positive relationship between
the saving behavior of an individual and her religion, i.e. religious people and people
attending more frequently church have a higher propensity to save.
4.1 Data Description
Using the PSID survey, a longitudinal study of a representative sample of the U.S. population,
our data include individual and family variables on an array of economic, social and political
indicators. We use data for the years 2003 and 2005 for which consistent information was
available on measures of religious involvement and believing.
Out of the original 47,381 individuals we discard 38,354 individuals due to that they
were not real current heads, due to that there was no information on religion and no
information on church attendance. Our dataset includes 15,824 observations and 9,027
individuals aged from 16 to 99 who were current head of household (men, women, and
children).
We use two dependent variables to measure the impact of religious believing on the
saving behavior. SAVED, encompass any money in checking or savings accounts, money
market funds, certificates of deposit, government savings bonds, or treasury bills, i.e. all cash
assets. It excludes assets held in employer-based pensions or individual retirement savings
programs. If people do not own a checking account with saved money, the variable takes on
the value zero and one otherwise. The variable SAVINGS indicates the real amount saved in
the years 2003 and 2005 in 2005 US dollar. Due to the fact that not all individuals indicated
their amount, the case number reduces for the analysis of SAVINGS.
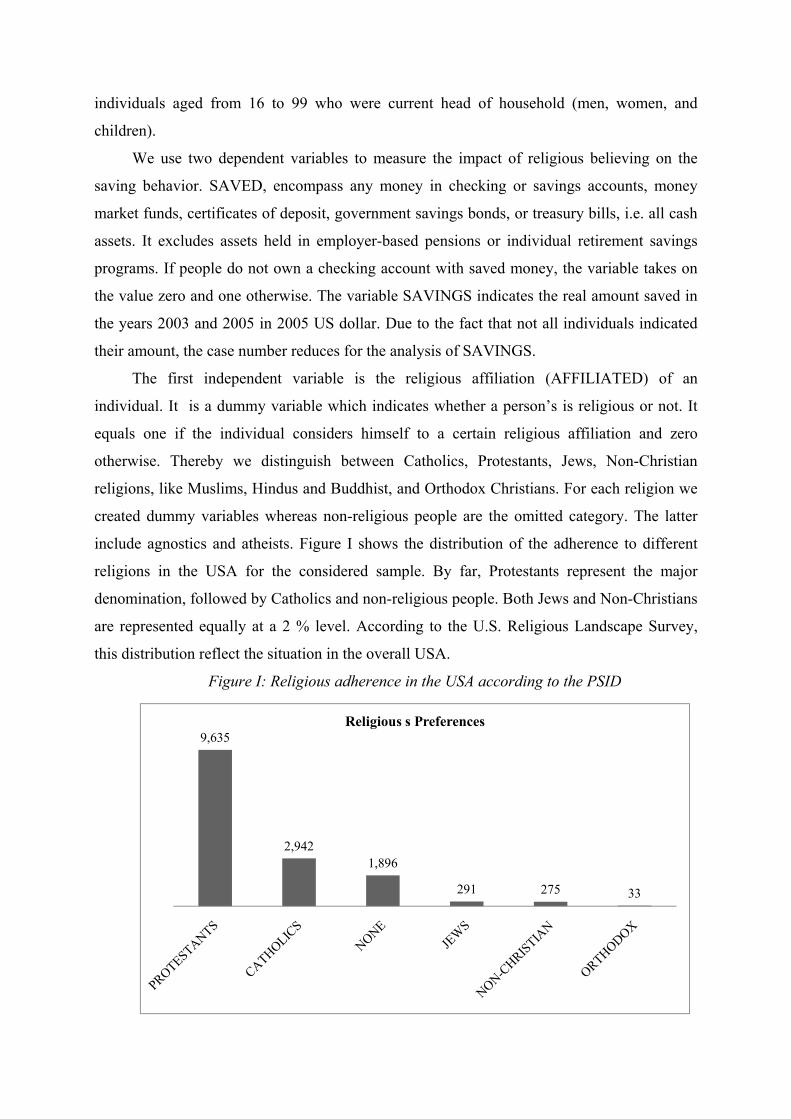
The first independent variable is the religious affiliation (AFFILIATED) of an
individual. It is a dummy variable which indicates whether a person’s is religious or not. It
equals one if the individual considers himself to a certain religious affiliation and zero
otherwise. Thereby we distinguish between Catholics, Protestants, Jews, Non-Christian
religions, like Muslims, Hindus and Buddhist, and Orthodox Christians. For each religion we
created dummy variables whereas non-religious people are the omitted category. The latter
include agnostics and atheists. Figure I shows the distribution of the adherence to different
religions in the USA for the considered sample. By far, Protestants represent the major
denomination, followed by Catholics and non-religious people. Both Jews and Non-Christians
are represented equally at a 2 % level. According to the U.S. Religious Landscape Survey,
this distribution reflect the situation in the overall USA.
Figure I: Religious adherence in the USA according to the PSID
9,635
2,9421,896
291 275 33
Religious s Preferences
The variable CHURCH ATTENDANCE illustrates how often the head on average go to
church per year. It ranges from daily to yearly. We abstract from the private dimension of
religion (e.g. importance of religion, private prayer), since we suggest that possible network
effects of religiosity are only captured when looking at the public dimensions of religiosity.
Based on the literature dealing with the relationship of religion and economic relevant
individual decisions, we control for a large number of background characteristics (such as
income, wealth and employment) and demographic variables (such as gender and age, health,
family size, marital status, education, race). INCOME is defined by the total family money
income per year, including taxable and transfer income, as well as social security income of
all family members. Additionally, we consider the variable EQUIVALENT INCOME to
control for the fact that individuals living together in one household might profit from
economies of scale. Therefore the income of persons living in households with different
family compositions are not comparable. The equivalent income is calculated by the total
income of the households divided by the sum of the weights of the people living in the
household, namely the spouse of the head and the number of children. Divergently to the
weights used by the OECD, we use the factor 1 for the head, 0.5 for adults over 17 years, and
0.3 for children up to 17 still living in the household. Since the decisions to save a certain
amount of money or to save at all depend not only on the current income, but also on the
endowment with other assets, we consider WEALTH as a measure of how wealthy a
household is. Hence, we calculate the net wealth of each household by aggregating the value
of all assets, including the net values of the main house, vehicles, stocks, shares in own
business, contracts on land etc., and subtracting other debts. All financial figures were
adjusted due to changes in the consumer price index in the USA using COLA. Furthermore a
dummy for EMPLOYED is considered measuring whether an individual is employed at the
moment or not. The variable takes on the value one if the head is working at the moment, or
only temporarily laid off, and the value zero if the head is looking for work, unemployed,
retired, permanently disabled, “housewife” or a student.
SEX of an individual is devoted to one if the individual is male, otherwise it is zero. We
include the health status of a person (HEALTH) to control for the fact that households in poor
health are less likely to hold risky financial assets (Rosen and Wu 2007). The health status can
take on the values excellent, very good, good, fair, or poor. The MARITAL STATUS is a
dummy variable coded one if the person is married and otherwise zero and counts for the
composition of the household as well FAMILY SIZE and CHILDREN, the number of the
children in the household, do. The family compositions seems to be important since we
assume that the savings are probably smaller the larger the family and the higher the transfers
to the family abroad are. RACE represents the different races and ethnic groups in the U.S.
We created dummy variables for Whites, Blacks, Latinos and Others, including American
Native, Asian and Native Hawaiian or Pacific Islander people, while Whites are the omitted
category. In all, 40.62 % of the selected sample is non-white.
Since education was found to raise asset accumulation, we include educational levels as
control variables. For example, Bernheim (1997) found that high school students who receive
instructions related to household financial decision-making, like budgeting, credit
management, saving and investment, accumulate in the adulthood more assets. The PSID
define EDUCATION as the highest grade, which ranges from one to seventeen, the
respondent completed at school. We created dummy variables for holding a high school
degree (HIGH SCHOOL), for people who got a high school degree and went to the college,
but did not get a degree there (PRE COLLEGE), and for people holding a college degree,
including people with at least one year of post-graduation or more (COLLEGE). People who
did not get at least a high school degree are the omitted category.
The economic environment where the head grew up is taken into consideration, too. As
Charles and Hurst (2003) pointed out, wealthier parents invest more in “their children's
education, give their children financial gifts, or pass on similar savings behavior.” Therefore it
seems to be likely that heads who grew up with wealthy parents might save more today than
heads who grew up with poor parents do. We created two dummy variables which measure
the economic milieu where the head was growing up. VARIED and WELL-OFF indicate
whether the economic situation of the parents was varying or pretty well off. Growing up in a
poor economic environment is the omitted category. Moreover, since the economic choices of
the current head might be shaped by a direct learning effect from his father, the education of
the head’s father will also be included as a control variable. In the regression analyses marital
status, age, race and the education of the head’s father are referred to as “OTHER
CONTROLS”.
4.2 Descriptive Statistics
Table I shows summery statistics (number of observations, mean, standard deviation
minimum and maximum) for the variables outlined above.
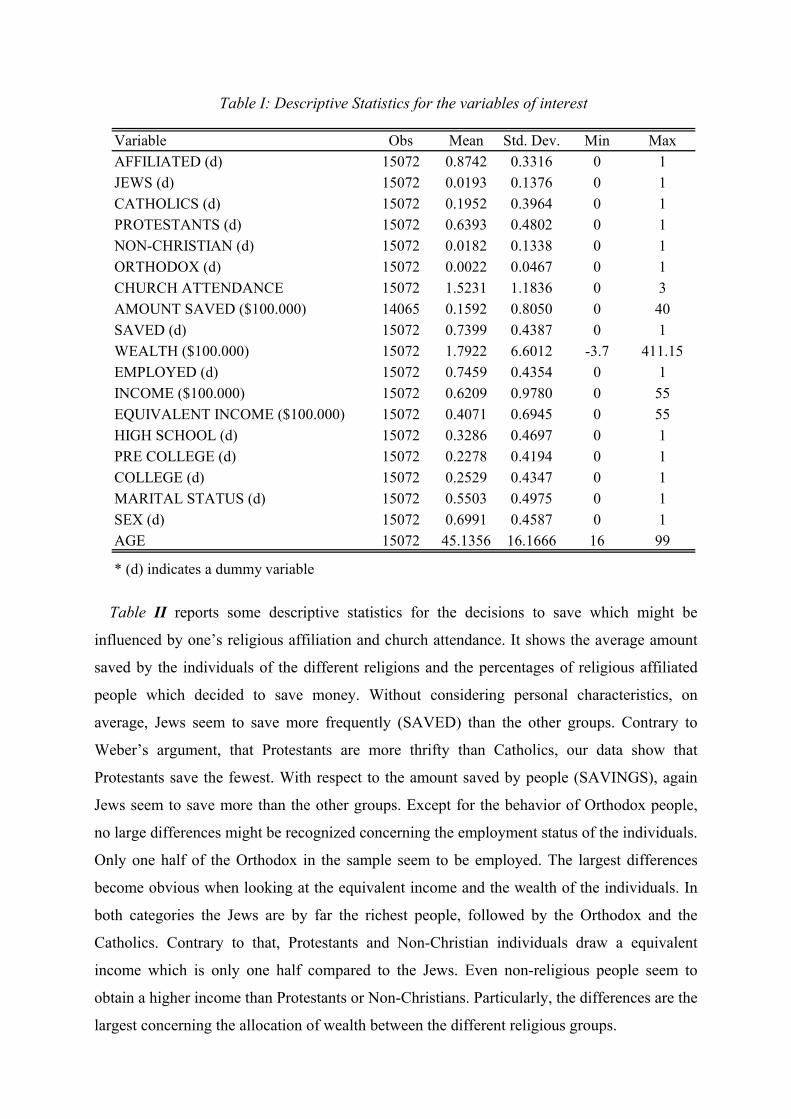
Table I: Descriptive Statistics for the variables of interest
Variable Obs Mean Std. Dev. Min MaxAFFILIATED (d) 15072 0.8742 0.3316 0 1JEWS (d) 15072 0.0193 0.1376 0 1CATHOLICS (d) 15072 0.1952 0.3964 0 1PROTESTANTS (d) 15072 0.6393 0.4802 0 1NON-CHRISTIAN (d) 15072 0.0182 0.1338 0 1ORTHODOX (d) 15072 0.0022 0.0467 0 1CHURCH ATTENDANCE 15072 1.5231 1.1836 0 3AMOUNT SAVED ($100.000) 14065 0.1592 0.8050 0 40SAVED (d) 15072 0.7399 0.4387 0 1WEALTH ($100.000) 15072 1.7922 6.6012 -3.7 411.15EMPLOYED (d) 15072 0.7459 0.4354 0 1INCOME ($100.000) 15072 0.6209 0.9780 0 55EQUIVALENT INCOME ($100.000) 15072 0.4071 0.6945 0 55HIGH SCHOOL (d) 15072 0.3286 0.4697 0 1PRE COLLEGE (d) 15072 0.2278 0.4194 0 1COLLEGE (d) 15072 0.2529 0.4347 0 1MARITAL STATUS (d) 15072 0.5503 0.4975 0 1SEX (d) 15072 0.6991 0.4587 0 1AGE 15072 45.1356 16.1666 16 99
* (d) indicates a dummy variable
Table II reports some descriptive statistics for the decisions to save which might be
influenced by one’s religious affiliation and church attendance. It shows the average amount
saved by the individuals of the different religions and the percentages of religious affiliated
people which decided to save money. Without considering personal characteristics, on
average, Jews seem to save more frequently (SAVED) than the other groups. Contrary to
Weber’s argument, that Protestants are more thrifty than Catholics, our data show that
Protestants save the fewest. With respect to the amount saved by people (SAVINGS), again
Jews seem to save more than the other groups. Except for the behavior of Orthodox people,
no large differences might be recognized concerning the employment status of the individuals.
Only one half of the Orthodox in the sample seem to be employed. The largest differences
become obvious when looking at the equivalent income and the wealth of the individuals. In
both categories the Jews are by far the richest people, followed by the Orthodox and the
Catholics. Contrary to that, Protestants and Non-Christian individuals draw a equivalent
income which is only one half compared to the Jews. Even non-religious people seem to
obtain a higher income than Protestants or Non-Christians. Particularly, the differences are the
largest concerning the allocation of wealth between the different religious groups.
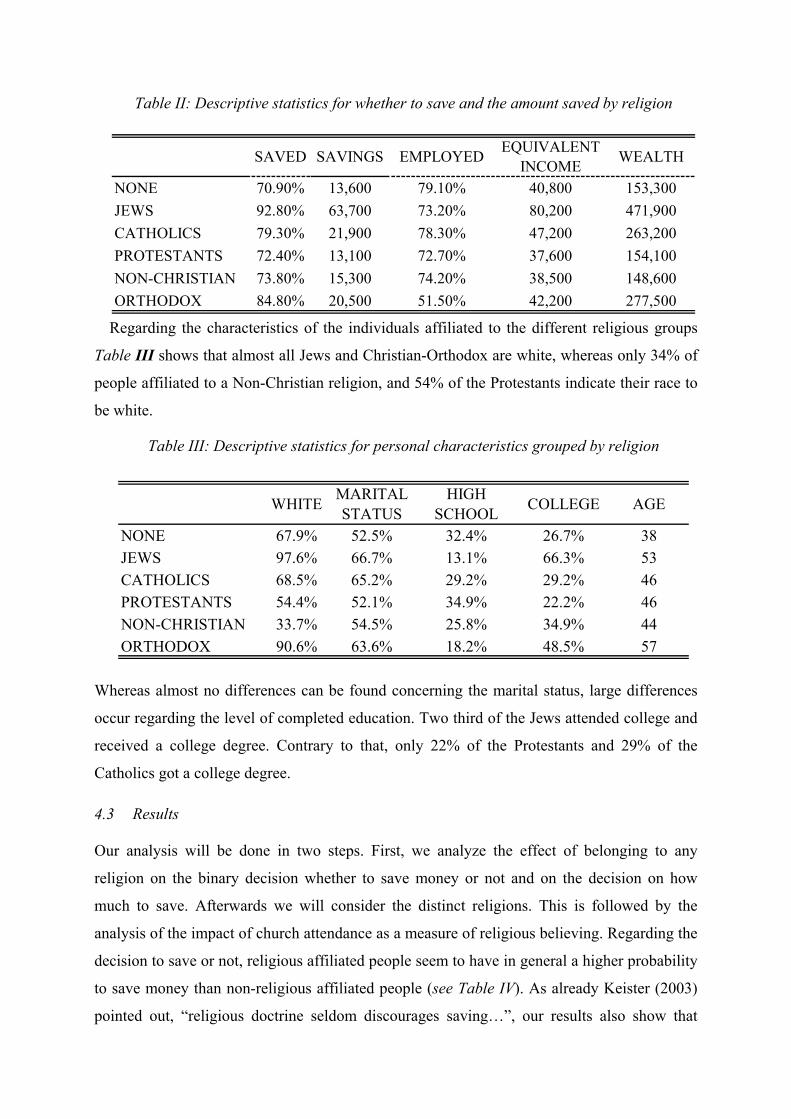
Table II: Descriptive statistics for whether to save and the amount saved by religion
SAVED SAVINGS EMPLOYED EQUIVALENT INCOME WEALTH
NONE 70.90% 13,600 79.10% 40,800 153,300JEWS 92.80% 63,700 73.20% 80,200 471,900CATHOLICS 79.30% 21,900 78.30% 47,200 263,200PROTESTANTS 72.40% 13,100 72.70% 37,600 154,100NON-CHRISTIAN 73.80% 15,300 74.20% 38,500 148,600ORTHODOX 84.80% 20,500 51.50% 42,200 277,500
Regarding the characteristics of the individuals affiliated to the different religious groups
Table III shows that almost all Jews and Christian-Orthodox are white, whereas only 34% of
people affiliated to a Non-Christian religion, and 54% of the Protestants indicate their race to
be white.
Table III: Descriptive statistics for personal characteristics grouped by religion
WHITE MARITAL STATUS
HIGH SCHOOL COLLEGE AGE
NONE 67.9% 52.5% 32.4% 26.7% 38JEWS 97.6% 66.7% 13.1% 66.3% 53CATHOLICS 68.5% 65.2% 29.2% 29.2% 46PROTESTANTS 54.4% 52.1% 34.9% 22.2% 46NON-CHRISTIAN 33.7% 54.5% 25.8% 34.9% 44ORTHODOX 90.6% 63.6% 18.2% 48.5% 57
Whereas almost no differences can be found concerning the marital status, large differences
occur regarding the level of completed education. Two third of the Jews attended college and
received a college degree. Contrary to that, only 22% of the Protestants and 29% of the
Catholics got a college degree.
4.3 Results
Our analysis will be done in two steps. First, we analyze the effect of belonging to any
religion on the binary decision whether to save money or not and on the decision on how
much to save. Afterwards we will consider the distinct religions. This is followed by the
analysis of the impact of church attendance as a measure of religious believing. Regarding the
decision to save or not, religious affiliated people seem to have in general a higher probability
to save money than non-religious affiliated people (see Table IV). As already Keister (2003)
pointed out, “religious doctrine seldom discourages saving…”, our results also show that
religious people are 3 percentage points more likely to save money than non-religious people.
Regarding the effects of the several religions, it becomes clear that the propensity to save of
Jews is twice as high as that of Protestants. Nevertheless Protestants have a 3.4 percentage
points higher probability to save than non-religious people. In the unconditioned sample the
effects of the other religions on the decision whether to save or not were not found to be
statistically significant. However, when looking at white males only, Jews and Non-Christens
have the highest propensity to save money, all other things equal.1 Regarding the relationship
between white male Catholics and white male Protestants the results indicate that they nearly
have the same propensity to save money. Protestants seem to have just a slightly higher
propensity to save than Catholics. Moreover, both groups have a 2.3, respectively 2.8,
percentage points higher probability to save money compared to non-white non-religious
people. Orthodox people seem to save on average a half percentage point less than non-
religious people. However, this result is not statistically significant probability due to the
small number of Orthodox people in the sample.
When looking at the amount saved by religious affiliated people in general, and by the
adherents of the different religions, it becomes clear that we obtain a different picture. People
belonging to a religion seem to save $2,200 less than non-religious people. Except for the
Jewish religion, all other religions have a negative impact on the amount people decided to
save. As suggested above, Jews save the most. They save $25,000 more a year than non-
religious people and even more than all the other religions, since the coefficients for the other
religions are all negative. Thereby only small differences exist between Catholics and Non-
Christians.
1 Results for white males will be delivered on request.
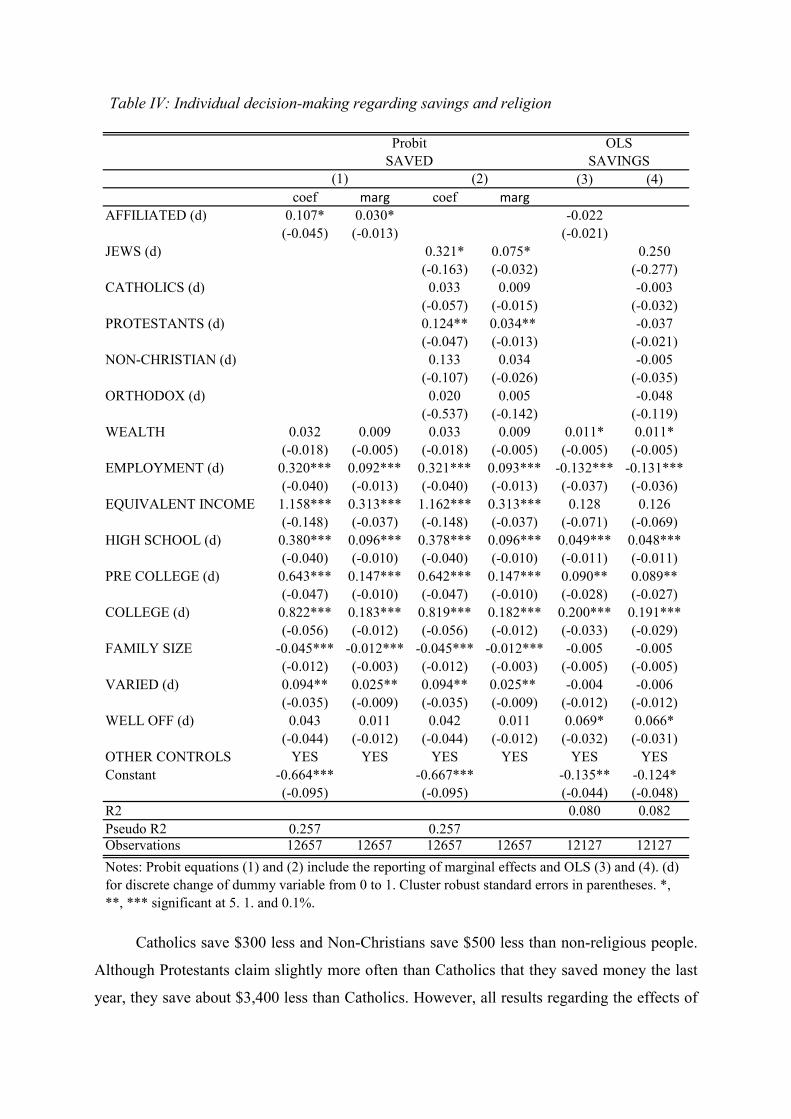
Table IV: Individual decision-making regarding savings and religion
(3) (4)coef marg coef marg
AFFILIATED (d) 0.107* 0.030* -0.022(-0.045) (-0.013) (-0.021)
JEWS (d) 0.321* 0.075* 0.250(-0.163) (-0.032) (-0.277)
CATHOLICS (d) 0.033 0.009 -0.003(-0.057) (-0.015) (-0.032)
PROTESTANTS (d) 0.124** 0.034** -0.037(-0.047) (-0.013) (-0.021)
NON-CHRISTIAN (d) 0.133 0.034 -0.005(-0.107) (-0.026) (-0.035)
ORTHODOX (d) 0.020 0.005 -0.048(-0.537) (-0.142) (-0.119)
WEALTH 0.032 0.009 0.033 0.009 0.011* 0.011*(-0.018) (-0.005) (-0.018) (-0.005) (-0.005) (-0.005)
EMPLOYMENT (d) 0.320*** 0.092*** 0.321*** 0.093*** -0.132*** -0.131***(-0.040) (-0.013) (-0.040) (-0.013) (-0.037) (-0.036)
EQUIVALENT INCOME 1.158*** 0.313*** 1.162*** 0.313*** 0.128 0.126(-0.148) (-0.037) (-0.148) (-0.037) (-0.071) (-0.069)
HIGH SCHOOL (d) 0.380*** 0.096*** 0.378*** 0.096*** 0.049*** 0.048***(-0.040) (-0.010) (-0.040) (-0.010) (-0.011) (-0.011)
PRE COLLEGE (d) 0.643*** 0.147*** 0.642*** 0.147*** 0.090** 0.089**(-0.047) (-0.010) (-0.047) (-0.010) (-0.028) (-0.027)
COLLEGE (d) 0.822*** 0.183*** 0.819*** 0.182*** 0.200*** 0.191***(-0.056) (-0.012) (-0.056) (-0.012) (-0.033) (-0.029)
FAMILY SIZE -0.045*** -0.012*** -0.045*** -0.012*** -0.005 -0.005(-0.012) (-0.003) (-0.012) (-0.003) (-0.005) (-0.005)
VARIED (d) 0.094** 0.025** 0.094** 0.025** -0.004 -0.006(-0.035) (-0.009) (-0.035) (-0.009) (-0.012) (-0.012)
WELL OFF (d) 0.043 0.011 0.042 0.011 0.069* 0.066*(-0.044) (-0.012) (-0.044) (-0.012) (-0.032) (-0.031)
OTHER CONTROLS YES YES YES YES YES YESConstant -0.664*** -0.667*** -0.135** -0.124*
(-0.095) (-0.095) (-0.044) (-0.048)R2 0.080 0.082Pseudo R2 0.257 0.257 Observations 12657 12657 12657 12657 12127 12127
ProbitSAVED
OLSSAVINGS
Notes: Probit equations (1) and (2) include the reporting of marginal effects and OLS (3) and (4). (d) for discrete change of dummy variable from 0 to 1. Cluster robust standard errors in parentheses. *, **, *** significant at 5. 1. and 0.1%.
(1) (2)
Catholics save $300 less and Non-Christians save $500 less than non-religious people.
Although Protestants claim slightly more often than Catholics that they saved money the last
year, they save about $3,400 less than Catholics. However, all results regarding the effects of
being affiliated in general and being affiliated to a certain religion on the actual amount saved
were not found to be statistically significant.
Regarding the control variables it becomes clear that the wealthier the family is the
more they will save. An increase in the net value of all assets by $100,000 increases the
amount of money saved by $1,100. Moreover, an increase in the equivalent income by
$100,000 raises the probability to save by 31.3 percentage points. Employed people are 9.3
percentage points more likely to save money than not employed people. Contrary to that
employed people save on average $13,100 less than people who are not employed. This might
be explained by the fact that especially unemployed people are faced with a higher
uncertainty regarding the future and therefore might save more of their available money in the
present to hedge against these uncertainties. The higher the obtained education of the
individual the higher is not only the probability to save money but also the amount which is
saved. People who got a college degree have a 8.7 higher probability to save than people who
got a high school degree. Moreover, they save $14,300 more per year than people who got a
high school degree and $10,200 more than people who attended college but did not get a
degree there. The household size seems to affect the decision whether to save, while no effect
was found for the effect on the amount saved. With an increase in the family by one person
the propensity to save decreases by 1.2 percentage points. Regarding the other control
variables like age, marital status, race and education of the father, we find out that the older
the person is the more she is saving. Black Americans and Latinos have on average a lower
propensity to save than white Americans and save a lower amount of money. For example,
black Americans have a 24.4 percentage points lower probability to save and save on average
$6,700 less per year than white Americans. Regarding the impact of the education of the
head’s father on the head’s decision to save we did not find an effect.
Since the decision to save seems not only to be influenced by one’s religious affiliation,
we now take a closer look at the variable church attendance (see Table V). Assuming that
people going to church do believe in the teachings of a certain religion, we use the frequency
of attending religious services as a measure for religious believing. The data show that the
more often people going to church, i.e. the more religious they are, the higher is their
propensity to save money. People going once a week or more to church have a 1.6 percentage
points higher probability to save money compared to people going less than once a month to
church and a 6.4 percentage points higher probability than people never attending church.
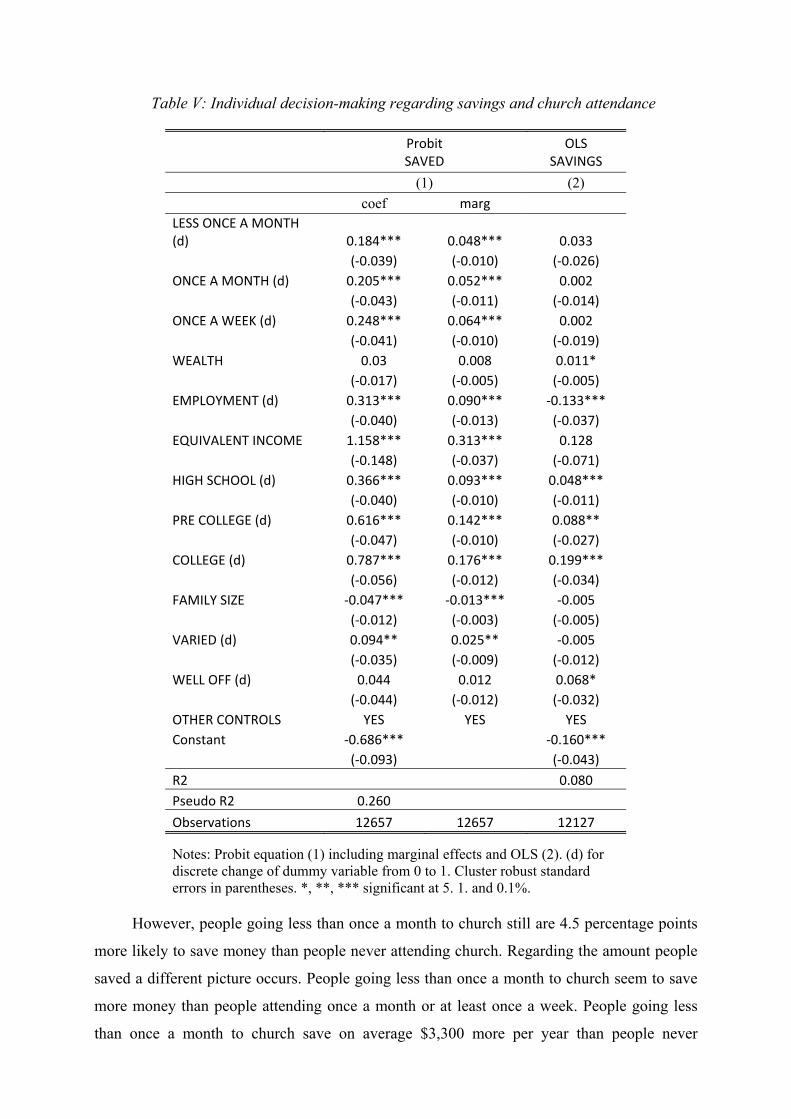
Table V: Individual decision-making regarding savings and church attendance
Probit SAVED
OLS SAVINGS
(1) (2) coef marg LESS ONCE A MONTH (d) 0.184*** 0.048*** 0.033 (‐0.039) (‐0.010) (‐0.026) ONCE A MONTH (d) 0.205*** 0.052*** 0.002 (‐0.043) (‐0.011) (‐0.014) ONCE A WEEK (d) 0.248*** 0.064*** 0.002 (‐0.041) (‐0.010) (‐0.019) WEALTH 0.03 0.008 0.011* (‐0.017) (‐0.005) (‐0.005) EMPLOYMENT (d) 0.313*** 0.090*** ‐0.133*** (‐0.040) (‐0.013) (‐0.037) EQUIVALENT INCOME 1.158*** 0.313*** 0.128 (‐0.148) (‐0.037) (‐0.071) HIGH SCHOOL (d) 0.366*** 0.093*** 0.048*** (‐0.040) (‐0.010) (‐0.011) PRE COLLEGE (d) 0.616*** 0.142*** 0.088** (‐0.047) (‐0.010) (‐0.027) COLLEGE (d) 0.787*** 0.176*** 0.199*** (‐0.056) (‐0.012) (‐0.034) FAMILY SIZE ‐0.047*** ‐0.013*** ‐0.005 (‐0.012) (‐0.003) (‐0.005) VARIED (d) 0.094** 0.025** ‐0.005 (‐0.035) (‐0.009) (‐0.012) WELL OFF (d) 0.044 0.012 0.068* (‐0.044) (‐0.012) (‐0.032) OTHER CONTROLS YES YES YES Constant ‐0.686*** ‐0.160*** (‐0.093) (‐0.043) R2 0.080 Pseudo R2 0.260
Observations 12657 12657 12127
Notes: Probit equation (1) including marginal effects and OLS (2). (d) for discrete change of dummy variable from 0 to 1. Cluster robust standard errors in parentheses. *, **, *** significant at 5. 1. and 0.1%.
However, people going less than once a month to church still are 4.5 percentage points
more likely to save money than people never attending church. Regarding the amount people
saved a different picture occurs. People going less than once a month to church seem to save
more money than people attending once a month or at least once a week. People going less
than once a month to church save on average $3,300 more per year than people never
attending. This is $3,100 more than people attending more often save. People going once a
month and more to church merely save on average $200 more than people never attending
church. This might be explained by the fact that people attending more often might rather
donate a higher amount of money to the church than saving it on their account. However, the
effects of attending church on the amount of money saved by the individuals is not statically
significant.
5. Conclusion
Religious beliefs and participation were found to impact the prosperity of households. Not
only the attitudes, but also the actual behavior of individuals might be influenced by ideas on
morality and good conduct which, in conjunction with religious ideas, were conveyed by
religions. Regarding the decision to save money no large differences within the Christian
religions, namely Protestants and Catholics, were found. However, large differences exist
compared to non-religious people as well as to Non-Christians and Jews. As previous studies
already suggested, on the individual level Jews save the most, all other things equal. Although
the decision whether to save money seems to be influenced by one’s religious affiliation, no
statistically significant effect was found for the influence of one’s religious affiliation on the
decision concerning a certain amount of money to save. With regard to the impact of
attending church on the savings decisions nearly the same pattern occurs. The more often
people attending religious services the higher is the probability to save money. With respect to
the amount saved, again no effects could be found. Comparing the impact of religious
belonging, measured by one’s religious affiliation, and religious believing, measured by
attending church, the results show that believing seems to matter more. People who are going
to church, even only less than once a month, are 4.8 percentage points more likely to save,
whereas people belonging to a religion are only 3.0 percentage points more likely to save
money than non-religious people.
In the context of economic development one might ask what to do with that knowledge.
Does it make sense to foster religions? Probably not. On the one hand, religions are just one
factor among others which are determining the development process, and, on the other hand,
religion as an institution need time to diffuse into the society. However, understanding how
religious beliefs influence economic decisions of individuals might help to gain further
insights into the causes of differing recourse endowments of individuals This is an essential
supposition to design policy instruments whose aim is to improve these endowments.
In a globalized world which is no longer shaped by state frontiers, but rather cultural
frontiers (Huntington 1998), answering the question how religions will interact in the future,
will show if the positive effects of religiosity might be used for economic issues. Only if a
peaceful and respectful contact is fostered, economical gains are also possible.
References
Allport, Gordon and Michael Ross. 1967. “Personal religious orientation and prejudice.”
Journal of Personality and Social Psychology. 5: 432–433.
Arruñada, Benito. March 2004. “The Economic Effects of Christian Moralities.” Universitat
Pompeu Fabra, Economics Working Papers no. 743.
Bernheim, Douglas and Daniel Maki Dean Garret. June 1997. “Education and Saving: The
Long-Term Effects of High School Financial Curriculum Mandates.” National Bureau
of Economic Research, Working Paper Series 6085no.
Carrol, Christopher Rhee Byung-Kun Rhee Changyong. 1994. “Are there cultural effects
on saving? Some cross-sectional evidence.” Quarterly Journal of Economics.
109(3): 685–699.
Cervellati, Matteo, MArcel Jansen, and Uwe Sunde. Max 27, 2008. “Religious Norms and
Long Term Development: Insurance, Human Capital and Technological Change.”. work
in progress.
Charles, Kervin and Erik Hurst. 2003. “The Correlation of Wealth across Generations.”
Journal of Political Economy. 111(6): 1155–1182.
Gorsuch, Richard. 1988. “Psychology of Religion.” Annual Review of Psychology. 39: 201–
221.
Guiso, Luigi, Paola Sapienza, and Luigi Zingales. 2003. “People's opium? Religion and
economic attitudes.” Journal of Monetary Economics. 50(1): 225–282.
Guiso, Luigi, Paola Sapienza, and Luigi Zingales. 2006. “Does culture affect economic
outcomes?” Journal of Economic Perspectives. 20(2).
Huntington, Samuel. 1998. The Clash of Civilizations and the Remaking of World Order.
Simon & Schuster.
Iannaccone, Laurence. 1998. “Introduction to the Economics of Religion.” Journal of
Economic Literature. 36(3): 1465–1495.
Keister, Lisa. 2003. “Religion and wealth: The role of religious affiliation and participation
in early adult asset accumulation.” Social Forces. 82: 175–207.
Kuran, Timur. 1995. Private Truths, Public Lies: The Social Consequences of Preference
Falsification. Cambridge, MA: Harvard University Press.
Long, Scott. 1997. Regression Models for Categorical and Limited Dependent
Variables: Thousand Oaks: Sage.
Marshall, Alfred. 1920. “Principles of Economics." Retrieved October 24, 2008, from
Library of Economics and Liberty. Available at:
http://www.econlib.org/library/Marshall/marP.html, access date: 04 January 2010.
McCleary, Rachel M. 2007. “Salvation, Damnation, and Economic Incentives.” Journal of
Contemporary Religion. 22(1): 49–74.
Quran. Available at http://www.quran.com/, access date: 10 January 2010.
Renneboog, Luc and Christophe Spaenjers. May 2009. “Where angels fear to Trade: The
Role if Religion in Household Finance.” CentER Disscusion Paper No. 2009-34.
Roman Catholic Church. 1964. Dogmatic Constitution on the Church. Lumen gentium.
Vatican Archives. Available at
http://www.vatican.va/archive/hist_councils/ii_vatican_council/documents/vat-
ii_const_19641121_lumen-gentium_en.html/, access date: 05 January 2010.
Rosen, Harvey and Stephen Wu. 2007. “Portfolio choice and health status.” Journal of
Financial Economics. 72: 457–484.
Stark, Rodney and William Bainbridge. 1985. The Future of Religion: Secularization,
Revival, and Cult Formation. Berkeley: University of California Press.
Stulz, René and Rohan Williamson. 2003. “Culture, openness, and finance.” Journal of
Financial Economics. 70: 313–349.
The Pew Forum on Religion & Public Life. 2008. “U.S. Religious Landscape Survey.
Religious Affiliation: Diverse and Dynamic.”.
Weber, Max. 1904/05. Die protestantische Ethik und der Geist des Kapitalismus.
Erftstadt: AREA Verlag, 2005.
Wooldridge, Jeffry. 2002. Econometric Analysis of Cross Section and Panel Data.
Massachusetts: MIT-Press.

Appendix I: Variable Definition
Question / Statement
Dependent Variables
SAVED Does your FAMILY have any savings, such as checking or savingsaccounts, or government bonds?
SAVINGS If you added up all such accounts (for all of your family living thereabout how much would they amount to right now (in 2005 US dolla
Religion
AFFILIATED Do you have a religious preference?
CATHOLICS, JEWS, PROTESTANTS; NON-CHRISTIANS, NONE What is your religious preference?
CHURCH ATTENDANCE How often do you go to religious services ?
Control Variables SEX Sex of Individual AGE Age at the time of the interview
WHITE, LATINO, NEGRO, OTHERS Are you white, black, Native American, Asian, Pacific Islander, or another race?
MARITAL STATUS Are you married?
CHILDREN Number of children under 18 living with the family
H-SIZE Number of people (children plus adults) living currently in the famiunit
HEALTH Would you say your health in general is excellent, very good, goodor poor?
HIGH SCHOOL; PRE COLLEGE; COLLEGE
Dummy variables which indicates whether the head got at least a hischool degree, attended college, or got a college degree.
INCOME Total money income of all family members (Taxable Income, TranIncome, Social Security Income) the year before in 2005 US dollar
EQUIVALENT INCOME INCOME is weighted after household size and composition.
WEALTH Sum of net values of the main house, other real estates, vehicles, buand farms owned, stocks, IRA's and other assets, minus other debts

EMPLOYED Are you working now?
VARIED; WELL OFF Dummy variables which indicates whether the head’s parents were when he was growing up, pretty well off, or did the situation vary. Pis the omitted category.
HIGH SCHOOL Father, HIGH SCHOOL Father, COLLEGE Father
Education of head's father: no education, at least high school degreattend pre-college, or college degree.
Working Paper Series in Economics (recent issues)
No.161: Nils Braakmann: The consequences of own and spousal disability on labor market outcomes and objective well-being: Evidence from Germany, January 2010
No.160: Norbert Olah, Thomas Huth und Dirk Löhr: Geldpolitik mit optimaler Zinsstruktur, Januar 2010.
No.159: Markus Groth: Zur Relevanz von Bestandseffekten und der Fundamentalen Transformation in wiederholten Biodiversitätsschutz-Ausschreibungen, Januar 2010
No.158: Franziska Boneberg: Die gegen das Drittelbeteiligungsgesetz verstoßende Aufsichtsratslücke existiert. Replik zu „Das Fehlen eines Aufsichtsrates muss nicht rechtswidrig sein“ von Alexander Dilger, Januar 2010 [erscheint in: Zeitschrift für Industrielle Beziehungen, 1 (2010)]
No.157: Institut für Volkswirtschaftslehre: Forschungsbericht 2009, Januar 2010
No.156: Alexander Vogel, Joachim Wagner, Kerstin Brunken und Arno Brandt: Zur Beschäftigungsentwicklung in der Region Hannover - Ein Vergleich mit 12 deutschen Verdichtungsräumen, Dezember 2009
No.155: Nils Braakmann and Joachim Wagner: Labor market adjustments after a great import shock: Evidence from the German clothing industry and the Multi-Fibre Arrangement, December 2009
No.154: Joachim Wagner: Zehn Jahre European Data Watch: Dokumentation von Datensätzen für die empirische Wirtschafts- und Sozialforschung und Zugangswegen zu den Daten, Dezember 2009
No.153: Joachim Wagner: Offshoring and work performance: Self-Selection, effects on performance, or both? December 2009
No.152: Christian Pfeifer: Effective Working Hours and Wages: The Case of Downward Adjustment via Paid Absenteeism, November 2009
No.151: Christian Pfeifer: Adjustment of Deferred Compensation Schemes, Fairness Concerns, and Hiring of Older Workers, November 2009
No.150: Franziska Boneberg: Recht und Realität von Mitbestimmung im westdeutschen Dienstleistungssektor: 11 Fallstudien, November 2009
No.149: Birgit Müller, Martin Quaas, Karin Frank and Stefan Baumgärtner: Pitfalls and potential of institutional change: Rain-index insurance and the sustainability of rangeland management, November 2009
No.148: Alexander Vogel, Florian Burg, Stefan Dittrich und Joachim Wagner: Zur Dynamik der Export- und Importbeteiligung deutscher Industrieunternehmen – Empirische Befunde aus dem Umsatzsteuerpanel 2001-2006, Oktober 2009 [publiziert in: Wirtschaft und Statistik, Heft 11(2009), 1109-1116]
No.147: Markus Groth: Potentiale und Risiken der Nutzung von Methan aus Methanhydraten als Energieträger, Oktober 2009
No.146: Sandra Derissen, Martin Quaas and Stefan Baumgärtner: The relationship between resilience and sustainable development of ecological-economic systems, October 2009
No.145: Anne-Kathrin Last und Heike Wetzel: Effizienzmessverfahren – Eine Einführung, September 2009
No.144: Horst Raff and Joachim Wagner: Intra-Industry Adjustment to Import Competition: Theory and Application to the German Clothing Industry, September 2009 [forthcoming in: The World Economy]
No.143: Nils Braakmann: Are there social returns to both firm-level and regional human capital? – Evidence from German social security data. September 2009
No.142: Nils Braakmann and Alexander Vogel: How does economic integration influence employment and wages in border regions? The case of the EU-enlargement 2004 and Germany’s eastern border, September 2009
No.141: Stefanie Glotzbach and Stefan Baumgärtner: The relationship between intra- and intergenerational ecological justice. Determinants of goal conflicts and synergies in sustainability policy. September 2009
No.140: Alexander Vogel: Exportprämien unternehmensnaher Dienstleister in Niedersachsen, September 2009
No.139: Alexander Vogel: Die Dynamik der Export- und Importbeteiligung niedersächsischer Industrieunternehmen im interregionalen Vergleich 2001-2006, September 2009
No.138: Stefan Baumgärtner and Martin F. Quaas: What is sustainability economics? September 2009 [published in: Ecological Economics 69 (2010), 3, , 445 - 450]
No.137: Roland Olbrich, Martin F. Quaas and Stefan Baumgärtner: Sustainable use of ecosystem services under multiple risks – a survey of commercial cattle farmers in semi-arid rangelands in Namibia, September 2009
No.136: Joachim Wagner: One-third codetermination at company supervisory boards and firm performance in German manufacturing industries: First direct evidence from a new type of enterprise data, August 2009
No.135: Joachim Wagner: The Reasearch Potential of New Types of Enterprise Data based on Surveys from Official Statistics in Germany, August 2009
No.134: Anne-Kathrin Last and Heike Wetzel: The Efficiency of German Public Theaters: A Stochastic Frontier Analysis Approach, July 2009
No.133: Markus Groth: Das Conservation Reserve Program: Erfahrungen und Perspektiven für die europäische Agrarumweltpolitik, Juli 2009 [published in: Zeitschrift für Umweltpolitik und Umweltrecht, Heft 4 (2009), 447-468]
No.132: Stefan Baumgärtner and Sebastian Strunz: The economic insurance value of ecosystem resilience, July 2009
No.131: Matthias Schröter, Oliver Jakoby, Roland Olbrich, Marcus Eichhorn and Stefan Baumgärtner: Remote sensing of bush encroachment on commercial cattle farms in semi-arid rangelands in Namibia, July 2009
No.130: Nils Braakmann: Other-regarding preferences, spousal disability and happiness: Evidence for German Couples, May 2009
No.129: Alexander Vogel and Joachim Wagner: Exports and Profitability – First Evidence for German Services Enterprises, May 2009 [forthcoming in: Applied Economics Quarterly]
No.128: Sebastian Troch: Drittelbeteiligung im Aufsichtsrat – Gesetzliche Regelung versus Unternehmenspraxis. Ausmaß und Bestimmungsgründe der Umgehung des Drittelbeteiligungsgesetzes in Industrieunternehmen, Mai 2009
No.127: Alexander Vogel: The German Business Services Statistics Panel 2003 to 2007, May 2009 [forthcoming in: Schmollers Jahrbuch 129 (2009)]
No.126: Nils Braakmann: The role of firm-level and regional human capital fort he social returns to education – Evidence from German social security data, April 2009
No.125: Elke Bertke und Markus Groth: Angebot und Nachfrage nach Umweltleistungen in einem marktanalogen Agrarumweltprogramm – Ergebnisse einer Pilotstudie, April 2009 [published in: Zeitschrift für angewandte Umweltforschung, Heft 1-2 (2009), 160-172]
No.124: Nils Braakmann and Alexander Vogel: The impact of the 2004 EU-enlargement on enterprise performance and exports of service enterprises in the German eastern border region, April 2009 [revised version forthcoming in: Review of World Economics]
No.123: Alexander Eickelpasch and Alexander Vogel: Determinants of Export Behaviour of German Business Services Companies, March 2009
No.122: Maik Heinemann: Stability under Learning of Equilibria in Financial Markets with Supply Information, March 2009
No.121: Thomas Wein: Auf der Speisekarte der DPAG: Rechtliche oder ökonomische Marktzutrittsschranken? März 2009
No.120: Nils Braakmann und Joachim Wagner: Product Diversification and Stability of Employment and Sales: First Evidence from German Manufacturing Firms, February 2009
No.119: Markus Groth: The transferability and performance of payment-by-results biodiversity conservation procurement auctions: empirical evidence from northernmost Germany, February 2009
No.118: Anja Klaubert: Being religious – A Question of Incentives? February 2009
No.117: Sourafel Girma, Holger Görg and Joachim Wagner: Subsidies and Exports in Germany. First Evidence from Enterprise Panel Data, January 2009 [published in: Applied Economics Quarterly 55 (2009), 3, 179-195]
No.116: Alexander Vogel und Joachim Wagner: Import, Export und Produktivität in niedersächsischen Unternehmen des Verarbeitenden Gewerbes, Januar 2009
No.115: Nils Braakmann and Joachim Wagner: Product Differentiation and Profitability in German Manufacturing Firms, January 2009
No.114: Franziska Boneberg: Die Drittelmitbestimmungslücke im Dienstleistungssektor: Ausmaß und Bestimmungsgründe, Januar 2009 [revidierte Version erschienen in: Zeitschrift für Industrielle Beziehungen, 4 (2009), 349-367]
No.113: Institut für Volkswirtschaftslehre: Forschungsbericht 2008, Januar 2009
No.112: Nils Braakmann: The role of psychological traits and the gender gap in full-time employment and wages: Evidence from Germany. January 2009
No.111: Alexander Vogel: Exporter Performance in the German Business Services Sector: First Evidence from the Services Statistics Panel. January 2009 [revised version forthcoming in: The Service Industries Journal]
No.110: Joachim Wagner: Wer wird subventioniert? Subventionen in deutschen Industrieunternehmen 1999 – 2006. Januar 2009
(see www.leuphana.de/institute/ivwl/publikationen/working-papers.html for a complete list)

Leuphana Universität Lüneburg
Institut für Volkswirtschaftslehre
Postfach 2440
D-21314 Lüneburg
Tel.: ++49 4131 677 2321
email: [email protected]
www.leuphana.de/institute/ivwl/publikationen/working-papers.html