Embed Size (px)
Citation preview
Serial No. R. 1114
UNITED STATES DEPARTMENT OF LABORFrances Perkins, Secretary -BUREAU OF LABOR STATISTICSIsador Lubin, Commissioner
STRIKES IN 1939
From the MONTHLY LABOR REVIEW
of the Bureau of Labor StatisticsUnited States Department of LaborMAY 1940 issue
P11,~N~#4
UNITED STATES GOVERNMENT PRINTING OFFICE • WASHINGTON • 1940

STRIKES IN 1939 1
THE year 1939 was characterized by a moderately large number ofsmall strikes, though there were occasional stoppages of large propor-tions. There were 2,613 strikes during the year, in which about1,171,000 workers were involved. There were approximately 17,812,-000 man-days of idleness during these strikes. About 43 percent ofthe workers involved and 51 percent of the idle man-days were ac-counted for by the three largest disputes of the year—the bituminous-coal stoppage in April and May, the WPA stoppages in July, and theChrysler dispute in October and November.
There were fewer strikes in 1939 than in the preceding 2 yearsalthough the number of workers involved and man-days of idlenessexceeded those in 1938, largely because of the bituminous-coal stop-page. Excluding the coal dispute, there were about the same numberof workers involved and man-days idle in 1939 as in 1938.
In this report no distinction is made between strikes and lock-outs,the term "strike" being used to include all stoppages of work arisingfrom labor disputes. As in former years, the figures do not includestoppages which lasted less than a full working day or shift, nor dothey include those involving fewer than six workers.
Original information and notices concerning strikes are obtained bythe Bureau mostly from the public press, union publications, andtrade journals. Information is obtained also from the various Stateand Federal labor boards and conciliation services. When a notice ofa strike is obtained, letters and report forms are sent to representativesof the union and employers involved, to obtain basic statistical infor-mation. For 10 strikes about which notices were received such re-ports could not be obtained. Except for these, it is believed thatfigures in this report cover all strikes which occurred in the UnitedStates during 1939, although it is possible that a few minor disputesescaped attention.
1 Prepared by Don Q. Crowther, under the direction of Florence Peterson, chief of the Bureau's Divisionof Industrial Relations.
235838-40 ( 1 )
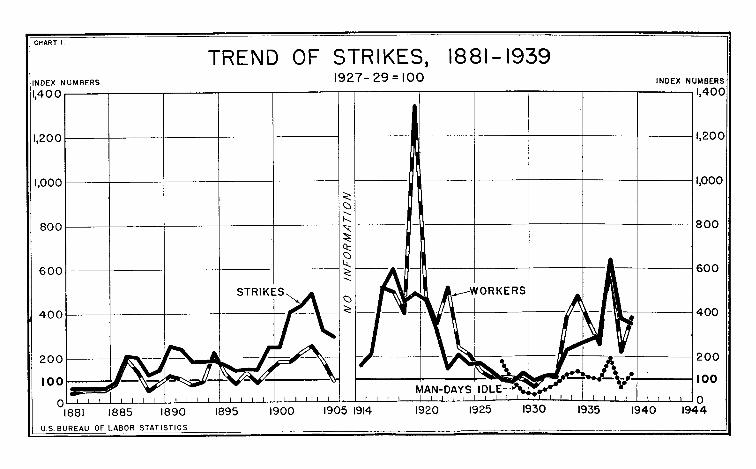
CHART I.
1,40 0
1,200
1,000
800
600
400
200
0
U.S. BUREAU
INDEX NUMBERS
TREND OF STRIKES, 1881-1939
1927— 29 =100 INDEX NUMBERS1,400
1,200
1,000
800
600
400
2001000
0i-...Q
et02--_0
III
I
I
-S N.I
' \ 1 I
.1
.---W OR KE RS
\,r/
%■ /
1111
1/1/` /1111
—X100 \ /
III 1111 11111MAN-DAYS IDLE—..-
11111 111111111 1111 1111 1111
1881 1885 1890 1895 1900 1905 1914 1920 1925 1930 1935 1940 1944OF LABOR STATISTICS

3
TABLE 1.-Strikes in the United States, 1881 to 1905 and 1914 to 1939
Year
Number of- Index
Strikes WorkersInvolved 1
Man-daysidle Strikes- 1 -
Workersinvolved
Man-dadays' -idle
1881 477 130,176 (2) 64 42 (2)1882 476 158,802 (2) 64 51 (2)1883 506 170, 275 (2) 68 55 (2)1884 485 165,175 (2) 65 53 (2)1885 695 258,129 (2) 93 83 (2)
1886 1,572 610,024 (2) 211 196 (2)1887 1,503 439,306 (2) 202 141 (2)1888 946 162,880 (2) 127 52 (2)1889 1,111 260, 290 (2) 149 84 (2)1890 1,897 373,499 (2) 255 120 (2)
1891 1, 786 329, 953 (2) 240 106 (2)1892 1, 359 238, 685 (2) 183 77 (2)1893 1, 375 287, 756 (2) 185 93 (2)1894 1,404 690,044 (2) 189 222 (2)1895 1, 255 407,188 (2) 169 131 (2)
1896 1,068 248, 838 (2) 143 80 (2)1897 1, 110 416, 154 (2) 149 134 (2)1898 1, 098 263, 219 (2) 148 85 (2)1899 1, 838 431, 889 (2) 247 139 (2)1900 1, 839 567, 719 (2) 217 182 (2)
1901 3, 012 563, 843 (2) 405 181 (2)1902 3, 240 691, 507 (2) 435 222 (2)1903 3, 648 787, 834 (2) 490 253 (2)1904 2, 419 573, 815 (2) 325 184 (2)1905 2, 186 302, 434 (2) 294 97 (2)
1906-1913 1914
(2)1, 204
(2)(2)
(2)(2)
(2)162
(2)(2)
((22
1915 1, 593 (2) (2) 214 (2) (41916 1 3,789 1,599,917 (2) 509 514 (2)1917 4, 450 1, 227, 254 (2) 598 395 (2)
1918 3, 353 1, 239, 989 (2) 451 399 (2)1919 3, 630 4, 160, 348 (2) 488 1, 337 (2)1920 3, 411 1, 463, 054 (2) 458 470 (2)1921 2, 385 1, 099, 247 (2) 321 353 (2)1922 1, 112 1, 612, 562 (2) 149 519 (2)
1923 1, 553 756, 584 (2) 209 243 (2)1924 1, 249 604,84154 (2) 168 210 (2)1925 1, 301 428, 416 (2) 175 138 (2)1926 1, 035 329, 592 (2) 139 106 (2)1927 707 329,939 26, 218, 628 95 106 178
1928 604 314, 210 12, 631, 863 81 101 811929 921 288, 572 351, 540 124 93 311930 637 182,975 3, 316, 808 86 59 221931 810 341, 817 893, 244 109 110 411932 841 324, 210 10, 502, 033 113 104 711933 1, 695 1, 168, 272 16, 872, 128 228 376 llt
1934 856 1, 466, 695 19, 591, 949 250 472 1321935 2,014 1, 117, 213 15, 456, 337 271 359 HQ1936 172 788, 648 13, 901, 956 292 254 991937 4, 740 1, 860, 621 28, 424, 857 637 598 1921938 2, 772 888.376 9, 148, 273 373 221 611929 2.613 1.170.962 17.812.219 351 377 121
1 The number of workers involved in strikes between 1916 and 1926 is not known for a portion of the total.However, the missing information is for the smaller disputes and it is believed that the total here given isfairly accurate.
3 No information available.
Principal Strikes During YearSOUTHERN NEW ENGLAND TRUCKING STRIKE
In March 1939 a strike was called by the International Brotherhoodof Teamsters, Chauffeurs, Stablemen and Helpers, against truckingfirms in Rhode Island, Connecticut, and part of Massachusetts, which

4
finally involved almost 8,000 truck drivers and helpers. The principaldemand of the union was for a general wage increase, with provisionsfor stipulated additional increases each year to be embodied in theterms of a 3-year contract.
Since the strike threatened a complete tie-up of truck transportationwith the consequent interruption to industry throughout the area,State and Federal conciliators and the Governors of the affected Statesurged a quick settlement of the dispute and at times participated inthe conferences between the disputing parties. In spite of thisassistance, it was 3 weeks before work was resumed.
The agreement which was finally concluded is to remain in effect for4 years, expiring in April 1943. Wage rates, representing increases formost workers, are stipulated for the first year with increases, varying inamount, for most of the men during each of the successive years thecontract is in force. Wage rates by the fourth year will be uniform inall the areas covered. Forty-eight hours constitute a week's work andthere is provision for overtime pay at the rate of time and one-half forhours worked in excess of 51 per week. No employee is permitted towork more than 48 hours, however, unless permission has been obtainedfrom the union business agent.
A joint administrative board to be known as the fair trade practiceboard of the trucking industry of New England is provided for in theagreement and consists of seven representatives each of the employersand of the union. The functions of the board are to administer theprovisions of the contract, provide machinery to handle disputes andgrievances in order to eliminate strikes and lock-outs, and to adoptsuch measures, rules, and regulations as will, in the opinion of itsmembers, eliminate from the industry any unfair practice that mayexist at present or at any future time. Decisions of the board arefinal and binding on all parties to the agreement.
BITUMINOUS-COAL STOPPAGE 2
With the expiration of agreements between operators of bituminous-coal mines and the United Mine Workers of America, at midnight,March 31, 1939, work ceased at mines in the Appalachian area 3 andthe State of Alabama. Only the necessary maintenance men wereauthorized to remain at work for protection of the idle mining proper-ties; also a few mines producing coal for hospitals and utilities of vitalnecessity to local communities continued in operation.
During the latter half of March the Appalachian joint conference ofthe United Mine Workers of America and the operators of the Appa-lachian bituminous area, meeting in New York City, had been trying
2 For a more detailed description of the bituminous-coal stoppage, including the text of the new agreement,see Monthly Labor Review, September 1939.
Includes bituminous mines in Pennsylvania, Ohio, Michigan, Maryland, West Virginia, easternKentucky, Virginia, and Tennessee.

5
to agree on terms of a new contract. The negotiators had so narrowedthe issues that the union was willing to renew the old contract, providedthe operators would consent to one of two changes—the elimination ofthe penalty clause, or exclusive recognition and the union shop. Thepenalty clause in the old agreement imposed a penalty of $1 per manper day in most districts for any strike or lock-out in violation of theagreement.
The shut-down became effective in the Appalachian fields and inAlabama on April 1. When no agreement had been reached by April20, the union gave the 15 days' notice required under the extensionagreements for the midwestern and western fields, and the shut-downbecame practically industry-wide by May 5, with around 330,000workers idle.
Federal conciliators and the Secretary of Labor participated in thejoint conferences of the operators and miners and, on invitation fromthe President, representatives of the two groups met at the WhiteHouse on May 9. On May 11, when no agreement had been reachedas requested by the President, the union issued orders to its outlyingdistrict presidents to arrange 2-year agreements in areas where opera-tors would accept the union-shop provision which the Appalachianoperators had thus far rejected.
On May 12, when an agreement covering the entire Appalachianarea appeared hopeless, it was decided that any individual operatorsand association members willing to do so could sign the all-unionagreement in order that production could be resumed in at least part ofthe mines. The agreement was accepted by 15 of the 21 employers'associations and work was thereupon resumed throughout the western,midwestern, and most of the eastern fields. During the followingweek agreements were signed by nearly all the remaining associationsand individual companies which had refused to sign on May 12, themajor exception being the Harlan County (Ky.) Coal OperatorsAssociation.
In Harlan County the National Guard was called out when somecompanies tried to operate their mines without signing the newagreement. Work in some mines was gradually resumed as operatorssigned individually. Finally, on July 19, the Harlan County CoalOperators Association signed an agreement which omitted the penaltyclause but did not provide for the closed shop. With the exception of apart of the Illinois fields under contract with the Progressive MineWorkers, this brought practically the entire bituminous-coal industryunder agreement with the United Mine Workers of America.
BRIGGS MANUFACTURING CO. STRIKE, DETROIT
This strike, called by the United Automobile Workers of America(C. I. 0.), began on May 22, 1939. More than 15,000 Briggsworkers were involved and since the firm manufactured automobile

6
bodies for other companies, the shortage of bodies resulting from thetie-up made 50,000 or more workers idle in other plants.
The union agreement with the Briggs company expired May 16,and the negotiation of a new agreement was delayed by the existenceof numerous grievances which the union contended must be settledbefore negotiations could proceed. The more important of thesegrievances concerned the discharge of a number of union men and thequestion whether, at the beginning of a shift, the men should get theirtools on company or on individual time.
Settlement negotiations which got under way immediately werethreatened when representatives of an independent or unaffiliatedgroup of workers, formerly a part of the United Automobile Workers,asked to be represented in the meetings and met separately withcompany officials on one or two occasions. The National LaborRelations Board offered to hold a consent election to settle anyquestion concerning the proper bargaining agent but the offer was notaccepted by the unaffiliated group.
After a week of strike activity the company and union agreed tosubmit the list of grievances to the Federal conciliator for arbitration.Negotiations on the new contract were then started, the majorobstacle to agreement being the union's demand for a union shop.Within a few days the National Labor Relations Board began hearingsto determine the bargaining agent, and shortly thereafter (June 7)the strike was called off with the understanding that the future ofthe union's status would be determined by the results of the NLRBelection. In November the Board certified the U. A. W. (C. I. 0.)as sole bargaining agent at the company's plants, both in the Detroitarea and at Evansville, Ind.
WPA STOPPAGES
The widespread stoppages on WPA projects in July 1939 werein protest against the abandonment of the former wage policy, in thenew relief appropriation bill passed by Congress for the fiscal year1939-40. The building-trades unions were especially opposed, asthey felt that abandonment of the prevailing-wage principle wouldaffect union wage scales on private construction as well as on WPAprojects. In many of the cities the protest stoppages of work onWPA projects were led by the local building-trades councils.
Immediately after the stoppages occured, the Work ProjectsAdministration announced that it would enforce its regulation thatall workers who absented themselves from work for 5 days would bedropped from the WPA rolls. The result was that many workerswere out only a short time, returning to work within the 5-day limit.Thousands of others remained away more than 5 days and weredropped from the rolls. As workers returned in some places, new

7
protest stoppages developed in other localities so that the demonstra-tions continued until after the middle of July. Considerable violencedeveloped in connection with the protests in Minneapolis, and anumber of persons were arrested and fined.
The number of WPA workers who were idle for 1 or more daysin connection with these stoppages was about 123,000. Many morethan this were idle for a part of a day, as a result of mass meetings andshort demonstrations which were held in protest against the newWPA regulations.
CHRYSLER DISPUTE
The United Automobile Workers of America obtained its firstwidespread union agreement with the Chrysler Corporation early inApril 1937 at the close of a 1-month strike. In this agreement, theunion was recognized as the collective-bargaining agency for its mem-bers. It was renewed, upon expiration, for 1 year—until March 31,1939. Monthly extensions were made thereafter until September 30,1939. In the meantime, there had been a split in the union and theNational Labor Relations Board had announced plans to conductelections to determine whether the C. I. 0. or the A. F. of L. unionhad a majority representation. The elections were held September27, the U. A. W. (C. I. 0.) winning by a large majority in each of 11of the 13 plants. The U. A. W. (A. F. of L.) obtained a majority atthe Evansville, Ind., plant, and in Kokomo, Ind., a majority votedfor neither union.
On October 6, the company accused the union of conducting aslow-down strike in one of the Dodge plants and discharged a numberof workers as a disciplinary measure. Within a day or two, some20,000 men were idle at the Dodge plants, the company contendingthat the stoppage was due to a union-ordered slow-down, and theunion claiming it was a lock-out after an attempted speed-up on thenew 1940 models. Within a few days other Chrysler plants wereclosed, affecting a total of approximately 50,000 workers.
As negotiations to settle the dispute and draft a new contract gotunder way, the union demanded joint study and control of productionstandards, a wage increase of 10 cents per hour, the union shop, pro-vision for arbitration of grievances, and seniority rights. In returnthe union promised that there would be no strikes during the term ofthe agreement.
Federal and State conciliators participated in the negotiations forsettlement. While conferences were under way, the companyreceived a request for recognition of the United Foremen's and Super-visors' Union, affiliated with the C. I. 0., and immediately demandedthat this request be withdrawn before negotiations could proceed.A few days after the foremen's union withdrew its request for recog-nition, an agreement settling the dispute was signed (November 29).
235842-40---2

8
Meanwhile, on November 16, the National Labor Relations Boardhad certified the U. A. W. (C. I. 0.) as the collective-bargaining agentfor the 11 plants as one unit.
The new agreement did not provide for a union shop but recognizedthe union as exclusive bargaining agent for production employees inthe 11 plants of the company, excluding only one department (die-sinkers) in the Newcastle, Ind., plant in which the A. F. of L. Machin-ists' Union had been certified as bargaining agent. Definite grievancemachinery was created, with an appeal board (composed of twoexecutives of the corporation and two official representatives of theunion) which must render a decision on any dispute within 30 daysafter being submitted. Any complaint or grievance concerningproduction standards is to be settled through the regular grievancemachinery. A wage increase of 3 cents per hour was granted and thedifferential between wage rates in Detroit plants and those in plantsoutside Detroit was to be narrowed by 1 cent. Seniority rights wereprovided for. There are to be no strikes or lock-outs before the entiregrievance procedure has been exhausted and in no case before anegotiating period of 5 days. The contract can be terminatedimmediately if a strike is called.
The agreement runs until November 30, 1940, and from year toyear thereafter unless either party notifies the other, between Novem-ber 1 and 15 in any year, of its desire to terminate the agreement.
CALIFORNIA COTTON PICKERS' STRIKE
The cotton pickers' strike, which began early in October, involvedapproximately 15,000 workers and extended into Kern, Tulare, Kings,Fresno, Madera, and Merced Counties. It was conducted by theUnited Cannery, Agricultural, Packing and Allied Workers of America,in an attempt to raise the wage rate for cotton picking from 80 centsper hundred pounds to $1.25. The strike was not formally terminateduntil late in November, although many of the pickers had returned towork earlier. Late in October the union offered to compromise for$1 per hundred pounds and sent workers back into the fields whereverthis rate was paid. When the strike was ended the union claimed thatthe $1 rate was fairly widely established and that signed contracts wereobtained in a few cases.
SHIP CLERKS' STRIKE, SAN FRANCISCO
The ship clerks' strike in San Francisco began November 10, 1939,and kept shipping activities at that port practically at a standstill fornearly 8 weeks. Approximately 600 ship clerks were involved and,when checking of cargo ceased and picket lines were formed at thedocks, about 4,000 longshoremen were made idle also.
9
Contracts between the Ship Clerks' Association and the DockCheckers Employers Association had expired September 30. Workcontinued after that date until negotiations for a new agreement be-came deadlocked and the strike was called,
Prior to September 30 there were two contracts—one covering"daily" workers, and the other covering workers employed on amonthly basis. The union now sought one contract to cover bothclasses of workers, with provisions which would establish unionpreference in employment for both daily and monthly clerks, regis-tration of all employees in the industry for the purpose of protectingthe jobs of the men in the industry at that time, adoption of theprinciple of equalization of work opportunity and earnings similar tothat practiced through the longshore hiring hall, and reduction of thehours of monthly clerks from 44 to 42 hours per week.
Local, State, and Federal officials participated in the mediationconferences until January 3, 1940, when a back-to-work agreementwas signed which provided that all employees were to return to workwithout discrimination. Union preferential hiring and registrationof monthly men was not granted. Except for this, all issues still indispute at the end of a negotiating period which was to last at least10 days, were to be submitted to arbitration.
Negotiations continued for about a month, and on February 7 acontract was signed covering the terms on which the parties had beenable to agree. Some matters—wage and hour adjustments formonthly clerks, equalization of earnings for daily clerks, and vaca-tions—were submitted to a board of arbitration.
Monthly Trend of 1939 Strikes
Strikes in 1939 followed, substantially, the usual seasonal trend,increasing in number during the spring months, maintaining a fairlyhigh level during the summer and fall, and then diminishing in numberwith the approach of winter. Strikes were more numerous in April(281) than in any other month of the year, and the smallest numberwas in December (106) Likewise, April was the high month in termsof number of workers involved and man-days of idleness and De-cember was the low month. The bituminous-coal stoppage accountedfor the extremely high number of workers involved and the largeamount of idleness in April.
In 1938 the greatest number of strikes and of man-days of idlenessoccurred in May, with the smallest numbers in January. The

10
greatest number of workers involved, however, was in Septemberalthough the smallest number was in January. Comparative monthlyfigures for the 2 years are given in table 2.
TABLE 2 -Strikes in 1938 and 1939, by Months
Number of strikes- Workers involved in strikes-
Man-days idle
Month BeBeginning in In progress Beginning in In progress dur-during month
month duringmonth month ing month
1938 1939 1938 1939 1938 1939 1938 1939 1938 1939
Year 2.772 2, 613 688, 376 1,170, 962 9, 148, 273 17, 812, 219
January 168 203 288 323 35, 329 51, 159 65,850 72, 427 473,289 513, 460February 198 204 327 343 53, 175 68,252 77, 486 88, 267 614,111 553, 138March 274 210 421 349 56, 759 43, 337 105, 962 64, 660 767, 856 618, 147April 281 281 456 431 78,666 396, 166 110,950 425, 748 838, 158 4, 902, 238May 300 258 495 434 83,029 95, 239 124, 682 457, 407 1, 174, 052 3, 547, 868June 219 245 424 407 52,801 62,534 95, 854 127, 474 871,002 958, 127July 208 251 387 389 50,193 175, 542 85, 672 211, 548 776, 237 1,168, 382August 262 275 434 448 48,378 79, 670 81,052 118,772 830, 987 1, 101, 419September 222 197 384 373 96,399 36, 846 133, 357 103,538 989, 916 892, 485October 256 205 406 356 52, 703 106, 623 113, 074 139, 608 842, 202 1, 508,120November 207 178 372 317 43, 128 43, 239 75, 445 130, 341 557, 903 1, 664, 574December 177 106 310 222 37, 816 12, 350 62, 160 37,122 512, 560 384, 261
Industries Affected
The industries most affected by disputes in 1939, as measured interms of man-days idle, were bituminous-coal mining (7,303,000) andautomobile manufacturing (2,535,000). Of the nearly 18,000,000man-days idle during the year as a result of all strikes, about 42 per-cent were in the mining industries, 15 percent were in the transporta-tion-equipment manufacturing industries, a little more than 7 percentwere in the textile (including clothing) industries, and nearly 5 percentwere in the transportation and communication industries. Of the1,171,000 workers involved, about 33 percent were in the miningindustries, 12 percent were on WPA projects, 11 percent were intransportation-equipment manufacturing, 8 percent were in textiles,and 7 percent were in the transportation and communication indus-tries. As for the number of strikes, nearly 21 percent were in thetextile industries (small strikes in the women's clothing industrymostly), 12 percent were in building and construction, 11 percentwere in retail and wholesale trade, and 10 percent were in transporta-tion and communication.

11
TABLE 3.-Strikes in 1939, by Industry
IndustryNumber of
strikesbeginning
in 1939
Number ofworkersinvolved
Man-daysidle during
1939
All industries 2, 613 1, 170, 962 17, 812, 219Iron and steel and their products, not including machinery 57 14, 466 212, 780
Blast furnaces, steel works, and rolling mills 10 6, 067 80, 034Cast-iron pipe and fittings 3 679 17, 333Cutlery (not including silver and plated cutlery) and edge tools_ 1 19 152Forgings, iron and steel 3 504 6, 062Hardware 3 498 26, 856Plumbers' supplies and fixtures 3 238 4, 284Steam and hot-water heating apparatus and steam fittings 3 171 1, 595Stoves 7 1, 178 9, 036Structural and ornamental metalwork 2 425 2, 167Tin cans and other tinware 6 1, 324 13, 610,Tool.: (not including edge tools, machine tools, files, and saws) 1 736 512'Wire and wire products 6 1,153 037Other 9 1, 474 26, 082'
Machinery, not including transportation equipment 85 25, 027 433, 288Agricultural implements 2 174 18, 530'Cash registers, adding machines, and typewriters 1 9 117"Electrical machinery, apparatus, and supplies 20 4, 613 96, 195Engines, turbines, tractors, and water wheels 2 8, 884 125, 070Foundry and machine-shop products 30 4, 637 95, 405Machine tools (power driven) 3 871 6, 815Radios and phonographs 2 53 329Other 25 5, 786 90, 827
Transportation equipment 56 133, 636 2, 656, 269Aircraft 2 1, 263 85, 419Automobiles, bodies and parts 44 129, 333 2, 535, 444Cars, electric- and steam-railroad 1 650 1, 950Shipbuilding 9 2, 389 33, 456
Nonferrous metals and their products 32 6, 180 167, 607Aluminum manufactures 2 292 641Brass. bronze, and copper products 2 591 33, 832Clocks, watches, and other time-recording devices 1 400 10, 726Jewelry 6 125 3,361Lighting equipment 5 198 8, 841Silverware and plated ware 1 175 1, 925Smelting and refining-copper, lead, and zinc 5 3, 137 93, 362Stamped and enameled ware 5 723 7, 689Other 5 539 7, 130
Lumber and allied products 170 31, 145 799, 343Furniture 67 8, 222 144, 134Millwork and planing 22 4, 170 160, 422Sawmills and logging camps 42 14, 632 398, 895Other 39 4, 121 96, 092Stone, clay, and glass products 53 11, 360 136. 901Brick, tile, and terra cotta 23 2, 367 48, 884Cement 1 32 576Glass 6 3, 619 17, 738Marble, granite, slate, and other products 4 1, 254 27, 170Pottery 2 660 3, 176Other 17 3, 418 39, 357Textiles and their products 639 90, 732 1, 320, 994Fabrics 92 30, 516 606, 038Carpets and rugs 3 2, 265 7, 292Cotton goods 24 10,947 350, 538Cotton small wares 2 206 3, 468Dyeing and finishing textiles 8 1, 728 18, 784Silk and rayon goods 21 6, 667 74, 800Woolen and worsted goods 10 5, 352 47, 811Other 24 3, 351 103, 347Wearing apparel 447 60, 216 714, 956Clothing, men's 20 9, 577 43, 730Clothing, women's 350 37, 702 453, 896Corsets and allied garments 1 400 2, 800Men's furnishing ,' 7 2, 009 24, 788Hats, caps, and millinery 13 3, 173 15, 655Shirts and collars 5 622 19, 497Hosiery 13 024 62, 439'Knit goods__ 34 3,396 51, 733Other 4 253 40, 418.
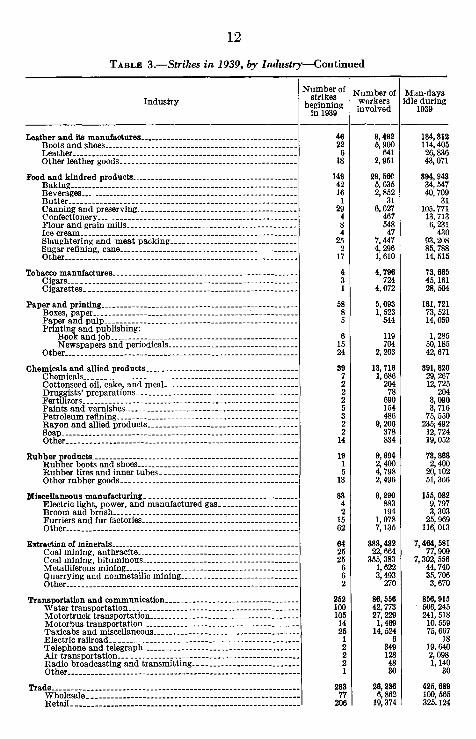
12
TABLE 3.-Strikes in 1939, by Industry-Continued
IndustryNumber of
strikesbeginning
in 1939
Number ofworkersinvolved
Man-daysidle during
1939
Leather and its manufactures Boots and shoes_ Leather Other leather goods
Food and kindred products
4822
618
148
9,4925, 900
6412, 951
29, 580
184,312114, 40526, 83643, 071
394, 943Baking 42 5,635 34,547Beverages 16 2, 852 40, 709Butter 1 31 31Canning and preserving 29 8,627 105,771Confectionery 4 467 13,713Flour and grain mills 8 548 6,231Ice cream 4 47 430Slaughtering and meat packing 25 7,447 93,208Sugar refining, cane 2 4,296 85,788Other 17 1,610 14,515
Tobacco manufactures 4 4,798 73,665Cigars 3 724 45,161Cigarettes 1 4, 072 28, 504
Paper and printing 58 5, 093 181, 721Boxes, paper 8 1, 523 73, 521Paper and pulp 5 544 14, 059Printing and publishing:
Book and job 6 119 1, 285Newspapers and periodicals 15 704 50, 185
Other 24 2, 203 42, 671
Chemicals and allied products 39 13,716 391,820Chemicals_ 7 1, 686 29, 267Cottonseed oil, cake, and meal 2 204 12, 725Druggists' preparations 2 78 204Fertilizers 2 690 3, 090Paints and varnishes 5 154 3,716Petroleum refining 3 486 75, 550Rayon and allied products 2 9, 206 235, 492Soap 2 378 12,724Other 14 834 19, 052
Rubber products 19 9,894 73,868Rubber boots and shoes 1 2,400 2,400Rubber tires and inner tubes 5 4, 798 20, 102Other rubber goods 13 2, 496 51, 366
Miscellaneous manufacturing 83 9, 290 155, 082Electric light, power, and manufactured gas 4 883 9, 797Broom and brush 2 194 3,303Furriers and fur factories 15 1,078 25,969Other 62 7,135 116, 013
Extraction of minerals 64 383, 432 7, 464, 581Coal mining, anthracite 25 22, 664 77, 909Coal mining, bituminous 25 355, 383 7, 302, 556Metalliferous mining 6 1, 622 44, 740Quarrying and nonmetallic mining 6 3,493 35, 706Other 2 270 3, 670
Transportation and communication 252 88,556 856,915Water transportation 100 42, 773 506, 245Motortruck transportation 105 27, 229 241, 518Motorbus transportation 14 1,489 10, 559Taxicabs and miscellaneous 25 14, 524 75, 667Electric railroad 1 6 18Telephone and telegraph 2 349 19, 640Air transportation 2 128 2, 098Radio broadcasting and transmitting 2 48 1,140Other 1 30 30
Trade 283 28, 236 425, 889Wholesale 77 6, 862 100, 565Retail 208 19, 374 325.124

13
TABLE 3.-Strikes in 1939, by Industry-Continued
IndustryNumber of
s iktresbeginning
in 1939
Number ofworkersinvolved
Man-daysidle during
1939
Domestic and personal service 181 21, 134 277, 402Hotels, restaurants, and boarding houses 68 5, 014 71, 075Personal service, barbers, and beauty parlors 1 23 1, 104Laundries 49 3, 733 107, 201Dyeing, cleaning, and pressing 24 551 71, 053Elevator and maintenance workers (when not attached to spe-
cific industry) 12 706 25, 616Other 7 107 1,353
Professional service 34 3,917 35, 086Recreation and amusement 26 2, 073 27, 515Professional 2 326 406Semiprofessional, attendants, and helpers 6 918 165
Building and construction 320 70, 097 633, 488Buildings, exclusive of PWA 183 50, 601 424, 884All other construction (bridges, docks, etc., and PWA buildings)_ 137 19, 496 208, 604
Agriculture and fishing 39 36, 754 477, 369Agriculture 25 26, 207 194, 880Fishing 14 10, 647 282, 483
WPA, relief, and resettlement projects 93 144, 920 428, 242Other nonmanufacturing industries 38 4, 340 30, 780
States Affected
Pennsylvania had more workers involved in strikes and more idle-ness because of strikes in 1939 than any other State, although therewere less than half as many strikes in Pennsylvania as in New York.Over 15 percent of the total workers involved in strikes and 17 percentof the total idleness during 1939 were in Pennsylvania. New York,with more than one-fourth of the country's strikes, had about 12 per-cent of the total workers involved but only 7 percent of the total man-days idle. Michigan, with 11 percent of the total workers involved,had 14 percent of the total idleness. West Virginia, owing principallyto the general bituminous-coal stoppage, had 8 percent of the totalworkers involved and 12 percent of the total idleness.
Strike figures for the various States appear in table 4. The inter-state strikes have been counted in this table, except in the total, asseparate strikes in each State. For example, a strike extending intoboth New York and New Jersey was counted in the New York figuresas one strike and in the New Jersey figures as one strike, with a properdivision of the workers involved and man-days idle.

14
TAB•g 4.—Strikes in 1939, by States
StateNumberof strikesbeginning
in 1939
Workers involved Man-days939
idle during1
Number Percentof total
Averageper strike Number Percent
of total
All States I 2, 613 1,170, 962 100.0 448 17, 812, 219 100.0Alabama 20 14, 434 1. 2 722 494, 788 2.8Arizona 7 536 (2) 77 8 319 (2)Arkansas 12 2, 187 .2 182 40, 677 . 2California 215 83, 679 7. 1 389 1, 038,109 5.8Colorado 17 8, 018 , 7 472 75, 986 .4Connecticut 38 10, 609 .9 279 92, 534 .5Delaware 5 252 (2) 50 3, 768 (2)District of Columbia 23 5, 878 .5 256 64, 989 .4Florida 20 2, 330 .2 117 80, 800 .5Georgia 17 2, 128 .2 125 73, 100 .4Idaho 2 116 (2) 58 1, 558 (2)Illinois 151 74, 017 6.3 490 606, 953 3.4Indiana 79 30, 838 2.6 390 381, 290 2. 1Iowa 42 8, 665 .7 206 85, 070 . 5Kansas 11 7, 482 .6 680 30, 245 .2Kentucky 19 61, 218 5.2 3, 222 1, 244, 742 7. 0Louisiana 23 1, 665 .1 72 21, 950 .1Maine 10 1, 989 .2 199 15, 384 .1Maryland 31 14, 603 1. 2 471 269, 709 1. 5Massachusetts 116 34, 832 3.0 300 346, 417 1.9Michigan 89 130, 410 11. 2 1, 465 2, 499,115 14. 1Minnesota 26, 18, 742 1. 6 721 107, 033 .6Mississippi 7 3, 543 .3 506 39, 766 .2Missouri 67 13, 305 1. 1 199 243, 924 1.4Montana 6 5, 589 .5 932 20, 315 .1Nebraska 6 587 .1 98 29,146 .2Nevada 2 300 (2) 150 850 (2)New Hampshire 9 1, 590 .1 177 10, 776 .1New Jersey 190 29, 550 2. 5 156 539, 476 3.0New Mexico 6 2, 979 .3 497 20, 540 .1
New York 726 135, 984 11. 7 187 1, 236, 547 6.9North Carolina 15 7, 936 .7 529 101, 624 .6North Dakota 7 1, 555 .1 222 20, 450 .1Ohio 96 50, 458 4.3 526 768. 961 4. 3Oklahoma 13 3, 084 .3 237 71, 225 .4Oregon 39 11, 455 1.0 294 139, 029 .8
Pennsylvania 315 179, 320 15.4 569 3, 043, 306 17. 2Rhode Island 18 7, 588 .6 422 117, 076 .7South Carolina 12 4, 786 .4 399 108, 174 .6South Dakota 3 53 (2) 18 222 (2)Tennessee 33 10, 495 .9 318 239. 516 1.3Texas 46 6, 209 .5 135 132, 501 .7
Utah 10 4, 708 .4 471 39, 183 .2Vermont 2 1, 010 .1 505 8, 180 (I)Virginia 26 14, 249 1.2 548 307, 733 1.7Washington 66 21, 949 1.9 333 438,995 2.5West Virginia 26 94, 626 8. 2 3, 639 2, 166, 032 12. 2Wisconsin 55 39, 426 3.4 717 366, 136 2.1Wyoming 1 4, 000 .3 4, 000 20, 000 .1
1 The sum of this column is more than 2,613. This is due to the fact that 67 strikes which extended acrossState lines have been counted, in this table, as separate strikes in each State affected, with the proper alloca-tion of number of workers involved and man-days idle.
2 Less than a tenth of 1 percent.
Cities AffectedThere were more strikes in New York City (597) in 1939 than in
any 10 other cities combined. The New York strikes were small onthe average, however, and were of comparatively short duration.Although more than 20 percent of the Nation's strikes were in NewYork City, only about 10 percent of the total workers involved werein these strikes, and only 6 percent of the total idleness caused by

15
strikes was in New York. Detroit, Mich., with only 51 strikes, hadalmost as many workers involved as New York and had more thantwice as many man-days idle.
The six cities having the most strikes in 1939 were, in order, NewYork, Philadelphia, Los Angeles, San Francisco, Detroit, and Chicago.Those with the most workers involved in strikes were, in order, NewYork, Detroit, Philadelphia, San Francisco, Milwaukee, and Boston.Those having the most idleness because of strikes were Detroit.New York, San Francisco, Philadelphia, Los Angeles, and Chicago.
Thirty-seven cities in the United States had 10 or more strikesduring the year. Figures for each of these cities are shown in table 5,together with figures for 37 other cities for which data have been pub-lished in previous years.
A number of strikes in 1939 extended into two or more cities. Intable 5 these intercity strikes have been regarded as separate strikesin each city affected, counting for each city only the workers who wereidle in that city. A strike included with figures for a given city,therefore, might have been only a part of a larger strike.
TABLE 5.-Strikes in 1939 in Cities Which Had 10 or More Strikes in Any Year from1927 to 1939
City
N-be
umr of
strikesbegin-iffngin 1939
Num-her of
kworkersin-
volved
Man-days*d1 d 'idle during
1939City
Nu-be o
mf
strikesbegin-"iiniitz9
Nu-ber of
workersin-
volved
Man-days idleduring
1939
Akron, Ohio 7 4, 370 9, 733 New Haven, Conn 4 1, 307 18, 352Allentown, Pa 10 2, 083 62,914 New Orleans, La 12 908 10, 327Atlanta, Ga 11 895 9, 235 New York (Greater)____ 597 115, 506 1, 033, 934Baltimore, Md 16 2,124 20, 428 Norfolk, Vs 6 1, 095 7, 404Birmingham, Ala 4 73 2, 530 Paducah, Ky 1 13 39Boston, Mass 29 14, 373 113, 748 Passaic, N. J 14 1, 974 14, 104Buffalo, N. Y 17 3. 042 16, 882 Paterson, N. J 33 3, 510 56, 337Chattanooga, Tenn 12 1, 102 17, 648 Pawtucket, R. I 4 539 4, 510Chicago, Ill 49 8, 688 122, 178 Peoria, Ill 8 2, 430 35, 746Cincinnati, Ohio 8 1. 480 36, 745 Philadelphia, Pa 95 27, 681 249, 003Cleveland, Ohio 26 9, 762 91, 927 Pittsburgh, Pa 35 3, 884 67, 673Columbus, Ohio 6 250 2, 333 Portland, Oreg 12 2, 897 21, 008Denver, Colo 9 1, 669 17, 484 Providence, R. I 8 4, 001 57, 623Des Moines, Iowa 9 379 3, 850 Reading, Pa 4 439 8, 008Detroit, Mich 51 115, 231 2, 292, 117 Richmond, Va 8 1, 570 13, 643Duluth, Minn 2 2, 001 6, 006 Rochester, N. Y 12 2, 161 11, 669Easton, Pa 1 66 198 Rockford, Ill 6 1, 286 5, 314East St. Louis, Ill 20 6, 344 50, 670 Saginaw, Mich 4 2, 006 9, 900Elizabeth, N. J 10 982 24, 033 St. Louis, Mo 36 4, 866 63, 461Erie, Pa 6 1, 286 28, 661 St. Paul, Minn 4 2.820 10, 117Evansville, Ind 3 533 5,145 San Francisco (bay area)_ 58 26, 178 348, 918Fall River, Mass 11 3, 392 40, 975 Scranton, Pa 6 544 4, 585Flint, Mich 14 3, 323 21, 038 Seattle, Wash 25 4, 253 38, 321Haverhill, Mass 4 660 3, 189 Shamokin, Pa 11 1, 330 21, 508Houston, Texas 17 513 9, 880 South Bend. Ind 6 5, 364 59, 587Indianapolis, Ind 22 2, 275 28, 275 Springfield, Ill 6 387 5, 004Jersey City, N. J 24 2, 401 20, 436 Springfield, Mass 13 1, 586 6, 137Kansas City, Mo 13 930 24, 833 Terre Haute, Ind 4 286 7, 500Los Angeles, Calif 71 11, 765 145, 023 Toledo, Ohio 10 6, 075 56, 237Louisville, Ky 6 694 3, 766 Trenton, N. J 8 859 9, 565Lowell, Mass 6 733 3, 004 Washington, D. C 23 5, 878 64, 989Lynn, Mass 4 328 1, 711 Waterbury, Conn 3 564 8, 233Memphis, Tenn 5 457 4, 858 Wausau, Wis 2 139 2, 835Milwaukee, Wis_ _ _____ 18 16, 788 97, 364 Wilkes-Barre, Pa 11 2, 482 37, 286Minneapolis, Minn 20 10,454 63, 491 Woonsocket, R. I_ 4 2, 456 50, 192Newark, N. J 28 5, 456 60, 477 Worcester, Mass 3 2, 514 54, 760New Bedford, Mass_ _ __ 7 I, 546 14, 066 York, Pa 9 2, 019 32, 562
16
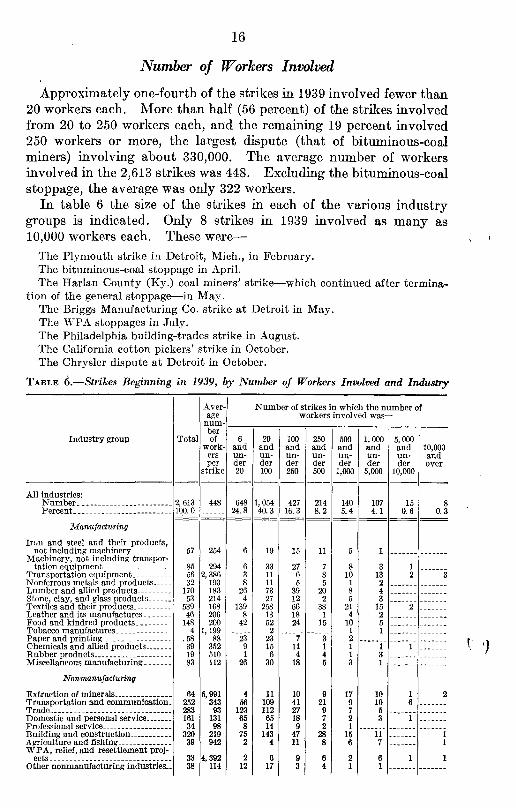
Number of Workers Involved
Approximately one-fourth of the strikes in 1939 involved fewer than20 workers each. More than half (56 percent) of the strikes involvedfrom 20 to 250 workers each, and the remaining 19 percent involved250 workers or more, the largest dispute (that of bituminous-coalminers) involving about 330,000. The average number of workersinvolved in the 2,613 strikes was 448. Excluding the bituminous-coalstoppage, the average was only 322 workers.
In table 6 the size of the strikes in each of the various industrygroups is indicated. Only 8 strikes in 1939 involved as many as10,000 workers each. These were—
The Plymouth strike in Detroit, Mich., in February.The bituminous-coal stoppage in April.The Harlan County (Ky.) coal miners' strike—which continued after termina-
tion of the general stoppage—in May.The Briggs Manufacturing Co. strike at Detroit in May.The WPA stoppages in July.The Philadelphia building-trades strike in August.The California cotton pickers' strike in October.The Chrysler dispute at Detroit in October.
TABLE 6.—Strikes Beginning in 1939, by Number of Workers Involved and Industry
Industry group Total
Aver-age
num-berof
work-ersper
strike
Number of strikes in which the number ofworkers involved was—
6andun-der20
20andun-der100
100andun-der250
250andun-der500
500andun-der
1,000
1, 000andun-der
5,000
5, 000andun-der
10,000
10,000andover
All industries:Number 2, 613 448 648 1, 054 427 214 140 107 15 8Percent 100. 0 24. 8 40. 3 16. 3 8. 2 5.4 4. 1 0. 6 0. 3
Manufacturing
Iron and steel and their products,not including machinery 57 254 6 19 15 11 5 1
Machinery, not including transpor-tation equipment 85 294 6 33 27 7 8 3 1
Transportation equipment 56 2, 386 3 11 6 8 10 13 2 3Nonferrous metals and products 32 193 8 11 5 5 1 2 Lumber and allied products 170 183 26 73 39 20 8 4 Stone, clay, and glass products 53 214 4 27 12 2 5 3 Textiles and their products 539 168 139 258 66 38 21 15 2 Leather and its manufactures 46 206 8 13 18 1 4 2 Food and kindred products 148 200 42 52 24 15 10 5 Tobacco manufactures 4 1, 199 2 1 1 Paper and printing . 58 88 23 23 7 3 2 Chemicals and allied products 39 352 9 15 11 1 1 1 1 Rubber products 19 510 1 6 4 4 1 3 Miscellaneous manufacturing 83 112 26 30 18 5 3 1
Nonmanufacturing
Extraction of minerals 64 5, 991 4 11 10 9 17 10 1 2Transportation and communication_ 252 343 56 109 41 21 9 10 6 Trade 283 93 123 112 27 9 7 5 Domestic and personal service 161 131 65 65 18 7 2 3 1 Professional service 34 98 8 14 9 2 1 Building and construction 320 219 75 143 47 28 15 11 1Agriculture and fishing 39 942 2 4 11 8 6 7 1WPA, relief, and resettlement proj-
ects 33 4,392 2 6 9 6 2 6 1 1Other nonmanufacturing industries 38 114 12 17 3 4 1 1
17
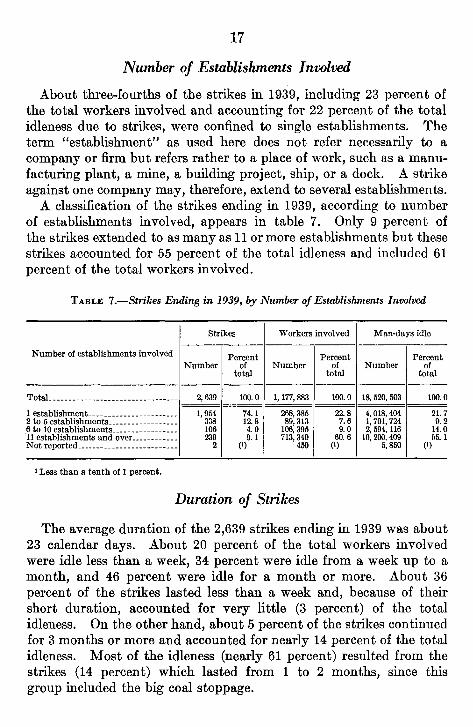
Number of Establishments Involved
About three-fourths of the strikes in 1939, including 23 percent ofthe total workers involved and accounting for 22 percent of the totalidleness due to strikes, were confined to single establishments. Theterm "establishment" as used here does not refer necessarily to acompany or firm but refers rather to a place of work, such as a manu-facturing plant, a mine, a building project, ship, or a dock. A strikeagainst one company may, therefore, extend to several establishments.
A classification of the strikes ending in 1939, according to numberof establishments involved, appears in table 7. Only 9 percent ofthe strikes extended to as many as 11 or more establishments but thesestrikes accounted for 55 percent of the total idleness and included 61percent of the total workers involved.
TABLE 7.—Strikes Ending in 1939, by Number of Establishments Involved
Strikes Workers involved Man-days idle
Number of establishments involved Percent Percent PercentNumber of
totalNumber of
totalNumber of
total
Total 2, 639 100. 0 1, 177, 883 100. 0 18, 520, 503 100.0
1 establishment I, 954 74. 1 268, 385 22.8 4, 018, 404 21. 72 to 5 establishments 338 12.8 89, 313 7. 6 701, 724 9. 26 to 10 establishments 106 4. 0 106, 395 9. 0 594, 116 14.011 establishments and over 239 9. 1 713, 340 60. 6 10, 200.409 b5. 1Not reported 2 (I) 450 (I) 5, 850 (I)
I Less than a tenth of 1 percent.
Duration of Strikes
The average duration of the 2,639 strikes ending in 1939 was about23 calendar days. About 20 percent of the total workers involvedwere idle less than a week, 34 percent were idle from a week up to amonth, and 46 percent were idle for a month or more. About 36percent of the strikes lasted less than a week and, because of theirshort duration, accounted for very little (3 percent) of the totalidleness. On the other hand, about 5 percent of the strikes continuedfor 3 months or more and accounted for nearly 14 percent of the totalidleness. Most of the idleness (nearly 61 percent) resulted from thestrikes (14 percent) which lasted from 1 to 2 months, since thisgroup included the big coal stoppage.

18
TABLE 8.—Duration of Strikes Ending in 1939
Strikes Workers involved Man-days idleDuration of strikes
Number Percentof total Number Percent
of total Number Percentof total
Total 2, 639 100.0 1, 177, 883 100.0 18, 520, 503 100.0'Less than 1 week 952 36. 1 231, 940 19. 7 535, 451 2. 91 week and less than 3z month 593 22.5 142, 725 12. 1 965, 381 5. 2.4 and less than 1 month 460 17.4 259, 948 22. 1 2, 177, 233 11. 81 and less than 2 months 380 14.4 485, 671 41. 2 11, 243, 565 60. 62 and less than 3 months 116 4. 4 33, 019 2.8 1, 085, 796 5.93 months or more 138 5. 2 24, 580 2. 1 2, 513, 077 13.6
CHART 2.
DURATION OF STRIKESENDING IN 1939
LESS THAN I WEEK 1/2 MONTH I MONTH 2 MONTHS 3 MONTHSI WEEK LESS THAN LESS THAN LESS THAN LESS THAN OR MORE
I/2 MONTH I MONTH 2 MONTHS 3 MONTHSU.S. BUREAU OF LABOR STATISTICS
Sex of WorkersOf the 1,177,883 workers involved in the strikes ending in 1939,
about 90 percent were men and 10 percent were women. The largeproportion of men is accounted for to a large extent by strikes in thecoal-mining and automobile-manufacturing industries, some of which

19
were among the largest strikes of the year. Men only were involvedin 55 percent of the 2,639 strikes, women only were involved innearly 3 percent, and both men and women were involved in about42 percent.
Labor Organizations Involved
Strikes called by unions affiliated with the American Federation ofLabor were more numerous in 1939 than those called by affiliates ofthe Congress of Industrial Organizations. Strikes of the latter organ-ization, however, were much larger on the average and accounted fora large proportion of the total man-days idle. Unions affiliated withthe American Federation of Labor were involved in half of the strikes,including 32 percent of the total workers involved and accounting for22 percent of the total idleness. Congress of Industrial Organizationsaffiliates were involved in 29 percent of the strikes, including 60percent of the total workers involved and accounting for 72 percentof the total idleness.
In addition to the figures shown in table 9 for the A. F. of L. andC. I. 0. organizations, affiliates of these two groups were involved inmost of the 75 strikes in which 2 rival unions were involved. Suchrival union disputes, however, accounted for only a minor fractionof the total strike activity during the year, including less than 21/percent of the workers involved in all strikes and less than 3 percentof the total man-days idle.
Of the 434 strikes by unaffiliated unions, 398 were called by localsof the International Ladies' Garment Workers' Union. Most of thesewere in small contract clothing shops in New York City. Some ofthese were organization strikes and many of them were due to allegedcontract violations. The I. L. G. W. U. strikes, though numerous,accounted for only about 3 percent of the total workers involved inall strikes.
TABLE 9.—Strikes Ending in 1939, by Types of Labor Organizations Involved
Strikes Workers involved Man-days idle
Labor organization involvedNum- Percent ,„„,,,„. Percent Number Percent
ber of total " ``""" of total of total
Total 2, 639 100.0 1, 177, 883 100.0 18, 520, 503 100.0
American Federation of Labor 1, 312 49. 7 371, 822 31. 6 4, 057, 473 21.9Congress of Industrial Organizations 764 29.0 704, 031 59. 7 13, 265, 150 71. 7Unaffiliated unions 1 434 16.4 60, 018 5. 1 607, 150 3. 32 rival unions 75 2.8 28, 571 2. 4 525, 755 2. 8Company unions 2 4 .2 1, 909 .2 19, 332 .1No organization 50 1.9 11, 532 1.0 45, 643 .2
1 Not affiliated with the American Federation of Labor, the Congress of Industrial Organizations, or therailroad brotherhoods but covering workers of more than I employer.
2 Organizations confined to 1 company.
20
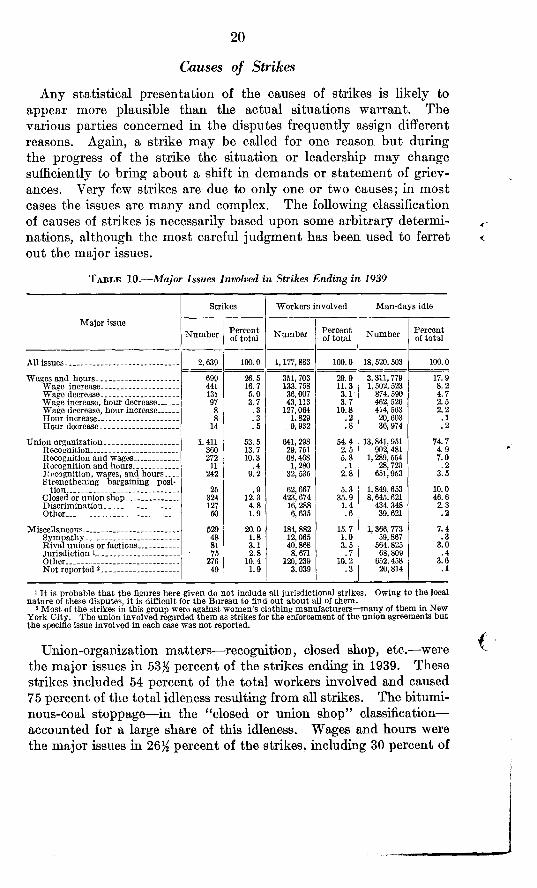
Causes of Strikes
Any statistical presentation of the causes of strikes is likely toappear more plausible than the actual situations warrant. Thevarious parties concerned in the disputes frequently assign differentreasons. Again, a strike may be called for one reason but duringthe progress of the strike the situation or leadership may changesufficiently to bring about a shift in demands or statement of griev-ances. Very few strikes are due to only one or two causes; in mostcases the issues are many and complex. The following classificationof causes of strikes is necessarily based upon some arbitrary determi-nations, although the most careful judgment has been used to ferretout the major issues.
TABLE 10.—Major Issues Involved in Strikes Ending in 1939
Major issue
Strikes Workers involved Man-days idle
Number Percentof total Number Percent
of total Number Percentof total
All issues 2, 639 100.0 1, 177, 883 100.0 18, 520, 503 100.0
Wages and hours 699 26.5 351, 703 29.9 3, 311, 779 17. 9Wage increase 441 16. 7 133. 758 11. 3 1, 502, 523 8. 2Wage decrease 131 5.0 36, 007 3. 1 874, 590 4.7Wage increase, hour decrease 97 3.7 43, 113 3. 7 462, 526 2. 5Wage decrease, hour increase 8 .3 127, 064 10.8 414, 563 2. 2Hour increase 8 .3 1.829 .2 20, 603 .1Hour decrease 14 . 5 9, 932 .8 36, 974 . 2
Union organization 1, 411 53. 5 641, 298 54.4 13, 841, 951 74. 7Recognition 360 13. 7 29, 751 2. 5 902, 481 4. 9Recognition and wages 272 10.3 68, 468 5.8 1, 289, 554 7.0Recognition and hours 11 .4 1, 280 .1 28, 720 .21; ecognition, waves, and hours __ _ _ 242 9.2 32, 535 2.8 651,953 3.5Strengthening bargaining posi-
tion 25 .9 62, 667 5. 3 1, 849, 653 10.0Closed or union shop 324 12. 3 423, 674 35.9 8, 645, 621 46.6Discrimination 127 4. 8 16, 288 1. 4 434, 348 2. 3Other 50 1.9 6, 635 .6 39, 621 .2
Miscellaneous 529 20. 0 184, 882 15. 7 1, 366, 773 7. 4Sympathy 48 1.8 12, 065 1.0 59, 867 .3Rival unions or factions 81 3. 1 40, 868 3. 5 564, 825 3.0Jurisdiction 1_. 75 2.8 8, 671 .7 68, 809 .4Other 276 10. 4 120, 239 10. 2 652, 458 3.6Not reported 2 49 1.9 3, 039 .3 20, 814 .1
1 It is probable that the figures here given do not include all jurisdicf onal strikes. Owing to the localnature of these disputes, it is difficult for the Bureau to find out about all of them.
2 Most of the strikes in this group were against women's clothing manufacturers—many of them in NewYork City. The union involved regarded them as strikes for the enforcement of the union agreements butthe specific issue involved in each case was not reported.
Union-organization matters—recognition, closed shop, etc.—werethe major issues in 533 percent of the strikes ending in 1939. Thesestrikes included 54 percent of the total workers involved and caused75 percent of the total idleness resulting from all strikes. The bitumi-nous-coal stoppage—in the "closed or union shop" classification—accounted for a large share of this idleness. Wages and hours werethe major issues in 26% percent of the strikes, including 30 percent of

21
CHART 3.
MAJOR ISSUES INVOLVED IN STRIKES1927-1939
PERCENT OF STRIKES
e.
1927 1928 1929 1930 19 31 1932 1933 1934 .1935 1936 193 7 1938 1939
PERCENT OF WORKERS INVOLVED IN STRIKES
1927 1928 1929 1930 1931 1932 1933 1934 1935 936 1937 938 1939MAJOR ISSUES:EzZa MISCELLANEOUS
UNION ORGANIZATIONZia WAGES AND HOURSU. S. BUREAU OF LABOR STATISTICS

22
the workers involved and causing 18 percent of the total idleness.About four-fifths of the wage-and-hour strikes were for wage increasesand one-fifth were defensive strikes, that is, protests against decreasedwages or increased hours.
In 20 percent of the strikes, including 16 percent of the total workersand accounting for 7 percent of the total idleness, the major issueswere miscellaneous matters other than wage-and-hour or union-organization issues. This group includes sympathy, jurisdictional,rival union, and factional strikes as well as disputes over such mattersas seniority, vacations, division of work, job classifications, and othergrievances concerning conditions of work.
Results of Strikes
The results of most strikes are fairly well known when the disputesare terminated. In some cases, however, subsequent developmentsmay reveal that the apparent results immediately at the close of thestrikes do not indicate the final effects. The results recorded statis-tically must of necessity be the apparent results at the close of thestrikes, since it is impossible to keep in touch with later developmentsor to determine, in many cases, what bearing the strikes have on whathappens later.
Of the 2,639 strikes ending in 1939, about 40 percent resulted insubstantial gains to the workers, that is, the strikers obtained sub-stantially' everything that was demanded. These strikes included 42percent of the total workers involved and accounted for 48 percent ofthe total man-days idle. About 32 percent of the strikes, including34 percent of the workers involved and accounting for 37 percent of thetotal idleness, resulted in partial gains or compromises. Approxi-mately 19 percent of the strikes, including 18 percent of the workersinvolved and accounting for 10% percent of the total idleness, resultedin little or no gains for the workers.
TABLE 11.—Results of Strikes Ending in 1939
Strikes Workers involved Man-days idle
ResultNumber Percent
of total Number Percentof total Number Percent
of total
Total 2, 639 100.0 1, 177, 883 100.0 18, 520, 503 100.0
Substantial gains to workers 1, 048 39. 7 493,149 41.8 8, 874, 685 48. 0Partial gains or compromises 852 32. 3 397, 776 33.8 6, 896, 797 37.2Little or no gains to workers 494 18. 7 209, 478 17. 8 1, 951.930 10. 5Jurisdiction, rival union, or faction
settlements 156 5.9 49, 539 4.2 633, 634 3.4Indeterminate 40 1. 6 24, 805 2.1 143, 526 .8Not reported 1 49 1. 9 3, 136 .3 19, 931 .1
I Most of the strikes in this group were against small shops in the women's clothing industry. The unionInvolved regarded many of them as being satisfactorily settled yet the exact terms of settlement were notreported.
Inde-termi-nate
Notre-
port-ed
23
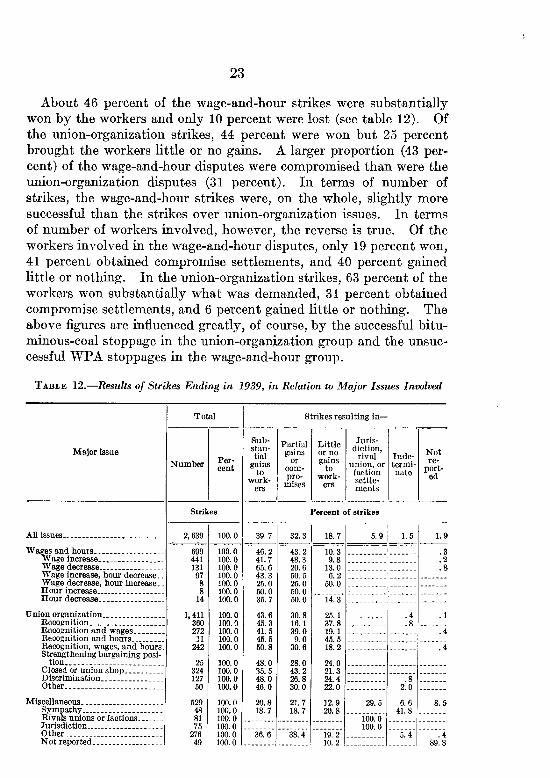
About 46 percent of the wage-and-hour strikes were substantiallywon by the workers and only 10 percent were lost (see table 12). Ofthe union-organization strikes, 44 percent were won but 25 percentbrought the workers little or no gains A larger proportion (43 per-cent) of the wage-and-hour disputes were compromised than were theunion-organization disputes (31 percent). In terms of number ofstrikes, the wage-and-hour strikes were, on the whole, slightly moresuccessful than the strikes over union-organization issues. In termsof number of workers involved, however, the reverse is true. Of theworkers involved in the wage-and-hour disputes, only 19 percent won,41 percent obtained compromise settlements, and 40 percent gainedlittle or nothing. In the union-organization strikes, 63 percent of theworkers won substantially what was demanded, 31 percent obtainedcompromise settlements, and 6 percent gained little or nothing. Theabove figures are influenced greatly, of course, by the successful bitu-minous-coal stoppage in the union-organization group and the unsuc-cessful WPA stoppages in the wage-and-hour group.
TABLE 12.-Results of Strikes Ending in 1939, in Relation to Major Issues Involved
Major issue
Total Strikes resulting in-
Number Per-cent
Sub-stan-tial
gainsto
work-ers
Partialgains
orcom-pro-
mises
Littleor nogains
towork-
ers
Juris-diction,
rivalunion. orfactionsettle-ments
Strikes Percent of strikes
All issues 2, 639 100. 0 39. 7 32. 3 18. 7 5.9 1. 5 1.9
Wages and hours 699 100.0 46. 2 43. 2 10. 3 .3Wage increase 441 100. 0 41. 7 48.3 9.8 .2Wage decrease 131 100. 0 65. 6 20. 6 13.0 . 8Wage increase, hour decrease.. 97 100.0 43. 3 50. 5 6. 2 Wage decrease, hour increase__ 8 100.0 25.0 25. 0 50. 0 Hour increase 8 100.0 50.0 50.0 Hour decrease 14 100.0 35. 7 50.0 14. 3
Union organization Recognition
1, 411360
100. 0100. 0
43. 645. 3
30. 816. 1
25. 1
37. 8 .4.8 .1
Recognition and wages 272 100. 0 41. 5 39.0 19. 1 .4Recognition and hours 11 100. 0 45. 5 9.0 45.5 Recognition, wages, and hours_ 242 100.0 50. 8 30. 6 18. 2 .4Strengthening bargaining posi-
tion 25 100.0 48. 0 28.0 24. 0 Closed or union shop 324 100. 0 35.5 43. 2 21.3 Discrimination 127 100.0 48.0 26.8 24.4 .8 Other 50 100.0 46. 0 30.0 22.0 2.0
Miscellaneous 529 100.0 20. 8 21. 7 12.9 29. 5 6. 6 8. 5Sympathy -- 48 100.0 18. 7 18. 7 20.8 41. 8 Rivals unions or factions 81 100.0 100. 0 Jurisdiction 75 100.0 100. 0 Other 276 100. 0 36. 6 38. 4 19. 2 5.4 .4Not reported 49 100.0 10.2 89.8

Total
Sub-Major issue
Number Per-cent
stan-tial
gainsto
work-ers
Strikes resulting in-
Juris-diction,
rivalunion, orfactionsettle-ments
Partialgains
Orcom-pro-
mises
Littleor nogains
towork-
ers
Inde-termi-nate
Notre-
port-ed
24
TABLE 12.-Results of Strikes Ending in 1939, in Relation to Major Issues Involved-Continued
Workers Percent of workers involved
All issues 1,177,883 100. 0 41.8 33. 8 17. 8 4. 2 2. 1 0.3
Wages and hours 351, 703 100.0 18. 8 40. 7 40. 5 (0Wage increase 133, 758 100. 0 25. 9 67. 2 6. 9 (1)Wage decrease 36, 007 100. 0 58. 7 30. 3 10. 8 .2Wage increase, hour decrease_ _ 43, 113 100. 0 14. 5 72. 4 13 1 Wage decrease, hour increase_ _ 127, 064 100.0 1. 3 1. 6 97. 1 Hour increase 1, 829 100. 0 36. 2 63. 8 Hour decrease 9, 932 100.0 17. 7 79. 6 2. 7
Union organization 641, 298 100.0 63. 3 30. 6 0 .1 (0Recognition 29, 751 100.0 40.3 31.8 26. 4 1. 5 Recognition and wages 68, 468 100. 0 43. 6 45. 9 10. 3 .2Recognition and hours 1, 280 100.0 73. 5 19. 5 0 Recognition, wages, and hours. 32, 535 100. 0 27. 5 65. 4 7. 1 (1)Strengthening bargaining posi-
tion 62, 667 100. 0 5. 9 84. 3 9. 8 Closed or union shop 423, 674 100. 0 81. 0 16. 5 2. 5 Discrimination 16, 288 100. 0 31. 9 49. 6 18. 4 .1 Other 6, 635 100.0 46. 1 39. 4 14. 1 .4
Miscellaneous 184, 882 100. 0 11. 1 31. 6 15. 7 26. 8 13. 2 1. 6Sympathy 12, 065 100. 0 3. 2 73. 5 5. 6 17. 7 Rival unions or factions 40, 868 100. 0 100. 0 Jurisdiction 8,671 100. 0 100.0Other Not reported
120, 2393, 039
100. 0100. 0
16. 7 41. 4
23. 4
5. 7 18. 5 (0 94
Less than a tenth of 1 percent.
In table 13 the 2,639 strikes ending in 1939 are classified accordingto results and duration. The successful strikes, generally speaking,tended to be of rather short duration. As strikes continued on for amonth or more the chances of a wholly successful settlement seem tohave diminished Of the strikes lasting less than 1 week, nearlyhalf were won by the workers, 25 percent were compromised, and 15percent resulted in little or no gains. The proportion of successfulstrikes diminished while the proportions of compromised and loststrikes increased in strikes of longer duration. Of those lasting 3months or more, only 22 percent were substantially won, 33 percentwere compromised, and 40 percent resulted in little or no gains.
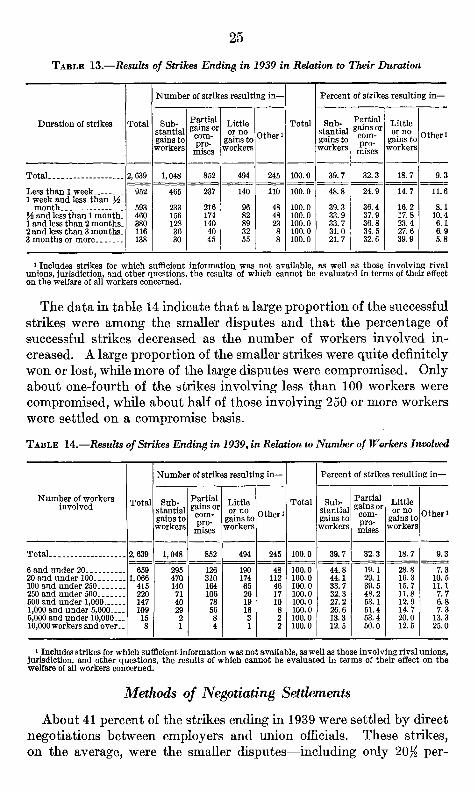
25
TABLE 13.-Results of Strikes Ending in 1939 in Relation to Their Duration
Number of strikes resulting in- Percent of strikes resulting in-
Duration of strikes Total Sub-stantialgains to
Partialgains or Little
or nogains to Others1
Total Sub-stantialgains to
Partial
corn-„,,,
Littleor 110.gains to Other 1corn-,..,,.„_
workers vt "-raises workers workers 't --mises workers
Total 2, 639 1, 048 852 494 245 100.0 39. 7 32. 3 18. 7 9. 3
Less than 1 week 952 465 237 140 110 100. 0 48.8 24.9 14. 7 11.61 week and less than 34
month 593 233 216 96 48 100.0 39. 3 36.4 16. 2 8. 14 and less than 1 month_ 460 156 174 82 48 100. 0 33.9 37.9 17.8 10.41 and less than 2 months_ 380 128 140 89 23 100.0 33. 7 36. 8 23. 4 6. 12 and less than 3 months_ 116 36 40 32 8 100.0 31.0 34.5 27.6 93 months or more 138 30 45 55 8 100.0 21. 7 32. 6 39.9 5.8
1 Includes strikes for which sufficient information was not available, as well as those involving rivalunions, jurisdiction, and other questions, the results of which cannot be evaluated in terms of their effecton the welfare of all workers concerned.
The data in table 14 indicate that a large proportion of the successfulstrikes were among the smaller disputes and that the percentage ofsuccessful strikes decreased as the number of workers involved in-creased. A large proportion of the smaller strikes were quite definitelywon or lost, while more of the large disputes were compromised. Onlyabout one-fourth of the strikes involving less than 100 workers werecompromised, while about half of those involving 250 or more workerswere settled on a compromise basis.
TABLE 14.-Results of Strikes Ending in 1939, in Relation to Number of Workers Involved
Number of strikes resulting in- Percent of strikes resulting in-
Number of workersinvolved Total Sub-
stantialains to
Partialgains or
corn-
Littleor no
gains to OthersTotal Sub-
stantialPartialgains orcoin
Littleor no
gains toworkersworkers raises workersPLO
g tow
ainsorkers wises workers
Total 2, 639 1, 048 852 494 245 100.0 39. 7 32.3 18. 7 9.3
6 and under 20 659 295 126 190 48 100.0 44.8 19. 1 28.8 320 and under 100 1, 066 470 310 174 112 100.0 44.1 29.1 16.3 10.5100 and under 250 415 140 164 65 46 100.0 33. 7 39. 5 15. 7 11.1250 and under 500 220 71 106 26 17 100.0 32.3 48.2 11.8 7.7500 and under 1,000. 147 40 78 19 10 100.0 27.2 53.1 12.9 6.81,000 and under 5,000 __ _ 109 29 56 16 8 100.0 26.6 51.4 14.7 7.35,000 and under 10,000 15 2 8 3 2 100.0 13.3 53.4 20.0 13.310,000 workers and over 8 1 4 1 2 100.0 12. 5 50.0 12. 5 25.0
1 Includes strikes for which sufficient information was not available, as well as those involv ing rival unions,jurisdiction, and other questions, the results of which cannot be evaluated in terms of their effect on thewelfare of all workers concerned.
Methods of Negotiating Settlements
About 41 percent of the strikes ending in 1939 were settled by directnegotiations between employers and union officials. These strikes,on the average, were the smaller disputes-including only 20 1/2 per-

26
cent of the total workers involved and accounting for about 11 percentof the total man-days idle as a result of all strikes. Governmentofficials or boards assisted in negotiating settlements for 38 percentof the strikes. These strikes included 62 percent of the total workersinvolved and caused 78 percent of the total idleness resulting from allstrikes. About 2 percent of the strikes were settled with the assistanceof private conciliators or arbitrators.
Of the 1,005 strikes settled with the assistance of governmentofficials or boards, 970 were settled through conciliation methods,and in 35 strikes the issues in dispute were arbitrated. Of the 48strikes in which private conciliators or arbitrators assisted, concilia-tion methods were used to settle 14, and in 34 some or all of the issueswent to arbitration.
About 17 percent of the strikes, including 16 percent of the workersinvolved and accounting for 9 percent of the total man-days idle, wereterminated without formal settlements. In most of these cases thestrikers returned to work on the employers' terms without settlementof the disputed issues, or they lost their jobs entirely when employersreplaced them with new workers, moved to other localities, or went outof business.
TABLE 15.—Methods of Negotiating Settlements of Strikes Ending in 1939
Strikes Workers involved Man-days idleNegotiations toward settlements carried
on by— Percent Percent PercentNumber of total Number of total Number of total
Total 2, 639 100.0 1, 177, 883 100.0 18, 520, 503 100. 0
Employers and workers directly 31 1.2 8, 289 .7 29, 067 .2Employers and representatives of organized
workers directly 1, 093 41. 4 241, 609 20. 5 1, 996, 221 10. 8Government officials or boards 1, 005 38. 1 724, 751 61. 6 14, 516, 966 78. 3Private conciliators or arbitrators 48 1. 8 18, 891 1. 6 345, 582 1.9Terminated without formal settlement 460 17.4 184, 182 15. 6 1, 627, 442 8.8Not reported 2 .1 161 (0 5, 225 (0
I Less than a tenth of 1 percent.
Sit-Down StrikesSit-down strikes, first receiving attention in 1936, had almost dis-
appeared in 1939. In 1936 there were 48 so-called sit-down strikes.In 1937 the number increased to 477, but by 1938 they decreased to52. There were only 6 strikes during 1939 in which all or part of thestrikers remained at their workplaces for one or more days afterceasing work. The number of workers idle in connection with these6 strikes was 3,416, although the number participating in the sit-downor stay-in feature is not known. Five of the 6 strikes, involving 3,391workers, occurred in February 1939 and 1 strike of 25 workers in March.
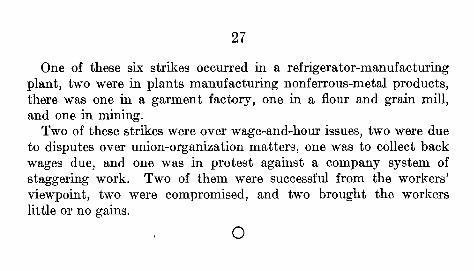
27
One of these six strikes occurred in a refrigerator-manufacturingplant, two were in plants manufacturing nonferrous-metal products,there was one in a garment factory, one in a flour and grain mill,and one in mining.
Two of these strikes were over wage-and-hour issues, two were dueto disputes over union-organization matters, one was to collect backwages due, and one was in protest against a company system ofstaggering work. Two of them were successful from the workers'viewpoint, two were compromised, and two brought the workerslittle or no gains.
0