Embed Size (px)
Citation preview
Strike Energy Limited
Quarterly Report
Q3 - 2017
Page 2
KEY HIGHLIGHTS Q3 2017
Technical Success
▪ Strike declared Technical Success and the producibility of the Vu Upper coal
seam in the Klebb area.
▪ Gas content of the Vu Upper coal was defined at 6.1 – 6.0m3/t.
Orica Gas Sales Agreement
▪ Strike negotiated a revised gas sales agreement for 64PJ at improved terms
subject to its Phase 1 FID.
▪ Orica agreed to extend the repayment date of the $2.5mln loan from 2018 to
2021 with certain conditions surrounding converting the loan to equity after
1st September 2018.
▪ Orica withdrew their claim for the $7.5mln repayment made against Strike in June
2017.
Jaws Project Funding Complete
▪ Strike successfully secured $9.1mln following an oversubscribed placement that
underpins the capital required for the Jaws 1 Vertical & Horizontal wells.
PACE Application
▪ Strike submitted an application for a grant as part of the PACE Round 2 program;
with results expected in late October.
Corporate & Organisation
▪ Relocation of Strike head office to Adelaide supported by a $990,000 grant from
SA Govt Economic Attraction Fund for the creation of 85 jobs by 2021.
▪ Recruitment of new CFO: Justin Ferravant from Santos.
▪ Andrew Seaton and Stuart Nicholls (MD) appointed to Board of Directors.
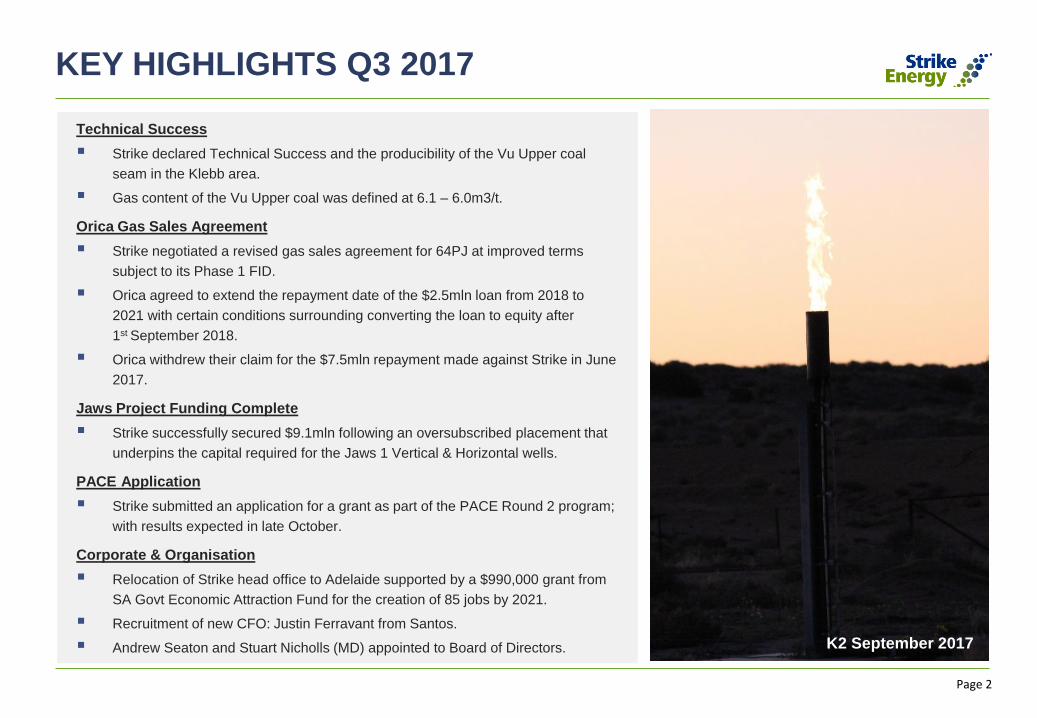
Flare from K2 during September
K2 September 2017
Page 3
OPERATIONS UPDATE
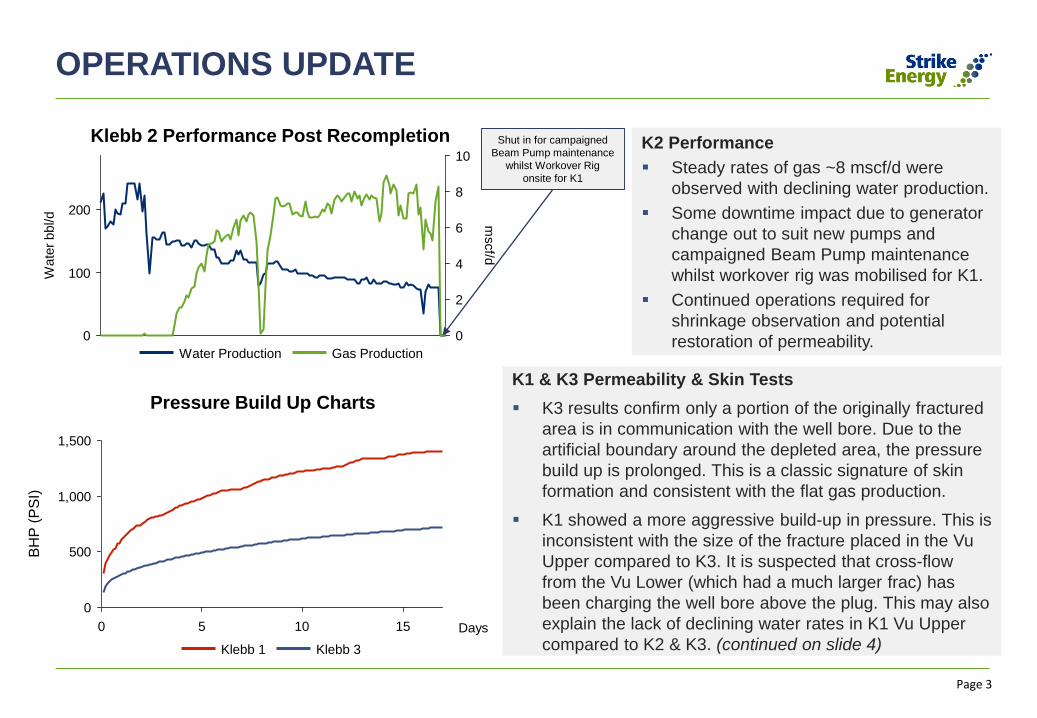
K2 Performance
▪ Steady rates of gas ~8 mscf/d were
observed with declining water production.
▪ Some downtime impact due to generator
change out to suit new pumps and
campaigned Beam Pump maintenance
whilst workover rig was mobilised for K1.
▪ Continued operations required for
shrinkage observation and potential
restoration of permeability.
K1 & K3 Permeability & Skin Tests
▪ K3 results confirm only a portion of the originally fractured
area is in communication with the well bore. Due to the
artificial boundary around the depleted area, the pressure
build up is prolonged. This is a classic signature of skin
formation and consistent with the flat gas production.
▪ K1 showed a more aggressive build-up in pressure. This is
inconsistent with the size of the fracture placed in the Vu
Upper compared to K3. It is suspected that cross-flow
from the Vu Lower (which had a much larger frac) has
been charging the well bore above the plug. This may also
explain the lack of declining water rates in K1 Vu Upper
compared to K2 & K3. (continued on slide 4)
Klebb 2 Performance Post Recompletion
Pressure Build Up Charts
0
100
200
0
2
4
6
8
10
mscf/d
Wate
r bbl/d
Gas ProductionWater Production
0
500
1,000
1,500
0 5 10 15 Days
BH
P (
PS
I)
Klebb 1 Klebb 3
Shut in for campaigned
Beam Pump maintenance
whilst Workover Rig
onsite for K1
Page 4
K1 RECOMPLETION
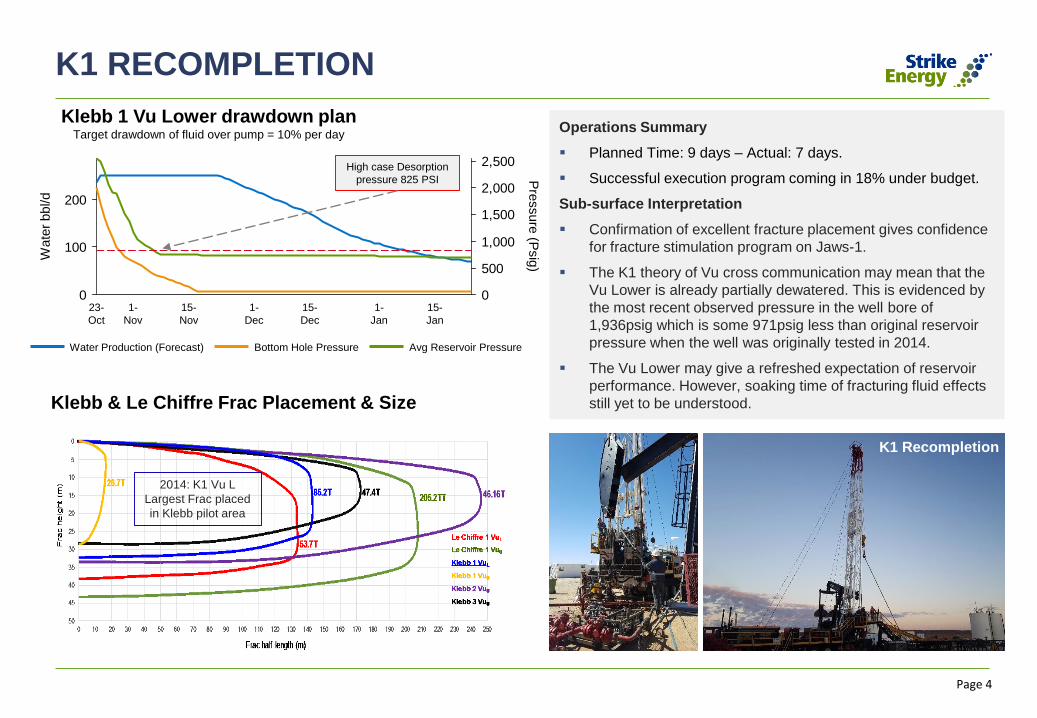
Klebb 1 Vu Lower drawdown planTarget drawdown of fluid over pump = 10% per day
Operations Summary
▪ Planned Time: 9 days – Actual: 7 days.
▪ Successful execution program coming in 18% under budget.
Sub-surface Interpretation
▪ Confirmation of excellent fracture placement gives confidence
for fracture stimulation program on Jaws-1.
▪ The K1 theory of Vu cross communication may mean that the
Vu Lower is already partially dewatered. This is evidenced by
the most recent observed pressure in the well bore of
1,936psig which is some 971psig less than original reservoir
pressure when the well was originally tested in 2014.
▪ The Vu Lower may give a refreshed expectation of reservoir
performance. However, soaking time of fracturing fluid effects
still yet to be understood.
2014: K1 Vu L
Largest Frac placed
in Klebb pilot area
0
100
200
0
500
1,000
1,500
2,000
2,500
Wate
r bbl/d
Pre
ssure
(Psig
)
15-
Jan
23-
Oct
1-
Jan
15-
Dec
15-
Nov
1-
Nov
1-
Dec
Water Production (Forecast) Avg Reservoir PressureBottom Hole Pressure
High case Desorption
pressure 825 PSI
Klebb & Le Chiffre Frac Placement & Size
K1 Bridge Plug MillingsK1 Recompletion
Page 5
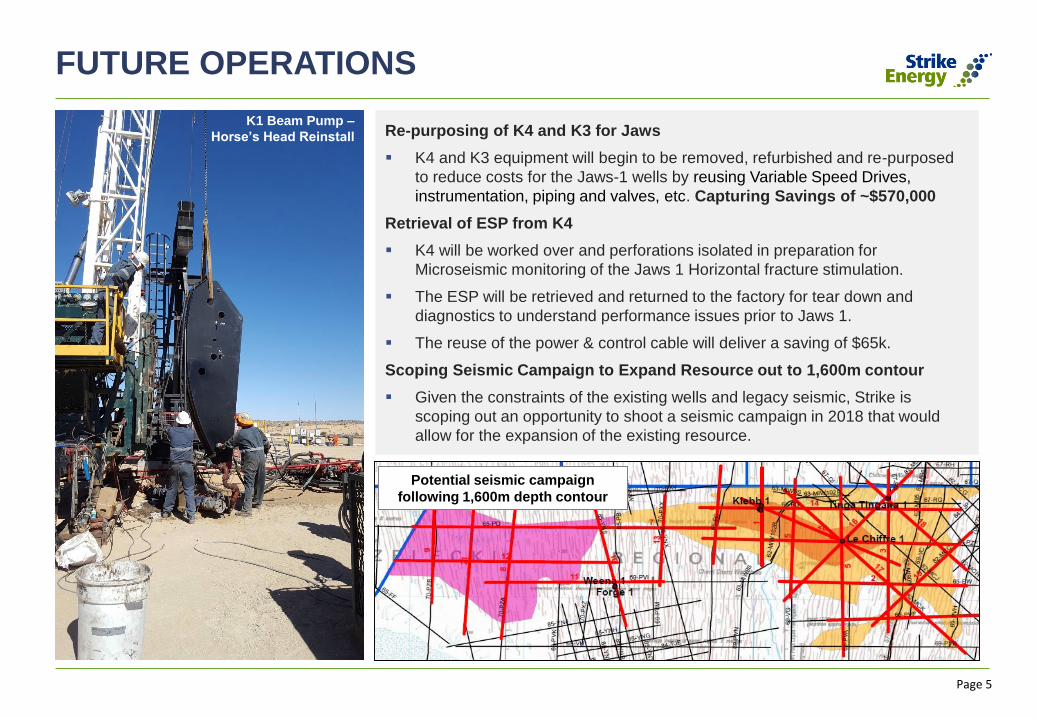
FUTURE OPERATIONS
Re-purposing of K4 and K3 for Jaws
▪ K4 and K3 equipment will begin to be removed, refurbished and re-purposed
to reduce costs for the Jaws-1 wells by reusing Variable Speed Drives,
instrumentation, piping and valves, etc. Capturing Savings of ~$570,000
Retrieval of ESP from K4
▪ K4 will be worked over and perforations isolated in preparation for
Microseismic monitoring of the Jaws 1 Horizontal fracture stimulation.
▪ The ESP will be retrieved and returned to the factory for tear down and
diagnostics to understand performance issues prior to Jaws 1.
▪ The reuse of the power & control cable will deliver a saving of $65k.
Scoping Seismic Campaign to Expand Resource out to 1,600m contour
▪ Given the constraints of the existing wells and legacy seismic, Strike is
scoping out an opportunity to shoot a seismic campaign in 2018 that would
allow for the expansion of the existing resource.
Potential seismic campaign
following 1,600m depth contour
K1 Beam Pump –
Horse’s Head Reinstall
Page 6
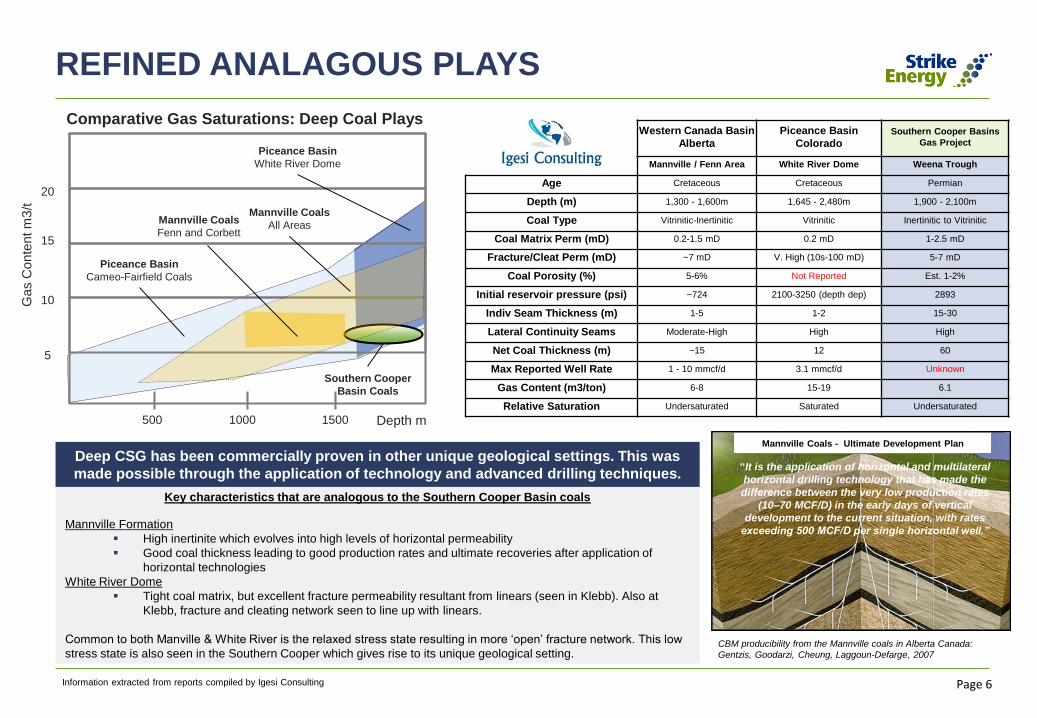
REFINED ANALAGOUS PLAYS
Key characteristics that are analogous to the Southern Cooper Basin coals
Mannville Formation
▪ High inertinite which evolves into high levels of horizontal permeability
▪ Good coal thickness leading to good production rates and ultimate recoveries after application of
horizontal technologies
White River Dome
▪ Tight coal matrix, but excellent fracture permeability resultant from linears (seen in Klebb). Also at
Klebb, fracture and cleating network seen to line up with linears.
Common to both Manville & White River is the relaxed stress state resulting in more ‘open’ fracture network. This low
stress state is also seen in the Southern Cooper which gives rise to its unique geological setting.
20
15
10
5
500 1000 1500
Mannville Coals
All Areas
Piceance Basin
Cameo-Fairfield Coals
Southern Cooper
Basin Coals
Gas C
onte
nt m
3/t
Depth m
Comparative Gas Saturations: Deep Coal Plays
Piceance Basin
White River Dome
Mannville Coals
Fenn and Corbett
Mannville Coals - Ultimate Development Plan
Western Canada Basin
Alberta
Piceance Basin
ColoradoSouthern Cooper Basins
Gas Project
Mannville / Fenn Area White River Dome Weena Trough
Age Cretaceous Cretaceous Permian
Depth (m) 1,300 - 1,600m 1,645 - 2,480m 1,900 - 2,100m
Coal Type Vitrinitic-Inertinitic Vitrinitic Inertinitic to Vitrinitic
Coal Matrix Perm (mD) 0.2-1.5 mD 0.2 mD 1-2.5 mD
Fracture/Cleat Perm (mD) ~7 mD V. High (10s-100 mD) 5-7 mD
Coal Porosity (%) 5-6% Not Reported Est. 1-2%
Initial reservoir pressure (psi) ~724 2100-3250 (depth dep) 2893
Indiv Seam Thickness (m) 1-5 1-2 15-30
Lateral Continuity Seams Moderate-High High High
Net Coal Thickness (m) ~15 12 60
Max Reported Well Rate 1 - 10 mmcf/d 3.1 mmcf/d Unknown
Gas Content (m3/ton) 6-8 15-19 6.1
Relative Saturation Undersaturated Saturated Undersaturated
“It is the application of horizontal and multilateral
horizontal drilling technology that has made the
difference between the very low production rates
(10–70 MCF/D) in the early days of vertical
development to the current situation, with rates
exceeding 500 MCF/D per single horizontal well.”
CBM producibility from the Mannville coals in Alberta Canada:
Gentzis, Goodarzi, Cheung, Laggoun-Defarge, 2007
Deep CSG has been commercially proven in other unique geological settings. This was
made possible through the application of technology and advanced drilling techniques.
Information extracted from reports compiled by Igesi Consulting
Page 7
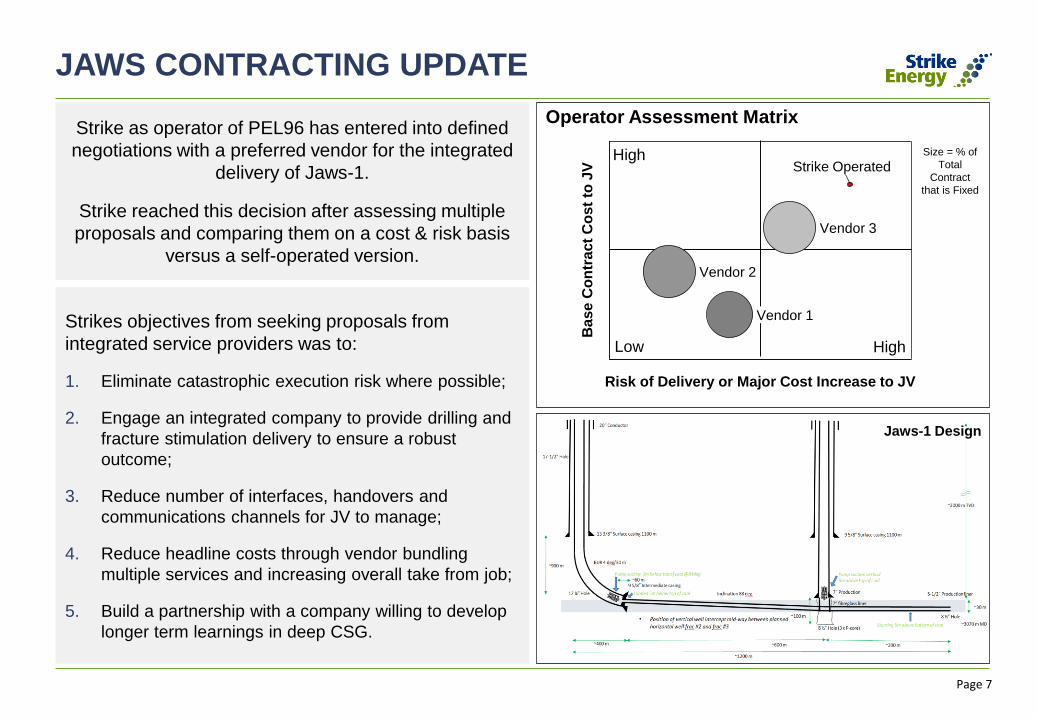
JAWS CONTRACTING UPDATE
Vendor 1
Ba
se
Co
ntr
act
Co
st
to J
V
Risk of Delivery or Major Cost Increase to JV
Strike Operated
Vendor 3
Vendor 2
Operator Assessment Matrix
Size = % of
Total
Contract
that is Fixed
Low High
High
Strike as operator of PEL96 has entered into defined
negotiations with a preferred vendor for the integrated
delivery of Jaws-1.
Strike reached this decision after assessing multiple
proposals and comparing them on a cost & risk basis
versus a self-operated version.
Strikes objectives from seeking proposals from
integrated service providers was to:
1. Eliminate catastrophic execution risk where possible;
2. Engage an integrated company to provide drilling and
fracture stimulation delivery to ensure a robust
outcome;
3. Reduce number of interfaces, handovers and
communications channels for JV to manage;
4. Reduce headline costs through vendor bundling
multiple services and increasing overall take from job;
5. Build a partnership with a company willing to develop
longer term learnings in deep CSG.
Jaws-1 Design
Page 8
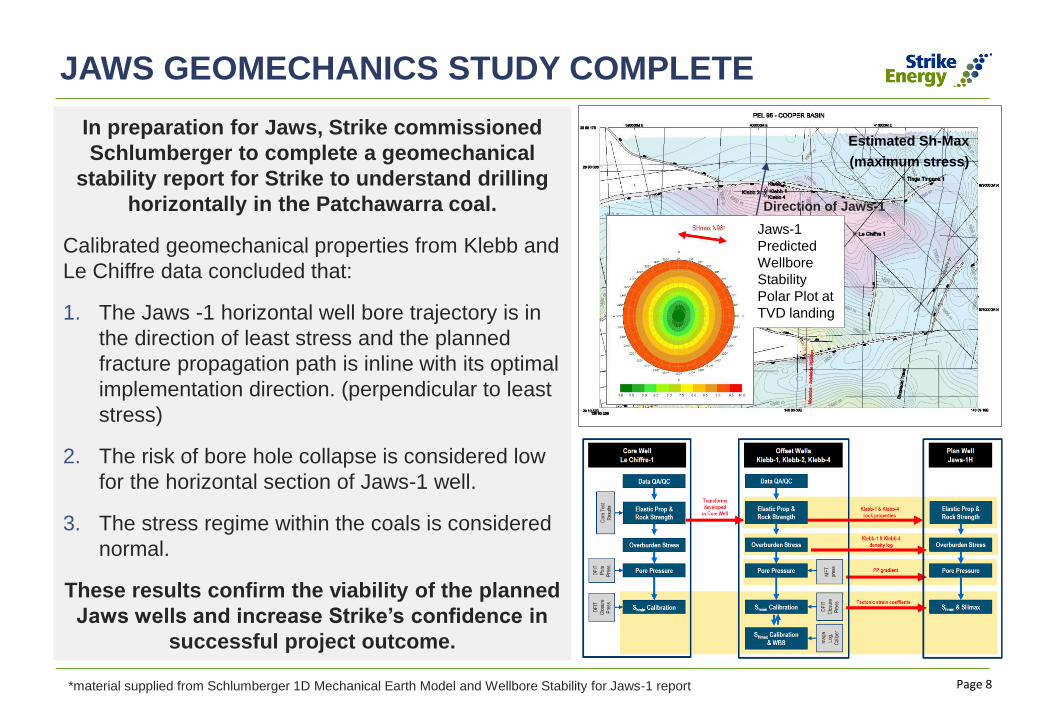
JAWS GEOMECHANICS STUDY COMPLETE
In preparation for Jaws, Strike commissioned
Schlumberger to complete a geomechanical
stability report for Strike to understand drilling
horizontally in the Patchawarra coal.
Calibrated geomechanical properties from Klebb and
Le Chiffre data concluded that:
1. The Jaws -1 horizontal well bore trajectory is in
the direction of least stress and the planned
fracture propagation path is inline with its optimal
implementation direction. (perpendicular to least
stress)
2. The risk of bore hole collapse is considered low
for the horizontal section of Jaws-1 well.
3. The stress regime within the coals is considered
normal.
These results confirm the viability of the planned
Jaws wells and increase Strike’s confidence in
successful project outcome.
Estimated Sh-Max
(maximum stress)
*material supplied from Schlumberger 1D Mechanical Earth Model and Wellbore Stability for Jaws-1 report
Direction of Jaws-1
Jaws-1
Predicted
Wellbore
Stability
Polar Plot at
TVD landing
Page 9
Board of Directors
John Poynton (Chairman)
Jody Rowe
Andrew Seaton
Stuart Nicholls (MD)
Tim Goyder
Corporate / Registered Office
Unit 1 31-35 George St,
Thebarton Adelaide SA 5031
T: +61 (08) 7099 7464
W: www.strikeenergy.com.au
Securities Exchange
ASX: STX
Securities on Issue
Shares: 1,094,640,299
Options: 16,200,000
Performance Rights 6,800,000
FINANCE & COMMERCIAL UPDATE
▪ Spend for the quarter on operations was $2.6 mln and was centered
around the piloting of the Klebb wells in achieving Technical Success.
▪ Strike completed negotiations with Orica and entered into a revised gas
sales agreement for 64PJ at improved terms and subject to its Phase 1 FID.
▪ Strike is continuing to draft the payment deed from the Economic
Investment Fund South Australia for the $990,000 grant as announced on
the 4th of September 2017.
▪ Strike successfully placed 130mln new shares in a oversubscribed capital
raising event, raising $9.1mln for forward operations.
▪ The joint venture activities and drilling of Jaws-1 are fully funded.
▪ Strike made an application for the PACE Gas Grant Program, round 2 with
results expected by end of October 2017.
▪ The Company completed the quarter with $10.8 mln of cash on hand at
30th September 2017.
Page 10
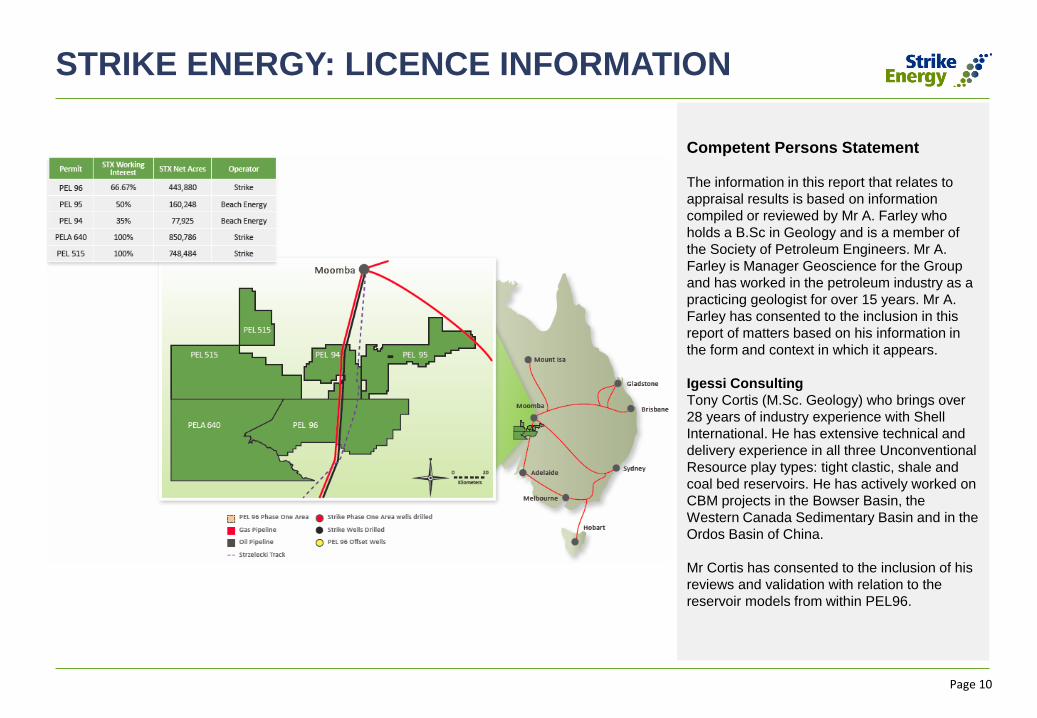
STRIKE ENERGY: LICENCE INFORMATION
Competent Persons Statement
The information in this report that relates to
appraisal results is based on information
compiled or reviewed by Mr A. Farley who
holds a B.Sc in Geology and is a member of
the Society of Petroleum Engineers. Mr A.
Farley is Manager Geoscience for the Group
and has worked in the petroleum industry as a
practicing geologist for over 15 years. Mr A.
Farley has consented to the inclusion in this
report of matters based on his information in
the form and context in which it appears.
Igessi Consulting
Tony Cortis (M.Sc. Geology) who brings over
28 years of industry experience with Shell
International. He has extensive technical and
delivery experience in all three Unconventional
Resource play types: tight clastic, shale and
coal bed reservoirs. He has actively worked on
CBM projects in the Bowser Basin, the
Western Canada Sedimentary Basin and in the
Ordos Basin of China.
Mr Cortis has consented to the inclusion of his
reviews and validation with relation to the
reservoir models from within PEL96.
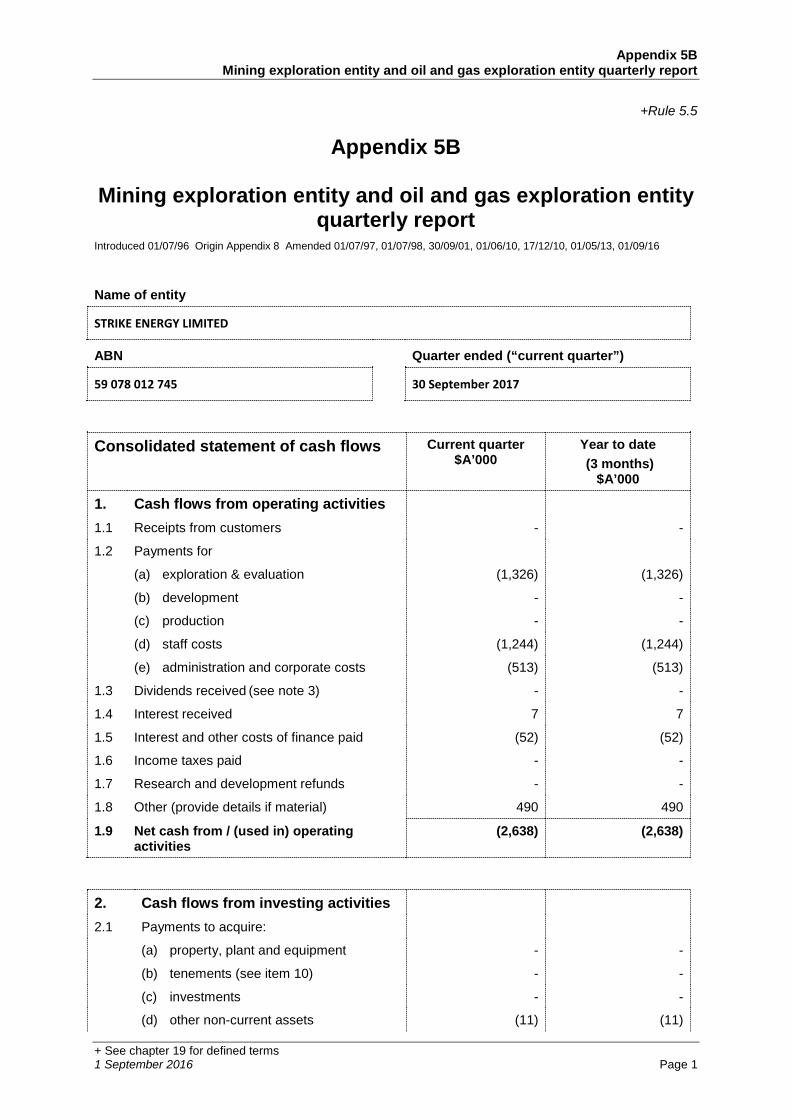
Appendix 5B Mining exploration entity and oil and gas exploration entity quarterly report
+ See chapter 19 for defined terms 1 September 2016 Page 1
+Rule 5.5
Appendix 5B
Mining exploration entity and oil and gas exploration entity quarterly report
Introduced 01/07/96 Origin Appendix 8 Amended 01/07/97, 01/07/98, 30/09/01, 01/06/10, 17/12/10, 01/05/13, 01/09/16
Name of entity
STRIKE ENERGY LIMITED
ABN Quarter ended (“current quarter”)
59 078 012 745 30 September 2017
Consolidated statement of cash flows Current quarter $A’000
Year to date
(3 months) $A’000
1. Cash flows from operating activities
- - 1.1 Receipts from customers
1.2 Payments for
(1,326) (1,326) (a) exploration & evaluation
(b) development - -
(c) production - -
(d) staff costs (1,244) (1,244)
(e) administration and corporate costs (513) (513)
1.3 Dividends received (see note 3) - -
1.4 Interest received 7 7
1.5 Interest and other costs of finance paid (52) (52)
1.6 Income taxes paid - -
1.7 Research and development refunds - -
1.8 Other (provide details if material) 490 490
1.9 Net cash from / (used in) operating activities
(2,638) (2,638)
2. Cash flows from investing activities
- -
2.1 Payments to acquire:
(a) property, plant and equipment
(b) tenements (see item 10) - -
(c) investments - -
(d) other non-current assets (11) (11)
Appendix 5B Mining exploration entity and oil and gas exploration entity quarterly report
+ See chapter 19 for defined terms 1 September 2016 Page 2
Consolidated statement of cash flows Current quarter $A’000
Year to date
(3 months) $A’000
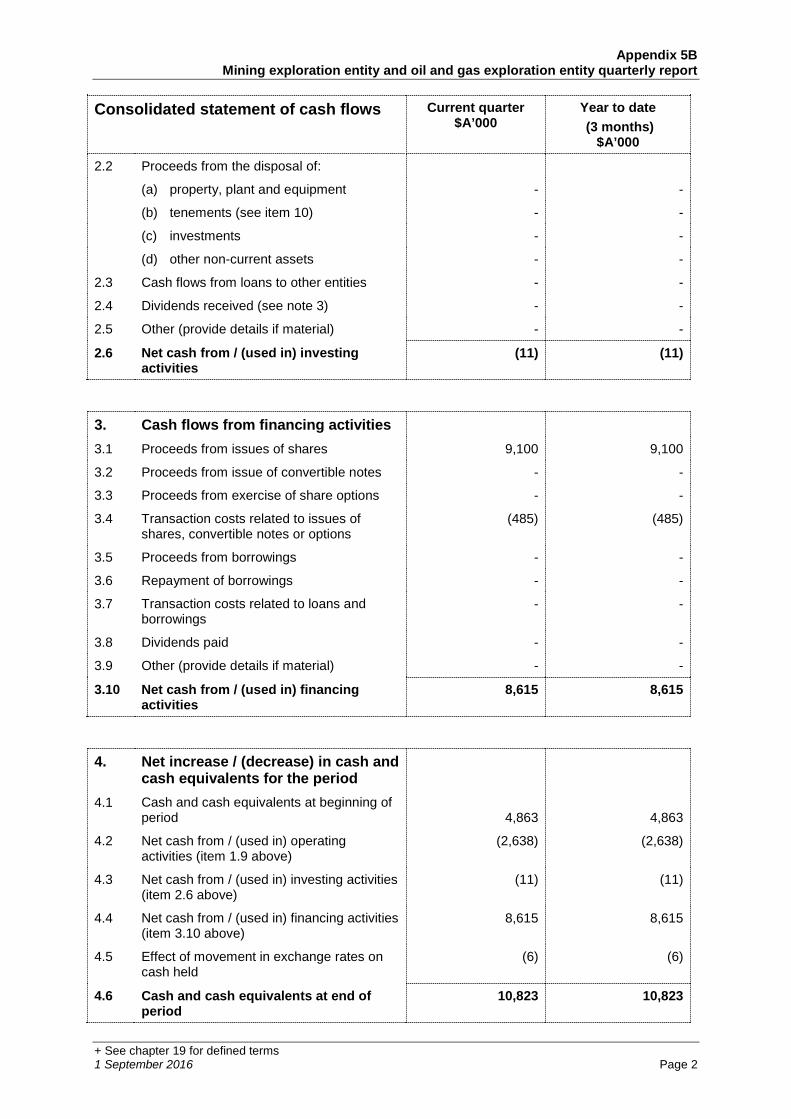
2.2 Proceeds from the disposal of:
- - (a) property, plant and equipment
(b) tenements (see item 10) - -
(c) investments - -
(d) other non-current assets - -
2.3 Cash flows from loans to other entities - -
2.4 Dividends received (see note 3) - -
2.5 Other (provide details if material) - -
2.6 Net cash from / (used in) investing activities
(11) (11)
3. Cash flows from financing activities
9,100 9,100 3.1 Proceeds from issues of shares
3.2 Proceeds from issue of convertible notes - -
3.3 Proceeds from exercise of share options - -
3.4 Transaction costs related to issues of shares, convertible notes or options
(485) (485)
3.5 Proceeds from borrowings - -
3.6 Repayment of borrowings - -
3.7 Transaction costs related to loans and borrowings
- -
3.8 Dividends paid - -
3.9 Other (provide details if material) - -
3.10 Net cash from / (used in) financing activities
8,615 8,615
4. Net increase / (decrease) in cash and cash equivalents for the period
4,863 4,863 4.1 Cash and cash equivalents at beginning of
period
4.2 Net cash from / (used in) operating activities (item 1.9 above)
(2,638) (2,638)
4.3 Net cash from / (used in) investing activities (item 2.6 above)
(11) (11)
4.4 Net cash from / (used in) financing activities (item 3.10 above)
8,615 8,615
4.5 Effect of movement in exchange rates on cash held
(6) (6)
4.6 Cash and cash equivalents at end of period
10,823 10,823
Appendix 5B Mining exploration entity and oil and gas exploration entity quarterly report
+ See chapter 19 for defined terms 1 September 2016 Page 3
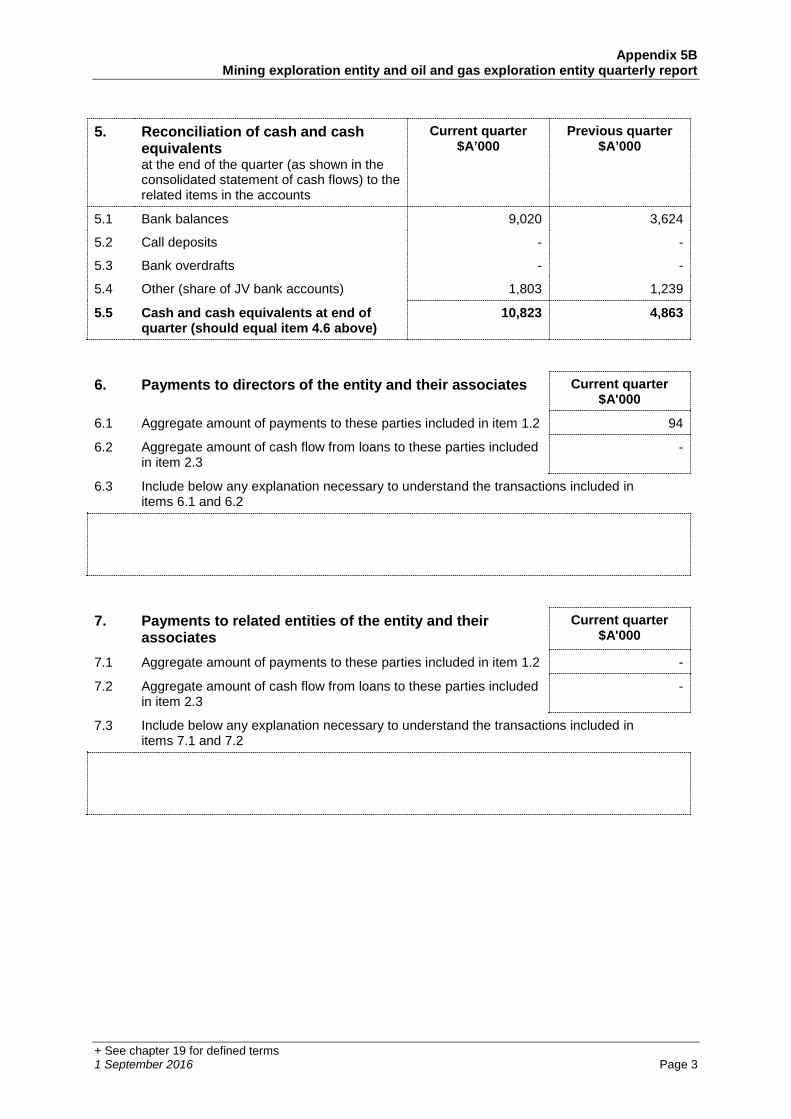
5. Reconciliation of cash and cash equivalents
at the end of the quarter (as shown in the consolidated statement of cash flows) to the related items in the accounts
Current quarter $A’000
Previous quarter $A’000
5.1 Bank balances 9,020 3,624
5.2 Call deposits - -
5.3 Bank overdrafts - -
5.4 Other (share of JV bank accounts) 1,803 1,239
5.5 Cash and cash equivalents at end of quarter (should equal item 4.6 above)
10,823 4,863
6. Payments to directors of the entity and their associates Current quarter $A'000
6.1 Aggregate amount of payments to these parties included in item 1.2 94
6.2 Aggregate amount of cash flow from loans to these parties included in item 2.3
-
6.3 Include below any explanation necessary to understand the transactions included in items 6.1 and 6.2
7. Payments to related entities of the entity and their associates
Current quarter $A'000
7.1 Aggregate amount of payments to these parties included in item 1.2 -
7.2 Aggregate amount of cash flow from loans to these parties included in item 2.3
-
7.3 Include below any explanation necessary to understand the transactions included in items 7.1 and 7.2
Appendix 5B Mining exploration entity and oil and gas exploration entity quarterly report
+ See chapter 19 for defined terms 1 September 2016 Page 4
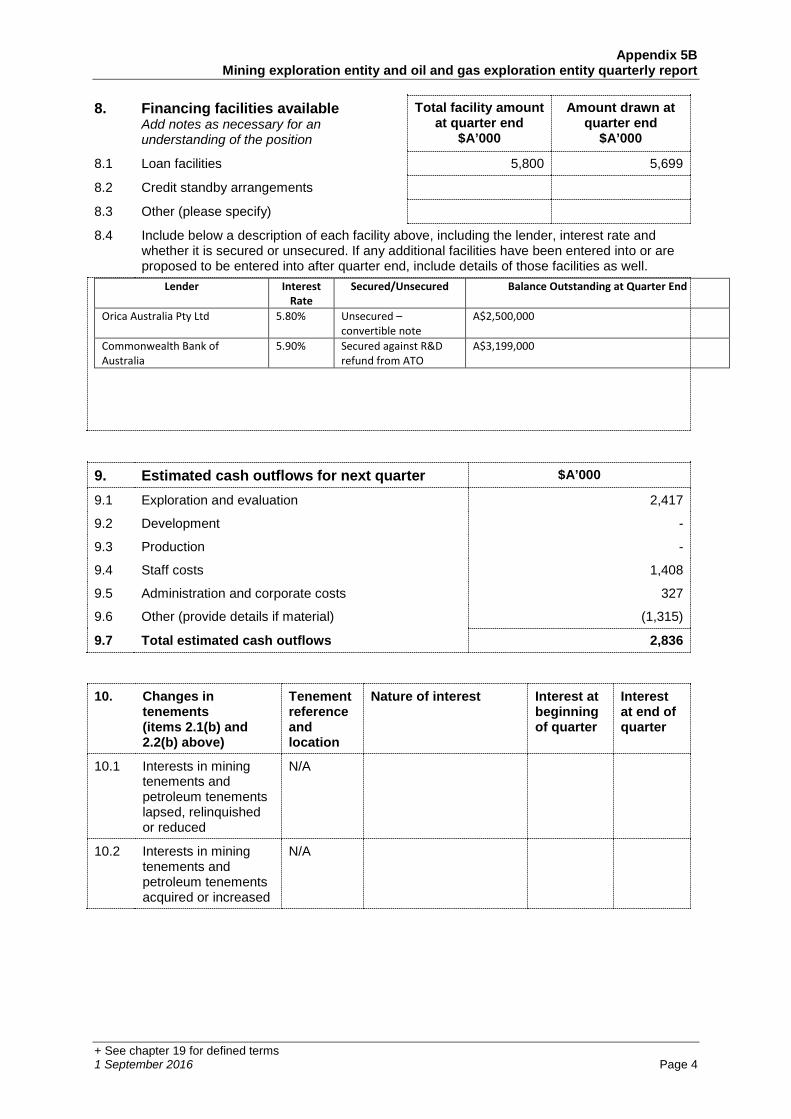
8. Financing facilities available Add notes as necessary for an understanding of the position
Total facility amount at quarter end
$A’000
Amount drawn at quarter end
$A’000
8.1 Loan facilities 5,800 5,699
8.2 Credit standby arrangements
8.3 Other (please specify)
8.4 Include below a description of each facility above, including the lender, interest rate and whether it is secured or unsecured. If any additional facilities have been entered into or are proposed to be entered into after quarter end, include details of those facilities as well.
Lender Interest Rate
Secured/Unsecured Balance Outstanding at Quarter End
Orica Australia Pty Ltd 5.80% Unsecured – convertible note
A$2,500,000
Commonwealth Bank of Australia
5.90% Secured against R&D refund from ATO
A$3,199,000
9. Estimated cash outflows for next quarter $A’000
9.1 Exploration and evaluation 2,417
9.2 Development -
9.3 Production -
9.4 Staff costs 1,408
9.5 Administration and corporate costs 327
9.6 Other (provide details if material) (1,315)
9.7 Total estimated cash outflows 2,836
10. Changes in tenements (items 2.1(b) and 2.2(b) above)
Tenement reference and location
Nature of interest Interest at beginning of quarter
Interest at end of quarter
10.1 Interests in mining tenements and petroleum tenements lapsed, relinquished or reduced
N/A
10.2 Interests in mining tenements and petroleum tenements acquired or increased
N/A
Appendix 5B Mining exploration entity and oil and gas exploration entity quarterly report
+ See chapter 19 for defined terms 1 September 2016 Page 5
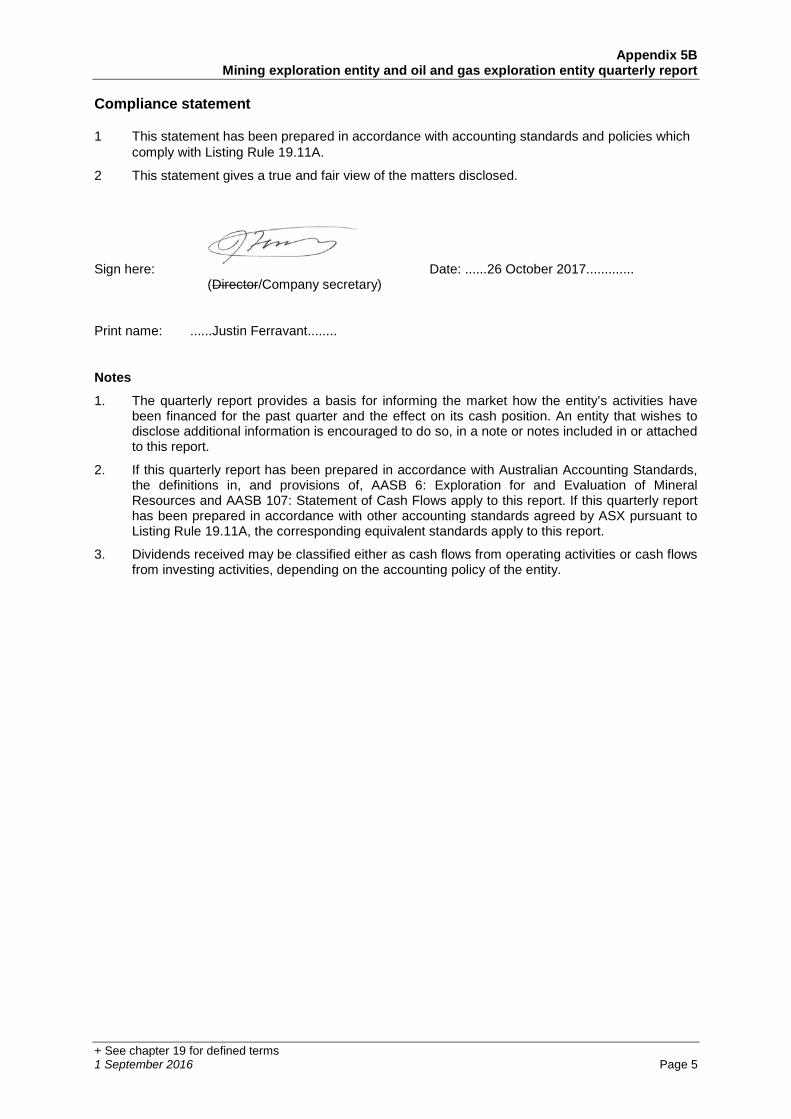
Compliance statement
1 This statement has been prepared in accordance with accounting standards and policies which
comply with Listing Rule 19.11A.
2 This statement gives a true and fair view of the matters disclosed.
Sign here: Date: ......26 October 2017............. (Director/Company secretary)
Print name: ......Justin Ferravant........
Notes
1. The quarterly report provides a basis for informing the market how the entity’s activities have been financed for the past quarter and the effect on its cash position. An entity that wishes to disclose additional information is encouraged to do so, in a note or notes included in or attached to this report.
2. If this quarterly report has been prepared in accordance with Australian Accounting Standards, the definitions in, and provisions of, AASB 6: Exploration for and Evaluation of Mineral Resources and AASB 107: Statement of Cash Flows apply to this report. If this quarterly report has been prepared in accordance with other accounting standards agreed by ASX pursuant to Listing Rule 19.11A, the corresponding equivalent standards apply to this report.
3. Dividends received may be classified either as cash flows from operating activities or cash flows from investing activities, depending on the accounting policy of the entity.