Embed Size (px)
Citation preview
Mossavar-Rahmani Center for Business & Government Weil Hall | Harvard Kennedy School | www.hks.harvard.edu/mrcbg
M-RCBG Associate Working Paper Series | No. 70
The views expressed in the M-RCBG Associate Working Paper Series are those of the author(s) and do not necessarily reflect those of the Mossavar-Rahmani Center for Business & Government or of
Harvard University. The papers in this series have not undergone formal review and approval; they are presented to elicit feedback and to encourage debate on important public policy challenges. Copyright
belongs to the author(s). Papers may be downloaded for personal use only.
Strict Price Control and Behaviorally Informed Pharmaceutical Policy:
Evidence from Poland
Maciej Drozd and Katarzyna Michalska
January 2017
1 / 32
Maciej Drozd1 Katarzyna Michalska2 Strict Price Control and Behaviorally Informed Pharmaceutical Policy: Evidence from Poland Abstract Poland’s Reimbursement Act of 2012 introduced one of the most restrictive pharmaceutical pricing policies in the developed world. Under this law, prices and margins for reimbursed prescription drugs were fixed by the government and indexed to market share in therapeutic classes. In this paper, we offer a first empirical evaluation of the Reimbursement Act by analyzing the public payer’s claims data from 2010 to 2014. We find that Poland was successful in lowering drug prices and containing aggregate spending at no loss to coverage. Reimbursement per daily drug dose decreased by 18% and patient copayment fell by 7% (averages weighted by sales). Yet patients and the national payer could have saved more if patients and prescribers were more attentive to prices of substitute medicines. We suggest several behaviorally informed measures to encourage further cost savings in the Polish pharmaceutical market. Table of Contents Introduction I. Background on strict pharmaceutical price control in Poland
I.1. Administrative prices and margins I.2. Limit groups I.3. Reimbursement and copayment I.4. Payback
II. Evaluation of strict pharmaceutical price control in Poland II.1. Data II.2. Methodology II.3. Results
II.3.1. Coverage II.3.2. Prices II.3.3. Expenditures II.3.4. Utilization
III. Consumer behavior III.1. Foregone savings III.2. Price inelasticity III.3. Potential explanations
IV. Recommendations JEL Codes H51, I13, K32
1 Corresponding author ([email protected]) and Fellow, Mossavar-Rahmani Center for Business and Government, John F. Kennedy School of Government, Harvard University (2015/2016). 2 MBA candidate, School of Business, Quinnipiac University.
2 / 32
Acknowledgments We were privileged to receive counsel on this paper from Brigitte Madrian, Richard Zeckhauser, and other participants of research seminars held by the Mossavar-Rahmani Center for Business and Government (MRCBG) at the Harvard Kennedy School. We are indebted to faculty and students at the Harvard Ph.D. Program in Health Policy for reviewing earlier versions of the document. We also thank members and affiliates of the Polish Association of Law and Economics as well as staff at the Ministry of Health in Warsaw for providing feedback. We are grateful to Devjani Roy for proofreading and editing the paper. This research would not have been possible without support from Scott Leland and Jennifer Nash at MRCBG as well as funding from the U.S. Department of State and the European Commission’s Directorate for Education and Culture. Any errors are the sole responsibility of the authors.
3 / 32
Strict Price Control and Behaviorally Informed Pharmaceutical Policy: Evidence from Poland Last year, people all over the world spent more on health care than they ever had. This statement was valid in 2015, 2014, 2013, 2012, and each of the prior 20 years, for which the World Bank and World Health Organization collected data. It is true in absolute, relative, nominal, and real terms. It is also likely to remain unchanged in the near future due to rising costs, ageing populations, and low price elasticity of demand. The growth of health care spending was pronounced in almost every market segment, from primary care, hospitals, clinical services, long-term care to medical products. This paper focuses on pharmaceutical expenditures in Poland, the largest economy in Central and Eastern Europe. Poland stands out among other member states of the Organization for Economic Cooperation and Development (OECD) as a country that grows wealthier but spends less of its income on pharmaceuticals. In 2002, the first year for which reliable data is available, Poles spent almost 1.79% of GDP on drugs.3 Twelve years later, this ratio dropped to 1.34%. The reverse took place in the largest OECD countries, such as the United States and Japan, where pharmaceutical expenditures increased from 1.74% and 1.44% in 2012 to 2.04% and 2.14% of GDP. Together with countries such as Austria, the Netherlands and all the Scandinavian states, Poland spent among the OECD’s EU members the least of income on drugs. At the same time, life expectancy and other measures of population health have been improving in Poland and other OECD countries at similar rates. How did Poland stay healthy but spend less of its rising income on pharmaceuticals? One of the explanations for Poland’s success is the government’s drug price control policy. This policy applies to prescription drugs that are reimbursed by the government or the National Health Fund (Narodowy Fundusz Zdrowia, hereafter NFZ), the country’s sole payer and central administrator of health insurance. Since health insurance is compulsory4 and near-universal5, the public pays for more than 70% of all health expenditures. It is also the largest funder of drugs and accounted for around 37% of the Polish pharmaceutical market in 2013.6 Over the past decade, the Polish government has been leveraging its bargaining power in negotiations with pharmaceutical companies interested in public coverage. In 2010 it proposed to 3 All data cited in this paragraph from OECD Health Statistics. 4 The majority of Poles are obliged to pay around 9% of their income (salary, pension, unemployment benefits etc.) to health insurance. Contributions are not split with, or matched by, employers, but a large share (86.11%) is tax-deductible. 5 Sagan, Adam, et al. "Poland health system review." Health Systems in Transition 13, no. 8 (2010): 1-193. As of 31 December 2009, approximately 97.6% of the Polish population had health insurance coverage through the NFZ. Of these 37.2 million individuals, almost 28.7 million (about 77%) were insured on a mandatory basis and 8.5 million (about 23%) were covered as dependents. Only 26771 (0.07%; including dependents) were insured on a voluntary basis. 6 Own estimates aggregated from monthly market surveys made publicly available by PharmaExpert, a leading provider of market intelligence in the Polish pharmaceutical sector, and OECD Health Statistics.
4 / 32
set administratively retail prices and mark-ups for pharmacies and wholesalers, limit reimbursement rates to the lowest of these retail prices, require companies to pay back a share of their revenue if budget ceilings are exceeded, and many other far-reaching measures. These proposals constituted the core of the Reimbursement Act, which was approved by parliament in May 2011 and went into effect in January 2012. They are presented in detail in section I of this paper. We believe that the provisions adopted under the Reimbursement Act are unique and that they merit attention from policymakers and health researchers. In our review of the comparative literature on pharmaceutical pricing policies, we have not found evidence of such extensive regulation of drug prices in other countries.7 We would like to offer a first empirical study of the effects of what we label “strict pharmaceutical price control”.8 To do so, we retrospectively estimate savings of the Reimbursement Act. We also calculate savings that were foregone by consumers. Our analysis of savings is not limited to switching from branded to generic drugs. It includes savings from substituting a brand-name drug for another patent-protected product, and price-optimizing between generics. We conclude that the Polish government was successful in containing the cost of pharmaceuticals and reimbursing new therapies. We also show how it could do better by incorporating behavioral insights into the design of its pharmaceutical policy. The following section of the paper presents essential background on the 2012 Reimbursement Act. We consciously omit some details of this 80-page long document to focus on the most important features of strict pharmaceutical price control. In section two, we present our data, method, and estimates of savings realized through price control. In section three, we analyze how these estimates differ from optimal savings and discuss plausible reasons, including cognitive biases, that explain these differences. In the closing section of the paper, we explain why extensive reforms to boost patient savings are likely to fail and why behaviorally informed interventions, including “nudges” (simple, low-cost, choice-preserving changes to the decision environment popularized by Richard Thaler and Cass Sunstein in their eponymous book9), are viable alternatives. 7 No systematic comparison is available for OECD countries, but data on drug pricing regimes in the EU have been recently compiled as part of the Pharmaceutical Pricing and Reimbursement Information Project (PPRI). National policies were compared with regards to the scope of price control at manufacturer/wholesaler/pharmacy level, the existence of reference price systems, the reference price level, the scope of drug reference groups, generic price linkages etc. Poland’s 2012 Reimbursement Act includes features that characterize the most restrictive price regimes. It also includes other spending controls such as administrative prices, paybacks and price-volume arrangements. We have identified only one dimension, in which Poland did not implement restrictive measures: Polish pharmacists have the right but not the obligation to substitute branded drugs for generics. Carone, G., C. Schwierz, and A. Xavier. "Cost-containment policies in public pharmaceutical spending in the EU.” Brussels: European Commission, Directorate-General for Economics and Financial Affairs, 2012. Aaserud, Morten, et al. "Pharmaceutical policies: effects of reference pricing, other pricing, and purchasing policies." The Cochrane Library (2006). Vogler, Sabine. "The impact of pharmaceutical pricing and reimbursement policies on generics uptake: implementation of policy options on generics in 29 European countries–an overview." Generics and Biosimilars Initiative Journal 1, no. 2 (2012): 44-51. 8 Our analysis elaborates on earlier research conducted with officials from the Health Ministry in Warsaw. 9 Thaler, Richard H., and Cass R. Sunstein. "Nudge: Improving Decisions about health, wealth and happiness”. Yale University Press, 2008.
5 / 32
I. Background: Strict Pharmaceutical Price Control in Poland The 2011 Reimbursement Act fundamentally reshaped access to prescription pharmaceuticals in Poland. It changed every aspect of reimbursement, including requirements for health technology assessments,10 spending caps on pharmaceutical drugs,11 and restrictions on advertising and drug sales.12 While all these changes were important, they were eclipsed by the introduction of strict pharmaceutical price control. The new pricing policy for drugs was built on four principles:
1) fixing retail prices and margins through administrative measures; 2) organizing drugs into “limit groups”, i.e. groups of chemically equivalent, therapeutically
similar products, each sharing the same reimbursement limit; 3) limiting reimbursements and patient copayments to the cheapest products that make up
15% of sales in the limit group; 4) introducing budget ceilings for each limit group and requiring pharmaceutical companies
to pay back a share of their revenue if budget ceilings are exceeded. We explain each of these principles in detail in the following subsections and illustrate them with the example of quinolones (broad-spectrum antibiotics). I.1. Administrative prices and margins From 2012 onwards, drug prices were set administratively and controlled by the government. Price levels and volumes were first negotiated between the government and pharmaceutical companies. The Health Ministry then fixed prices in bimonthly ordinances, and became solely responsible for changes in their levels. Fixing and changing prices administratively was designed to contain escalating health care costs. Before 2012, the government set upper limits for retail prices and sales margins of reimbursed drugs. Drug companies were permitted to offer drugs at lower prices than the upper limit. Reimbursement was fixed as a proportion of the maximum price.13 Pharmacies leveraged this pricing system by offering discounts and thus increasing total drug purchases.14 In addition, public costs escalated because pharmacists had the right to qualify for reimbursement medicines that were not covered by state insurance but were “similar” to reimbursable drugs. 10 Since the introduction of the Reimbursement Act the reimbursement process has become more transparent and fulfills the requirements of Council Directive 89/105/EEC. One of the most important requirements is that every rejection of reimbursement must be based on objective criteria. Also the process of issuing a decision must be completed within 180 days. 11 The Reimbursement Act capped public spending on drugs and medical devices at around 17% of general government spending on health care. Under this ceiling, funds saved through price control were to be reinvested in reimbursing previously unaffordable products and therapies. 12 The ban on pharmaceutical advertising was extended from reimbursed drugs to all prescription medicines. Pharmacies were no longer allowed to advertise. These rules were strictly enforced. In 2013 and 2014 several pharmacies were fined for informing about their participation in voluntary health plans. In addition, pharmacies lost discretion over reimbursement as they were no longer permitted to sell drugs not listed by the Ministry of Health. 13 If the retail price was lower than the fixed proportion of the maximum price, reimbursement was reduced to the retail price to prevent pharmacies from increasing sales through fictitious purchases. 14 Certain drugs were discounted to as low as 1 gr (0.01 PLN = ca. 0.0025 USD) per package.
6 / 32
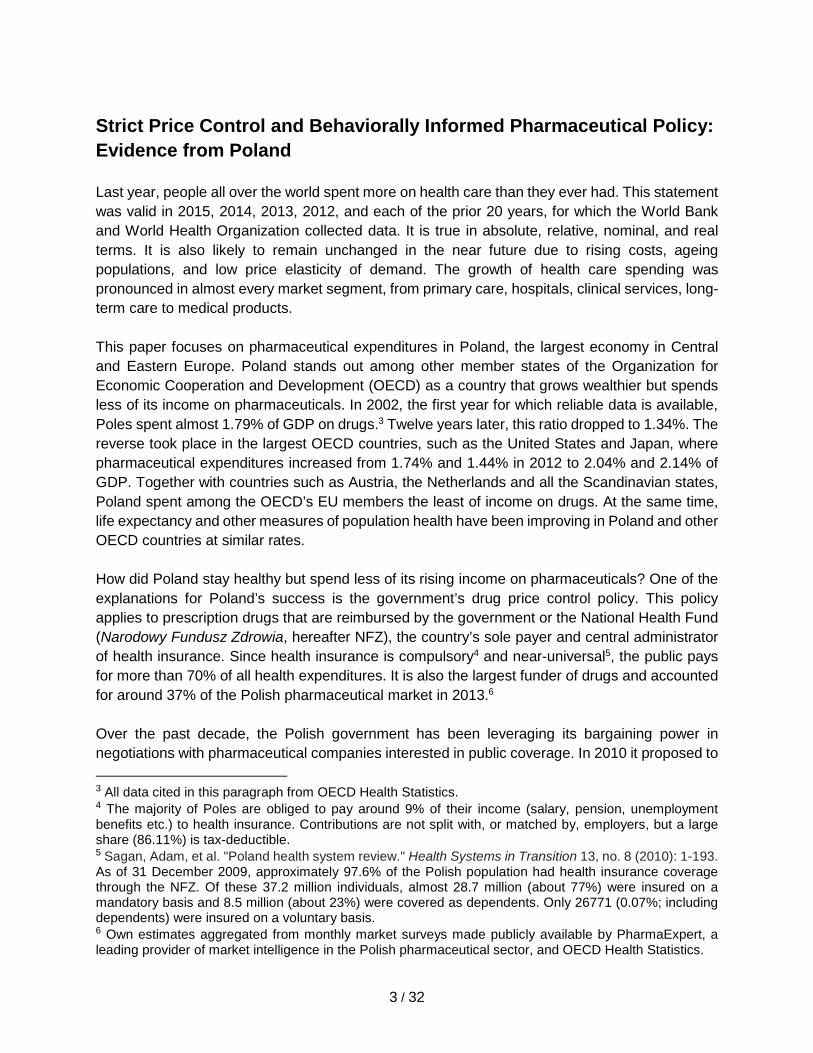
Wholesaler and pharmacy margins were also set administratively beginning in 2012, but unlike prices, they were not subject to negotiations. Margin levels were specified by the Reimbursement Act. Wholesalers were entitled to 7% of the administrative price in 2012, 6% in 2013, and 5% in subsequent years.15 Pharmacies obtained a variable, regressive share of the wholesale price shown in table 1.16 Pharmacy margins were equated across different products within the same limit group to make pharmacies indifferent between disbursing an expensive drug or its cheaper substitute. In box 1, the rules for calculating wholesale and retail prices are demonstrated for quinolone antibacterial drugs. Table 1. Retail margins as a function of wholesale price (x)17 Wholesale price ranges in PLN Retail margins [0,5) 40%*x [5.01,10) 2 PLN + 30%*(x-5) [10.01,20) 3.5 PLN + 20%*(x-10) [20.01,40) 5.50 PLN +15%*(x-20) [40.01,80) 8.50 PLN + 10%*(x-40) [80.01,160) 12.50 PLN + 5%*(x-80) [160.01,320) 16.50 PLN + 2,5%*(x-160) [320.01,640) 20.50 PLN +2,5%*(x-320) [640.01,1280) 28.50 PLN +2,5%*(x-640) [1280.01,...] 44.50 PLN +1,25%*(x-1280) Source: Reimbursement Act
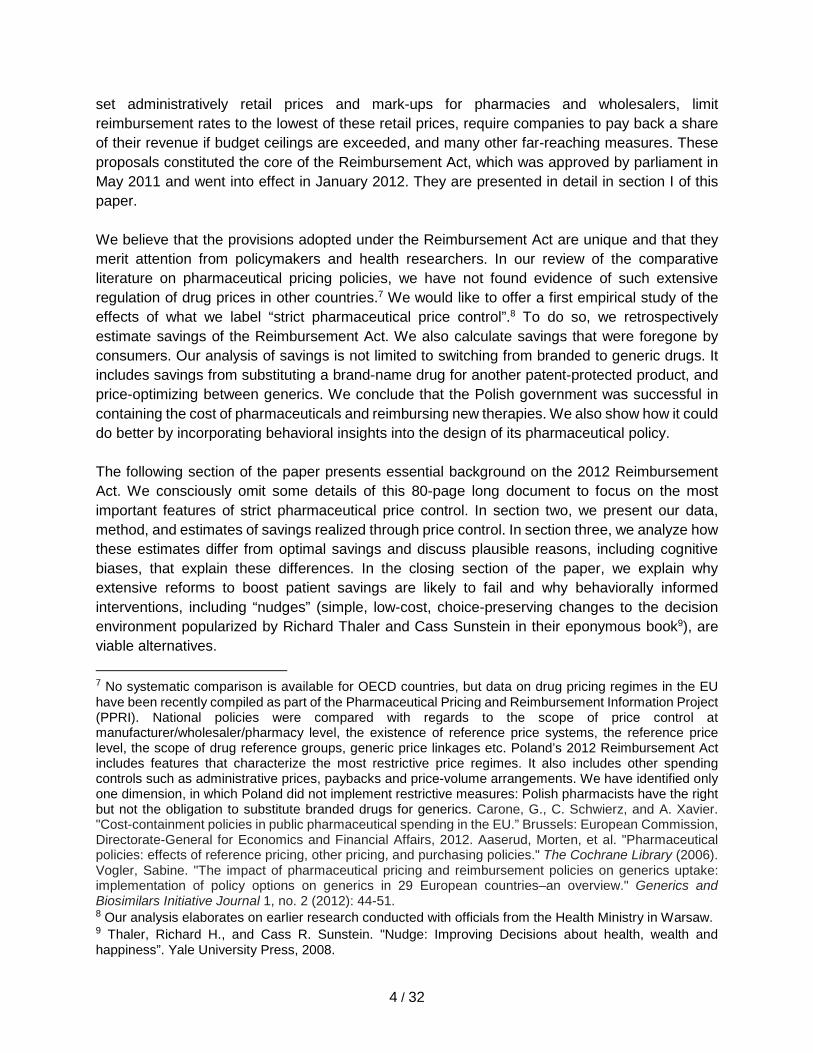
Box 1. Administrative prices of quinolones Quinolones are broad-spectrum antibiotics, used mainly for treating infections. Quinolones make up the limit group 105.0 Quinolone antibacterial drugs - Fluoroquinolones for oral usage. This group contains 14 products, ten of which include Citroplofraxinum as their active ingredient, two include Ofloxacinum and two include Norfloxacinum. The table below lists all quinolones that were listed in limit group 105.0 and reimbursed in July and August 2012, together with their administrative, wholesale and retail prices.
EAN Active ingredient Drug name Dose
Defined daily doses
Administrative price
Wholesale price
Retail price
5909990499113 Ciprofloxacinum CIPHIN 500 500 mg 5 7,99 8,55 10,88 5909990066216 Ciprofloxacinum Ciprinol 500 mg 5 13,50 14,45 16,78 5909990066414 Ciprofloxacinum Ciprinol 250 mg 2,5 8,64 9,24 10,46 5909990308514 Ciprofloxacinum Cipronex 250 mg 2,5 7,56 8,09 9,31 5909990334964 Ciprofloxacinum Cipronex 500 mg 5 7,95 8,51 10,84 5909990308712 Ciprofloxacinum Cipropol 250 mg 2,5 7,83 8,38 9,6 5909990729012 Ciprofloxacinum Cipropol 500 mg 5 11,34 12,13 14,46 5909990338030 Ciprofloxacinum Cyprofloksacyna 500 mg 5 7,56 8,09 10,42 5909991033514 Ciprofloxacinum Proxacin 250 250 mg 2,5 5,29 5,66 6,88 5909991033613 Ciprofloxacinum Proxacin 500 500 mg 5 9,18 9,82 12,15 5909991102838 Norfloxacinum NORSEPT 400 mg 10 10,58 11,32 15,26 5909990085323 Norfloxacinum Nolicin 400 mg 10 11,40 12,2 16,14 5909990111213 Ofloxacinum Tarivid 200 200 mg 5 12,95 13,86 16,19 5909990111213 Ofloxacinum Tarivid 200 200 mg 5 12,95 13,86 16,19 Source: Ministry of Health communiqué
15 The administrative price is the retail price net of wholesale and pharmacy margins. 16 The wholesale price equals the administrative sales price plus wholesale margin. 17 “x” stands for wholesale price of the limit-setting reference product, reweighted to reflect any differences between the number of daily doses in a package of any given product and the number of daily doses in a package of the reference product.
7 / 32
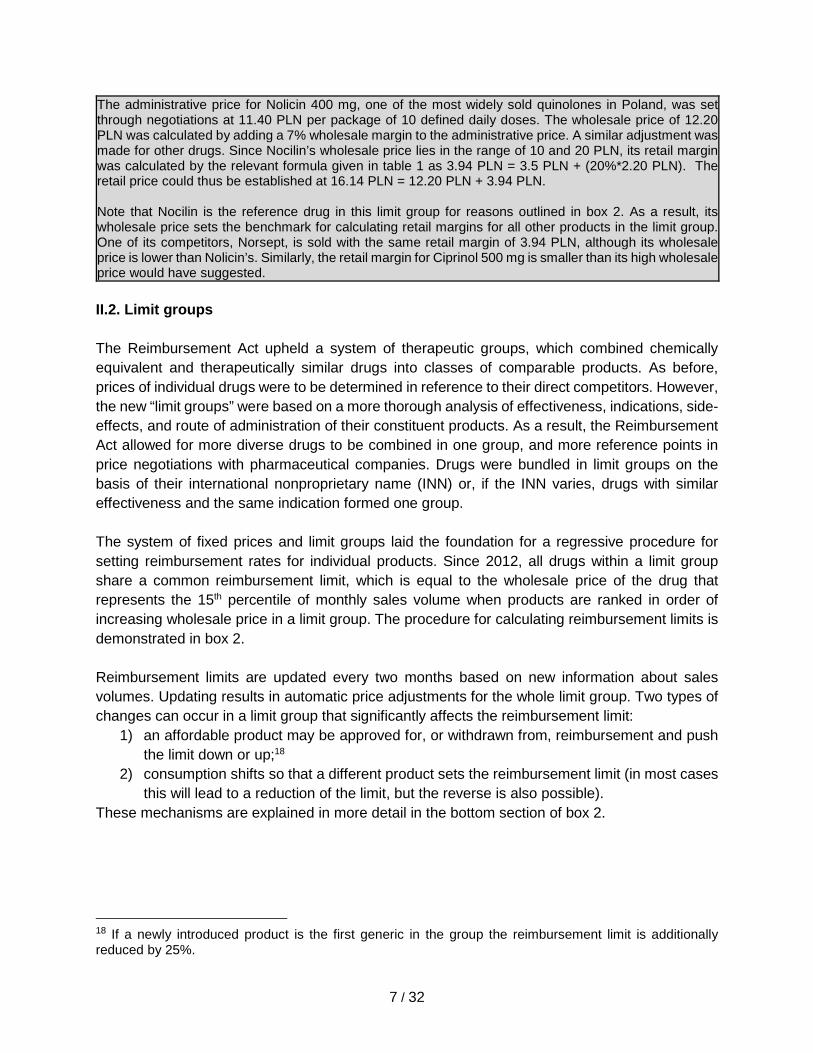
The administrative price for Nolicin 400 mg, one of the most widely sold quinolones in Poland, was set through negotiations at 11.40 PLN per package of 10 defined daily doses. The wholesale price of 12.20 PLN was calculated by adding a 7% wholesale margin to the administrative price. A similar adjustment was made for other drugs. Since Nocilin’s wholesale price lies in the range of 10 and 20 PLN, its retail margin was calculated by the relevant formula given in table 1 as 3.94 PLN = 3.5 PLN + (20%*2.20 PLN). The retail price could thus be established at 16.14 PLN = 12.20 PLN + 3.94 PLN. Note that Nocilin is the reference drug in this limit group for reasons outlined in box 2. As a result, its wholesale price sets the benchmark for calculating retail margins for all other products in the limit group. One of its competitors, Norsept, is sold with the same retail margin of 3.94 PLN, although its wholesale price is lower than Nolicin’s. Similarly, the retail margin for Ciprinol 500 mg is smaller than its high wholesale price would have suggested. II.2. Limit groups The Reimbursement Act upheld a system of therapeutic groups, which combined chemically equivalent and therapeutically similar drugs into classes of comparable products. As before, prices of individual drugs were to be determined in reference to their direct competitors. However, the new “limit groups” were based on a more thorough analysis of effectiveness, indications, side-effects, and route of administration of their constituent products. As a result, the Reimbursement Act allowed for more diverse drugs to be combined in one group, and more reference points in price negotiations with pharmaceutical companies. Drugs were bundled in limit groups on the basis of their international nonproprietary name (INN) or, if the INN varies, drugs with similar effectiveness and the same indication formed one group. The system of fixed prices and limit groups laid the foundation for a regressive procedure for setting reimbursement rates for individual products. Since 2012, all drugs within a limit group share a common reimbursement limit, which is equal to the wholesale price of the drug that represents the 15th percentile of monthly sales volume when products are ranked in order of increasing wholesale price in a limit group. The procedure for calculating reimbursement limits is demonstrated in box 2. Reimbursement limits are updated every two months based on new information about sales volumes. Updating results in automatic price adjustments for the whole limit group. Two types of changes can occur in a limit group that significantly affects the reimbursement limit:
1) an affordable product may be approved for, or withdrawn from, reimbursement and push the limit down or up;18
2) consumption shifts so that a different product sets the reimbursement limit (in most cases this will lead to a reduction of the limit, but the reverse is also possible).
These mechanisms are explained in more detail in the bottom section of box 2.
18 If a newly introduced product is the first generic in the group the reimbursement limit is additionally reduced by 25%.
8 / 32
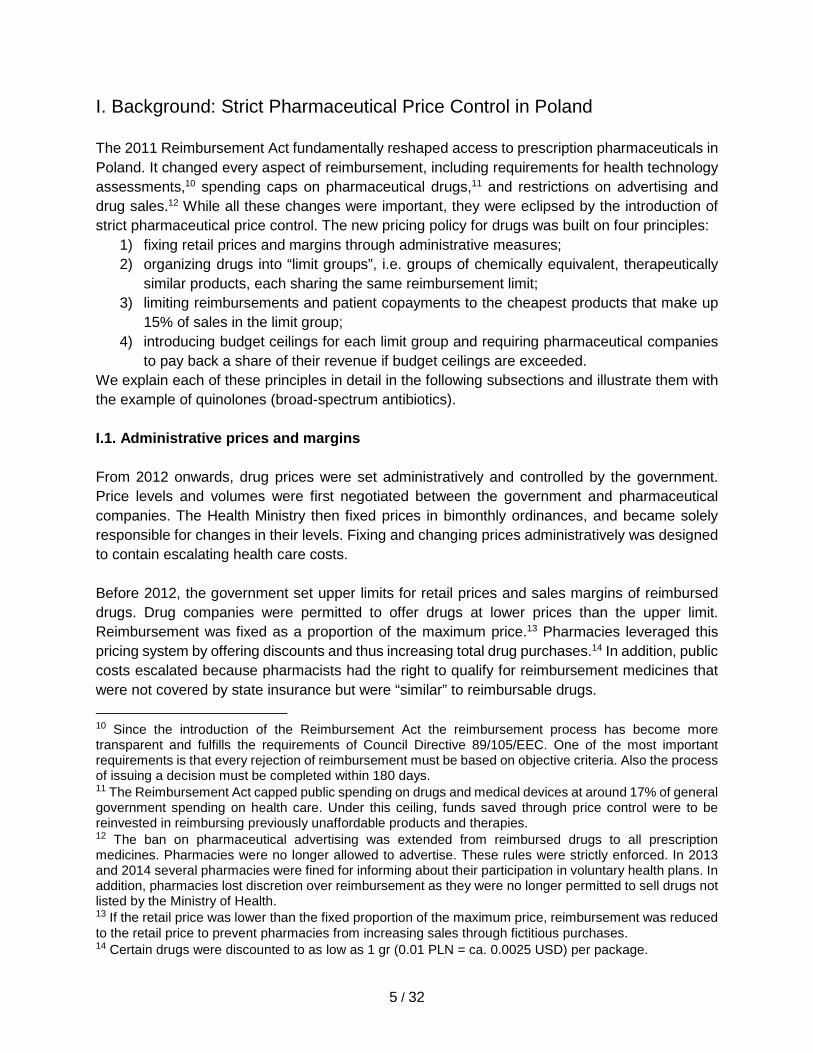
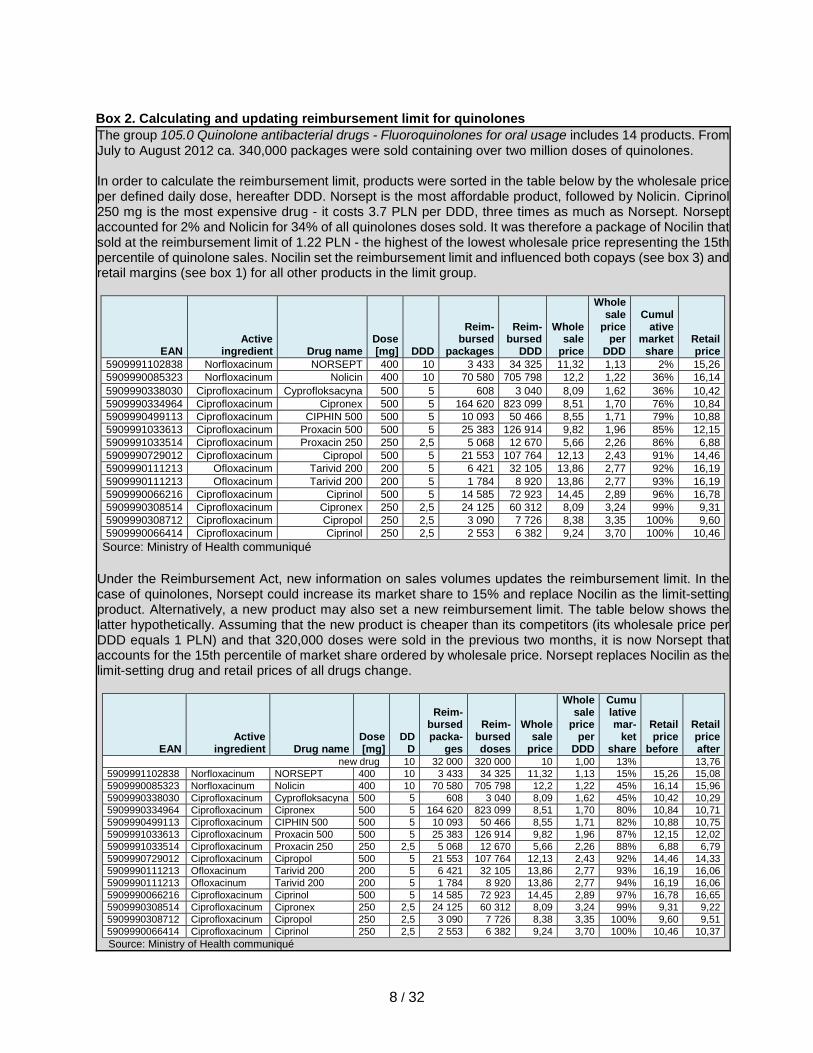
Box 2. Calculating and updating reimbursement limit for quinolones The group 105.0 Quinolone antibacterial drugs - Fluoroquinolones for oral usage includes 14 products. From July to August 2012 ca. 340,000 packages were sold containing over two million doses of quinolones. In order to calculate the reimbursement limit, products were sorted in the table below by the wholesale price per defined daily dose, hereafter DDD. Norsept is the most affordable product, followed by Nolicin. Ciprinol 250 mg is the most expensive drug - it costs 3.7 PLN per DDD, three times as much as Norsept. Norsept accounted for 2% and Nolicin for 34% of all quinolones doses sold. It was therefore a package of Nocilin that sold at the reimbursement limit of 1.22 PLN - the highest of the lowest wholesale price representing the 15th percentile of quinolone sales. Nocilin set the reimbursement limit and influenced both copays (see box 3) and retail margins (see box 1) for all other products in the limit group.
EAN Active
ingredient Drug name Dose [mg] DDD
Reim- bursed
packages
Reim-bursed
DDD
Wholesale
price
Wholesale
price per
DDD
Cumulative
market share
Retail price
5909991102838 Norfloxacinum NORSEPT 400 10 3 433 34 325 11,32 1,13 2% 15,26 5909990085323 Norfloxacinum Nolicin 400 10 70 580 705 798 12,2 1,22 36% 16,14 5909990338030 Ciprofloxacinum Cyprofloksacyna 500 5 608 3 040 8,09 1,62 36% 10,42 5909990334964 Ciprofloxacinum Cipronex 500 5 164 620 823 099 8,51 1,70 76% 10,84 5909990499113 Ciprofloxacinum CIPHIN 500 500 5 10 093 50 466 8,55 1,71 79% 10,88 5909991033613 Ciprofloxacinum Proxacin 500 500 5 25 383 126 914 9,82 1,96 85% 12,15 5909991033514 Ciprofloxacinum Proxacin 250 250 2,5 5 068 12 670 5,66 2,26 86% 6,88 5909990729012 Ciprofloxacinum Cipropol 500 5 21 553 107 764 12,13 2,43 91% 14,46 5909990111213 Ofloxacinum Tarivid 200 200 5 6 421 32 105 13,86 2,77 92% 16,19 5909990111213 Ofloxacinum Tarivid 200 200 5 1 784 8 920 13,86 2,77 93% 16,19 5909990066216 Ciprofloxacinum Ciprinol 500 5 14 585 72 923 14,45 2,89 96% 16,78 5909990308514 Ciprofloxacinum Cipronex 250 2,5 24 125 60 312 8,09 3,24 99% 9,31 5909990308712 Ciprofloxacinum Cipropol 250 2,5 3 090 7 726 8,38 3,35 100% 9,60 5909990066414 Ciprofloxacinum Ciprinol 250 2,5 2 553 6 382 9,24 3,70 100% 10,46
Source: Ministry of Health communiqué Under the Reimbursement Act, new information on sales volumes updates the reimbursement limit. In the case of quinolones, Norsept could increase its market share to 15% and replace Nocilin as the limit-setting product. Alternatively, a new product may also set a new reimbursement limit. The table below shows the latter hypothetically. Assuming that the new product is cheaper than its competitors (its wholesale price per DDD equals 1 PLN) and that 320,000 doses were sold in the previous two months, it is now Norsept that accounts for the 15th percentile of market share ordered by wholesale price. Norsept replaces Nocilin as the limit-setting drug and retail prices of all drugs change.
EAN Active
ingredient Drug name Dose [mg]
DDD
Reim-bursed packa-
ges
Reim-bursed doses
Wholesale
price
Wholesale
price per
DDD
Cumulative mar-
ket share
Retail price
before
Retail price after
new drug 10 32 000 320 000 10 1,00 13% 13,76 5909991102838 Norfloxacinum NORSEPT 400 10 3 433 34 325 11,32 1,13 15% 15,26 15,08 5909990085323 Norfloxacinum Nolicin 400 10 70 580 705 798 12,2 1,22 45% 16,14 15,96 5909990338030 Ciprofloxacinum Cyprofloksacyna 500 5 608 3 040 8,09 1,62 45% 10,42 10,29 5909990334964 Ciprofloxacinum Cipronex 500 5 164 620 823 099 8,51 1,70 80% 10,84 10,71 5909990499113 Ciprofloxacinum CIPHIN 500 500 5 10 093 50 466 8,55 1,71 82% 10,88 10,75 5909991033613 Ciprofloxacinum Proxacin 500 500 5 25 383 126 914 9,82 1,96 87% 12,15 12,02 5909991033514 Ciprofloxacinum Proxacin 250 250 2,5 5 068 12 670 5,66 2,26 88% 6,88 6,79 5909990729012 Ciprofloxacinum Cipropol 500 5 21 553 107 764 12,13 2,43 92% 14,46 14,33 5909990111213 Ofloxacinum Tarivid 200 200 5 6 421 32 105 13,86 2,77 93% 16,19 16,06 5909990111213 Ofloxacinum Tarivid 200 200 5 1 784 8 920 13,86 2,77 94% 16,19 16,06 5909990066216 Ciprofloxacinum Ciprinol 500 5 14 585 72 923 14,45 2,89 97% 16,78 16,65 5909990308514 Ciprofloxacinum Cipronex 250 2,5 24 125 60 312 8,09 3,24 99% 9,31 9,22 5909990308712 Ciprofloxacinum Cipropol 250 2,5 3 090 7 726 8,38 3,35 100% 9,60 9,51 5909990066414 Ciprofloxacinum Ciprinol 250 2,5 2 553 6 382 9,24 3,70 100% 10,46 10,37 Source: Ministry of Health communiqué
9 / 32
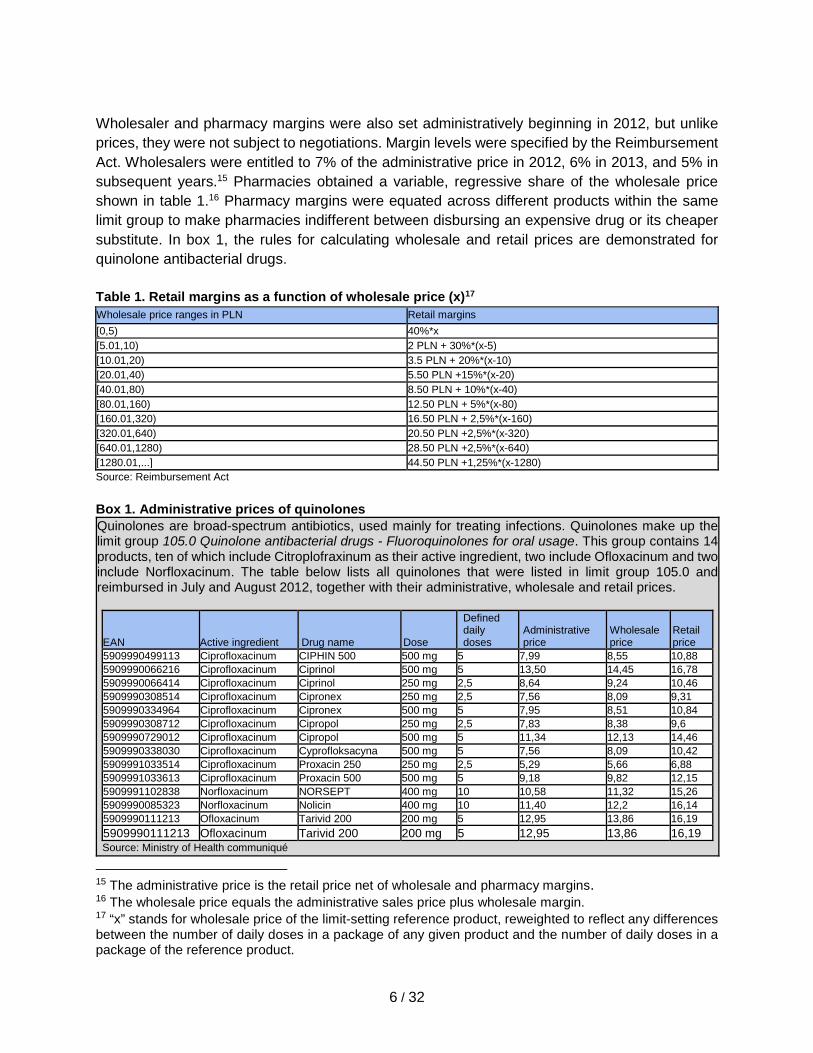
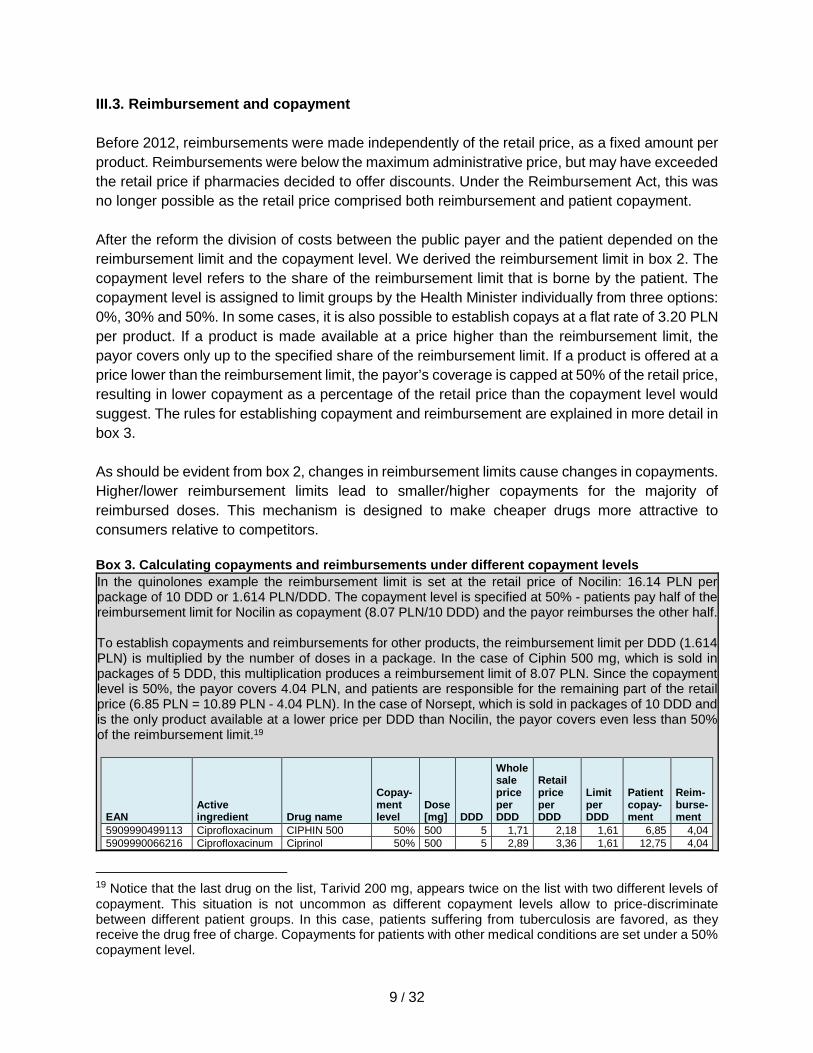
III.3. Reimbursement and copayment Before 2012, reimbursements were made independently of the retail price, as a fixed amount per product. Reimbursements were below the maximum administrative price, but may have exceeded the retail price if pharmacies decided to offer discounts. Under the Reimbursement Act, this was no longer possible as the retail price comprised both reimbursement and patient copayment. After the reform the division of costs between the public payer and the patient depended on the reimbursement limit and the copayment level. We derived the reimbursement limit in box 2. The copayment level refers to the share of the reimbursement limit that is borne by the patient. The copayment level is assigned to limit groups by the Health Minister individually from three options: 0%, 30% and 50%. In some cases, it is also possible to establish copays at a flat rate of 3.20 PLN per product. If a product is made available at a price higher than the reimbursement limit, the payor covers only up to the specified share of the reimbursement limit. If a product is offered at a price lower than the reimbursement limit, the payor’s coverage is capped at 50% of the retail price, resulting in lower copayment as a percentage of the retail price than the copayment level would suggest. The rules for establishing copayment and reimbursement are explained in more detail in box 3. As should be evident from box 2, changes in reimbursement limits cause changes in copayments. Higher/lower reimbursement limits lead to smaller/higher copayments for the majority of reimbursed doses. This mechanism is designed to make cheaper drugs more attractive to consumers relative to competitors. Box 3. Calculating copayments and reimbursements under different copayment levels In the quinolones example the reimbursement limit is set at the retail price of Nocilin: 16.14 PLN per package of 10 DDD or 1.614 PLN/DDD. The copayment level is specified at 50% - patients pay half of the reimbursement limit for Nocilin as copayment (8.07 PLN/10 DDD) and the payor reimburses the other half. To establish copayments and reimbursements for other products, the reimbursement limit per DDD (1.614 PLN) is multiplied by the number of doses in a package. In the case of Ciphin 500 mg, which is sold in packages of 5 DDD, this multiplication produces a reimbursement limit of 8.07 PLN. Since the copayment level is 50%, the payor covers 4.04 PLN, and patients are responsible for the remaining part of the retail price (6.85 PLN = 10.89 PLN - 4.04 PLN). In the case of Norsept, which is sold in packages of 10 DDD and is the only product available at a lower price per DDD than Nocilin, the payor covers even less than 50% of the reimbursement limit.19
EAN Active ingredient Drug name
Copay-ment level
Dose [mg] DDD
Wholesale price per DDD
Retail price per DDD
Limit per DDD
Patient copay-ment
Reim-burse-ment
5909990499113 Ciprofloxacinum CIPHIN 500 50% 500 5 1,71 2,18 1,61 6,85 4,04 5909990066216 Ciprofloxacinum Ciprinol 50% 500 5 2,89 3,36 1,61 12,75 4,04
19 Notice that the last drug on the list, Tarivid 200 mg, appears twice on the list with two different levels of copayment. This situation is not uncommon as different copayment levels allow to price-discriminate between different patient groups. In this case, patients suffering from tuberculosis are favored, as they receive the drug free of charge. Copayments for patients with other medical conditions are set under a 50% copayment level.
10 / 32
5909990066414 Ciprofloxacinum Ciprinol 50% 250 2,5 3,70 4,18 1,62 8,44 2,02 5909990308514 Ciprofloxacinum Cipronex 50% 250 2,5 3,24 3,72 1,62 7,29 2,02 5909990334964 Ciprofloxacinum Cipronex 50% 500 5 1,70 2,17 1,61 6,81 4.04 5909990308712 Ciprofloxacinum Cipropol 50% 250 2,5 3,35 3,84 1,62 7,58 2.02 5909990729012 Ciprofloxacinum Cipropol 50% 500 5 2,43 2,89 1,61 10,43 4.04 5909990338030 Ciprofloxacinum Cyprofloksacyna 50% 500 5 1,62 2,08 1,61 6,39 4.04 5909991033514 Ciprofloxacinum Proxacin 250 50% 250 2,5 2,26 2,75 1,62 4,86 2.02 5909991033613 Ciprofloxacinum Proxacin 500 50% 500 5 1,96 2,43 1,61 8,12 4.04 5909991102838 Norfloxacinum NORSEPT 50% 400 10 1,13 1,53 1,53 7,63 7,63 5909990085323 Norfloxacinum Nolicin 50% 400 10 1,22 1,61 1,61 8,07 8,07 5909990111213 Ofloxacinum Tarivid 200 50% 200 5 2,77 3,24 1,61 12,16 4,04 5909990111213 Ofloxacinum Tarivid 200 free 200 5 2,77 3,24 1,61 8,12 8.07
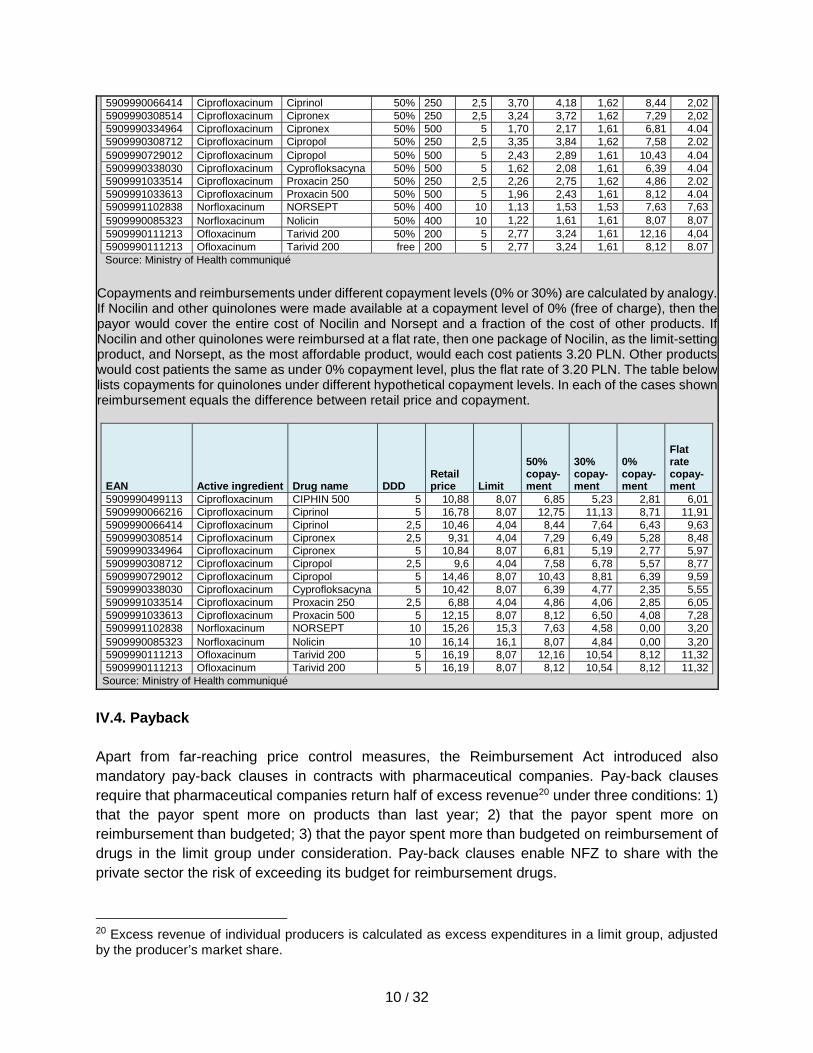
Source: Ministry of Health communiqué Copayments and reimbursements under different copayment levels (0% or 30%) are calculated by analogy. If Nocilin and other quinolones were made available at a copayment level of 0% (free of charge), then the payor would cover the entire cost of Nocilin and Norsept and a fraction of the cost of other products. If Nocilin and other quinolones were reimbursed at a flat rate, then one package of Nocilin, as the limit-setting product, and Norsept, as the most affordable product, would each cost patients 3.20 PLN. Other products would cost patients the same as under 0% copayment level, plus the flat rate of 3.20 PLN. The table below lists copayments for quinolones under different hypothetical copayment levels. In each of the cases shown reimbursement equals the difference between retail price and copayment.
EAN Active ingredient Drug name DDD Retail price Limit
50% copay-ment
30% copay-ment
0% copay-ment
Flat rate copay-ment
5909990499113 Ciprofloxacinum CIPHIN 500 5 10,88 8,07 6,85 5,23 2,81 6,01 5909990066216 Ciprofloxacinum Ciprinol 5 16,78 8,07 12,75 11,13 8,71 11,91 5909990066414 Ciprofloxacinum Ciprinol 2,5 10,46 4,04 8,44 7,64 6,43 9,63 5909990308514 Ciprofloxacinum Cipronex 2,5 9,31 4,04 7,29 6,49 5,28 8,48 5909990334964 Ciprofloxacinum Cipronex 5 10,84 8,07 6,81 5,19 2,77 5,97 5909990308712 Ciprofloxacinum Cipropol 2,5 9,6 4,04 7,58 6,78 5,57 8,77 5909990729012 Ciprofloxacinum Cipropol 5 14,46 8,07 10,43 8,81 6,39 9,59 5909990338030 Ciprofloxacinum Cyprofloksacyna 5 10,42 8,07 6,39 4,77 2,35 5,55 5909991033514 Ciprofloxacinum Proxacin 250 2,5 6,88 4,04 4,86 4,06 2,85 6,05 5909991033613 Ciprofloxacinum Proxacin 500 5 12,15 8,07 8,12 6,50 4,08 7,28 5909991102838 Norfloxacinum NORSEPT 10 15,26 15,3 7,63 4,58 0,00 3,20 5909990085323 Norfloxacinum Nolicin 10 16,14 16,1 8,07 4,84 0,00 3,20 5909990111213 Ofloxacinum Tarivid 200 5 16,19 8,07 12,16 10,54 8,12 11,32 5909990111213 Ofloxacinum Tarivid 200 5 16,19 8,07 8,12 10,54 8,12 11,32
Source: Ministry of Health communiqué
IV.4. Payback Apart from far-reaching price control measures, the Reimbursement Act introduced also mandatory pay-back clauses in contracts with pharmaceutical companies. Pay-back clauses require that pharmaceutical companies return half of excess revenue20 under three conditions: 1) that the payor spent more on products than last year; 2) that the payor spent more on reimbursement than budgeted; 3) that the payor spent more than budgeted on reimbursement of drugs in the limit group under consideration. Pay-back clauses enable NFZ to share with the private sector the risk of exceeding its budget for reimbursement drugs.
20 Excess revenue of individual producers is calculated as excess expenditures in a limit group, adjusted by the producer’s market share.
11 / 32
II. Evaluation of Strict Pharmaceutical Price Control in Poland II.1. Data We obtained data on prices and sales volumes of reimbursable drugs from NFZ, the public health agency responsible for contracting and paying health care providers. We have also collected data on administrative prices and copayment levels from the relevant statutes.21 NFZ collects data on prices and sales from registered pharmacies. Our data were recorded in intervals of two months after the introduction of the Reimbursement Act (January 2012 - December 2014) and year by year prior to reform (2010-2011). The dataset allows users to isolate prices and sales for all identical products reimbursed by NFZ, but identifying purchases made by individual consumers is not possible. The data exclude drugs purchased and dispensed by hospitals and primary care providers. We have, therefore, thorough evidence on prices and sales of publicly reimbursed prescription drugs that were sold in pharmacies 24 months before and 36 months after the Reimbursement Act went into force. In addition, we have validated data with information from two independent, commercial providers of market intelligence.22 We identified different products by the barcode found on every package and copayment level.23 This is important because drugs known under the same merchandise name or international nonproprietary name can vary substantially in terms of dose, package size, route of administration etc. In addition, copayment levels can vary for the same drug, if it is prescribed for different medical diagnoses. In total, we analyzed 5195 products, of which over 260 were offered at two copayment levels.24 These drugs contained 608 active ingredients and made up 303 limit groups. Since we are interested in studying the impact of pricing reform on costs, we have excluded from our dataset drug purchases made by veterans with disability and other patients with unlimited coverage of medical expenses. These patients kept their privileges under the 2012 Reimbursement Act. They should represent a relatively small share of the insured population and a larger, albeit still insignificant, portion of drug costs. We have also excluded extremely rare
21 Health Minister Communiqués - Reimbursement Lists no. 1-19 [I-XIX obwieszczenia Ministra Zdrowia w sprawie wykazu refundowanych leków, środków spożywczych specjalnego przeznaczenia żywieniowego oraz wyrobów medycznych], Health Minister Ordinances on the Price Limit for Drugs and Medical Products, dated December 8, 2009 and December 22, 2010 (rozporządzenie Ministra Zdrowia z dnia 8 grudnia 2009 r. w sprawie limitów cen leków i wyrobów medycznych wydawanych świadczeniobiorcom bezpłatnie, za opłatą ryczałtową lub częściową odpłatnością, rozporządzenie Ministra Zdrowia z dnia 22 grudnia 2010 r. w sprawie limitów cen leków i wyrobów medycznych wydawanych świadczeniobiorcom bezpłatnie, za opłatą ryczałtową lub częściową odpłatnością). 22 In most cases prices recorded by NFZ in 2010 and 2011 matched prices gathered by the private sector. In some instances, NFZ recorded lower prices, but differences could be resolved by taking into account divergent methodologies. Commercial providers listed one price for some products, which were prescribed at two or more copayment levels—a fine distinction reflected in NFZ data. Prices recorded in 2012-2014 were identical and given by the relevant statutes. 23 We use EAN, the European Article Number, now renamed to the International Article Number. In a few instances, we have extended the EAN ID to reflect differences in copayment level for the same product. 24 We analyzed all products that were listed in Ministry of Health communiqués and Ministry of Health ordinances between 2010 and 2014.
12 / 32
purchases of unlisted drugs. These transactions accounted for only 0.05% of items reimbursed from 2010 to 2014. II.2. Methodology We compare coverage, prices, sales, and utilization before and after the reform without controlling for other variables or producing counterfactual estimates. We justify this simple approach with the absence of any evident external shocks in the market for reimbursed prescription drugs from 2010 to 2014 and the fact that after the Reimbursement Act went into force prices were solely determined through administrative decisions and sales volumes - observable, endogenous variables in our analysis of pharmaceutical spending. Since prices were set by the government, we do not correct for inflation in the market for reimbursable prescription drugs and ignore general price-level increases.25 II.3. Results II.3.1. Coverage From the beginning of 2012 until September 2014, several new drugs were added to the list of reimbursed medicines. The reimbursement list was expanded to include 32 new active ingredients. For 13 active ingredients already on the pharmacy list, new indications for prescription were added. Also, off-label indications were added for 100 active ingredients. At the same time, 48 active ingredients were removed from the reimbursement list. There were various reasons for delisting these drugs. Some products were outdated and could be substituted for better performing medicines. In other cases, pharmaceutical companies preferred to market a drug as over-the-counter or self-pay prescription medicine.26 One product received a negative recommendation from the Economic Commission, which is responsible for vetting the cost-effectiveness of applications for public reimbursement. II.3.2. Prices The 2012 Reimbursement Act fundamentally changed prices of prescribed drugs in the health care system, for patients and for the public payor. As Figure 1 shows, for over three-quarters of
25 Coupled with low inflation of around 2% per year from 2010 to 2014, a nominal price decrease of drugs would mean that drugs have become cheaper in real terms. 26 The exact number of active ingredients removed from public coverage due to strict pharmaceutical price control is a known unknown. The maximum number of such active ingredients is 48. Anecdotal evidence suggests tactical behavior – firms shifting products to the OTC segment. Where this was not possible, products were made available on the basis of prescriptions but not refunded by NFZ. There is also evidence of small producers failing to re-apply for reimbursement because of higher transaction costs (higher application fees). In addition, there are several unknown unknowns about firm response to the Reimbursement Act. Did firms halt applications regarding new products that were previously not covered by public health insurance? Did firms respond strategically by colluding to influence the administrative price in different limit groups?
13 / 32
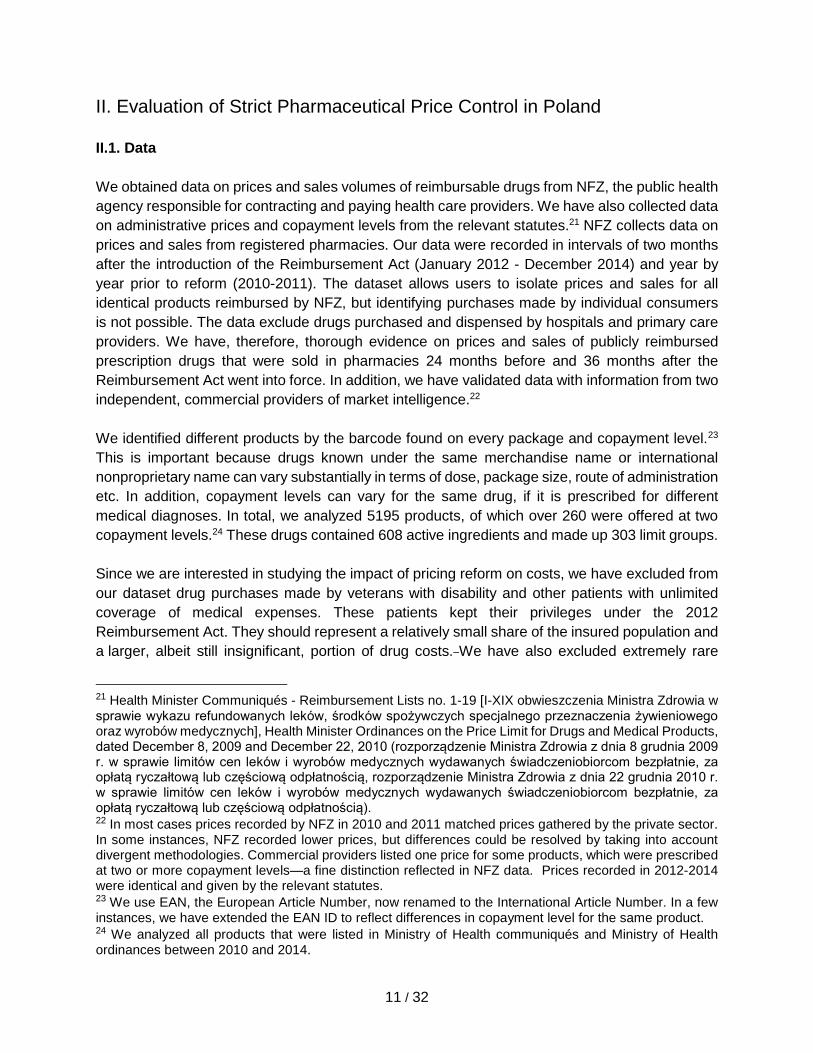
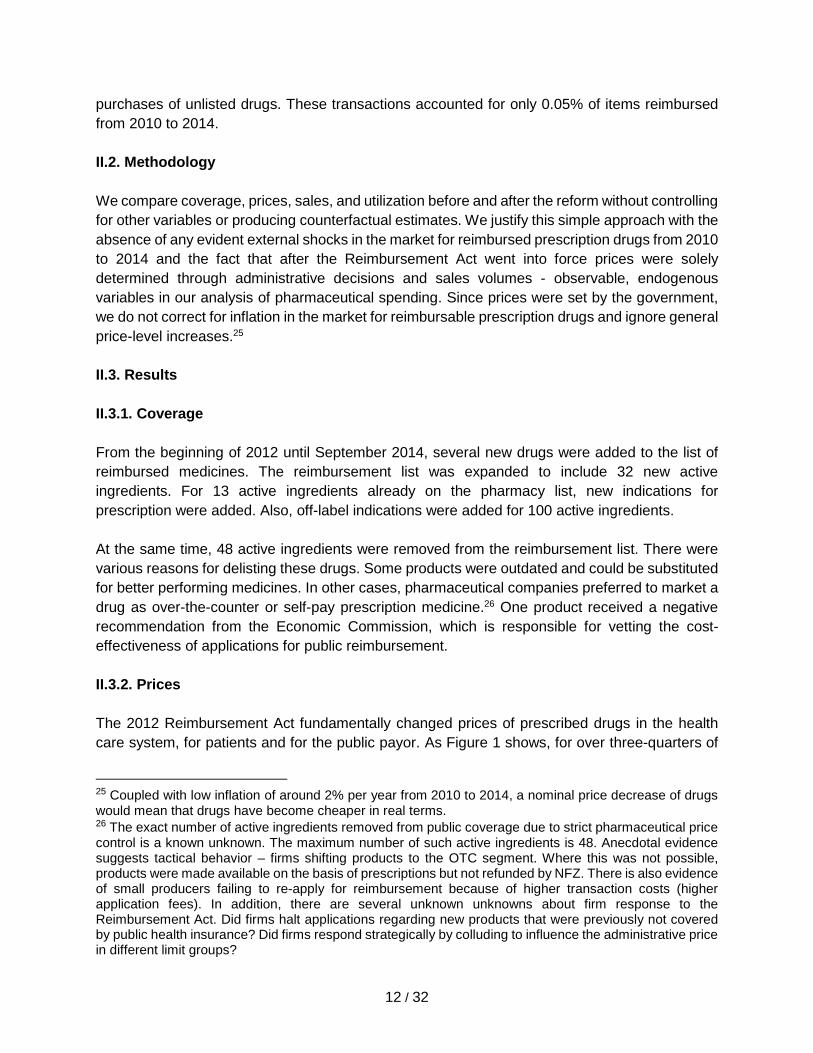
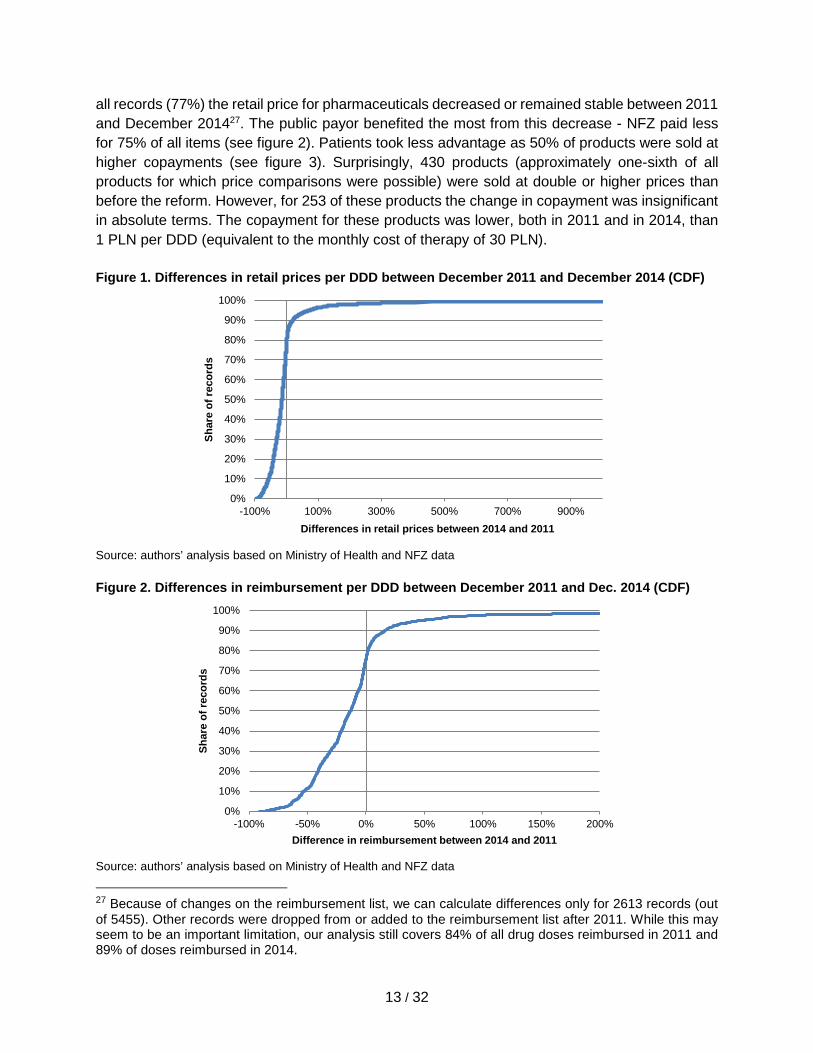
all records (77%) the retail price for pharmaceuticals decreased or remained stable between 2011 and December 201427. The public payor benefited the most from this decrease - NFZ paid less for 75% of all items (see figure 2). Patients took less advantage as 50% of products were sold at higher copayments (see figure 3). Surprisingly, 430 products (approximately one-sixth of all products for which price comparisons were possible) were sold at double or higher prices than before the reform. However, for 253 of these products the change in copayment was insignificant in absolute terms. The copayment for these products was lower, both in 2011 and in 2014, than 1 PLN per DDD (equivalent to the monthly cost of therapy of 30 PLN). Figure 1. Differences in retail prices per DDD between December 2011 and December 2014 (CDF)
Source: authors’ analysis based on Ministry of Health and NFZ data Figure 2. Differences in reimbursement per DDD between December 2011 and Dec. 2014 (CDF)
Source: authors’ analysis based on Ministry of Health and NFZ data 27 Because of changes on the reimbursement list, we can calculate differences only for 2613 records (out of 5455). Other records were dropped from or added to the reimbursement list after 2011. While this may seem to be an important limitation, our analysis still covers 84% of all drug doses reimbursed in 2011 and 89% of doses reimbursed in 2014.
0%
10%
20%
30%
40%
50%
60%
70%
80%
90%
100%
-100% 100% 300% 500% 700% 900%
Shar
e of
reco
rds
Differences in retail prices between 2014 and 2011
0%
10%
20%
30%
40%
50%
60%
70%
80%
90%
100%
-100% -50% 0% 50% 100% 150% 200%
Shar
e of
reco
rds
Difference in reimbursement between 2014 and 2011
14 / 32
Figure 3. Differences in patient copayment per DDD between December 2011 and Dec. 2014 (CDF)
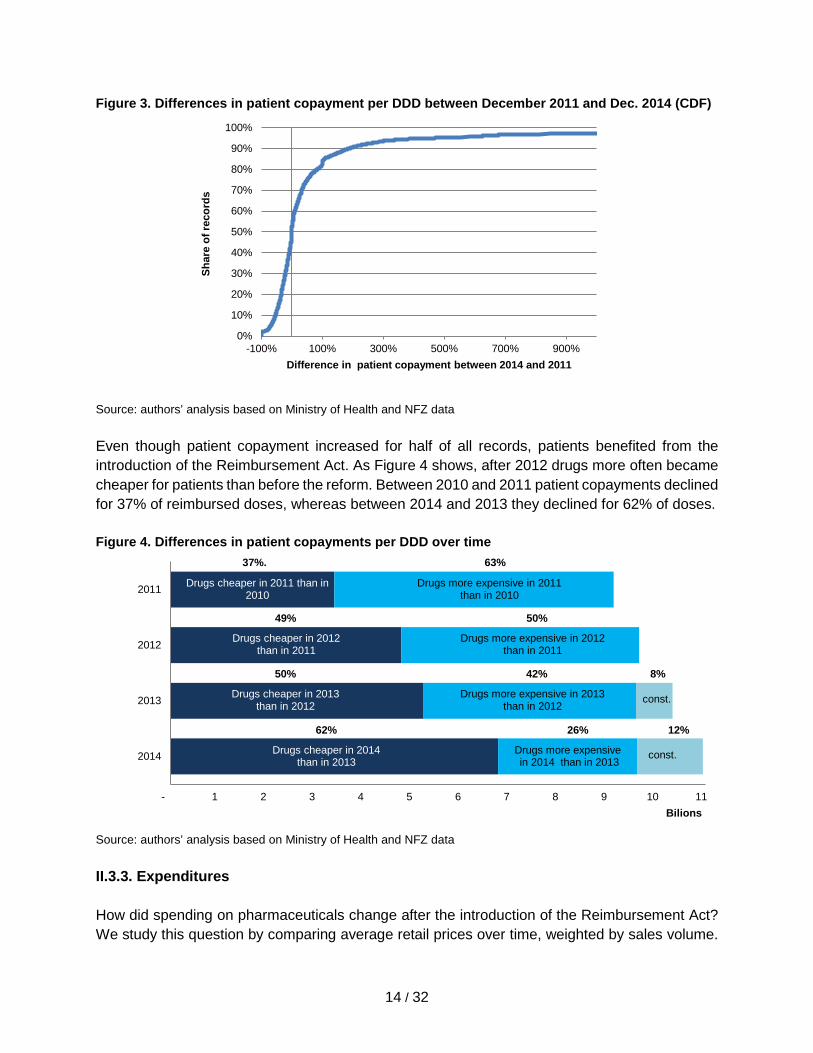
Source: authors’ analysis based on Ministry of Health and NFZ data Even though patient copayment increased for half of all records, patients benefited from the introduction of the Reimbursement Act. As Figure 4 shows, after 2012 drugs more often became cheaper for patients than before the reform. Between 2010 and 2011 patient copayments declined for 37% of reimbursed doses, whereas between 2014 and 2013 they declined for 62% of doses. Figure 4. Differences in patient copayments per DDD over time
Source: authors’ analysis based on Ministry of Health and NFZ data
II.3.3. Expenditures How did spending on pharmaceuticals change after the introduction of the Reimbursement Act? We study this question by comparing average retail prices over time, weighted by sales volume.
0%
10%
20%
30%
40%
50%
60%
70%
80%
90%
100%
-100% 100% 300% 500% 700% 900%
Shar
e of
reco
rds
Difference in patient copayment between 2014 and 2011
- 1 2 3 4 5 6 7 8 9 10 11
2014
2013
2012
2011
Bilions
Drugs more expensive in 2011 than in 2010
Drugs cheaper in 2011 than in 2010
37%. 63%
Drugs more expensive in 2012 than in 2011
Drugs cheaper in 2012 than in 2011
49% 50%
Drugs more expensive in 2013 than in 2012
Drugs cheaper in 2013 than in 2012
50% 42%
const.
8%
Drugs more expensive in 2014 than in 2013
Drugs cheaper in 2014 than in 2013
62% 26%
const.
12%
15 / 32
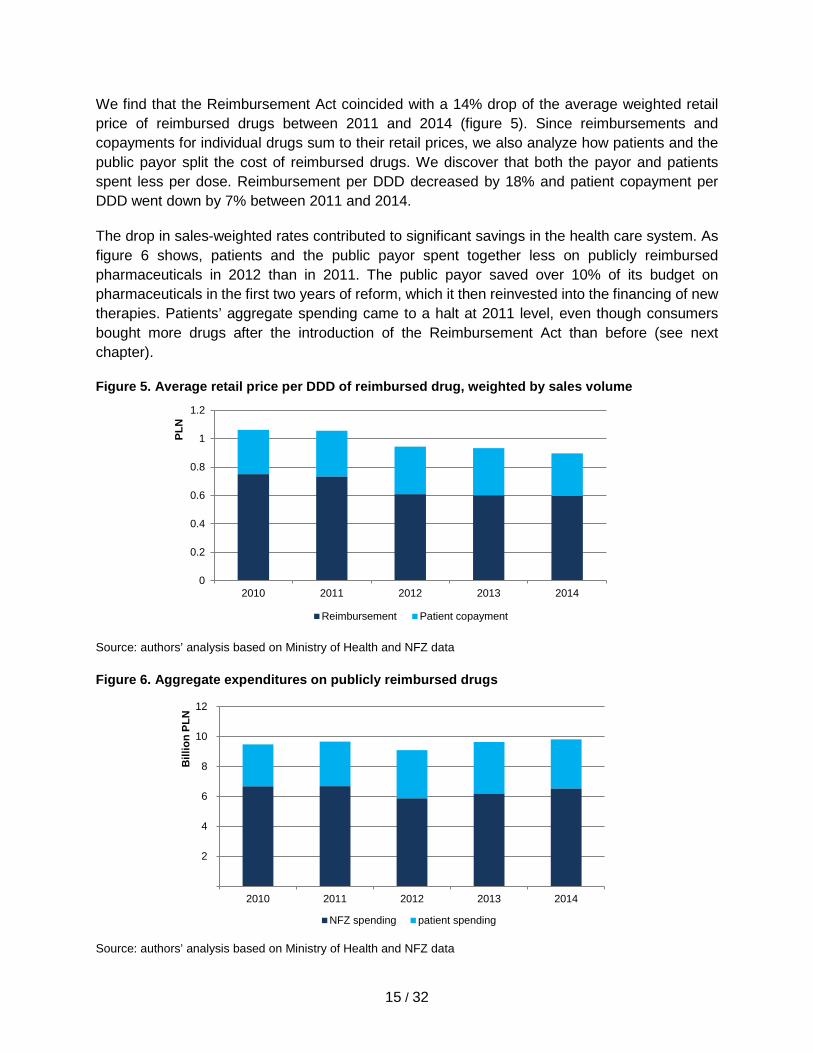
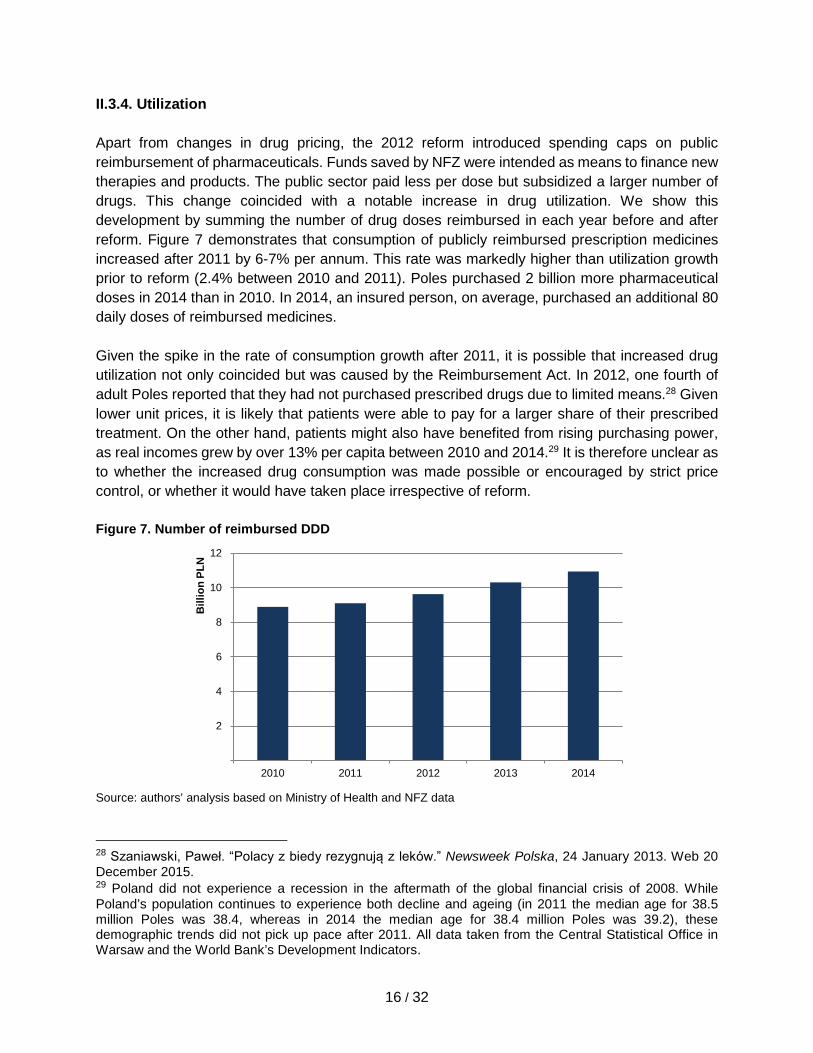
We find that the Reimbursement Act coincided with a 14% drop of the average weighted retail price of reimbursed drugs between 2011 and 2014 (figure 5). Since reimbursements and copayments for individual drugs sum to their retail prices, we also analyze how patients and the public payor split the cost of reimbursed drugs. We discover that both the payor and patients spent less per dose. Reimbursement per DDD decreased by 18% and patient copayment per DDD went down by 7% between 2011 and 2014. The drop in sales-weighted rates contributed to significant savings in the health care system. As figure 6 shows, patients and the public payor spent together less on publicly reimbursed pharmaceuticals in 2012 than in 2011. The public payor saved over 10% of its budget on pharmaceuticals in the first two years of reform, which it then reinvested into the financing of new therapies. Patients’ aggregate spending came to a halt at 2011 level, even though consumers bought more drugs after the introduction of the Reimbursement Act than before (see next chapter). Figure 5. Average retail price per DDD of reimbursed drug, weighted by sales volume
Source: authors’ analysis based on Ministry of Health and NFZ data
Figure 6. Aggregate expenditures on publicly reimbursed drugs
Source: authors’ analysis based on Ministry of Health and NFZ data
0
0.2
0.4
0.6
0.8
1
1.2
2010 2011 2012 2013 2014
Reimbursement Patient copayment
2
4
6
8
10
12
2010 2011 2012 2013 2014
Bill
ion
PLN
NFZ spending patient spending
PLN
16 / 32
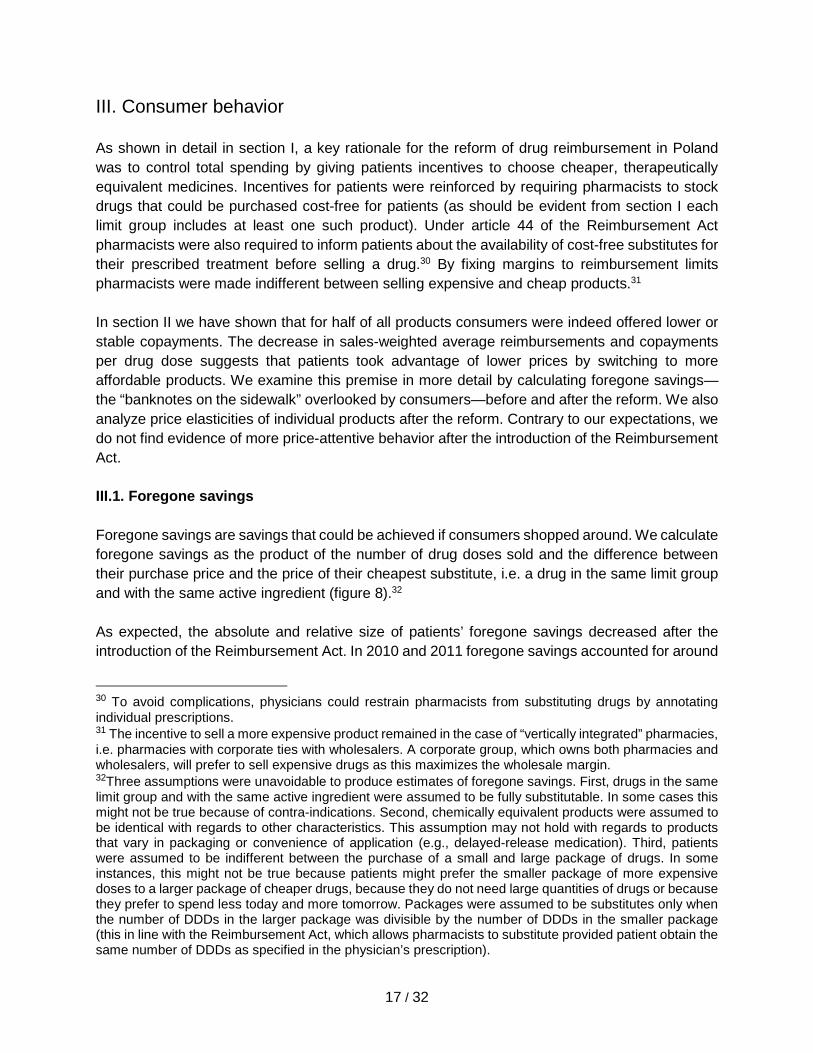
II.3.4. Utilization Apart from changes in drug pricing, the 2012 reform introduced spending caps on public reimbursement of pharmaceuticals. Funds saved by NFZ were intended as means to finance new therapies and products. The public sector paid less per dose but subsidized a larger number of drugs. This change coincided with a notable increase in drug utilization. We show this development by summing the number of drug doses reimbursed in each year before and after reform. Figure 7 demonstrates that consumption of publicly reimbursed prescription medicines increased after 2011 by 6-7% per annum. This rate was markedly higher than utilization growth prior to reform (2.4% between 2010 and 2011). Poles purchased 2 billion more pharmaceutical doses in 2014 than in 2010. In 2014, an insured person, on average, purchased an additional 80 daily doses of reimbursed medicines. Given the spike in the rate of consumption growth after 2011, it is possible that increased drug utilization not only coincided but was caused by the Reimbursement Act. In 2012, one fourth of adult Poles reported that they had not purchased prescribed drugs due to limited means.28 Given lower unit prices, it is likely that patients were able to pay for a larger share of their prescribed treatment. On the other hand, patients might also have benefited from rising purchasing power, as real incomes grew by over 13% per capita between 2010 and 2014.29 It is therefore unclear as to whether the increased drug consumption was made possible or encouraged by strict price control, or whether it would have taken place irrespective of reform. Figure 7. Number of reimbursed DDD
Source: authors’ analysis based on Ministry of Health and NFZ data 28 Szaniawski, Paweł. “Polacy z biedy rezygnują z leków.” Newsweek Polska, 24 January 2013. Web 20 December 2015. 29 Poland did not experience a recession in the aftermath of the global financial crisis of 2008. While Poland’s population continues to experience both decline and ageing (in 2011 the median age for 38.5 million Poles was 38.4, whereas in 2014 the median age for 38.4 million Poles was 39.2), these demographic trends did not pick up pace after 2011. All data taken from the Central Statistical Office in Warsaw and the World Bank’s Development Indicators.
2
4
6
8
10
12
2010 2011 2012 2013 2014
Bill
ion
PLN
17 / 32
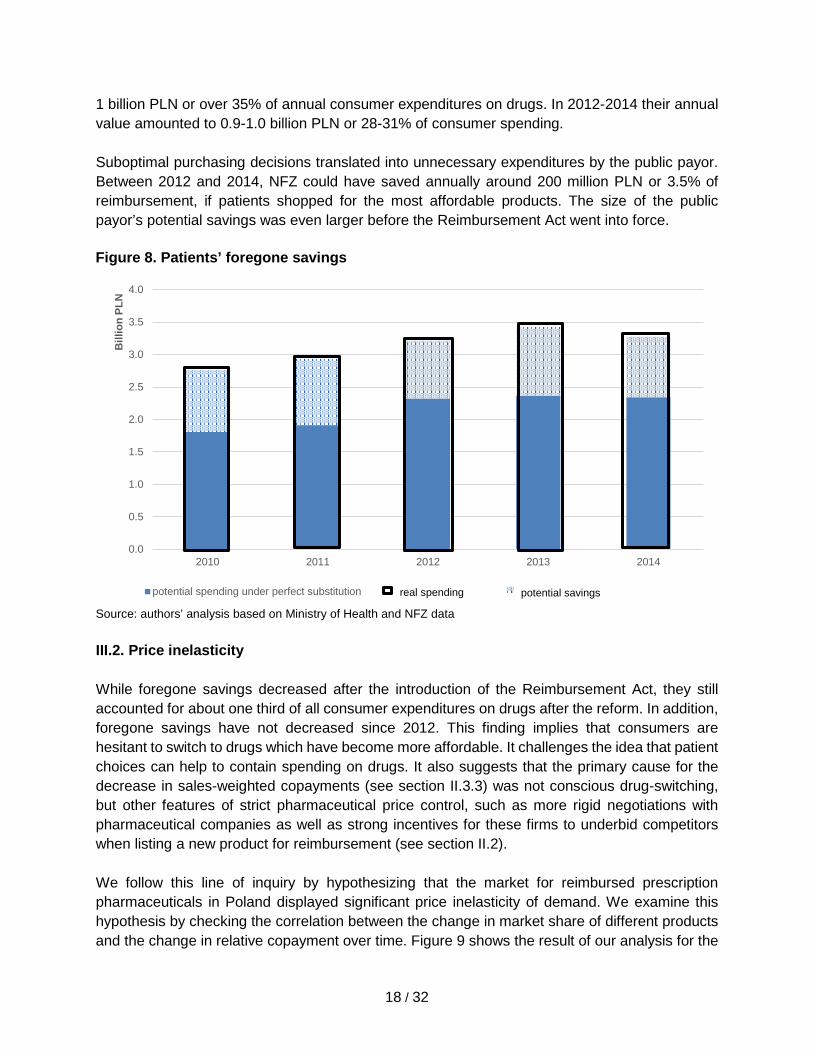
III. Consumer behavior As shown in detail in section I, a key rationale for the reform of drug reimbursement in Poland was to control total spending by giving patients incentives to choose cheaper, therapeutically equivalent medicines. Incentives for patients were reinforced by requiring pharmacists to stock drugs that could be purchased cost-free for patients (as should be evident from section I each limit group includes at least one such product). Under article 44 of the Reimbursement Act pharmacists were also required to inform patients about the availability of cost-free substitutes for their prescribed treatment before selling a drug.30 By fixing margins to reimbursement limits pharmacists were made indifferent between selling expensive and cheap products.31 In section II we have shown that for half of all products consumers were indeed offered lower or stable copayments. The decrease in sales-weighted average reimbursements and copayments per drug dose suggests that patients took advantage of lower prices by switching to more affordable products. We examine this premise in more detail by calculating foregone savings—the “banknotes on the sidewalk” overlooked by consumers—before and after the reform. We also analyze price elasticities of individual products after the reform. Contrary to our expectations, we do not find evidence of more price-attentive behavior after the introduction of the Reimbursement Act. III.1. Foregone savings Foregone savings are savings that could be achieved if consumers shopped around. We calculate foregone savings as the product of the number of drug doses sold and the difference between their purchase price and the price of their cheapest substitute, i.e. a drug in the same limit group and with the same active ingredient (figure 8).32 As expected, the absolute and relative size of patients’ foregone savings decreased after the introduction of the Reimbursement Act. In 2010 and 2011 foregone savings accounted for around
30 To avoid complications, physicians could restrain pharmacists from substituting drugs by annotating individual prescriptions. 31 The incentive to sell a more expensive product remained in the case of “vertically integrated” pharmacies, i.e. pharmacies with corporate ties with wholesalers. A corporate group, which owns both pharmacies and wholesalers, will prefer to sell expensive drugs as this maximizes the wholesale margin. 32Three assumptions were unavoidable to produce estimates of foregone savings. First, drugs in the same limit group and with the same active ingredient were assumed to be fully substitutable. In some cases this might not be true because of contra-indications. Second, chemically equivalent products were assumed to be identical with regards to other characteristics. This assumption may not hold with regards to products that vary in packaging or convenience of application (e.g., delayed-release medication). Third, patients were assumed to be indifferent between the purchase of a small and large package of drugs. In some instances, this might not be true because patients might prefer the smaller package of more expensive doses to a larger package of cheaper drugs, because they do not need large quantities of drugs or because they prefer to spend less today and more tomorrow. Packages were assumed to be substitutes only when the number of DDDs in the larger package was divisible by the number of DDDs in the smaller package (this in line with the Reimbursement Act, which allows pharmacists to substitute provided patient obtain the same number of DDDs as specified in the physician’s prescription).
18 / 32
1 billion PLN or over 35% of annual consumer expenditures on drugs. In 2012-2014 their annual value amounted to 0.9-1.0 billion PLN or 28-31% of consumer spending. Suboptimal purchasing decisions translated into unnecessary expenditures by the public payor. Between 2012 and 2014, NFZ could have saved annually around 200 million PLN or 3.5% of reimbursement, if patients shopped for the most affordable products. The size of the public payor’s potential savings was even larger before the Reimbursement Act went into force.
Source: authors’ analysis based on Ministry of Health and NFZ data III.2. Price inelasticity While foregone savings decreased after the introduction of the Reimbursement Act, they still accounted for about one third of all consumer expenditures on drugs after the reform. In addition, foregone savings have not decreased since 2012. This finding implies that consumers are hesitant to switch to drugs which have become more affordable. It challenges the idea that patient choices can help to contain spending on drugs. It also suggests that the primary cause for the decrease in sales-weighted copayments (see section II.3.3) was not conscious drug-switching, but other features of strict pharmaceutical price control, such as more rigid negotiations with pharmaceutical companies as well as strong incentives for these firms to underbid competitors when listing a new product for reimbursement (see section II.2). We follow this line of inquiry by hypothesizing that the market for reimbursed prescription pharmaceuticals in Poland displayed significant price inelasticity of demand. We examine this hypothesis by checking the correlation between the change in market share of different products and the change in relative copayment over time. Figure 9 shows the result of our analysis for the
0.0
0.5
1.0
1.5
2.0
2.5
3.0
3.5
4.0
2010 2011 2012 2013 2014
Bill
ion
PLN
potential spending under perfect substitution real spending
Figure 8. Patients’ foregone savings
potential savings
19 / 32
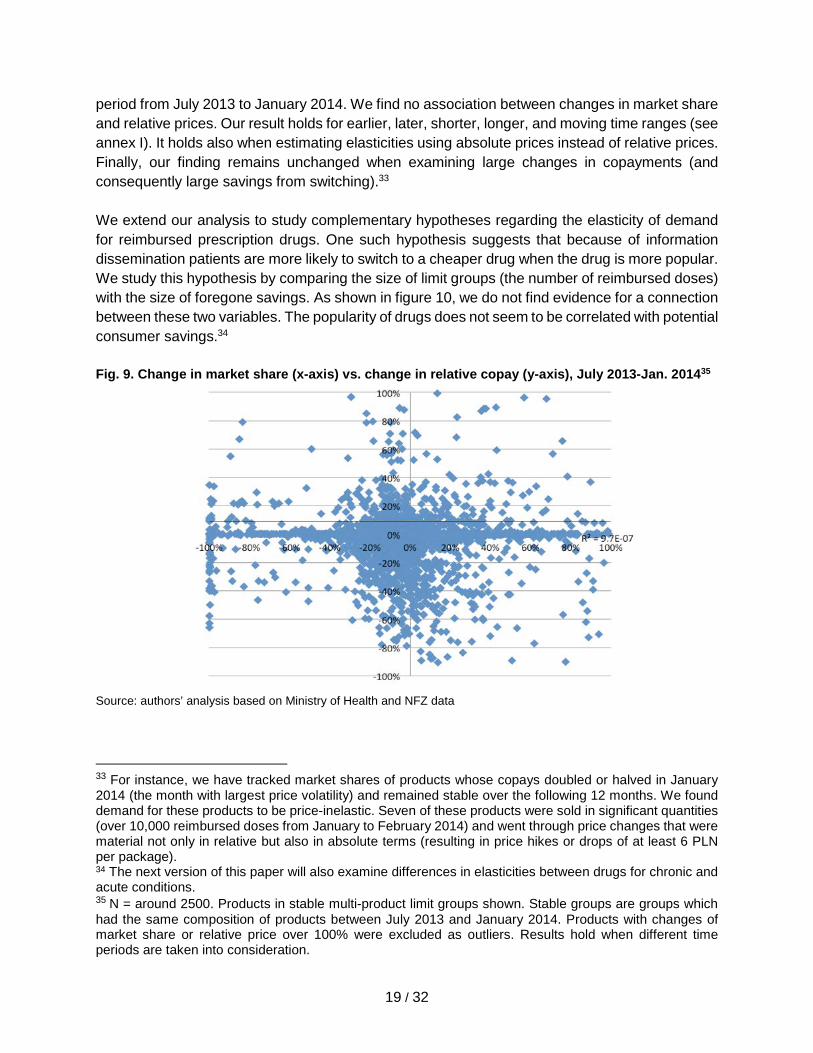
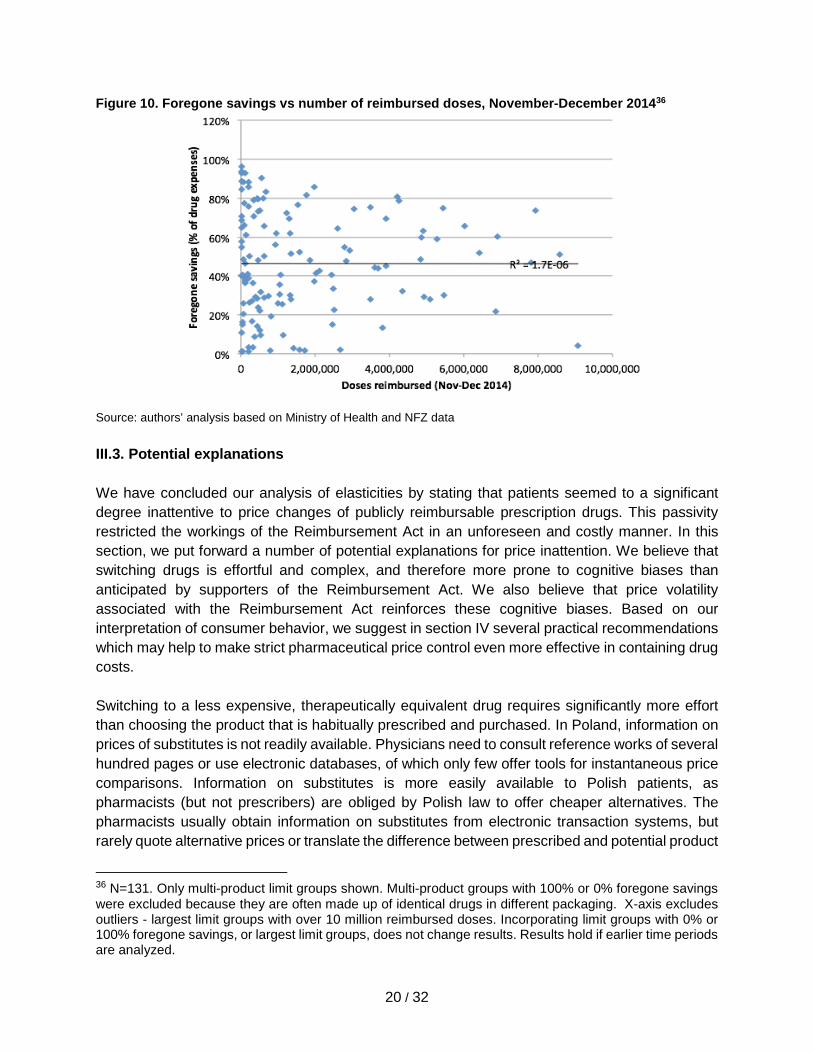
period from July 2013 to January 2014. We find no association between changes in market share and relative prices. Our result holds for earlier, later, shorter, longer, and moving time ranges (see annex I). It holds also when estimating elasticities using absolute prices instead of relative prices. Finally, our finding remains unchanged when examining large changes in copayments (and consequently large savings from switching).33 We extend our analysis to study complementary hypotheses regarding the elasticity of demand for reimbursed prescription drugs. One such hypothesis suggests that because of information dissemination patients are more likely to switch to a cheaper drug when the drug is more popular. We study this hypothesis by comparing the size of limit groups (the number of reimbursed doses) with the size of foregone savings. As shown in figure 10, we do not find evidence for a connection between these two variables. The popularity of drugs does not seem to be correlated with potential consumer savings.34 Fig. 9. Change in market share (x-axis) vs. change in relative copay (y-axis), July 2013-Jan. 201435
Source: authors’ analysis based on Ministry of Health and NFZ data
33 For instance, we have tracked market shares of products whose copays doubled or halved in January 2014 (the month with largest price volatility) and remained stable over the following 12 months. We found demand for these products to be price-inelastic. Seven of these products were sold in significant quantities (over 10,000 reimbursed doses from January to February 2014) and went through price changes that were material not only in relative but also in absolute terms (resulting in price hikes or drops of at least 6 PLN per package). 34 The next version of this paper will also examine differences in elasticities between drugs for chronic and acute conditions. 35 N = around 2500. Products in stable multi-product limit groups shown. Stable groups are groups which had the same composition of products between July 2013 and January 2014. Products with changes of market share or relative price over 100% were excluded as outliers. Results hold when different time periods are taken into consideration.
20 / 32
Figure 10. Foregone savings vs number of reimbursed doses, November-December 201436
Source: authors’ analysis based on Ministry of Health and NFZ data III.3. Potential explanations We have concluded our analysis of elasticities by stating that patients seemed to a significant degree inattentive to price changes of publicly reimbursable prescription drugs. This passivity restricted the workings of the Reimbursement Act in an unforeseen and costly manner. In this section, we put forward a number of potential explanations for price inattention. We believe that switching drugs is effortful and complex, and therefore more prone to cognitive biases than anticipated by supporters of the Reimbursement Act. We also believe that price volatility associated with the Reimbursement Act reinforces these cognitive biases. Based on our interpretation of consumer behavior, we suggest in section IV several practical recommendations which may help to make strict pharmaceutical price control even more effective in containing drug costs. Switching to a less expensive, therapeutically equivalent drug requires significantly more effort than choosing the product that is habitually prescribed and purchased. In Poland, information on prices of substitutes is not readily available. Physicians need to consult reference works of several hundred pages or use electronic databases, of which only few offer tools for instantaneous price comparisons. Information on substitutes is more easily available to Polish patients, as pharmacists (but not prescribers) are obliged by Polish law to offer cheaper alternatives. The pharmacists usually obtain information on substitutes from electronic transaction systems, but rarely quote alternative prices or translate the difference between prescribed and potential product
36 N=131. Only multi-product limit groups shown. Multi-product groups with 100% or 0% foregone savings were excluded because they are often made up of identical drugs in different packaging. X-axis excludes outliers - largest limit groups with over 10 million reimbursed doses. Incorporating limit groups with 0% or 100% foregone savings, or largest limit groups, does not change results. Results hold if earlier time periods are analyzed.
21 / 32
into savings for the patient. The patient’s decision in the pharmacy is further complicated by uncertainty and information asymmetry. The patient is more likely to have a prior assessment of treatment success and side-effects when relying on the prescribed drug, as it is likely that it has been recommended by a physician, who knows the patient’s medical history, or the patient has used the drug before. When considering to switch to an alternative product, the patient has to rely on information from the pharmacist, and may not know how to phrase questions to ensure full product comparability, e.g. with regards to excipients. Figure 11. Average variation of copayments37
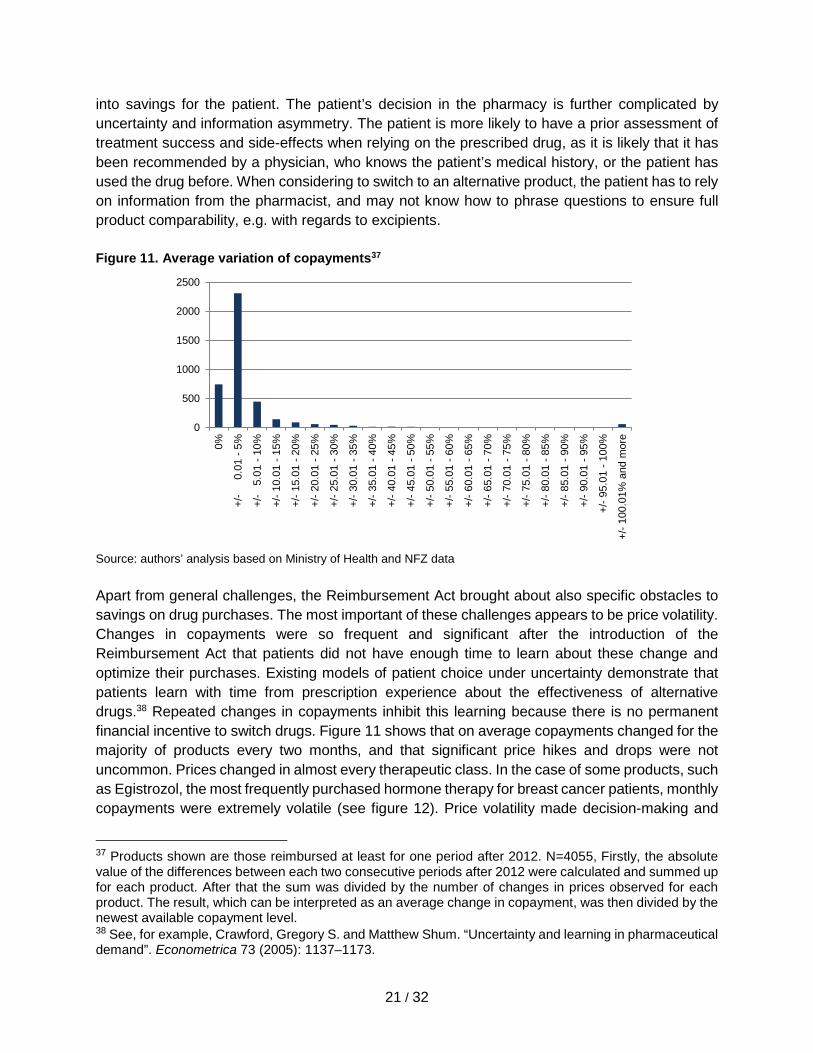
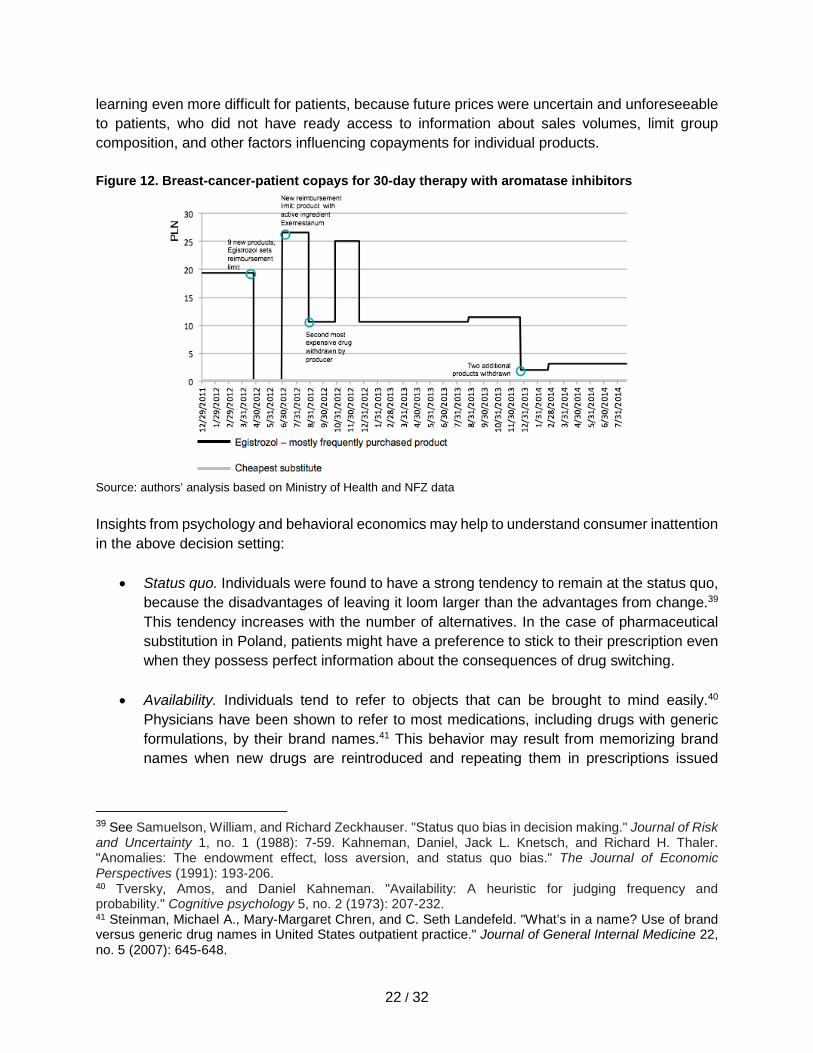
Source: authors’ analysis based on Ministry of Health and NFZ data Apart from general challenges, the Reimbursement Act brought about also specific obstacles to savings on drug purchases. The most important of these challenges appears to be price volatility. Changes in copayments were so frequent and significant after the introduction of the Reimbursement Act that patients did not have enough time to learn about these change and optimize their purchases. Existing models of patient choice under uncertainty demonstrate that patients learn with time from prescription experience about the effectiveness of alternative drugs.38 Repeated changes in copayments inhibit this learning because there is no permanent financial incentive to switch drugs. Figure 11 shows that on average copayments changed for the majority of products every two months, and that significant price hikes and drops were not uncommon. Prices changed in almost every therapeutic class. In the case of some products, such as Egistrozol, the most frequently purchased hormone therapy for breast cancer patients, monthly copayments were extremely volatile (see figure 12). Price volatility made decision-making and
37 Products shown are those reimbursed at least for one period after 2012. N=4055, Firstly, the absolute value of the differences between each two consecutive periods after 2012 were calculated and summed up for each product. After that the sum was divided by the number of changes in prices observed for each product. The result, which can be interpreted as an average change in copayment, was then divided by the newest available copayment level. 38 See, for example, Crawford, Gregory S. and Matthew Shum. “Uncertainty and learning in pharmaceutical demand”. Econometrica 73 (2005): 1137–1173.
0
500
1000
1500
2000
2500
0%
+/-
0.
01 -
5%
+/-
5.0
1 - 1
0%
+/- 1
0.01
- 15
%
+/- 1
5.01
- 20
%
+/- 2
0.01
- 25
%
+/- 2
5.01
- 30
%
+/- 3
0.01
- 35
%
+/- 3
5.01
- 40
%
+/- 4
0.01
- 45
%
+/- 4
5.01
- 50
%
+/- 5
0.01
- 55
%
+/- 5
5.01
- 60
%
+/- 6
0.01
- 65
%
+/- 6
5.01
- 70
%
+/- 7
0.01
- 75
%
+/- 7
5.01
- 80
%
+/- 8
0.01
- 85
%
+/- 8
5.01
- 90
%
+/- 9
0.01
- 95
%
+/- 9
5.01
- 10
0%
+/- 1
00.0
1% a
nd m
ore
22 / 32
learning even more difficult for patients, because future prices were uncertain and unforeseeable to patients, who did not have ready access to information about sales volumes, limit group composition, and other factors influencing copayments for individual products. Figure 12. Breast-cancer-patient copays for 30-day therapy with aromatase inhibitors
Source: authors’ analysis based on Ministry of Health and NFZ data Insights from psychology and behavioral economics may help to understand consumer inattention in the above decision setting:
• Status quo. Individuals were found to have a strong tendency to remain at the status quo, because the disadvantages of leaving it loom larger than the advantages from change.39 This tendency increases with the number of alternatives. In the case of pharmaceutical substitution in Poland, patients might have a preference to stick to their prescription even when they possess perfect information about the consequences of drug switching.
• Availability. Individuals tend to refer to objects that can be brought to mind easily.40 Physicians have been shown to refer to most medications, including drugs with generic formulations, by their brand names.41 This behavior may result from memorizing brand names when new drugs are reintroduced and repeating them in prescriptions issued
39 See Samuelson, William, and Richard Zeckhauser. "Status quo bias in decision making." Journal of Risk and Uncertainty 1, no. 1 (1988): 7-59. Kahneman, Daniel, Jack L. Knetsch, and Richard H. Thaler. "Anomalies: The endowment effect, loss aversion, and status quo bias." The Journal of Economic Perspectives (1991): 193-206. 40 Tversky, Amos, and Daniel Kahneman. "Availability: A heuristic for judging frequency and probability." Cognitive psychology 5, no. 2 (1973): 207-232. 41 Steinman, Michael A., Mary-Margaret Chren, and C. Seth Landefeld. "What’s in a name? Use of brand versus generic drug names in United States outpatient practice." Journal of General Internal Medicine 22, no. 5 (2007): 645-648.
23 / 32
before the expiration of patent protection. Similarly, patients may tend to stick to prescribed drugs as this is the reference to treatment most readily available to them.
• Anchoring. Individuals have been shown to base their judgment on initial pieces of information (so-called “anchors”).42 For instance, when estimating the percentage of African countries in the United Nations, subjects were influenced by random numbers appearing on a fortune wheel. Similarly, patients may use prescribed drugs as reference points when evaluating the price and efficacy of alternatives. The higher price of the prescribed medicine may suggest higher value to patients. This is related to earlier research which showed stronger therapeutic effects of expensive placebos.43
• Authority. In situations involving information asymmetry consumers are likely to rely on expert knowledge. Patients generally have faith in the skills and judgment of their physician. Around 78% of respondents found physicians to be trustworthy in opinion polls in Poland.44 Switching to a cheaper drug without consulting this person of authority may raise concerns with patients, even when the substitute are therapeutically equivalent.
IV. Recommendations Based on our evaluation of strict pharmaceutical price control and consumer behavior in Poland, we offer several recommendations which may help to achieve the Reimbursement Act’s primary purpose and limit unnecessary expenditures on drugs. Our list of recommendations is selective and focuses on the most feasible policy options. Thus, we consciously omit changes targeting physician prescribing. Such changes have been successfully implemented by providers in the United States45 and Europe.46 They range from electronic prescription to financial incentives, mandatory generic substitution, and prescription by international nonproprietary name. Unfortunately, their applicability in Poland is limited due to political economy considerations and a history of implementation failures. Physicians are a powerful professional group, which has
42 Tversky, Amos and Daniel Kahneman. “Judgment under Uncertainty: Heuristics and Biases”. Science 185, no. 4157 (1974): 1124-1131. 43 Shiv Baba, Carmon Ziv, and Dan Ariely. "Placebo effects of marketing actions: consumers may get what they pay for. " Journal of Marketing Research 42, no. 4 (2005): 383-393. 44 Centrum Badania Opinii Społecznej. “Opinie o błędach medycznych i zaufaniu do lekarzy.” Komunikaty z badań CBOS no. 165 (2014). 45 See for instance McMullin, S. Troy, Thomas P. Lonergan, and Charles S. Rynearson. "Twelve-month drug cost savings related to use of an electronic prescribing system with integrated decision support in primary care." Journal of managed care pharmacy: JMCP 11.4 (2005): 322-332. 46 For a summary of these initiatives in 8 European countries see Godman, B., Wettermark, B., Bishop, I., Burkhardt, T., Fürst, J., Garuoliene, K., Laius, L., Martikainen, J., Semet, C., Teixeira, I. and Zara, C., 2012. European payer initiatives to reduce prescribing costs through use of generics. Generic and Biosimilars Initiative Journal 1 (1), pp.22-27. For a summary of relevant evidence on the use of financial incentives to change prescribing behavior see: Sturm, H., Austvoll ‐Dahlgren, A., Aaserud, M., Oxman, A.D., Ramsay, C.R., Vernby, Å. and Kösters, J.P., 2007. Pharmaceutical policies: effects of financial incentives for prescribers. The Cochrane Library.
24 / 32
successfully protested changes in prescribing practices.47 Poland’s e-prescription projects are many years behind schedule and it is unclear if and to what extent they will be implemented.48 In order to reap fully the benefits of the Drug Reimbursement Act, we recommend embracing consumer choice and encouraging patients to save unnecessary costs for themselves and the public payer. This can be achieved by three sets of measures related to price transparency, the the workings of the Reimbursement Act, as well as communication between pharmacists and patients:
● Information. An obvious starting point is the provision of easily accessible, up-to-date information on prices. Today, patients rely on physicians and pharmacists to obtain information on prescription drug prices. Both groups are likely to rely on their memory when suggesting cheaper substitutes, even though the volatility of prices shown in section III.3. make this an unreliable and inefficient method of price comparison. In addition, patients in such situations are likely to receive only one price quote despite the fact that some drug classes encompass dozens of substitutes. Poland’s Ministry of Health has made efforts to make information on prices and substitutability more available to patients. Since March 2014, consumers have access to information on prices and substitutability via a hotline. This form of communication could be extended with the help of a price comparison application for smartphones to serve the needs of patients requiring instant access to information. Such smartphone applications are widely used in other countries. Examples include GoodRx and LowestMed in the United States, Medizinfuchs in Germany and PrixMedicament.com in France. They are also offered by commercial providers in Poland, but are either not up-to-date49 or lack an accurate price comparison feature.50
● Behaviorally informed regulation. Apart from better price transparency, we also suggest
behaviorally informed changes to the Reimbursement Act and its enforcement by the Ministry of Health. Since we have shown that the decrease in foregone savings was more likely associated with price negotiations and adding new products to the reimbursement list than with patients switching prescription drugs, officials should actively invite applications for reimbursement from producers selling affordable and popular products. Under the current regulation, extending public insurance coverage to such products should result in cost savings in the entire cluster of comparable drugs. Another improvement can be made by relaxing the statutory requirement to update prices and reimbursement limits every two months. Frequent changes in prices make it more difficult for patients to learn and adapt to new copayments. In addition, given inertia on the side of
47 For instance, in early 2012 physicians boycotted for several weeks new rules on prescribing which required them to specify the copayment level on prescriptions. 48 For an overview of implementation problems see a recent announcement by the Ministry of Health. “Projekt P1 - nowe otwarcie”. 2 December 2015. Web 3 December 2015. 49 The app LLR (Lista Leków Refundowanych) has not been updated since June 2013. 50 Empendium provides information on package prices, but does not indicate the drug with the lowest copayment per DDD. Other smartphone applications focus on medical information.
25 / 32
patients, drug prices change in a way which increase the disadvantages of choosing poorly. Smoothing price changes over periods of 3-6 months, while reducing potential savings in the short run, could help to increase actual savings over the long term.
● Nudges. Finally, pharmacists could “nudge”, or behaviorally induce, patients to switch to cheaper drugs through prompts. There are many potential biases that such prompts could counteract. For instance, when suggesting a switch to a generic drug, the pharmacist might term the generic a “new drug”. This association could make the purchase of a substitute more attractive, not least because generic drugs are considered fake in Poland by some patients (the dyad “generic-branded” translates as “generic-original” in Polish). Given the asymmetry of information involved in the purchase of prescription medicines, pharmacists could also appeal to authority (“I would switch to product B, if I were buying the product for myself”). Finally, pharmacists could leverage loss aversion and raise the salience of the price difference between different products (“Consumers who do not switch lose on average 50 PLN per year”). The wording of different prompts could be subject to a multi-pronged experiment to prove their effectiveness.
All of the above recommendations, from increased price transparency to behaviorally informed changes to regulations and practices, have the clear advantage of being simple, low-cost and verifiable - a welcome complement to the intricate web of strict price regulation in Poland.
26 / 32
Bibliography
1. Aaserud, Morten, A. T. Dahlgren, J. P. Kosters, Andrew D. Oxman, Craig Ramsay, and Heidrun Sturm. "Pharmaceutical policies: effects of reference pricing, other pricing, and purchasing policies." Cochrane Database Systematic Reviews 2 (2006).
2. Abaluck, Jason, and Jonathan Gruber. “Evolving choice inconsistencies in choice of prescription drug insurance.” National Bureau of Economic Research Working Paper 19163 (2013).
3. Abaluck, Jason, and Jonathan Gruber. "Heterogeneity in choice inconsistencies among the elderly: Evidence from prescription drug plan choice." The American Economic Review 101, no. 3 (2011): 377.
4. Allan, G. Michael, Joel Lexchin, and Natasha Wiebe. "Physician awareness of drug cost: a systematic review." PLoS Med 4(9): e283. (2007).
5. Brekke, Kurt R., Tor Helge Holmas, and Odd Rune Straume. "Reference pricing, competition, and pharmaceutical expenditures: theory and evidence from a natural experiment." Journal of Public Economics 95, no. 7 (2011): 624-638.
6. Büchel, Christian, Stephan Geuter, Christian Sprenger, and Falk Eippert. "Placebo analgesia: a predictive coding perspective." Neuron 81, no. 6 (2014): 1223-1239.
7. Carone, Giuseppe, Christoph Schwierz, and Ana Xavier. "Cost-containment policies in public pharmaceutical spending in the EU." Available at SSRN 2161803 (2012).
8. Centrum Badania Opinii Społecznej. “Opinie o błędach medycznych i zaufaniu do lekarzy.” Komunikaty z badań CBOS no. 165 (2014).
9. Chapman, Gretchen B. "The psychology of medical decision making." Blackwell handbook of judgment and decision making (2004).
10. Crawford, Gregory S., and Matthew Shum. "Uncertainty and learning in pharmaceutical demand." Econometrica 73, no. 4 (2005): 1137-1173.
11. Decollogny, Anne, Yves Eggli, Patricia Halfon, and Thomas M. Lufkin. "Determinants of generic drug substitution in Switzerland." BMC Health Services Research 11, no. 1 (2011): 1.
12. Dolan, Paul, Michael Hallsworth, David Halpern, Dominic King, and Ivo Vlaev. "Mindplace: influencing behaviour through public policy." UK: Report for the Cabinet Office (2014).
13. Drozdowska, Aleksandra, and Tomasz Hermanowski. "Predictors of generic substitution: The role of psychological, sociodemographic, and contextual factors." Research in Social and Administrative Pharmacy 12, no. 1 (2016): 119-129.
14. Dunne, Suzanne, Bill Shannon, Colum Dunne, and Walter Cullen. "Patient perceptions of generic medicines: a mixed-methods study." The Patient-Patient-Centered Outcomes Research 7, no. 2 (2014): 177-185.
15. Ginsburg, Tom, Jonathan S. Masur, and Richard H. McAdams. "Libertarian paternalism, path dependence, and temporary law." The University of Chicago Law Review 81, no. 1 (2014): 291-359.
16. Godman, B., Wettermark, B., Bishop, I., Burkhardt, T., Fürst, J., Garuoliene, K., Laius, L., Martikainen, J., Semet, C., Teixeira, I. and Zara, C., 2012. European payer initiatives to reduce prescribing costs through use of generics. Generic and Biosimilars Initiative Journal 1, no. 1 (2012), pp. 22-27.
27 / 32
17. Goldman, Dana P., Geoffrey F. Joyce, Jose J. Escarce, Jennifer E. Pace, Matthew D. Solomon, Marianne Laouri, Pamela B. Landsman, and Steven M. Teutsch. "Pharmacy benefits and the use of drugs by the chronically ill." Journal of the American Medical Association 291, no. 19 (2004): 2344-2350.
18. Haas, Jennifer S., Kathryn A. Phillips, Eric P. Gerstenberger, and Andrew C. Seger. "Potential savings from substituting generic drugs for brand-name drugs: medical expenditure panel survey, 1997–2000." Annals of Internal Medicine 142, no. 11 (2005): 891-897.
19. Håkonsen, Helle, and Else-Lydia Toverud. "A review of patient perspectives on generics substitution: what are the challenges for optimal drug use." Generics and Biosimilars Initiative Journal 1, no. 1 (2012): 28-32.
20. Ho, Kate, Joseph Hogan, and Fiona Scott Morton. The impact of consumer inattention on insurer pricing in the Medicare Part D program. No. w21028. National Bureau of Economic Research (2015).
21. Jolls, Christine, Cass R. Sunstein, and Richard Thaler. "A behavioral approach to law and economics." Stanford Law Review (1998): 1471-1550.
22. Kahneman, Daniel. Thinking fast and slow. Macmillan (2011). 23. Kahneman, Daniel, Jack L. Knetsch, and Richard H. Thaler. "Anomalies: The endowment
effect, loss aversion, and status quo bias." The Journal of Economic Perspectives 5, no. 1 (1991): 193-206.
24. Kamenica, Emir, Robert Naclerio, and Anup Malani. "Advertisements impact the physiological efficacy of a branded drug." Proceedings of the National Academy of Sciences 110, no. 32 (2013): 12931-12935.
25. Ketcham, Jonathan D., Claudio Lucarelli, Eugenio J. Miravete, and M. Christopher Roebuck. "Sinking, swimming, or learning to swim in Medicare Part D." The American Economic Review (2012): 2639-2673.
26. Ketcham, Jonathan D., Claudio Lucarelli, and Christopher A. Powers. "Paying attention or paying too much in Medicare Part D." The American Economic Review 105, no. 1 (2014): 204-233.
27. Ministerstwo Zdrowia. “Projekt P1 - nowe otwarcie”. 2 December 2015. Web 3 December 2015 (2015).
28. McMullin, S. Troy, Thomas P. Lonergan, and Charles S. Rynearson. "Twelve-month drug cost savings related to use of an electronic prescribing system with integrated decision support in primary care." Journal of Managed Care Pharmacy 11, no. 4 (2005): 322-332.
29. Obwieszczenia Ministra Zdrowia w sprawie wykazu refundowanych leków, środków spożywczych specjalnego przeznaczenia żywieniowego oraz wyrobów medycznych (Ministry of Health communiqués I - XIX),
30. Okunade, Albert A., and Chutima Suraratdecha. "The pervasiveness of pharmaceutical expenditure inertia in the OECD countries." Social science & medicine 63, no. 1 (2006): 225-238.
31. Proceedings of the Conference on Applying Behavioural Insights to Policy-making, European Commission. Accessed January, 5, 2016 . https://storify.com/eu_consumer/eunudge-applying-behavioural-insights-to-policy-m
28 / 32
32. Rozporządzenie Ministra Zdrowia z dnia 8 grudnia 2009 r. w sprawie limitów cen leków i wyrobów medycznych wydawanych świadczeniobiorcom bezpłatnie, za opłatą ryczałtową lub częściową odpłatnością (Minister of Health Ordinance dated December 8, 2009)
33. Rozporządzenie Ministra Zdrowia z dnia 22 grudnia 2010 r. w sprawie limitów cen leków i wyrobów medycznych wydawanych świadczeniobiorcom bezpłatnie, za opłatą ryczałtową lub częściową odpłatnością (Minister of Health ordinance, dated December 22, 2010).
34. Sagan, Adam, Dimitra Panteli, Włodzimierzt Borkowski, Marek Dmowski, F. Domanski, M. Czyzewski, P. Gorynski et al. "Poland health system review." Health Systems in Transition 13, no. 8 (2010): 1-193.
35. Samuelson, William, and Richard Zeckhauser. "Status quo bias in decision making." Journal of risk and uncertainty 1, no. 1 (1988): 7-59.
36. Shafir, Eldar, ed. “The behavioral foundations of public policy.” Princeton University Press (2013).
37. Shiv Baba, Carmon Ziv and Dan Ariely (2005), "Placebo effects of marketing actions: consumers may get what they pay for". Journal of Marketing Research 42, no. 4 (2005): 383-393.
38. Shrank, William H., Emily R. Cox, Michael A. Fischer, Jyotsna Mehta, and Niteesh K. Choudhry. "Patients’ perceptions of generic medications." Health Affairs 28, no. 2 (2009): 546-556.
39. Simonsen, Marianne, Lars Skipper, and Niels Skipper. "Price sensitivity of demand for prescription drugs: Exploiting a regression kink design." Journal of Applied Econometrics (2015).
40. Stargardt, Tom. "The impact of reference pricing on switching behaviour and healthcare utilisation: the case of statins in Germany." The European Journal of Health Economics 11, no. 3 (2010): 267-277.
41. Steinman, Michael A., Mary-Margaret Chren, and C. Seth Landefeld. "What’s in a name? Use of brand versus generic drug names in United States outpatient practice." Journal of general internal medicine 22, no. 5 (2007): 645-648.
42. Sturm, H., Austvoll ‐Dahlgren, A., and Kösters, J.P. Pharmaceutical policies: effects of financial incentives for prescribers. The Cochrane Library (2007).
43. Sunstein, Cass R. “Behavioral law and economics.” Cambridge University Press (2000). 44. Sunstein, Cass R. "Empirically informed regulation." The University of Chicago Law
Review 78, no. 4 (2011): 1349-1429. 45. Sunstein, Cass R. Simpler: The future of government. Simon and Schuster (2014). 46. Szaniawski, Paweł. “Polacy z biedy rezygnują z leków.” Newsweek Polska, 24 January
2013. Web 20 December 2015 (2015). 47. Teutsch, Steven M., and Marc L. Berger. "Impact of 3-tier pharmacy benefit design and
increased consumer cost-sharing on drug utilization." American Journal of Managed Care 11, no. 10 (2005): 621-8.
48. Thaler, Richard H., and Cass R. Sunstein. "Nudge: Improving Decisions about health, wealth and happiness.” Yale University Press (2008).
49. Tversky, Amos, and Daniel Kahneman. "Availability: A heuristic for judging frequency and probability." Cognitive psychology 5, no. 2 (1973): 207-232.
29 / 32
50. Tversky, Amos and Daniel Kahneman. “Judgment under Uncertainty: Heuristics and Biases”. Science 185, no. 4157 (1974): 1124-1131.
51. Ustawa z dnia 12 maja 2011 r. o refundacji leków, środków spożywczych specjalnego przeznaczenia żywieniowego oraz wyrobów medycznych (Reimbursement Act)
52. Vogler, Sabine. "The impact of pharmaceutical pricing and reimbursement policies on generics uptake: implementation of policy options on generics in 29 European countries–an overview." Generics and Biosimilars Initiative Journal 1, no. 2 (2012): 44-51.
53. Vogler, Sabine, Claudia Habl, Martina Bogut, and Luka Vončina. "Comparing pharmaceutical pricing and reimbursement policies in Croatia to the European Union Member States." Croatian medical journal 52, no. 2 (2011): 183-197.
54. Waber, Rebecca L., Baba Shiv, and Ziv Carmon. "Commercial features of placebo and therapeutic." Journal of the American Medical Association 299, no. 9 (2008): 1016-7.
55. Zamir, Eyal, and Doron Teichman, eds. The Oxford handbook of behavioral economics and the law. Oxford University Press (2014).
56. Zhou, Chao, and Yuting Zhang. "The vast majority of Medicare Part D beneficiaries still don’t choose the cheapest plans that meet their medication needs." Health Affairs 31, no. 10 (2012): 2259-2265.
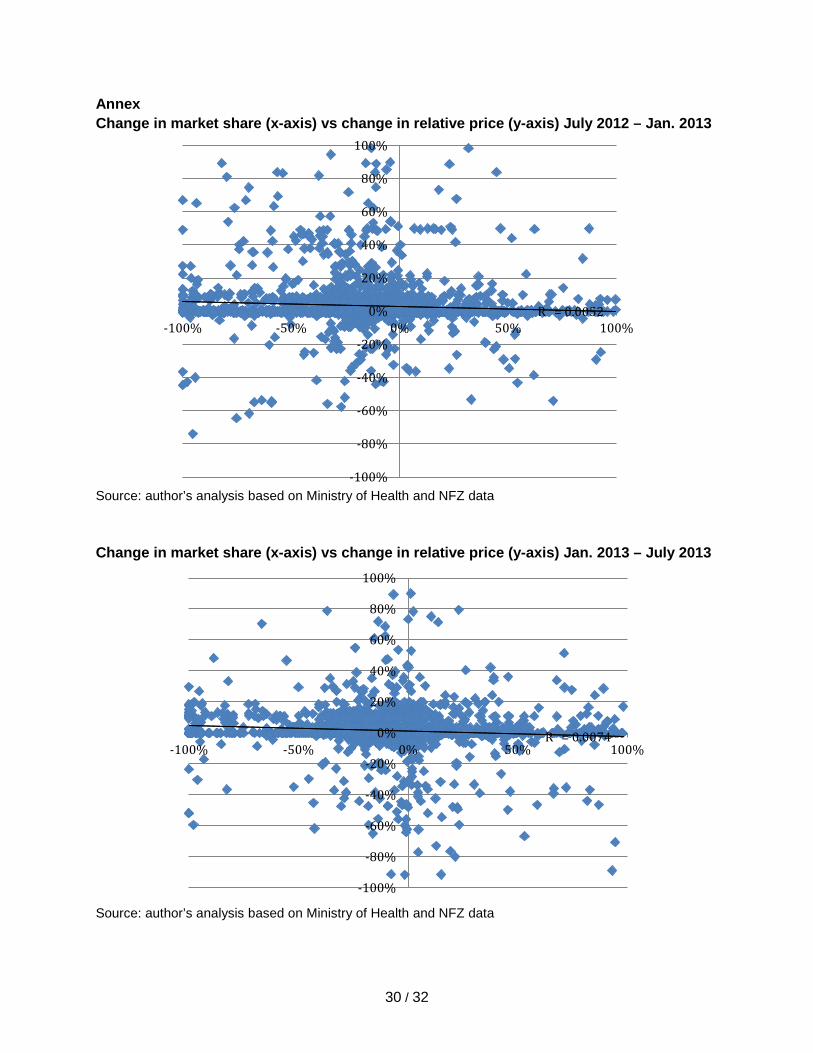
30 / 32
Annex Change in market share (x-axis) vs change in relative price (y-axis) July 2012 – Jan. 2013
Source: author’s analysis based on Ministry of Health and NFZ data Change in market share (x-axis) vs change in relative price (y-axis) Jan. 2013 – July 2013
Source: author’s analysis based on Ministry of Health and NFZ data
R² = 0.0052
-100%
-80%
-60%
-40%
-20%
0%
20%
40%
60%
80%
100%
-100% -50% 0% 50% 100%
R² = 0.0074
-100%
-80%
-60%
-40%
-20%
0%
20%
40%
60%
80%
100%
-100% -50% 0% 50% 100%
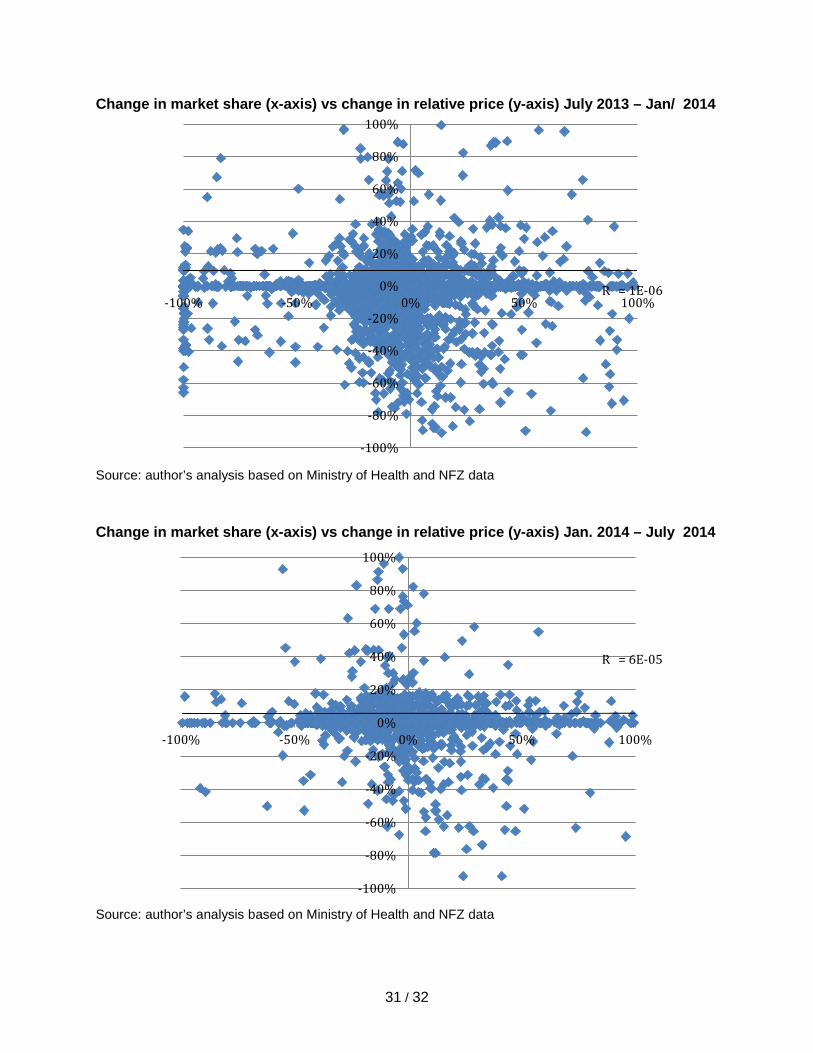
31 / 32
Change in market share (x-axis) vs change in relative price (y-axis) July 2013 – Jan/ 2014
Source: author’s analysis based on Ministry of Health and NFZ data Change in market share (x-axis) vs change in relative price (y-axis) Jan. 2014 – July 2014
Source: author’s analysis based on Ministry of Health and NFZ data
R² = 1E-06
-100%
-80%
-60%
-40%
-20%
0%
20%
40%
60%
80%
100%
-100% -50% 0% 50% 100%
R² = 6E-05
-100%
-80%
-60%
-40%
-20%
0%
20%
40%
60%
80%
100%
-100% -50% 0% 50% 100%
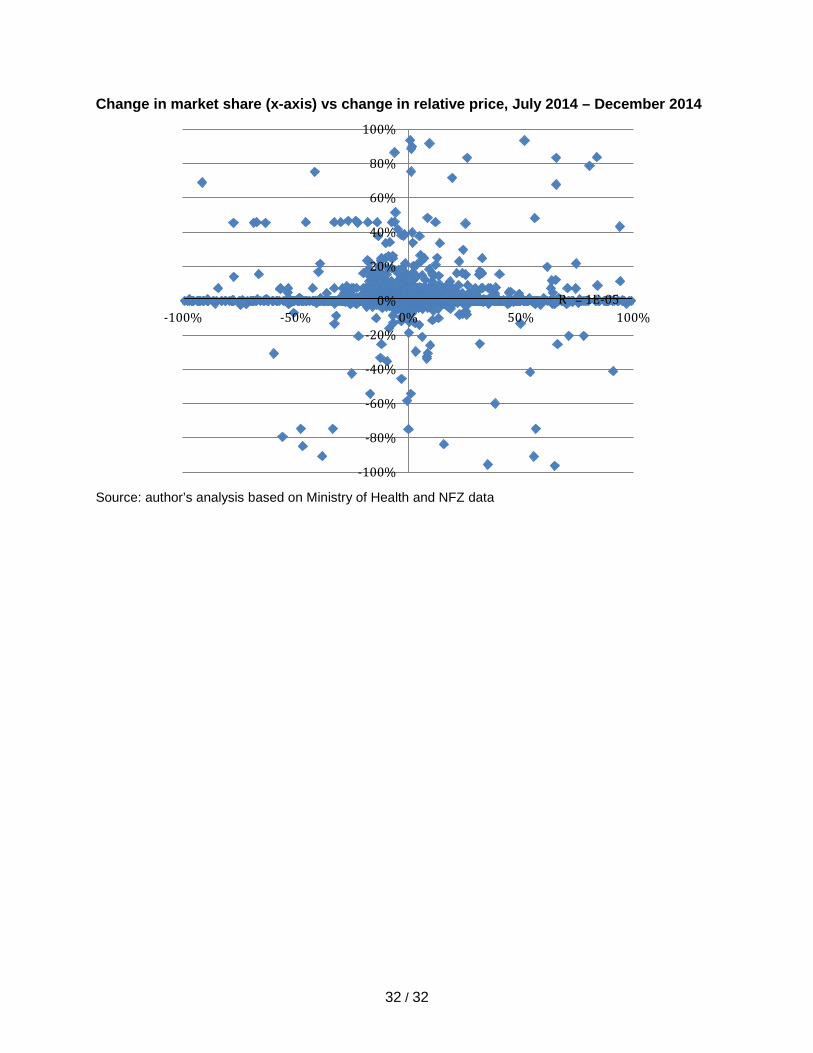
32 / 32
Change in market share (x-axis) vs change in relative price, July 2014 – December 2014
Source: author’s analysis based on Ministry of Health and NFZ data
R² = 1E-05
-100%
-80%
-60%
-40%
-20%
0%
20%
40%
60%
80%
100%
-100% -50% 0% 50% 100%