Embed Size (px)
Citation preview
1
Stretch-induced stress patterns and wrinkles in hyperelastic thin sheets
Vishal Nayyar, K. Ravi-Chandar, and Rui Huang
Department of Aerospace Engineering and Engineering Mechanics
The University of Texas at Austin, Austin, Texas 78712
Abstract: Wrinkles are commonly observed in stretched thin sheets and membranes. This paper
presents a numerical study on stretch-induced wrinkling of hyperelastic thin sheets based on
nonlinear finite element analyses. The model problem is set up for uniaxial stretching of a
rectangular sheet with two clamped ends and two free edges. A two-dimensional stress analysis
is performed first under the plane-stress condition to determine stretch-induced stress distribution
patterns in the elastic sheets, assuming no wrinkles. As a prerequisite for wrinkling, development
of compressive stresses in the transverse direction is found to depend on both the length-to-width
aspect ratio of the sheet and the applied tensile strain in the longitudinal direction. A phase
diagram is constructed with four different distribution patterns of the stretch-induced
compressive stresses, spanning a wide range of the aspect ratio and tensile strain. Next, an
eigenvalue analysis is performed to find the potential buckling modes of the elastic sheet under
the prescribed boundary conditions. Finally, a nonlinear post-buckling analysis is performed to
show evolution of stretch-induced wrinkles. In addition to the aspect ratio and tensile strain, it is
found that the critical condition for wrinkling and the post-buckling behavior both depend
sensitively on the sheet thickness. In general, wrinkles form only when both the magnitude and
the distribution area of the compressive stresses are sufficiently large. The wrinkle wavelength
decreases with increasing strain, in good agreement with the prediction by a scaling analysis.
However, as the tensile strain increases, the wrinkle amplitude first increases and then decreases,
eventually flattened beyond a moderately large critical strain, in contrast to the scaling analysis.
Keywords: buckling; wrinkle; thin sheet; hyperelastic material.

2
1. Introduction
Thin sheets and membrane structures are used widely in space applications such as
inflatable space antennas, solar sails, and radars (Talley et al., 2002; Sleight et al., 2005;
Sakamoto and Park, 2005; Wang et al., 2007). Similar structures have also found applications in
areas of solar energy systems (Peypoudat et al., 2005) and large-area flexible electronics (Rogers
et al., 2001). The main advantage of using these structures in the space applications is due to
their lightweight and low space requirement. Among others, surface flatness over a large area is
one of the key requirements for many applications using the flexible thin structures (Wang et al.,
2007). For instance, in a solar sail, surface wrinkles may lead to problems such as non-uniform
sail loading, loss of momentum transfer to sail, and undesirable torques on the spacecraft (Talley
et al., 2002). Typically, wrinkles form as a result of structural instability under compressive
stresses. However, previous studies have shown that wrinkles often appear in thin sheets under a
variety of loading conditions (Jenkins et al., 1997; Su et al., 2003; Leifer and Belvin, 2003;
Wong and Pellegrino, 2006a). It is thus important to understand the mechanics of wrinkling for
practical applications that require reliable control of surface wrinkles.
Two approaches have been commonly used for wrinkling analysis of elastic membranes:
the tension field theory and the bifurcation analysis. In the tension field theory, the membrane is
assumed to have zero bending stiffness. This approach was first applied by Wagner (1929) to
estimate the maximum shear load that can be carried by a thin web. Stein and Hedgepeth (1961)
adopted the approach in analysis of partly wrinkled membranes, where a wrinkling region is
assumed whenever one of the in-plane principal stresses becomes negative. Subsequently, the
tension field theory has been continuously developed and extended for various applications (e.g.,
Mansfield, 1970; Danielson and Natarajan, 1975; Wu, 1978; Pipkin, 1986; Steigmann, 1990;

3
Alder, et al., 2000; Liu et al., 2001; Coman, 2007). The tension field theory approach typically
provides a satisfactory prediction of the stress distribution and wrinkling regions. However, it
does not provide detailed information about the wrinkles such as amplitude and wavelength.
In the bifurcation analysis, the membrane is treated as a thin shell with non-zero bending
stiffness. Typically, a geometrically nonlinear finite element method is employed using shell
elements for numerical analysis (e.g., Tomita and Shindo, 1988; Friedl et al., 2000; Lee and Lee,
2002; Leifer and Belvin, 2003; Iwasa et al., 2004; Tessler et al., 2005; Wong and Pellegrino,
2006c; Diaby et al., 2006; Zheng, 2009). Both the critical condition for wrinkling and post-
buckling behavior can be predicted by this approach. For relatively simple cases, analytical
methods have also been proposed to obtain approximate solutions (Jacques and Potier-Ferry,
2005; Wong and Pellegrino, 2006b; Coman and Haughton, 2006; Steigmann, 2008; Puntel et al.,
2010).
In the present study we take the approach of bifurcation analysis and focus on a model
problem as depicted in Fig. 1a: a rectangular sheet is subjected to uniaxial stretch with two
opposite ends clamped. Figure 1b shows an image of a stretched polyethylene sheet with
wrinkles. The same problem has been studied previously. Friedl et al. (2000) showed that
compressive transverse stresses are induced in the sheet upon stretching as a result of the
clamped boundary condition. They suggested a buckling coefficient to determine the critical
longitudinal stress for onset of wrinkling. Jacques and Potier-Ferry (2005) presented an
analytical solution to explain the wrinkle wavelength selection and mode localization in
relatively long sheets. Cerda et al. (2002) presented the first experimental data for stretch-
induced wrinkle wavelengths along with a scaling analysis, which predicted the wavelength to
decrease with increasing longitudinal strain while the wrinkle amplitude increases. Cerda and

4
Mahadevan (2003) later extended the scaling analysis for a wide range of wrinkling phenomena.
Recently, with a more elaborate analysis, Puntel et al. (2010) confirmed the scaling relation for
the wrinkle wavelength but showed that wrinkling occurs only beyond a critical stretch, which
depends on the length-to-width ratio of the rectangular sheet. Zheng (2009) presented both
numerical analyses and experimental measurements of the wrinkles, showing that the wrinkle
amplitude first increases and then decreases as the longitudinal strain increases. All of the
previous studies except for Zheng (2009) assumed the material of the sheet to be linear elastic,
which restricts the longitudinal strain to be less than a few percent. In the present study, to
consider moderately large strains (up to 150%), the material is taken to be hyperelastic. Unlike
Zheng (2009), we start with a two-dimensional analysis of stress distribution in the sheet
(Section 2), which predicts various patterns of stretch-induced compressive stresses for the
rectangular sheets with different length-to-width aspect ratios. Subsequently, we present critical
eigenvalue analyses for onset of buckling modes (Section 3) and nonlinear post-buckling
analyses for evolution of stretch-induced wrinkles (Section 4). Furthermore, a simple model is
presented to qualitatively understand the numerical results.
2. Two-dimensional stress analysis
Figure 1a shows schematically a rectangular sheet, subjected to uniaxial stretch in the
longitudinal direction with two opposite ends clamped. Before stretching, the dimensions of the
sheet are: length L0, width W0, and thickness t0. The nominal strain is defined as ε = L/L0 – 1,
where L is the end-to-end distance of the stretched sheet. Due to the constraint of the clamped
ends, the deformation and stress in the sheet are inhomogeneous. In this section, we present a
two-dimensional (2-D) stress analysis of the stretched sheet, assuming no wrinkles. A 2-D finite

5
element model is developed using the commercial software ABAQUS (v6.8, 2008), where the
sheet is modeled by quadrilateral plane-stress elements (CPS4R). A uniform mesh is used with
100 nearly square-shaped elements across the width of the sheet, which was found sufficient to
achieve convergence in the 2-D stress analysis (Nayyar, 2010). The geometry of the rectangular
sheet is characterized by a single dimensionless ratio between the length and the width, α =
L0/W0. The thickness of the sheet has no effect on the 2-D stress analysis, but will be important
for wrinkling analysis in later sections. The material of the sheet is assumed to be hyperelastic so
that moderately large deformation can be considered. Using the incompressible neo-Hookean
model for the material, the only material property to be specified is the initial shear modulus (µ).
To be specific, we set µ = 6 MPa, a representative value for rubberlike materials. The value of
the shear modulus affects only the magnitude of stress in the sheet but has no effect on the
wrinkling behavior as shown later. In addition to the nonlinear elasticity of the material, the
nonlinear kinematics for finite deformation is taken into account in the finite element analysis.
To understand the effect of the aspect ratio (α = L0/W0), we vary the initial length (L0) of
the sheet while keeping the width constant (W0 = 10 cm, to be specific) in all models. For each
aspect ratio, the sheet is increasingly stretched by prescribing the end displacements, up to a
moderately large nominal strain (ε ≤ 150%). It is found that for a wide range of the aspect ratio
compressive stresses are induced in the transverse direction of the sheet (i.e., σy < 0), which is a
prerequisite for wrinkling. In addition, different distribution patterns of the stretch-induced
compressive stress are predicted, depending on the aspect ratio and the applied stretch. Figure 2
summarizes the results in a phase diagram for the stress patterns, including four different phases:
(I) all-tension phase (see Fig. 3); (II) transverse two-peak phase (see Figs. 4 and 5); (III) central

6
one-peak phase (see Fig. 6); (IV) longitudinal two-peak phase (see Figs. 7 and 8). The details are
discussed as follows.
2.1 Case 1: low aspect ratio (α ≤ 1)
For rectangular sheets with low aspect ratios (α ≤ 1), no compressive stress is induced by
stretching the sheets with the prescribed boundary condition. Figure 3a shows the stress contour
(σy) for a sheet with α = 1 and ε = 1%, where the stress magnitude is normalized by Young’s
modulus of the material (E = 3µ). The entire sheet is under tension in both the x and y directions;
consequently, no wrinkling is expected in this case. We note that the resolution of the singular
stress field at the corners (Benthem, 1963) may require use of a very fine mesh or singular
elements in the finite element model. However, for the discussion of stretch-induced wrinkling,
only the stress distribution away from the corners is of importance and thus a moderately fine
mesh is sufficient. Due to the constraint of uniaxial strain at the clamped ends (i.e., zero strain in
the y-direction), a biaxial tensile stress field develops near the ends. However, due to the two free
edges at y/W0 = ±0.5, the tensile stress in the y direction is partially relaxed in the center region
of the sheet, but remains tensile everywhere for the low-aspect-ratio sheet. Figure 3b shows the
transverse stress σy along the vertical center line of the sheet (x/L0 = 0.5). The stress σy is
necessarily zero at the edge (y/W0 = ±0.5) by the boundary condition. Away from the edges, σy
increases and reaches a peak at the center of the sheet (y = 0). As the nominal strain increases,
the magnitude of the tensile transverse stress increases. Therefore, regardless of the applied
stretch, the stress field is completely tensile for the low-aspect-ratio sheets; this is designated as
Phase I in Fig. 2.

7
2.2 Case 2: 1 < α < 1.5
With the aspect ratio slightly greater than 1, a compressive stress is induced in the
rectangular sheet upon stretching. As shown in Fig. 4a for α = 1.1 and ε = 1%, the stress σy is
negative in two separate regions symmetrically located near the free edges, with two peak
compressive stresses on the vertical center line. As shown in Fig. 4b, at ε = 1% the transverse
stress along the center line is compressive near the edges and tensile at the center. As the applied
strain increases, the magnitude of the compressive stress first increases and then decreases,
becoming all tensile at ε = 5%. Therefore, for such an aspect ratio, a two-peak compressive stress
pattern is induced at small strains; this is designated as Phase II in Fig. 2. A transition from Phase
II to Phase I (all-tension) occurs at a critical strain that increases with the aspect ratio.
For aspect ratios up to 1.5, the distribution of the stretch-induced compressive stress
exhibits similar pattern, with two peaks along the vertical center line of the sheet. As the aspect
ratio increases, the locations of the two peaks move toward the center. Meanwhile, the two
regions of the compressive stress expand and eventually merge into one region from edge to
edge, as shown in Fig. 5a for α = 1.35 and ε = 1%. With increasing stretch, the magnitude of the
compressive stress first increases (Fig. 5b) and then decreases (Fig. 5c), becoming all tension at ε
= 15%.
The boundary between Phase I and Phase II in Fig. 2 is determined approximately from
the finite element analysis. First, the critical aspect ratio between the two phases is found to be
around 1. Second, for 1 < α < 1.5, the critical strain for the transition from Phase II to Phase I is
calculated as a function of the aspect ratio. At α = 1.5, it is found that the two peaks of the
compressive stress merge into one at the center of the sheet (y = 0 and x/L0 = 0.5); this is
designated as Phase III in Fig. 2.

8
2.3 Case 3: 1.5 ≤ α < 2.2
For 1.5 ≤ α < 2.2, a region of compressive stress develops at the center of the rectangular
sheet upon stretching, with the peak compressive stress at the center of symmetry (y = 0 and x/L0
= 0.5), as shown in Fig. 6a for α = 2 and ε = 1%. The one-peak distribution pattern is designated
as Phase III in Fig. 2. Friedl et al. (2000) showed a similar stress pattern for a linear elastic sheet
with α = 2. Along the vertical center line of the sheet, the stress σy is compressive from edge to
edge for ε < 20%. The magnitude of the peak compressive stress first increases as the applied
stretch increases up to ε = 20%, as shown in Fig. 6b. As the applied stretch increases further, the
stress becomes tensile near the edges and the magnitude of the peak compressive stress at the
center decreases (Fig. 6c). Eventually at ε = 64%, the stress becomes all tension (Phase I) again.
Similar to the transition from Phase II to Phase I, the critical strain for the transition from Phase
III to Phase I increases as the aspect ratio increases, which defines the boundary between Phase
III and Phase I in Fig. 2.
2.4 Case 4: 2.2 ≤ α < 3.7
As the aspect ratio continues to increase, the region of the stretch-induced compressive
stress expands in the x direction. When α ≥ 2.2, the peak compressive stress at the center splits
into two peaks symmetrically located on the x-axis, as shown in Fig. 7a for α = 2.5 and ε = 1%.
The longitudinal two-peak distribution of the stretch-induced compressive stress is designated as
Phase IV in Fig. 2. Figure 7b shows the transverse stress (σy) along the x-axis (horizontal center
line of the sheet) for α = 2.5. The stress is tensile near the clamped ends, but becomes
compressive approaching the center of the sheet. The magnitude of the peak compressive stress

9
increases with increasing stretch up to ε = 20%. Further increasing the stretch, the magnitude of
the peak compressive stress decreases, as shown in Fig. 7c. Meanwhile, the location of the peak
compressive stress moves towards the center as the stretch increases. At ε = 60%, the two peaks
merge into one at the center of the sheet. Therefore, the distribution pattern of the stretch-
induced compressive stress changes from Phase IV to Phase III. As shown in Fig. 2, the critical
strain for this transition increases with the aspect ratio for 2.2 ≤ α < 3.7. As the applied stretch
continues to increase, a transition from Phase III to Phase I (all-tension) occurs, similar to that
shown in Fig. 6 for Case 3.
2.5 Case 5: high aspect ratio (α ≥ 3.7)
For rectangular sheets with the length-to-width aspect ratio greater than 3.7, the stretch-
induced compressive stress has two peaks symmetrically located on the x-axis (Phase IV) when
the applied stretch is less than a critical strain. Beyond the critical strain, the stress distribution
becomes all tension (Phase I). Unlike in Case 4, the stress pattern transitions directly from Phase
IV to Phase I, without going through Phase III. As shown in Fig. 2, the critical strain for this
transition is nearly independent of the aspect ratio.
With a high aspect ratio, the two peaks of the compressive stress are located far apart
from each other, and the region of compressive stress is split into two separate regions, with
nearly zero σy at the center region of the sheet, as shown in Fig. 8a for α = 5 and ε = 1%. Thus,
the stretch-induced compressive stress is localized near the clamped ends. In between, the stress
state is essentially uniaxial. Indeed, at the limiting case with α >> 1, it is expected that most part
of the sheet is under uniaxial tension with a uniform stress distribution (σy = 0 and σx > 0) except
for the regions near the clamped ends. A similar stress pattern was predicted by Friedl et al.
(2000) for α = 7 and by Benthem (1963) for a semi-infinite strip, both assuming linear elastic

10
properties of the material. As the applied stretch increases, the locations of the peak compressive
stress move towards the center of the sheet, but remain separated. The magnitude of the peak
compressive stress first increases (Fig. 8b) and then decreases (Fig. 8c). Eventually, with the
nominal strain beyond 130%, the stress distribution becomes all tension (Phase I). Since the two
regions of compressive stress are separate with negligible interaction, the behavior becomes
independent of the length (L0) for the rectangular sheets with high aspect ratios.
To summarize the 2-D stress analyses, we plot in Fig. 9a the magnitude of the peak
compressive stress as a function of the nominal strain for the rectangular sheets with four
different aspect ratios. For all cases with α > 1, the magnitude of the peak compressive stress first
increases with the nominal strain and then decreases, with a maximum magnitude at an
intermediate strain. The maximum magnitude of the peak compressive stress increases with the
aspect ratio for 1 < α < 1.8, but decreases for α > 1.8, as shown in Fig. 9b. It may be understood
that the magnitude of the peak compressive stress increases as the two peaks on the vertical
center line (Phase II) merge into one (Phase III) and decreases as the peak split into two on the
horizontal center line (Phase IV). In the case of high aspect ratios (α > 3.7), the peak
compressive stress and its dependence on the nominal strain becomes essentially independent of
the aspect ratio; this can be understood to be the result of separation of the two regions with
localized compressive stress near the clamped ends. As shown in Fig. 2, the critical strain for the
sheet to become all tension (Phase I) increases with the aspect ratio, with a small overshoot
before it saturates at a constant strain (~130%) for high aspect ratios (α ≥ 4). As discussed above,
several types of phase transition for the distribution patterns of stretch-induced compressive

11
stress (σy) can be observed in the diagram (Fig. 2), including II-to-I, III-to-I, IV-to-III, and IV-to-
I.
We close this section by noting two necessary conditions to have stretch-induced
compressive stresses in the rectangular sheets. The first condition is the coupling between the
longitudinal and transverse deformation, and the second is the constraint due to the clamped
ends. In the present study, the longitudinal-transverse coupling arises from the incompressibility
of the hyperelastic material model. Similar results were obtained by Friedl et al. (2000) using a
linear elastic material model with Poisson’s ratio ν = 0.3. On the other hand, if ν = 0, no
compressive stress would be induced, regardless of the aspect ratio or the applied strain and
hence, no wrinkles would form in the stretched sheet. Alternatively, if the constraint at the
clamped ends is relaxed (e.g., allowing end displacement in the transverse direction), a uniaxial
tensile stress in the longitudinal direction would be expected with zero transverse stress and
hence no wrinkles either.
3. Eigenvalue buckling analysis
To determine whether the stretch-induced compressive stress is sufficient to cause
wrinkling of the sheet, we perform an eigenvalue buckling analysis for pre-stretched sheets in
this section, followed by a nonlinear post-buckling analysis in Section 4. In addition to the
length-to-width aspect ratio, the thickness of the sheet becomes important in both the eigenvalue
and post-buckling analyses. In the present study, we take the initial width-to-thickness ratio
(W0/t0) of the sheet to be 1000. For such a thin sheet, the shell elements (S4R) in ABAQUS are
used in the finite element analyses to allow three-dimensional deformation of the sheet. A
uniform mesh similar to the 2-D stress analysis is used for the buckling analysis. It is confirmed

12
that when the out-of-plane displacement is numerically suppressed, the finite element model with
the shell elements correctly reproduces the stress patterns obtained from the 2-D model with the
plane-stress elements in Section 2 (Nayyar, 2010).
To obtain the relevant eigenmodes for stretch-induced wrinkling, a small pre-stretch of
1% is applied in the longitudinal direction before the eigenvalue analysis. For the length-to-width
aspect ratio α < 1.35, no buckling mode with positive eigenvalues can be found under the
prescribed boundary condition. While the stretch-induced compressive stress is present for 1 < α
< 1.35, the magnitude of the compressive stress is low and it is distributed in two small regions
as shown in Fig. 4a for α = 1.1. In general, both the magnitude and the area of the compressive
stresses must be sufficiently large to cause buckling. For α ≥ 1.35, a number of eigenmodes are
obtained for the pre-stretched sheet. Figure 10 shows the first eigenmode for four different aspect
ratios. We note the correlation between the buckling mode shapes and the compressive stress
patterns in Figs. 5-8. In particular, the transition of the compressive stress pattern from Phase II
to III and eventually to IV with increasing aspect ratio is faithfully replicated in the eigenmodes.
For α = 2.5, however, the eigenmode shows apparently a single peak in the center of the sheet,
while the compressive stress has two peaks on the longitudinal axis (Fig. 7). This may be
attributed to the close proximity of the two peaks in the compressive stress pattern. When the
two peaks are sufficiently separated, the eigenmode shows two peaks as well with a relatively
flat region in between, as shown in Fig. 10d for α = 5.
It should be pointed out that the results from the eigenvalue analysis, including both the
eigenmodes and the corresponding eigenvalues, depends sensitively on the width-to-thickness
ratio (W0/t0) of the sheet as well as the applied pre-stretch. For the present study, we focus on the
eigenmodes at a small pre-stretch (1%), which will be used as geometric imperfections in the

13
post-buckling analysis. Due to nonlinearity in both the material behavior and the kinematics, the
eigenvalues do not necessarily predict the critical strain or stress for onset of buckling.
A simplified model was suggested by Friedl et al. (2000) to estimate the critical stress for
wrinkling. Consider a simply supported rectangular plate subject to a uniform biaxial stress with
tension in the x direction and compression in the y direction (see the inset of Fig. 11a). The stress
magnitudes are assumed to be proportional, e.g.,
0<= Cx
y
σ
σ. (1)
The critical longitudinal stress for buckling of such a plate is (Timoshenko and Gere, 1985)
( ) ( )( )
−−
++
−=
222
4222442
2
2
,
2
)1(12ab
ab
ab
cxnCm
mnmn
b
tE
ν
πσ , (2)
where the material is assumed to be linear elastic with Young’s modulus E and Poisson’s ratio ν,
n and m are the numbers of half waves in the x and y directions, respectively. The dimensions of
the plate are: length a, width b, and thickness t. For σx > 0 and C < 0, the critical stress in (2) is
minimized with n = 1 while m varies with the ratio b/a, as shown in Fig. 11a.
As an approximate model, Eq. (2) may be used to qualitatively understand the onset of
stretch-induced wrinkling and the wrinkling modes as well as how they depend on the aspect
ratio and the stretch. While Friedl et al. (2000) assumed the simply supported plate to have the
same dimensions as the end-clamped sheet, we take the plate approximately to be part of the
sheet where the transverse stress (σy) is compressive. Therefore, both the length and the width of
the plate (a and b) vary with the aspect ratio of the original sheet and with the applied strain. The
aspect ratio of the plate (b/a) may be estimated from the stress patterns in Figs. 4-8 as a function
of the aspect ratio. In addition, the stress ratio C also depends on the aspect ratio and the strain in

14
general. The stress ratio C may be estimated from Fig. 9a as a function of the nominal strain for
each aspect ratio.
Taking the stress ratio approximately to be a constant (C = -0.01), the critical stress as
predicted by Eq. (2) is plotted in Fig. 11a as a function of the aspect ratio b/a. The number of
half waves in the transverse direction (m) increases as b/a increases, qualitatively consistent with
the eigenmodes shown in Fig. 10. Note that the aspect ratio b/a for the region of compressive
transverse stress in the end-clamped sheet is larger for α = 1.35 (Fig. 5) than for α = 2 (Fig. 6).
As a result, the number of wrinkles in the eigenmode for α = 1.35 (Fig. 10a) is greater than for α
= 2 (Fig. 10b). For a rectangular sheet of high aspect ratio (α > 3.7), as the stretch-induced
compressive stress splits into two regions, the ratio b/a for each region becomes independent of
the aspect ratio α. However, as shown in Fig. 10d for α = 5, the wrinkles extend beyond the
region of compressive stress, which apparently violates the boundary condition assumed in the
simplified model.
For each m, the critical stress in Eq. (2) is minimized for a particular ratio b/a. It can be
shown that the minimum critical stress is independent of m, as indicated by the horizontal dashed
line in Fig. 11a. For relatively large b/a (~1), the critical stress for onset of wrinkling depends
weakly on the aspect ratio, which is approximately equal to the minimum critical stress, namely
−
−≈
2
2
2
2
,
1
)1(3 C
C
a
tEcx
ν
πσ . (3)
As shown in Fig. 11b, the approximate critical stress in (3) increases as C decreases. The
corresponding critical compressive stress in the transverse direction ( cxcy C ,, σσ = ) increases as
well. As suggested by Fig. 9a, the stress ratio C in the end-clamped rectangular sheet decreases
with the nominal strain for each aspect ratio. By comparing the critical compressive stress ( cy,σ )

15
with the stretch-induced compressive stress ( yσ ), we may predict qualitatively that stretch-
induced wrinkles form at a critical nominal strain (εc1) when cyy ,σσ = . Subsequently, as the
magnitude of yσ increases and then decreases while the magnitude of cy,σ increases, a second
critical nominal strain (εc2) may be predicted, beyond which the stretch-induced compressive
stress drops below the critical stress. Therefore, stretch-induced wrinkles are expected only in
between of the two critical strains (εc1 < ε < εc2). Such a behavior is confirmed by the post-
buckling analysis in Section 4.
As predicted by Eq. (3), the critical stress decreases as the sheet thickness (t) decreases.
On the other hand, the stretch-induced compressive stress as shown in Fig. 9 is independent of
the sheet thickness. By comparing the critical stress with the maximum magnitude of the stretch-
induced compressive stress in Fig. 9b, we classify the sheet thickness into three types, as
indicated by three dashed lines for the critical stresses. First, for a thick sheet, the critical stress is
greater than the stretch-induced compressive stress for all aspect ratios. Thus, the thick sheet
would not wrinkle upon stretching, regardless of the aspect ratio. Second, for a thin sheet, the
stretch-induced compressive stress is greater than the critical stress for aspect ratios within a
window (α1 < α < α2). Third, for a very thin sheet, the stretch-induced compressive stress is
greater than the critical stress for all aspect ratios beyond a critical value. The qualitative
predictions based on the simplified model are confirmed by the post-buckling analysis for the
cases of a thin sheet (W0/t0 = 1000) and a very thin sheet (W0/t0 = 2000) in Section 4.
4. Post-buckling analysis
To perform a post-buckling analysis of the end-clamped rectangular sheet, a small
geometrical imperfection is introduced by using the eigenmodes from the eigenvalue analysis in

16
Section 3. The numerical results in general depend on the number of eigenmodes and their
amplitudes used as the geometrical imperfection (Nayyar, 2010). For the purpose of
convergence, a sufficiently large number of eigenmodes and a sufficiently small amplitude must
be used. In the present study, the first four eigenmodes are used for each sheet, and the amplitude
of imperfection is about 0.1% of the sheet thickness. The RIKS method as implemented in
ABAQUS is employed for the post-buckling analysis.
Figure 12 shows evolution of stretch-induced wrinkles for a rectangular sheet with the
aspect ratio α = 2.5 and W0/t0 = 1000 as the nominal strain increases. Similar wrinkle patterns
were observed in an experiment with polyethylene sheets (Fig. 1b); the details of the experiment
and comparison with the numerical results will be reported in a subsequent work. The out-of-
plane displacement (uz) along the mid-section of the sheet (x = L/2) is plotted in Fig. 13. It is
seen that the wrinkle amplitude grows significantly from ε = 5% to ε = 10%. Subsequently, as the
nominal strain increases further, the wrinkle amplitude decreases and eventually all wrinkles are
nearly flattened at ε = 30%. Similar results are obtained for different aspect ratios, as shown in
Fig. 14 for the evolution of wrinkle amplitudes, where the amplitude is taken as
[ ] 2/)min()max( zz uuA −= from the numerical results. Such a wrinkling behavior is in drastic
contrast with the scaling analysis by Cerda and Mahadevan (2003), which predicted the wrinkle
amplitude to increase monotonically with increasing strain, i.e., ( ) 4/12/1~ εLtA . On the other
hand, as discussed in Section 3, by comparing the evolution of the stretch-induced compressive
stress in Fig. 9a with the critical stress in Fig. 11b, the stretch-induced wrinkles are qualitatively
predicted in between of two critical strains (εc1 < ε < εc2) and hence non-monotonic scaling with
the strain for the wrinkle amplitude. Figure 14 shows that the critical strains depend on the aspect

17
ratio of the sheet. Similar evolution of the wrinkle amplitude was predicted by Zheng (2009). By
a dimensional consideration, the wrinkle amplitude may be written as
( )000 /,,/ tWftA αε= , (4)
which is generally more complicated than the simple scaling relation. As shown in Fig. 14, for
the same width and thickness, the wrinkle amplitude first increases with the length and then
decreases, with the maximum amplitude at α = 2.5. In other words, the wrinkle amplitude does
not increase monotonically with increasing length (L0) of the sheet. We note that such a behavior
may not be attributed simply to the nonlinear elastic material model used in the present study.
The results are qualitatively similar if a linear elastic material model is used (Nayyar, 2010).
As shown in Fig. 12, the wrinkles are largely confined in the central region of the sheet
where the transverse stress is compressive. However, the wrinkling region may not be exactly the
region with the compressive stress by the 2-D stress analysis in Section 2 (Fig. 7 for α = 2.5). As
shown by Stern and Hedgepeth (1961), for a stretched membrane with a hub subject to torsion,
the wrinkles could extend far beyond the compression region in a plate under same loading,
which they attributed to the “over contraction” in the direction perpendicular to the wrinkling of
the membrane. In the tension-field theory, the wrinkling region may be determined by replacing
Poisson’s ratio with an arbitrary function to result in a zero principal stress perpendicular to the
wrinkles, rendering a different 2-D boundary value problem for the plate.
Figure 13 shows that the sheet remains flat near the free edges and the wrinkling profiles
are modulated by a long-wavelength mode, similar to the prediction by Puntel et al. (2010). We
note that while the number of wrinkles in the sheet remains nearly a constant, the wrinkle
wavelength, which may be measured from crest to crest, decreases with increasing strain. The
18
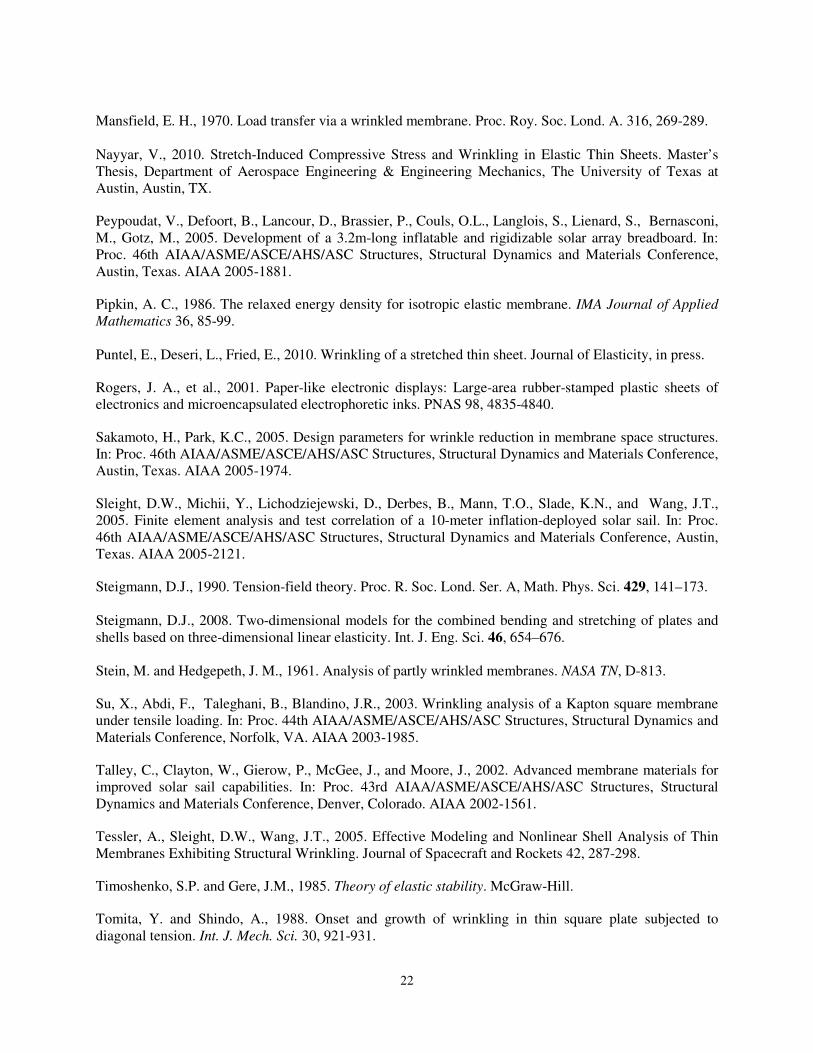
scaling analysis by Cerda and Mahadevan (2003) predicted that the wrinkle wavelength,
( ) 4/12/1~ −ελ Lt , or equivalently ( ) ( ) 4/12/12/1
//~/ −−ελ tWWLW in a dimensionless form. Figure
15 plots the normalized wrinkle wavelength ( 0/Wλ ) versus ( ) ( ) 4/12/1
00
2/1
00 // −εWtWL . Two sets
of numerical results are presented in Fig. 15, for W0/t0 = 1000 (open symbols) and 2000 (filled
symbols), respectively. For each set, the wavelengths are determined from the post-buckling
analysis for three different aspect ratios (α = 2, 2.5, and 2.7) and at different nominal strains.
Evidently, the numerical results follow the prediction by the scaling analysis reasonably well; the
latter is plotted as the dashed line with a slope depending on Poisson’s ratio (taken to be 0.5
here). The experimental results reported by Cerda et al. (2002) also indicated that the wrinkle
wavelength followed the scaling relation. It may thus be concluded that the scaling analysis
offers a satisfactory prediction of the wrinkle wavelength, but less so for the wrinkle amplitude.
Furthermore, it is found that, for W0/t0 = 1000, the stretch-induced wrinkle amplitude is
negligibly small for the sheets with the length-to-width aspect ratio smaller than 1.7 or larger
than 3.5. Only when 1.7 < α < 3.5 is the stretch-induced compressive stress sufficiently large to
cause wrinkling of the sheet. For each aspect ratio in this range, the lower and upper critical
strains are determined from the post-buckling analysis, defining a wrinkling region in the α-ε
plane, as shown in Fig. 16a. By decreasing the sheet thickness or increasing the ratio W0/t0, the
critical stress for wrinkling drops and the wrinkling region in the α-ε plane expands. As shown in
Fig. 16a for W0/t0 = 2000, the lower critical strain for onset of wrinkling is lower, whereas the
upper critical strain for flattening is higher. Figure 16b shows the maximum wrinkle amplitude
as a function of the aspect ratio for W0/t0 = 1000 and 2000. Referring to the classification
illustrated in Fig. 9b, the sheet with W0/t0 = 1000 is thin and the sheet with W0/t0 = 2000 is very
thin. Therefore, for the latter case, stretch-induced wrinkling is predicted for α > 1.2, with no

19
upper bound for the aspect ratio of the sheet. In all cases, the wrinkling region in the α-ε plane is
necessarily within the region of the stretch-induced compressive stress. The dashed line in Fig.
16a is the boundary between the regions with and without compressive stresses (Fig. 2).
We note in Fig. 16a that both the lower and upper critical strains depend on the in-plane
aspect ratio of the sheet for W0/t0 = 1000. For W0/t0 = 2000, the lower critical strain is nearly
independent of the aspect ratio, while the upper critical strain first increases and then decreases,
eventually becoming independent of the aspect ratio for α > 5. The dependence of the upper
critical strain on the aspect ratio is similar to that of the maximum compressive stress in Fig. 9b,
and the dependence of the maximum wrinkle amplitude for the very thin sheets (W0/t0 = 2000) in
Fig. 16b is similar too. The results shown in Fig. 16 suggest that stretch-induced wrinkling may
be suppressed (1) by increasing the sheet thickness; (2) by designing the in-plane aspect ratio so
that it is out of the wrinkling window in the case of a thin sheet; or (3) by stretching beyond the
upper critical strain.
5. Summary
This paper presents a numerical study on stretch-induced wrinkling of hyperelastic
rectangular sheets under uniaxial stretching with two clamped ends. As a prerequisite for
wrinkling, a two-dimensional stress analysis is performed first under the plane-stress condition to
determine stretch-induced compressive stresses in the transverse direction. Depending on the
length-to-width aspect ratio of the sheet and the applied tensile strain, four different distribution
patterns of the stretch-induced compressive stresses are predicted and summarized in a phase
diagram. Next, eigenmodes of buckling are predicted by an eigenvalue analysis for pre-stretched
sheets, which are used as geometric imperfections for the post-buckling analysis. A simplified

20
plate model is adopted to estimate the critical condition for stretch-induced wrinkling, which
qualitatively predicts wrinkling between two critical strains and the effect of sheet thickness.
Finally, we examine the evolution of stretch-induced wrinkles by a nonlinear post-buckling
analysis. It is found that the wrinkle wavelength decreases with increasing strain, in good
agreement with the scaling analysis of Cerda and Mahadevan (2003). However, in contrast to the
prediction of the scaling analysis, the wrinkle amplitude exhibits a non-monotonic dependence
on the tensile strain with a lower critical tensile strain for onset of wrinkling and an upper critical
tensile strain for wrinkle flattening. Based on the numerical results, it is suggested that stretch-
induced wrinkling may be suppressed either by geometric design of the sheet (length-to-width
aspect ratio and thickness) or by moderately large stretching beyond the upper critical strain. The
numerical results reported in the present study will be compared to experimental measurements
in a subsequent study.
Acknowledgments
VN and RH gratefully acknowledge financial supports by National Science Foundation (Grant
No. 0547409).

21
References
ABAQUS, 2008. Theory and User’s Manual, Version 6.8.
Alder, A. L., Mikulas, M. M., and Hedgepeth, J. M. (2000). Static and dynamic analysis of partially
wrinkled membrane structures. In Proc. 41st AIAA/ASME/ASCE/AHS/ASC Structures, Structures
Dynamics, and Material Conference and Exhibit. Atlanta. AIAA-2000-1810.
Benthem, J.P., 1963. A Laplace transform method for the solution of semi-infinite and finite strip
problems in stress analysis. Q. J. Mech. Appl. Math. 16, 413-429.
Cerda, E., Mahadevan, L., 2003. Geometry and Physics of Wrinkling. Physical Review Letters 90,
074302.
Cerda, E., Ravi-Chandar, K., Mahadevan, L., 2002. Wrinkling of an elastic sheet under tension. Nature
419, 579-580.
Coman, C.D., 2007. On the applicability of tension field theory to a wrinkling instability problem. Acta
Mech. 190, 57–72.
Coman, C.D., Haughton, D. M., 2006. Localized wrinkling instabilities in radially stretched annular thin
films. Acta Mech. 185, 179-200.
Danielson, D.A., Natarajan, S., 1975. Tension field theory and the stress in stretched skin. J. Biomech. 8,
135–142.
Diaby, A., Le van, A., Wielgosz, C., 2006. Buckling and wrinkling of prestressed membranes. Finite
Elements in Analysis and Design 42, 992-1001.
Friedl, N., Rammerstorfer, F.G., Fisher, F.D., 2000. Buckling of stretched strips. Computers and
Structures 78, 185-190.
Iwasa, T., Natori, M.C., Higuchi, K., 2004. Evaluation of tension field theory for wrinkling analysis with
respect to the post-buckling study. Journal of Applied Mechanics 71, 532-540.
Jacques, N., Potier-Ferry, M., 2005. On mode localisation in tensile plate buckilng. C. R. Mecanique 333,
804–809.
Jenkins, C.H., Haugen, F., Spicher, W.H., 1998. Experimental measurement of wrinkling in membranes
undergoing planar deformation. Experimental Mechanics 38, 147-152.
Lee, K., Lee, S.W., 2002. Analysis of gossamer space structures using assumed strain formulation solid
shell elements. In: Proc. 43rd AIAA/ASME/ASCE/AHS/ASC Structures, Structural Dynamics and
Materials Conference, Denver, Colorado. AIAA 2002-1559.
Leifer, J., Belvin, W. K., 2003. Prediction of wrinkle amplitudes in thin film membranes using finite
element modeling. 44th AIAA/ASME/ASCE/AHS/ASC Structures, Structural Dynamics and Materials
Conference, Norfolk, VA. AIAA 2003-1983.
Liu, X., Jenkins, C. H. and Schur, W. W. (2001). Large deflection analysis of pneumatic envelopes using
a penalty paramter modified material model. Finite Elements in Analysis and Design 37, 233-251.
22
Mansfield, E. H., 1970. Load transfer via a wrinkled membrane. Proc. Roy. Soc. Lond. A. 316, 269-289.
Nayyar, V., 2010. Stretch-Induced Compressive Stress and Wrinkling in Elastic Thin Sheets. Master’s
Thesis, Department of Aerospace Engineering & Engineering Mechanics, The University of Texas at
Austin, Austin, TX.
Peypoudat, V., Defoort, B., Lancour, D., Brassier, P., Couls, O.L., Langlois, S., Lienard, S., Bernasconi,
M., Gotz, M., 2005. Development of a 3.2m-long inflatable and rigidizable solar array breadboard. In:
Proc. 46th AIAA/ASME/ASCE/AHS/ASC Structures, Structural Dynamics and Materials Conference,
Austin, Texas. AIAA 2005-1881.
Pipkin, A. C., 1986. The relaxed energy density for isotropic elastic membrane. IMA Journal of Applied
Mathematics 36, 85-99.
Puntel, E., Deseri, L., Fried, E., 2010. Wrinkling of a stretched thin sheet. Journal of Elasticity, in press.
Rogers, J. A., et al., 2001. Paper-like electronic displays: Large-area rubber-stamped plastic sheets of
electronics and microencapsulated electrophoretic inks. PNAS 98, 4835-4840.
Sakamoto, H., Park, K.C., 2005. Design parameters for wrinkle reduction in membrane space structures.
In: Proc. 46th AIAA/ASME/ASCE/AHS/ASC Structures, Structural Dynamics and Materials Conference,
Austin, Texas. AIAA 2005-1974.
Sleight, D.W., Michii, Y., Lichodziejewski, D., Derbes, B., Mann, T.O., Slade, K.N., and Wang, J.T.,
2005. Finite element analysis and test correlation of a 10-meter inflation-deployed solar sail. In: Proc.
46th AIAA/ASME/ASCE/AHS/ASC Structures, Structural Dynamics and Materials Conference, Austin,
Texas. AIAA 2005-2121.
Steigmann, D.J., 1990. Tension-field theory. Proc. R. Soc. Lond. Ser. A, Math. Phys. Sci. 429, 141–173.
Steigmann, D.J., 2008. Two-dimensional models for the combined bending and stretching of plates and
shells based on three-dimensional linear elasticity. Int. J. Eng. Sci. 46, 654–676.
Stein, M. and Hedgepeth, J. M., 1961. Analysis of partly wrinkled membranes. NASA TN, D-813.
Su, X., Abdi, F., Taleghani, B., Blandino, J.R., 2003. Wrinkling analysis of a Kapton square membrane
under tensile loading. In: Proc. 44th AIAA/ASME/ASCE/AHS/ASC Structures, Structural Dynamics and
Materials Conference, Norfolk, VA. AIAA 2003-1985.
Talley, C., Clayton, W., Gierow, P., McGee, J., and Moore, J., 2002. Advanced membrane materials for
improved solar sail capabilities. In: Proc. 43rd AIAA/ASME/ASCE/AHS/ASC Structures, Structural
Dynamics and Materials Conference, Denver, Colorado. AIAA 2002-1561.
Tessler, A., Sleight, D.W., Wang, J.T., 2005. Effective Modeling and Nonlinear Shell Analysis of Thin
Membranes Exhibiting Structural Wrinkling. Journal of Spacecraft and Rockets 42, 287-298.
Timoshenko, S.P. and Gere, J.M., 1985. Theory of elastic stability. McGraw-Hill.
Tomita, Y. and Shindo, A., 1988. Onset and growth of wrinkling in thin square plate subjected to
diagonal tension. Int. J. Mech. Sci. 30, 921-931.

23
Wagner, H., 1929. Flat sheet metal girder with very thin metal web. Zeitschrift f¨ur Flugtechnik und
Motorluftschiffahrt, 20, 200-314.
Wang, X., Zheng, W., Hu, Y.R., 2007. Active Flatness Control of Membrane Structures Using Adaptive
Genetic Algorithm. Proc. of SPIE, vol. 6572, 652704.
Wong, Y.W., Pellegrino, S., 2006a. Wrinkled membranes. Part I: Experiments. Journal of Mechanics of
Materials and Structures 1, 1-23.
Wong, Y.W., Pellegrino, S., 2006b. Wrinkled membranes. Part II: Analytical models. Journal of
Mechanics of Materials and Structures 1, 25-59.
Wong, Y.W., Pellegrino, S., 2006c. Wrinkled membranes. Part III: Numerical simulations. Journal of
Mechanics of Materials and Structures 1, 61-93.
Wu, C.H., 1978. Nonlinear wrinkling of nonlinear membranes of revolution. J. Appl. Mech. 45, 533–538.
Zheng, L., 2009. Wrinkling of Dielectric Elastomer Membranes. PhD Thesis, California Institute of
Technology, Pasadena, CA.

24
(a)
(b)
Figure 1: (a) Schematic illustration of a rectangular sheet with two clamped-ends, subject to
uniaxial stretch. (b) An optical image of a wrinkled polyethylene sheet under stretch (ε ~ 10%).
W0
L0 = αW0
L
y
x

25
0 0.5 1 1.5 2 2.5 3 3.5 4 4.5 50
0.5
1
1.5
Nom
inal str
ain
, ε
Aspect ratio, α = L0/W
0
Figure 2: A phase diagram for stretch-induced compressive stress patterns in end-clamped rectangular
sheets.
IV
I
III II

26
(a)
(b)
-0.5 -0.4 -0.3 -0.2 -0.1 0 0.1 0.2 0.3 0.4 0.5-1
0
1
2
3x 10
-3
y/W0
Tra
nsvers
e s
tress,
σy /
E
ε = 1%
ε = 3%
ε = 5%
Figure 3: (a) Contour plots of the stretch-induced transverse stress (σy) for α = 1 and ε = 1%,
showing no compressive stress; (b) Distribution of the transverse stress along the vertical center
line of the sheet under different strains.

27
(a)
(b)
-0.5 -0.4 -0.3 -0.2 -0.1 0 0.1 0.2 0.3 0.4 0.5-2
0
2
4
6
8
10x 10
-4
y/W0
Tra
nsvers
e s
tress,
σy /
E
ε = 1%
ε = 3%
ε = 5%
Figure 4: (a) Contour plots of stretch-induced transverse stress (σy) for α = 1.1 and ε = 1%,
showing the compressive stress in two separate regions; (b) Distribution of the transverse stress
along the vertical center line of the sheet under different strains.

28
(a)
-0.5 -0.4 -0.3 -0.2 -0.1 0 0.1 0.2 0.3 0.4 0.5-4
-3
-2
-1
0
1
2x 10
-4
y/W0
Tra
nsvers
e s
tress,
σy /
E
ε = 1%
ε = 3%
ε = 5%
-0.5 -0.4 -0.3 -0.2 -0.1 0 0.1 0.2 0.3 0.4 0.5-4
-2
0
2
4
6x 10
-4
y/W0
Tra
nsvers
e s
tress,
σy/E
ε = 5%
ε = 10%
ε = 13%
ε = 15%
Figure 5: (a) Contour plots of stretch-induced transverse stress (σy) for α = 1.35 and ε = 1%,
showing only the compressive stress region; (b) and (c) Distributions of the transverse stress
along the vertical center line of the sheet under increasing nominal strains.
(b) (c)

29
(a)
-0.5 -0.4 -0.3 -0.2 -0.1 0 0.1 0.2 0.3 0.4 0.5-15
-10
-5
0
5x 10
-4
y/W0
Tra
nsvers
e s
tress,
σy /
E
ε = 1%
ε = 5%
ε = 10%
ε = 20%
-0.5 -0.4 -0.3 -0.2 -0.1 0 0.1 0.2 0.3 0.4 0.5-15
-10
-5
0
5x 10
-4
y/W0
Tra
nsvers
e s
tress,
σy /
E
ε = 20%
ε = 30%
ε = 40%
ε = 50%
ε = 64%
Figure 6: (a) Contour plots of stretch-induced transverse stress (σy) for α = 2 and ε = 1%,
showing only the compressive stress region; (b) and (c) Distributions of the transverse stress
along the vertical center line of the sheet under increasing nominal strains.
(b) (c)

30
(a)
0 0.2 0.4 0.6 0.8 1-1
-0.5
0
0.5
1x 10
-3
x/L0
Tra
nsvers
e s
tress,
σy/E
ε = 1%
ε = 5%
ε = 10%
ε = 20%
0 0.2 0.4 0.6 0.8 1-1
-0.5
0
0.5
1x 10
-3
x/L0
Tra
nsvers
e s
tress,
σy /
E
ε = 20%
ε = 30%
ε = 40%
ε = 50%
ε = 60%
Figure 7: (a) Contour plots of stretch-induced transverse stress (σy) for α = 2.5 and ε = 1%,
showing only the compressive stress region; (b) and (c) Distributions of the transverse stress
along the horizontal center line of the sheet under increasing nominal strains.
(b) (c)

31
(a)
0 0.2 0.4 0.6 0.8 1-1
-0.5
0
0.5
1x 10
-3
x/L0
Tra
nsvers
e s
tress,
σy /
E
ε = 1%
ε = 5%
ε = 10%
ε = 20%
0 0.2 0.4 0.6 0.8 1-1
-0.5
0
0.5
1x 10
-3
x/L0
Tra
nsvers
e s
tress,
σy /
E
ε = 20%
ε = 30%
ε = 40%
ε = 50%
ε = 60%
Figure 8: (a) Contour plots of stretch-induced transverse stress (σy) for α = 5 and ε = 1%,
showing only the compressive stress region; (b) and (c) Distributions of the transverse stress
along the horizontal center line of the sheet under increasing nominal strains.
(b) (c)

32
0 0.2 0.4 0.6 0.8 10
0.5
1
1.5x 10
-3
Nominal Strain, ε
Maxim
um
com
pre
ssiv
e s
tress
α = 1.35
α = 2
α = 2.5
α = 5
1 2 3 4 50
0.5
1
1.5x 10
-3
Maxim
um
com
pre
ssiv
e s
tress
L0/W
0
Figure 9: (a) Variation of the maximum compressive stress magnitude in the rectangular sheets under
increasing stretch for different aspect ratios; (b) Maximum magnitude of the stretch-induced compressive
stress as a function of the aspect ratio. Dashed lines indicate the critical buckling stresses for different
sheet thicknesses.
thick
thin
Very thin
(a)
(b)

33
(a)
(b)
(c)
(d)
Figure 10: The first eigenmode for end-clamped rectangular sheets with 1% pre-stretch, obtained
from eigenvalue analysis for different aspect ratios. (a) α = 1.35; (b) α = 2; (c) α = 2.5; (d) α = 5.

34
0 0.2 0.4 0.6 0.8 13
4
5
6
7
8x 10
4
Norm
aliz
ed c
ritical str
ess
σx,c
b/a
m = 1
m = 2
m = 3
0 0.02 0.04 0.06 0.08 0.110
1
102
103
104
105
106
107
|C|
Norm
aliz
ed c
ritical str
ess
σx,c
-σy,c
Figure 11. The critical stress for a simply supported rectangular plate: (a) dependence on the
ratio b/a for C = -0.01; (b) dependence on the ratio C for relatively large b/a. The stress
magnitude is normalized by
2
2
2
)1(12
− a
tE
ν
π. The dashed line in (a) indicates the minimum
critical stress given by Eq. (3).
σx
σy = Cσx
a
b
(a)
(b)

35
(a)
(b)
(c)
(d)
Figure 12: Evolution of wrinkles in an end-clamped rectangular sheet with an aspect ratio α = 2.5
and W0/t0 = 1000: (a) ε = 5%; (b) ε = 10%; (c) ε = 20%; (d) ε = 30%.

36
-0.5 -0.4 -0.3 -0.2 -0.1 0 0.1 0.2 0.3 0.4 0.5-4
-3
-2
-1
0
1
2
3
4
y / W0
uz / t 0
ε = 5%
ε = 10%
ε = 15%
ε = 20%
ε = 25%
ε = 30%
Figure 13: Out-of-plane displacement along the mid-section of the sheet with α = 2.5 and W0/t0 =
1000 under increasing nominal strain.

37
0 0.1 0.2 0.3 0.40
0.5
1
1.5
2
2.5
3
3.5
Nominal strain, ε
Wrinkle
am
plit
ude, A
/ t 0
α = 1.8
α = 2
α = 2.5
α = 3
α = 3.2
Figure 14: Stretch-induced wrinkle amplitude as a function of the nominal strain for the end-clamped
rectangular sheets with different aspect ratios. The width-to-thickness ratio (W0/t0) is 1000 for all cases.
38
0 0.02 0.04 0.06 0.08 0.1 0.120
0.05
0.1
0.15
0.2
0.25λ
/ W
0
α1/2(W
0/t
0)-1/2
ε-1/4
α = 2
α = 2.5
α = 2.7
y = 2.05x
Figure 15. Normalized wrinkle wavelength from the post-buckling analysis, in comparison with the
prediction by a scaling analysis (dashed line). The open symbols show numerical results for W0/t0 = 1000,
and the filled symbols for W0/t0 = 2000.

39
1 2 3 4 5 6 7 8 9 100
0.1
0.2
0.3
0.4
0.5
0.6
Aspect ratio, L0/W
0
No
min
al s
tra
in, ε
W0/t
0 = 2000
W0/t
0 = 1000
1 2 3 4 5 6 7 8 9 100
2
4
6
8
10
12
Aspect ratio, L0/W
0
Ma
xim
um
wrin
kle
am
plit
ud
e, A
max /
t 0
W0 /t
0 = 1000
W0 /t
0 = 2000
Figure 16: (a) The wrinkling regions in the α-ε plane for two different width-to-thickness ratios. The
dashed line is the boundary for the region with stretch-induced compressive stress (phases II-IV in Fig.
2); (b) The maximum wrinkle amplitude as a function of the aspect ratio.
(a)
(b)
No
co
mpre
ssiv
e st
ress


![Welcome []€¦ · wrinkles, stretch marks and acne scarring. No additional time $40 BIOMOLECULAR IMASK This next-generation sheet mask is constructed from a unique, patented hydrogel](https://img.pdfslide.us/doc/110x75/5f0d9ebd7e708231d43b417a/welcome-wrinkles-stretch-marks-and-acne-scarring-no-additional-time-40-biomolecular.jpg)