Embed Size (px)
Citation preview

© Oliver Wyman | SIN-ASP10501-041FINANCIAL SERVICES
STRESS TESTING
16 AUGUST 2012
Yen Chu Cheng Senior Manager
Jason EkbergSenior Manager

1© Oliver Wyman | SIN-ASP10501-041 1
Main points we want to get across today
• The crisis has highlighted the shortcomings in stress testing frameworks, particularly in how they are generated and how they are used by management
• Generating effective scenarios requires a robust data driven process and lateral thinking, e.g. reverse stresses – expert insight is essential to ensure business relevance
• Scenario-based goes beyond risk management and should support business decision making and contingency planning – as well as a wide range of management processes
• Senior management and business buy-in remains key to derive maximum use of stress testing frameworks and planning

Lessons learned from the crisisSection 1

33© Oliver Wyman | SIN-ASP10501-041
Stress and scenario testing is highlighted by many as a gap in banks’ risk management frameworks
• Industry difficulties attributed in part to misunderstanding the impact of “events”– Appropriate stresses not considered– Impact of stresses not well understood
• Stress-testing near the top of the agenda for regulators, rating agencies and analysts– Recent BIS and UK FSA publications – Government support design/execution– Broker reports and valuations
• Economic outlook particularly uncertain, with uncertainty underscoring the need for stress testing insights– Characteristics of the current recession unclear
(deflation, hyper-inflation…?)– Post crisis regulatory and competitive
landscape unclear
• Few executives regularly utilise stress/scenario results in decision making– Limited value realised from current capabilities
• Most institutions lack elements of analytical “technology”– Most have some siloed models
(e.g. liquidity stresses)…– …though few meaningfully model the impact
of scenarios– Many miss a holistic view of all risks/
products/businesses
• Substantial ambiguity about required or best practice– Regulatory requirements– Processes and what to do with the insights provided
Lower recent defaults/losses in many of the Asia Pacific portfolios in recent years highlights the importance of forward looking, rather than backward looking, metrics
Need for stress-testing highlighted Many institutions fall short of requirements

44© Oliver Wyman | SIN-ASP10501-041
Challenge: There is significant ambiguity over issues that stress testing should cover, and the role in the organisation
P&L B/S
Impacts
Solvency Etc.
Group
Division/BU
Deal/product
Models don’t “sum up” directly
Illustrative stress testing framework
• Numerous interpretations of– “Sensitivity analysis”– “Stress testing”– “Scenario planning”– Etc.
• Differing views over stress testing’s role in– Risk management – Strategic/business
management– Regulatory compliance– Target setting…

55© Oliver Wyman | SIN-ASP10501-041
It is important to get the “big picture” right beyond the individual scenario methodology and definitions
Sensitivity tests Scenario tests
• Defined by shift in underlying variable
• Relatively easy to define and implement– Often used at trading desk and
business line level
• Shifts in several variables have to be used in order to “simulate” historical events
• Correct use of stressed correlations between risk types is crucial– Difficult to parameterise
Historical scenarios• Choice of different scenarios that
are most relevant for different parts of the portfolio
• Coverage at least of major risks in the portfolio
Hypothetical scenarios• More relevant to portfolio and
current market environment than historical scenarios
• Labour intensive
• Involve more judgement– Usually created with input
from experts- Management- Business level- Macro-economic models
• Get high level estimate of likelihood of each scenario
• Ensure coverage of all risk types that the bank faces
• Ensure coverage of major portfolios by dedicated elements in each stress scenario
Trade-off of comprehensibility vs. realism is crucial – get the “big picture” of scenarios right
Expo
sure
Rating class
0
5
10
15
20
25
1 2 3 4 5 6 7 8 9 10 11 12 13 14 15
Hybrid scenarios• Hypothetical scenarios that are based on historical scenarios
– Adjusted historical scenarios– Price sensitivities are set using historical events– Effects of events on market liquidity are set using historical scenarios
Black Monday Oct. 1987
Asian crisis 1997
9/11 Terrorist attacks
Global credit crisis 2008 – onwards

66© Oliver Wyman | SIN-ASP10501-041
Historical stress testing framework Emerging stress testing framework
• Range of scenarios considered– Often based on statistical intervals (“1 in 25”)– Consideration of historical events (“1990’s recession”)– Sets of events deemed by management to be severe
but plausible
• Scope– Siloed approach to addressing each risk type– “Mechanical” approach taken by Risk Management,
often based on historical relationships and events
• Governance and use– Risk management the primary audience, with the aim of
meeting Basel II/Pillar II challenges– Limited use in business processes or decision making
• Practical approach– Ad hoc analysis by Group Risk– Conducted in isolation from many other risk
management processes
• Range of scenarios considered– Less focus on statistical/historical relationships – Focus on forward-looking and creative challenges– Reverse stress-tests (i.e. scenarios that break the
business model)
• Scope– Holistic view of risks, business and threat types, with
particular focus on liquidity and reputation– Focus on “contagion”, both within the Group and across
the broader industry– Increased input from experts across a range of
business disciplines
• Governance and use– Board level issue for debate– Consideration of scenario impacts across a broad range
of processes (e.g. contingency planning)
• Practical approach– Business-as-usual process, embedded in regular
reporting and strategy development
Lower recent defaults/losses in many of the Asia Pacific portfolios in recent years highlights the importance of forward looking, rather than backward looking, metrics
The industry has begun to address challenges across four key areasPast stress testing framework vs. emerging framework

77© Oliver Wyman | SIN-ASP10501-041
UseEnsuring that results drive business decisions
AnalyticsModelling the impact of stresses
Scenario generation Defining and agreeing stresses
Data feeds
Volumeand margin trends
Loans ___________AUM ___________… ___________
Profitand loss
BalanceSheet
Stress testing framework
To create real impact from stress testing while meeting compliance goals, processes and analytics must be addressed simultaneously…
• Identify relevant risks, contagions and concentrations
• Agree scenario sets that challenge conventional wisdom
• Assess impact of scenarios on businesses
• Enrich current measures and metrics (e.g. Capital, earnings…)
• Develop mitigation techniques and contingent strategies
• Link into risk appetite, monitoring and forecasting
Responsibility: regulators, government and all members of institutions
Responsibility: risk, finance and treasury Responsibility: executives and managers
Feedback loop
Threat scenariosEARNINGS at Risk CAPITAL at Risk
10% 0%33%
R A G
EaRAFR/EC (%)(% Expec Earnings) 110%
Current
A GR
100%
Equity index drops 15%
Yield curve down 2%
Housing market falls 10%
Lapse rate doubles
Largest single name defaults
Natural catastrophe
Equity index drops 15%
Yield curve down 2%
Housing market falls 10%
Lapse rate doubles
Largest single name defaults
Natural catastrophe
Breadth
Duration
Severity
Scenario 5
Scenario 6
Scenario 3
Scenario 1 Scenario 2Scenario 4

88© Oliver Wyman | SIN-ASP10501-041
• Developing a set of stresses that meet contradictory pressures…– Identify specific risks, concentrations
and contagions– Provide comparability
through time– Account for current macro conditions
• …while avoiding– Production of an unwieldy large set
of scenarios– “Group think” in scenario development
• Generating buy-in and ensuring scenarios address the next banking crisis
• Develop strategies considering a range of possible scenarios– Position for upside, limit downside– Link into planning process
• Develop contingent strategies to gain early mover advantage– e.g. Macro hedging
• Monitor situation and use scenarios for short term forecasting
• Link scenarios into risk appetite
• Assess the impact of scenarios across the full range of metrics– Funding and capital impact– Portfolio specific outcomes– New business margin
and volumes
• Ensure analytics are flexible enough to model strategic choices– e.g. Impact of changing
credit policies
• Interpreting and explaining key results and issues (e.g. Capital, earnings...)
Major challenges of stress testing
…However, this is not without challenges along each step of the way
UseEnsuring that results drive business decisions
AnalyticsModelling the impact of stresses
Scenario generation Defining and agreeing stresses

99© Oliver Wyman | SIN-ASP10501-041
Balance sheet
“How will the structure (term, mix and availability) of liabilities evolve?”
“How can asset and liability contagion be meaningfully modelled?”
“What equity resources will be available (internal and external)?”
P&L and link to balance sheet
“How will components of the P&L change?”
“How do the P&L and on/off balance sheet items interact through time?”
Volumes and margins
“How will business fundamentalsbe impacted?”
Volumesand margins trends
Loans ___________AUM ___________… ___________
Profitand loss
Balancesheet
Deposits
Int mar
Long term debt
Equity
AFS
Loansto cost
Immob & goodwill
Traded
Off balance sheet
Comm
S/T debt
“What will the impact on newvolume and renewals and be?”
Methodology should provide comprehensive output covering P&L, balance sheet, volumes and margins on (re-) underwriting

Generating scenariosSection 2

1111© Oliver Wyman | SIN-ASP10501-041
• Shock in early 1970s resulted in over-supply from Oil companies– Steady 6% p.a. growth of 1960s built into
supply plans– Slow to react to paradigm change
• Shell had begun to use scenarios in the 1960s, including a scenario that simulated a lasting reduction in demand and Middle Eastern political interference
• As a result, when the macro-economy began to mirror this scenario, it was able to change its plans ahead of the rest of the market– Avoided over-supply problems of its competitors
• Shell continues to use scenario planning as a steering tool– Current scenarios include significant political shift
towards renewable energy– Scenarios have a tangible impact on the business
strategies developed, leaving it better prepared for macro changes
Oil Capacity and Demand 1965–1985Industry slow to react to paradigm change
0
10
20
30
40
50
60
70
80
90
1965
1967
1969
1971
1973
1975
1977
1979
1981
1983
1985
Mill
ions
of b
arre
ls/d
ay
Oil Consumption Refinery capacity
Source: BP Statistical Review 2008
Eight year lag
Few Financial Services companies have fully realised the benefit of scenario based planning, though in other industries benefits have been made clear
Case study: Shell and the 1970’s oil crisis

12© Oliver Wyman | SIN-ASP10501-041 12
To maximize the value of stress testing, we propose using a five step iterative process
Draw a coherent and plausible story that would impact the activity of the Bank
Example“House prices fall 40%”
Historical and academic theory analysis to calculate interconnection between risk drivers
ExampleHouse prices fall 40%, what happens to GDP, interest rates, unemployment, stock markets…
Challenge historical relationships before scenarios are finalised. Incorporate• Executives’ opinions on changing relationships• Specific experts’ inputs
All relevant factors are detailed and quantified
Running the model the effects of the scenario on the Bank are quantified
Complete scenario
Expertoverlay
Risk drivers dynamics
High levelstory
Impact onthe Bank

13© Oliver Wyman | SIN-ASP10501-041 13
• Stress scenarios should be coherent big picture “stories” and forecast all relevant risk drivers
• One should operate a library of standard stress tests complemented with a few, ad hoc scenarios and reverse stress tests indicating at which severity the bank breaks
• Scenarios should be generated starting from a blend of historical and hypothetical scenarios: Key is to parameterize all relevant risk drivers
• Reverse Stress testing provides the reference point what “we’re betting the bank on” –Regulators are pushing it as it avoids the tedious compromises on the appropriate severity of a scenario
• Non-financial risks should also be considered: both as standalone scenarios and as part of the broader scenario
Scenario definition – Key insightsDraw a coherent high level story, make it severe, make it complete

1414© Oliver Wyman | SIN-ASP10501-041
Best practice scenario generation is an iterative process, including a range of sources of scenarios that aligned to business and economic uncertainties
Scenario taxonomy and examples• Scenarios taxonomy must cover relevant threats and opportunities – Constant issues (to allow through-time comparison)– Confidence interval based (reg. requirement)– “Ad hoc” investigation of specific current concerns– Reverse stress tests – Etc.
• Scenario discovery should include feedback from regular processes (e.g. planning/budgeting rounds, risk appetite setting etc.)
• Numerous stakeholders included (Group Economics, Risk, Finance, Business leaders etc.)
• Scenarios reconsidered/re-designed after each round
Economic scenarios
• Macro economic possibilities • Economic “shock” impacts
• Deflation/hyper inflation• Currency collapse
External changes
• Regulatory initiatives • Market/competitive changes
• Capital increase• Ban on short selling
Market events
• Key markets shut down• Volatility in specific areas
• FX market halts• Gold market
Internal sensitivities
• Known concentrations, issues and sensitivities
• One off events
• Default of largest name• Drop in real
estate market
Aim is not to predict the future. Instead to highlight a set of issues and facilitate preparation for the unexpected

1515© Oliver Wyman | SIN-ASP10501-041
• Description– Small set of generic scenarios that
remain constant through time –one-off exercise based on historical scenarios
– Focused on 3/4 main macro-economic factors
• Aim, role and benefit– Provide a consistent view of the risk
profile through time– Avoid undue focus on short
term conditions
• Examples (typically 2–3 run)– Early’ 90s downturn– Mild recession– Property price fall– Equity market crash (dotcom)– Bird flu epidemic
• Description– Identification of very specific events
that might cause a large loss – or threaten the bank – in a specific area
– Not necessarily linked to macro-economic factors
– Updated constantly
• Aim, role and benefit– Risk identification and mitigation: do
not necessarily trigger a full stress test/capital plan calculation
– Foster creativity and buy-in through the Group
– Potential feed into FSA “reverse stress testing”
• Examples (number depends on business complexity)– Hedging strategy breakdown– Default of large single counterparty– Institution-specific liquidity crisis
• Description– Forward looking scenarios addressing
current macro-economic, concerns – Regularly updated– Consider a wider range of macro-
economic factors
• Aim, role and benefit– Show potential impact of macro-
economic concerns on the Group
• Examples (typically 5–10)– UK government downgrade– Eastern European government default– Deflation– Sustained inflation and rising
interest rates
Scenarios considered for stress testing – Three types
Industrialised “Scenario libraries”1 “Ad hoc” scenarios2 Bottom up/
Reverse scenarios3
Three different types of scenario are seen in the market – best practice organisations combine all three types

1616© Oliver Wyman | SIN-ASP10501-041
1 2 3 4No scenarios considered One scenario considered Two to four
scenarios consideredFive or more scenarios considered
• Stress test is a mere sensitivity test without linkage to macro-economic factors
• A single macro-economic stress scenario is considered – usually the scenario provided by the regulator
• Various scenarios considered, covering general economic stresses– Base case– Downturns of
different severities
• Scenario provided by regulator may be amongst them
• A probability of occurrence may be associated to each scenario (e.g. 1-in-25,1-in-10)
• A variety of scenarios, including general macro-economic ones…– Mild recession– Sever recession
• …and specific, event-driven stresses; e.g.– Pandemic– Regulatory changes– Decline in
property prices– Rising commodity prices
• Other risks are stressed (market, operational, business, etc.) in consistency with credit risk scenarios
The quantity and complexity of scenarios can differ based on size and sophistication of the institution
1717© Oliver Wyman | SIN-ASP10501-041
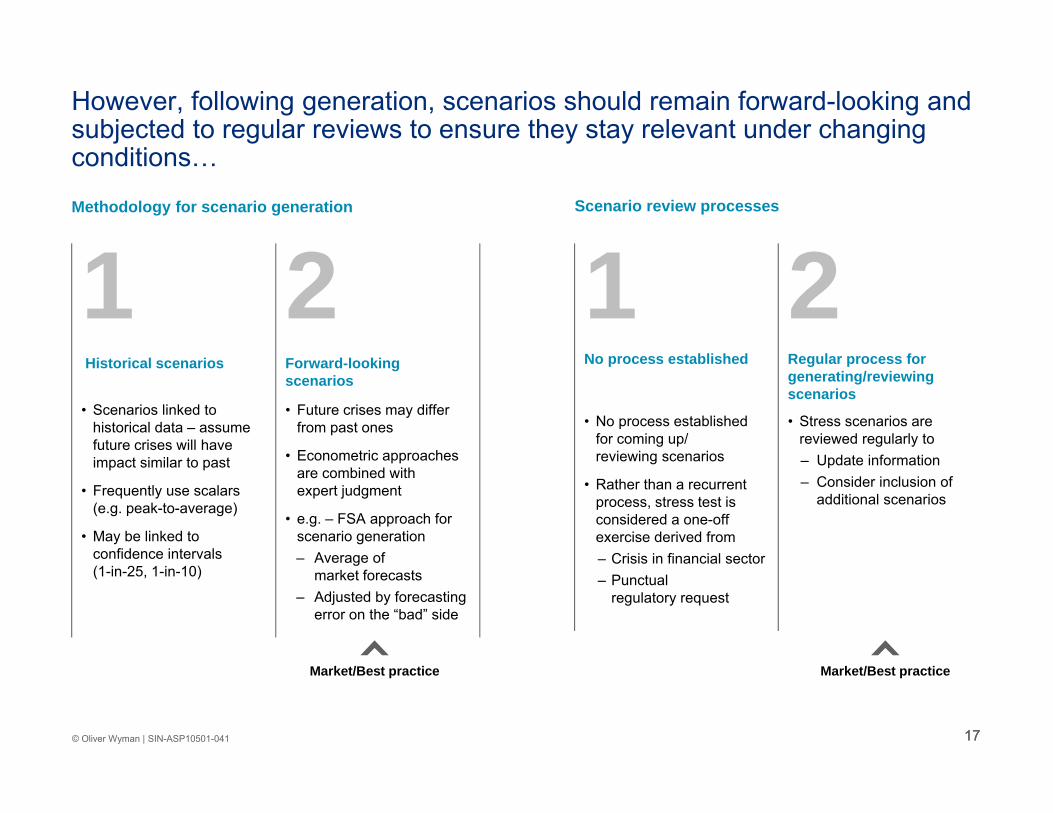
Methodology for scenario generation Scenario review processes
Market/Best practice
1 2Historical scenarios Forward-looking
scenarios
• Scenarios linked to historical data – assume future crises will have impact similar to past
• Frequently use scalars (e.g. peak-to-average)
• May be linked to confidence intervals(1-in-25, 1-in-10)
• Future crises may differ from past ones
• Econometric approaches are combined with expert judgment
• e.g. – FSA approach for scenario generation– Average of
market forecasts– Adjusted by forecasting
error on the “bad” side
Market/Best practice
1 2No process established Regular process for
generating/reviewing scenarios
• No process established for coming up/reviewing scenarios
• Rather than a recurrent process, stress test is considered a one-off exercise derived from– Crisis in financial sector– Punctual
regulatory request
• Stress scenarios are reviewed regularly to– Update information– Consider inclusion of
additional scenarios
However, following generation, scenarios should remain forward-looking and subjected to regular reviews to ensure they stay relevant under changing conditions…

18© Oliver Wyman | SIN-ASP10501-041 18
…whilst being realistic about what is achievable given intrinsic challenges in stress testing
1 Scenarios may be different to the past
– As such, inferences from past experience may not be relevant to forward looking scenario periods
Expert understanding is essential2 Lack of available data
– Shortage of historical time series
– Little or none of this will be similar to the scenarios considered
3 Human judgement element of rating tools difficultto predict
– Error around expert predictions of qualitative factors
Realistic expectations should temper desire for sophistication
4 Re-rating behaviour is unpredictable and subject to change
– Differences in re-rating behaviour more likely during downturns
Intrinsic challenges Implications

1919© Oliver Wyman | SIN-ASP10501-041
To ensure business relevance – Stress scenarios should be based on true economic drivers rather than the parameters of the calculation engine
Topic Basic practice Best practice
Credit risk –PD calculation
• Undifferentiated rating stress (e.g. 2-grade shift for all obligors)
• Limited use of historical regression or well-thought out expert view
• Model considers historical data with explicit link between PD and scenario factors
• Supplement with expert judgment to discuss and challenge different scenarios used in the model
Credit risk –LGD calculation
• Use downturn LGD from RWA calculation • No linkage to scenario factors
• Model that link scenario factors to LGDs (either Bottom-up or Top-down)
• Differentiates between point-in-time loss rate and LGD used in RWA calculation
Market risk • Ad hoc process exists• Stress testing covers parts but not all of market
risk factors (interest rates, equity prices, exchange rates, credit spreads, volatility)
• Tool to test positions in financial instruments in the trading/loan books under various stressed conditions across all relevant factors
Other risks • No formal process to quantify the effect of other risks (liquidity, reputational)
• Considers these risks as an afterthought in the framework
• Framework to assess and quantify effects of shocks to funding (liquidity risk)
• Considers non-financial risk (reputational) on both standalone (impact on reputation of a scenario) and as part of inter-connected risk framework (how reputational risk may effect share prices, etc.)
2020© Oliver Wyman | SIN-ASP10501-041
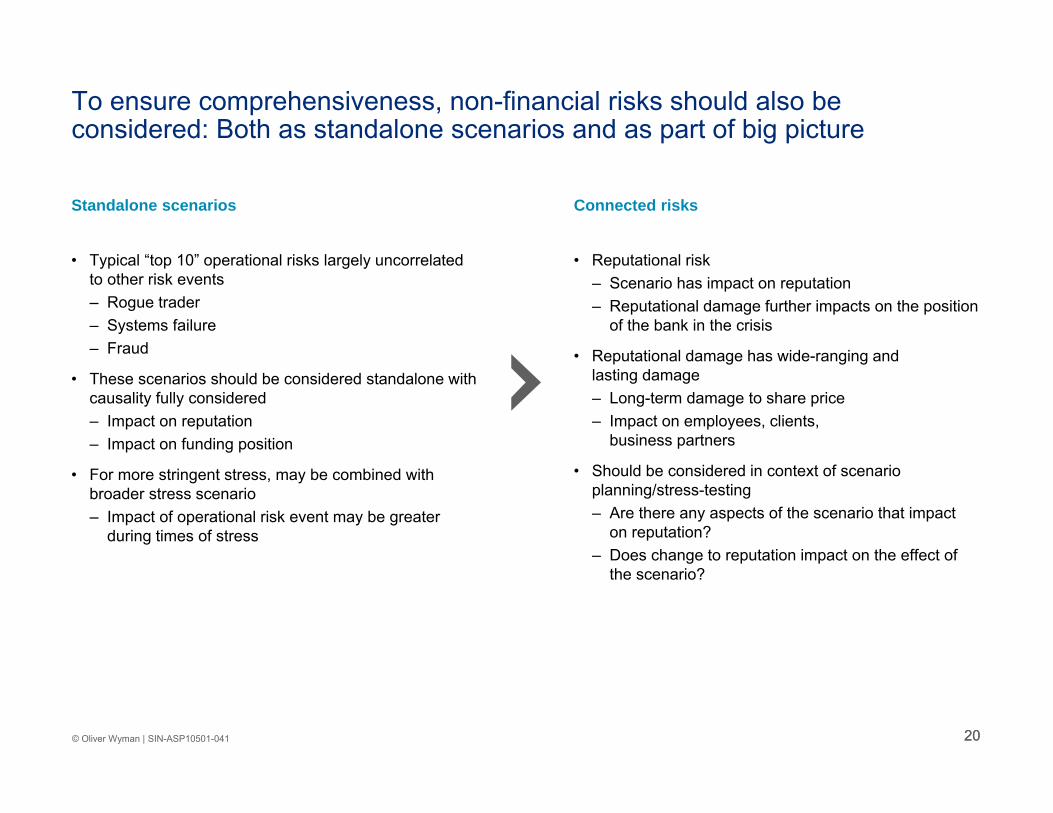
Standalone scenarios Connected risks
• Typical “top 10” operational risks largely uncorrelated to other risk events– Rogue trader– Systems failure– Fraud
• These scenarios should be considered standalone with causality fully considered– Impact on reputation– Impact on funding position
• For more stringent stress, may be combined with broader stress scenario– Impact of operational risk event may be greater
during times of stress
• Reputational risk– Scenario has impact on reputation– Reputational damage further impacts on the position
of the bank in the crisis
• Reputational damage has wide-ranging and lasting damage– Long-term damage to share price– Impact on employees, clients,
business partners
• Should be considered in context of scenario planning/stress-testing– Are there any aspects of the scenario that impact
on reputation?– Does change to reputation impact on the effect of
the scenario?
To ensure comprehensiveness, non-financial risks should also be considered: Both as standalone scenarios and as part of big picture

2121© Oliver Wyman | SIN-ASP10501-041
To ensure a forward-looking view, historical time series should be combined with forward-looking experts opinions during scenario generation
1. Analysis is shown only for illustrative purposes – the model may not be ideally formed even with a single factor (at least lag and factor transformations could be considered)Source: Bureau of Economic Analysis, Moody’s
-15
-10
-5
0
5
10
15
20
25
-6
-4
-2
0
2
4
6
8
10
1930 1935 1940 1945 1950 1955 1960 1965 1970 1975 1980 1985 1990 1995 2000 2005
Model developed on 1985-2004
R2 = 38.3%
Applied to 1930-1984
R2 = 10.5%
Def
ault
rate
(%)
Default rate = -0.50 GDP growth + 3.3% G
DP grow
th (%)
Actual US corporate defaultsPredicted US corporate defaultsGDP growth
Implications• Macro factors affect credit risk differently at different periods in time• It is essential to fully understand the scenarios considered• Expert judgement is key, and should complement stress testing models

2222© Oliver Wyman | SIN-ASP10501-041
Example: Using a combination of approaches to triangulate stress scenario, with a significant role for expert judgement
Bottom-up risk driver analysis
• Relationships defined between macro factors and individual model factors– Based on historical regression and
expert judgement– Pragmatism required
• Split by industry as far as practical
0.0%
2.0%
4.0%
6.0%
1989
1991
1993
1995
1997
1999
2001
2003
2005
2007
PD%
PD Model
Regression model for default rates
• Regressions to link scenarios to PD experience (may need to be recreated)
External benchmarks
• Compare results to external benchmarks as a sanity check on results– E.g. Historical rating agency migrations
Triangulated PD projections Rating system overlay
0.0%
1.0%
2.0%
3.0%
4.0%
0
50
100
150
Y0 Y1 Y2 Y3 Y4
Impact of rating system
0.0%
2.0%
4.0%
6.0%
Lag on financials OverridesCore projection
0.0%
2.0%
4.0%
6.0%
Triangulation projection 1
0.0%
2.0%
4.0%
6.0%
Triangulation projection 2
• Understand dynamics of the scenarios considered
• Consider core projection against triangulation points
• Understand reasons for differences between projections
• Justify final PD projection
Final projection based on directed expert judgement
“Cor
e” m
etho
dolo
gyTr
iang
ulat
ion
poin
ts
0.0%
2.0%
4.0%
6.0%

23© Oliver Wyman | SIN-ASP10501-041 23
In summary: The ideal stress scenario
• Defines a clear “big picture” – e.g. liquidity crunch, world recession, stagflation
• Is relevant– Scenarios specifically designed keeping in mind the risks the Bank is exposed to
• Is plausible – Stress tests must be realistic and be based off scenarios that are extreme and yet have a
chance of happening
• Is complete – A scenario must articulate the “big picture” by forecasting ALL necessary risk drivers
• Is consistent – Forecasting of risk drivers must be done coherently accounting also for conjoint dynamics
• Is up-to-date – Stress scenarios must be updated regularly ensuring consistency with market events

Using the resultsSection 3

2525© Oliver Wyman | SIN-ASP10501-041
The most common mistake is to regard scenario planning as a regulatory exercise only
1 2 3Regulator only Risk function (Senior) Business
management
• Stress test results do not inform any business decisions – exercise is performed solely for compliance purposes
• Results are reported to/signed-off by head of risk function
• Main purpose is gain understanding of sensitivity of Economic Capital numbers
• Conclusions of Stress test results are reported to/signed-off by senior management– CEO, CFO, CRO– Board
• Results are discussed and used to drive capital and business planning
Common practice Common practice

2626© Oliver Wyman | SIN-ASP10501-041
Best practice peers are using stress testing to inform risk identification and mitigation, as well as for business planning
Uses of stress testingContingency planning • Determine impact of specific stress scenario and build contingency plan (e.g.
hedge/sale/business reduction etc.)• Assess validity of existing contingency plans
Limit new business/renewals • Set new capital/balance sheet constraints if adverse loss scenarios are outside risk appetite
Budgeting/Capital management • Forecast loan losses to feed into P&L budget, with impact on future business volumes and cost base
Workout capacity management • Determine likely flow of files to workout, to enable development of resources and capabilities in advance
Risk appetite assessment • Assess risk exposures against risk appetite
Trigger more detailed stress-testing • Identify high-risk portfolios/names to be investigated further
Add deals to watch list • Identify names to be added to watch list
Macro-hedging/portfolio sale • Identify risk hot-spots outside risk appetite• Build business case for purchase of macro hedge/portfolio sale
Single-name hedging/asset sale • Identify name-level risks for hedging/sale
Transfer to Workout and recovery • Identify names to be transferred directly to workout for restructuring/recovery
Risk identification
Risk mitigation
Planning

2727© Oliver Wyman | SIN-ASP10501-041
The extent of embedding often depends on the management processes and the scenario type
Section 1. Industrialised
“Scenario libraries”2. “Ad hoc”scenarios
3. Bottom up scenarios
Contingency planning
Limit new business/renewals
Budgeting/Capital management
Risk appetite assessment
Workout capacity management
Trigger more detailed stress-testing
Add deals to watch list
Macro-hedging/portfolio sale
Single-name hedging/asset sale
Transfer to Workout and recovery
Addressee • Business unit management• Executive board
• Executive board• Business unit
management
• Product/segment level management
• Escalated where appropriate
Frequency • Quarterly • Quarterly at least• Carried out “ad hoc”/
when needed
• On-going/“ad hoc”
Risk ident.
Risk mitig.
Planning
Use of stress test results – by type of scenario
28© Oliver Wyman | SIN-ASP10501-041 28
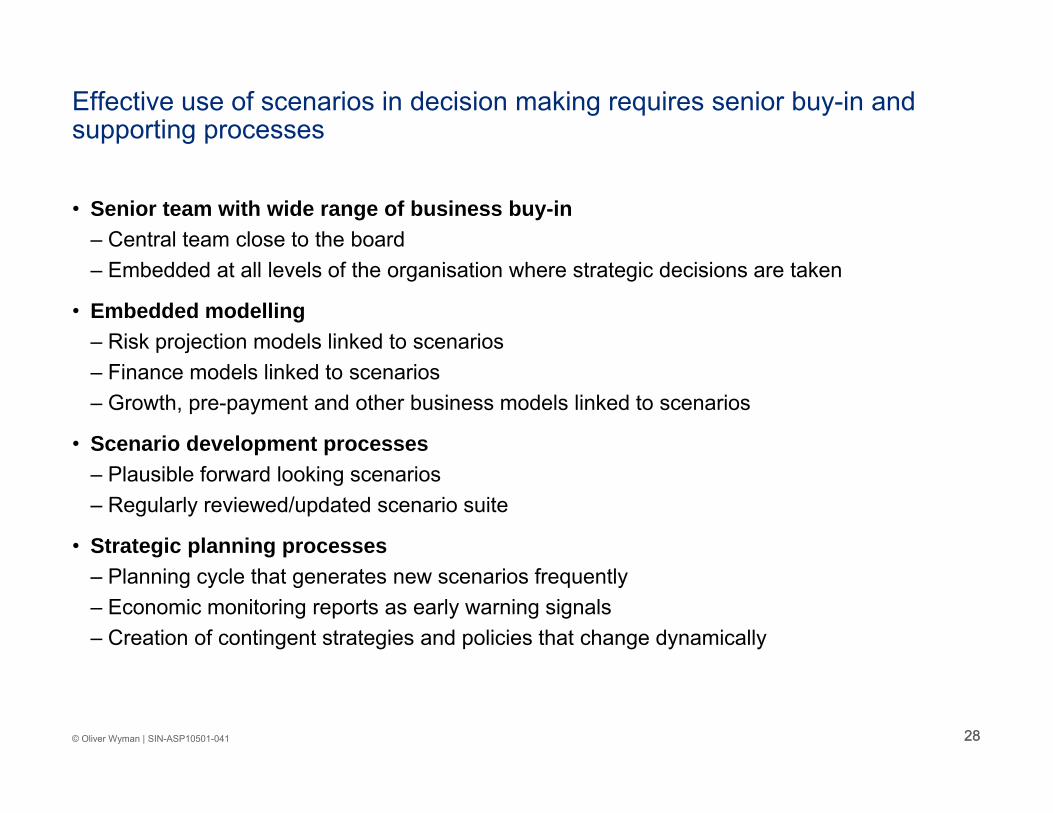
Effective use of scenarios in decision making requires senior buy-in and supporting processes
• Senior team with wide range of business buy-in– Central team close to the board– Embedded at all levels of the organisation where strategic decisions are taken
• Embedded modelling– Risk projection models linked to scenarios– Finance models linked to scenarios– Growth, pre-payment and other business models linked to scenarios
• Scenario development processes– Plausible forward looking scenarios– Regularly reviewed/updated scenario suite
• Strategic planning processes– Planning cycle that generates new scenarios frequently– Economic monitoring reports as early warning signals– Creation of contingent strategies and policies that change dynamically

29© Oliver Wyman | SIN-ASP10501-041 29
Risk appetite, limit setting and stress testing are all closely interlinked and required in conjunction with each other
• Formulating the strategy, including embedding explicit consideration of risk-reward trade offs
• Providing the business with a philosophical view of acceptable and unacceptable sources of risk
• Steering the portfolio and coordinating risk taking activities across the bank
Strategy and risk appetite setting
• Cascading exposure/capital from the Group to the BU level− Individual large exposures− Industries
• Setting limits across additional risk dimensions
• Communicating risk appetite in actionable format
Limit setting
• Define a set of stress scenarios and relevant scenario parameters
− Depends on the stress testing approach, senior management involvement at this stage can be critical
• What do the implied limits mean under the stress scenarios?
− P&L and capital impact
• Profitability analysis ideally taken into account to provide a full picture
Stress testing analysis
1 2
3

3030© Oliver Wyman | SIN-ASP10501-041
Example: Embedding stress-testing and scenario planning into risk appetite frameworks
Constraint Traditional risk appetite statement Additional scenario-based statements
Target debt rating
• We will maintain our AA rating even in a 1 in 10 event
• Plans must ensure we remain AA under any core scenarios
Capital adequacy
• We will maintain our regulatory capital adequacy even in a 1 in 50 event
• We will remain out regulatory capital adequacy under any considered scenario
Earnings volatility
• We will not miss consensus earnings forecasts by more than 25% more often than 1 year in 10
• Scenario-based plans should ensure we stay within 25% of communicated earnings projections
Liquidity • We will ensure that liquidity resources are sufficient to meet a 1 in 100 liquidity event
• We will have sufficient liquidity to continue doing business under any or our planning scenarios
Concentrations • We will not have more than 5% of the bank’s RWA at risk to one counterparty
• The top 10 customers will not account for more than 20% of total RWA
• We will not have more than 20% of the bank’s RWA at risk to a 1 in 25 movement in any single macro factor
Operational risk • Operational losses will not exceed 5% of revenue in any year
• Top 10 risks will be managed with escalation procedures
• We will plan to survive a top 10 operational risk event together with any of our planning scenarios

3131© Oliver Wyman | SIN-ASP10501-041
Example: Stress testing is an important enabler for central bank steering processes…
Key elements of bank steering
Calculate snapshot capital requirements
and resources
Demonstrate sound management of
all risks
Understand impact of adverse scenarios
Define risk appetite
Develop capital plan Board sign off Ongoing monitoring, reporting and action
• Risk definition and register
• Risk materiality policy
• Justification of approach • Pillar 1
• Pillar 2 (which approach?)
• Capitalised and non-capitalised
• Including approach to downturn mgmt
• “Severe but plausible”
• Resources and requirements
Business planning
• Growth assumptions etc.
• Capital management
• Target ratios etc.
Key: One off/ as needed exercise (At least) annual process Monthly/ quarterly process
Identify and size all material risks
Update and refine plan
Stress testing as enabler

3232© Oliver Wyman | SIN-ASP10501-041
Example: …and should play a central role in the management of capital adequacy through establishing a forward-looking view
Risk-basedcapital
Inclusion of mitigatingactions
Stressed capital projection
“Base” capital projection
• What would the impact of a severe downturn be– On capital?– On earnings
and costs?
• Multiple stresses will be required
• Stress test must be appropriately severe (not limited by historical scenarios)
• Multi-year projection of risk-based capital – the base case capital plan
• Evolution of business plans linked to forecast capital, earnings and costs
• Assumes a particular state of the economy over planning period
• What management actions could be taken to reduce the impact of a severe downturn?
• What would be the expected impact of these actions?
• What contingency plans have been put in place?
• Will these be available in all scenarios?
Capital plan
• Capital adequacy and its forecast
• Stress test impact and contingency action
• Monitoring framework
• Implementation strategy
• Snapshot of risk-based capital requirement
• Covering all material risks
• Inclusion only of “convincing” diversification benefits
• Use for capital planning limited because
• Backward looking• Portfolio is
assumed static

3333© Oliver Wyman | SIN-ASP10501-041
Parameterise losses Estimate impactDesign stress scenario
CRE Resi Equity
SG -20% -30% -35%
MY -15% -20% -25%
Others -20% -20% -30%
Price drops
Loss parameters
CRE Resi
PD 6% 4%
LGD 25% 35%
Setting bottom-up Risk Appetite for real estate exposures using stressed scenarios
Singapore property price indices1985-present
20%+ YoY drop
020406080
100120140160180200
2007
Q2
2005
Q2
2003
Q2
2001
Q2
1999
Q2
1997
Q2
1995
Q2
1993
Q2
1991
Q2
1989
Q2
1987
Q2
1985
Q2
Resi Office Shop Industry
20%+ YoY drop
020406080
100120140160180200
2007
Q2
2005
Q2
2003
Q2
2001
Q2
1999
Q2
1997
Q2
1995
Q2
1993
Q2
1991
Q2
1989
Q2
1987
Q2
1985
Q2
Resi Office Shop Industry
• Scenario driven into loss estimates through– Prices– PD– LGD
• Impact on earnings and/or capital
• Decide whether acceptable to Bank
• Design macro or industry-specific scenario
• Analyse historical real estate price movements
0%
5%
10%
15%
20%
25%
30%
35%
40%
1-in-10 EL change
% o
f Ear
ning
s
Total EaR tolerance (hypothetical)
Total credit EAR tolerance at 80% of total (hypothetical)
Other BB lendingBank X propertiesHome loans
CRE
Illustrative
Example: Stress testing is a critical tool to estimate concentration limits

3434© Oliver Wyman | SIN-ASP10501-041
Example: An institutionalised approach to scenario-based planning also facilitates use of outputs in practical decision-making such as contingency planning
-2-101234
0 1 2 3 4 5
GDP % Change
0
2
4
6
8
0 1 2 3 4 5
Interest rates
Factor Current best estimate (full year)
GDP growth -0.2%
Interest rates 3.5%
Etc.
Comments
• Economic conditions monitored on a regular basis– Best estimates updated regularly along key
dimensions (house prices, GDP growth, unemployment, interest rates, etc.)
• Economic conditions can be compared against pre-test scenarios– Check for the emergence of stories that fit pre-
tested scenarios– Check emergence of results compared
to scenarios
• Acts as “early warning system”– Early signs point to other developments as
described in the scenario
• Provides first mover advantage– Spotting early means reacting early
Pre-considered planning scenarios
Monitoring of external market developments
Early warning signals
• Current scenario appears like scenario 2– Under this scenario the market will develop as XX– This suggests a change in strategy of XX

3535© Oliver Wyman | SIN-ASP10501-041
Example: Designing scenario planning over medium-term also supports mitigating management action – which may be slow to take effect
0
20
40
60
80
100
120
140
160
0 1 2 3 4 5
Expe
cted
loss
%
Year
Downturn scenario Downturn with management actions
Approach
• Mitigating actions slow to have any impact– e.g. Tighter lending criteria– Usually little action possible against
in-force business– Portfolio churn often slow
• Some actions can be taken to increase scope for management action– Shorter maturity requirements– Increase capital/liquidity buffers
• Strategic business decisions often slow to bear fruit– New country, product, etc.– Changes in HR model
Effect of mitigating actionsDisguised client example

3636© Oliver Wyman | SIN-ASP10501-041
Beyond immediate decision making, stress-testing can benefit a range of management processes
Stress testing aims
Strategic planning and management
• Development of strategy mindful of opportunities and threats, shaping the profile of the organisation
• Engage in meaningful analysis of threats/opportunities from specific businesses
Budgeting • Scenario Input into targets and budgets
Loss emergence forecasting
• Short term estimation of (generally credit) loss forecasts
ICAAP/regulation • Meet evolving requirements and expectations
Deal/ product design
• Include the impact of unexpected in designing balance sheet items
Macro hedging • Purchase of specific instruments to hedge against extreme losses in some exposures
Investor communication
• Provide IR with a fact base to help allay analyst/ investor fears
Risk appetite • Using stress testing to define elements of the risk appetite
Reporting/MI • Inclusion of result and impacts in standard reporting packs
Example processes benefiting from stress testing thought
• Cultural and behavioural challenges remain for almost all firms– “That will never happen”– “We’ll all be dead anyway”– Etc.
• Short term aims include– Board education– Visible actions (e.g. hedging,
reduction of exposure)
• Long term aim is to incorporate in a broad range of processes (see RHS)

3737© Oliver Wyman | SIN-ASP10501-041
Example: A coherent stress testing framework leads to more effective, informative risk reports, which can be used by management to steer the risk profile
Disguised client example
Typical defects of stress test reporting
• Information is not appropriate for target audience– Not easy to read and interpret– Focused on review and analysis, lack of
action-oriented comments “so what”– Reports are too long and contain too much
irrelevant information
• Unclear positioning within the overall reporting architecture– Numbers/analysis partly inconsistent with
other reports– No reconciliation with other important metrics– Not comprehensive and self-contained to allow
conclusions on business issues
• Insufficient standardisation– Every area uses their own templates, focus areas,
terminology etc. (compare, e.g. credit risk vs. natural-catastrophe risk)
– Reporting format is not stable
• Action-oriented, relevant analytics with informative comments
• Focus is on future trends and developments – past reviewed only to infer views about the future
• Clear positioning within financial and risk reporting
• Consistent structure, starting from aggregate risk profile, with drill down into individual risk drivers
Threat scenarios
Action point tracking and key projectsTrends analysis
Focus on Red and Amber areas
100%+
CaR limit
Risk Appetite monitoring
BU 1
BU 2
BU 3
BU 4
BU 5
134
185
140
195
177
137
187
140
188
179
EaR (Q1)
262
365
312
365
370
282
375
310
364
376
EaR (Q2)
EaR limit
CaR (Q1) CaR (Q2)
BU 6 103 101 197 196
Green Amber Red0- 95% 95%- 100%
Earnings/Capital - at- Risk vs. limits
300
EAR/CAR as % limit:
€ MM
400
300
400
400
200
150
200
150
200
200
100
Total Group 934 932 1871 19031,000 2,000
Action point tracking
Action point agenda Risk Appetite Red &
Amber traffic lights Concentrations
outside limits Etc.
EARNINGS at Risk CAPITAL at Risk
Analysis e.g. Limit breaches Remedial actions
e.g. Board member, senior
manager
10% 0%33%
R A G
EaRAFR/EC (%)(% Expec Earnings) 110%
Current
A GR
100%
Equity index drops 15%
Yield curve down 2%
Housing market falls 10%
Lapse rate doubles
Largest single name defaults
Natural catastrophe
Equity index drops 15%
Yield curve down 2%
Housing market falls 10%
Lapse rate doubles
Largest single name defaults
Natural catastrophe
Investment grade credit spreads (bp)
E.g. Credit Trends
Analysis e.g. 5 places this
impacts most Action points
050
100150200250300
Jan-02Apr-02 Jul-02 Oct-02Jan-03Apr-03 Jul-03
EURO
USD
1%
3.5%
1.5%
3.8%5,700 8,20005Counterparty 1
3,400 6,20004Counterparty 2
2,600 3,20001Counterparty 3
900 1,70006Counterparty 4
… … ………
4
4
9
13
…
Out-standings
Limit Earnings At Risk
ParentRating
Counter -parties
GroupWARR
Capital At Risk
1.1%
2.5%
1.8%
3%
…
Green Amber Red
Capital at Risk (%)
Earnings at Risk (%) 5%+2-5%0-2%
5%+2-5%0-2%
Name level (equity and credit) Sectoral Geographical, etc.
ConcentrationsAction | Status Review
1 Investigate alternative guarantee structures Amber Q4 2004
2 …
3
…
Description Owner StatusDelivery Date
1 IFRS . Amber 01/2005
2 Basel II Green 01/2007
Key projects

3838© Oliver Wyman | SIN-ASP10501-041
Example: Emerging industry trend to disclose selected stress test results as part of investor communication – pre-empting analysts’ outside-in views
Danske Bank1 – Detailed description of the framework and scenarios considered
ING2 – Specific quantitative results for risks of concern
One of Danske Bank Group’s largest customers files for bankruptcy and the Group’s rating is downgraded.
Liquidity crisis, Danske Bank Group
A liquidity crisis triggers credit losses and impairs capital procurement.
Liquidity crisis in banking sector
Bird flu becomes an epidemic and causes a significant decline in GDP.
Bird flu
US current account deficit triggers a global recession in which the dollar falls 25%.
Depreciation of the US dollar
Increase in price of oil of 50% and in commodity prices of 25%, reducing purchasing power (for both consumers and businesses).
Sharp increase in price of oil
No economic growth for two consecutive quarters. The scenario is estimated to occur once during a period of seven years.
Mild recession
Rising interest rates lead to falling property prices.Falling real property prices
Structural problems in Europe lead to recession and deflation.
Deflation
Sharp drop in exports and rising taxes lead to a decline in demand. The scenario is estimated to occur once during a period of 25 years.
Severe recession
1. Danske Bank, 2007, P852. ING Investor Day, 9 September 2007, P30