Embed Size (px)
Citation preview
Submitted 29 July 2016Accepted 3 November 2016Published 6 December 2016
Corresponding authorEdmundo Lozoya-Gloria,[email protected]
Academic editorIvo Feussner
Additional Information andDeclarations can be found onpage 19
DOI 10.7717/peerj.2748
Copyright2016 Cornejo-Corona et al.
Distributed underCreative Commons CC-BY 4.0
OPEN ACCESS
Stress responses of the oil-producinggreen microalga Botryococcus braunii
Race BIvette Cornejo-Corona1, Hem R. Thapa2, Daniel R. Browne2,Timothy P. Devarenne2 and Edmundo Lozoya-Gloria1
1Genetic Engineering, Centro de Investigación y de Estudios Avanzados del Instituto Politécnico Nacional,Unidad Irapuato, Irapuato, Guanajuato, Mexico
2Department of Biochemistry and Biophysics, Texas A&M University, College Station, TX, United States
ABSTRACTPlants react to biotic and abiotic stresses with a variety of responses including theproduction of reactive oxygen species (ROS), which may result in programmedcell death (PCD). The mechanisms underlying ROS production and PCD have notbeen well studied in microalgae. Here, we analyzed ROS accumulation, biomassaccumulation, and hydrocarbon production in the colony-forming green microalgaBotryococcus braunii in response to several stress inducers such as NaCl, NaHCO3,salicylic acid (SA), methyl jasmonate, and acetic acid. We also identified and cloneda single cDNA for the B. braunii ortholog of the Arabidopsis gene defender against celldeath 1 (DAD1), a gene that is directly involved in PCD regulation. The function ofB. braunii DAD1 was assessed by a complementation assay of the yeast knockout lineof the DAD1 ortholog, oligosaccharyl transferase 2. Additionally, we found that DAD1transcription was induced in response to SA at short times. These results suggest thatB. braunii responds to stresses by mechanisms similar to those in land plants andother organisms.
Subjects Aquaculture, Fisheries and Fish Science, Biochemistry, Molecular Biology, Plant ScienceKeywords DAD1, OST2, PCD, ROS, Hydrocarbons, NaCl, NaHCO3, Salicylic acid, Methyljasmonate, Acetic acid
INTRODUCTIONPhotosynthetic organisms support life on Earth by emitting oxygen as a byproduct of thephotosynthetic process, and as a result these organisms face constant photo-oxidative stress(Ledford & Niyogi, 2005). Most of the reactions involved in the capture of light energy arerelated to the production and control of reactive oxygen species (ROS) (Mittler et al., 2004;Hebelstrup & Møller, 2015). ROS generally exist as different forms of oxygen dependingon interactions with an added electron or proton. ROS may be present as superoxideradical, hydrogen peroxide, or a hydroxyl radical (Mallick & Mohn, 2000). The equilibriumbetween light harvesting and energy production must be carefully controlled, otherwise theproduced ROS may result in loss of protein function, deterioration of membrane integrity,and cell death (Ledford & Niyogi, 2005). Non-damaging levels of ROS may prepare cellsto deal with higher ROS levels in order to survive this oxidative stress condition (Ledford& Niyogi, 2005). Mechanisms to deal with ROS include non-enzymatic ROS scavenging
How to cite this article Cornejo-Corona et al. (2016), Stress responses of the oil-producing green microalga Botryococcus braunii Race B.PeerJ 4:e2748; DOI 10.7717/peerj.2748
through the production of antioxidant compounds like carotenoids (Apel & Hirt, 2004).However, excessive ROS production may induce the process known as programmed celldeath (PCD), which is an active and genetically controlled process initiated during normaldevelopment, and utilized to isolate and remove damaged tissues to ensure survival of theorganism (Petrov et al., 2015). Different kinds of biotic and abiotic stresses may also triggerROS production leading to PCD (Torres, Jones & Dangl, 2006).
Studies on PCD in land plants have received substantial attention, whereas PCD inalgae has not been well studied. In the unicellular freshwater green alga Micrasteriasdenticulate some biochemical and physiological modifications characteristic of PCDwere shown to be induced by high salt (NaCl or KCl) similar to what has been seenfor higher plants (Affenzeller et al., 2009). After long exposure (24 h) to these stressesautophagy of organelles was detected, which is a particular type of PCD (Affenzeller etal., 2009). In Chlamydomonas reinhardtii, acetic acid, NaCl, and Na2CO3 induced PCDand the release of volatile compounds (Zuo et al., 2015). Apoptosis is another form ofPCD that is accompanied by specific changes in morphology, such as increased chromatincondensation, nuclear degradation, and DNA fragmentation (Van Doorn & Woltering,2005). These changes were observed during PCD in the unicellular chlorophyte Dunaliellatertiolecta and were accompanied by increased expression of caspases, which are celldeath-associated proteases (Segovia et al., 2003). It is known that after oxidative stress,cells somehow sense ROS production and specific signal transduction processes activatetranscription factors which trigger gene expression of caspases and other degradingproteins to bring about PCD (Rantong & Gunawardena, 2015). Expression of PCD-relatedgenes was studied in C. reinhardtii after PCD induction by UV-C treatment. This studyshowed an increase of protein levels for apoptosis protease activating factor-1 (AFA1),and down-regulation of expression for the anti-apoptotic gene defender against death(DAD1) (Moharikar, D’Souza & Rao, 2007). In the regulatory framework of PCD, DAD1has been recognized as a key inhibitor of PCD. The highly conserved DAD1 gene has beenidentified in distantly related organisms such as human, mouse, rat, chicken, Xenopus,C. elegans, yeast, and plants (Wang et al., 1997; Van der Kop et al., 2003). The DAD1 genewas initially isolated from a temperature-sensitive hamstermutant cell line, and the encodedprotein can inhibit the development of PCD in C. elegans (Nakashima et al., 1993). TheDAD1 protein was identified as part of the oligosaccharyl transferase (OST) complex and itsactivity is related to N-linked glycosylation of the apoptotic machinery (Nishimoto, 1997;Knauer & Lehle, 1999). Thus, DAD1 is evolutionarily conserved as a universal negativeregulator of PCD (Makishima et al., 1997).
The green microalga Botryococcus braunii is a colonial alga with individual cells of thecolony held together by an extracellular matrix (ECM), and produces high levels of liquidhydrocarbons that are mainly stored in the ECM (Banerjee et al., 2002). Three races ofB. braunii have been described, which are differentiated by the type of liquid hydrocarbonproduced. Race B hydrocarbons are polymethylated, unsaturated triterpenes between 30–37carbons named botryococcenes, race L produces a tetraterpene named lycopadiene, andrace A produces fatty acid-derived alkadienes and alkatrienes of 25–31 carbons (Banerjeeet al., 2002). Although ROS were not directly assayed, a study placing B. braunii Races B
Cornejo-Corona et al. (2016), PeerJ, DOI 10.7717/peerj.2748 2/27
and L under stress conditions such as nitrogen deficiency or high light intensity showedaccumulation of carotenoids that could act as antioxidants capable of quenching ROSthat may be produced under these conditions (Ambati, Ravi & Aswathanarayana, 2010).During the linear phase of the B. braunii growth cycle, antioxidants/pigments such aslutein were produced, whereas the antioxidants/pigments echinenone and canthaxanthinwere produced mainly in the stationary phase in response to depletion of nitrogen (Grung,Metzger & Liaaen-Jensen, 1989). This data suggests that ROS could be produced in B.braunii under certain stress conditions (Grung et al., 1994). The ROS protective antioxidantproperties of the acetone extracted carotenoids from B. braunii were demonstrated in vitrousing systems such as the 2,2-diphenyl-1-picrylhydrazyl (DPPH) antioxidant assay inhuman low-density lipoprotein and rat tissues (Rao et al., 2006; Rao et al., 2013). Eventhough the production of these antioxidant compounds in B. braunii has been known forsome time, there has not been a report about the production of ROS or the induction ofPCD in this alga. In this work, we present results showing ROS production in B. brauniiafter treatment with several common stress inducers using a staining procedure adaptedfrom mammalian systems. We also demonstrate the existence of the DAD1 gene in B.braunii, assess its function by complementation of the yeast knockout line of the DAD1homologue (oligosaccharyl transferase 2, OST2), and show induction of DAD1 geneexpression after stress treatments.
MATERIALS AND METHODSAlgal culturingBatch cultures of B. braunii Race B, Showa (Berkeley) strain (Nonomura, 1988) were grownin 500 mL homemade bioreactors by inoculating 40 mL of a two-week-old culture into400 mL fresh Chu-13 media (Grung, Metzger & Liaaen-Jensen, 1989). The algal cultureswere aerated with filter-sterilized ambient air and grown at 25 �C under cool-whitefluorescent illumination at photosynthetically active radiation of 50 µmol photons m�2s�1
with 59 watt lamps (Philip F96T8 59W/850 Single Pin ALTO Plus). Cultures were grownfor two weeks to obtain green active state colonies prior to analysis in accordance withprevious reports (Brown, Knights & Conway, 1969). Algal cells of two-week-old cultureswere collected by filtration using Millipore Nylon filters (10 µm pore size) and the dryweight (DW) biomass was calculated after filtration in pre-weighed 0.45 µm MilliporeNylon membranes followed by drying in an oven at 65 �C for 24 h.
Induction of stress conditionsBefore stress induction, cells from two-week-old cultures were washed by filtration througha 10 µm nylon net followed by suspension of cells in 100 mL of sterile deionized water.For stress induction 400 mL of fresh media was inoculated with 10 mL of water-suspendedcells (0.6 g DW L�1), cultures grown for 72 h, and independent cultures treated with 50,100, and 200 mMNaCl (KARAL); 120, 240, and 360 mMNaHCO3 (KARAL); 1.5, 3.0, and6.0 mM salicylic acid (SA; Sigma-Aldrich); 10, 20, and 30 µM methyl jasmonate (MeJA;Sigma-Aldrich) and 1.09, 2.18, and 4.33 mM acetic acid (KARAL). Samples were taken at
Cornejo-Corona et al. (2016), PeerJ, DOI 10.7717/peerj.2748 3/27
10, 30, 60, and 120 min after treatment and the cultures were either used for ROS detectionby fluorescent staining or the cells were harvested by filtration, frozen in liquid N2, andstored at �80 �C for future use.
Staining procedure for ROS detection in B. braunii coloniesWe optimize the method to detect ROS in B. braunii colonies by modifying the procedurefor CellROX Green reagent (Invitrogen) recommended by the supplier. Briefly, 2 µL of5 mMCellROX Green was added to 100 µL of algal culture followed by incubation at 36 �Cand shaking at 120 rpm for 30 min in the dark. The cells were then washed twice for 5 mineach time at room temperature with 1⇥ PBS, 0.1% Triton X-100, and fluorescence wasobserved using a Zeiss Axio Lab.A1 microscope with a ICc3 Rev.3 digital camera under thecontrol of ZEN lite 2011 Software. An LEDmodule at 470 nm was used for excitation and afilter set of 38 Endow GFP shift free (E) EX BP 470/40, BS FT 495, EM BP 525/50 was usedfor emission detection. At least one hundred colonies were evaluated for each treatment.The samples were observed under white light to locate colonies for evaluation and then themicroscope was switched to fluorescence to identify and count the number of fluorescentcolonies. Due to the colony organization of B. braunii it was sometimes difficult to countindividual cells in a selected sample without moving the field under the microscope. So,once the field was fixed under fluorescent light colonies were considered ROS positive ifmore than 90% of the cells in the field had fluorescent nuclei.
The percentage of ROS positive colonies was determined according to the equation:
(FC/TC)⇤100=%PC
where FC= number of colonies with fluorescence, TC= total number of observed colonies,and PC = percent of ROS positive colonies.
B. braunii hydrocarbon productionSamples were collected by filtration as described above and DW was measured. Theextracellular hydrocarbons were extracted three times by the addition of 50 mL of n-hexane and incubation for 60 min with continuous stirring at 1,800 rpm using a magneticstir bar. All n-hexane extracts were mixed and evaporated in a rotary evaporator (Büchi).Hydrocarbon amounts were calculated gravimetrically and expressed as a percentage ofbiomass DW. The average hydrocarbon productivity was evaluated using the data fromsamples taken every 24 h for seven days after treatments. For botryococcene purification, agravity-fed silica gel 60 Å (Sigma-Aldrich) column with n-hexane as mobile phase was usedto separate the pigments from hydrocarbons in the crude extracts. Positive identificationof botryococcenes in the hydrocarbon fraction was confirmed by GC-MS (Bruker 436-GC-SCION SQ Premium) using a WCOT BR-5 ms fused silica capillary column (60 m⇥ 0.25 mm, film thickness: 0.25 µm) in electron ionization mode (70 eV) mode. A splitinjection mode was used with a split ratio of 1:200. Initial oven temperature was 50 �C for1 min, then increased to 220 �C at a rate of 10 �C min�1, and then ramped to 260 �C at arate of 2 �C min�1 and held for 20 min. Total analysis time was 58 min. Helium was used
Cornejo-Corona et al. (2016), PeerJ, DOI 10.7717/peerj.2748 4/27
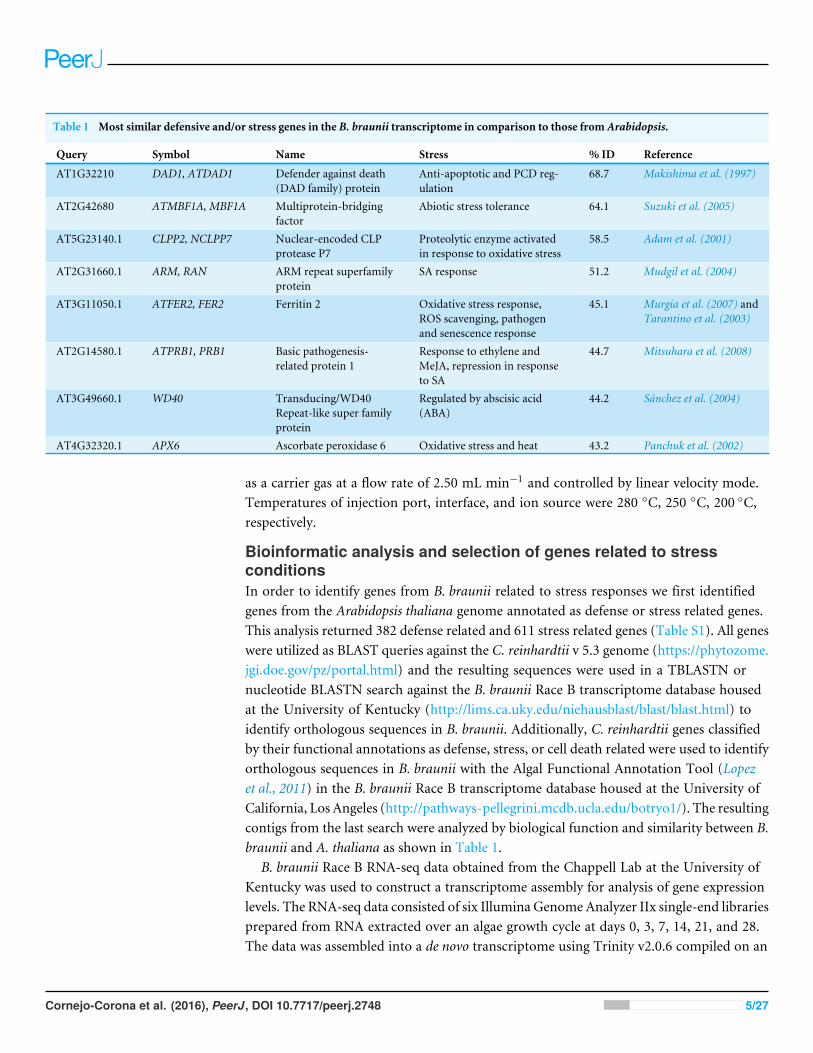
Table 1 Most similar defensive and/or stress genes in the B. braunii transcriptome in comparison to those from Arabidopsis.
Query Symbol Name Stress % ID Reference
AT1G32210 DAD1, ATDAD1 Defender against death(DAD family) protein
Anti-apoptotic and PCD reg-ulation
68.7 Makishima et al. (1997)
AT2G42680 ATMBF1A, MBF1A Multiprotein-bridgingfactor
Abiotic stress tolerance 64.1 Suzuki et al. (2005)
AT5G23140.1 CLPP2, NCLPP7 Nuclear-encoded CLPprotease P7
Proteolytic enzyme activatedin response to oxidative stress
58.5 Adam et al. (2001)
AT2G31660.1 ARM, RAN ARM repeat superfamilyprotein
SA response 51.2 Mudgil et al. (2004)
AT3G11050.1 ATFER2, FER2 Ferritin 2 Oxidative stress response,ROS scavenging, pathogenand senescence response
45.1 Murgia et al. (2007) andTarantino et al. (2003)
AT2G14580.1 ATPRB1, PRB1 Basic pathogenesis-related protein 1
Response to ethylene andMeJA, repression in responseto SA
44.7 Mitsuhara et al. (2008)
AT3G49660.1 WD40 Transducing/WD40Repeat-like super familyprotein
Regulated by abscisic acid(ABA)
44.2 Sánchez et al. (2004)
AT4G32320.1 APX6 Ascorbate peroxidase 6 Oxidative stress and heat 43.2 Panchuk et al. (2002)
as a carrier gas at a flow rate of 2.50 mL min�1 and controlled by linear velocity mode.Temperatures of injection port, interface, and ion source were 280 �C, 250 �C, 200 �C,respectively.
Bioinformatic analysis and selection of genes related to stressconditionsIn order to identify genes from B. braunii related to stress responses we first identifiedgenes from the Arabidopsis thaliana genome annotated as defense or stress related genes.This analysis returned 382 defense related and 611 stress related genes (Table S1). All geneswere utilized as BLAST queries against the C. reinhardtii v 5.3 genome (https://phytozome.jgi.doe.gov/pz/portal.html) and the resulting sequences were used in a TBLASTN ornucleotide BLASTN search against the B. braunii Race B transcriptome database housedat the University of Kentucky (http://lims.ca.uky.edu/niehausblast/blast/blast.html) toidentify orthologous sequences in B. braunii. Additionally, C. reinhardtii genes classifiedby their functional annotations as defense, stress, or cell death related were used to identifyorthologous sequences in B. braunii with the Algal Functional Annotation Tool (Lopezet al., 2011) in the B. braunii Race B transcriptome database housed at the University ofCalifornia, Los Angeles (http://pathways-pellegrini.mcdb.ucla.edu/botryo1/). The resultingcontigs from the last search were analyzed by biological function and similarity between B.braunii and A. thaliana as shown in Table 1.
B. braunii Race B RNA-seq data obtained from the Chappell Lab at the University ofKentucky was used to construct a transcriptome assembly for analysis of gene expressionlevels. The RNA-seq data consisted of six Illumina Genome Analyzer IIx single-end librariesprepared from RNA extracted over an algae growth cycle at days 0, 3, 7, 14, 21, and 28.The data was assembled into a de novo transcriptome using Trinity v2.0.6 compiled on an
Cornejo-Corona et al. (2016), PeerJ, DOI 10.7717/peerj.2748 5/27
Intel x86-64 computer cluster. Expression values for the B. braunii orthologs of the genesin Table 1 were determined for transcripts at each time point, measured in fragments perkilobase per million mapped reads (FPKM), using the standard Trinity gene expressionanalysis pipeline. To identify genes in B. braunii, the transcriptome was queried with theselected A. thaliana protein sequences using the TBLASTN algorithm in the BLAST+v2.2.29 package. TBLASTN hits with an E-value lower than 1e–5 were selected for furtheranalysis. The expression levels of the transcripts identified in the B. braunii transcriptomewere analyzed and resulting B. braunii nucleotide sequences were used to design specificprimers for transcription analysis by RT-PCR.
Cloning of the B. braunii DAD1 cDNATotal RNAwas purified (López-Gómez & Gómez-Lim, 1992) from algal cells harvested froma 21-day-old culture. Reverse transcription reactions were carried out using SuperScriptIII Reverse Transcriptase (RT) (Invitrogen) with an oligo-dT primer according to thesupplier’s instructions. The generated single-strand cDNA was treated with RNAse H(Invitrogen) for 15 min at 37 �C before use as a template for PCR. Reactions for theDAD1 gene were performed from the start codon to the stop codon using forward primer(50- ATGGACACTCTTAAGCTAAT-30, start codon underlined) and reverse primer (50-TTAACCCATGAAGTTCCACGC-30, stop codon underlined). The PCR reaction wascarried out using 1 µl of single-strand cDNA in a final volume of 25 µl with GoTaq GreenMaster Mix (Promega). The Pre-denaturation step was at 95 �C for 60 s, followed by 35cycles of 95 �C for 30 s, 60 �C for 60 s, 70 �C 30 s, and a final elongation step at 70 �Cfor 5 min. The PCR fragments were directly cloned into the pGEM-T vector (Promega)according to the supplier instructions. Cloned fragments were sequenced using the Big Dyedirect sequencing system (Thermo Fisher) with M13 forward and reverse primers usingthe supplier’s recommendations.
Functional characterization of B. braunii DAD1 using the OST2deletion yeast strainThe B. braunii DAD1–cDNA was subcloned into the yeast vector p426GPD (Mumberg,Mailer & Funk, 1995) using the Bam HI and Sal I restriction sites for expression underthe control of the GPD promoter. The Bam HI and Sal I restriction sites were addedto DAD1 by PCR amplification using forward primer (Bam HI site underlined) 50-GACGGATCCATGGACACTCTTAAGCTAAT-30 and reverse primer (Sal I site underlined) 50-GAC GTCGACACCCATGAAGTTCCACGCCACATAG-30. The ost2 knockout (Winzeleret al., 1999) (YSC1021 Open Biosystems; 1ost2; OST2x 1ost2::KanMX) in yeaststrain BY4743 (MATa/↵ his311/his311 leu210 /leu210 lys210/LYS2 MET15/met1510ura310 /ura310) (4741/4742) was transformed with the DAD1/p426GPD plasmid andthe OST2/p5472 plasmid (MoBY ORF Library, DharmaconTM GE Healthcare Cat.YSC5432) according to the LiAc/SS carrier DNA/PEG method (Gietz & Woods, 2002).The plasmid vector p5472 carries a URA3 selectable marker and a yeast centromere.The OST2 ORF was PCR amplified from an average of 900 bp upstream of the startcodon to an average of 250 bp downstream of the stop codon using DNA template
Cornejo-Corona et al. (2016), PeerJ, DOI 10.7717/peerj.2748 6/27
isolated from the sequenced S288C strain (Ho et al., 2009). We confirmed the OST2ORF in the plasmid by the restriction pattern after a digestion with Hind III andEco RI (Invitrogen). Also, we performed PCR for the OST2 sequence using theforward primer 50-AATTTATCAAAGCTGTTTCATTTGC-30 and reverse primer 50-AAAATGATCCTGCTCTCTTGATATG-30, and for the KanMX F G418/kanamycinresistance gene using the forward primer 50-TGATTTTGATGACGACGAGCGTAAT-30and reverse primer 50-CTGCAGCGAGGAGCCGTAAT-30 according to the supplierrecommendations (Open Biosystems).
Wild type yeast (BY4743) or the ost2 knockout strain transformed with theDAD1/p426GPD plasmid or the wild-typeOST2 cDNA (OST2/p5472 plasmid) were grownat 28 �C in YPD + G418 (200 mg/mL) (Sigma-Aldrich), SD-URA + G418 (200 mg/mL),and YPD growth medium, respectively. The phenotype of the ost2 knockout expressingDAD1 or OST2 was analyzed in the presence or absence of 1 µg/mL tunicamycin (Sigma).Cell viability was analyzed by single plate-serial dilution spotting (SP-SDS) (Thomas etal., 2015) after tunicamycin treatment using a starting OD600 = 0.6 and 5 µl of dilutions(101–106) on the plates, which were incubated at 28 �C for 48 h.
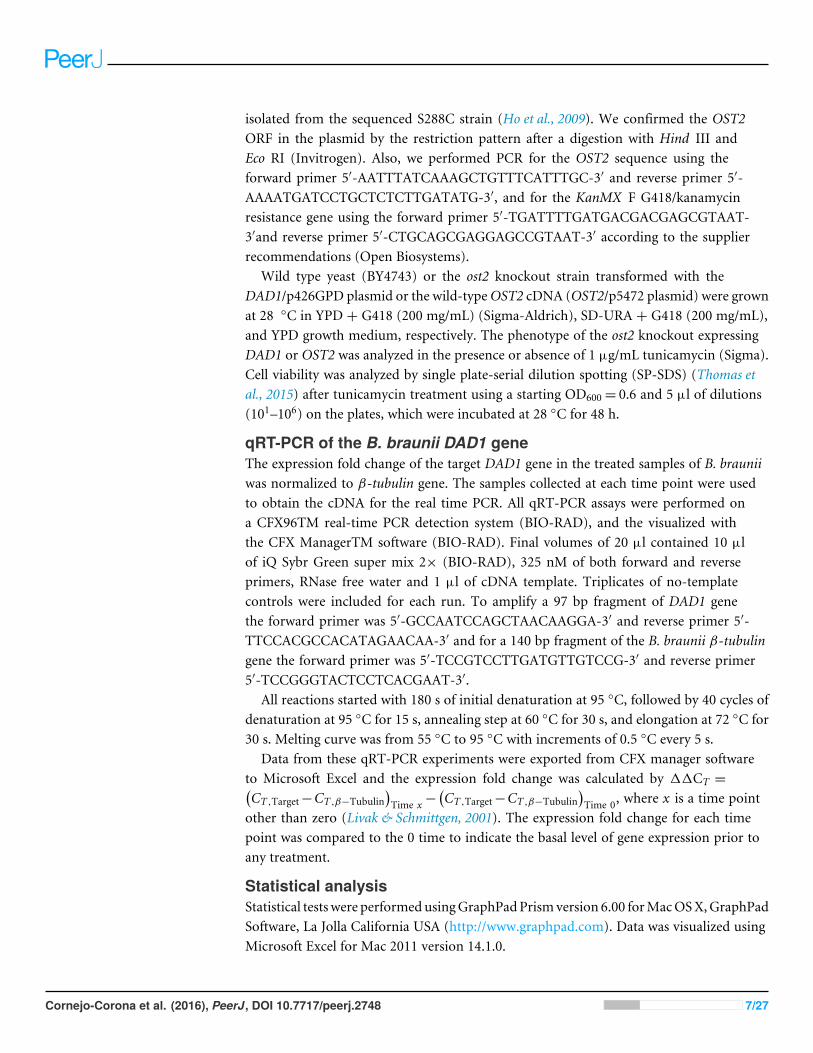
qRT-PCR of the B. braunii DAD1 geneThe expression fold change of the target DAD1 gene in the treated samples of B. brauniiwas normalized to �-tubulin gene. The samples collected at each time point were usedto obtain the cDNA for the real time PCR. All qRT-PCR assays were performed ona CFX96TM real-time PCR detection system (BIO-RAD), and the visualized withthe CFX ManagerTM software (BIO-RAD). Final volumes of 20 µl contained 10 µlof iQ Sybr Green super mix 2⇥ (BIO-RAD), 325 nM of both forward and reverseprimers, RNase free water and 1 µl of cDNA template. Triplicates of no-templatecontrols were included for each run. To amplify a 97 bp fragment of DAD1 genethe forward primer was 50-GCCAATCCAGCTAACAAGGA-30 and reverse primer 50-TTCCACGCCACATAGAACAA-30 and for a 140 bp fragment of the B. braunii �-tubulingene the forward primer was 50-TCCGTCCTTGATGTTGTCCG-30 and reverse primer50-TCCGGGTACTCCTCACGAAT-30.
All reactions started with 180 s of initial denaturation at 95 �C, followed by 40 cycles ofdenaturation at 95 �C for 15 s, annealing step at 60 �C for 30 s, and elongation at 72 �C for30 s. Melting curve was from 55 �C to 95 �C with increments of 0.5 �C every 5 s.
Data from these qRT-PCR experiments were exported from CFX manager softwareto Microsoft Excel and the expression fold change was calculated by 11CT =�CT ,Target�CT ,��Tubulin
�Time x �
�CT ,Target�CT ,��Tubulin
�Time 0, where x is a time point
other than zero (Livak & Schmittgen, 2001). The expression fold change for each timepoint was compared to the 0 time to indicate the basal level of gene expression prior toany treatment.
Statistical analysisStatistical tests were performedusingGraphPadPrismversion 6.00 forMacOSX,GraphPadSoftware, La Jolla California USA (http://www.graphpad.com). Data was visualized usingMicrosoft Excel for Mac 2011 version 14.1.0.
Cornejo-Corona et al. (2016), PeerJ, DOI 10.7717/peerj.2748 7/27
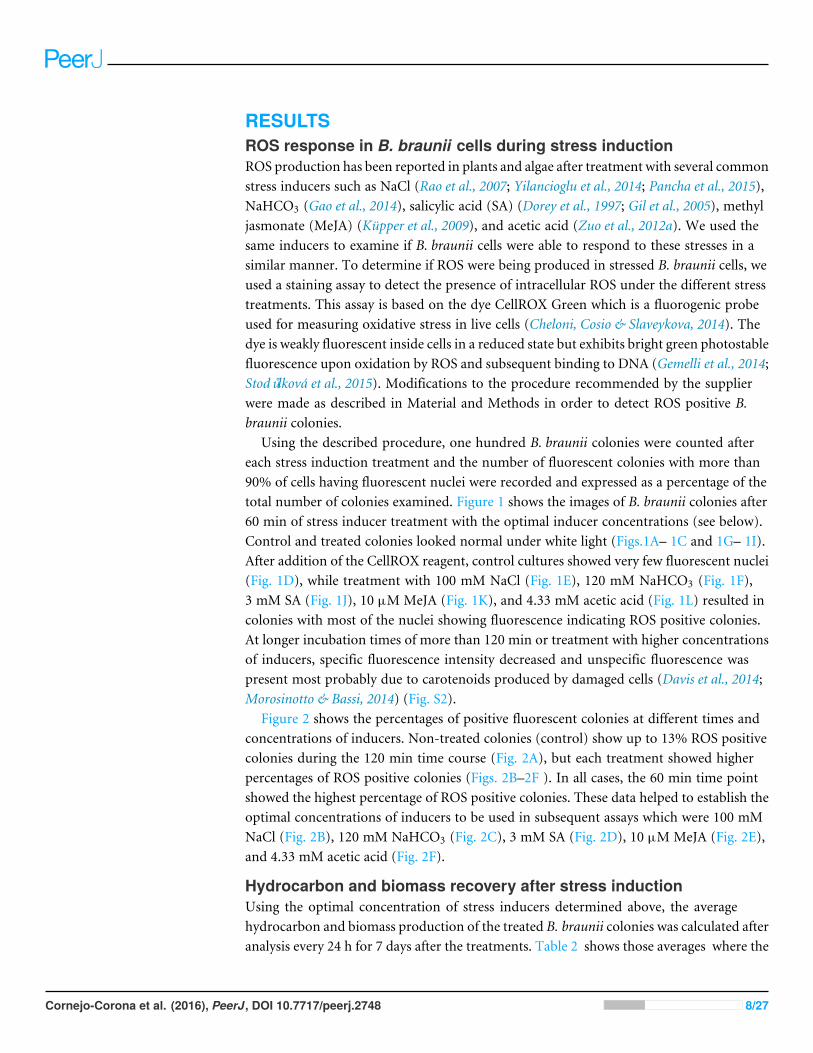
RESULTSROS response in B. braunii cells during stress inductionROS production has been reported in plants and algae after treatment with several commonstress inducers such as NaCl (Rao et al., 2007; Yilancioglu et al., 2014; Pancha et al., 2015),NaHCO3 (Gao et al., 2014), salicylic acid (SA) (Dorey et al., 1997; Gil et al., 2005), methyljasmonate (MeJA) (Küpper et al., 2009), and acetic acid (Zuo et al., 2012a). We used thesame inducers to examine if B. braunii cells were able to respond to these stresses in asimilar manner. To determine if ROS were being produced in stressed B. braunii cells, weused a staining assay to detect the presence of intracellular ROS under the different stresstreatments. This assay is based on the dye CellROX Green which is a fluorogenic probeused for measuring oxidative stress in live cells (Cheloni, Cosio & Slaveykova, 2014). Thedye is weakly fluorescent inside cells in a reduced state but exhibits bright green photostablefluorescence upon oxidation by ROS and subsequent binding to DNA (Gemelli et al., 2014;Stod∑lková et al., 2015). Modifications to the procedure recommended by the supplierwere made as described in Material and Methods in order to detect ROS positive B.braunii colonies.
Using the described procedure, one hundred B. braunii colonies were counted aftereach stress induction treatment and the number of fluorescent colonies with more than90% of cells having fluorescent nuclei were recorded and expressed as a percentage of thetotal number of colonies examined. Figure 1 shows the images of B. braunii colonies after60 min of stress inducer treatment with the optimal inducer concentrations (see below).Control and treated colonies looked normal under white light (Figs.1A– 1C and 1G– 1I).After addition of the CellROX reagent, control cultures showed very few fluorescent nuclei(Fig. 1D), while treatment with 100 mM NaCl (Fig. 1E), 120 mM NaHCO3 (Fig. 1F),3 mM SA (Fig. 1J), 10 µM MeJA (Fig. 1K), and 4.33 mM acetic acid (Fig. 1L) resulted incolonies with most of the nuclei showing fluorescence indicating ROS positive colonies.At longer incubation times of more than 120 min or treatment with higher concentrationsof inducers, specific fluorescence intensity decreased and unspecific fluorescence waspresent most probably due to carotenoids produced by damaged cells (Davis et al., 2014;Morosinotto & Bassi, 2014) (Fig. S2).
Figure 2 shows the percentages of positive fluorescent colonies at different times andconcentrations of inducers. Non-treated colonies (control) show up to 13% ROS positivecolonies during the 120 min time course (Fig. 2A), but each treatment showed higherpercentages of ROS positive colonies (Figs. 2B–2F ). In all cases, the 60 min time pointshowed the highest percentage of ROS positive colonies. These data helped to establish theoptimal concentrations of inducers to be used in subsequent assays which were 100 mMNaCl (Fig. 2B), 120 mM NaHCO3 (Fig. 2C), 3 mM SA (Fig. 2D), 10 µM MeJA (Fig. 2E),and 4.33 mM acetic acid (Fig. 2F).
Hydrocarbon and biomass recovery after stress inductionUsing the optimal concentration of stress inducers determined above, the averagehydrocarbon and biomass production of the treated B. braunii colonies was calculated afteranalysis every 24 h for 7 days after the treatments. Table 2 shows those averages where the
Cornejo-Corona et al. (2016), PeerJ, DOI 10.7717/peerj.2748 8/27
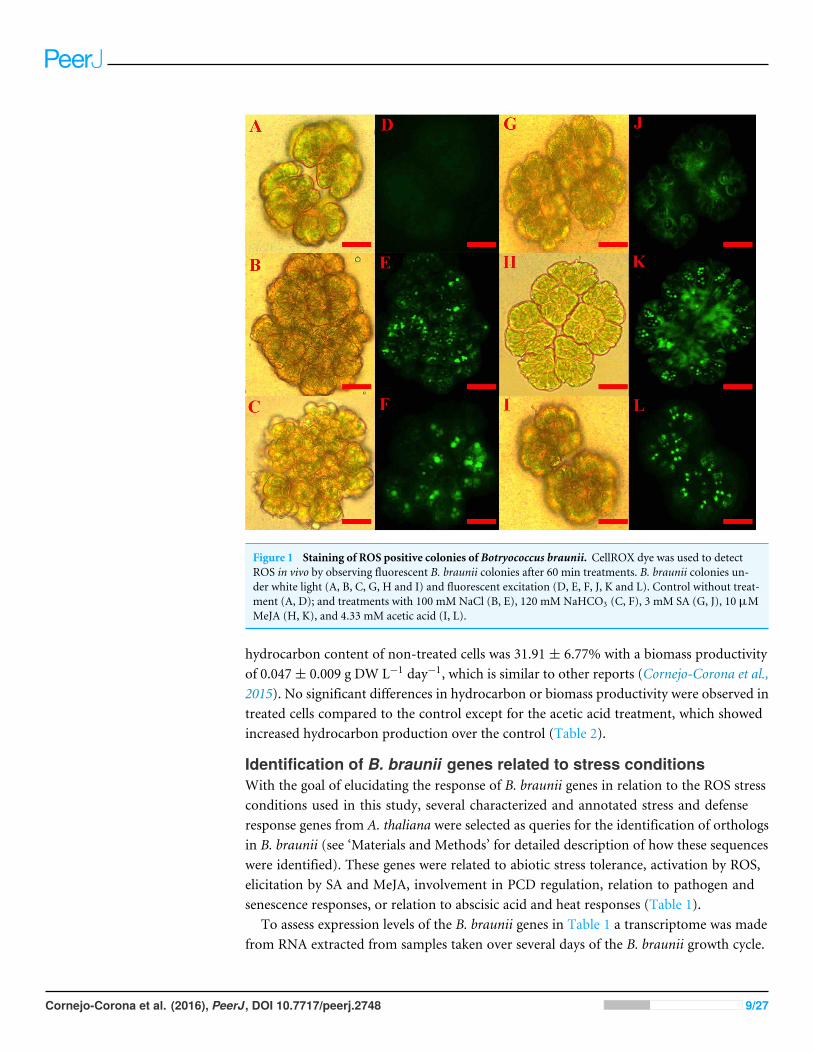
Figure 1 Staining of ROS positive colonies of Botryococcus braunii. CellROX dye was used to detectROS in vivo by observing fluorescent B. braunii colonies after 60 min treatments. B. braunii colonies un-der white light (A, B, C, G, H and I) and fluorescent excitation (D, E, F, J, K and L). Control without treat-ment (A, D); and treatments with 100 mM NaCl (B, E), 120 mM NaHCO3 (C, F), 3 mM SA (G, J), 10 µMMeJA (H, K), and 4.33 mM acetic acid (I, L).
hydrocarbon content of non-treated cells was 31.91 ± 6.77% with a biomass productivityof 0.047 ± 0.009 g DW L�1 day�1, which is similar to other reports (Cornejo-Corona et al.,2015). No significant differences in hydrocarbon or biomass productivity were observed intreated cells compared to the control except for the acetic acid treatment, which showedincreased hydrocarbon production over the control (Table 2).
Identification of B. braunii genes related to stress conditionsWith the goal of elucidating the response of B. braunii genes in relation to the ROS stressconditions used in this study, several characterized and annotated stress and defenseresponse genes from A. thaliana were selected as queries for the identification of orthologsin B. braunii (see ‘Materials and Methods’ for detailed description of how these sequenceswere identified). These genes were related to abiotic stress tolerance, activation by ROS,elicitation by SA and MeJA, involvement in PCD regulation, relation to pathogen andsenescence responses, or relation to abscisic acid and heat responses (Table 1).
To assess expression levels of the B. braunii genes in Table 1 a transcriptome was madefrom RNA extracted from samples taken over several days of the B. braunii growth cycle.
Cornejo-Corona et al. (2016), PeerJ, DOI 10.7717/peerj.2748 9/27
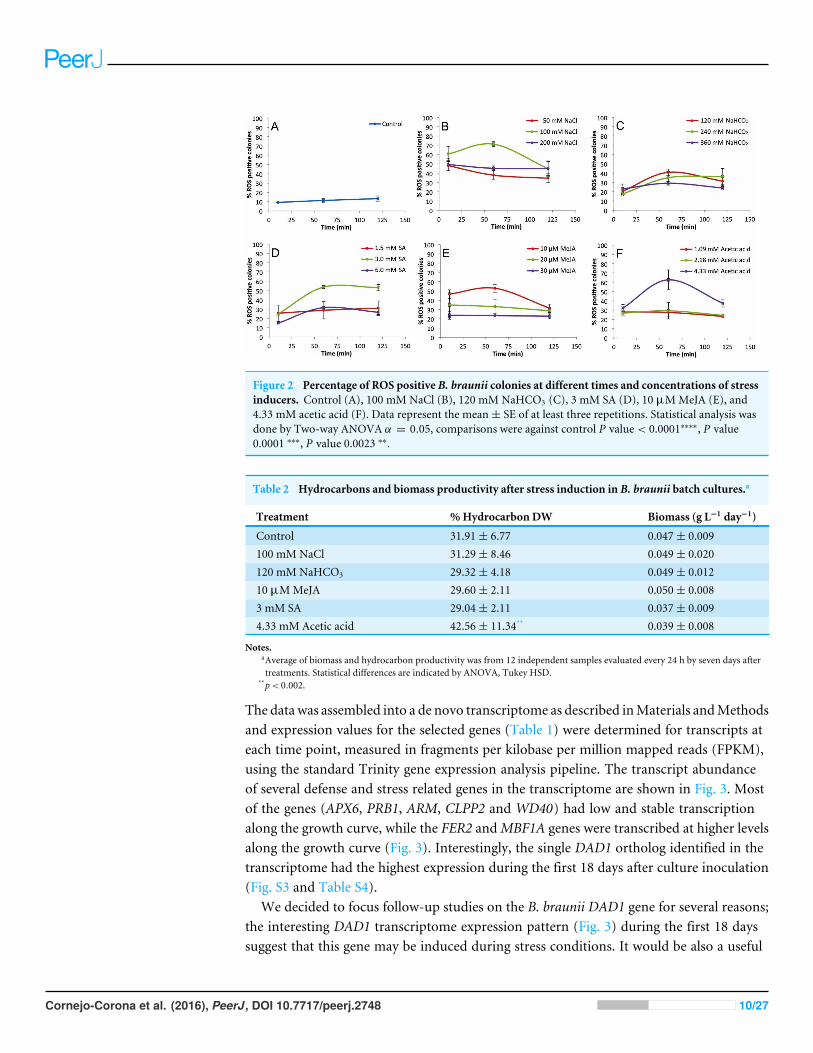
Figure 2 Percentage of ROS positive B. braunii colonies at different times and concentrations of stressinducers. Control (A), 100 mM NaCl (B), 120 mM NaHCO3 (C), 3 mM SA (D), 10 µMMeJA (E), and4.33 mM acetic acid (F). Data represent the mean ± SE of at least three repetitions. Statistical analysis wasdone by Two-way ANOVA ↵ = 0.05, comparisons were against control P value < 0.0001⇤⇤⇤⇤, P value0.0001 ⇤⇤⇤, P value 0.0023 ⇤⇤.
Table 2 Hydrocarbons and biomass productivity after stress induction in B. braunii batch cultures.a
Treatment %Hydrocarbon DW Biomass (g L�1 day�1)
Control 31.91 ± 6.77 0.047 ± 0.009100 mM NaCl 31.29 ± 8.46 0.049 ± 0.020120 mM NaHCO3 29.32 ± 4.18 0.049 ± 0.01210 µMMeJA 29.60 ± 2.11 0.050 ± 0.0083 mM SA 29.04 ± 2.11 0.037 ± 0.0094.33 mM Acetic acid 42.56 ± 11.34** 0.039 ± 0.008
Notes.aAverage of biomass and hydrocarbon productivity was from 12 independent samples evaluated every 24 h by seven days aftertreatments. Statistical differences are indicated by ANOVA, Tukey HSD.
**p< 0.002.
The data was assembled into a de novo transcriptome as described inMaterials andMethodsand expression values for the selected genes (Table 1) were determined for transcripts ateach time point, measured in fragments per kilobase per million mapped reads (FPKM),using the standard Trinity gene expression analysis pipeline. The transcript abundanceof several defense and stress related genes in the transcriptome are shown in Fig. 3. Mostof the genes (APX6, PRB1, ARM, CLPP2 and WD40) had low and stable transcriptionalong the growth curve, while the FER2 andMBF1A genes were transcribed at higher levelsalong the growth curve (Fig. 3). Interestingly, the single DAD1 ortholog identified in thetranscriptome had the highest expression during the first 18 days after culture inoculation(Fig. S3 and Table S4).
We decided to focus follow-up studies on the B. braunii DAD1 gene for several reasons;the interesting DAD1 transcriptome expression pattern (Fig. 3) during the first 18 dayssuggest that this gene may be induced during stress conditions. It would be also a useful
Cornejo-Corona et al. (2016), PeerJ, DOI 10.7717/peerj.2748 10/27
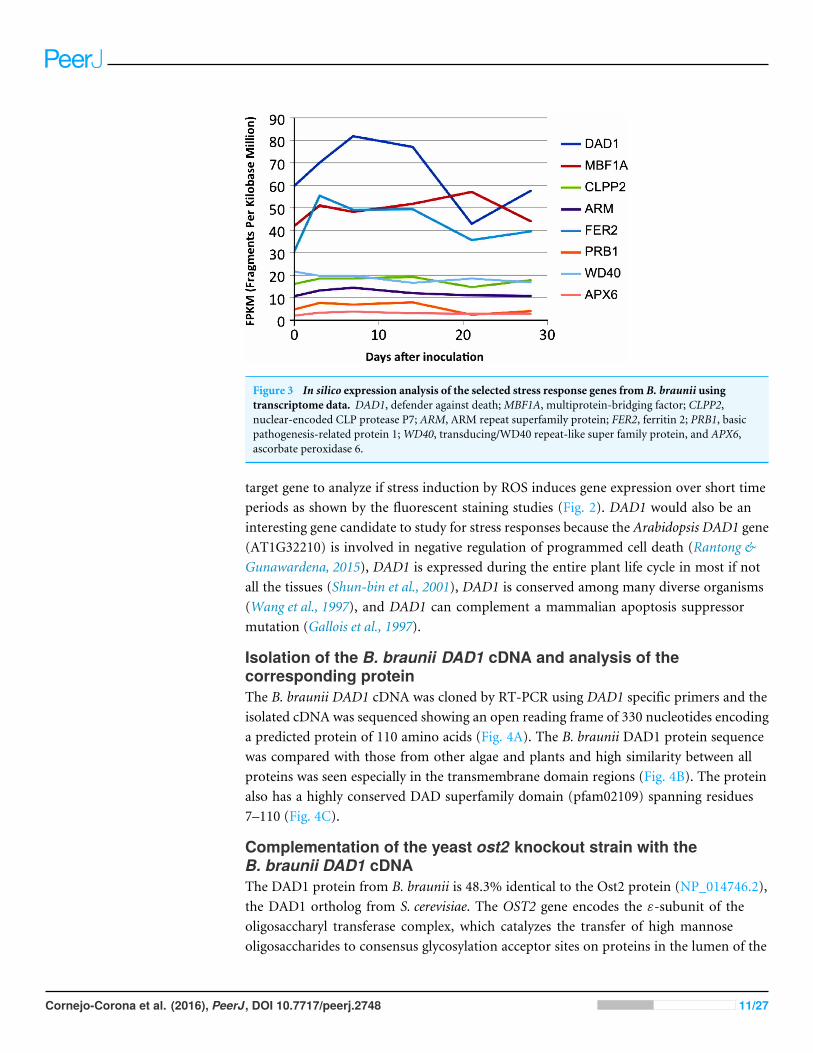
Figure 3 In silico expression analysis of the selected stress response genes from B. braunii usingtranscriptome data. DAD1, defender against death;MBF1A, multiprotein-bridging factor; CLPP2,nuclear-encoded CLP protease P7; ARM, ARM repeat superfamily protein; FER2, ferritin 2; PRB1, basicpathogenesis-related protein 1;WD40, transducing/WD40 repeat-like super family protein, and APX6,ascorbate peroxidase 6.
target gene to analyze if stress induction by ROS induces gene expression over short timeperiods as shown by the fluorescent staining studies (Fig. 2). DAD1 would also be aninteresting gene candidate to study for stress responses because the Arabidopsis DAD1 gene(AT1G32210) is involved in negative regulation of programmed cell death (Rantong &Gunawardena, 2015), DAD1 is expressed during the entire plant life cycle in most if notall the tissues (Shun-bin et al., 2001), DAD1 is conserved among many diverse organisms(Wang et al., 1997), and DAD1 can complement a mammalian apoptosis suppressormutation (Gallois et al., 1997).
Isolation of the B. braunii DAD1 cDNA and analysis of thecorresponding proteinThe B. braunii DAD1 cDNA was cloned by RT-PCR using DAD1 specific primers and theisolated cDNA was sequenced showing an open reading frame of 330 nucleotides encodinga predicted protein of 110 amino acids (Fig. 4A). The B. braunii DAD1 protein sequencewas compared with those from other algae and plants and high similarity between allproteins was seen especially in the transmembrane domain regions (Fig. 4B). The proteinalso has a highly conserved DAD superfamily domain (pfam02109) spanning residues7–110 (Fig. 4C).
Complementation of the yeast ost2 knockout strain with theB. braunii DAD1 cDNAThe DAD1 protein from B. braunii is 48.3% identical to the Ost2 protein (NP_014746.2),the DAD1 ortholog from S. cerevisiae. The OST2 gene encodes the "-subunit of theoligosaccharyl transferase complex, which catalyzes the transfer of high mannoseoligosaccharides to consensus glycosylation acceptor sites on proteins in the lumen of the
Cornejo-Corona et al. (2016), PeerJ, DOI 10.7717/peerj.2748 11/27
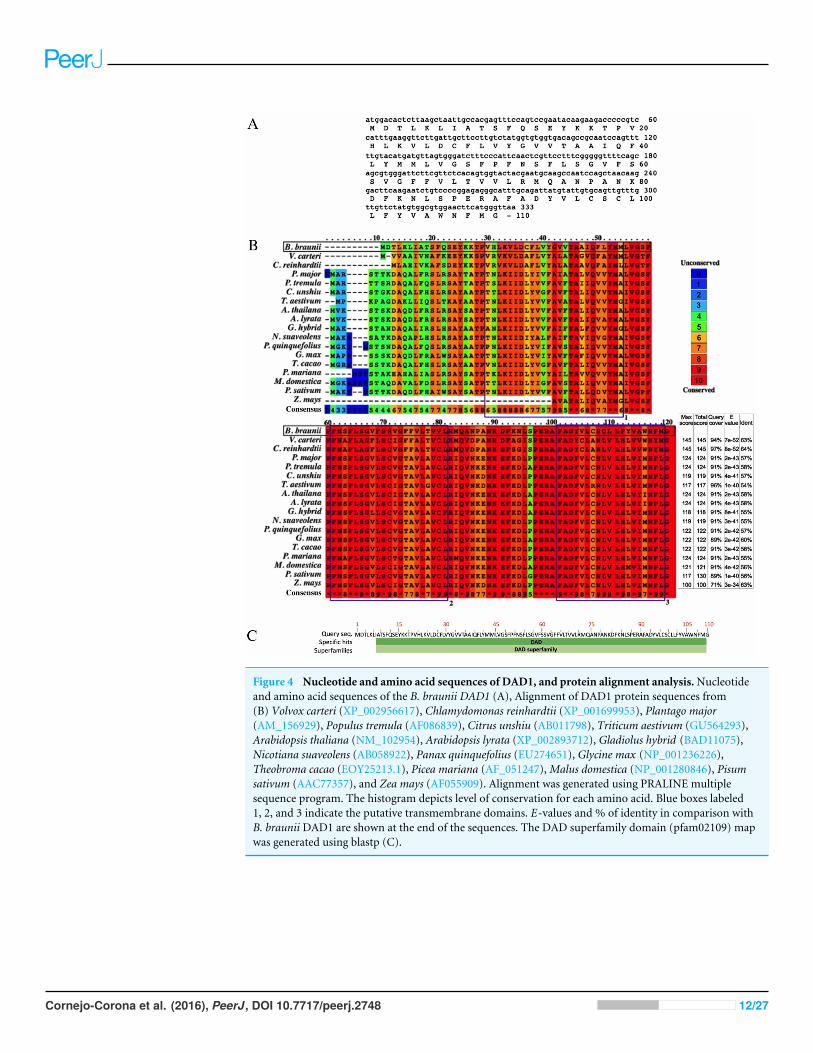
Figure 4 Nucleotide and amino acid sequences of DAD1, and protein alignment analysis.Nucleotideand amino acid sequences of the B. braunii DAD1 (A), Alignment of DAD1 protein sequences from(B) Volvox carteri (XP_002956617), Chlamydomonas reinhardtii (XP_001699953), Plantago major(AM_156929), Populus tremula (AF086839), Citrus unshiu (AB011798), Triticum aestivum (GU564293),Arabidopsis thaliana (NM_102954), Arabidopsis lyrata (XP_002893712), Gladiolus hybrid (BAD11075),Nicotiana suaveolens (AB058922), Panax quinquefolius (EU274651), Glycine max (NP_001236226),Theobroma cacao (EOY25213.1), Picea mariana (AF_051247),Malus domestica (NP_001280846), Pisumsativum (AAC77357), and Zea mays (AF055909). Alignment was generated using PRALINE multiplesequence program. The histogram depicts level of conservation for each amino acid. Blue boxes labeled1, 2, and 3 indicate the putative transmembrane domains. E-values and % of identity in comparison withB. braunii DAD1 are shown at the end of the sequences. The DAD superfamily domain (pfam02109) mapwas generated using blastp (C).
Cornejo-Corona et al. (2016), PeerJ, DOI 10.7717/peerj.2748 12/27
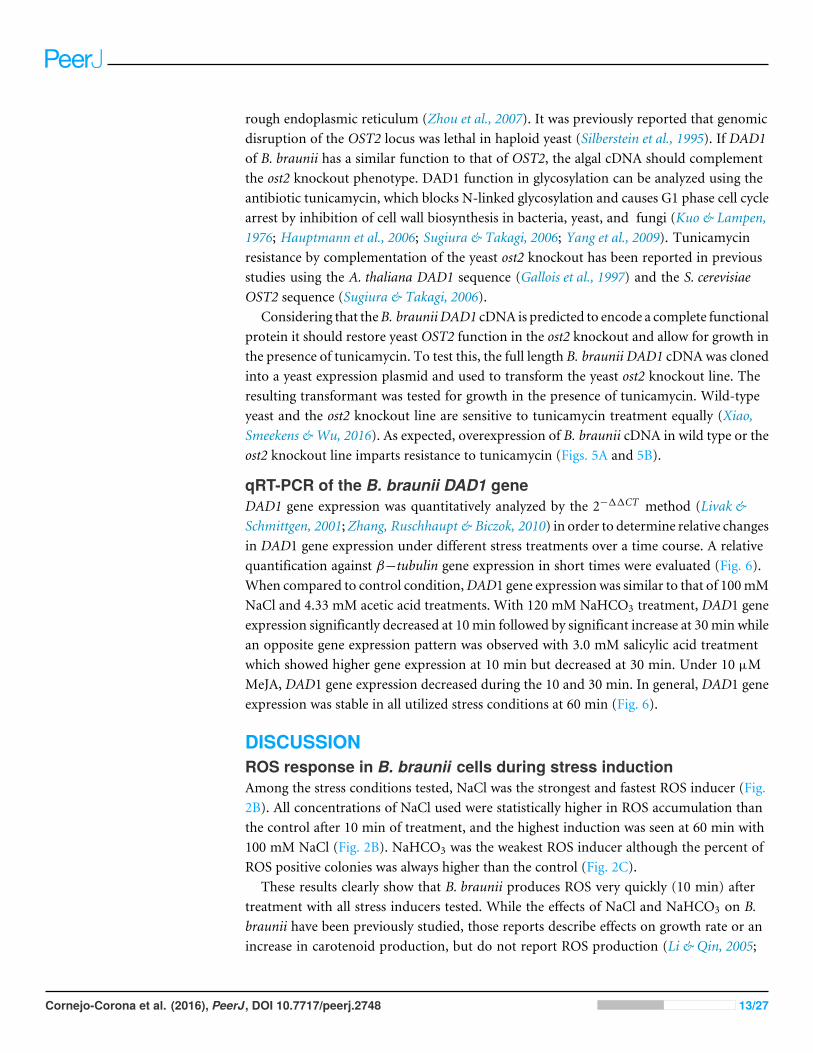
rough endoplasmic reticulum (Zhou et al., 2007). It was previously reported that genomicdisruption of the OST2 locus was lethal in haploid yeast (Silberstein et al., 1995). If DAD1of B. braunii has a similar function to that of OST2, the algal cDNA should complementthe ost2 knockout phenotype. DAD1 function in glycosylation can be analyzed using theantibiotic tunicamycin, which blocks N-linked glycosylation and causes G1 phase cell cyclearrest by inhibition of cell wall biosynthesis in bacteria, yeast, and fungi (Kuo & Lampen,1976; Hauptmann et al., 2006; Sugiura & Takagi, 2006; Yang et al., 2009). Tunicamycinresistance by complementation of the yeast ost2 knockout has been reported in previousstudies using the A. thaliana DAD1 sequence (Gallois et al., 1997) and the S. cerevisiaeOST2 sequence (Sugiura & Takagi, 2006).
Considering that theB. braunii DAD1 cDNA is predicted to encode a complete functionalprotein it should restore yeast OST2 function in the ost2 knockout and allow for growth inthe presence of tunicamycin. To test this, the full length B. braunii DAD1 cDNA was clonedinto a yeast expression plasmid and used to transform the yeast ost2 knockout line. Theresulting transformant was tested for growth in the presence of tunicamycin. Wild-typeyeast and the ost2 knockout line are sensitive to tunicamycin treatment equally (Xiao,Smeekens & Wu, 2016). As expected, overexpression of B. braunii cDNA in wild type or theost2 knockout line imparts resistance to tunicamycin (Figs. 5A and 5B).
qRT-PCR of the B. braunii DAD1 geneDAD1 gene expression was quantitatively analyzed by the 2�11CT method (Livak &Schmittgen, 2001;Zhang, Ruschhaupt & Biczok, 2010) in order to determine relative changesin DAD1 gene expression under different stress treatments over a time course. A relativequantification against ��tubulin gene expression in short times were evaluated (Fig. 6).When compared to control condition,DAD1 gene expression was similar to that of 100mMNaCl and 4.33 mM acetic acid treatments. With 120 mM NaHCO3 treatment, DAD1 geneexpression significantly decreased at 10min followed by significant increase at 30min whilean opposite gene expression pattern was observed with 3.0 mM salicylic acid treatmentwhich showed higher gene expression at 10 min but decreased at 30 min. Under 10 µMMeJA, DAD1 gene expression decreased during the 10 and 30 min. In general, DAD1 geneexpression was stable in all utilized stress conditions at 60 min (Fig. 6).
DISCUSSIONROS response in B. braunii cells during stress inductionAmong the stress conditions tested, NaCl was the strongest and fastest ROS inducer (Fig.2B). All concentrations of NaCl used were statistically higher in ROS accumulation thanthe control after 10 min of treatment, and the highest induction was seen at 60 min with100 mM NaCl (Fig. 2B). NaHCO3 was the weakest ROS inducer although the percent ofROS positive colonies was always higher than the control (Fig. 2C).
These results clearly show that B. braunii produces ROS very quickly (10 min) aftertreatment with all stress inducers tested. While the effects of NaCl and NaHCO3 on B.braunii have been previously studied, those reports describe effects on growth rate or anincrease in carotenoid production, but do not report ROS production (Li & Qin, 2005;
Cornejo-Corona et al. (2016), PeerJ, DOI 10.7717/peerj.2748 13/27
Figure 5 Complementation of the yeast ost2 knockout strain with the B. braunii DAD1 cDNA. Serialdilutions (10�1 –10�6) of yeast cells were plated in SD—URA medium containing 1 mg mL�1 tunicamycinand incubated at 28 �C for 48 h (A). Viability of wild type and 1 ost2 (OST2x 1 ost2::KanMX) was calcu-lated after counting number of colonies in the presence or absence of tunicamycin (B). Mean ± SE, n= 3.
Rao et al., 2007; Ambati, Ravi & Aswathanarayana, 2010; Hifney & Abdel-Basset, 2014).Moreover, those studies focused on hydrocarbon production and showed results overmany days of the algal growth cycle, which is a much longer time period in comparisonto our studies. NaHCO3 has previously been studied in B. braunii as a carbon sourcein comparison to glucose, sucrose, and sodium acetate, and showed no effect on the B.braunii growth rate after 15 days of growth with NaHCO3 (Kong et al., 2012). No effect wasobserved on the B. braunii growth rate after 15 days of growth with NaHCO3. However,
Cornejo-Corona et al. (2016), PeerJ, DOI 10.7717/peerj.2748 14/27
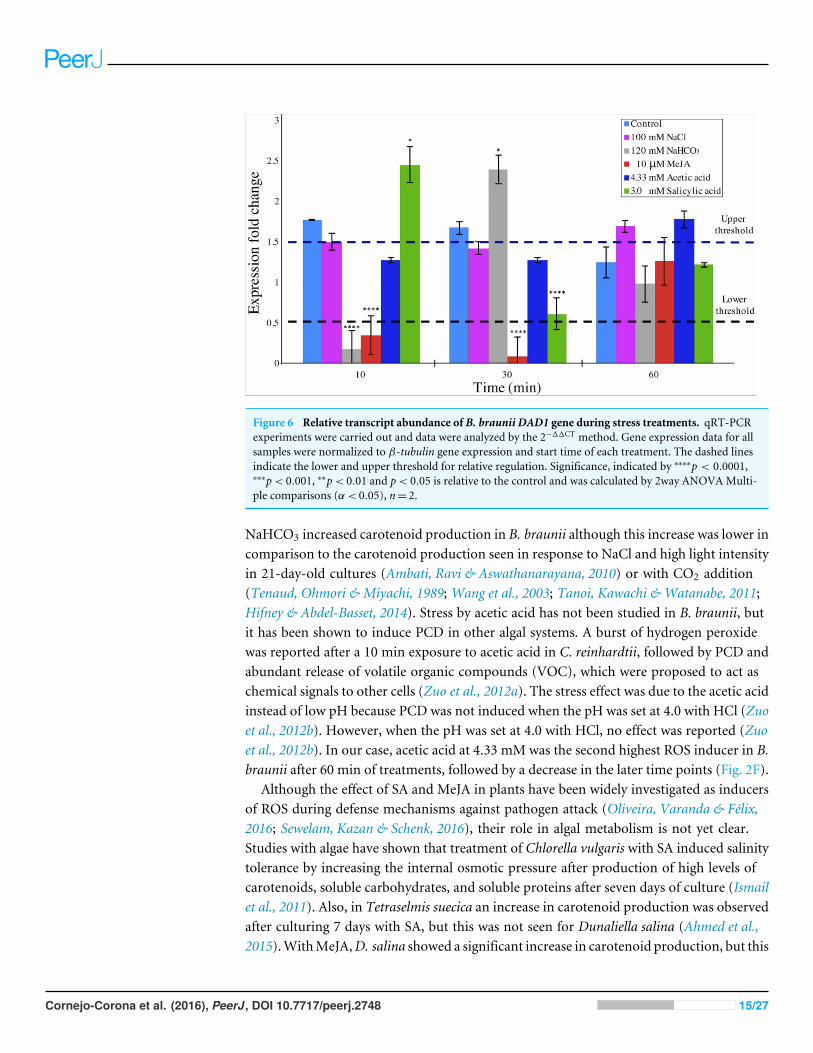
Figure 6 Relative transcript abundance of B. braunii DAD1 gene during stress treatments. qRT-PCRexperiments were carried out and data were analyzed by the 2�11CT method. Gene expression data for allsamples were normalized to �-tubulin gene expression and start time of each treatment. The dashed linesindicate the lower and upper threshold for relative regulation. Significance, indicated by ⇤⇤⇤⇤p < 0.0001,⇤⇤⇤p< 0.001, ⇤⇤p< 0.01 and p< 0.05 is relative to the control and was calculated by 2way ANOVAMulti-ple comparisons (↵ < 0.05), n= 2.
NaHCO3 increased carotenoid production in B. braunii although this increase was lower incomparison to the carotenoid production seen in response to NaCl and high light intensityin 21-day-old cultures (Ambati, Ravi & Aswathanarayana, 2010) or with CO2 addition(Tenaud, Ohmori & Miyachi, 1989; Wang et al., 2003; Tanoi, Kawachi & Watanabe, 2011;Hifney & Abdel-Basset, 2014). Stress by acetic acid has not been studied in B. braunii, butit has been shown to induce PCD in other algal systems. A burst of hydrogen peroxidewas reported after a 10 min exposure to acetic acid in C. reinhardtii, followed by PCD andabundant release of volatile organic compounds (VOC), which were proposed to act aschemical signals to other cells (Zuo et al., 2012a). The stress effect was due to the acetic acidinstead of low pH because PCD was not induced when the pH was set at 4.0 with HCl (Zuoet al., 2012b). However, when the pH was set at 4.0 with HCl, no effect was reported (Zuoet al., 2012b). In our case, acetic acid at 4.33 mM was the second highest ROS inducer in B.braunii after 60 min of treatments, followed by a decrease in the later time points (Fig. 2F).
Although the effect of SA and MeJA in plants have been widely investigated as inducersof ROS during defense mechanisms against pathogen attack (Oliveira, Varanda & Félix,2016; Sewelam, Kazan & Schenk, 2016), their role in algal metabolism is not yet clear.Studies with algae have shown that treatment of Chlorella vulgaris with SA induced salinitytolerance by increasing the internal osmotic pressure after production of high levels ofcarotenoids, soluble carbohydrates, and soluble proteins after seven days of culture (Ismailet al., 2011). Also, in Tetraselmis suecica an increase in carotenoid production was observedafter culturing 7 days with SA, but this was not seen for Dunaliella salina (Ahmed et al.,2015).WithMeJA,D. salina showed a significant increase in carotenoid production, but this
Cornejo-Corona et al. (2016), PeerJ, DOI 10.7717/peerj.2748 15/27
was not seen in T. suecica (Ahmed et al., 2015). In the microalga Schizochytrium mangrovei,the concentration of squalene, a natural antioxidant, increased significantly after 3 h ofMeJA treatment (Yue & Jiang, 2009). Our data shows that B. braunii does indeed produceROS in response to SA and MeJA treatment. A 3 mM SA treatment strongly induced ROSproduction after 60 min with no significant change until 120 min (Fig. 2D). Additionally,10 µMMeJA increased ROS production after 60 min, which decreased in later time points(Fig. 2E).
Hydrocarbon and biomass recovery after stress inductionIn this study we did not make a detailed analysis of the hydrocarbon composition, butinterestingly the main VOCs induced during PCD in C. reinhardtii after acetic acidtreatment were mainly hydrocarbon derivatives like 3-methyl-2-pentanone, hexanal and4-methyl-3-hexanone (Zuo et al., 2012b). The observed effect of acetic acid on B. brauniihydrocarbon production may be due to its availability for conversion into pyruvate, aprecursor for botryococcene production through the MEP isoprenoid pathway (Metzger &Largeau, 2005). Previously, it was reported that three-week-old B. braunii cultures treatedwith NaHCO3 to increase CO2 concentrations showed a 1:1–1:3 increase in biomass andhydrocarbonproduction (Dayananda et al., 2007). The effect of salinity on this Showa strainof B. braunii by NaCl treatment was described as harmful for hydrocarbon production andbiomass accumulation (Yoshimura, Okada & Honda, 2013). Same authors mention thatthe best conditions for growing B. braunii are at 30 �C with 0.2–5% CO2 where the fastestgrow rate is obtained (0.5 day�1 which means a doubling time of 1.4 days), under theseconditions, the hydrocarbon productivity also increases.
Identification of B. braunii genes related to stress conditionsIt is possible that the inoculation into fresh culture medium was sufficient to stress thecells and induce the expression of the FER2, MBF1A and DAD1 genes. This could suggestthat the increased amount of DAD1 protein may help in the recovery and growth of thecells after inoculation until they are fully recovered after 20 days. This hypothesis has somesupport from other studies. It has been reported that the DAD1 gene was up-regulatedin callus cells of Agapanthus praecox during the recovery stage following inoculation intofresh medium after cryopreservation (Zhang et al., 2015). It was important to know theexpression change of these genes (Fig. 3) because with the low growing rate of 1.4 daysdoubling time, B. braunii cells required around 18 days to recover from the dilution effectafter inoculation. Once recovered, we collected the cells, washed them and after 72 h theywere subjected to the different stress treatments. In these conditions we were able to see thestress response of the DAD1 gene in min without the effect of dilution which was higherafter 7–8 days.
Isolation of the B. braunii DAD1 cDNA and analysis of thecorresponding proteinSequence comparison among DAD1 homologues suggests a conserved role in plant andanimal PCD events (Van der Kop et al., 2003). However, there are interesting differencesat the amino end of the DAD1 proteins where the highest sequence variability is seen for
Cornejo-Corona et al. (2016), PeerJ, DOI 10.7717/peerj.2748 16/27
the algal DAD1 proteins compared to the other DAD1 proteins shown in Fig. 4B. TheDAD1 N-terminus may be important for its association with other proteins. It is knownthat the mammalian OST complex is composed of three membrane proteins: ribophorin I(RI), ribophorin II (RII), and OST48 all bound to the endoplasmic reticulum, and DAD1has been proposed as a fourth subunit of this complex (Silberstein, Kelleher & Gilmore,1992). Yeast two-hybrid experiments revealed affinity between the N-terminal region ofcytoplasmic mammalian DAD1 and the cytoplasmic tail of OST48, which may fix DAD1firmly into the OST complex (Fu, Ren & Kreibich, 1997). Up to now it is unknown if algaehave a similar complex, although DAD1 has been involved in PCD regulation. It has beenreported that DAD1 gene expression is high in metabolically active healthy plant tissues,but declines in the organs committed to die either by senescence or other stress conditions(Orzáez & Granell, 1997).
Complementation of the yeast ost2 knockout strain with theB. braunii DAD1 cDNAExpression of the B. braunii DAD1 cDNA in wild-type yeast or the ost2 knockout lineshowed a slight but significant increase in resistance to tunicamycin (Figs. 5A & 5B).This data suggests the B. braunii DAD1 cDNA is capable of complementing the functionof the yeast OST2 gene and is capable of functioning in the glycosylation of proteins.Complementation of the ost2 knockout with the B. braunii DAD1 was not as strong in thepresence of tunicamycin compared to expression of the OST2 gene in the ost2 knockout(Fig. 5B). This could be due to the promoters used or the differences in codon usagebetween the native OST2 and the heterologous DAD1. Expression of the OST2 gene inthese experiments was controlled by the native promoter and terminator sequences, whichshould allow for the correct complementation in the ost2 knockout. In comparison, the B.braunii DAD1 cDNA was expressed from the constitutive GPD promoter.
qRT-PCR of the B. braunii DAD1 geneConsidering that relative quantification has been proposed as the best method of analyzingdata for qRT-PCR at real time in comparison to absolute quantification, we decidedto perform experiments of DAD1 gene expression under stress treatments relative tountreated control conditions in a time course study (Livak & Schmittgen, 2001). The2�11CT algorithm requires at least one housekeeping gene for analysis. We used �-tubulinin our experiments which indeed showed a uniform gene expression in all samples(Zhang, Ruschhaupt & Biczok, 2010) (Fig. 6). With this method, significant fold changein DAD1 gene expression were observed for short times between 10 and 30 min undersome treatments like SA, MeJA and NaHCO3. At 60 min the equilibrium seems to bereestablished. These results suggest that DAD1 may be a part of the stress responsemechanism that helps to minimize effects produced by ROS accumulation under stresstreatments. Also, these results agree with the proposed role ofDAD1 gene in cell viability aspreviously reported for C. reinhardtii (Pérez-Martín et al., 2014). On the other hand, downregulation of DAD1 expression in C. reinhardtii has been observed in response to UV light,but only after longer times between 30 min and 6 h (Moharikar, D’Souza & Rao, 2007). The
Cornejo-Corona et al. (2016), PeerJ, DOI 10.7717/peerj.2748 17/27
short times of the responses reported in this work suggests that B. braunii quickly sensesthe stress inducers and produces ROS. Additionally, the expression changes in the DAD1gene are manifested in min.
CONCLUSIONSB. braunii has been cultured under a large variety of culture conditions includingtemperature variations (Kalacheva et al., 2002), nitrogen limitation (Zhila, Kalacheva& Volova, 2005); salinity differences (Rao et al., 2007; Zhila, Kalacheva & Volova, 2011),variable light, nutrients, and cultivation time (Ruangsomboon, 2012), different sugars ascarbon sources (Weetall, 1985), different mineral salts like potassium nitrate, magnesiumsulfate, dihydrogen potassium phosphate and ferric citrate (Dayananda et al., 2005), andCO2 levels (Yoshimura, Okada & Honda, 2013). However, most of these studies havebeen done over long time periods of days in order to find the best condition to increasehydrocarbon production. In comparison very little is known about the timing of stressresponses in this organism. Using fluorescent staining to identify ROS production after astress response (Fig. 1), our results show that B. braunii ROS production was triggered atshort times (10 min) after treatment with all stress inducers. Biomass productivity was notaffected by any of the stress inducers and hydrocarbon production was increased only byacetic acid (Table 2).
The DAD1 protein is a highly conserved suppressor of PCD (Sinha et al., 2015) andalthough it is not exactly clear how this protein is related to PCD control, it protectsplant and algal cells from this lethal process (Lindholm et al., 2000; Yamada et al., 2004;Moharikar, D’Souza & Rao, 2007). DAD1 inhibits PCD during several plant processeslike senescence, UV-C exposure, and seed development (Rantong & Gunawardena, 2015).According to the transcriptome data, we found that theDAD1 gene of B. brauniiwas highlyexpressed after inoculation of cells into fresh medium and declined after 15 days (Fig. 3).During stress treatments, DAD1 was strongly up-regulated by SA in the first 10 min (Fig.6). These results suggest that DAD1 may help minimize stress effects induced by the ROSinduced by SA treatment. Even though B. braunii cells are embedded in a complex ECM,externally applied molecules are still able to penetrate the cells and induce ROS production(Fig. 1), within minutes resulting in stronger transcription of the gene DAD1 (Fig. 6).
Finally, recovery of the yeastOST2 phenotype by the DAD1 cDNA of B. braunii suggeststhat the corresponding protein is involved in the N-glycosylation process as is expected forthe function of the DAD1 protein. It is possible thatDAD1may be part of a rapid sensing ordefense mechanism allowing the alga to adapt as fast as possible to changing environmentalconditions. In spite of these results, we cannot directly correlate DAD1 function in thePCD process of B. braunii. More experiments are required to confirm the role of B. brauniiDAD1 in PCD, such as those carried out in A. thaliana where DAD1 overexpression clearlydemonstrated PCD inhibition under stress conditions (Hogg et al., 2011).
Cornejo-Corona et al. (2016), PeerJ, DOI 10.7717/peerj.2748 18/27
ACKNOWLEDGEMENTSWe thank Dr. Plinio Guzmán-Villate from Departamento de Ingeniería GenéticaCINVESTAV-IPN Irapuato, Guanajuato, México for his expertise, valuable advice, andsupport with the yeast work.
ADDITIONAL INFORMATION AND DECLARATIONS
FundingThis work was supported by a PhD scholarship to IC-C from Consejo Nacional de Cienciay Tecnología (CONACYT) Mexico, a grant from the 2012 Texas A&M University—CONACYT Collaborative Research Grant Program to EL-G and TPD, and grant #1240478 from the National Science Foundation (NSF) Emerging Frontiers in Research andInnovation (EFRI) to TPD. The funders had no role in study design, data collection andanalysis, decision to publish, or preparation of the manuscript.
Grant DisclosuresThe following grant information was disclosed by the authors:Consejo Nacional de Ciencia y Tecnología (CONACYT) Mexico.2012 Texas A&M University—CONACYT Collaborative Research Grant Program.National Science Foundation (NSF) Emerging Frontiers in Research and Innovation(EFRI): #1240478.
Competing InterestsThe authors declare there are no competing interests.
Author Contributions• Ivette Cornejo-Corona and Daniel R. Browne conceived and designed the experiments,performed the experiments, analyzed the data, wrote the paper, prepared figures and/ortables, reviewed drafts of the paper.
• Hem R. Thapa conceived and designed the experiments, performed the experiments,analyzed the data, wrote the paper, reviewed drafts of the paper.
• Timothy P. Devarenne conceived and designed the experiments, analyzed the data,contributed reagents/materials/analysis tools, wrote the paper, reviewed drafts of thepaper.
• Edmundo Lozoya-Gloria conceived and designed the experiments, analyzed the data,contributed reagents/materials/analysis tools, wrote the paper, prepared figures and/ortables, reviewed drafts of the paper.
DNA DepositionThe following information was supplied regarding the deposition of DNA sequences:
GenBank: KU746841.
Data AvailabilityThe following information was supplied regarding data availability:
The raw data have been supplied as Supplementary Files.
Cornejo-Corona et al. (2016), PeerJ, DOI 10.7717/peerj.2748 19/27
Supplemental InformationSupplemental information for this article can be found online at http://dx.doi.org/10.7717/peerj.2748#supplemental-information.
REFERENCESAdam Z, Adamska I, Nakabayashi K, Ostersetzer O, Haussuhl K, Manuell A, Clarke
AK. 2001. Chloroplast and mitochondrial proteases in Arabidopsis. A proposednomenclature. Plant Physiology 125:1912–1918 DOI 10.1104/pp.125.4.1912.
Affenzeller MJ, Darehshouri A, Andosch A, Lütz C, Lütz-Meindl U. 2009. Salt stress-induced cell death in the unicellular green algaMicrasterias denticulata. Journal ofExperimental Botany 60:939–954 DOI 10.1093/jxb/ern348.
Ahmed F, Fanning K, Netzel M, Schenk PM. 2015. Induced carotenoid accumulation inDunaliella salina and Tetraselmis suecica by plant hormones and UV-C radiation. Ap-plied Microbiology and Biotechnology 99:9407–9416 DOI 10.1007/s00253-015-6792-x.
Ambati RR, Ravi S, Aswathanarayana RG. 2010. Enhancement of carotenoids in greenalga-Botryococcus braunii in various autotrophic media under stress conditions.International Journal of Biomedical and Pharmaceutical Sciences 4:87–92.
Apel K, Hirt H. 2004. Reactive oxygen species: metabolism, oxidative stress, and signaltransduction. Annual Review of Plant Biology 55:373–399DOI 10.1146/annurev.arplant.55.031903.141701.
Banerjee A, Sharma R, Chisti Y, Banerjee UC. 2002. Botryococcus braunii: a renewablesource of hydrocarbons and other chemicals. Critical Reviews in Biotechnology22:245–279 DOI 10.1080/07388550290789513.
Brown AC, Knights BA, Conway E. 1969.Hydrocarbon content and its relationship tophysiological state in the green alga Botryococcus braunii. Phytochemistry 8:543–547DOI 10.1016/S0031-9422(00)85397-2.
Cheloni G, Cosio C, Slaveykova VI. 2014. Antagonistic and synergistic effects oflight irradiation on the effects of copper on Chlamydomonas reinhardtii. AquaticToxicology 155:275–282 DOI 10.1016/j.aquatox.2014.07.010.
Cornejo-Corona I, Thapa HR, Devarenne TP, Lozoya-Gloria E. 2015. The biofuelpotential of the green colonial microalga Botryococcus braunii. In: Torres-BustillosLG, ed.Microalgae and other phototrophic bacteria. Culture, processing, recovery andnew products. New York: Nova Science Publishers, Inc., 41–58.
Davis RW, Jones HD, Collins AM, Ricken JB, Sinclair MB, Timlin JA, Singh S. 2014.Label-free measurement of algal triacylglyceride production using fluorescencehyperspectral imaging. Algal Research 5:181–189 DOI 10.1016/j.algal.2013.11.010.
Dayananda C, Sarada R, Bhattacharya S, Ravishankar GA. 2005. Effect of media andculture conditions on growth and hydrocarbon production by Botryococcus braunii.Process Biochemistry 40:3125–3131 DOI 10.1016/j.procbio.2005.03.006.
Dayananda C, Sarada R, Kumar V, Ravishankar GA. 2007. Isolation and character-ization of hydrocarbon producing green alga Botryococcus braunii from Indian
Cornejo-Corona et al. (2016), PeerJ, DOI 10.7717/peerj.2748 20/27
freshwater bodies. Electronic Journal of Biotechnology 10:78–91DOI 10.2225/vol10-issue1-fulltext-11.
Dorey S, Baillieul F, Pierrel MA, Saindrenan P, Fritig B, Kauffmann S. 1997. Spatial andtemporal induction of cell death, defense genes, and accumulation of salicylic acid intobacco leaves reacting hypersensitively to a fungal glycoprotein elicitor.MolecularPlant-Microbe Interactions 10:646–655 DOI 10.1094/MPMI.1997.10.5.646.
Fu J, RenM, Kreibich G. 1997. Interactions among subunits of the oligosaccha-ryltransferase complex. Journal of Biological Chemistry 272:29687–29692DOI 10.1074/jbc.272.47.29687.
Gallois P, Makishima T, Hecht V, Despres B, Laudié M, Nishimoto T, Cooke R. 1997.An Arabidopsis thaliana cDNA complementing a hamster apoptosis suppressormutant. Plant Journal 11:1325–1331 DOI 10.1046/j.1365-313X.1997.11061325.x.
Gao Z, Lin Y,Wang X,Wei M, Yang F, Shi Q. 2014. Sodium nitroprusside (SNP)alleviates the oxidative stress induced by NaHCO3 and protects chloroplast fromdamage in cucumber. African Journal of Biotechnology 11:6974–6982.
Gemelli C, Dongmo BM, Ferrarini F, Grande A, Corsi L. 2014. Cytotoxic effect of heminin colonic epithelial cell line: involvement of 18kDa translocator protein (TSPO). LifeSciences 107:14–20 DOI 10.1016/j.lfs.2014.04.026.
Gietz RD,Woods RA. 2002. Transformation of yeast by lithium acetate/single-strandedcarrier DNA/polyethylene glycol method.Methods in Enzymology 350:87–96DOI 10.1016/S0076-6879(02)50957-5.
Gil MJ, Coego A, Mauch-Mani B, Jordá L, Vera P. 2005. The Arabidopsis csb3 mu-tant reveals a regulatory link between salicylic acid-mediated disease resistanceand the methyl-erythritol 4-phosphate pathway. Plant Journal 44:155–166DOI 10.1111/j.1365-313X.2005.02517.x.
GrungM,Metzger P, Berkaloff C, Liaaen-Jensen S. 1994. Studies on the formation andlocalization of primary and secondary carotenoids in the green alga Botryococcusbraunii, including the regreening process. Comparative Biochemistry and PhysiologyPart B: Comparative Biochemistry 107:265–272 DOI 10.1016/0305-0491(94)90049-3.
GrungM,Metzger P, Liaaen-Jensen S. 1989. Primary and secondary carotenoids in tworaces of the green alga Botryococcus braunii. Biochemical Systematics and Ecology17:263–269 DOI 10.1016/0305-1978(89)90001-X.
Hauptmann P, Riel C, Kunz-Schughart LA, Fröhxlich KU, Madeo F, Lehle L. 2006.Defects in N-glycosylation induce apoptosis in yeast.Molecular Microbiology59:765–778 DOI 10.1111/j.1365-2958.2005.04981.x.
Hebelstrup KH,Møller IM. 2015. Mitochondrial signaling in plants under hypoxia:use of reactive oxygen species (ROS) and reactive nitrogen species (RNS). In:Gupta KJ, Igamberdiev AU, eds. Reactive oxygen and nitrogen species signaling andcommunication in plants. Cham: Springer International Publishing, 63–77.
Hifney AF, Abdel-Basset R. 2014. Photosynthesis, respiration and carotenoid contents inthe green alga Botryococcus braunii at elevated nutrient levels. Journal of Biology andEarth Sciences 4:B191–B198.
Cornejo-Corona et al. (2016), PeerJ, DOI 10.7717/peerj.2748 21/27
Ho CH,Magtanong L, Barker SL, GreshamD, Nishimura S, Natarajan P, Koh JLY,Porter J, A Gray CH, Andersen RJ, Giaever G, Nislow C, Andrews B, Botstein D,Graham TR, YoshidaM, Boone C. 2009. A molecular barcoded yeast ORF libraryenables mode-of-action analysis of bioactive compounds. Nature Biotechnology27:369–377 DOI 10.1038/nbt.1534.
Hogg BV, Kacprzyk J, Molony EM, O’Reilly C, Gallagher TF, Gallois P, McCabe PF.2011. An in vivo root hair assay for determining rates of apoptotic-like programmedcell death in plants. Plant Methods 7:1–9 DOI 10.1186/1746-4811-7-1.
Ismail AM, AlhamdMA, Galal HRM, Nasr-Eldeen FA. 2011.Modification of photo-synthetic pigments, osmotic solutes and ions accumulation in Chlorella vulgaris andwheat cv. Sds-1 seedlings under the influence of NaCl with salicylic acids. ResearchJournal of Botany 6:100–111 DOI 10.3923/rjb.2011.100.111.
Kalacheva GS, Zhila NO, Volova TG, GladyshevMI. 2002. The effect of temperature onthe lipid composition of the green alga Botryococcus.Microbiology 71:286–293DOI 10.1023/A:1015898426573.
Knauer R, Lehle L. 1999. The oligosaccharyltransferase complex from yeast. Biochimica etBiophysica Acta (BBA)-General Subjects 142:259–273DOI 10.1016/S0304-4165(98)00128-7.
KongWB, Song H, Hua SF, Yang H, Yang Q, Xia CG. 2012. Enhancement of biomassand hydrocarbon productivities of Botryococcus braunii by mixotrophic cultivationand its application in brewery wastewater treatment. African Journal of MicrobiologyResearch 6:1489–1496 DOI 10.5897/AJMR11.1349.
Kuo SC, Lampen JO. 1976. Tunicamycin inhibition of [3H] glucosamine incorporationinto yeast glycoproteins: binding of tunicamycin and interaction with phospholipids.Archives of Biochemistry and Biophysics 172:574–581DOI 10.1016/0003-9861(76)90110-7.
Küpper FC, Gaquerel E, Cosse A, Adas F, Peters AF, Müller DG, Potin P. 2009. Freefatty acids and methyl jasmonate trigger defense reactions in Laminaria digitata.Plant Cell Physiology 50:789–800 DOI 10.1093/pcp/pcp023.
Ledford HK, Niyogi KK. 2005. Singlet oxygen and photo-oxidative stress management inplants and algae. Plant, Cell & Environment 28:1037–1045DOI 10.1111/j.1365-3040.2005.01374.x.
Li Y, Qin JG. 2005. Comparison of growth and lipid content in three Botryococcus brauniistrains. Journal of Applied Phycology 17:551–556 DOI 10.1007/s10811-005-9005-7.
Lindholm P, Kuittinen T, Sorri O, Guo D, Merits A, Törmäkangas K, Runeberg-Roos P.2000. Glycosylation of phytepsin and expression of dad1, dad2 and ost1 during onsetof cell death in germinating barley scutella.Mechanisms of Development 93:169–173DOI 10.1016/S0925-4773(00)00254-9.
Livak KJ, Schmittgen TD. 2001. Analysis of relative gene expression data usingreal-time quantitative PCR and the 2�11CT method.Methods 25:402–408DOI 10.1006/meth.2001.1262.
Lopez D, Casero D, Cokus SJ, Merchant SS, Pellegrini M. 2011. Algal functionalannotation tool: a web-based analysis suite to functionally interpret large gene lists
Cornejo-Corona et al. (2016), PeerJ, DOI 10.7717/peerj.2748 22/27
using integrated annotation and expression data. BMC Bioinformatics 12:282DOI 10.1186/1471-2105-12-282.
López-Gómez R, Gómez-LimM. 1992. A method for extracting intact RNA from fruitsrich in polysaccharides using ripe mango mesocarp. HortScience 27:440–442.
Makishima T, Nakashima T, Nagata-Kuno K, Fukushima K, Iida H, SakaguchiM, Ikehara Y, Komiyama S, Nishimoto T. 1997. The highly conserved DAD1protein involved in apoptosis is required for N-linked glycosylation. Genes to Cells2:129–141 DOI 10.1046/j.1365-2443.1997.1070303.x.
Mallick N, Mohn FH. 2000. Reactive oxygen species: response of algal cells. Journal ofPlant Physiology 157:183–193 DOI 10.1016/S0176-1617(00)80189-3.
Metzger P, Largeau C. 2005. Botryococcus braunii: a rich source for hydrocarbons andrelated ether lipids. Applied Microbiology and Biotechnology 66:486–496DOI 10.1007/s00253-004-1779-z.
Mitsuhara I, Iwai T, Seo S, Yanagawa Y, Kawahigasi H, Hirose S, Ohkawa Y, OhashiY. 2008. Characteristic expression of twelve rice PR1 family genes in response topathogen infection, wounding, and defense-related signal compounds (121/180).Molecular Genetics and Genomics 279:415–427.
Mittler R, Vanderauwera S, Gollery M, Van Breusegem F. 2004. Reactive oxygen genenetwork of plants. Trends in Plant Science 9:490–498DOI 10.1016/j.tplants.2004.08.009.
Moharikar S, D’Souza JS, Rao BJ. 2007. A homologue of the defender against theapoptotic death gene dad1 in UV-exposed Chlamydomonas cells is downregulatedwith the onset of programmed cell death. Journal of Biosciences 32:261–270DOI 10.1007/s12038-007-0026-z.
Morosinotto T, Bassi R. 2014. Molecular mechanisms for activation of non-photochemical fluorescence quenching: from unicellular algae to mosses andhigher plants. In: Demmig-Adams B, Garab G, Adams III W, Govindjee, eds. Non-photochemical quenching and energy dissipation in plants, algae and cyanobacteria.Advances in photosynthesis and respiration, vol. 40. Dordrecht: Springer Netherlands,315–331.
Mudgil Y, Shiu SH, Stone SL, Salt JN, Goring DR. 2004. A large complement of thepredicted Arabidopsis ARM repeat proteins are members of the U-box E3 ubiquitinligase family. Plant Physiology 134:59–66 DOI 10.1104/pp.103.029553.
Mumberg D, Mailer R, FunkM. 1995. Yeast vectors for the controlled expressionof heterologous proteins in different genetic backgrounds. Gene 156:119–122DOI 10.1016/0378-1119(95)00037-7.
Murgia I, Vazzola V, Tarantino D, Cellier F, Ravet K, Briat JF, Soave C. 2007. Knock-out of ferritin AtFer1 causes earlier onset of age-dependent leaf senescence inArabidopsis. Plant Physiology and Biochemistry 45:898–907DOI 10.1016/j.plaphy.2007.09.007.
Nakashima T, Sekiguchi T, Kuraoka A, Fukushima K, Shibata Y, Komiyama S,Nishimoto T. 1993.Molecular cloning of a human cDNA encoding a novel protein,
Cornejo-Corona et al. (2016), PeerJ, DOI 10.7717/peerj.2748 23/27
DAD1, whose defect causes apoptotic cell death in hamster BHK21 cells.Molecularand Cellular Biology 13:6367–6374 DOI 10.1128/MCB.13.10.6367.
Nishimoto T. 1997. The highly conserved DAD1 protein involved in apoptosis isrequired for N-linked glycosylation. Genes to Cells 2:129–141DOI 10.1046/j.1365-2443.1997.1070303.x.
Nonomura AM. 1988. Botryococcus braunii var. showa (Chlorophyceae) from Berkeley,California, United States of America. Japanese Journal of Phycoly 36:285–291.
Oliveira MDM, Varanda CMR, Félix MRF. 2016. Induced resistance during the inter-action pathogen x plant and the use of resistance inducers. Phytochemistry Letters15:152–158 DOI 10.1016/j.phytol.2015.12.011.
Orzáez D, Granell A. 1997. The plant homologue of the defender against apoptoticdeath gene is down-regulated during senescence of flower petals. FEBS Letters404:275–278 DOI 10.1016/S0014-5793(97)00133-6.
Pancha I, Chokshi K, Maurya R, Trivedi K, Patidar SK, Ghosh A, Mishra S. 2015.Salinity induced oxidative stress enhanced biofuel production potential of mi-croalgae Scenedesmus sp. CCNM 1077. Bioresource Technology 189:341–348DOI 10.1016/j.biortech.2015.04.017.
Panchuk II, Volkov RA, Schöffl F. 2002.Heat stress-and heat shock transcription factor-dependent expression and activity of ascorbate peroxidase in Arabidopsis. PlantPhysiology 129:838–853 DOI 10.1104/pp.001362.
Pérez-Martín M, Pérez-Pérez ME, Lemaire SD, Crespo JL. 2014. Oxidative stresscontributes to autophagy induction in response to endoplasmic reticulum stress inChlamydomonas reinhardtii. Plant Physiology 166:997–1008DOI 10.1104/pp.114.243659.
Petrov V, Hille J, Mueller-Roeber B, Gechev TS. 2015. ROS-mediated abiotic stress-induced programmed cell death in plants. Frontiers in Plant Science 6: Article 69DOI 10.3389/fpls.2015.00069.
Rantong G, Gunawardena AH. 2015. Programmed cell death: genes involved insignaling, regulation, and execution in plants and animals. Botany 93:193–210DOI 10.1139/cjb-2014-0152.
Rao AR, Baskaran V, Sarada R, Ravishankar GA. 2013. In vivo bioavailability andantioxidant activity of carotenoids from microalgal biomass—A repeated dose study.Food Research International 54:711–717 DOI 10.1016/j.foodres.2013.07.067.
Rao AR, Dayananda C, Sarada R, Shamala TR, Ravishankar GA. 2007. Effect of salinityon growth of green alga Botryococcus braunii and its constituents. BioresourceTechnology 98:560–564 DOI 10.1016/j.biortech.2006.02.007.
Rao AR, Sarada R, Baskaran V, Ravishankar GA. 2006. Antioxidant activity of Botry-ococcus braunii extract elucidated in vitromodels. Journal of Agricultural and FoodChemistry 54:4593–4599 DOI 10.1021/jf060799j.
Ruangsomboon S. 2012. Effect of light, nutrient, cultivation time and salinity on lipidproduction of newly isolated strain of the green microalga, Botryococcus brauniiKMITL 2. Bioresource Technology 109:261–265 DOI 10.1016/j.biortech.2011.07.025.
Cornejo-Corona et al. (2016), PeerJ, DOI 10.7717/peerj.2748 24/27
Sánchez JP, Duque P, Chua NH. 2004. ABA activates ADPR cyclase and cADPR inducesa subset of AB-responsive genes in Arabidopsis. The Plant Journal 38:381–395DOI 10.1111/j.1365-313X.2004.02055.x.
Segovia M, Haramaty L, Berges JA, Falkowski PG. 2003. Cell death in the uni-cellular chlorophyte Dunaliella tertiolecta. A hypothesis on the evolutionof apoptosis in higher plants and metazoans. Plant Physiology 132:99–105DOI 10.1104/pp.102.017129.
SewelamN, Kazan K, Schenk PM. 2016. Global plant stress signaling: reactive oxygenspecies at the cross-road. Frontiers in Plant Science 7: Article 187DOI 10.3389/fpls.2016.00187.
Shun-bin N, LingW,Wei-wei JIN, Yun-chun S. 2001. Expression of dad1 in maize seeddevelopment. Developmental & Reproductive Biology 11:53–62.
Silberstein S, Collins PG, Kelleher DJ, Gilmore R. 1995. The essential OST2 geneencodes the 16-kD subunit of the yeast oligosaccharyltransferase, a highly con-served protein expressed in diverse eukaryotic organisms. Journal of Cell Biology131:371–383 DOI 10.1083/jcb.131.2.371.
Silberstein S, Kelleher DJ, Gilmore R. 1992. The 48-kDa subunit of the mammalianoligosaccharyltransferase complex is homologous to the essential yeast proteinWBP1. Journal of Biological Chemistry 267:23658–23663.
Sinha DK, Atray I, Bentur JS, Nair S. 2015. Feeding on resistant rice leads to enhancedexpression of defender against apoptotic cell death (OoDAD1) in the Asian rice gallmidge. BMC Plant Biology 15:1 DOI 10.1186/s12870-014-0410-4.
Stod∑lková E, Císa∞ová I, Kola∞ík M, Chudí£kováM, Novák P, Man P, KzumaM, Pavi∑ B, Éern˝ J, Flieger M. 2015. Biologically active metabolites pro-duced by the basidiomycete Quambalaria cyanescens. PLoS ONE 10:e0118913DOI 10.1371/journal.pone.0118913.
Sugiura M, Takagi H. 2006. Yeast cell death caused by mutation of the OST2 geneencoding the epsilon-subunit of Saccharomyces cerevisiae oligosaccharyltransferase.Bioscience, Biotechnology and Biochemistry 70:1234–1241 DOI 10.1271/bbb.70.1234.
Suzuki N, Rizhsky L, Liang H, Shuman J, Shulaev V, Mittler R. 2005. Enhancedtolerance to environmental stress in transgenic plants expressing the transcriptionalcoactivator multiprotein bridging factor 1c. Plant Physiology 139:1313–1322DOI 10.1104/pp.105.070110.
Tanoi T, Kawachi M,WatanabeMM. 2011. Effects of carbon source on growth andmorphology of Botryococcus braunii. Journal of Applied Phycology 23:25–33DOI 10.1007/s10811-010-9528-4.
Tarantino D, Petit JM, Lobreaux S, Briat JF, Soave C, Murgia I. 2003. Differentialinvolvement of the IDRS cis-element in the developmental and environmentalregulation of the AtFer1 ferritin gene from Arabidopsis. Planta 217:709–716DOI 10.1007/s00425-003-1038-z.
TenaudM, Ohmori M, Miyachi S. 1989. Inorganic carbon and acetate assimila-tion in Botryococcus braunii (Chlorophyta). Journal of Phycology 25:662–667DOI 10.1111/j.0022-3646.1989.00662.x.
Cornejo-Corona et al. (2016), PeerJ, DOI 10.7717/peerj.2748 25/27
Thomas P, Sekhar AC, Upreti R, MujawarMM, Pasha SS. 2015. Optimization of singleplate-serial dilution spotting SP-SDS with sample anchoring as an assured methodfor bacterial and yeast cfu enumeration and single colony isolation from diversesamples. Biotechnology Reports 8:45–55 DOI 10.1016/j.btre.2015.08.003.
Torres MA, Jones JD, Dangl JL. 2006. Reactive oxygen species signaling in response topathogens. Plant Physiology 141:373–378 DOI 10.1104/pp.106.079467.
Van der Kop DA, Ruys G, Dees D, Van der Schoot C, Douwe de Boer A, Van DoornWG. 2003. Expression of defender against apoptotic death (DAD1) in Iris andDianthus petals. Physiologia Plantarum 117:256–263DOI 10.1034/j.1399-3054.2003.1170213.x.
Van DoornWG,Woltering EJ. 2005.Many ways to exit? Cell death categories in plants.Trends in Plant Science 10:117–122 DOI 10.1016/j.tplants.2005.01.006.
Wang K, Gan L, Kuo CL, Hood L. 1997. A highly conserved apoptotic suppressor gene islocated near the chicken T-cell receptor alpha chain constant region. Immunogenetics46:376–382 DOI 10.1007/s002510050291.
Wang J, Yang SL, CongW, Cai ZL. 2003. Effect of nutrient conditions on the growth ofBotryococcus braunii. Chinese Journal of Process Engineering 3:141–145.
Weetall HH. 1985. Studies on the nutritional requirements of the oil-producingalga Botryococcus braunii. Applied Biochemistry and Biotechnology 11:377–391DOI 10.1007/BF02798671.
Winzeler EA, Shoemaker DD, Astromoff A, Liang H, Anderson K, Andre B, Chu AM.1999. Functional characterization of the S. cerevisiae genome by gene deletion andparallel analysis. Science 285:901–906 DOI 10.1126/science.285.5429.901.
Xiao H, Smeekens JM,Wu R. 2016. Quantification of tunicamycin-induced pro-tein expression and N-glycosylation changes in yeast. Analyst 141:3737–3745DOI 10.1039/C6AN00144K.
Yamada T, Takatsu Y, KasumiM,MarubashiW, Ichimura K. 2004. A homolog of thedefender against apoptotic death gene DAD1 in senescing gladiolus petals is down-regulated prior to the onset of programmed cell death. Journal of Plant Physiology161:1281–1283 DOI 10.1016/j.jplph.2004.06.005.
Yang H, Tatebayashi K, Yamamoto K, Saito H. 2009. Glycosylation defects activatefilamentous growth Kss1 MAPK and inhibit osmoregulatory Hog1 MAPK. EMBOJournal 28:1380–1391 DOI 10.1038/emboj.2009.104.
Yilancioglu K, Cokol M, Pastirmaci I, Erman B, Cetiner S. 2014. Oxidative stress is amediator for increased lipid accumulation in a newly isolated Dunaliella salina strain.PLoS ONE 9:e91957 DOI 10.1371/journal.pone.0091957.
Yoshimura T, Okada S, HondaM. 2013. Culture of the hydrocarbon producingmicroalga Botryococcus braunii strain Showa: Optimal CO2, salinity, tem-perature, and irradiance conditions. Bioresource Technology 133:232–239DOI 10.1016/j.biortech.2013.01.095.
Yue CJ, Jiang Y. 2009. Impact of methyl jasmonate on squalene biosynthesisin microalga Schizochytrium mangrovei. Process Biochemistry 44:923–927DOI 10.1016/j.procbio.2009.03.016.
Cornejo-Corona et al. (2016), PeerJ, DOI 10.7717/peerj.2748 26/27
Zhang D, Ren L, Chen GQ, Zhang J, Reed BM, Shen XH. 2015. ROS-induced oxidativestress and apoptosis-like event directly affect the cell viability of cryopreservedembryogenic callus in Agapanthus praecox . Plant Cell Reports 34:1499–1513DOI 10.1007/s00299-015-1802-0.
Zhang JD, Ruschhaupt M, Biczok R. 2010. ddCt method for qRT–PCR data analysis.Available at https://www.bioconductor.org/packages/devel/ bioc/ vignettes/ddCt/ inst/doc/ rtPCR.pdf.
Zhila NO, Kalacheva GS, Volova TG. 2005. Effect of nitrogen limitation on the growthand lipid composition of the green alga Botryococcus braunii Kutz IPPAS H-252.Russian Journal of Plant Physiology 52:311–319 DOI 10.1007/s11183-005-0047-0.
Zhila NO, Kalacheva GS, Volova TG. 2011. Effect of salinity on the biochemicalcomposition of the alga Botryococcus braunii Kütz IPPAS H-252. Journal of AppliedPhycology 23:47–52 DOI 10.1007/s10811-010-9532-8.
Zhou J, Zhang H, Liu X,Wang PG, Qi Q. 2007. Influence of N-glycosylation on Sac-charomyces cerevisiae morphology: a golgi glycosylation mutant shows cell divisiondefects. Current Microbiology 55:198–204 DOI 10.1007/s00284-006-0585-5.
Zuo Z, Chen Z, Shi M, Zhu Y, Bai Y,Wang Y. 2015. Reactive oxygen species contributeto the release of volatile organic compounds from Chlamydomonas reinhardtii duringprogrammed cell death. Phycology Research 63:37–42 DOI 10.1111/pre.12071.
Zuo Z, Zhu Y, Bai Y,Wang Y. 2012a. Acetic acid-induced programmed cell deathand release of volatile organic compounds in Chlamydomonas reinhardtii. PlantPhysiology and Biochemistry 51:175–184 DOI 10.1016/j.plaphy.2011.11.003.
Zuo ZJ, Zhu YR, Bai YL,Wang Y. 2012b. Volatile communication between Chlamy-domonas reinhardtii cells under salt stress. Biochemical Systematics and Ecology40:19–24 DOI 10.1016/j.bse.2011.09.007.
Cornejo-Corona et al. (2016), PeerJ, DOI 10.7717/peerj.2748 27/27


![arXiv:1702.01932v1 [cs.CL] 7 Feb 2017 · model aimed at producing more contentful responses without slot filling. We gener-alize the widely-used SEQ2SEQ approach by conditioning](https://img.pdfslide.us/doc/110x75/5faa6f9b1699493f7c4ff033/arxiv170201932v1-cscl-7-feb-2017-model-aimed-at-producing-more-contentful-responses.jpg)