Embed Size (px)
Citation preview
Originally published as: Roth, F., Fleckenstein, P. (2001): Stress orientations found in NE Germany differ from the West European trend. - Terra Nova, 13, 4, 289-296 DOI: 10.1046/j.1365-3121.2001.00357.x
Stress Orientations Found in NE Germany Differ from the West European Trend
F. Roth (Division "Solid Earth Physics and Disaster Research", GeoForschungsZentrum Potsdam (GFZ),
Telegraphenberg, D-14473 Potsdam, Fed. Rep. of Germany), P. Fleckenstein (GeoForschungsZentrum, Potsdam; now at
Geophysical Institute, Karlsruhe University)
ABSTRACT Knowledge about the acting stresses is of crucial importance for understanding the tectonics of a region. Data about the stress field in north-eastern Germany used to be very rare. In general, it was assumed that the orientation of the larger horizontal principal stress (SH) is similar to that found for western Germany and central West-Europe, i.e. NW-SE. To check this, several borehole logs of the late 1980s were analysed for information on the principal horizontal stress orientations: They include Four-Arm-Dipmeter and borehole televiewer data from 15 boreholes. The depth range of our stress results reaches from 1500 to 6700 m. They were compared to a few other data, especially from hydraulic fracturing, and to recent findings on the stresses in the Northwest German basin. In contrast to the expectations, SH derived from breakout orientations below the salt layers displayed N to NE orientation. The latter was found at 10 locations spread over the NE-German basin from Berlin to the Baltic sea, from the Polish border to the former border between East and West Germany. Moreover, this stress rotation in the sub-saline formations seems to be the continuation of a trend found in the NW German basin.
Introduction The knowledge of orientation and strength of the main tectonic stress is the basis for understanding many geodynamic processes like orogeny, subduction, intra-plate deformation, earthquakes, etc. The patterns of orientation and magnitude of the tectonic stress field can provide information about the active forces.
Moreover, the knowledge of tectonic stress is also of economic interest. On one hand, it contributes to solve problems concerning rock stability in planning big constructions like tunnels or water reservoirs, for mining as well as during drilling. On the other hand, the permeability of porous rocks and of fractures is influenced by stress. Permeability is one of the key issues in characterising the quality of reservoirs. Moreover, for the extraction of hot water for geothermal energy as well as in hydrocarbon-exploitation, often hydraulic fracturing is carried out to increase production. To prepare these operations knowledge about the direction of existing open fractures and about the orientation of tectonic stress is necessary in order to foresee the trend of the newly generated fractures (c.f. e.g. Bell, 1990).
The tectonic setting The Northeast-German basin (NEGB) is part of the southern Permian basin, following Ziegler (1990). It is situated between the Transeuropean Suture zone (TESZ) in the North and the
Elbe fault system in the South. It connects the Polish trough in the East and the North German basin in the West, see Fig. 1. Presently, one would expect that the force system acting on the basin is dominated by the ridge push from the North Atlantic and the northward drift of Africa, resulting in a NW-SE to NNW-SSE orientation of the larger (compressive) horizontal principal stress, as is generally found in central western Europe.
In addition, Scheck and Bayer (1999) state a decoupling of the post-Zechstein succession due on a basin-wide salt layer, continuous through to areas close to the basin borders, and intense halokinesis, that led to a strong deformation of the post-Zechstein layers. The thickness of the salt layer, usually between 500 and 1000 m, reaches locally 4000 m (cf. Scheck and Bayer, 1999, Fig. 8a); its bottom depth, very shallow at the Elbe fault system reaches down to 4,600 m in the basin centre (cf. Tab. 1 and Scheck and Bayer, 1999, Fig. 12b).
The data Logs measured between 1986 and 1990 in 19 wells in NE-Germany, now owned by Erdöl-Erdgas-Gommern GmbH", were checked for stress orientations by detecting tectonically induced borehole breakouts. The tools used for these measurements were Four-Arm-Dipmeters (FED) and a type of borehole televiewer (BHTV) called “Akustischer Bohrloch-Fernseher" (ABF) with optical registration on black-and-white films. These data were compared with stress data found by hydraulic fracturing experiments (Groß, 1989; Palmer and Groß, 1999).
Dipmeter-logs from 14 boreholes were analysed. In our search for breakouts, we followed the quality criteria set-up by Plumb and Hickman (1985) concerning the minimum length of breakouts, their minimum depth etc. In particular, we checked for correlations between the orientation of breakouts and the inclination of the borehole. We excluded from our breakout summary all sections where we found such a correlation to avoid a misinterpretation of key-seats as breakouts. The quality ranging in table 5, mainly dependent on the total length of breakouts and the standard deviation of their orientation, follows the criteria stated in Zoback (1992). Most of the breakouts found, are present in different formations with similar orientation, indicating independence of material properties. The lithology of some of the wells (FEG 1/87, KAA 1/87, and PUD 1/86, cf. Fig. 3) is publicly available in Hoth et al. (1993). Table 1 gives an overview about the depth range of the salt structures. Systematic deviations are discussed below.
Among the logs analysed, those from 9 wells showed breakouts - 1 above and 8 below the Zechstein salt layers (Fig. 2 shows an example). In addition, one ABF-log showed breakouts in the sub-saline formations. The results are summarised in tables 2, and 3.
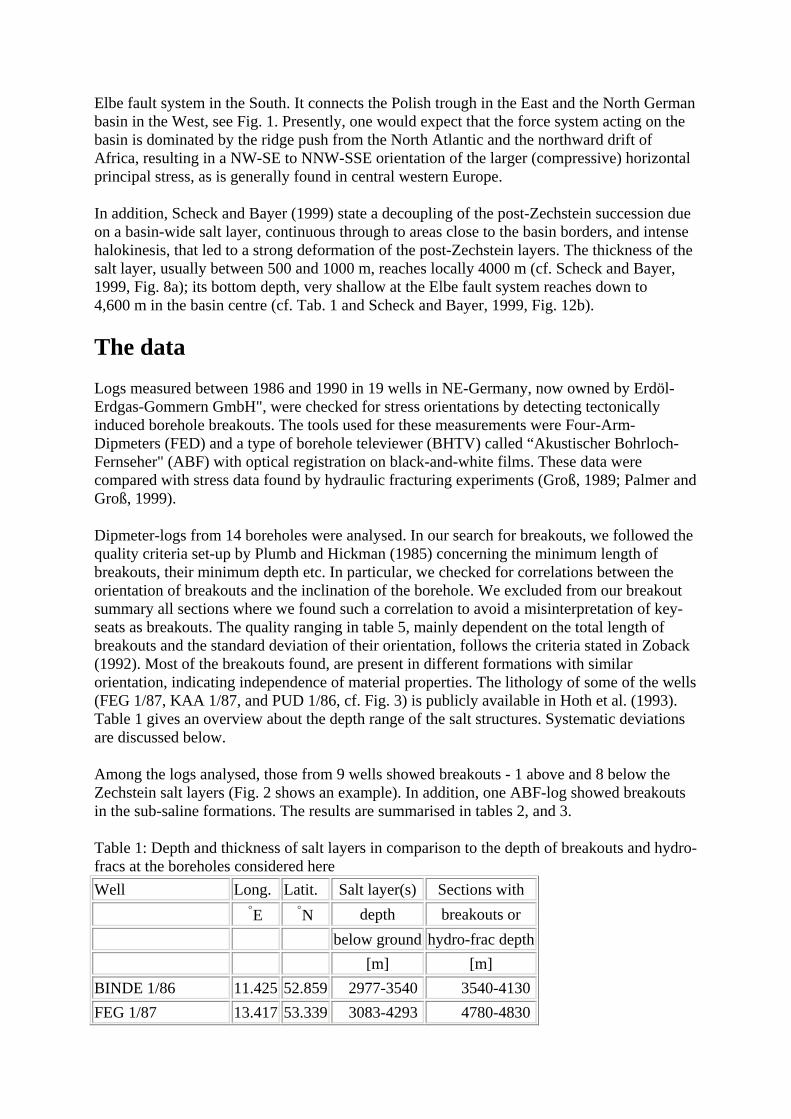
Table 1: Depth and thickness of salt layers in comparison to the depth of breakouts and hydro-fracs at the boreholes considered here Well Long. Latit. Salt layer(s) Sections with °E °N depth breakouts or below ground hydro-frac depth [m] [m] BINDE 1/86 11.425 52.859 2977-3540 3540-4130 FEG 1/87 13.417 53.339 3083-4293 4780-4830
FU 1/88 14.047 52.398 2294-3013 2240-2280 GZO 2/87 14.062 53.246 3211-4044 4030-4260 KAA 1/87 11.064 53.263 3459-4540 4600-5100 3/Dp MAH SW 2/84 11.238 52.863 below 1680 1565-1582 1/E ML 6/71 10.935 52.678 2424-3261 3262-3290 1/E ML 20/79 10.961 52.661 2608-3094∗ 2332 3/E ML 20/79 10.961 52.661 2608-3094∗ 3135 4/E ML 20/79 10.961 52.661 2608-3094∗ 3219 NLN 1/89 11.532 52.879 2898-3786 4000-4160 PES 153A/82 10.967 52.824 900-3209∗ 3190-4160†
2/E PES 166/79 11.114 52.811 2552-3318∗ 2144 1/E PES 233/82 11.075 52.827 2626-3282∗ 2567 3/E PES 233/82 11.075 52.827 2626-3282∗ 2458 4/E PES 166/79 11.114 52.811 2552-3318∗ 3291‡
2/E PES 233/82 11.075 52.827 2626-3282∗ 3275‡
PUD 1/1H86 14.128 53.965 2321-2995 4500-4860 PUD 1/1H86 14.128 53.965 5590-6690 SMO 1/88 10.772 52.817 3129-3811 4100-4210 WRIZ 3/88 13.926 52.765 3075-3871 4310-4320
Remarks: The thickness of the salt layers indicates the area from the top of the uppermost salt layer to the bottom of the lowermost one. Simplified after ]Hoth93 and unpublished information of EEG - Erdgas Erdöl GmbH, Berlin. (∗) Thickness of the entire Zechstein formation; (†) breakouts in subsaline Zechstein and Rotliegendes (cf. Palmer and Groß (1999); (‡) hydro-fracs in subsaline Zechstein (cf. Groß, 1989; Palmer and Groß, 1999).
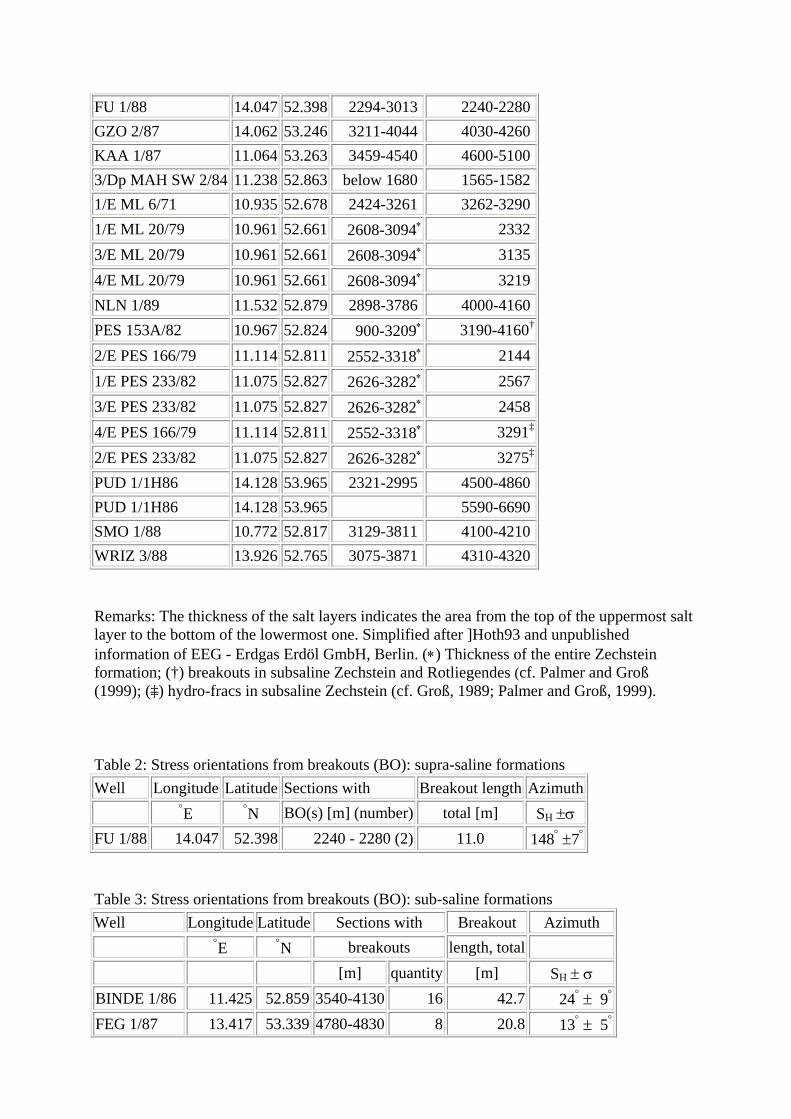
Table 2: Stress orientations from breakouts (BO): supra-saline formations Well Longitude Latitude Sections with Breakout length Azimuth °E °N BO(s) [m] (number) total [m] SH ±σ FU 1/88 14.047 52.398 2240 - 2280 (2) 11.0 148° ±7°
Table 3: Stress orientations from breakouts (BO): sub-saline formations Well Longitude Latitude Sections with Breakout Azimuth °E °N breakouts length, total [m] quantity [m] SH ± σ BINDE 1/86 11.425 52.859 3540-4130 16 42.7 24° ± 9° FEG 1/87 13.417 53.339 4780-4830 8 20.8 13° ± 5°
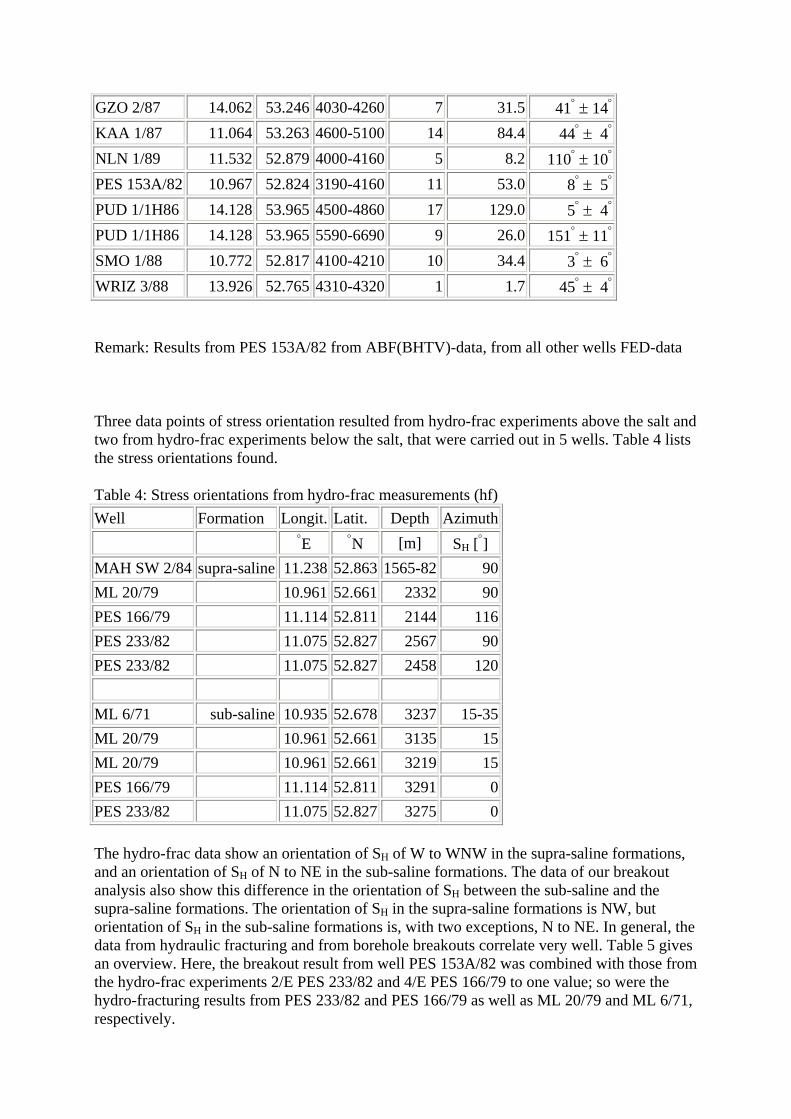
GZO 2/87 14.062 53.246 4030-4260 7 31.5 41° ± 14° KAA 1/87 11.064 53.263 4600-5100 14 84.4 44° ± 4° NLN 1/89 11.532 52.879 4000-4160 5 8.2 110° ± 10° PES 153A/82 10.967 52.824 3190-4160 11 53.0 8° ± 5° PUD 1/1H86 14.128 53.965 4500-4860 17 129.0 5° ± 4° PUD 1/1H86 14.128 53.965 5590-6690 9 26.0 151° ± 11° SMO 1/88 10.772 52.817 4100-4210 10 34.4 3° ± 6° WRIZ 3/88 13.926 52.765 4310-4320 1 1.7 45° ± 4°
Remark: Results from PES 153A/82 from ABF(BHTV)-data, from all other wells FED-data
Three data points of stress orientation resulted from hydro-frac experiments above the salt and two from hydro-frac experiments below the salt, that were carried out in 5 wells. Table 4 lists the stress orientations found.
Table 4: Stress orientations from hydro-frac measurements (hf) Well Formation Longit. Latit. Depth Azimuth °E °N [m] SH [°] MAH SW 2/84 supra-saline 11.238 52.863 1565-82 90 ML 20/79 10.961 52.661 2332 90 PES 166/79 11.114 52.811 2144 116 PES 233/82 11.075 52.827 2567 90 PES 233/82 11.075 52.827 2458 120 ML 6/71 sub-saline 10.935 52.678 3237 15-35 ML 20/79 10.961 52.661 3135 15 ML 20/79 10.961 52.661 3219 15 PES 166/79 11.114 52.811 3291 0 PES 233/82 11.075 52.827 3275 0
The hydro-frac data show an orientation of SH of W to WNW in the supra-saline formations, and an orientation of SH of N to NE in the sub-saline formations. The data of our breakout analysis also show this difference in the orientation of SH between the sub-saline and the supra-saline formations. The orientation of SH in the supra-saline formations is NW, but orientation of SH in the sub-saline formations is, with two exceptions, N to NE. In general, the data from hydraulic fracturing and from borehole breakouts correlate very well. Table 5 gives an overview. Here, the breakout result from well PES 153A/82 was combined with those from the hydro-frac experiments 2/E PES 233/82 and 4/E PES 166/79 to one value; so were the hydro-fracturing results from PES 233/82 and PES 166/79 as well as ML 20/79 and ML 6/71, respectively.
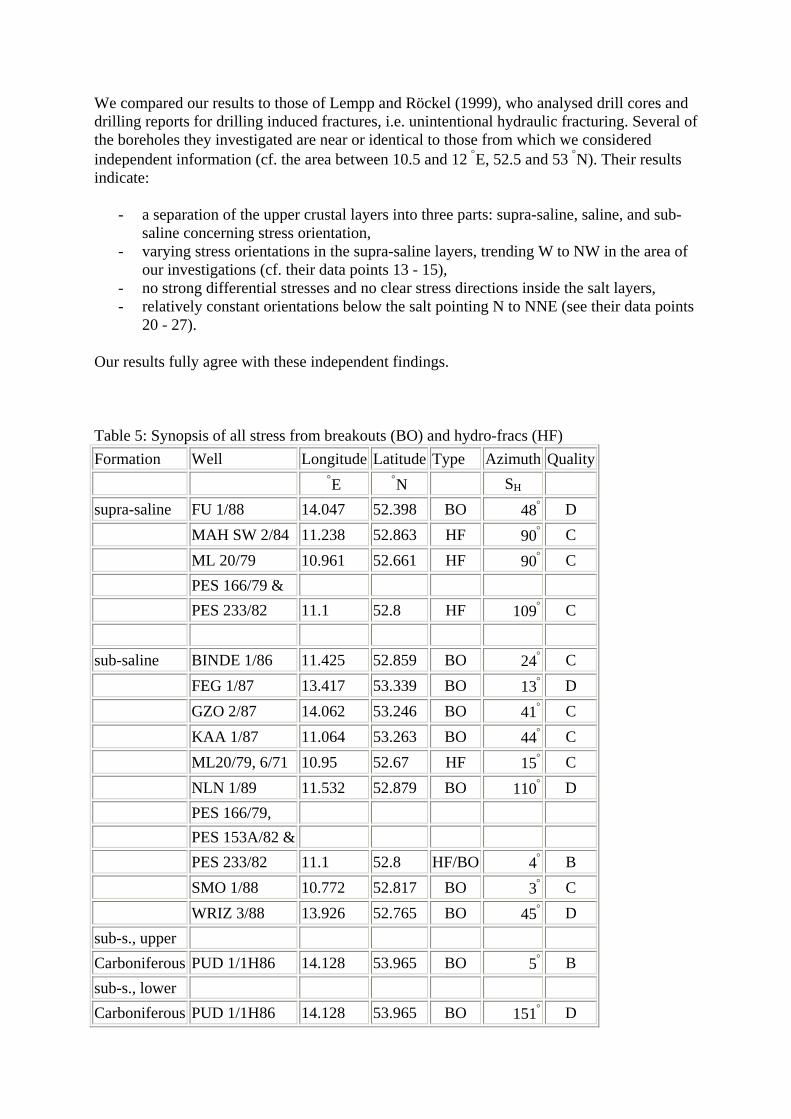
We compared our results to those of Lempp and Röckel (1999), who analysed drill cores and drilling reports for drilling induced fractures, i.e. unintentional hydraulic fracturing. Several of the boreholes they investigated are near or identical to those from which we considered independent information (cf. the area between 10.5 and 12 °E, 52.5 and 53 °N). Their results indicate:
- a separation of the upper crustal layers into three parts: supra-saline, saline, and sub-saline concerning stress orientation,
- varying stress orientations in the supra-saline layers, trending W to NW in the area of our investigations (cf. their data points 13 - 15),
- no strong differential stresses and no clear stress directions inside the salt layers, - relatively constant orientations below the salt pointing N to NNE (see their data points
20 - 27).
Our results fully agree with these independent findings.
Table 5: Synopsis of all stress from breakouts (BO) and hydro-fracs (HF) Formation Well Longitude Latitude Type Azimuth Quality °E °N SH supra-saline FU 1/88 14.047 52.398 BO 48° D MAH SW 2/84 11.238 52.863 HF 90° C ML 20/79 10.961 52.661 HF 90° C PES 166/79 & PES 233/82 11.1 52.8 HF 109° C sub-saline BINDE 1/86 11.425 52.859 BO 24° C FEG 1/87 13.417 53.339 BO 13° D GZO 2/87 14.062 53.246 BO 41° C KAA 1/87 11.064 53.263 BO 44° C ML20/79, 6/71 10.95 52.67 HF 15° C NLN 1/89 11.532 52.879 BO 110° D PES 166/79, PES 153A/82 & PES 233/82 11.1 52.8 HF/BO 4° B SMO 1/88 10.772 52.817 BO 3° C WRIZ 3/88 13.926 52.765 BO 45° D sub-s., upper Carboniferous PUD 1/1H86 14.128 53.965 BO 5° B sub-s., lower Carboniferous PUD 1/1H86 14.128 53.965 BO 151° D
Remark: Quality range is A-D; A is highest.
Interpretation of the data In Western Europe, an orientation for the maximum horizontal tectonic stress (SH) from NW to NNW was found (Grünthal and Stromeyer, 1992; Müller et al., 1992; Gölke and Coblentz, 1996). As the stress orientation often is stable across a tectonic plate, it was assumed that this orientation of SH should also be found in NE-Germany.
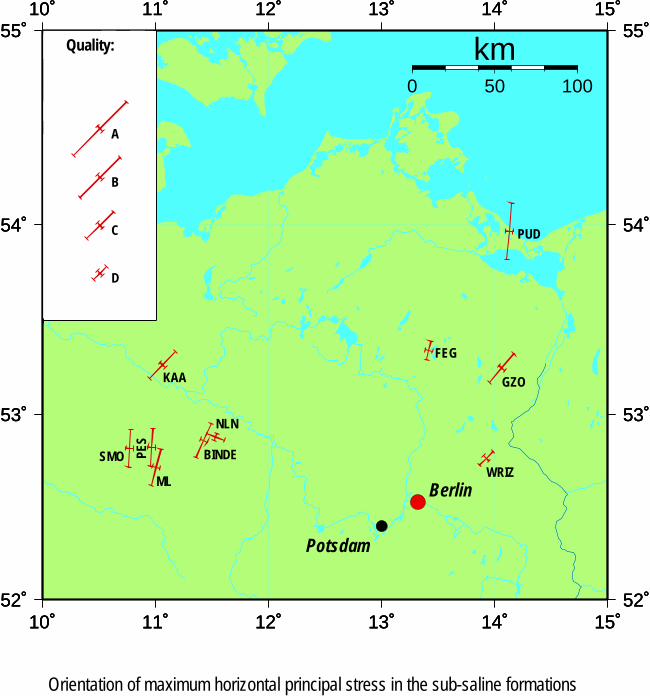
However, our new results do not show this. Instead, the orientation of SH in the sub-saline formations, which we assume to represent the regional tectonic field, is totally different. In sub-saline formations, we obtained - with 2 low quality (D) exceptions - an orientation of N to NE (Fig. 3 shows the data without the result from the deepest part of well PUD).
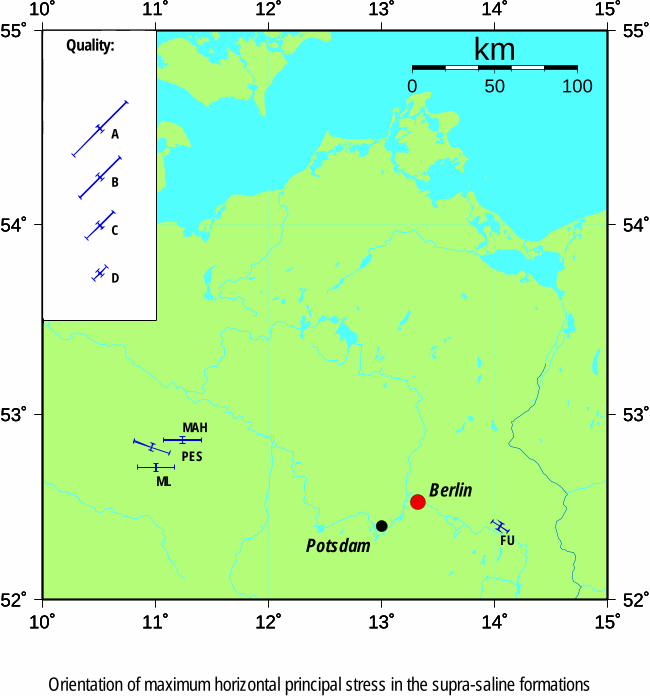
The data from above the salt - only 4 data points, clustered in the Altmark - display W to NW orientation (see Fig. 4). In our opinion, their number and distribution give not yet a basis for an interpretation in the regional scale. In contrast to this, our results for the sub-saline formations consist of 11 data points with very homogeneous orientations. Their locations are spread over the whole NEGB. They obviously represent the regional stress field in the area.
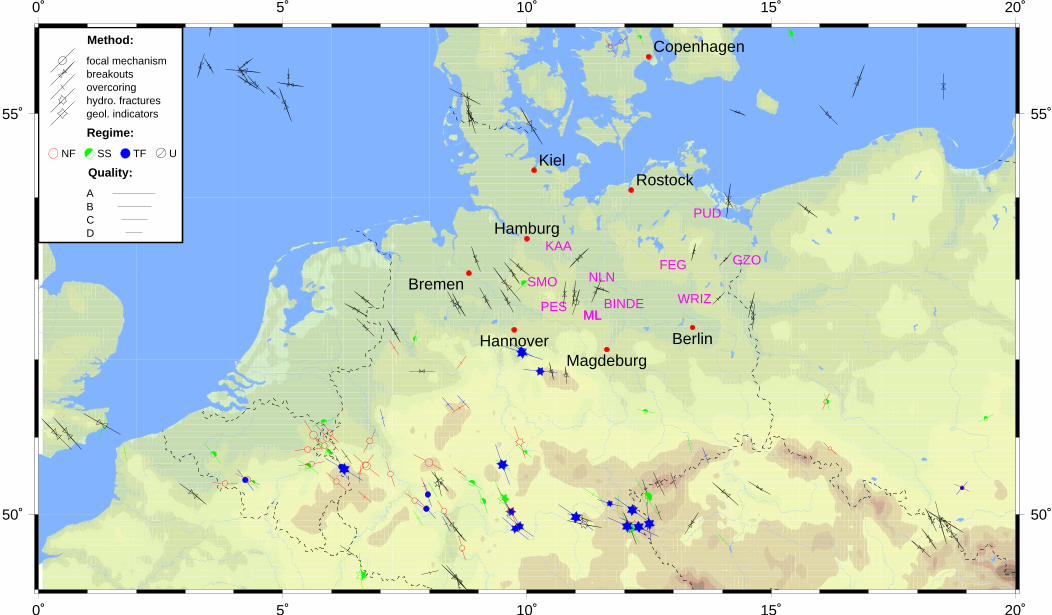
The visible differences in orientation above and below the salt can be explained by decoupling of the stress field due to the continuous Zechstein salt layers in NE-Germany. Moreover, as the salt tends to form domes, stress measurements beside or above domes may be significantly influenced by these soft salt inclusions around which SH tends to rotate (cf. Brereton and Müller, 1991). The cause for the difference in stress field between the NE and the NW German basin (cf. Fig. 5) might be due to changes in tectonic forces at collision zones or the proximity to inhomogeneities in lithospheric structure (cf. Bada et al., 1998), as discussed below. In any case, a change in the orientation of SH in sub-saline formations was also found by Grote (1997) and Grote (1998), when she reanalysed stress data from the Northwest and North German basin for differences between orientations above and below the salt. For sub-saline formations, she shows that the orientation of SH rotates from NW in the western part to N and NNE in the northern part of the basin. Obviously, this trend continues in the adjacent area investigated by us.
Furthermore, during the seismic experiment BASIN'96 within the programme DEKORP2000 (German Continental Reflection Seismic Programme) hints for an updoming of the Moho discontinuity were found, that could be explained by crustal buckling due to forces roughly in N-S direction (cf. Bayer et al., 1999). This is supported by models on the NEGB in Marotta et al. (2001a).
Discussion What might be the explanation for SH acting approximately NNE-SSW, leading to the rotation in the stress field in the NEGB? These have to dominate the forces from the Eurasian-African
collision in the Mediterranean and from the mid-Atlantic ridge that are commonly assumed to determine the NW orientation of the stress field in central western Europe.
Hypothesis I - Influence of the TESZ: This ancient suture zone is quite close to the area under investigation, trending NW-SE through the southern Baltic sea towards central Poland. An active fault could release by strike-slip motion the stress component parallel to it so that only perpendicular components (oriented NE in this case) would remain. However, there is no indication neither for recent seismic moment release nor for any kind of crustal deformation detectable by geodetic means (Gregersen et al., 1995).
Hypothesis II - Dominance of local stresses due to post-glacial lithospheric flexure: Grollimund and Zoback (2000) observed a change in the stress regime from reverse/strike-slip to strike-slip/normal faulting and a rotation of SH in the northern North Sea from 100° west of the Viking Graben to about 80° closer to the coast. For stress calculations, they use a model with a layered elastic/viscoelastic lithosphere above a viscous asthenosphere subject to ice load cycles (for a thickness of 1 km and an average lateral extension). The model is two-dimensional rather perpendicular to the front of the ice load. They find an increase in compressive stress just outside the ice sheet and a decrease below the edge of the ice shield, which match the changes in stress magnitude in their observations, while the stress magnitude of the regional stress field (from ridge push at the North Atlantic) is assumed to be constant and homogeneous throughout the area. - Applying this to the NEGB would be like the following: The boundary of the ice load was about N100°E, the maximum extension of the ice cover in eastern Germany reached as far south as 51 °N (Cepek, 1973; cf. Fig. 1 here), whereas the ice thickness is very uncertain. If we assume that the 1000 m isoline of ice thickness was at the Baltic Sea coast in this region, the Northeast German Basin would have been under increased compressional stress compared with the North German Basin further West, as there the distance to Scandinavia is larger (cf. Fig. 1). As this compressive stress would be N100°E, it would strongly deviate from the regional NW-SE orientation of SH, leading to N-S to NE-SW orientations fitting to our observations. Further north, formerly below the ice sheet, this additional local stress would diminish so that the regional stress would prevail. This would match the observations of a more or less NW-SE oriented SH by Ask et al. (1996). In face of the uncertainties about the shape of the glacial ice load these qualitative arguments need to be checked with 2- or even 3-D model calculations, varying the extent and thickness of the ice load.
Hypothesis III - Strong lithospheric barrier below the northern margin of the NEGB: Investigations on the rheology/depth profile to infer the strength of the lithosphere below the NEGB (Marotta et al., 2001b) found a northward increase in lithospheric strength below the NEGB. Values there might be higher than under the Baltic shield, cf. for instance Cloetingh and Burov (1996). Therefore, they assume a barrier below the northern NEGB in a two-dimensional viscous thin-sheet model of the stress field (Marotta et al., 2001a). Such a hard inclusion acts like an optical lens or pillar in underground cavities, in focussing the stress trajectories inside and releasing them in an fan-like pattern. Indeed, their result shows a rotation of the SH orientations, similar to our data.
Conclusions The analysis of borehole breakouts and hydrofrac-data from the Northeast German basin with respect to the orientation of the larger horizontal principle stress indicate:
• There is a distinct difference between the supra-saline and the sub-saline layers concerning stress orientation.
• The orientation below the salt points N to NE in almost all (9 out of 11) wells. • The large depth of the data (1500 to 6700 m; especially their location below the salt
detachment surface), their number and consistency in orientation, and last not least their spatial distribution across the NEGB, are strong indicators that they represent the regional stress field in the NEGB.
• Comparing the SH orientation in the Northwest and the North German basin with the one in the NEGB, we find a rotation from Northwest via North to Northeast.
• As there is no indication for difference in the plate boundary forces producing this stress rotation, we assume that the rigidity contrast between the NEGB and Scandinavia is responsible for this effect.
Acknowledgements We are very grateful to Erdöl-Erdgas-Gommern GmbH, especially Drs. S. Schretzenmayr and P. Finger, for providing us data of Four-Arm-Dipmeter- and ABF-logs, to the Geophysical Institute of Karlsruhe University, especially H. Bäßler, K. Fuchs, B. Müller and B. Sperner, for many discussions and for providing us the WorldStressMap-plots, and to U. Bayer, A. M. Marotta, G. Greiner, Ch. Lempp, and Th. Röckel for stimulating hints. The paper profited very much from comments of Sierd Cloetingh and Mark Zoback. We thank J. Palmer for his scientific work in the project, C. Carnein, M. Hönig, S. Mielitz for the pre-processing of the data. The project was funded by the GeoForschungsZentrum Potsdam and the Deutsche Forschungsgemeinschaft (DFG; grant: Ro733/4-3 and Fu55/37-3).
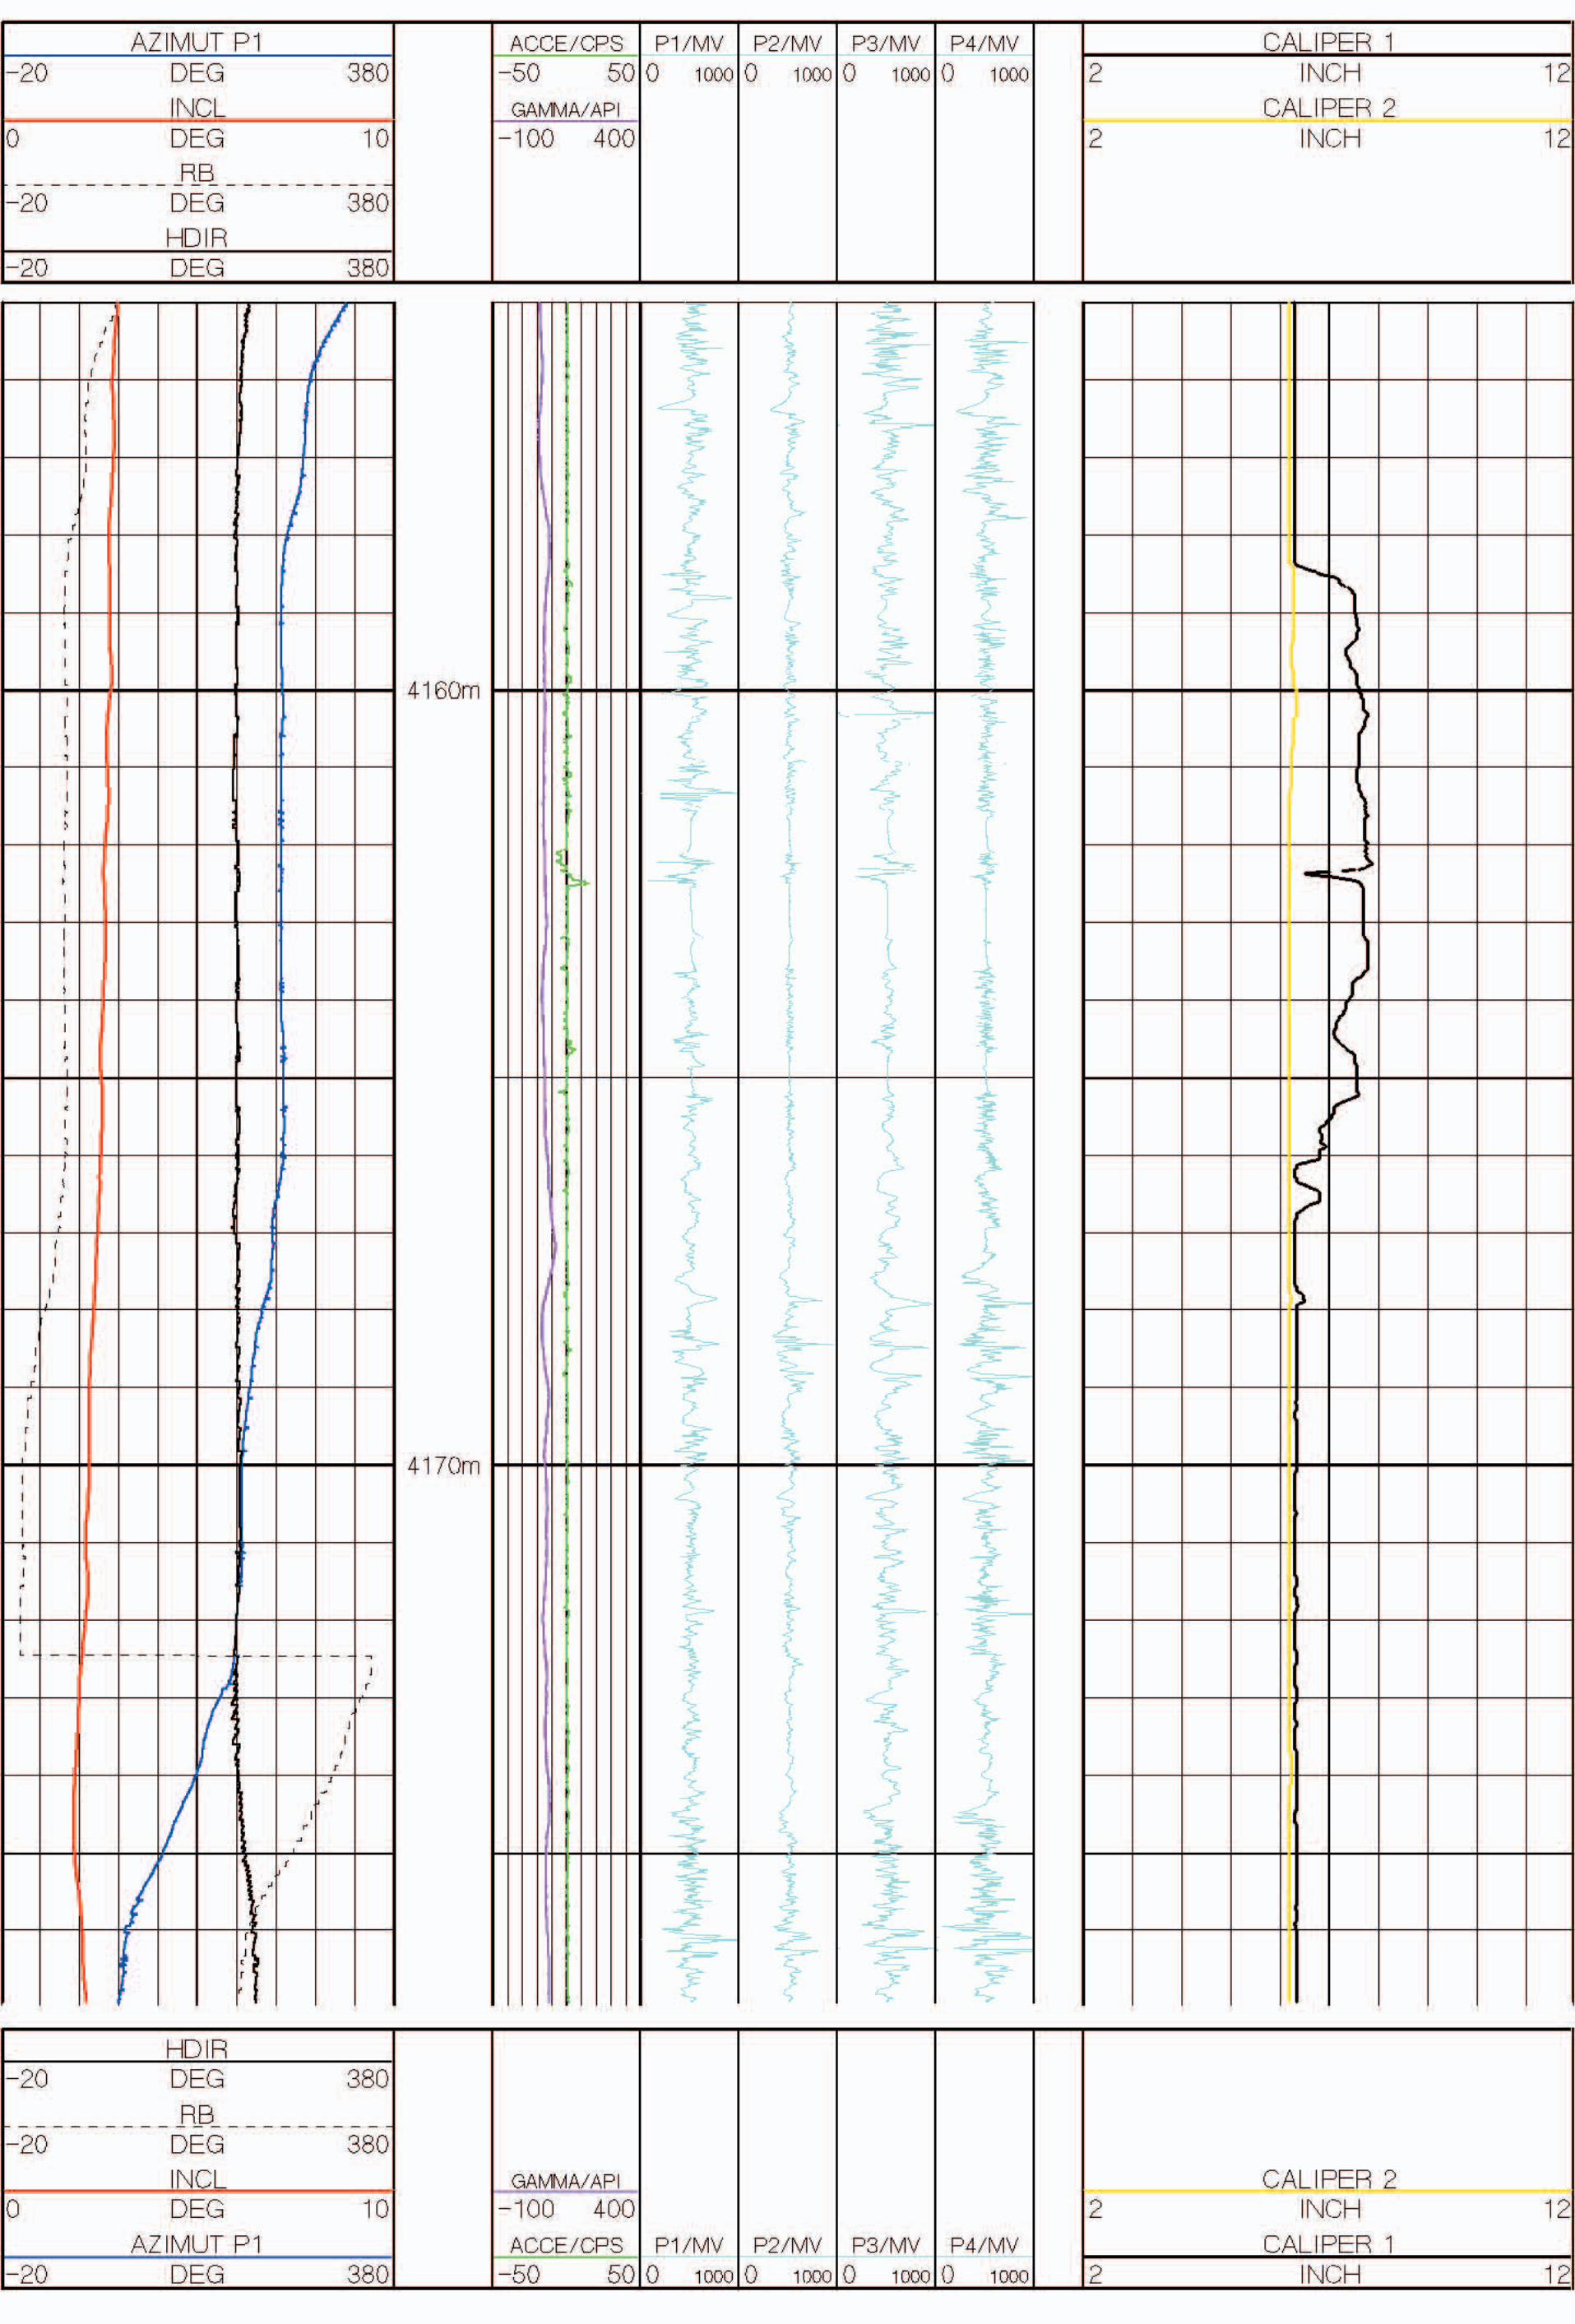
Figure captions: Figure 1: Regional tectonic framework of the Northeast German Basin after Scheck and Bayer (1999). Figure 2: Four-Electrode-Dipmeter data example from well SMO with a distinct breakout in the depth interval from 4158.5 m to 4166 m (the diameters from Caliper 1 (pad 1 and 3) and Caliper 2 (pad 2 and 4) show a distinct difference, while the rotation of pad 1 (see azimuth P1) has stopped and the diameter given by Caliper 2 shows drill bit size). Figure 3: Map showing the new data on SH (sub-saline formations). Figure 4: Map showing the new data on SH (supra-saline formations). Figure 5: Part of the World Stress Map (North Germany) including the new sub-saline data of this study, not yet regarding the results from (Grote, 1998).
References Ask, M.V.S., Müller, B. and Stephansson, O., 1996. In situ stress determination from
breakouts in the Tornquist Fan, Denmark. Terra Nova, 8(6), 575-584. Bada, G., Cloetingh, S., Gerner, P. and Horváth, F., 1998. Sources of recent tectonic stress in
the Pannonian region: inferences from finite element modelling. Geophys. J. Int., 134(1), 87-101.
Bayer, U.,Scheck, M., Rabbel, W., Krawczyk, C. M., Götze, H.-J., Stiller, M., Beilecke, T., Marotta, A. M., Barrio-Alvers, L. and Kuder, J., 1999. An integrated study of the NE-German basin. Tectonophys., 314(1-3), 285-307.
Bell, J.S., 1990. Investigating stress regimes in sedimentary basins using information from oil industry wireline logs and drilling records. In: M.A.L.a.A.C.M. A. Hurst (Editor), Geological Applications of Wireline Logs. Geological Society Special Publications. The Geological Society, London & Blackwell Scientific Publications, Oxford-Boston, pp. 305-325.
Brereton, R. and Müller, B., 1991. European stress: Contributions from borehole breakouts. In: M.H.P.B. R. B. Whitmarsh, J. D. Fairhead, and N. J. Kusznir (Editor), Tectonic Stress in the Lithosphere. The Royal Society, London, pp. 165-177.
Cepek, A.G., 1973. Geologische Karte der Dt. Demokrat. Rep.; Quartäre Bildungen. Zentrales Geolog. Inst., Berlin.
Cloetingh, S. and Burov, E.B., 1996. Thermomechanical structure of European continental lithosphere: constraints from rheological profiles and EET estimates. Geophys. J. Int., 124(3), 695-723.
Gölke, M. and Coblentz, D., 1996. Origins of the European regional stress field. Tectonophys., 266(1-4), 11-24.
Gregersen, S., Lykke Andersen, H., Oncescu, M. C., Mocanu, V., Bankwitz, E., Bankwitz, P. and Grünthal, G., 1995. Recent crustal movements and earthquakes in the area of the Tornquist zone. studia geophysica et geodaetica, 39(3), 257-261.
Grollimund, B. and Zoback, M.D., 2000. Post glacial lithospheric flexure and induced stresses and pore pressure changes in the northern North Sea. Tectonophys., 327(1-2), 61-81.
Groß, U., 1989. Untersuchungen zum Gebirgsspannungszustand in der Altmark. Forschungsbericht, Institut f. Bergbausicherheit, Leipzig.
Grote, R., 1997. Erdgasfelder und -funde in Nordwestdeutschland - Mit Information der rezenten kompressiven horizontalen Hauptspannungsrichtung. Map EP273, as of 06/1997, number: z9711036, BEB Unternehmen Erdgas, Hannover.
Grote, R., 1998. Die rezente horizontale Hauptspannungsrichtung im Rotliegenden und Oberkarbon in Norddeutschland. Erdöl, Erdgas, Kohle, 114(10), 478-483.
Grünthal, G. and Stromeyer, D., 1992. The recent crustal stress field in Central Europe: Trajectories and finite element modeling. J. Geophys. Res., 97, 11805-11820.
Hoth, K., Rusbült, J., Zagora, K., Beer, H. and Hartmann, O., 1993. Die tiefen Bohrungen im Zentralabschnitt der Mitteleuropäischen Senke - Dokumentation für den Zeitabschnitt 1962-1990, Schriftenreihe für Geowissenschaften. Ges. f. Geowissenschaften e.V., Berlin.
Lempp, C. and Röckel, T., 1999. Der Spannungszustand im Nordostdeutschen Becken, ermittelt aus Brucherscheinungen und bohrtechnischen Protokollen. Expanded abstract in the proceedings of the ICDP/KTB-meeting, May 27 and 28, 1999, Ruhr-Univ. Bochum and Deutsche Forschungsgemeinschaft.
Marotta, A.M., Bayer, U., Scheck, M. and Thybo, H., 2001a. The stress field below the NE German Basin: effects induced by the Alpine collision. Geophys. J. Int., 144(2), F8-F12.
Marotta, A.M., Bayer, U. and Thybo, H., 2001b. The legacy of the NE-German basin - reactivation by compressional buckling. Terra Nova, 12(3), 132-140.
Müller, B., Zoback, M. L., Fuchs, K., Mastin, L., Gregersen, S., Pavoni, N., Stephansson, O. and Ljunggren, C., 1992. Regional patterns of tectonic stress in Europe. J. Geophys. Res., 97, 11783-11803.
Palmer, J. and Groß, U., 1999. Richtung der rezenten, horizontalen Hauptspannung im Subsalinar Nordostdeutschlands. Z. geol. Wiss., 27(3/4), 189-200.
Plumb, R.A. and Hickman, S.H., 1985. Stress induced borehole elongation - A comparison between the four-arm dipmeter and the borehole televiewer in the Auburn geothermal well. J. Geophys. Res., 90, 5513-5521.
Scheck, M. and Bayer, U., 1999. Evolution of the Northeast German Basin - inferences from a 3D structural model and subsidence analysis. Tectonophys., 313(1-2), 145-169.
Ziegler, P.A., 1990. Geological Atlas of Western and Central Europe. Shell Internationale Petroleum Maatschappij B.V.
Zoback, M.L., 1992. First- and second-order patterns of stress in the lithosphere: The World Stress Map project. J. Geophys. Res., 97, 11703-11728.
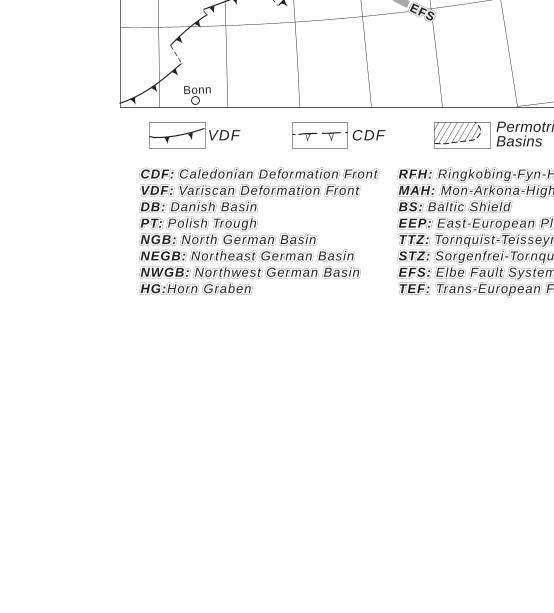
CDF: CDF: CDF: Caledonian Deformation FrontCaledonian Deformation FrontCaledonian Deformation FrontVDF: VDF: VDF: Variscan Deformation FrontVariscan Deformation FrontVariscan Deformation FrontDB: DB: DB: Danish BasinDanish BasinDanish BasinPT: PT: PT: Polish TroughPolish TroughPolish TroughNGB: NGB: NGB: North German BasinNor th German BasinNor th German BasinNEGB: NEGB: NEGB: Northeast German BasinNor theast German BasinNor theast German BasinNWGB: NWGB: NWGB: Northwest German BasinNor thwest German BasinNor thwest German BasinHG:Horn GrabenHG:Horn GrabenHG:Horn Graben
RFH: Ringkobing-Fyn-HighRFH: Ringkobing-Fyn-HighRFH: Ringkobing-Fyn-HMAH: Mon-Arkona-HighMAH: Mon-Arkona-HighMAH: Mon-Arkona-HighBS: Baltic ShieldBS: Baltic ShieldBS: Baltic ShieldEEP: East-European PlatformEEP: East-European PlatformEEP: East-European PlaTTZ: TTZ: TTZ: Tornquist-Teisseyre-ZoneTornquist-Teisseyre-ZoneTornquist-TeisseyreSTZ: STZ: STZ: Sorgenfrei-Tornquist-ZoneSorgenfrei-Tornquist-ZoneSorgenfrei-TornquiEFS: EFS: EFS: Elbe Fault SystemElbe Fault SystemElbe Fault SystemTEF: Trans-European FaultTEF: Trans-European FaultTEF: Trans-European Fa
EEPEEP
BSBS
TTZTTZ
EFSEFSEFS
Bonn
NWGBNWGB
NEGBNEGBP TP T
NGBNGB TEFTEF
S e aS e a
VDF CDF PermotriaBasins
RR FFHH
A HA HHG
HG MM
10˚
10˚
11˚
11˚
12˚
12˚
13˚
13˚
14˚
14˚
15˚
15˚
52˚ 52˚
53˚ 53˚
54˚ 54˚
55˚ 55˚
0 50 100
km
10˚
10˚
11˚
11˚
12˚
12˚
13˚
13˚
14˚
14˚
15˚
15˚
52˚ 52˚
53˚ 53˚
54˚ 54˚
55˚ 55˚
Berlin
10˚
10˚
11˚
11˚
12˚
12˚
13˚
13˚
14˚
14˚
15˚
15˚
52˚ 52˚
53˚ 53˚
54˚ 54˚
55˚ 55˚
Potsdam
BINDE
GZO
NLN
SMO WRIZ
FEG
KAA
PES
ML
PUD
Orientation of maximum horizontal principal stress in the sub-saline formations
Quality:
A
B
C
D
10˚
10˚
11˚
11˚
12˚
12˚
13˚
13˚
14˚
14˚
15˚
15˚
52˚ 52˚
53˚ 53˚
54˚ 54˚
55˚ 55˚
0 50 100
km
10˚
10˚
11˚
11˚
12˚
12˚
13˚
13˚
14˚
14˚
15˚
15˚
52˚ 52˚
53˚ 53˚
54˚ 54˚
55˚ 55˚
Berlin
10˚
10˚
11˚
11˚
12˚
12˚
13˚
13˚
14˚
14˚
15˚
15˚
52˚ 52˚
53˚ 53˚
54˚ 54˚
55˚ 55˚
Potsdam FU
MAH
PES
ML
Orientation of maximum horizontal principal stress in the supra-saline formations
Quality:
A
B
C
D
0˚
0˚
5˚
5˚
10˚
10˚
15˚
15˚
20˚
20˚
50˚ 50˚
55˚ 55˚
Berlin
Copenhagen
Hamburg
Hannover
Bremen
Rostock
Magdeburg
Kiel
PUD
FEG GZO
WRIZBINDE
NLNSMO
KAA
PESMLML
Method:
focal mechanismbreakoutsovercoringhydro. fracturesgeol. indicators
Regime:
NF SS TF U
Quality:
ABCD