Embed Size (px)
Citation preview
Acta Materialia 51 (2003) 2171–2190www.actamat-journals.com
Stress distributions in growing oxide films
R. Krishnamurthy∗, D.J. SrolovitzPrinceton Materials Institute and Department of Mechanical and Aerospace Engineering, Princeton University, Princeton, NJ
08540, USA
Received 26 June 2002; received in revised form 13 December 2002; accepted 20 December 2002
Abstract
We present a new continuum model for the growth of an oxide film that examines the generation of self-stresses.The model self-consistently accounts for the thermodynamics and kinetics of the evolution of film thickness, diffusionof all components, oxidation reaction rates and the effects of stresses on these. Numerical solution of the models showsthat large compressive stresses and significant stress gradients can be developed across the oxide layer. The signs ofthe stress and stress gradients are consistent with experimental observations. Following an initial transient, the concen-tration profiles and stresses settle into a steady-state, in which the concentration profiles and stresses are independentof the relative magnitudes of the oxygen and cation diffusivities. We have developed an approximate, analytical solutionfor the composition and stress that accurately matches the steady-state results obtained numerically. 2003 Acta Materialia Inc. Published by Elsevier Science Ltd. All rights reserved.
Keywords: Oxidation; Residual stresses; Theory; Modelling
1. Introduction
The presence of stresses in oxide layers and theireffects on cracking, spalling and decohesion ofoxide layers has been recognized for some time [1–3]. Measurements of dimensional changes on oxi-dation [4,5], strain measurements by X-ray diffrac-tion [6] and piezospectroscopic techniques [7] andmeasurements of specimen deflection on oxidation[8] provide direct evidence for the presence ofthese stresses. For example, Buscail et al. [9] esti-mated the stress in FeO scales grown on pure iron
∗ Corresponding author. Tel.: 609-258-1494; fax: 609-258-1477.
E-mail address: [email protected] (R. Krishnamurthy).
1359-6454/03/$30.00 2003 Acta Materialia Inc. Published by Elsevier Science Ltd. All rights reserved.doi:10.1016/S1359-6454(03)00009-0
to be �150 MPa based upon X-ray diffractionmeasurements, Huntz et al. [10] found a stress of�100 MPa in NiO scales grown on NiCr alloysusing deflection measurements, while Tolpygo etal. [11] measured a stress of�1000 MPa in A1203
scales grown on FeCrAlY alloys via piezospectros-copic techniques. Observations of oxide film curl-ing [3,12,13] or bending [14] on detachment fromthe metal substrate demonstrate that the stressesthrough the thickness of the these films is non-uni-form. Zhu et al. used X-ray diffraction methods tomeasure in-plane compressive stresses of 1380MPa and 460 MPa at the oxide/alloy andoxide/vapor interfaces, respectively, in aCr203/Ni-Cr system [15]. Ueno [14] found a stressgradient of 30 MPa/µm in NiO scales based uponflexural measurements on decohered oxides. Roy

2172 R. Krishnamurthy, D.J. Srolovitz / Acta Materialia 51 (2003) 2171–2190
and Burgess estimated an average in-plane com-pressive stress of 1000 MPa in Zr02 films growingon Zr metal using flexural measurements [16];Bradhurst and Heuer observed decohered Zr02
films to curl in a manner that suggests the presenceof a stress gradient across the oxide layer, such thatthe stresses in the growing film are more compress-ive at the metal/oxide interface than at the oxidesurface [17]. Kobeda and Irene have observedqualitatively similar stress gradients in thermallygrown Si02 films on Si [18]. While these resultsclearly demonstrate that oxide scale growth canlead to large stresses and stress-gradients, ourunderstanding of this phenomena is far from com-plete.
There have been relatively few attempts toinvestigate the mechanisms that produce theobserved stress distributions in films produced byoxidation. The earliest explanation for the originof these stresses was offered by Pilling andBedworth [19] who proposed that these stresseswere due to the difference in molar volumes of theoxide and the metal, �ox��m. The resultingbiaxial stress is proportional to 1/3(1��ox /�m).While this theory predicts the sign of the stresses(tensile/compressive) fairly accurately for thickeroxide films, the magnitude of the growth stressesobserved in oxides is typically much lower thanpredicted. Subsequently, there have been othertheories which have considered reasons other thanthe difference in molar volume for the generationof these stresses [20,4]. A widely quoted expla-nation for the origin of these stresses was offeredby Rhines and Wolf [4], who proposed that oxideformation at grain boundaries within the existingoxide layer is responsible for the development ofstresses during oxide growth. They also pointedout that cation diffusion controlled growth ofplanar oxide layers will be stress-free unless oxideformation also occurred at defects/grain boundarieswithin the oxide layer. An elastic analysis of thismechanism of stress generation done by Srolovitzand Ramanarayanan [21], suggests that thesestresses can be large enough to cause mechanicalfailure of the oxide, unless stress relaxation occursby plastic deformation or the oxidation reaction isinhibited by the increase in strain energy. Tolpygoet al. [22] used experimental measurements of
growth strain to evaluate lateral growth mech-anisms, within the context of the Rhines–Wolfmodel. They conclude that a small amount of oxideformed within the oxide film (4% increase involume) can produce large stresses. Speight andHarris [23] suggested that oxide formed at any sitewithin the existing oxide layer, not necessarily atgrain boundaries, will lead to the development ofstresses in the oxide layer. Atkinson examinedvarious cation and anion point defect pairs andidentified combinations for which oxide formationwithin an existing oxide layer is possible when oneof the defects dominates over the other [24]. Astress generation mechanism based upon annihil-ation of cation vacancies at the oxide/metal inter-face and the accompanying climb of interface mis-fit dislocations into the metal has been proposedby Pieraggi and Rapp [20]. This mechanism pre-dicts the development of compressive stresses inthe oxide at the oxide/metal interface. While allof these theories predict the generation of stressesduring oxide growth, they do not describe the dis-tribution of stresses within the oxide film or thenature of stress gradients within the film. Obser-vations of curling of oxide films upon separationfrom the metal substrate as well as direct measure-ments of strain gradients within the films indicatethat substantial stress gradients are commonlypresent [12,25].
In this work, we investigate the development ofstresses and stress distributions during oxide filmgrowth using a transparent, physically-motivatedmodel. We allow the oxidation reaction to occurwithin the oxide film as well as at the oxide/metaland oxide/vapor interfaces. The diffusion of bothcations and anions is explicitly considered and thedifferent regimes of diffusion controlled oxidation(rapid cation diffusion, rapid anion diffusion,mixed control) are examined by varying the ratioof the cation and anion diffusivities. The stressgenerated on oxidation is modeled through a mis-match strain, which depends on the difference inconcentration of each species (metal, oxygen) inthe oxide from the reference concentration at theoxidation temperature for that species. This formu-lation accounts for concentration differences (fromthe reference concentration) that arise as a result ofboth diffusion and reaction. By treating the oxide
2173R. Krishnamurthy, D.J. Srolovitz / Acta Materialia 51 (2003) 2171–2190
generated within the oxide film as a new species,this formulation accounts for stresses developed asa result of oxide being formed within the film ina self-consistent manner.
Stresses in the oxide can affect the diffusion pro-cess through both the driving force for diffusionand the diffusivities of the different species. In thiswork, we assume that the diffusivities of the spec-ies are not significantly modified by the stress, suchthat the main effect of stress is on the chemicalpotential of the different species (we follow anapproach formulated by Cahn and Larche [26]).We also allow the stress in the oxide to affect theoxidation reaction rates by influencing the freeenergy of the reaction. This mirrors an approachthat is discussed by Haase [27] and allows us toexamine any possible inhibition of the oxidationreaction due to stress. We assume that the oxidegrows as a planar layer and that the underlyingsubstrate is much thicker than the oxide. Eventhough the microstructure of the oxide can play animportant role in stress generation, we haveignored such effects here for the sake of simplicity.With these assumptions, the stress state anywherewithin the oxide layer depends only on the localconcentrations and is given by a simple expression(see Eqs. (4) and (7)). Furthermore, the coupledstress-diffusion-reaction problem reduces to a moretractable one-dimensional problem. Clearly, thisapproach neglects several potentially importantissues such as creep within the oxide and metaland effects associated with the oxide microstruc-ture. Nonetheless, the present model includes mostof the important features of stress evolution duringoxidation and reproduces experimental trends, asdiscussed below.
2. Effect of stress on oxidation
There are three important features in our theor-etical model for oxidation, namely, the generationof stress during oxidation and the effect of stresson diffusion within the oxide film and on the oxi-dation reaction. In Section 2.1, we describe themismatch strain introduced to describe the gener-ation of stresses in the oxide due to changes in theconcentrations of the ionic species A and O and
the reaction product. These concentrations changeas a result of diffusion and reaction within theoxide film. In Section 2.2, we outline the basictheory that describes the effect of stress on thedriving forces for reaction and diffusion.
2.1. Mismatch strain associated with oxidation
For simple diffusion of species, a ‘compo-sitional’ mismatch strain of the following form(assuming ideal solution behavior) was proposedby Cahn and Larche [26]
em � �i
hidci, (1)
where the sum is over all independent compo-nents, hi = ∂em /∂ci is the Vegard’s law coefficientfor species i, and dci reflects the difference betweenthe actual composition ci and a reference compo-sition for i at the temperature of concern. For sim-plicity, we write a schematic equation for the oxi-dation reaction within the oxide film as
A � O*AO. (2)
The exact reaction (2) will be determined by thenature of point defects present in the two sublatt-ices. For example, if doubly charged oxygen andcation vacancies (V··
O and V�A respectively, wherewe have employed Kroger–Vink notation) are themajor point defects in the respective sublatticesand holes (h�) are the major electronic carriers, the‘ free species’ A represents the charge free group-ing Ax
A - V�A − 2h� and O represents the chargefree grouping Ox
O � V··O + 2 h�. Substituting these
into Eq. (2), we obtain
AxA � Ox
O*AO � V··O � V�A (3)
Eq. (3) is the same as the internal oxide formationreaction proposed by Atkinson for this case [24].If it is appropriate to assume local electroneutral-ity, such charge free groupings can be used to studydiffusion of the component species [28]. Treatingthe oxide product formed within the oxide film(henceforth referred to as internal oxide) as a newspecies p, we can formulate an expression for themismatch strain on oxidation as
em � hAcA � hOcO � hpcp (4)

2174 R. Krishnamurthy, D.J. Srolovitz / Acta Materialia 51 (2003) 2171–2190
where the δ’s have been dropped for convenienceand hp = Np /3, where Np is the total number ofatoms in one unit of the oxide (Np = 2 for AO).We have used a dilatational transformation strainto represent the volume generated on internal oxideformation. Since p represents AO formed withinthe AO oxide, and the transformation strain �m, isa pure dilatation, there is no volume term in theexpression for hp. It is important to note that Eq.(4) can be used to describe the mismatch strain onoxidation for any oxidation reaction (i.e. for oxideswith stoichiometry different from AO) uponchanging Np to represent the oxide stoichiometry.For example, if the oxide was AxOy, then we canuse Eq. (4) with Np = x+y.
2.2. Stress effects on diffusion and reaction
Following Larche and Cahn [26], we can relatethe chemical potential mi (or to be precise, the dif-fusion potential) at temperature T to stress as
mi(s,T,c) � mi(0,T,c)�hi�Tskk (5)
where skk is the hydrostatic stress, �T is the aver-age volume of the oxide per atom and mi(0, T, c)is the stress-free chemical potential [26]. Thisexpression assumes that the elastic constants in theoxide are independent of composition and neglectshigher order terms in strain. Incorporating the equi-biaxial plane stress state assumption, we canrewrite Eq. (5) as
mi(s,T,c) � mi(0,T,c)�2hi�Ts (6)
where s is the in-plane equibiaxial stress in theoxide and is described, for the case in which theunderlying substrate is much thicker than theoxide, by
s � �E
1�vem (7)
where we have assumed linear, isotropic elasticityand E and v are the elastic modulus and Poisson’sratio of the oxide, respectively. Substrate and oxidecreep can potentially influence the stress state inthe oxide layer. For a thick substrate (as assumedhere), substrate creep has a limited effect onstresses in the oxide layer and, consequently, we
have neglected it in this work. While oxide creepcan be included in the current formulation in a rela-tively straightforward manner [29], and can sig-nificantly affect the stresses in the oxide layer, wehave ignored it to avoid making ad-hoc assump-tions and to keep the calculations relatively simple.
The stress-free chemical potential, mi(0,T,c)depends upon the solution model that is suitablefor species i in the sub-lattice it occupies in theoxide. For non-metallic oxides, we assume that astate of local electroneutrality exists throughout theoxide film, such that we can use the chemicalpotential to describe the diffusion process in theseoxides. It is important to note that if this assump-tion is not valid, electrochemical potential gradi-ents, which comprise electrostatic and chemicalpotential gradient contributions, will drive dif-fusion. For most oxide ceramics (other than electri-cally active ones), local electroneutrality is anexcellent assumption throughout the film except,possibly for surface layers that are a few nanomet-ers in thickness [30]. We assume ideal solutionbehavior and write expressions for the stress-freechemical potential of species i as follows
mi(0,T,c) � m0i � kBT ln(ci) (8)
where m0i is the reference chemical potential of i
at the oxidation temperature and kB is the Boltz-mann constant. Combining Eqs. (4), (6), (7) and(8), we obtain the following simplified expressionfor the chemical potential of species i in the oxide
mi � kBT(m0
i
kBT� ln ci � �
j
Sijcj) (9)
where Sij = 2E�Thihj / (1�v)kBT, is a dimensionlessnumber representing the effect of stress on thechemical potential.
We can write phenomenological equations forthe mass fluxes Ji as
Ji � �Lii�mi (10)
where Lii are Onsager coefficients which arerelated to the diffusion constants by Lii = Diri /kBT and ri is the number density of i. In Eq. (10),we have neglected the effect of cross-coefficientson the mass flux. Incorporating the expression forthe chemical potential (Eq. (9)) into Eq. (10), weobtain

2175R. Krishnamurthy, D.J. Srolovitz / Acta Materialia 51 (2003) 2171–2190
Ji � �DirT� �j � A,O,p
ij�cj�, (11)
where rT is the average number density of atomsin the oxide and the ij are given by
ii � 1 � Siici, ij � Sijci i j. (12)
Stress can also affect the oxidation reaction intwo ways; by changing the kinetic rate constantsand by affecting the free energy of the reaction.We assume that stress affects the oxidation reac-tion only through the free energy for the reaction.This is consistent with our assumption for dif-fusion, namely, that stress affects only the dif-fusion potential and has no effect on the diffusivi-ties. We derive the stress dependence of thereaction rate using an approach similar to the oneillustrated by Haase [27]. For the reaction in Eq.(2), we can express the rate R and the free energyg (affinity) of the reaction by the following equa-tions
R � kf(cAcO�cp
K), g � mp�mA�mO, (13)
where K =kf
kb
, is the ratio of the forward and back-
ward reaction rate constants and mass action kin-etics is used to describe the reaction rate. Usingthe expression for the chemical potential derivedpreviously and recognizing that both g and R arezero at equilibrium, we can rewrite Eq. (13) as
R � kf(cAcO�cp
K0f(s)), f(s) � exp(ac∗
A
� bc∗O � ec∗
p ), a � SpA�SAA�SOA, (14)
b � SpO�SOO�SAO, e � Spp�SAp�SOp,
where the Sij have been defined previously, K0 isthe equilibrium constant for the stress-free reactionand c∗
i represent equilibrium concentrations. Forthe simple case in which the Vegard’s law coef-ficients for A and O are negligible (i.e. the mis-match strain on oxidation is essentially due to thevolume of internal oxide produced), theexponential term on the right hand side of Eq.(13b) is greater than 1 and, thus, the stressed equi-librium constant is less than K0, resulting in adecreased reaction rate.
3. Mathematical formulation
We consider the growth of a planar oxide layeron a thick metallic substrate, with lateral dimen-sions considerably larger than the combined thick-ness of the oxide layer and the substrate. A sche-matic of the model system is shown in Fig. 1. Massbalance leads to two coupled reaction-diffusionequations of the form
∂cA
∂t� a
∂∂x
[ �j � A,O,p
Aj
∂cj
∂x]��[cAcO
�cp
K0f(s)],
∂cO
∂t�
∂∂x
[ �j � A,O,p
Oj
∂cj
∂x]��[cAcO(15)
�cp
K0f(s)],
where a = DA /DO is the ratio of the diffusivitiesof the two species in the oxide, x = z /L0 is thenormalized space dimension along the thicknessdirection, t = DOt /L2
0 is a normalized time, � =kfL2
0 /DO is a dimensionless forward reaction rate,and L0 is an arbitrarily chosen reference oxidelayer thickness. At any time t, these equations arevalid for 0 � z � X (t), where X (t) is the nor-malized thickness of the oxide at time t. We requiretwo more equations; an ordinary differential equ-ation describing the formation of internal oxide atany position z within the oxide film and analgebraic equation expressing the condition ofchemical reaction equilibrium, which are as fol-lows
∂cp
∂t � �[cAcO�cp
K0f(s)], (cA�y)(cO�y) (16)
�cp � y
K0f(s),
JA
JO
A
AO
scale growth
Fig. 1. Schematic illustration of an AO oxide growing on athick A substrate.

2176 R. Krishnamurthy, D.J. Srolovitz / Acta Materialia 51 (2003) 2171–2190
where y denotes the departure from chemical reac-tion equilibrium and is related to the equilibriumconcentrations c∗
i by
y � cA�c∗A � cO�c∗
O � c∗p�cp. (17)
Eqs. (15�17) will be solved together, along withthe boundary conditions for the partial differentialequations that are described below. In addition, thethickening of the oxide film due to oxide formationwithin the film and at the surface and interface hasto be considered.
Oxide layer growth at the oxide/vapor andoxide/substrate interfaces is accounted for throughthe boundary conditions by writing explicitrelations for the velocities of the two interfaces.Internal oxide formation also contributes to oxidelayer thickening, as the oxide layer is free to elasti-cally expand in the thickness direction. This contri-bution to oxide film thickening can be consideredby tracking the normal strain in the thickness direc-tion, �zz which is related to the mismatch strain �m
in the oxide as follows
ezz �1 � v1�v
em. (18)
As �m changes with time (through theconcentrations), �zz will also vary with time. Thenormalized displacement in the thickness direction,relative to the interface, is
uz(x,t)L0
� �x0
ezz( ,t)d . (19)
The rate of change of the displacement, v, at anyposition x along the thickness of the oxide, relativeto the interface, is related to the mismatch strain�m by
v(x,t) �1 � v1�v �x
0
∂em
∂t ( ,t)d . (20)
The oxidation reaction at the oxide/vapor bound-ary (surface) is written schematically as
A �12
O2*AO. (21)
This reaction can occur in two steps, namely,adsorption of oxygen onto the oxide surface, fol-
lowed by reaction of adsorped oxygen with A inthe oxide. If the adsorption is fast, the rate of thesurface reaction is determined by the rate of thereaction with A in the oxide. At the oxide/substrateboundary (interface) the oxidation reaction can bewritten schematically as
A(Sub) � O*AO. (22)
The interface reaction too can occur in twosteps; adsorption of A onto the oxide surface fol-lowed by reaction of adsorped A with oxygen inthe oxide. The rate of the interface oxidation reac-tion will be determined by the rate of the reactionwith oxygen if adsorption of A is fast. As for reac-tion (2), reactions (21) and (22) can also be rep-resented in terms of point defects with the respect-ive free species being replaced by appropriatecharge free groupings. For example, in the casewhere V�A is the mobile point defect in the cationicsublattice, inserting the charge-free groupingAx
A�V�A�2h� for the free species A in reaction(21), we obtain
AxA � 1/2O2*AO � V�A � 2h�. (23)
At the surface, stress-free oxide is formed bythe surface reaction, as any new volume generatedinstantaneously can be freely accomodated at thesurface. However, the oxide becomes stressedimmediately afterwards, as it becomes a part of thesolid oxide layer. At the interface, the newly for-med oxide is free to occupy a volume equal to thevolume of the substrate consumed by the interfacereaction at any given instant. The volume of thenewly formed oxide exceeds this volume by�p��sub
A , for every molecule of oxide formed,andconsequently, the interface is under residual com-pressive stress. The differential equation rep-resenting internal oxide formation at the interfacehas been adjusted to incorporate this fact. Weassume that gas phase mass transport of oxygen atthe surface is fast and consequently, the concen-tration of oxygen in the vapor at the surface is con-stant. We also assume that the concentration of Aon the substrate side of the interface is constant(this could be achieved if the diffusion of A in thesubstrate is much faster than the oxidation rate orif the decrease in cA at the substrate side of theinterface is small compared to the value of cA).

2177R. Krishnamurthy, D.J. Srolovitz / Acta Materialia 51 (2003) 2171–2190
Annihilation/creation of appropriate point defectsat the interface is necessary to maintain this con-dition and to facilitate continued oxidation and thiscan be achieved by the climb of interface misfitand misorientation dislocations [20,31]. Thestresses generated at the substrate/oxide interface,especially for thin epitaxial oxide layers, will beinfluenced by the climb of these dislocations andby stress relaxation mechanisms based on the sub-sequent glide of these dislocations [20,31]. In thiswork, we have assumed rapid vacancyinjection/diffusion into the substrate and we haveignored stress generation/relaxation due to inter-face line defects.
With these considerations, we have the follow-ing boundary conditions at the interface
I+A�IA�(
r+A
rT
�cA)v � �s
L0[cOcsub
A �cp
K0exp(fi(s))],
�IO � cOv � �s
L0[cOcsub
A �cp
K0exp(fi(s))],
K0(cO�y)csubA � (cp � y)exp(fi(s)),
v � ��s
L0
�subA
�T
(cOcsubA �
cp
K0exp(fi(s))),
cA � csubA exp(Bi�SAAcA�SAOcO�SApcp).
(24)
Eq. (24), along with the differential equationdescribing internal oxide formation at the interface,complete the formulation of the interface bound-ary conditions:
dcp
dt�
�p��subA
�p
�[cOcsubA �
cp
K0
exp(fi(s))] (25)
� v∂cp
∂x .
In Eqs. (24) and (25), Ii = JiL0 /DOrT is thedimensionless flux of species i, Ji can be foundfrom Eq. (11), s characterizes the width of theinterface and is of atomic dimensions (kfs is thelinear reaction rate constant measured inexperiments), v = vL0 /DO is the dimensionlessvelocity of the interface, r +
A = csubA rsub is the den-
sity of cationic species in the substrate near theinterface (ρsub is the number density in the
substrate), fi(s) = (SpA�SOA)cA + (SpO�SOO)cO +(Spp�SOp)cp + (Spp�SOp�SpO + SOO)y representsthe effect of stress on the chemical potential at theinterface, and Bi = m0,sub
A �m0A /kBT is a measure of
the solubility of A in the oxide (m0,subA the reference
chemical potential of A in the substrate).In a similar manner, we can write equations for
the surface boundary conditions as
�I+O � IO � (
r+O
rT
�cO)v � �s
L0[cAP1/2
O2�
cp
K0exp(fs(s)],
�IA � cAv � ��s
L0[cAP1/2
O2�
cp
K0exp(fs(s)],
cO � P1/2O2
exp(Bs�SOAcA�SOOcO�SOpcp),
dcp
dt� v
∂cp
∂x ,v ��p
�T
�s
L0(cAP1/2
O2�
cp
K0exp(fs(s)),
K0P1/2O2
(cA�y) � (cp � y)exp(fs(s),
(26)
where r +O is the concentration of oxygen in the
vapor at the surface of the oxide, fs(s) = (SpA�SAA)cA + (SpO�SAO)cO + (Spp�SAp)cp + (Spp�SAp�SpA + SAA)y represents the effect of stress onchemical potential at the surface, and Bs =1 /2m0
O2�mO /kBT is a measure of the solubility of
O in the oxide (m0O2
is the reference chemicalpotential of oxygen in the vapor). Eqs. (24) and(26) represent mass balance (in a stationary frameof reference) of both species A and O across theboundaries, chemical equilibrium conditions for Aacross the interface and for O across the surface,generation of internal oxide at the interface andsurface and chemical reaction equilibrium for theinterface and surface oxidation reactions. Eqs. (15),(16), (24) and (26) are solved together to yield aself-consistent solution for the time-dependentcomposition and stress profiles and growth rates.
4. Numerical solution
Eqs. (15–17) were solved together with Eqs.(18), (20), (24) and (26) using an implicit finitedifference method. However, at early times, anexplicit method with a small time step (as dictatedby numerical stability) was employed. The partial

2178 R. Krishnamurthy, D.J. Srolovitz / Acta Materialia 51 (2003) 2171–2190
differential equations are non-linear and a Newton-Raphson method was used to solve the system ofequations resulting from the finite differenceapproximation at each time step. A Murray-Landisapproximation was used to account for the movinggrid [32]. A 50 nm thick stress-free oxide on asemi-infinite substrate was used as the starting statefor all of the calculations.
Since the primary focus of this study is to under-stand the nature of the stresses that are generatedas a result of the oxidation process, we (arbitrarily)neglect the contribution of solutionizing stresses bysetting hA = hO = 0. This assumption is equivalentto setting Sij = 0, unless both i, j = p (see Eq. (12)).Solutionizing effects are important in non-stoichio-metric oxides, where they can dominate stress gen-eration at high temperature [33]. The effects of twoimportant parameters are explored in this study;namely, the linear reaction rate kfs /D (normalizedby the larger of the two diffusivities DA and DO)and the relative diffusivities of the two species Aand O, a = DA /DO. Three different values, a =100, 1 and 0.01 were chosen to capture three dif-ferent oxidation regimes representing rapid cationdiffusion, mixed control and rapid oxygen dif-fusion, respectively. For many oxides which growby diffusion control, kfs /D�10/mm. For example,a = 2000 and kfs /D = 13/mm for Ni oxidation[34,35]. We have chosen three different values ofthe dimensionless ratio � = kfsL0 /D (i.e. 10, 100and 1000) to capture the effects of varying kfs /Don the oxidation process. Though Eqs. (15), (16),(24) and (26) have rate expressions for a reversiblereaction, we do not allow oxide, once formed, todecompose. The reaction is terminated once chemi-cal reaction equilibrium is attained and further oxi-dation occurs only after more of the reactant hasbeen supplied by diffusion.
5. Results
Stress and concentration profiles in the oxide areshown in Figs. 2, 3a and 4a for kfs /D = 20/mmand a = 100. These conditions correspond to oxi-dation under rapid cation diffusion and are typicalof metal oxidation. Fig. 2(a) shows the in-planestress profile through the oxide layer at small times
(i.e., when the total film thickness is only slightlylarger than the pre-existing oxide thickness). Largecompressive stresses are developed near the sur-face of the pre-existing oxide at very early times.With increasing time, more oxygen diffuses intothe oxide layer from the surface and consequently,more internal oxide is formed. This results ingreater compressive stresses throughout the oxidelayer and less steep stress gradients (see t =3.6x10�5). The evolution of the stress profiles isinfluenced by three main factors; namely, con-tinued stress generation due to internal oxide for-mation, inhibition of the oxidation reaction oncethe stresses associated with the formation of theinternal oxide become sufficiently large and oxidelayer thickening by the formation of stress-freeoxide at the surface. The balance between thesefactors governs the shape of the profiles at t =10�5 to t = 0.0003. The biaxial stress profileeventually reaches a steady state with high com-pressive stresses at the interface and a stress gradi-ent such that the compressive stress is smallest atthe surface (see t = 0.0003). At longer times, thecompressive stress at the interface approaches aconstant value (see Fig. 2b). This value is dictatedby the final chemical reaction equilibrium statewhich depends on the maximum solubility of oxy-gen and A in the oxide. The stress gradientdecreases with increasing time (oxide layerthickness) and the stress at the oxide surfaceasymptotically approaches zero. The decrease instress gradients is due to both oxide layer thicken-ing and the fact that the stress approaches constantvalues both at the surface and interface.
The cation concentration profile across the oxidelayer, at short times, is roughly the same as thesteady state cation profile for stress-free oxidelayer thickening (see Fig. 3a, t = 0.0003). Sincethe cation diffusivity is relatively large in thepresent case (a = 100), cation diffusion profilesattain a steady state very quickly. The cation con-centration gradients across the oxide film decreasewith increasing time (layer thickness) due to bothoxide thickening and internal oxidation (see thenext section). The oxygen concentration profilereaches a nearly constant, steady state at longertimes (see Fig. 4a, t = 0.0047–0.0185). This canbe attributed to the decreasing rates of internal

2179R. Krishnamurthy, D.J. Srolovitz / Acta Materialia 51 (2003) 2171–2190
ξ
σ
0 0.01 0.02 0.03-100
-90
-80
-70
-60
-50
-40
-30
-20
-10
0
(a )
τ = 0.0003
τ = 10-5
τ = 3.6 x 10⁻⁵
τ = 0.0001
ξ
σ
0 0.1 0.2-100
-90
-80
-70
-60
-50
-40
-30
-20
-10
0
(b )
τ = 0.0025
τ = 0.0185τ = 0.0091τ = 0.0025
Fig. 2. The in-plane, biaxial stress in the oxide layer, s, vs. normalized position in the oxide layer (along the thickness direction),ξ, at both (a) short and (b) long times, where ξ = 0 is the interface. Note, the initial oxide layer thickness is 0.01 in these normalizedunits. The ratio of the diffusivities a = DA /DO = 100 and the normalized reaction rate kfs /D = 20/mm. The dots at the end of thecurves represent the total film thickness at the indicated times.
oxide formation at longer times. A more detailedexplanation for the evolution of oxygen profiles toa nearly uniform profile at long times is providedin the next section.
Stress and concentration profiles for the case ofrapid oxygen diffusion are shown in Fig. 5a, 3band 4b. Oxide layer thickening proceeds slowly forthis case as compared to the case where cation dif-fusion was rapid, as can be deduced from the muchlarger values of t in Fig. 5a as compared to Fig.
2b. The reason for the reduced thickening rates isthat, even though oxygen diffusion is relativelyrapid (a = 0.01), internal oxide formation inhibitsthe interface and internal oxidation reactions andeventually, the much slower diffusion of cationscontrols the thickening rate. An interesting obser-vation from Fig. 5a is that at long times, the stressgradient has the same sign as in the previous case(Fig. 2b). This is partly owing to the fact that cat-ion diffusion controls oxide layer thickening at

2180 R. Krishnamurthy, D.J. Srolovitz / Acta Materialia 51 (2003) 2171–2190
ξ
c A
0 0.1 0.20
0.002
0.004
0.006
0.008
0.01
0.012
τ = 0.0003
τ = 0.0185τ = 0.0091
τ = 0.0047
τ = 0.0012
(a)
ξ
c A
0 0.05 0.10
0.002
0.004
0.006
0.008
0.01
0.012
τ = 0.0047
τ = 27.2
τ = 20.7
τ = 13
τ = 7.05
τ = 1.61
(b)
ξ
c A
0 0.05 0.10
0.002
0.004
0.006
0.008
0.01
0.012
τ = 0.008τ = 0.256
τ = 0.197
τ = 0.120τ = 0.075
τ = 0.040
(c)

2181R. Krishnamurthy, D.J. Srolovitz / Acta Materialia 51 (2003) 2171–2190
Fig. 3. A concentrations within the oxide layer along thethickness direction for (a) a = DA /DO = 100, (b) a = 0.01 and(c) a = 1. As in Fig. 2, the initial oxide layer thickness is 0.01in normalized units and and the normalized reaction rate kfs /D = 20/mm. The dots at the end of the curves represent thetotal film thickness at the indicated times.
long times regardless of the value of α and, conse-quently, the stress gradient in the oxide layer isinfluenced strongly by the cation concentrationgradient in the oxide. With rapid oxygen diffusion,the oxidation reaction quickly attains chemicalreaction equilibrium within the oxide layer and atthe interface, and the stress profiles in Fig. 5ashould correspond to chemical reaction equilib-rium concentrations.
As in the fast cation diffusion case (see Fig. 3a),the cation concentration profiles evolve to a linearsteady state with a non-zero slope and the oxygenprofiles attain a uniform steady state at long times(see Figs. 3b and 4b). The slope of the cation con-centration profiles (Fig. 3b) depends on both thesurface oxidation rate and the rate of A consump-tion due to oxidation within the oxide layer. Theuniform oxygen profiles at longer times (Fig. 4b)can be explained using the same reasons as before.
The trends are similar when the cation and oxy-gen diffusivities are comparable (a = 1), as seenin Fig. 5b, 3c and 4c where we show the biaxialstress and concentration profiles across the oxidelayer. As expected from the values of a, the magni-tude of the times, t, in Fig. 5b are intermediatebetween those found in Fig. 2b and 5a, and conse-quently, the oxide layer thickening rates are inter-mediate to those for a = 100 and a = 0.01.
The dimensionless parameter � = kfsL0 /D wasvaried in the range 10���1000 in order to deter-mine the effects of the relative rates of reactionand diffusion on the oxidation process. Figs. 6–8 show the effects of varying � on oxide layerthickening and the biaxial stress distribution fora = 100, a = 0.01 and a = 1, respectively. Fig. 6ashows oxide thickness versus t1 /2 for differentvalues of this ratio at a = 100. The oxide film
Fig. 4. O concentrations within the oxide layer along thethickness direction for (a) a = DA /DO = 100, (b) a = 0.01 and(c) a = 1.
ξc O
0 0.1 0.20
0.003
0.006
0.009
0.012
0.015
0.018
0.021τ = 0.0185
τ = 7 x 10⁻⁶
τ = 0.0047
τ = 0.0012
(a)
ξ
c O
0 0.05 0.10
0.004
0.008
0.012
0.016
0.02
τ = 10-5
τ = 0.0002
τ = 27.2
τ = 0.0003
(b)
ξ
c O
0 0.05 0.10
0.004
0.008
0.012
0.016
0.02τ = 0.0003
τ = 0.256
(c)

2182 R. Krishnamurthy, D.J. Srolovitz / Acta Materialia 51 (2003) 2171–2190
ξ
σ
0 0.05 0.1-100
-90
-80
-70
-60
-50
-40
-30
-20
-10
0
τ = 0.62
τ = 27.2
τ = 20.7
τ = 13
τ = 7.05
τ = 3.10
(a)
ξ
σ
0 0.05 0.1
-100
-90
-80
-70
-60
-50
-40
-30
-20
-10
0
τ = 0.008
τ = 0.256τ = 0.197
τ = 0.153
τ = 0.095
τ = 0.026
(b)
Fig. 5. As per Fig. 2, but for (a) a = DA /DO = 0.01 and (b)a = 1, respectively.
thickness varies linearly with √t for large valuesof t and for all three values of �, indicating thatoxide layer thickening follows parabolic kinetics atlong times. At relatively high reaction rates (� =1000), oxide layer thickening is essentially para-bolic even at very short times. At lower reactionrates, there is an initial non-parabolic transientthickening regime, which extends to longer timeswith decreasing reaction rates (see curves for �= 100 and � = 10). This initial non-parabolicregime is due to the generation of stressaccompanying internal oxidation. At very long
times, most of the oxide formation occurs at thesurface, rather than internally, and, hence, normalparabolic oxidation kinetics pertain. Regardless ofthe value of a, two competing factors determinehow oxide layer growth rates change with � andthey are: (a) increased kf with increasing �, leadingto an enhanced rate of the oxidation reaction at thesurface, and (b) increased rates of the internal oxi-dation reaction with increasing �, decreasing boththe concentration of A and the rate of the oxidationreaction at the surface. When cation diffusion israpid, cA at the surface is significantly differentfrom zero even when � = 1000 and varying �from 1000–10 does not increase cA at the surfacesubstantially. However, increasing kf for the sur-face reaction enhances the rate of the surface reac-tion considerably as cA at the surface is signifi-cantly different from zero. Consequently, the rateof the surface reaction and the oxide layer growthrate increase with increasing values of �.
The effects of varying reaction rates on thebiaxial stress profiles in the oxide film are shownin Fig. 6b for a = 100 and an oxide layer thicknessof approximately 200 nm (X = 0.04). At relativelylow reaction rates (low �), more internal oxideforms, leading to a nearly uniform stress profile inthe oxide. Conversely, as the reaction ratesincrease, the stress gradients become more pro-nounced.
The time dependence of the oxide layer thick-ness and the biaxial stress profiles at a fixed oxidefilm thickness (X�0.04) are shown in Fig. 7a andb for the case in which anion diffusion is muchfaster than cation diffusion (α = 0.01). As in thethe fast cation diffusion case, oxide thickeningobeys parabolic kinetics at long times for all valuesof �. In contrast to the rapid cation diffusion case(Fig. 7a), the oxide film thickness at any fixed timeincreases with decreasing values of � (Fig. 7a).Also in contrast to the rapid cation diffusion case(Fig. 6a), the duration of the non-parabolic transi-ent increases with increasing �. Both of these canbe explained by the following arguments. In thiscase, cA at the surface is much smaller (for fixedX and �) than when a = 100 owing to the rela-tively slower diffusion of A, and hence, the oxi-dation reaction at the surface is comparativelyslow. Consequently, the surface reaction remains

2183R. Krishnamurthy, D.J. Srolovitz / Acta Materialia 51 (2003) 2171–2190
τ1/2
X-
X0
0 0.1 0.2 0.3
0.1
0.2
0.3
= 1000= 100= 10
(a)
Ψ
ΨΨ
ξ
σ
0 0.01 0.02 0.03 0.04-100
-90
-80
-70
-60
-50
-40
-30
-20
-10
0
= 10= 100= 1000
(b)
ΨΨ
Ψ
Fig. 6. Effect of the relative rates of reaction and diffusion (represented by the ratio � = kfsL0 /D) on (a) the time dependence ofthe oxide thickness, X–X0 and (b) biaxial in-plane stress profiles s(z) in a film of thickness 0.04 for a = 100.
slow even on increasing kf by varying � from 10–1000. However, the internal oxidation reaction pro-ceeds faster compared to the surface reaction as cA
within the layer is large compared to cA at the sur-face. Consequently, increasing � from 10–1000results in a substantial increase in the rate of theinternal oxidation reaction and an accompanyinglarge decrease in cA at the surface. Therefore, the
rate of the oxidation reaction at the surface and theoxide layer growth rate decrease with increasing� when oxygen diffusion is rapid. As we notedfor the rapid cation diffusion case, it is the quantityof internal oxide formed that determines the dur-ation of the non-parabolic, transient behavior. Thebiaxial stress profiles (Fig. 7b) show decreasedgradients with decreasing �, as in the rapid cation

2184 R. Krishnamurthy, D.J. Srolovitz / Acta Materialia 51 (2003) 2171–2190
τ1/2
X-
X0
0 1 2 3 4 5 6 7 8 9 100
0.05
0.1
0.15
0.2
0.25
= 10= 100= 1000
(a)
ΨΨ
Ψ
ξ
σ
0 0.01 0.02 0.03 0.04-100
-90
-80
-70
-60
-50
-40
-30
-20
-10
0
= 10= 100= 1000
(b)
ΨΨ
Ψ
Fig. 7. As per Fig. 6, but for a = DA /DO = 1 = 0.01. Note that variations in � have much less effect in this case than in the rapidcation diffusion case (see Fig. 6).
diffusion case (Fig. 6b). This decrease is muchsmaller in the fast oxygen diffusion case becausein this limit the chemical reaction is close to equi-librium and decreasing the reaction rate does notsubstantially alter the quantity of internal oxideformed.
The time dependence of the oxide layer thick-ness and the biaxial stress profiles at a fixed oxidefilm thickness (X�0.04) are shown in Fig. 8a and
b for the case in which the cation and anion diffusi-ties are comparable (a = 1). The trends are similarto the rapid cation diffusion case (Figs. 6a and b),except that the oxide layer thicknesses and the non-parabolic transients are smaller and the decrease instress gradients with decreasing reaction rates issmaller. This is consistent with the observation thatcation diffusivities and, consequently, internal oxi-dation rates are lower for the a = 1 case.

2185R. Krishnamurthy, D.J. Srolovitz / Acta Materialia 51 (2003) 2171–2190
τ1/2
X-
X0
0 0.5 1 1.50
0.02
0.04
0.06
0.08
0.1
0.12
= 1000= 100= 10
(a)
ΨΨ
Ψ
ξ
σ
0 0.01 0.02 0.03 0.04-100
-90
-80
-70
-60
-50
-40
-30
-20
-10
0
= 10= 100= 1000
(b)
ΨΨ
Ψ
Fig. 8. As per Fig. 6, but for a = DA /DO = 1.
6. Approximate analytical solutions
Most of the numerical solutions presented aboveare characterized by an initial transient, followedby some form of steady state behavior. In this sec-tion, we derive approximate analytical solutions forthe steady state regimes.
We first consider the case where cation diffusionis much faster than oxygen diffusion. Initially,there is no internal oxidation and the cation profilesreach a steady state at relatively short times. This
steady state is dictated by the rate of the surfaceoxidation reaction, and can be described, in thislimit, by
∂2cA
∂x2 � 0, cA(x � 0) � cIA, (27)
a∂cA
∂x ��s cA�PO2
L0� 0.
In Eq. (27), we have assumed that the advectivecontribution to the flux of A at the surface is smallcompared to the reaction rate. cI
A is the concen-tration of A in the oxide at the interface and is aconstant for the steady state problem at x = 0(contrast this with the equality of chemical poten-tials condition in Section 2).
The solution to Eq. (27) for any given oxidelayer thickness X is
cA(x) � cIA
� � �PO2(X�x)
� � �PO2X
(28)
where � = aL0 /�s is a dimensionless constant. Atlonger times, more oxygen diffuses into the oxideleading to internal oxidation and accompanyingstress generation. Eventually, chemical reactionequilibrium is attained throughout the oxide filmand any further oxidation can occur only whenmore of the reactants are supplied by diffusion. Atthese large times, the oxygen concentration profilesin the oxide film would have attained a steady statetoo, and this steady state is approximatelydescribed by the following
∂2cO
∂x2 � 0, cO(x � X) � cso,
∂co
∂x (x � 0) � 0
. (29)
The zero flux boundary condition at the interfaceis indicative of the interface oxidation reactionhaving reached a final state of chemical reactionequilibrium. In Eq. (29), cS
O is the oxygen concen-tration in the oxide at the surface and is a constantfor steady state conditions. The solution to Eq. (29)is the uniform state given by
cO(x) � cSO. (30)
2186 R. Krishnamurthy, D.J. Srolovitz / Acta Materialia 51 (2003) 2171–2190
At these late times, the cation profiles are differ-ent from those described by Eq. (27) because ofcation consumption by internal oxidation. Thechange in slope in the cation profiles can be esti-mated by mass conservation. At any given filmthickness X, the cation profiles will be given byEq. (28), were there no internal oxidation. Conse-quently, the difference between the total amount ofA in the oxide, if cA was given by Eq. (28)(obtained by integrating Eq. (28) between the lim-its 0 and X), and the actual total amount of A inthe oxide will equal the total amount of A con-sumed by internal oxidation. Assuming chemicalreaction equilibrium throughout the reaction layer,we can write the following expression for the cat-ion profile in the oxide at large times
cA(x) � cIA�Bx, B (31)
�
2K0cSOcI
A
X�
�PO2cI
A
� � �PO2X
1 � K0cSO
.
Eqs. (30) and (31) are in agreement with thelong time concentration profiles observed in thenumerical simulations (see Figs. 3a and 4a).
When oxygen diffusion is rapid, initial oxidationoccurs at the interface. With time, the cation dif-fuses into the oxide layer and oxidation occurswithin the oxide and at the surface. At large times,the interface and the internal oxidation reactionsattain chemical reaction equilibrium and hence, theoxygen concentration profile attains a steady statedescribed by Eq. (30). Since chemical reactionequilibrium pertains within the oxide, oxide layergrowth is controlled by the slower cation diffusioncontrolled surface oxidation. The steady stateattained by the cation concentrations is determinedby both the surface reaction rate and the quantityof A consumed by internal oxidation, as in therapid cation diffusion case. Accordingly, we expectit to be described by Eq. (31) as well, albeit withdifferent values for � and a. For similar reasons,we also expect the steady states represented byEqs. (30) and (31) to be eventually attained, whena = 1 as well. However, the times (filmthicknesses) beyond which these equations are a
valid approximation for the concentration profileswill be different.
The variation of the biaxial stress through thethickness of the oxide film can be obtained fromthe distribution of internal oxide formed
cp(x) exp(Sppcp(x)) � K0cA(x)cO(x) (32)
where cA (x) and cO (x) are obtained from Eqs. (30)and (31). The biaxial stress is then simply
s(x) � �E
1�vhpcp(x). (33)
The eqs. (27) and (31) depend on time throughthe film thickness X, which is related to time bythe following expression
X���
�PO2
� � �2
PO2
� 2bt � g,
b � a�p
�T
cIA
1 � K0csO
, g �2�X0
�PO2
� X20.
(34)
For large time, the growth kinetics is parabolicand Eq. (34) can be approximated as
X��(2bt). (35)
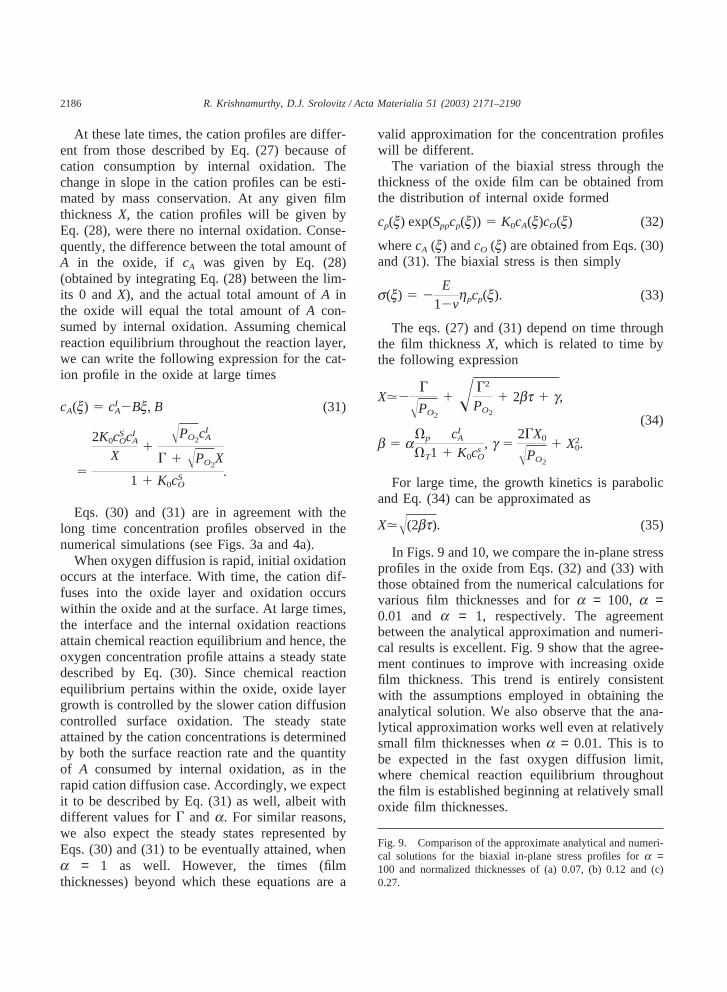
In Figs. 9 and 10, we compare the in-plane stressprofiles in the oxide from Eqs. (32) and (33) withthose obtained from the numerical calculations forvarious film thicknesses and for a = 100, a =0.01 and a = 1, respectively. The agreementbetween the analytical approximation and numeri-cal results is excellent. Fig. 9 show that the agree-ment continues to improve with increasing oxidefilm thickness. This trend is entirely consistentwith the assumptions employed in obtaining theanalytical solution. We also observe that the ana-lytical approximation works well even at relativelysmall film thicknesses when a = 0.01. This is tobe expected in the fast oxygen diffusion limit,where chemical reaction equilibrium throughoutthe film is established beginning at relatively smalloxide film thicknesses.
Fig. 9. Comparison of the approximate analytical and numeri-cal solutions for the biaxial in-plane stress profiles for a =100 and normalized thicknesses of (a) 0.07, (b) 0.12 and (c)0.27.

2187R. Krishnamurthy, D.J. Srolovitz / Acta Materialia 51 (2003) 2171–2190
ξ
σ
0 0.025 0.05 0.075-100
-90
-80
-70
-60
-50
-40
-30
-20
-10
0
numericalapproximate
(a)
ξ
σ
0 0.05 0.1-100
-90
-80
-70
-60
-50
-40
-30
-20
-10
0
numericalapproximate
(b)
ξ
σ
0 0.1 0.2-100
-90
-80
-70
-60
-50
-40
-30
-20
-10
0
numericalapproximate
(c)
ξσ
0 0.01 0.02 0.03 0.04-100
-90
-80
-70
-60
-50
-40
-30
-20
-10
0
(a)
numerical
approximate
DA/DO = 1
DA/DO = 0.01
ξ
σ
0 0.05 0.1-100
-90
-80
-70
-60
-50
-40
-30
-20
-10
0
(b)
approximatenumerical
DA/DO = 0.01
DA/DO = 1
Fig. 10. As per Fig. 9, for a = 1 and a = 0.01 and normalizedthicknesses of (a) 0.04 and (b) 0.10.
7. Conclusion
We have developed a continuum model for oxi-dation that predicts the oxide scale growth rate andthe spatial distribution of stress and concentrationswithin the scale. The stresses affect internal oxi-dation by changing the free energy of the reactionand affect diffusion by modifying the chemicalpotential. This allows us to consider how the stressinhibits internal oxidation in a thermodynamically

2188 R. Krishnamurthy, D.J. Srolovitz / Acta Materialia 51 (2003) 2171–2190
and kinetically consistent manner. We find that sig-nificant stress gradients can be developed acrossthe oxide layer, and that the oxide/substrate inter-face can be under relatively high compressivestress. We study different diffusion controlledgrowth regimes by varying the ratio of cation andoxygen diffusivities a and the ratio of the forwardoxidation reaction rate constant and the diffusivi-ties. One of the interesting results that emerge fromthese calculations is that the stress gradients in theoxide layer, at long times, has the same signregardless of the value of a. The stress gradient atlong times, for all values of a, is such that thestress is highly compressive at the substrate/filminterface and decreases in magnitude on movingtowards the surface of the film. This result is inqualitative agreement with x-ray diffraction basedmeasurements of strain gradients in oxides [25,15].Qualitatively similar stress distributions have alsobeen observed experimentally in Si02 films grownthermally on Si substrates at 950°C (at higher tem-peratures, the Si02 layer is viscoelastic) [18].Gradients in the phase fraction of tetragonal Zr02
across a Zr02 film, bearing the same sign, have alsobeen attributed to stress gradients of a similar nat-ure [36]. We have also developed a relatively sim-ple, approximate, analytical solution for the com-position and stress that accurately matches thedetailed numerical results at long time.
With experimental values of the physical para-meters (e.g. the solubilities of the two species inthe oxide, relative diffusivities, etc.), this solutioncan be used to estimate the magnitude and natureof stresses and stress gradients in the oxide layer.In these diffusion controlled growth processes,reaction rates are considerably higher than diffus-ivities in the oxide film (kfsX»D). However, vary-ing the relative rates of reaction and diffusion overa range that is still within the diffusion controlledgrowth regime significantly affects the rate ofoxide thickening and the magnitude of the stressgradient within the oxide layer.
Our model does not consider the effects ofmicrostructural features within the oxide layer onthe stress distribution or stress relaxation mech-anisms. Consequently, it does not account for theimportant role grain boundaries may play ininternal oxidation. This problem can only be
addressed in higher dimensions. However, we canexamine some simple effects of the presence ofgrain boundaries within the framework of thepresent model. One possible effect of grain bound-aries is an increase in the solubility of both oxygenand the cation in the oxide layer. With increasedsolubility, higher stresses are developed in theoxide layer; this effect is shown in Fig. 11. Thepresence of grain boundaries will change the effec-tive cation and oxygen diffusivities, and conse-quently, influence the relative rates of reaction anddiffusion as represented by the ratio kfs /D. For anoxide film with a grain size d and a grain boundarywidth d, the effective diffusivity of either of thetwo species can be estimated by
Deff � Db(1 �ddDgb
Db
) (36)
where Db is the diffusivity through the bulk andDgb is the grain boundary diffusivity. For Dgb /Db
= 9000, d = 1 nm and d = 1 µm, the effectivediffusivity Def f is an order of magnitude higherthan the bulk diffusivity Db. Consequently, theratio kfs /Db is smaller by an order of magnitudecompared the bulk case. As Figs. 6–8 show, thisleads to lower stress gradients and a more uniform
ξ
σ
0 0.025 0.05 0.075 0.1
-600
-500
-400
-300
-200
-100
0
DA / DO = 100DA / DO = 0.01
Fig. 11. Stress profile, s(x), as per Figs. 2b and 5 and 5a,but in which the maximum solubility of oxygen in the oxide isarbitrarily set to 10% (the corresponding value in Figs. 2b and5a is 2.2%) and that of metal in the oxide is set to 5% (thecorresponding value in Figs. 2b and 5a is 1.3%).

2189R. Krishnamurthy, D.J. Srolovitz / Acta Materialia 51 (2003) 2171–2190
stress distribution. This approximation (Eq. (36))is only expected to provide a reasonable estimateprovided that ((d /d) (Dgb /Db)) is small. Othermicrostructural features, such as the morphologyof the substrate and/or oxide film will certainlymodify the stresses and stress gradients within thefilm. Similarly, plastic deformation, creep or crack-ing within the film (or substrate) [11,2] can alsostrongly modify the stresses and oxide layergrowth rates.
Acknowledgements
The authors gratefully acknowledge useful dis-cussions with Z. Suo, A.G. Evans and D.R. Mummduring the course of this work. The authors aregrateful to the reviewer for helpful comments andsuggestions. This work was supported by NASAGlenn Research Center through agreementNRA01-GRC-03.
References
[1] Kubaschewski O, Hopkins BE. Oxidation of metals andalloys. London: Butterworths, 1962.
[2] Stringer J. Stress generation and relief in growing oxidefilms. Corros. Sci 1970;10:513–43.
[3] Evans UR. The mechanism of oxidation and tarnishing.T. Electrochem. Soc. 1947;91:547–72.
[4] Rhines FN, Wolf JS. The role of oxide microstructure andgrowth stresses in the high-temperature scaling of nickel.Metall. Trans 1970;1:1701–10.
[5] Forest C, Davidson JH. Some observations on the effectsof sulfur and active elements on the oxidation of FeCrAlYalloys. Oxid. Met 1995;43(5-6):479–90.
[6] Evans HE, Huntz AM. Methods of measuring oxidationgrowth stresses. Materials at High Temperatures1994;12(2-3):111–7.
[7] Lipkin DM, Clarke DR. Measurement of the stress inoxide scales formed by oxidation of alumina-formingalloys. Oxid. Met. 1970;45(3-4):267–80.
[8] Li MS, Li TF, Gao W, Liu ZY. Determination of oxidegrowth stresses by a novel deflection method. Oxid. Met1999;51(5-6):333–51.
[9] Buscail H, Stroosnijder MF, Jacob YP, Sciora E. Influenceof yttrium implantation on growth stresses developed inFeO scales formed on pure iron at 800°C. Mater. Sci. andEngg. A 1999;262(1-2):184–91.
[10] Huntz AM, Calvarin Amiri G, Evans HE, Cailletaud G.Comparison of oxidation-growth stresses in NiO film mea-
sured by deflection and calculated using creep analysis orfinite-element modeling. Oxid. Met 2002;57(5-6):499–521.
[11] Tolpygo VK, Clarke DR. Competition between stress gen-eration and relaxation During oxidation of an Fe-Cr-Al-Yalloy. Oxid. Met 1998;49(1-2):187–212.
[12] Dankov PD, Churaev PV. Doklady. Akad. Nauk. SSSR1950;29:529–82.
[13] Mitchell TE, Voss DA, Butler EP. The observation ofstress effects during the high-temperature oxidation ofiron. J. Mater. Sci 1982;17(6):1825–33.
[14] Ueno T. Stresses in bi-layered NiO scales. Trans. JapanInst. Met 1974;15:167–72.
[15] Zhu D, Stout JH, Shores DA. Determination of stressgradients in a thermally grown oxide layer using X-raydiffraction. Mater. Sci. Forum 1997;251-254:333–40.
[16] Roy C, Burgess B. A study of the stresses generated inzirconia films during the oxidation of zirconium alloys.Oxid. Met 1970;2(3):235–61.
[17] Bradhurst DH, Heuer PM. The influence of oxide stresseson the breakaway oxidation of zircaloy-2. J. Nucl. Mater.1970;37:35–47.
[18] Kobeda E, Irene EA. Si02 film stress distribution duringthermal oxidation of Si. J. Vac. Sci. Technol. B1988;6(2):574–8.
[19] Pilling NB, Bedworth RE. The oxidation of metals at hightemperatures. J. Inst. Met 1923;29:529–82.
[20] Pieraggi B, Rapp RA. Stress generation and vacancyannihilation during scale growth limited by cation-vacancydiffusion. Acta Metall 1988;36(5):1281–9.
[21] Srolovitz DJ, Ramanarayanan TA. An elastic analysis ofgrowth stresses during oxidation. Oxid. Met 1984;22(3-4):133–46.
[22] Tolpygo VK, Dryden JR, Clarke DR. Determination ofthe growth stress and strain in α-Al2O3 scales during theoxidation of Fe-22Cr-4.8A1-0.3Y alloy. Acta Mater1998;46(3):927–37.
[23] Speight MV, Harris JE. The generation of stresses in oxidefilms growing by cation diffusion. Acta Metall1978;26:1043–5.
[24] Atkinson A. Conditions for the formation of new oxidewithin oxide films growing on metals. Corros. Sci1982;22(4):347–57.
[25] Hou PY, Cannon RM. The stress state in thermally grownNiO scales. Mater. Sci. Forum 1997;251-254:325–32.
[26] Larche F, Cahn JW. The interactions of composition andstress in crystalline solids. Acta Metall 1985;33:333–57.
[27] Haase R. Thermodynamics of irreversible processes. NewYork: Dover, 1990.
[28] Kirkaldy JS, Young DJ. Diffusion in the condensed state.London: The Institute of Metals, 1987.
[29] Stephenson GB. Deformation during interdifusion. ActaMetall 1988;36(10):2663–83.
[30] Dechamps M, Barbier F. In: Nowotny J, editor. Scienceof ceramic interfaces. Holland: Elsevier Science; 1991. p.79–204.
[31] Hirth JP, Pieraggi B, Rapp RA. The role of interface dislo-

2190 R. Krishnamurthy, D.J. Srolovitz / Acta Materialia 51 (2003) 2171–2190
cations and ledges as sources/sinks for point defects inscaling reactions. Acta Metall. Mater 1995;43(3):1065–73.
[32] Murray WD, Landis F. Numerical and machine solutionsof transient heat-conduction problems involving meltingor freezing. Trans. ASME Ser. D 1959;81:106–12.
[33] Kofstad P. High Temperature oxidation of metals. NewYork: John Wiley & Sons; 1966. p. 147-227.
[34] O’Keefe M, Moore WJ. Diffusion of oxygen in singlecrystals of nickel oxide. J. Chem. Phys 1961;65:1438–9.
[35] Hauffe K. Oxidation of metals. New York: PlenumPress, 1965.
[36] Roy C, David G. X-ray diffraction analyses of zirconiafilms on zirconium and zircaloy-2. J. Nucl. Mater1970;37:71–81.


![[TA1-D] Hybrid Oxide Thin Films](https://img.pdfslide.us/doc/110x75/615ab33bad71057f9352b7b6/ta1-d-hybrid-oxide-thin-films.jpg)