Embed Size (px)
Citation preview
United States General Accounting Office
GAO Report to Congressional Requesters
March 1997 MEASURINGPERFORMANCE
Strengths andLimitations ofResearch Indicators
GAO/RCED-97-91

GAO United States
General Accounting Office
Washington, D.C. 20548
B-275241
March 21, 1997
The Honorable Constance A. MorellaChairwomanThe Honorable Bart GordonRanking Minority MemberSubcommittee on TechnologyCommittee on ScienceHouse of Representatives
The Honorable John S. TannerHouse of Representatives
This report responds to your request for information on the indicators used to evaluate theresults of research and development (R&D). The report discusses the relative strengths andlimitations of the input and output indicators used by the federal and private sectors to measurethe results of R&D. The report also provides a historical perspective on research spending.
As agreed with your offices, we plan no further distribution of this report until 30 days from itsdate of issue, unless you publicly announce its contents earlier. We will then send copies tointerested parties, and we will also make copies available to others upon request.
If you have any questions, I can be reached at (202) 512-3600. Major contributors to this reportare listed in appendix II.
Allen LiAssociate Director, Energy, Resources, and Science Issues
Executive Summary
Purpose American taxpayers invested more than $60 billion in federal funds inmilitary and civilian research and development (R&D) efforts in 1996. Theprivate sector invested more than $110 billion that same year. Thetechnological advancements resulting from these efforts are a criticalfactor in improving the productivity of American workers and,correspondingly, the nation’s standard of living. However, while thecontribution of R&D to technological advancement is widely recognized,there is no widely accepted method of measuring the results of thatresearch.
To facilitate discussions of the adequacy of the funding and of the resultsof the R&D, the Subcommittee on Technology, House Committee onScience, asked GAO to evaluate the various indicators that are used tomeasure the results of R&D. Specifically, this report discusses the strengthsand limitations of the input and output indicators used by the federal andprivate sectors to measure the results of R&D. This report also provides ahistorical perspective on spending for research.
Background The commitment to reduce the federal deficit is forcing the Congress toreexamine the value of programs across the federal government. Althoughscientific research is often considered to be intrinsically valuable tosociety, there is pressure on all federal agencies, including scienceagencies, to demonstrate that they are making effective use of thetaxpayers’ dollars. This greater emphasis on results is evident in thepassage of the Government Performance and Results Act of 1993 (GPRA).The act fundamentally seeks to shift the focus of federal management andaccountability from a preoccupation with staffing, activity levels, andtasks completed to a focus on results—that is, the real difference thatfederal programs make in people’s lives.
The experts in research measurement have tried for years to developindicators that would provide a measure of the results of R&D. However,the very nature of the innovative process makes measuring theperformance of science-related projects difficult. For example, a widerange of factors determine if and when a particular R&D project will resultin commercial or other benefits. It can also take many years for a researchproject to achieve results.
Results in Brief The amount of money spent on research and development, the primaryindicator of the investment in research, is useful as a measure of how
GAO/RCED-97-91 Measuring PerformancePage 2
Executive Summary
much research is being performed. Having been refined over many years,these data are generally available for the research efforts in both thepublic and private sectors. However, the level of spending is not a reliableindicator of the level of results achieved by research.
Unlike the situation with the input measures of research and development,there is no primary indicator of the outputs. Output indicators includequantitative analyses of return on investment, patents granted, and otheroutputs as well as qualitative assessments based on peer review. Thecompanies that GAO spoke with collect data on various output indicatorsbut, in general, make limited use of them in their investment decisions.Instead, the companies emphasized that research and developmentcontribute directly to their “bottom line.” Because companies areprofit-oriented, many of the indicators tracked by the private sectorcannot be directly applied to the federal government. Experiences frompilot efforts made under the Government Performance and Results Acthave reinforced the finding that output measures are highly specific to themanagement and mission of each federal agency and that no singleindicator exists to measure the results of research.
Principal Findings
Funding IndicatesResearch Activity but DoesNot Measure the Results ofResearch
Funding has been used as the primary input indicator for decades.Whether a policymaker is interested in basic research, applied research, ordevelopment, the amount of money spent in that area is taken as anindication of how much research is being performed. The majoradvantages of using expenditure data as an indicator are that they areeasily understandable, readily available, and have been, in general,consistently gathered over time. In addition, spending on different projectsin different research areas can be measured according to the same unit,dollars, making comparisons between projects straightforward.
The amount of funding, however, does not provide a good indication of theresults of research. Companies told GAO that they are focusing more oftheir spending on short-term R&D projects than on long-term projects.However, the impacts of that change in focus are unclear. The reducedfunding levels may not reflect the fact that the R&D efforts are beingperformed with greater efficiency. For example, one way in which thefederal government and the private sector have tried to use R&D resources
GAO/RCED-97-91 Measuring PerformancePage 3
Executive Summary
more efficiently and effectively is through consortia with universities orother companies. By combining their research activities, the companiesattempt to avoid expensive duplication and learn from each other.
R&D Output IndicatorsCan Provide LimitedInformation About theResults of R&D
Because of the difficulties in identifying the impacts of research,decisionmakers have developed quantitative and qualitative indicators asproxies to assess the results of R&D activity. The strengths and limitationsare evident in both types of indicators. The current quantitative indicatorsfocus mainly on return on investment, patenting rates, andbibliometrics—the study of published data. While implying a degree ofprecision, these indicators were not originally intended to measure thelong-term results of R&D. Qualitative assessment provides detailedinformation, but it relies on the judgments of experts and may beexpensive.
Because of these difficulties, the companies interviewed by GAO stressedmarketplace results rather than R&D output indicators. While varying in thetypes of indicators they collect, they emphasized the difficulties inmeasuring R&D’s specific contribution to a company’s overall performance.For example, one company stated that because so many people have beeninvolved in a product’s evolution, it is difficult to separate the contributionof the research unit from that of other units. All of the companiesinterviewed have increased their expectation that R&D contribute directlyto their profitability, but instead of increasing their efforts at measuringR&D results, they have shifted the responsibility for R&D decisions to thebusiness units. However, many of the R&D output measures tracked by theprivate sector do not apply directly to the federal government. Inparticular, while facing the same increasing cost pressures as the privatesector, the federal government cannot rely on the profit motive to guide itsdecisions.
The GPRA requires the executive agencies to develop their annual R&D planswith suitable performance measures. The Research Roundtable, a group offederal researchers and managers representing a cross-section of R&D
departments and agencies, warned about the difficulties of quantifying theresults of R&D and the potential for incorrect application with subsequentharm to scientific endeavors. The Army Research Laboratory, which wasdesignated a pilot project for performance measurement under the act, hasdeveloped a multifaceted approach using quantitative indicators, peerreview, and customer feedback to evaluate the results of R&D.
GAO/RCED-97-91 Measuring PerformancePage 4
Executive Summary
Recommendations This report contains no recommendations.
Agency Comments Because this report focuses broadly on the R&D of both the federal andprivate sectors, and not on the effort of individual agencies, GAO did notsubmit a draft of this report to federal agencies for their review andcomment.
GAO/RCED-97-91 Measuring PerformancePage 5
Contents
Executive Summary 2
Chapter 1 Introduction
8The Process of Innovation and the Use of R&D Indicators 8Past Efforts to Evaluate R&D Impacts 10The Government Performance and Results Act 11Objectives, Scope, and Methodology 12
Chapter 2 R&D Spending DataProvide SomeInformation AboutInnovative Activitybut Not About R&DResults
14R&D Spending Gives an Indication of Innovative Effort 14R&D Spending Is Not a Good Indicator of R&D Results 15Spending Patterns Show a Greater Emphasis on Short-Term
Research17
Chapter 3 R&D OutputIndicators CanProvide LimitedInformation AboutR&D Results
18Current Indicators Have Strengths and Limitations 18The Private Sector’s Emphasis on Marketplace Results Limits
Lessons for the Federal Government22
Federal Science Agencies Are Still Exploring Ways to Measurethe Impacts of R&D
26
Appendixes Appendix I: Historical Perspective on Research Spending 28Appendix II: Major Contributors to This Report 34
Figure Figure I.1: U.S. R&D Spending, 1953-96 30
GAO/RCED-97-91 Measuring PerformancePage 6
Contents
Abbreviations
ARPA Advanced Research Projects AgencyDOD Department of DefenseGAO General Accounting OfficeGPRA Government Performance and Results ActIRI Industrial Research InstituteNIH National Institutes of HealthNSF National Science FoundationNASA National Aeronautics and Space AdministrationOECD Office of Economic Cooperation and DevelopmentOTA Office of Technology AssessmentR&D research and development
GAO/RCED-97-91 Measuring PerformancePage 7
Chapter 1
Introduction
Over $180 billion was spent on research and development (R&D) in theUnited States in 1996.1 Most of that amount was spent by industry and thefederal government—$113 billion and $62 billion, respectively; the balancewas spent by universities and other nonprofit organizations. The leadingexperts in the study of research indicators agree that R&D has a significant,positive effect on economic growth and the overall standard of living.However, because of the complexity of linking the results of R&D to itseconomic impacts, there is no widely accepted method of measuring theresults of R&D spending in either industry or the federal government. Thecommitment to reduce the federal budget deficit is forcing the Congressand the executive branch to undertake a basic reexamination of the valueof programs across the federal government. It is also placing pressure onall federal agencies, including the civilian science agencies, to clearlydemonstrate that they are making effective use of the taxpayers’ dollars.The Government Performance and Results Act of 1993 (GPRA) provides alegislative vehicle for the agencies to use as they seek to demonstrate andimprove their effectiveness. Equally important, if successfullyimplemented, GPRA should help the Congress make the difficult funding,policy, and program decisions that the current budget environmentdemands.
The Process ofInnovation and theUse of R&D Indicators
Researchers have developed their own terminology for describing theprocess of transforming R&D into economic results. In its simplest form,the theory underlying both public and private decision-making has beenthat innovative activity positively affects economic performance.Innovation can be thought of as the development and application of a newproduct, process, or service. It can include the use of an existing productin a new application or the development of a new device for an existingapplication. Innovation encompasses many activities, including scientific,technical, and market research; product, process, or service development;and manufacturing and marketing to the extent that they support thedissemination and application of the invention. Innovation is acombination of invention and commercialization. Invention describes theinitial conception of a new product, process, or service, but not the act ofputting it to use. Commercialization refers to the attempt to profit frominnovation through the sale or use of new products, processes, andservices.
1These figures are based on preliminary 1996 statistics reported by R&D performers to the NationalScience Foundation.
GAO/RCED-97-91 Measuring PerformancePage 8
Chapter 1
Introduction
This description as well as the traditional views of innovation has beenstrongly influenced by the linear model of innovation, which says thatinnovation proceeds sequentially through the stages of basic research,applied research, development, manufacturing, and marketing.2 Thismodel assumes that basic research serves as the source of innovation andthat new scientific knowledge initiates a chain of events culminating in thedevelopment and sale of a new product, process, or service. In this model,basic research is the most uncertain part of the process; once basicresearch is conducted, innovation and commercialization can proceed.The model suggests that the firms with the best technology will likely bethe first to market and win the lion’s share of profits.
The simplicity of this model makes it particularly useful in policydiscussions. Other models may be more accurate, but they provide a morecomplex explanation of the relationship between science and thecommercialization of new technology. These models, such as the“chain-linked model,” include feedback loops that allow for interactionamong the different stages of the linear model. These models also reflectthe fact that the ideas for new inventions or changes to existing productsoften arise from the recognition of new market opportunities, advances inmanufacturing capabilities, or advances in technology independent ofprogress in the underlying science.
Real-world examples show that technological breakthroughs can precedeas well as follow basic research. In many cases, science is not the sourceof innovation. The Wright brothers, for example, developed the firstairplane without an understanding of aerodynamic theory, and ChesterCarlson developed the first xerographic copier without a thoroughunderstanding of photoconductive materials. These inventions haveresulted in considerable research into aerodynamic theory and materialsscience, respectively, as scientists and engineers attempted to improve theoriginal invention.
In studying complex processes or concepts such as innovation, it is notalways possible to measure them directly. As a result, researchers turn tothe use of “indicators.” Indicators point to or illustrate the process or
2The National Science Foundation uses the following definitions in its resource surveys: Basic researchhas as its objective to gain a more comprehensive knowledge or understanding of the subject understudy, without specific applications in mind. Applied research is aimed at gaining knowledge orunderstanding to determine the means by which a specific, recognized need may be met. Developmentis the systematic use of the knowledge or understanding gained from research directed toward theproduction of useful materials, devices, systems, or methods. The Foundation recognizes thelimitations of this classification scheme but continues to use these categories to maintain historicalconsistency, among other reasons.
GAO/RCED-97-91 Measuring PerformancePage 9
Chapter 1
Introduction
concept in question but do not directly measure it. For example, in orderto determine an object’s temperature, one can use a thermometer tomeasure it directly. However, when trying to measure something ascomplex as the health of a country’s economy, one relies on differentindicators, such as unemployment rates, stock market averages, or tradebalances that do not provide a direct measurement of economic health butdo give an indication of its status. In the case of innovation, various “input”and “output” indicators are used that are based on the linear model ofinnovation. The following chapters of this report are broken downaccording to these two sets of indicators. Chapter 2 is concerned with R&D
spending, or expenditure data, which is the most widely used inputindicator of innovation, and chapter 3 focuses on some widely used outputindicators.
Past Efforts toEvaluate R&DImpacts
For almost two decades, numerous reports have documented thedifficulties of quantifying the results of R&D. As noted above, theidentification of the economic and social effects of research involvescomplex issues of measurement, analysis, and interpretation. Thefollowing efforts may help to give perspective to the present concernsabout measuring R&D results.
• In 1979, we reported on a wide range of factors that make themeasurement of R&D results difficult.3 The report noted that R&D
expenditures are undertaken for a variety of reasons. Some attempt todevelop new knowledge; others are directed at meeting needs, such asnational defense, for which there is no commercial market; and still othersare directed at lowering the cost of products. Furthermore, some projectsproduce revolutions; others produce nothing. Most important, R&D is onlyone input into a complex process. Thus, we concluded that there is nopossibility of eliminating the role that judgment plays in the allocation offederal R&D resources.
• In 1986, the Office of Technology Assessment (OTA) issued a detailedreport that questioned the utility of the effort to quantify R&D returns.4
According to OTA, the fundamental stumbling block to placing an economicvalue on federal R&D is that improving productivity or producing aneconomic return is not the primary justification for most federal R&D
programs. The report added that the attempts to measure the economicreturn to federal R&D are flawed because many of the research outputs,
3Assessing the “Output” of Federal Commercially Directed R&D (GAO/PAD-79-69, Aug. 1979).
4Research Funding as an Investment: Can We Measure the Returns? Office of Technology Assessment,72 pp. (Apr. 1986).
GAO/RCED-97-91 Measuring PerformancePage 10
Chapter 1
Introduction
such as national defense, cannot be assigned an economic value. Thereport also noted that in industry, where one might expect quantitativetechniques to prevail because of the existence of a well-defined economicobjective, OTA found a reliance on subjective judgment and goodcommunications between R&D, management, and marketing staffs.
• In 1996, responding to concerns about the implementation of GPRA, theNational Science and Technology Council issued a report that stressed thelimited role of quantification in measuring the results of R&D.5 It stated thatthe insufficiency of quantitative measures per se is one reason why othersources of evidence, such as merit review of past performance, narrativediscussion, and descriptions of outstanding accomplishments and moretypical levels of achievement, should be included in annual performancereports. The report concluded that the cornerstone of world-class sciencewill continue to be merit review with peer evaluation, while the sciencecommunity works to develop the measurement tools and other methodsneeded to assess the contributions of fundamental science.
• At the international level, the Organization of Economic Cooperation andDevelopment (OECD) is also grappling with these questions. Beginning withthe first edition of the Standard Practice for Surveys of R&D (the “FrascatiManual”) in the 1960s, OECD has been developing international frameworksfor the measurement of R&D inputs. In connection with its more recenteffort to develop new output indicators (the “Oslo Manual”), OECD statedthat the new indicators and the underlying statistics usually take two ormore decades to reach general acceptance and regular collection andpublication. The participants at a 1996 OECD conference extensivelydiscussed the organization’s efforts to improve the quality of innovationindicators. At this stage, these indicators appear to be most useful inhelping researchers study and describe the process of innovation.
The GovernmentPerformance andResults Act
In response to questions about the value and effectiveness of federalprograms, GPRA seeks to shift federal agencies’ focus away from suchtraditional concerns as staffing, activity levels, and tasks completedtoward a focus on program outcomes—that is, the real difference thefederal program makes in people’s lives. In the GPRA context, an “outcomemeasure” assesses the results of a program activity compared to itsintended purpose. An “output measure,” according to GPRA, tabulates,calculates, or records the level of activity or effort and can be expressed ina quantitative or qualitative manner. The output indicators discussed inour report could be considered either outcome measures or outputmeasures, depending on the context. For example, return-on-investment
5Assessing Fundamental Science, National Science and Technology Council (July 1996).
GAO/RCED-97-91 Measuring PerformancePage 11
Chapter 1
Introduction
calculations could be outcome measures in a business context sincegaining the maximum return on investment is the intended purpose of abusiness. Patenting rates would be output measures in some businessesbecause patents could serve as one measure of the level of activity of aresearch unit.
The act recognizes how difficult it is to state the goals and measure theresults of some programs. While the law encourages the use of objectivemeasures of performance, it authorizes agencies—with the approval of theOffice of Management and Budget—to use alternative, subjectivemeasures of performance. Also, instead of having GPRA take effectimmediately after its passage in 1993, the Congress allowed for a period oftime for the government to learn how to implement the act. As part of thelearning process, the act called for the use of pilot projects in performancemeasurement. Among the approximately 70 agencies or parts of agenciesthat participated in pilot projects, one addresses scientific research. Uponthe full implementation of the act, the executive branch agencies arerequired to devise plans that are outcome-oriented. The act calls for theagencies to develop three documents: a strategic plan, an annualperformance plan, and an annual performance report.
Objectives, Scope,and Methodology
In response to the Subcommittee on Technology’s request, our objectivewas to review various indicators that are used to measure the results ofR&D. Specifically, this report discusses the relative strengths andlimitations of the input and output indicators used by the federal andprivate sectors to measure the results of R&D as well as the claim thatindustry focuses on short-term profitability rather than long-term R&D
needs. This report also provides a historical perspective on researchspending. (See app. I.)
The impacts of innovation are widely studied in the public and privatesectors as well as in academia. Our work relied on a limited number ofexperts in each of these sectors to provide us with the prevailingunderstanding of and latest developments in the area. As a result, ourreview does not provide an exhaustive examination of R&D measures nordoes it answer the question of how R&D should be measured. It does,however, as agreed with your offices, consist of information on thestrengths and limitations in the use of these indicators as well as anecdotalinformation based on interviews with leading R&D companies. We alsoreviewed the relevant literature.
GAO/RCED-97-91 Measuring PerformancePage 12
Chapter 1
Introduction
We interviewed a number of experts, including a former IBM Vice Presidentfor Research and National Science Foundation (NSF) Director, a formerExecutive Director of the Manufacturing Forum, a former AssociateDirector of the White House Office of Science and Technology Policy, theDirector of the Special Projects Office for the Army Research Laboratory,and the former Chief Financial Officer for Apple Computer. We alsoconducted six teleconferences with company officials who were typicallyat the director level. We interviewed representatives of General Electric,Lucent Technologies (formerly Bell Labs), Dow Chemical,Eastman-Kodak, IBM, and Microsoft Corporation. These companies spentfrom $5 billion to $800 million on R&D in 1995. We chose companies havingamong the largest total R&D budgets, in terms of dollars spent, because webelieved that their experiences would be the most relevant to the needs ofthe federal government.
Our work also covered the available data on R&D spending and outputindicators provided by the leading data-gathering organizations in thisfield—the OECD, NSF, and the Industrial Research Institute (IRI). Ourcollaboration with the OECD included participation in an OECD conferenceon science and technology indicators. Throughout the course of this work,we also interviewed the NSF staff responsible for publishing the Scienceand Engineering Indicators.
We performed our audit work from June 1996 through February 1997 inaccordance with generally accepted government auditing standards.
GAO/RCED-97-91 Measuring PerformancePage 13
Chapter 2
R&D Spending Data Provide SomeInformation About Innovative Activity butNot About R&D Results
R&D spending data provide an indication of how much research is beingperformed but do not provide a measure of the impacts of that spending.Spending data have been used for budgeting purposes; however, they havealso been used as an indicator of the level of innovative activity within anation or company. The use of R&D spending data as an indicator has anumber of advantages. For example, it reduces the innovation process to asingle figure for the purposes of discussion. In addition, the data-gatheringmethods have been refined over many years and are generally reliable overtime. However, the level of spending is not a reliable indicator of the levelof research results. For example, companies told us that they are focusingmore of their spending on short-term R&D projects than on long-termprojects, but the impacts of that change in emphasis are unclear. The useof spending data is more appropriate for discussions of R&D spendingpriorities than of the effectiveness and impacts of R&D spending levels.
R&D Spending Givesan Indication ofInnovative Effort
Traditionally, R&D expenditures have been taken to indicate the “amount”of innovative activity that is occurring within a country or a firm. One ofthe advantages of using expenditure data in this way is that it simplifiesthe discussion of the complex process of innovation to a single unit ofmeasurement. Another advantage is that the use of dollars as the unit ofmeasurement enables direct comparisons to be made. In addition, thegathering of spending data has been refined over many years, increasingthe data’s reliability and relevance to policy-making.
This straightforward rationale—the more R&D spending, the moreinnovative activity—is the primary advantage to using expenditure data inpolicy discussions. Its simplicity and close ties to the linear model ofinnovation allow it to be readily understood by those with little specializedknowledge, making it appealing in policy discussions. These samesimplifying characteristics may have led to its use in other areas. In somecontexts, countries and companies are categorized according to theirtechnological sophistication on the basis of their R&D spending levels; littleattention is given to other factors.
Another advantage arises from the common use of “dollars” in the R&D
spending data. This usage enables the spending in different research areasto be compared according to the same units. These straightforwardcomparisons are useful in demonstrating the priorities of the nation atlarge. For example, recent U.S. R&D expenditure data show that areduction in defense-related R&D was somewhat counterbalanced by anincrease in federal support for civilian R&D programs, including those
GAO/RCED-97-91 Measuring PerformancePage 14
Chapter 2
R&D Spending Data Provide Some
Information About Innovative Activity but
Not About R&D Results
aimed at improving the diagnosis and treatment of disease, cleaning up theenvironment, and enhancing technological competitiveness and economicprosperity. In addition, converting different foreign currencies to dollarsallows for international comparisons of research. After allowing for thevariation of inflation over time, funding data depict historical patterns ofreal expenditures.
The accuracy and policy relevance of spending data are also importantadvantages to their use as indicators. The typical source of these data isthe widely cited Science and Engineering Indicators document publishedperiodically by the National Science Board. The Science ResourcesStudies Division of NSF has been gathering data to use in Indicators formany years, and many improvements have been made in the accuracy ofthe data.6 For example, NSF has sponsored the Survey of Industrial R&D
since 1953 as a source of data for Indicators. Recent improvements to thissurvey include selecting samples annually (rather than less frequently) andincreasing the sample size from approximately 14,000 to nearly 24,000firms. NSF took these steps to account more accurately for theestablishment of R&D-performing entities in the survey universe and tosurvey more fully and accurately the R&D performed by nonmanufacturingfirms. In addition, NSF is constantly searching for ways to make Indicatorsmore responsive to policymakers’ needs. NSF began to make adjustmentsin its surveys when it recognized that there was a need to supply moreinformation on the service sector to policymakers because the surveyhistorically had focused on the manufacturing industries in which R&D
performance had been heavily concentrated in the past.
R&D Spending Is Nota Good Indicator ofR&D Results
The use of spending data is limited in its relevance to the impacts of R&D.There is some correlation between the level of R&D spending andinnovative success. For example, if fewer research projects are performed,then companies and countries forgo the potential benefits of the research.However, spending alone does not guarantee innovative success becausemany additional factors figure into the innovation process and haveimportant effects on the resulting outputs. The reality of the process ofinnovation is much more complex than expenditure data alone can reveal.
The usefulness of R&D spending data as an indicator of results is limitedbecause the data measure the amount of resources a firm or a nation
6Some problems with the data may still exist, however. For example, NSF itself notes that the data ontrends in the private sector’s basic research contain anomalous spending spikes in 1986 and 1991. Theinconsistencies in the data appear to derive from changes made in the NSF survey in those years. Forexample, in 1991 the survey was expanded to cover a broader array of nonmanufacturing firms.
GAO/RCED-97-91 Measuring PerformancePage 15
Chapter 2
R&D Spending Data Provide Some
Information About Innovative Activity but
Not About R&D Results
dedicates to innovation, but not its ability to convert that effort intosuccessful products, processes, and services. Accounts in the press havenoted that companies are proud of high R&D spending levels becausewell-focused R&D generally pays off in long-term revenue growth andprofits. However, more is not always better, as shown by the companiesthat ranked among the leaders for R&D spending and disappeared shortlythereafter. For example, two companies called Xonics and TransitronElectronic ranked as the top companies in R&D spending per employee for1984 and 1986, respectively; in the same years that they achieved their topranking, one company was forced to file for Chapter 11 protection and theother company dissolved.
There is great uncertainty in research and development investments. Theprocesses leading to commercially viable and socially useful technologiesare complex and involve substantial non-R&D factors. One company officialtold us that it was impossible to determine which business function wasmost important to the success of a new product—research, marketing, orsales. While there is some correlation between the level of R&D spendingand innovative success, spending alone does not guarantee success. Oneofficial from a high-technology company told us that his company isconstantly evaluating research projects with respect to their targetedmarkets and estimating the expected return on investment. However, inone case the company lost approximately $100 million when the marketwould not support a newly developed product at the price the companyexpected.
The usefulness of R&D spending indicators is also limited because the wayin which innovative activities are structured and managed can be assignificant as the amounts of resources devoted to them in determiningtheir outcomes and effects on performance. Those nations or firms withextremely efficient innovation systems can outperform those that usegreater R&D resources inefficiently. As a former director of NSF pointed outto us, streamlining research efforts could reduce both bureaucratic andfinancial overhead costs and make up for spending reductions.
In addition, falling spending levels may hide the greater efficiencies thatmight be realized by leveraging research. One company official told us thatalthough his company was cutting back on long-term research, it wasrelying more on its relationships with federal and university laboratoriesfor similar work. Collaboration between firms—through joint ventures,consortia, and contracting—has recently been on the rise as firms attemptto efficiently distribute risk, pool their resources, and tap into external
GAO/RCED-97-91 Measuring PerformancePage 16
Chapter 2
R&D Spending Data Provide Some
Information About Innovative Activity but
Not About R&D Results
expertise. The magnitude of alliance formation is difficult to gauge, as arethe implications for the innovation and commercialization of newtechnologies in the United States. However, one academic told us that ifthe rhetoric about the efficiencies coming from cooperative R&D is true,then no one should be too disappointed with recent drops in R&D spending.
Spending PatternsShow a GreaterEmphasis onShort-Term Research
Federal and private R&D spending patterns reflect the changing conditionsin the country and the world at large. The share of basic researchsupported by private sources peaked in the early post-World War II period,driven by thriving domestic and international markets. However, recentsurveys and anecdotal evidence suggest that increased internationalcompetitive pressures have forced companies to emphasize short-termdevelopment over long-term research. Company officials echoed this shiftand suggested that the focus on short-term research was part of a pushtoward more relevancy in their R&D departments. They pointed out thattheir business units are determining their research needs to a greaterextent today than they have in the past.
Some companies told us that this strategy could be viewed asshort-sighted. Others defended this strategy. For example, one companyofficial told us that his company emphasizes short-term research because“competition is short-term.” He stated that in today’s competitiveenvironment, once a market is lost, it is gone forever.
GAO/RCED-97-91 Measuring PerformancePage 17
Chapter 3
R&D Output Indicators Can Provide LimitedInformation About R&D Results
Quantitative and qualitative indicators have been developed to evaluateR&D activities and their results, but both types of indicators have strengthsand limitations. Our interviews with a number of companies showed thatthe private sector stresses marketplace results rather than relying onoutput indicators. Because of the companies’ profit orientation, many ofthe indicators tracked by the private sector cannot be directly applied tothe federal government. In response to the GPRA, the federal scienceagencies are exploring new ways to quantify the impacts of research.However, it is too early to tell whether new performance measures can bedeveloped and whether they will meet the needs of the Congress.
Current IndicatorsHave Strengths andLimitations
Because of the difficulties in identifying the impacts of research,decisionmakers in the public and private sectors typically have chosen tomeasure outcomes using a variety of proxies. These quantitative andqualitative indicators have strengths and limitations. To illustrate thesestrengths and limitations, we looked at three of the most frequently citedquantitative indicators: return on investment, patents issued, andbibliometrics. While these indicators imply a degree of precision, theywere generally not designed to measure the long-term results of R&D
programs, nor are they easily adaptable to such a purpose. Qualitativeassessment provides detailed, descriptive information, but it depends onsubjective judgments and may be costly.
Return on Investment This indicator aims at measuring the sales and profits resulting frominvestments in R&D; as such, it addresses one of the fundamental concernsabout the value of such investments. However, a variety of factors, such asthe complexity of the innovation process and its inherently long timeframes, pose serious obstacles to the calculation of these returns. Theliterature dealing with return on investment is replete with words ofcaution against quantifying R&D results. NSF’s Science and EngineeringIndicators 1996 pointed out that not only is much of this informationunobtainable or ambiguous, but many of the gains from research aresimply monetarily intangible.
Experts on the R&D process have stated frequently that the long timeperiods and multiple inputs involved make the task of calculating thereturn on basic research especially difficult. Productivity growth may lag20 years behind the first appearance of research in the scientificcommunity, and the lag for interindustry effects may be 30 years. A moreserious impediment, however, is the fact that outcomes are often not
GAO/RCED-97-91 Measuring PerformancePage 18
Chapter 3
R&D Output Indicators Can Provide Limited
Information About R&D Results
directly traceable to specific inputs or may result from a combination ofsuch inputs. The National Aeronautics and Space Administration (NASA)and the National Bureau of Standards (now the National Institute forStandards and Technology) attempted to measure the economic impactsand benefits of certain of their technologies in the 1970s and early 1980s.The studies at the Bureau were discontinued, according to staff, becauseof serious theoretical and methodological problems. As with the Bureau’sstudies, NASA’s studies evoked serious criticisms and were likewisediscontinued.
Despite the difficulties in calculating return on investment, the leadingresearchers in this field agree that R&D offers high private and socialreturns in terms of high productivity. One recent survey of 63 studiesfound that R&D activity achieves, on average, a 20- to 30-percent annualreturn on private (industrial) investments.7
Patents Patents show certain strengths as useful indicators in measuring technicalchange and inventive input and output over time. For example, they canreveal a variety of trends involving ownership and levels of activity intechnical areas. According to NSF, the data concerning ownership showthat the federal share of patents averaged 3.5 percent of the total numberof U.S. patents during 1963 through 1980 but declined thereafter.
In addition, the data concerning a country’s distribution of patents bytechnical area have proved to be a reliable indicator of a nation’stechnological strengths as well as its direction in product development.For example, the three most emphasized U.S. patent categories forinventors show specific contrasts between U.S. and foreign patents. U.S.inventors obtained most of their patents in wells, mineral oils, and certainareas of surgery. Japanese inventors focused their efforts on certain areasof communications, organic compounds, and refrigeration. Patent activitycan be used to pinpoint potentially important changes. In 1980 through1987, U.S. inventors led all other foreign inventors in radio and televisionpatents, but in 1987 the United States lost its front position to Japaneseinventors in this area.
Despite their usefulness as indicators of broad national and internationaltrends in various industries and areas of research, patents also haveseveral intrinsic drawbacks. Inconsistency across industries in the numberof patents granted is a major limitation that results from the wide
7Nadiri, M.I. Innovations and Technological Spillovers (1993).
GAO/RCED-97-91 Measuring PerformancePage 19
Chapter 3
R&D Output Indicators Can Provide Limited
Information About R&D Results
variations in the propensity to patent inventions. Consequently, accordingto NSF, it is not advisable to compare patenting rates between differenttechnologies or industries. Inconsistency in quality is a second drawback.The aggregated patent statistics do not distinguish between those that ledto major innovations and those that led to minor improvements.Incompleteness is a further limitation. Many inventions are not patented atall, and trade secrecy may become a preferred alternative to patenting.Another limitation is that patents do not lend themselves to the evaluationof the most significant results achieved by an R&D program. They canprovide intermediate measures of progress, but they are not usually thepurpose for which the research was undertaken.
In addition, the use of patents as a measure of federal R&D effectivenessmay be hampered by their limited relevance. The 1996 report entitledAssessing Fundamental Science by the National Science and TechnologyCouncil noted that any use of patent counts should be undertaken onlywith a full awareness of their limitations. A recent academic study ofpatents and the evaluation of R&D also commented on the extraordinarilylimited applicability of patent evaluation to government-performed R&D.Both studies pointed to the relatively low level of federal patentingactivity. The academic study noted that most government laboratories aregranted only one or two patents per year, and only a few of them patentextensively. It concluded that for government laboratories, one mayquestion the overall wisdom of evaluating public R&D with privatetechniques.8
Bibliometrics A third area of effort in developing quantitative measurements involvesbibliometrics, or the study of published data. Bibliometrics countscitations in an attempt to address questions of productivity, influence, andthe transfer of knowledge. Its most appropriate use is in quantifying thework of researchers whose results are published. Thus, it may beespecially applicable in areas such as basic research where the results aremore often published than protected by firms. However, its usefulness as ameasure of research results remains somewhat controversial.
We believe that the use of bibliometrics as a source of information on thequality of the publications or the citations being counted needs to be
8In its October 11, 1996 issue, Science magazine noted the French government’s announcement thatpatent records will form a part of the evaluation of publicly funded researchers. The new proposal,according to the magazine, is controversial because it might upset the proper balance between basicand applied research by favoring those who work in fields that are immediately applicable at theexpense of people doing basic research.
GAO/RCED-97-91 Measuring PerformancePage 20
Chapter 3
R&D Output Indicators Can Provide Limited
Information About R&D Results
approached with caution. Although bibliometric indicators can beweighted by publication or other quality measure, the frequency ofcitation, for example, provides no indication of the level of researchinnovation. Another limitation is the problems that arise ininterdisciplinary comparisons of results. Some critics have gone so far asto say that bibliometric findings should not be used in science policy workuntil the problems with the analysis of citations are addressed.
In addition, the relevance of bibliometric analysis to decision-making bythe federal government appears very limited. One expert noted that arecent comprehensive review of bibliometrics shows the sparsity ofbibliometric studies for evaluations of the impact of research reported bythe federal government. Another pointed out that few federal agencies usebibliometric analysis as an evaluative tool. One of the few is the NationalInstitutes of Health (NIH), which uses this method to evaluate theeffectiveness of its different institutes, the comparative productivity ofNIH-sponsored research and similar international programs, and theresponsiveness of NIH’s research programs to their congressional mandate.
Peer Review Recognizing the limitations of quantitative indicators, the National Scienceand Technology Council concluded that it makes sense to track relevantmeasures but that they cannot supplant the essential element of expertjudgment. Peer review, the most important form of qualitative assessment,uses technical experts to judge R&D results on the basis of the expert’sevaluation of the quality of research. However, peer review has seriousshortcomings; it generally depends on criteria that are inherently difficultto measure and on subjective judgment that is vulnerable to bias.
Peer review has been used extensively in the selection of proposedresearch projects. To a lesser extent, it has also been used to evaluate R&D
impacts. Peer review has come to be viewed by some observers as the bestassurance that quality criteria will prevail over social, economic, andpolitical considerations, while others view it as an element of elitism inscience that tends to discount such concerns as economic significance.
Its major strength is its ability to bring together the leading experts in thearea of concern. Most peer review procedures require a minimum of threereviewers; if the review involves a more ambitious scope of coverage(such as an entire agency), dozens of reviewers may be involved. Theprocess of selecting the peer reviewers varies. One of the chiefresponsibilities of the professional staff in science agencies such as NSF
GAO/RCED-97-91 Measuring PerformancePage 21
Chapter 3
R&D Output Indicators Can Provide Limited
Information About R&D Results
and NIH is to stay in touch with a specialized community of scientists whoare qualified to judge the agency’s activities. However, others rely onin-house managers who are not active researchers.
The major limitations of peer review are twofold. First, the perception ofquality depends largely on the expertise of the panel members. It is basedon the judgment of experts about a proposal or a set of research-relatedresults. Generally, a final judgment will depend on the collective weight ofthe different opinions. Frequently, a numerical rating scale—such as 1 forpoor through 5 for excellent—is used. Despite the appearance of precisionconferred by a specific number, the numbers represent the best ofsometimes widely differing judgments. Consequently, although peerreview has been a mainstay in judging science for over three centuries,questions remain about ways of improving it. For instance, according toone academic, to improve “validity and reliability,” research needs to bedone on the optimal numbers of reviewers and on the advisability oftraining people to perform peer reviews.
Second, peer review evaluation of completed or ongoing R&D projects is amore thorough and expensive process than peer review for the purpose ofselecting proposals for funding. According to one study, the cost of a2-day, 10-person, face-to-face NSF merit review panel is in theneighborhood of $20,000. Another study concluded that if this methodwere applied annually to all federal research programs, the cost inreviewer time alone would be enormous. For example, the Army ResearchLaboratory has contracted for a peer review of its activities; the contractcalls for a 3-year review directed by the National Research Council atapproximately $650,000 per year.
The Private Sector’sEmphasis onMarketplace ResultsLimits Lessons for theFederal Government
The private-sector companies we interviewed varied in terms of the typesof quantitative and qualitative R&D indicators that they collect, but ingeneral they made limited use of these indicators in their decisions. Manycompanies stressed the difficulties involved in measuring the contributionof R&D to the firm’s overall performance using return on investment,patents issued, and other R&D output measures. All of the firms mentionedthat they were increasing R&D that contributes directly to the bottom lineof the firm. Thus, they shifted the responsibility for R&D decisions to thebusiness-unit level so that the R&D would be tied more directly to theprofits of those units. The private sector’s experience offers generallessons to the federal government in terms of ensuring that the R&D
GAO/RCED-97-91 Measuring PerformancePage 22
Chapter 3
R&D Output Indicators Can Provide Limited
Information About R&D Results
contributes directly to the mission of the organization, although thespecific output measures do not apply directly to federal R&D efforts.
Companies CitedDifficulties in Measuringthe Results of R&D
Companies told us that measuring the return on R&D investment is verydifficult. Companies stated that one factor making measurement moredifficult is the long time lag between the research and any revenue thatmight be earned. Companies also stated that because so many people havebeen involved in a product’s evolution, it is difficult to separate thecontribution of the research unit from that of other units.
Companies also mentioned difficulties with some of the other indicatorsthat they track. For example, one indicator was alternatively labeled a“vitality index” or “product innovation metric,” which reflected the shareof the firm’s products that could be considered new products. Thismeasure provided an indication of how rapidly the company wasincorporating new ideas and research into its products. Several companyofficials mentioned that this measure had to be applied carefully becauseof the problem of defining a “new” product; some products are completelydifferent from their predecessors, while others might incorporate cosmeticchanges.
Firms Increased TheirAttention to R&D’sContribution to the BottomLine
One issue that was mentioned by all of the firms in our discussions wasthe increasing emphasis on the relevance of R&D to business needs and the“bottom line.” These comments came up in a number of contexts. Forexample, some firms mentioned that they look for research with ashorter-term payoff in order to have a greater impact on getting newproducts into the marketplace. Other firms cited the increased emphasison applied R&D, or the small amount of research that they perform thatcould be called basic research. A common element was that these firmswere attempting to reduce what might be called benevolent research:projects that benefit the industry or the nation but do not have a payoff tothe firm.
However, a number of the firms noted that this emphasis on the bottomline does not necessarily create the opportunities for breakthroughproducts. All of the firms either reserved a certain fraction of theirresearch funding for these types of projects or developed processes thatmade it possible to continue some level of research in areas that might notbe directly aligned with any particular product line. In this context, one
GAO/RCED-97-91 Measuring PerformancePage 23
Chapter 3
R&D Output Indicators Can Provide Limited
Information About R&D Results
firm mentioned the importance of cooperation with the federalgovernment and universities in the pursuit of fundamental research.
Firms Have ReducedEmphasis on R&D OutputMeasures
While this increased emphasis on getting the most out of R&D might beexpected to lead to greater efforts to measure the results of research, mostof the firms that we spoke to responded by changing the organization sothat measuring R&D outputs was no longer so important. By shifting theresponsibility for research decisions to the business units in the firm thatmake use of the research outputs, the companies have sidestepped theneed for centralized indicators of the quality of research. If the businessunits believe that a particular R&D project would increase their profits, thefirm would budget for that R&D. If the business units do not perform up toexpectations in terms of their profitability, the entire unit would beresponsible.
For example, one firm shifted from a policy of centrally directed researchto a policy in which the individual business units make the decisions onthe appropriate research projects. Under the previous arrangement, thevarious business units were assessed to support the central R&D efforts;under the new arrangement, the units pay only for those projects that theythink are valuable. This shift was designed to make the research moreresponsive to the needs of the business units, in that these units do not payfor the research unless they find it useful. This shift also greatly reducedthe emphasis on developing R&D output indicators in the central laboratorybecause each of the business units would be reviewed on the basis of itsprofitability. The reasoning is that if these units were making poordecisions on R&D projects, the unit’s overall profitability would decrease.
Private Sector’s MeasuresDo Not Directly Apply tothe Federal Government
Our interviews with private-sector firms suggest that many of the R&D
output measures tracked by the private sector do not apply directly to thefederal government. Many of these measures are directly related to thecontribution of the R&D to the bottom line profitability of the firm.However, federal agencies do not operate in order to make a profit, but toaccomplish a variety of other missions and goals. For example, agenciesconduct R&D to support a variety of missions, such as maintaining nationalsecurity or improving citizens’ health. R&D in these areas can contributegreatly to the quality of life in the United States, even if it has a negative
GAO/RCED-97-91 Measuring PerformancePage 24
Chapter 3
R&D Output Indicators Can Provide Limited
Information About R&D Results
return on investment.9 Given these very different missions, there is also noreason to believe that any single measure is appropriate for differentpublic-sector agencies.
Despite the lack of specific measures that can be translated from theprivate to the public sector, there are general lessons to be learned fromthe private sector’s experience. Possibly the most important is therecognition that as the pressures on costs increased at many of the firmsthat we interviewed, the firms made significant efforts to ensure that R&D
contributed directly to the bottom line. The federal government likewisefaces increasing pressure on costs such as R&D expenditures but, unlikethe private sector, cannot rely on the marketplace to ensure that the R&D
contributes to the agency’s goals. Federal R&D is undertaken to support avariety of agency missions, and producing an economic return is not theprimary justification for most federal R&D programs. In fact, the purpose offederal R&D is to promote research that is socially beneficial but may notbe profitable for the private sector to pursue. Without this competitivemarketplace to ensure the relevance of R&D, the federal agencies willcontinue to be challenged to develop better measures of the outputs oftheir R&D.
The literature confirms this general finding of our discussions. Forexample, in 1995 the National Research Council reported on the results ofa workshop on what the federal government might learn from thecorporate experience in research restructuring and assessment.10 TheCouncil invited senior corporate research managers from IBM, AT&T, Ford,and Xerox to discuss their experiences in this area. The report concludedthat developing useful metrics and using them appropriately is a difficultproblem, but it is not impossible. In addition, the participants were notsuccessful in translating their private-sector experience into specificlessons about what can be measured and what makes sense to measure forthe federal government.
9The return-on-investment measure that is appropriate for the federal government would compare thetotal “social benefits” to the nation with the costs of the initial investment. Computing this measurehas many of the difficulties of computing the return on investment for private firms, with the addedcomplications associated with placing a value on national security, improved quality of life, and otherintangible qualities.
10Research Restructuring and Assessment: Can We Apply the Corporate Experience to GovernmentAgencies?, 72 pp., National Research Council (1995).
GAO/RCED-97-91 Measuring PerformancePage 25
Chapter 3
R&D Output Indicators Can Provide Limited
Information About R&D Results
Federal ScienceAgencies Are StillExploring Ways toMeasure the Impactsof R&D
Our July 1996 testimony on the implementation of GPRA noted that theCongress recognized that successful implementation will not come quicklyor easily for many agencies.11 To help address the challenges of“measuring” the results of R&D programs, the Research Roundtable, agroup of federal researchers and managers representing a cross-section ofdepartments and agencies, has met periodically to share ideas andapproaches for implementing GPRA. The Army Research Laboratory hasalso begun to address this issue in a pilot project for performancemeasurement under GPRA.
The Research Roundtable has considered the extent to which R&D agenciescan and should adopt a common approach to measuring performance. In1995, it issued a paper based on 6 months of discussions on thedevelopment of performance measures for research programs. Althoughthe Roundtable stated that the results of a research program’sperformance can be measured, it cautioned that at the same time, it isimportant to recognize the complexity of the cause-effect relationshipbetween R&D and its results. It added that this complexity makes it difficultto establish quantifiable measures that consistently measure programperformance. It also noted that such measures create a potential forincorrect application, which could lead subsequently to a detrimentaleffect on scientific endeavors. It warned that quantitative empiricaldemonstrations of such cause-effect relationships should not be requiredand are often not even possible.
The Army Research Laboratory was designated a pilot project forperformance measurement under GPRA. Of the more than 70 such pilotprojects governmentwide, the laboratory was the only pilot project thataddresses scientific research. As such, it attempted to break new groundin both the planning and the evaluation of basic and applied research. TheChief of the Army Research Laboratory’s Special Projects Office, who ismainly responsible for designing the laboratory’s approach toimplementing GPRA, submitted a case study to the Office of Managementand Budget in 1996.12 The case study outlines an approach that makes useof “three pillars:” metrics, peer review, and customer feedback.
In the case study, the laboratory identified about 60 metrics, most of whichmeasure input using fiscal, facilities, and personnel data. Some of the
11Managing for Results: Key Steps and Challenges in Implementing GPRA in Science Agencies(GAO/T-GGD/RCED-96-214, July 10, 1996).
12Brown, Edward A. “Applying the Principles of the Government Performance and Results Act to theResearch and Development Function” (1996).
GAO/RCED-97-91 Measuring PerformancePage 26
Chapter 3
R&D Output Indicators Can Provide Limited
Information About R&D Results
metrics, such as tasks completed, patents awarded, and articles published,measure output; none measure outcome. The laboratory views themeasures as useful tools for understanding the functional health of theorganization and the management of the laboratory but cautions that theinformation will not enable it to determine the real quality and impact ofits R&D. The laboratory is relying more heavily on peer review of itsresearch and on customer surveys for information about quality.
According to the case study, the laboratory has contracted with theNational Research Council of the National Academies of Science andEngineering to conduct a retrospective peer review of research over a 2-or 3-year period. The Council is to assemble a Technical AssessmentBoard that consists of six panels with 8 to 10 people, each of whom is ofhigh repute within the technical community. These panels will appraisethe quality of the laboratory’s technical and scientific efforts and, to alimited extent, productivity.
The case study also described the use of customer feedback. Thelaboratory has identified a number of internal and external customers. Forthose customers to whom it delivers specific items, it uses a series offeedback questionnaires to determine their degree of satisfaction on a 1 to5 scale in terms of the quality, timeliness, and utility of the deliverable. Forthose customers who do not receive a specific, identifiable product, thelaboratory is developing a Stakeholders’ Advisory Board of seniorleadership and user representatives to provide first-hand guidance andfeedback.
GAO/RCED-97-91 Measuring PerformancePage 27
Appendix I
Historical Perspective on ResearchSpending
Since World War II, U.S. public and private research and development(R&D) spending patterns have reflected changing priorities as well asreactions to the changing national and international economies. Some ofthe more prominent events that have shaped spending in both sectors havebeen the Cold War and the recent international competitive pressures.Declines in spending in both sectors have been less frequent thanincreases.
Federal Spending In his July 1945 report, Science—The Endless Frontier, Vannevar Bush,who headed the U.S. R&D effort during World War II, provided the rationalefor federal support of both basic research and research related to nationalsecurity, industry, and human health and welfare. His plan contributed tothe legislation adopted in 1950 that established the National ScienceFoundation (NSF). By that time, however, the National Institutes of Health(NIH) already had control over most health-related research; the Office ofNaval Research had taken on a major role in supporting academicresearch in the physical sciences; and the new Atomic Energy Commissionhad been assigned control of the R&D on nuclear weapons and nuclearpower. NSF’s mission focused on supporting fundamental research andrelated educational activities. Its annual budget was less than $10 millionuntil the late 1950s. In contrast, NIH’s annual budget, which had been lessthan $3 million at the end of the war, grew to more than $50 million by1950.
The scope of federal R&D support grew in the decade after World War II.Anxiety over the Cold War and the loss in 1949 of the U.S. monopoly innuclear weapons led to expanded R&D programs in the Army and in thenewly established Air Force and to a continuing buildup in support fornuclear weapons R&D in the Atomic Energy Commission. On the civilianside, R&D programs were established or expanded in fields with directpractical importance, such as aeronautics technology, waterdesalinization, and atmospheric disturbances and weather. The launch ofSputnik by the Soviet Union in 1957 led to immediate efforts to expandU.S. R&D, science and engineering education, and technology deployment.Within months of the Sputnik launch, the National Aeronautics and SpaceAdministration (NASA) and the Advanced Research Projects Agency (ARPA)in the Department of Defense (DOD) were established. NASA’s core includedthe aeronautics programs of the National Advisory Committee onAeronautics and some of the space activities of DOD; ARPA’s purpose was toenable DOD to conduct advanced R&D to meet military needs.
GAO/RCED-97-91 Measuring PerformancePage 28
Appendix I
Historical Perspective on Research
Spending
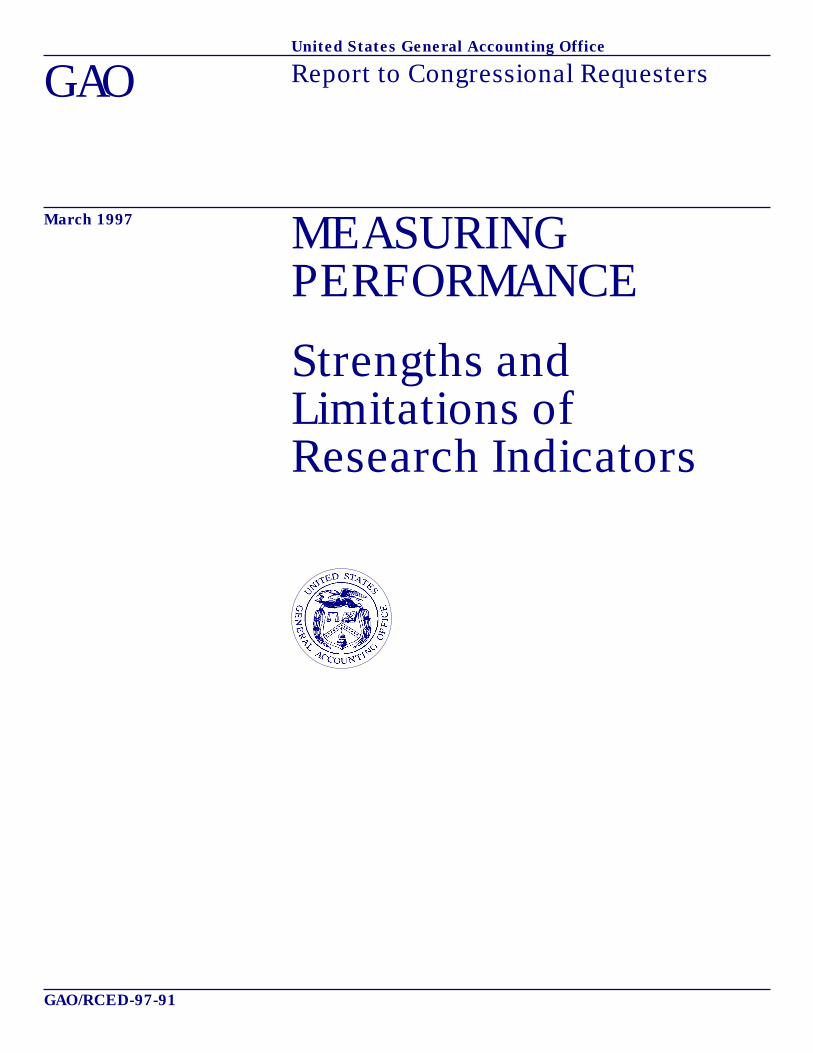
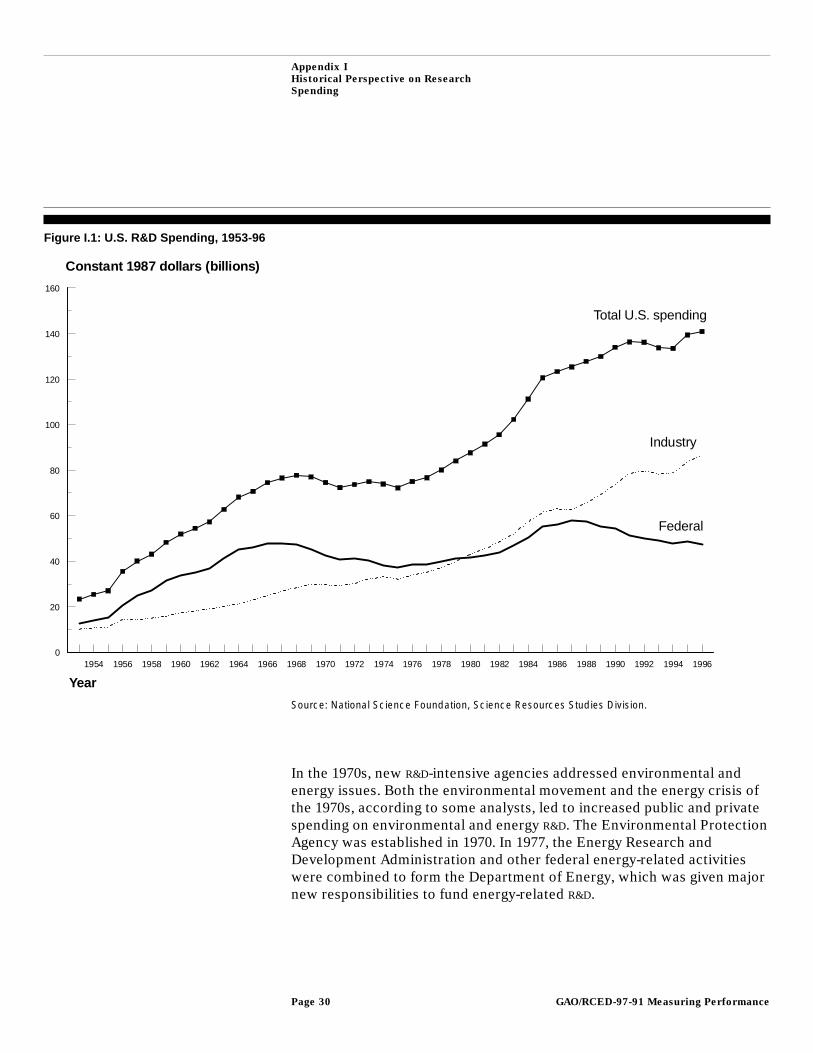
Federal appropriations for R&D and for mathematics and science educationin NSF and other government agencies rose rapidly over the next decade,often at double-digit rates in real terms. (See fig. I.1.) During the early1950s, the growth in federal funding for health research slowedconsiderably from its fast pace in the immediate postwar years. However,in the late 1950s federal support for health research accelerated rapidly.
From 1966 to 1975, federal support for nondefense R&D dropped nearly22 percent in real terms. The costs of the Vietnam War put downwardpressure on nondefense R&D along with other nondefense discretionaryspending. The conclusion of NASA’s Apollo program contributed to thedecline in federal R&D funding during that period, also. Until recently, thiswas the only period in which federal funds for R&D were reducedsubstantially.
GAO/RCED-97-91 Measuring PerformancePage 29
Appendix I
Historical Perspective on Research
Spending
Figure I.1: U.S. R&D Spending, 1953-96
1954 1956 1958 1960 1962 1964 1966 1968 1970 1972 1974 1976 1978 1980 1982 1984 1986 1988 1990 1992 1994 19960
20
40
60
80
100
120
140
160
Year
Constant 1987 dollars (billions)
Industry
Total U.S. spending
Federal
Source: National Science Foundation, Science Resources Studies Division.
In the 1970s, new R&D-intensive agencies addressed environmental andenergy issues. Both the environmental movement and the energy crisis ofthe 1970s, according to some analysts, led to increased public and privatespending on environmental and energy R&D. The Environmental ProtectionAgency was established in 1970. In 1977, the Energy Research andDevelopment Administration and other federal energy-related activitieswere combined to form the Department of Energy, which was given majornew responsibilities to fund energy-related R&D.
GAO/RCED-97-91 Measuring PerformancePage 30
Appendix I
Historical Perspective on Research
Spending
In the 1980s, the federal role in R&D expanded to enable the United Statesto compete in a global market. Out of this atmosphere, several programswere initiated to provide financial and other incentives for industrial R&D
and for industrially related R&D conducted at universities or federallaboratories.
Two major factors have influenced federal support for R&D funding in the1990s. These factors have been the efforts to reduce the budget deficit andthe defense drawdown. The Department of Defense and the Department ofEnergy, two of the four largest sources of federal R&D support, have hadconstant-dollar reductions in R&D obligations during the 1990s. In fiscalyear 1995, Defense accounted for roughly half of all federal R&D
obligations, down from nearly two-thirds of the total in 1986 at the heightof the defense build-up that occurred during the Reagan administration.
At the same time, military-related R&D spending was being curtailed, whilefederal investment in selected civilian R&D activities increased, includingsupport for research aimed at improving health and the environment andfor technology advancement. The Department of Health and HumanServices, which is a distant second to Defense in terms of total R&D
support, had the largest absolute increase—$3 billion—in federal R&D
obligations during the 1990s. The proportion of all U.S. R&D devoted tohealth-related projects has been increasing continuously for nearly adecade. The Commerce Department has registered the largest percentageincrease in federal R&D obligations during the 1990s so far. In addition, thefederal government, which supplies about three-fifths of all funds used toperform R&D on college and university campuses, has been increasing itssupport of academic research continuously since 1982, even afteradjusting for inflation.13
Private-SectorFunding
During the early post-World War II period, thriving domestic andinternational markets supported large profits and the rapid expansion ofR&D in both the central laboratories and the divisional laboratories of largecompanies. Central R&D facilities focused increasingly on fundamentalresearch in many of these large firms, leaving the development andapplication of new technologies, as well as the improvement of establishedproducts and processes, to the divisional laboratories. The data on basicresearch for 1953 through 1960 are less reliable than those for later yearsbut suggest that the share of total U.S. basic research financed by industry
13Much of this section is based on Allocating Federal Funds for Science and Technology by theCommittee on Criteria for Federal Support of Research and Development of the National Academy ofSciences, National Academy Press (1995).
GAO/RCED-97-91 Measuring PerformancePage 31
Appendix I
Historical Perspective on Research
Spending
during the postwar period may well have been at its peak during the 1950sand early 1960s.
Severe competitive pressures from foreign firms, increases in the real costof capital, and a slowdown in the growth rate of the domestic economy inthe 1970s have been cited as causes for the apparent decline in the returnsto R&D investment during the mid-1970s, and the rate of growth in realindustry expenditures on R&D declined. Industry’s funding of basicresearch shrank, and many of the central research facilities of the giantcorporations entered a period of budgetary austerity or cutbacks. After aresurgence in the early 1980s, the rate of growth in industry-funded R&D
declined in the late 1980s.
Industry’s funding of R&D was generally flat between 1991 and 1994;several reasons have been cited for the lack of growth in some companies’R&D programs during this time. These include corporate downsizing,decentralization (i.e., a shift of R&D activity from corporate laboratories toindividual business units), and increasing collaboration among industrialfirms and with partners in academia, in government, in the nonprofitsector, and in other countries. The preliminary data for 1995 and 1996indicate a slight upswing in industrial R&D funding.
According to NSF, the most striking recent trend in industrial R&D
performance has been the increase in the proportion of total R&D fundedby the companies classified as nonmanufacturing industries. Prior to 1983,nonmanufacturing industries accounted for less than 5 percent of theindustry’s total R&D. That share grew steadily during the next decade sothat in 1993, nonmanufacturing firms represented more than 25 percent ofall industrial R&D performed in the United States. Part of this reportedgrowth, however, reflects improvements in the NSF’s survey efforts tomeasure R&D in nonmanufacturing industries, in addition to actual growthin service sector R&D spending.
Between 1984 and 1994, some significant changes occurred among the 100largest publicly held R&D funding companies, although the four leadingfirms were the same in both 1984 and 1994. During the decade, the numberof pharmaceutical and computer hardware and software companiesamong the largest R&D funders rose. In contrast, the number of largedefense contractors and chemical and petroleum companies among thelargest R&D funders fell.
GAO/RCED-97-91 Measuring PerformancePage 32
Appendix I
Historical Perspective on Research
Spending
U.S. firms have begun to alter their R&D patterns in response to increasingcompetitive pressures. Firms have shifted a greater portion of their R&D
resources away from long-term investments and toward shorter-termprojects. U.S. companies now allocate 22 percent of their R&D spending tolong-term projects when compared with their Japanese counterparts, whodevote 50 percent. Increasingly, firms are emphasizing short-term R&D forimmediate problem-solving or near-term development over basic research;and basic research is being directed toward the needs of productdevelopment and manufacturing teams. Many central researchlaboratories at large companies—such as AT&T, IBM, General Electric,Kodak, and Xerox—have been downsized and work more closely withproduct development divisions. They now receive a larger share of theiroperating funds from individual business units rather than generalcorporate funds.
GAO/RCED-97-91 Measuring PerformancePage 33
Appendix II
Major Contributors to This Report
Resources,Community, andEconomicDevelopmentDivision, Washington,D.C.
Victor S. Rezendes, DirectorRobin M. Nazzaro, Assistant DirectorAndrew J. Vogelsang, Evaluator-in-ChargeDennis Carroll, Senior Evaluator
Office of the ChiefEconomist
Loren Yager, Assistant Director
(307738) GAO/RCED-97-91 Measuring PerformancePage 34
Ordering Information
The first copy of each GAO report and testimony is free.
Additional copies are $2 each. Orders should be sent to the
following address, accompanied by a check or money order
made out to the Superintendent of Documents, when
necessary. VISA and MasterCard credit cards are accepted, also.
Orders for 100 or more copies to be mailed to a single address
are discounted 25 percent.
Orders by mail:
U.S. General Accounting Office
P.O. Box 6015
Gaithersburg, MD 20884-6015
or visit:
Room 1100
700 4th St. NW (corner of 4th and G Sts. NW)
U.S. General Accounting Office
Washington, DC
Orders may also be placed by calling (202) 512-6000
or by using fax number (301) 258-4066, or TDD (301) 413-0006.
Each day, GAO issues a list of newly available reports and
testimony. To receive facsimile copies of the daily list or any
list from the past 30 days, please call (202) 512-6000 using a
touchtone phone. A recorded menu will provide information on
how to obtain these lists.
For information on how to access GAO reports on the INTERNET,
send an e-mail message with "info" in the body to:
or visit GAO’s World Wide Web Home Page at:
http://www.gao.gov
PRINTED ON RECYCLED PAPER

United StatesGeneral Accounting OfficeWashington, D.C. 20548-0001
Official BusinessPenalty for Private Use $300
Address Correction Requested
Bulk RatePostage & Fees Paid
GAOPermit No. G100