Embed Size (px)
Citation preview

Science Arena Publications
Specialty Journal of Architecture and Construction
ISSN: 2412-740X Available online at www.sciarena.com
2019, Vol, 5 (4): 46-58
Strengthening the Water Underground Concrete
Reservoirs Using the FRP Materials
Alireza Kheirandish Moghaddam1, Seyyed Mohammad Mir Hosseini2*
1Master of Civil Engineering- Structural Engineering Discipline, Islamic Azad University, Tehran
South Branch, Tehran, Iran. 2Assistant Professor, Faculty of Civil Engineering, Islamic Azad University, Arak Branch, Iran.
*Corresponding Author
Abstract: The goal of current research was to strengthen water underground concrete reservoirs using FRP materials. So, in this research, first of all, structural system, seismic behavior of concrete underground reservoirs, damage to them and their failure mechanism have been shown. Then, hydrodynamics behavior of reservoirs and issues of water and structure interactions have been reviewed. After all, it has been referred to a strengthening method with FRP composite fibers and their application in seismic strength of structures. Finally, these results have been compared with the modelling of underground concrete reservoir using the ABAQUS software and reservoir`s dynamic behavior in normal mode and strength mode have been reviewed (with FRP fibers). Furthermore, suitable approaches have been presented for strengthening this kind of reservoirs. According to obtained results, acceleration maps had the largest damage to reservoir walls, because they had the maximum amount of ground acceleration. So, they must be strengthened with the best solution. Thus, according to the conducted modelling and review of the previous studies and research and considering the strength of performance work, using FRP materials can be one of the main and effective solutions for this ground. Keywords: Underground concrete reservoirs, Strengthening, FRP composite fibers
INTRODUCTION
Evaluation and safety equipment of underground concrete reservoirs maintaining water are an
important subject of country and defense issues. So, designing, construction and maintenance of
reservoirs which are used to store water are important considering the population growth and
development suburb and urban areas. According to application of the water storage tanks, review of
their behavior is very important when an earthquake happens. These structures must be used after
earthquake, because they estimate primary needs such as water supply during fire and water supply
of people. Thus, correct knowledge of seismic behavior of these kinds of structures is essential for
their safety and reduction of maintenance cost. Damages to underground concrete reservoirs show
the inadequate resistance of these reservoirs against the side-loads due to earthquake during the
past earthquakes. Reviewing the conducted studies on concrete reservoirs showed that Haskins has
done the primary studies on reservoirs. He studied theoretical and experimental response of the

Spec. J. Archit. Constr, 2019, Vol, 5 (4): 46-58
47
system to earthquake`s horizontal motion effect considering a tank with rigid walls connected to
foundation (Hoskins and Jacobsen, 1934). In reservoir issue, one of the most effective factors on
design is hydrodynamic force. The primary main research on obtaining forces induced by earthquake
was done by Jacobsen in circular reservoirs containing fluids (Jacobsen, 1949). He calculated
hydrodynamic pressure entered into the wall of cylindrical tanks whose foundation were affected by
horizontal dynamic simulation. He obtained the velocity of liquid particles trough different points
(Jacobsen, 1949). Veletsos et al. (1977) studied on dynamic response of circular concrete reservoirs
under vertical simulation in rigid flexible walls. They showed that soil and structure interactions
cause to reduce the maximum of hydrodynamics pressure induced by earthquake simulation. It was
shown that hydrodynamics` pressure induced by hard section of liquid increases considering the
flexibility of walls (Veletsos and Auyang, 1977). Fischer (1979), did plenty of studies on the effect of
wall flexibility on dynamic response of reservoirs. It showed that flexibility influences so much over
hydrodynamics pressures as well as created forces (Fischer, 1979). Studies and reports of damages to
tanks in earthquakes showed that the flexibility of walls and the effect of vertical component of
earthquake must also be considered in the design of reservoirs. In this regard, Haroon and Husner
(1981) presented Husner’s main model considering the flexible behavior of the reservoir. One
research was done by Kim, Park et al. for dynamic analysis of rectangular reservoirs. They used a
combination of finite elements and boundary elements to calculate responses (Koh, Kim and Park,
1998). Also, Ghods and Shenaiee (2014), reviewed and strengthened concrete reservoirs by Fibre-
Reinforced Polymer (FRP). Reviews have shown that water concrete reservoirs are reinforced by
brief map of management and planning organization of Iran as well as armed steel bars, currently.
In fact, fatigue behavior of bars causes to reduce life-cycle and reservoir resistance and wastes huge
investments, so strengthening water concrete reservoirs with FRP is essential. Thus, the goal of the
current research was strengthening water underground concrete reservoirs using the FRP materials.
Research Method
Considering the goal of the current research which was strengthening water underground concrete
reservoirs using the FRP materials, first of all, it has been shown the structural system, seismic
behavior of underground concrete reservoirs and damages to them and their failure mechanism.
Then, hydrodynamics of tanks, structure and water interactions have been reviewed. After all, it has
been referred to strengthening method with FRP composite fibers and its application in seismic
strength of structures. At last, it has been compared with the modelling of underground concrete
reservoir using the ABAQUS software and the reservoir dynamic behavior in normal mode and
strength mode (with FRP fibers) have bee reviewed. In this research, specification of the used steel
has come in Table 1. According to the mentioned numbers, it can be said that the behavior of the
model has used von-Mises criteria.
Table 1. Specification of the steel materials
(MPa) yf υ E (GPa) )ρ3(kg/m
420 3/0 200 7850
An important problem of the modelling of the steel in the range of plastic is that engineering stress
or strain are obtained from the results of the tensile test of the device. Equations below, have been
used to transform engineering stress and strain to the true stress and strain. True stress and strain
must be used to identify the plastic behavior of the material to ABAQUS software.
ε = ln (1+ε0) (1)

Spec. J. Archit. Constr, 2019, Vol, 5 (4): 46-58
48
σ = σ0 (1+ε0) (2)
Where ε0 and σ0 are engineering strain and engineering stress, respectively and ε and σ are true
strain and true stress, respectively. Considering the above point, the obtained stresses and strains
from the tensile test convert into true stress and strain. They are considered in Table 2.
Table 2. Plastic strain and stress of steel materials (Mokhatar and Abdullah, 2012)
YIELD stress(MPa) plastic strain
300 0
310 0.01
350 0.1
400 0.5
In Table 2, the first column shows true stresses and the second column shows true strains, where
stress values were in Pascal.
Concrete materials as well as the combination model of Concrete Damaged Plasticity has been used
in this model. This behavior model is the most complex and applicable model for concrete materials
which has been used in ABAQUS software. This behavior model is able to simulate concrete cycle
behavior well. The parameters required to model water are given in Table 4 and mechanical
specification of CFRP composite materials required to enter into software are given in Table 5.
Table 3. The definition of the function of compressive and tensile properties of concrete (Mokhatar
and Abdullah, 2012)
Yield Stress Inelastic Strain Damage Parameter
14280000 0 0
17920000 5.50E-05 0
21000000 0.000132 0
23520000 0.000232 0
25480000 0.000354 0
26880000 0.000498 0
27720000 0.000665 0
28000000 0.000853 0
27720000 0.001065 0.01
26880000 0.001298 0.04
25480000 0.001554 0.09
23520000 0.001832 0.16
21000000 0.002132 0.25
17920000 0.002455 0.36
14280000 0.0028 0.49
10080000 0.003167 0.64
Table 4. The definition of the function of tensile properties of the concrete (Mokhatar and Abdullah,
2012)
Damage Parameter Cracking Strain Yield Stress(Pa)
0 0 2800000
0.99 0.0011 28000
Spec. J. Archit. Constr, 2019, Vol, 5 (4): 46-58
49
Table 5. Plasticity specification of the concrete (Mokhatar and Abdullah, 2012)
Viscosity parameter Kc σbo
σco⁄ Off-axis Expansion angle
0 0.666 1.16 0.1 30.5
Table 6. The parameters required to model water in ABAQUS software
Gama S 0C speed Sound Dynamic Viscosity Density
0 0 1450 0/001 980kg/m3
Table 7. Mechanical specification of CFRP composite materials
E2=55 E1=72 Elastic modulus GPa
υ13=0.00 υ12=0.28 Poisson’s ratio
G13=39 G12=35 Shear modulus GPa
Among the existing elements in the current study in ABAQUA, all elements have been used in a
form of cube except of crack element.
Modelling calculation
In this section, calculation related to the hard liquid mode and wavy liquid mode, calculation related
to the overturning anchor and wave height have been done based on the regulation 123 of
management and planning organization of Iran to use in ABAQUS software.
WWall= 43200 Kg the weight of walls (3)
Wb= 165814 Kg the weight of the floor (4)
Wwater= 51638 Kg the weight of water (5)
Analysis along X
ℎ
𝑙= 0.57 (6)
𝑤𝑖
𝑤= 0.58 (7)
𝑤𝑐
𝑤= 0.38 (8)
ℎ𝑖
𝑙= 0.375 (9)
ℎ𝑐
ℎ= 0.6 (10)
ℎ𝑖∗
ℎ= 0.7 (11)
ℎ𝑐∗
ℎ= 0.8 (12)
𝑤𝑖 + 𝑤𝑐 = 49572 𝑘𝑔 (13)
(𝑤𝑖+𝑤𝑐)
𝑤𝑤𝑎𝑡𝑒𝑟= 0.96 (14)
The total of hard liquid mode and wavy mode were lower than the total of water weight (4%).
- Time period of source
Time period of rectangular underground reservoirs in hard liquid mode was equal to:
𝑇𝑖 = 2𝜋 ∗ √𝑑
𝑔= 0.49 (15)

Spec. J. Archit. Constr, 2019, Vol, 5 (4): 46-58
50
ℎ̅ =𝑊𝑖2
ℎ𝑖+�̅�ℎ𝑤
2𝑊𝑖2
+𝑊𝑤̅̅ ̅̅ ̅= 1.17 𝑚 (16)
𝑞 =𝑤𝑖2
+𝑤𝑤̅̅ ̅̅ ̅
𝐵ℎ= 2.2 𝑡/𝑚2 (17)
Time period of wavy liquid mode was equal to:
𝐶𝐶 =2𝜋
√3.16 tanh(3.16(ℎ
𝑙))
= 3.65 𝑠𝑒𝑐 (18)
Vertical seismic coefficient was equal to:
A = 0.3 (19)
I = 1.4 (20)
R = 3 (21)
According to regulation, it was 2800.
𝐶𝑖 =𝐴∗𝐵∗𝐼
𝑅= 0.35 (22)
𝐶𝐶 =𝐴∗𝐵∗𝐼
𝑅= 0.2 (23)
Base cut below source wall in hard liquid mode was:
𝑉𝑖 = 𝐶𝑖 ∗ (𝑊𝑖 + 𝑊𝑤 + 𝑊𝑡 ) =25
6 𝑇𝑜𝑛 (24)
Base cut below source wall in wavy liquid mode was:
𝑉𝑐 = 𝐶𝑐(𝑤𝑐) = 4 𝑇𝑜𝑛 (25)
Total base cut is
𝑉 = √𝑉𝑖2 + 𝑉𝑐
2 = 26 𝑇𝑜𝑛 (26)
The anchor bend below source wall was:
ℎ𝑤 = 1.5 𝑚 (27)
ℎ𝑡 = 0 (28)
𝑀𝑖 = 𝐶𝑖[𝑊𝑖ℎ𝑖 + 𝑊𝑤ℎ𝑤 + 𝑊𝑡ℎ𝑡] = 32.64 𝑡 − 𝑚 (29)
𝑀𝑐 = 𝐶𝑐𝑊𝑐ℎ𝑐 = 6 𝑡 − 𝑚 (30)
𝑀∗ = 61 𝑇𝑜𝑛 (31)
The analysis along Y is the same as along X, because the dimensions of the tank is cubic.
The maximum of the wave height based on journal 123 was:
𝑑𝑚𝑎𝑥 = (0.375𝐶𝐶
1−𝐾𝑑𝐶𝑐) 𝐷 = 53 𝐶𝑚 (32)
𝐾𝑑 = 1.84 tanh (3.68ℎ
𝐷) = 1.84 (33)
C: Vertical seismic coefficient of design (regulation 2800)
Cc: Vertical seismic coefficient of design in wavy liquid mode
Ci: Vertical seismic coefficient of design in hard liquid mode
hi: The mass center height of hard liquid towards the source base at the foot of the wall (without
calculation of tank base pressure)

Spec. J. Archit. Constr, 2019, Vol, 5 (4): 46-58
51
hs: The height of the tank multi-story base structure which has been measured from the above
foundation to the bottom of the reservoir wall.
hw: The height of the mass gravity center of the reservoir wall towards the tank base in the bottom of
the reservoir wall
hc*: The height of the wavy liquid mass center towards the tank base in the bottom of the reservoir
wall (with pressure entered into the tank base)
hi*: The height of the hard liquid mass center towards the tank base in the bottom of the reservoir
wall (with pressure entered into the tank base)
M: Total bend anchor in the bottom of the reservoir wall
M*: Total overturning anchor in the bottom of the reservoir wall
MC*: Overturning anchor of wavy liquid mode in the bottom of the wall
Vc: Base cut in wavy liquid mode
Vi: Base cut in hard liquid mode
Three earthquakes of Tabas, Kobe and El Centro have been used under horizontal acceleration to
review the damage to concrete. Their information is given in Table 8. Total information related to
map acceleration has been downloaded from the site: www.peer.berkej.edu and tame-acceleration
charts have been corrected and drawn by SeismoSignal software. They are given in charts 1-3.
Table 8. The information of Tabas, Kobe and El Centro earthquakes
Number Name Max. of earth
acceleration (PGA)
Effective time duration of
the earthquake (s)
Total time
ttotal (s)
1 Tabas 0.835 10.5 32.82
2 Kobe 0.693 6.01 40.95
3 El Centro 0.318 2.02 31.16
Chart 1. Map acceleration of the Tabas earthquake (acceleration horizontal component)
Chart 2. Map acceleration of the Kobe earthquake (acceleration horizontal component)
-1.5
-1
-0.5
0
0.5
1
1.5
Acceleration(g)
Time(Sec)
TABAS
-1.5
-1
-0.5
0
0.5
1
Acceleration(g)
Time(Sec)
KOBE

Spec. J. Archit. Constr, 2019, Vol, 5 (4): 46-58
52
Chart 3. Map acceleration of the El Centro earthquake (acceleration horizontal component)
S4R components (from SHELL family) have been used to review more and compare the desired shell
elements to model FRP. This kind of element has been used by many researchers which have
provided suitable results.
In the first stage of the analysis, based on the maximum of earthquake forces calculated according to
the regulation, forces were applied to the reservoir. There wasn’t any damages to the reservoir and
the wave height value was obtained 43cm from permissible amount of the regulation. In the second
stage of the analysis, the earthquake force was applied to model based on the map acceleration of
three earthquakes. The amount of the damage entered into the reservoir was obtained and reviewed.
Considering the fact that Tabas earthquake had the maximum of the ground acceleration1 (the
maximum of the ground acceleration is the largest criteria for designing and the main reason for
damages when earthquake happens, which is measured by the g (ground gravity acceleration)
coefficient), it caused great harm to the reservoir wall. As a result, map acceleration was used to
review crack and strength of the reservoir with FRP created by this damage. The results showed
that the most damaging was due to compressive stress and water turbulence. This damage had the
largest value in the corner of the concrete reservoir. The review of the stress entered into reservoir
walls showed that the water wave caused the stress increase of reservoir walls at a rate of 0.76108.
In this research, the analysis of crack growth was done by XFEM method in ABAQUS. It must be
used direct cyclic analysis for XFEM method. The concrete crack must be considered oval and its
type must be considered SHELL (S4R mesh type).
Before presenting the obtained results of desired tank analysis to validate the model, one of the
analyzed reservoirs (its specification is as the same as the modeled reservoir in before studies) has
been analyzed (Yazdanian and Fu, 2017). The mechanical specification of fluid and the reservoir of
the mentioned paper is given in Table 9 and the outward specification of the concrete is given in
Table 10.
Table 9. The mechanical specification of fluid and the reservoir for rectangular concrete reservoirs
Material specification Type of materials Density (kg/m3) Poisson's ratio Elastic modulus E(Gp)
concrete Reinforced concrete 2500 0.2 25
fluid Water 1000 - 2.07
1 the maximum of the ground acceleration is the most criteria for design and the main reason for damages when earthquake happens, it is
measured by the g (ground gravity acceleration) coefficient
-0.4-0.3-0.2-0.1
00.10.20.30.4
0 10 20 30Acceleration(g)
Time(Sec)
El Centro

Spec. J. Archit. Constr, 2019, Vol, 5 (4): 46-58
53
Table 10. The outward specification of the rectangular concrete reservoir
Concrete
type
Reservoir
height (m)
Reservoir
length (m)
Reservoir
width (m)
Liquid
height (m)
Fluid
type
Foundation
thickness (m)
Body thickness
(m)
General 3 11.3 11.3 2.5 Water 0.40 0.35
The studied reservoir has been done by the horizontal element of the earthquake based on spectrum
analysis. Considering the valuation, the maximum of the main tensile stress has been compared due
to fluid pressure entered into reservoir wall on that region. The maximum of the tensile stress in this
paper and based on the ANSIS software was equal to 1.14106 MPa. This tensile stress has obtained
1.24106 from modelling the same reservoir in ABAQUS software. The maximum of stresses was in
the bottom of the walls and above them. The maximum of tensile stress was 1.89106 in this study.
Based on the results in this study, the maximum of the wave height has happened to reservoir
corners. The force-displacement chart is given in chart 4 which (a) section is related to this study and
(b) section is related to the mentioned study. There was a little difference between the figures in the
mentioned study and the current study. It is due to insufficient information about armature and
reservoir design, the larger dimensions of the reservoir and also use of two different softwares as
well as different solvers. So, the results showed the model`s validation.
(a) (b)
Chart 4. Force-displacement chart (N-m), (a) related to the current study, (b) related to the
mentioned study
Also, according to the last study (Mohseni and Bastami) on the behavior of water concrete reservoirs
during the earthquake, damages to water concrete reservoirs and their strength have been reviewed
after Mormori earthquake and the water reservoir of Dehloran city has been used to confirm the
cracks of the reservoir. In this study, numerical modelling of the water concrete reservoir, located in
Dehloran city, was done to analyze the mechanical analysis of this reservoir under map acceleration
along X and Y. The results of this study showed that damages to walls and roof of the reservoir were
in the form of cracks (Mohseni and Bastami, 3rd National Conference on Crisis Management).
Findings
The model of the concrete reservoir was under the map acceleration of Tabas earthquake and had
caused damages and cracks to its walls. Spread of the crack was based on before PHILSM2 and
2 Signed distance function to describe the initial crack front

Spec. J. Archit. Constr, 2019, Vol, 5 (4): 46-58
54
PSILSM3 and after strengthening. Trend of growth decrease can be found to compare these figures
with the primary value of the crack and the face of the crack in wall elements.
Figure 6. The primary figure of the crack and the face of the crack based on PSILSM and PHILSM
after strengthening
The maximum value of the stress was 1.251013 before strengthening with FRP materials (Figure 8).
As it is observed, the stresses didn`t suffer from walls, so they caused damages. After placing FRP
composite layers on walls, the amount of the stress on them increased. According to Figure 7, the
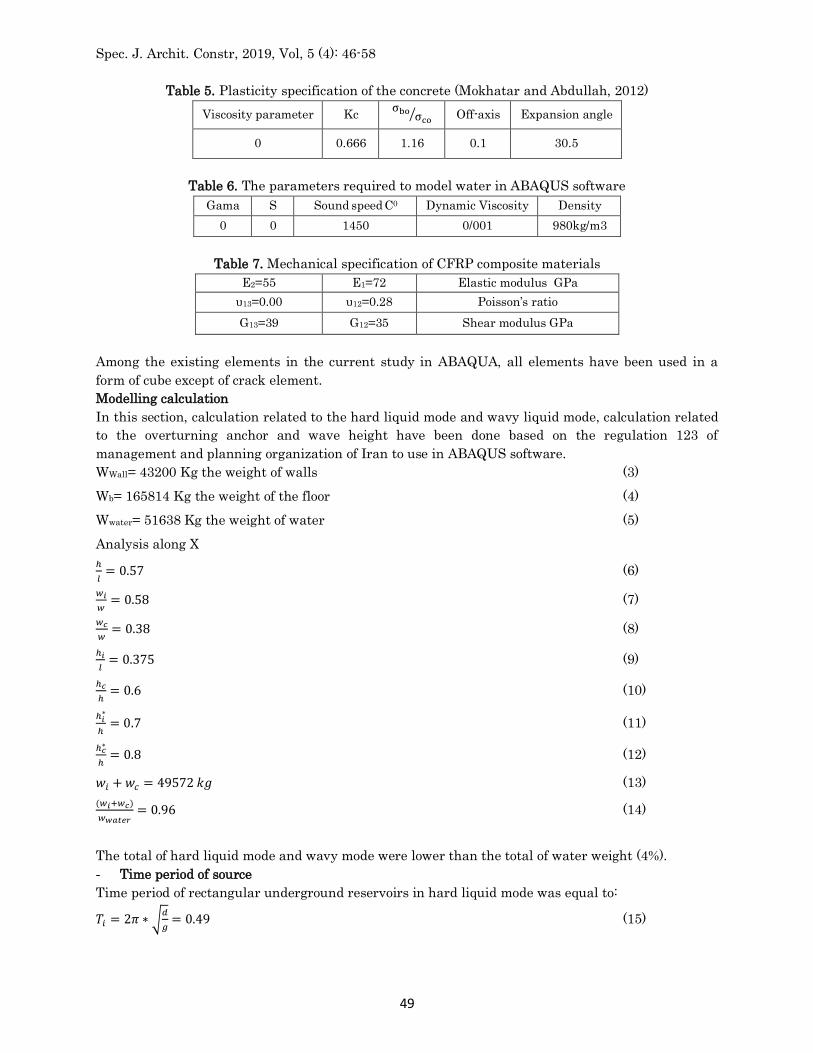
stress number has increased on 1.651013. Chart 9 compares the stress with time after and before
strengthening with FRP materials for water concrete reservoir. Also, it is indicated that the stress
has increased after strengthening. It means that damage and crack needed more stress.
Figure 7. The amount of the stress before strengthening with FRP
3 Signed distance function to describe the crack surface
Spec. J. Archit. Constr, 2019, Vol, 5 (4): 46-58
55
Figure 8. Maximum amount of the stress after strengthening with FRP
Chart 9. Stress against time before and after strengthening with FRP
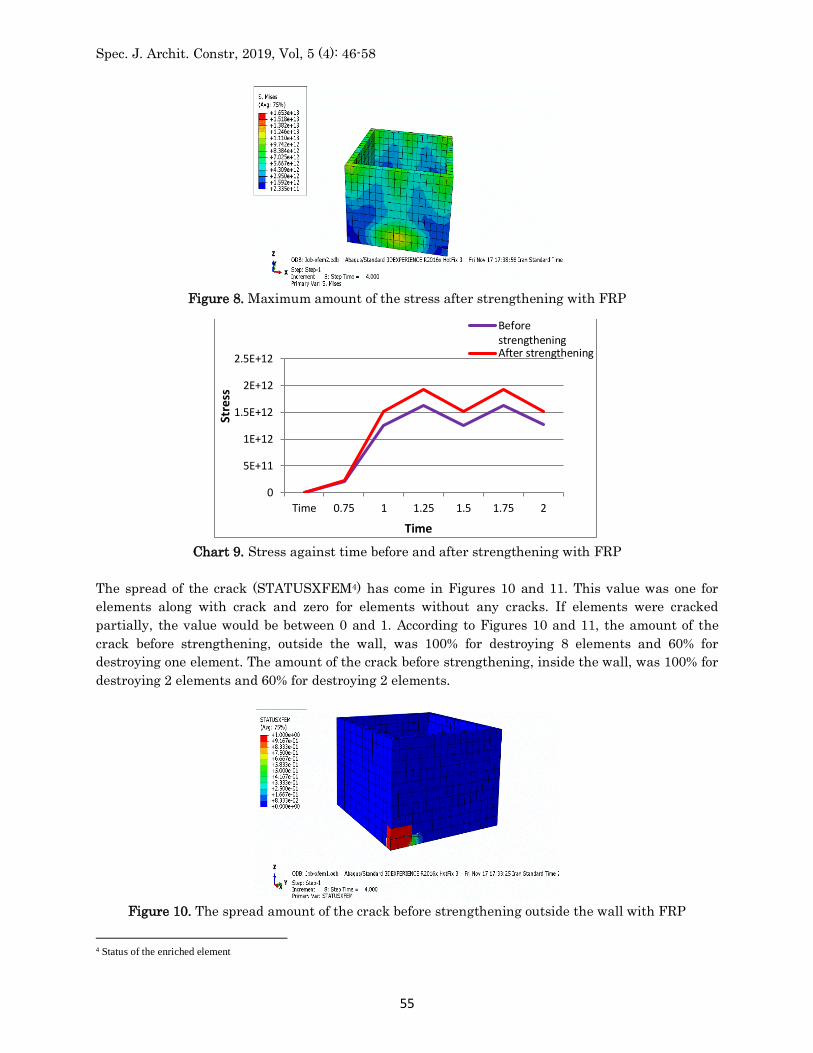
The spread of the crack (STATUSXFEM4) has come in Figures 10 and 11. This value was one for
elements along with crack and zero for elements without any cracks. If elements were cracked
partially, the value would be between 0 and 1. According to Figures 10 and 11, the amount of the
crack before strengthening, outside the wall, was 100% for destroying 8 elements and 60% for
destroying one element. The amount of the crack before strengthening, inside the wall, was 100% for
destroying 2 elements and 60% for destroying 2 elements.
Figure 10. The spread amount of the crack before strengthening outside the wall with FRP
4 Status of the enriched element
0
5E+11
1E+12
1.5E+12
2E+12
2.5E+12
Time 0.75 1 1.25 1.5 1.75 2
Stre
ss
Time
BeforestrengtheningAfter strengthening

Spec. J. Archit. Constr, 2019, Vol, 5 (4): 46-58
56
Figure 11. The spread amount of the crack before strengthening inside the wall with FRP
The spread amount of the crack (STATUSXFEM) after strengthening with FRP materials has been
shown in Figures 12 and 13. As it is observed, the amount of the crack outside the wall has
decreased to 90% for destroying 5 elements outside the wall and 60% for destroying 2 elements
inside the wall. It suggests that FRP composites can be used for strengthening concrete reservoirs
reliably.
Figure 12. The spread amount of the crack after strengthening the reservoir with FRP outside the
wall
Figure 13. The spread amount of the crack after strengthening the reservoir with FRP inside the
wall
After modelling the water underground concrete reservoir using the ABAQUS software and careful
mesh of elements and the exertion of earthquake force at the maximum of the ground acceleration
(PGA), the amount of the damage to reservoir walls was considered. So, the maximum damage to
reservoir was related to the damage induced by compressive stress due to water wave forces. After

Spec. J. Archit. Constr, 2019, Vol, 5 (4): 46-58
57
strengthening with FRP materials, the amount of the tolerable stress increased in reservoir and the
spread of the crack decreased in cracked region. It showed the correct performance of FRP materials
in strengthening and decrease of damages induced by the earthquake to concrete reservoirs above
the ground.
CFRP composites with bidirectional fibers were used for strengthening the walls of concrete
reservoirs above the ground. The thickness of their sheets were 1.5 mm.
According to the placement of the FRP composites above the reservoir wall, the kind of the CFRP
composites and their placement must be inside the reservoir and start from the bottom of the wall.
The main side of composite fibers must be along cracks and considering the reservoir height, it must
be 3m. The width of composite rolls was 50cm in 6 rows for each wall. The installation stages of FRP
composites have been mentioned that are necessary for the improvement and performance of FRP
composites.
Conclusion
The obtained results of non-linear analysis of the water concrete reservoir and stress values, after
strengthening underground concrete reservoir, showed very reliable and suitable criterion to
understand how to strengthen the studied reservoir with CFRP polymer fibers.
- The more the earthquake (PGA) happened, the more the results such as base cut, displacement
and wave height of the reservoir increased. The largest stress was in the corner and bottom of
the walls in rectangular reservoirs.
- In fact, because of the dominance of hydrodynamics forces, water sounded in concrete reservoirs
above the ground. The disadvantages of these reservoirs were merely side-walls. Other elements
of water reservoirs didn`t get any damage, because water hydrodynamics forces didn`t enter into
them. So, it is proposed that CFRP polymer fibers can merely be used for strengthening water
reservoirs to decrease cost in side-walls.
- FRP sheets were able to improve performance level of the armature concrete reservoirs.
- FRP sheets led to an increase in the stiffness and load capacity of the concrete reservoir above
the ground.
- ABAQUS software was able to do non-linear analysis of concrete reservoirs and the obtained
results from experimental experiments and their comparison with software outputs confirmed
this claim.
- Using the XFEM method was very carefully done and was effective for analysis and spread of the
crack. So this method was more suitable than other existing methods.
References
1. Fischer, D. (1979). Dynamic fluid effects in liquid‐filled flexible cylindrical tanks. Earthquake
Engineering & Structural Dynamics, 7(6), 587-601.
2. Gods N., ShenaieeM., (2014). “Strengthening water concrete reservoirs with FRP reinforced
polymer fibers”, 8th Civil Engineering Congress, Babol university.
3. Haroun, M. A., & Housner, G. W. (1981). Seismic design of liquid storage tanks. Journal of the
Technical Councils of ASCE, 107(1), 191-207.
4. Hoskins, L. M., & Jacobsen, L. S. (1934). Water pressure in a tank caused by a simulated
earthquake. Bulletin of the seismological society of America, 24(1), 1-32.
5. Jacobsen, L. S. (1949). Impulsive hydrodynamics of fluid inside a cylindrical tank and of fluid
surrounding a cylindrical pier. Bulletin of the Seismological Society of America, 39(3), 189-204.

Spec. J. Archit. Constr, 2019, Vol, 5 (4): 46-58
58
6. Koh, H. M., Kim, J. K., & Park, J. H. (1998). Fluid–structure interaction analysis of 3‐D
rectangular tanks by a variationally coupled BEM–FEM and comparison with test results.
Earthquake engineering & structural dynamics, 27(2), 109-124.
7. Mohseni A., Bastami M., “The behavior of water concrete reservoirs during earthquake,
damages to water concrete reservoirs and strengthening them after Mormori earthquake,
review of the water reservoir of Dehloran city”, 3rd National Conference on Crisis
Management, Tehran.
8. Mokhatar S. N. and Abdullah R., (2012). “Computational Analysis of Reinforced Concrete
Slabs Subjected to Impact Loads,” Int. J. Integr. Eng., vol. 4, no. 2, pp. 70–76.
9. Veletsos, A. S., & Auyang, J. (1977, May). Earthquake response of liquid storage tanks. In
Advances in Civil Engineering through Engineering Mechanics (pp. 1-24). ASCE.
10. Yazdanian M. and Fu F., (2017). “Parametric study on dynamic behavior of rectangular
concrete storage tanks,” COUPLED Syst. Mech., vol. 6, no. 2, pp. 189–206.

![Numerical Modeling and Investigation of Fluid-Driven ...€¦ · underground [6], heat production from hot dry rock geothermal reservoirs [7,8], as well as the measurement of in situ](https://img.pdfslide.us/doc/110x75/5f0be9467e708231d432d37c/numerical-modeling-and-investigation-of-fluid-driven-underground-6-heat-production.jpg)