Embed Size (px)
Citation preview
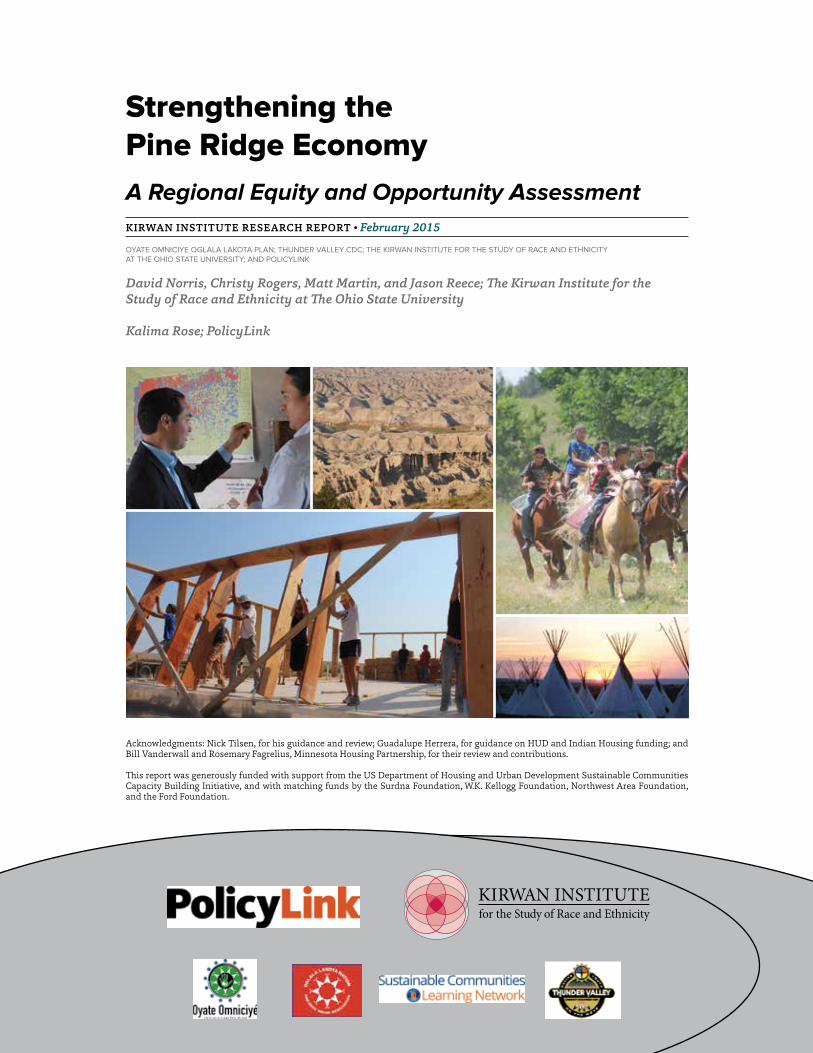
Acknowledgments: Nick Tilsen, for his guidance and review; Guadalupe Herrera, for guidance on HUD and Indian Housing funding; and Bill Vanderwall and Rosemary Fagrelius, Minnesota Housing Partnership, for their review and contributions.
This report was generously funded with support from the US Department of Housing and Urban Development Sustainable Communities Capacity Building Initiative, and with matching funds by the Surdna Foundation, W.K. Kellogg Foundation, Northwest Area Foundation, and the Ford Foundation.
Strengthening the Pine Ridge EconomyA Regional Equity and Opportunity AssessmentKIRWAN INSTITUTE RESEARCH REPORT • February 2015
OYATE OMNICIYE OGLALA LAKOTA PLAN; THUNDER VALLEY CDC; THE KIRWAN INSTITUTE FOR THE STUDY OF RACE AND ETHNICITY AT THE OHIO STATE UNIVERSITY; AND POLICYLINK
David Norris, Christy Rogers, Matt Martin, and Jason Reece; The Kirwan Institute for the Study of Race and Ethnicity at The Ohio State University Kalima Rose; PolicyLink
RESEARCH REPORT • February 20152/35
www.KirwanInstitute.osu.edu | www.policylink.org
INTRODUCTION
Building a Vibrant Tribal Economy in a Regional Economic Context
The Pine Ridge reservation sits within a broader regional economic context, whose primary sectors include tourism, agriculture, manufactur-ing, and retail.1 The Pine Ridge Reservation and the Rapid City Metro-politan area are interdependent economies that, to date, channel many economic benefits off-reservation. This Equity and Opportunity Assess-ment identifies key strategies to create greater vibrancy and equity in reservation-based economic activity—to increase prosperity and quality of life for both the Oglala Lakota people and the region as a whole.
Currently, the reservation and its people support the larger regional economy by providing labor force for off-reservation employment, providing job opportunities for off-reservation workers and by doing the majority of their shopping and consumer-services spending off-reservation. To en-courage housing and community economic development that benefits both the reservation and the larger regional economy, stakeholders should continue to create and expand opportunity on the reservation while building bridges to opportunity in the surrounding region.
1.) South Dakota Department of Tourism, http://www.travelsd.com/About-SD/South-Dakota-Facts
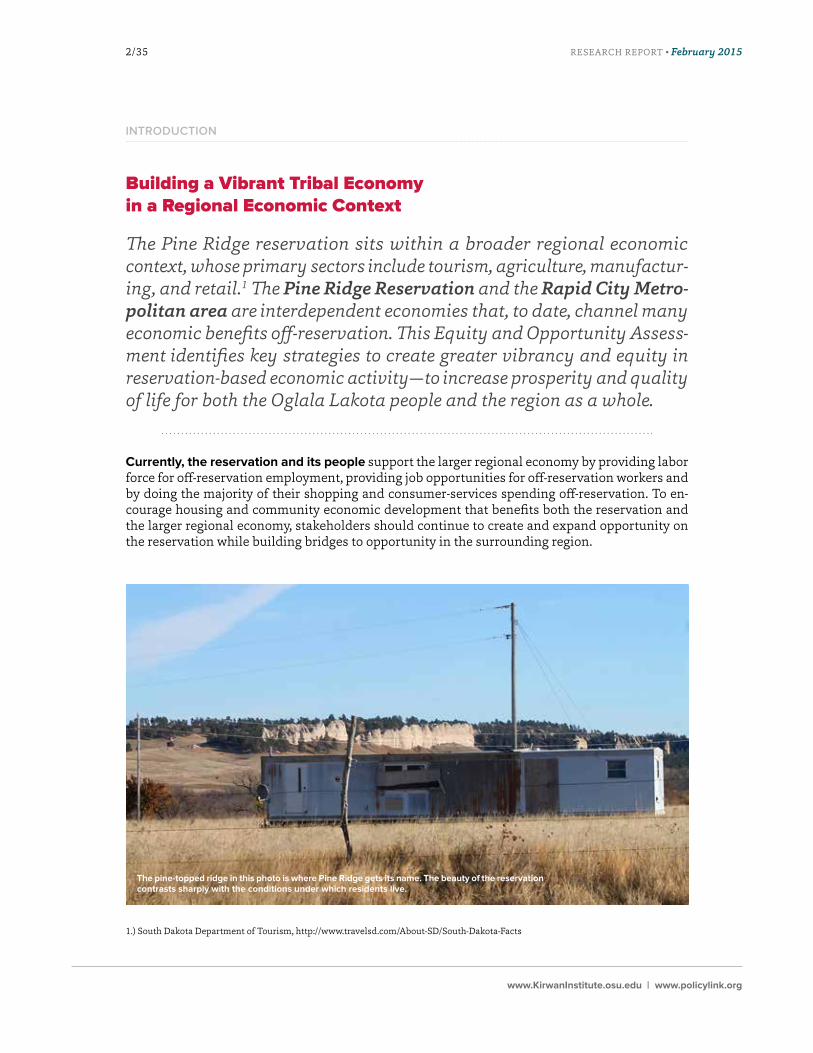
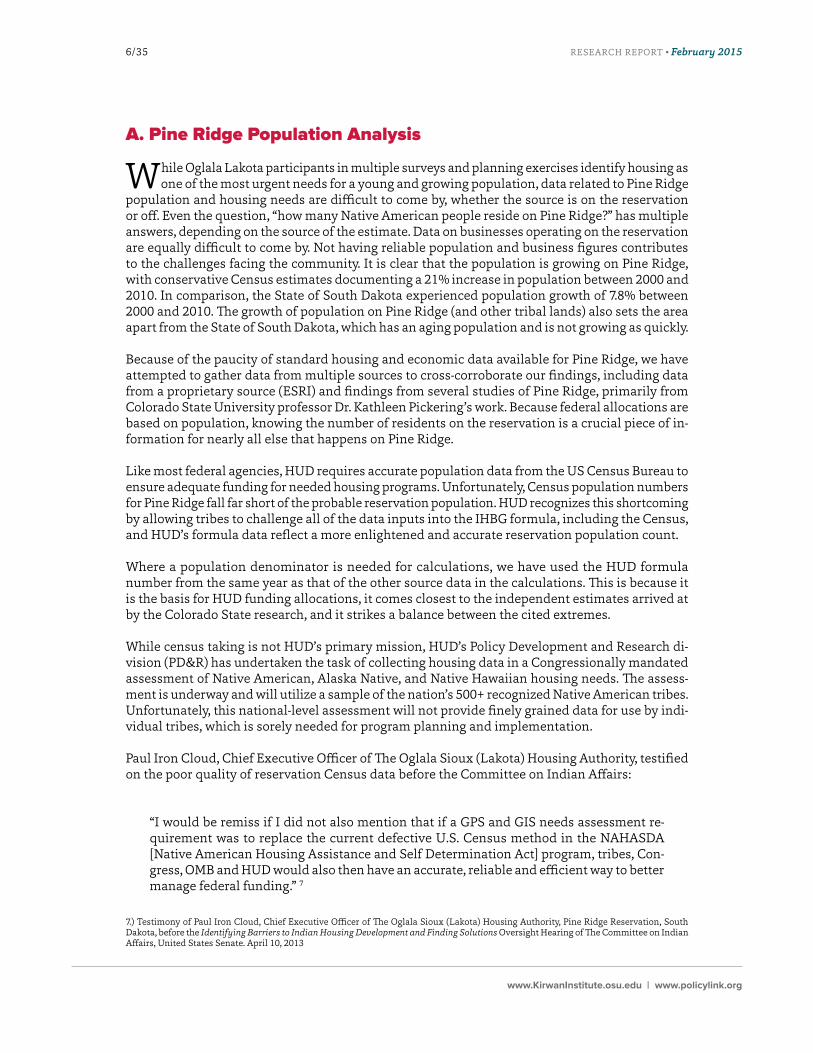
The pine-topped ridge in this photo is where Pine Ridge gets its name. The beauty of the reservation contrasts sharply with the conditions under which residents live.
RESEARCH REPORT • February 20153/35
www.KirwanInstitute.osu.edu | www.policylink.org
The Oyate Omniciye, The Oglala Lakota Regional Plan for Sustainable Development (2013) refers to “the connectedness of all things and … the ways in which health, culture, prosperity, and the natural world overlap.” An assessment of equity and opportunity should focus on this connectedness in in-tentional ways. For example, increased business opportunities on the reservation mean that more dollars are generated and circulated on the reservation. More income can support more attractive housing choices, which will in turn entice higher-skilled, higher-paid workers to live or remain on the reservation. Living closer to work will free up time and income that previously went to long, ex-pensive commutes. A healthy, educated, well-trained workforce will better start, staff and support new and existing businesses. Investments into the preservation and teaching of tribal knowledge, language, and culture will open up new employment opportunities (language teachers, communi-ty health workers, archivists/librarians, counselors, landscape architects, artists, housing develop-ers, and others) and strengthen Native people’s ties to the land and to the reservation community.
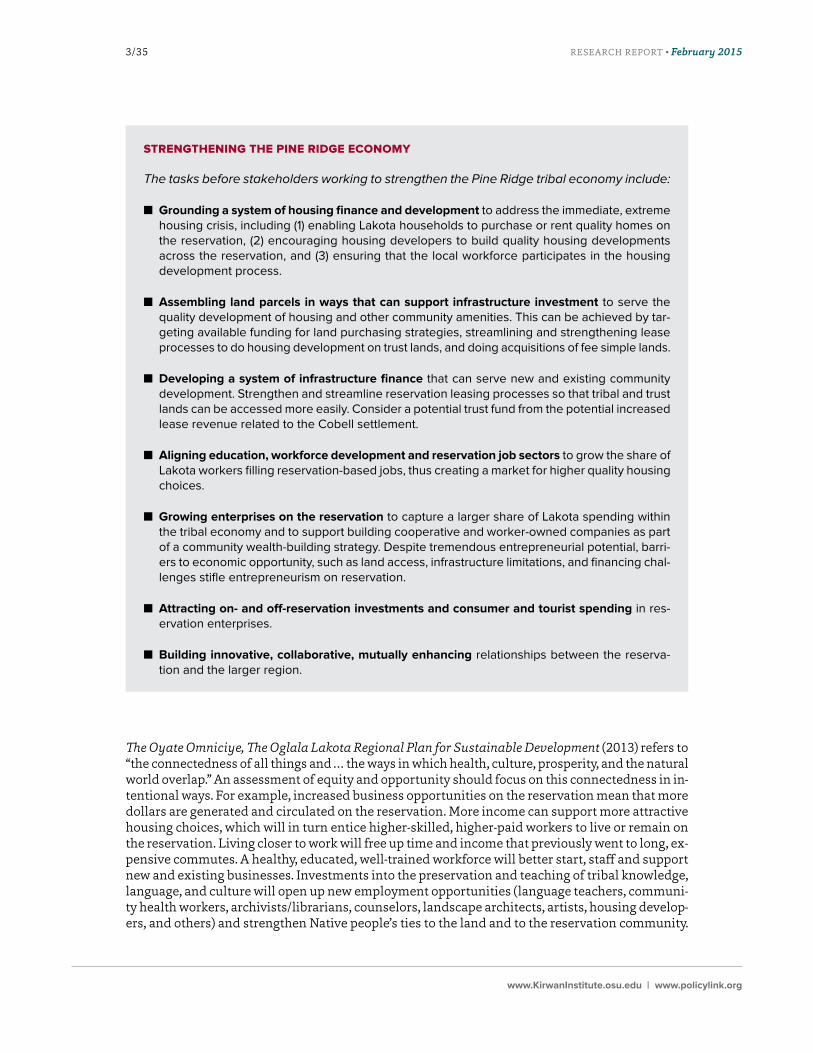
STRENGTHENING THE PINE RIDGE ECONOMY The tasks before stakeholders working to strengthen the Pine Ridge tribal economy include:
■ Grounding a system of housing finance and development to address the immediate, extreme housing crisis, including (1) enabling Lakota households to purchase or rent quality homes on the reservation, (2) encouraging housing developers to build quality housing developments across the reservation, and (3) ensuring that the local workforce participates in the housing development process.
■ Assembling land parcels in ways that can support infrastructure investment to serve the quality development of housing and other community amenities. This can be achieved by tar-geting available funding for land purchasing strategies, streamlining and strengthening lease processes to do housing development on trust lands, and doing acquisitions of fee simple lands.
■ Developing a system of infrastructure finance that can serve new and existing community development. Strengthen and streamline reservation leasing processes so that tribal and trust lands can be accessed more easily. Consider a potential trust fund from the potential increased lease revenue related to the Cobell settlement.
■ Aligning education, workforce development and reservation job sectors to grow the share of Lakota workers filling reservation-based jobs, thus creating a market for higher quality housing choices.
■ Growing enterprises on the reservation to capture a larger share of Lakota spending within the tribal economy and to support building cooperative and worker-owned companies as part of a community wealth-building strategy. Despite tremendous entrepreneurial potential, barri-ers to economic opportunity, such as land access, infrastructure limitations, and financing chal-lenges stifle entrepreneurism on reservation.
■ Attracting on- and off-reservation investments and consumer and tourist spending in res-ervation enterprises.
■ Building innovative, collaborative, mutually enhancing relationships between the reserva-tion and the larger region.
RESEARCH REPORT • February 20154/35
www.KirwanInstitute.osu.edu | www.policylink.org
Strengthening linkages to the regional economy to enhance opportunity could include:
• Building bridges to broader pools of investment capital
• Supporting transitions from high school to college, and from college to advanced training
• Leveraging regional educational, environmental, health care, and economic anchor insti-tutions to meet reservation-based employment and economic goals
• Positioning of a reservation-based Native American entertainment, dining, shopping, arts and cultural experience in the context of the broader regional economy.
Oglala Lakota communities are hungry for investment, and reservation-based institutions stand ready to make these investments work. For instance, Lakota Funds, a model Native Community Development Financial In-stitution (CDFI), has helped finance more than 660 businesses owned by tribal members, in turn creating more than 1100 jobs.2
As the nation grapples with challenges to sustainability and adapts to embrace the benefits of diversity, lifting up success-ful Native American sustainability strategies could inspire and educate planners and policymakers across tribal communities, their regions and the country.
Addressing Key Challenges
A broadly agreed-upon imperative is the immediate and significant need for housing and econom-ic investment on Pine Ridge Reservation. While there is a lack of standardized data to adequately assess the need, one credible source, a 2013 survey of Head Start / Early Head Start families, indi-cated that top issues impacting families were “housing, death of a family member, and unemploy-ment (about 30% responded equally to these three topics).”3 Given the stress, poverty and poor health engendered by difficult living conditions, life expectancy is far below that of US averages. For example, a 1997 study found that men on the Pine Ridge Reservation live 16-1/2 years less than average US males; women on the Reservation live 13-1/2 years less than average US females.4
2.) Kathleen Pickering Sherman, “Best Practices Guide: Microenterprise and Emerging Businesses, Native Small Business Support, and the Contributions of Financial Institutions to Community Development.” September 2011.
3.) Oglala Lakota College, Head Start / Early Head Start, Community-wide Strategic Planning and Needs Assessment. 2013. Presented by: Thomas Shortbull, OLC President and Michelle Yankton, OLC HS/EHS Executive Director. (Document on file with author.)
4.) Oglala College 2012 Case Statement, quoting a 1997 USA Today article that referenced a Harvard School of Public Health study [by Dr. Christopher Murray] that found “the life expectancy of Lakota men and women living on the Pine Ridge Indian Reservation to be the lowest in the U.S. and the lowest in the Western Hemisphere except for Haitians.” Retrieved from Oglala Lakota College website on 11/14/2013 at:olc.edu/~jdudek/webfolder/task... /case2.29.doc. (Document on file with author.) Dr. Murray’s 2006 update, while not calling out Pine Ridge specifically, noted that “Native American males in the cluster of Bennet, Jackson, Mellette, Shannon, Todd, and Washabaugh Coun-ties in South Dakota had a life expectancy of 58 y in 1997–2001, compared to Asian females in Bergen County, New Jersey, with a life ex-pectancy of 91 y, a gap of 33 y.” Eight Americas: Investigating Mortality Disparities across Races, Counties, and Race-Counties in the United States. Christopher J. L. Murray, Sandeep C. Kulkarni, Catherine Michaud, Niels Tomijima, Maria T. Bulzacchelli, Terrell J. Iandiorio, Majid Ezzati. PLOS Medicine. September, 2006.
A healthy, educated, well-trained workforce will better start, staff and support new and existing businesses
RESEARCH REPORT • February 20155/35
www.KirwanInstitute.osu.edu | www.policylink.org
A 2010 UN report observed:
During the mission, the Special Rapporteur observed many families living in subsidized housing units in conditions of severe overcrowding. This was...most strikingly on Pine Ridge Native American Reservation, where it was described as commonplace to have three to four families living in a three-bedroom house. The conditions in the houses on the Res-ervation were the worst seen by the Special Rapporteur during her mission, evidence of the urgent and severe need for additional subsidized housing units there.
[…]
Severe limitations in access to services such as public transportation and fresh food were observed by the Special Rapporteur during her visit to Pine Ridge Reservation. Problems have been compounded due to budget constraints, and in her meetings with HUD the Special Rapporteur was told that the budget for Indian housing has essentially been flat for the past decade.5
The 2012 Oglala Lakota College Case Statement reported that students on the reservation in grades 3–8 average only 22% proficient in reading and 14% proficient in math.6 Clearly, for the health, education, and future of Lakota youth, housing must be stabilized and education, training and employment opportunities expanded.
This report first explores the population data and housing needs on the Pine Ridge Reservation. Second, we review the job type mix on and off reservation and look at travel times for Pine Ridge residents commuting to work. Third, we compare Native American employment statistics across sectors on the reservation, and we compare reservation economic and business opportunities with those of the surrounding region. Lastly, we provide recommendations on building equitable oppor-tunity pathways for Pine Ridge, as well as building connections to the larger region.
5.) Promotion and Protection of All Human Rights, Civil, Political, Economic, Social and Cultural Rights, Including the Right to Develop-ment. Report of the Special Rapporteur on adequate housing as a component of the right to an adequate standard of living, and on the right to non-discrimination in this context, Raquel Rolnik: Addendum. Mission to the United States of America. Report Issued 12 February 2010
6.) Oglala College 2012 Case Statement. Retrieved from Oglala Lakota College website on 11/14/2013 at: olc.edu/~jdudek/webfolder/task.../case2.29.doc. (Document on file with author.)
Given the stress, poverty and poor health engendered by difficult living conditions, life expectancy is far below that of US averages
RESEARCH REPORT • February 20156/35
www.KirwanInstitute.osu.edu | www.policylink.org
A. Pine Ridge Population Analysis
W hile Oglala Lakota participants in multiple surveys and planning exercises identify housing as one of the most urgent needs for a young and growing population, data related to Pine Ridge
population and housing needs are difficult to come by, whether the source is on the reservation or off. Even the question, “how many Native American people reside on Pine Ridge?” has multiple answers, depending on the source of the estimate. Data on businesses operating on the reservation are equally difficult to come by. Not having reliable population and business figures contributes to the challenges facing the community. It is clear that the population is growing on Pine Ridge, with conservative Census estimates documenting a 21% increase in population between 2000 and 2010. In comparison, the State of South Dakota experienced population growth of 7.8% between 2000 and 2010. The growth of population on Pine Ridge (and other tribal lands) also sets the area apart from the State of South Dakota, which has an aging population and is not growing as quickly.
Because of the paucity of standard housing and economic data available for Pine Ridge, we have attempted to gather data from multiple sources to cross-corroborate our findings, including data from a proprietary source (ESRI) and findings from several studies of Pine Ridge, primarily from Colorado State University professor Dr. Kathleen Pickering’s work. Because federal allocations are based on population, knowing the number of residents on the reservation is a crucial piece of in-formation for nearly all else that happens on Pine Ridge.
Like most federal agencies, HUD requires accurate population data from the US Census Bureau to ensure adequate funding for needed housing programs. Unfortunately, Census population numbers for Pine Ridge fall far short of the probable reservation population. HUD recognizes this shortcoming by allowing tribes to challenge all of the data inputs into the IHBG formula, including the Census, and HUD’s formula data reflect a more enlightened and accurate reservation population count.
Where a population denominator is needed for calculations, we have used the HUD formula number from the same year as that of the other source data in the calculations. This is because it is the basis for HUD funding allocations, it comes closest to the independent estimates arrived at by the Colorado State research, and it strikes a balance between the cited extremes.
While census taking is not HUD’s primary mission, HUD’s Policy Development and Research di-vision (PD&R) has undertaken the task of collecting housing data in a Congressionally mandated assessment of Native American, Alaska Native, and Native Hawaiian housing needs. The assess-ment is underway and will utilize a sample of the nation’s 500+ recognized Native American tribes. Unfortunately, this national-level assessment will not provide finely grained data for use by indi-vidual tribes, which is sorely needed for program planning and implementation.
Paul Iron Cloud, Chief Executive Officer of The Oglala Sioux (Lakota) Housing Authority, testified on the poor quality of reservation Census data before the Committee on Indian Affairs:
“I would be remiss if I did not also mention that if a GPS and GIS needs assessment re-quirement was to replace the current defective U.S. Census method in the NAHASDA [Native American Housing Assistance and Self Determination Act] program, tribes, Con-gress, OMB and HUD would also then have an accurate, reliable and efficient way to better manage federal funding.” 7
7.) Testimony of Paul Iron Cloud, Chief Executive Officer of The Oglala Sioux (Lakota) Housing Authority, Pine Ridge Reservation, South Dakota, before the Identifying Barriers to Indian Housing Development and Finding Solutions Oversight Hearing of The Committee on Indian Affairs, United States Senate. April 10, 2013
RESEARCH REPORT • February 20157/35
www.KirwanInstitute.osu.edu | www.policylink.org
Recommendations to support accurate population data:
• Support the recommendation in the Oglala Lakota Regional Plan for Sustainable Devel-opment for the creation of a regional or tribal planning authority that acts as a one-stop shop for data on the Pine Ridge Indian Reservation. This entity would collect and evalu-ate data on an on-going basis.
• HUD should advance its work with the tribal housing authority to establish an accurate assessment of the Pine Ridge population and housing needs, and push other federal agen-cies to adopt the locally sourced numbers for use in funding allocations.
• HUD can advocate for more accurate data collection methodologies on reservations, in-cluding Pine Ridge, by leveraging the Congressional mandate behind the national assess-ment of Native American tribes to keep the need for accurate data before Congress and other federal agencies, particularly the Census Bureau.
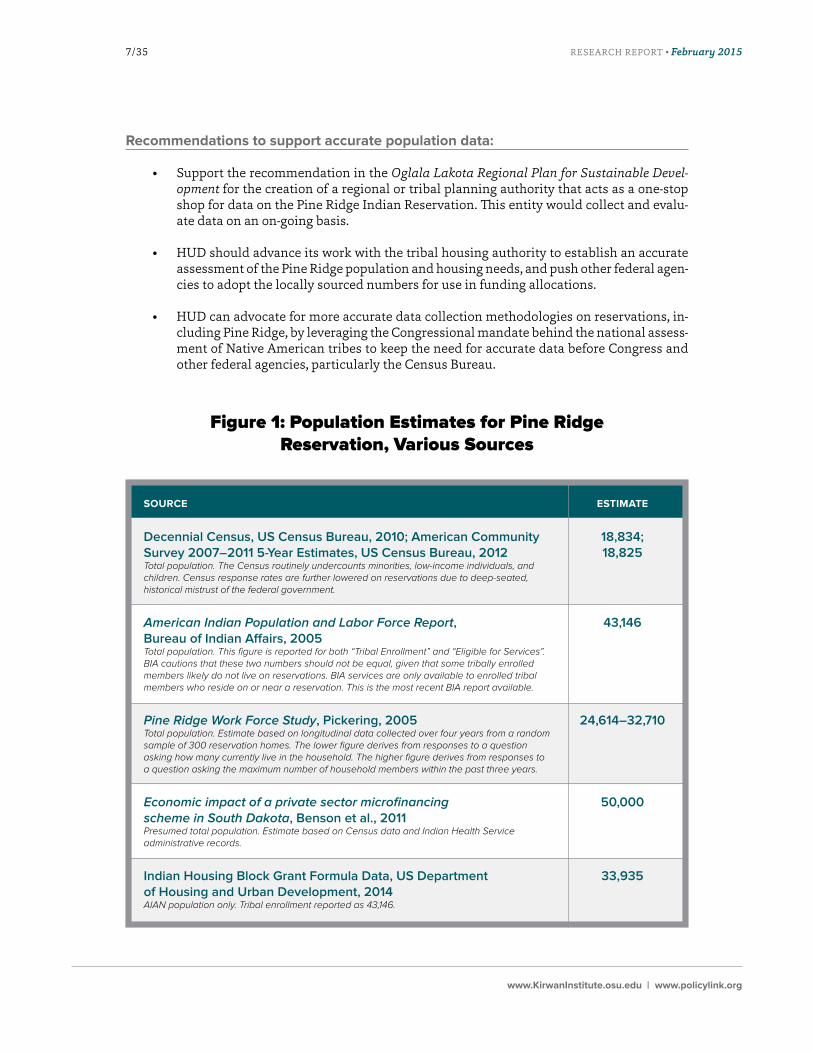
Figure 1: Population Estimates for Pine Ridge Reservation, Various Sources
SOURCE ESTIMATE
Decennial Census, US Census Bureau, 2010; American Community 18,834; Survey 2007–2011 5-Year Estimates, US Census Bureau, 2012 18,825 Total population. The Census routinely undercounts minorities, low-income individuals, and children. Census response rates are further lowered on reservations due to deep-seated, historical mistrust of the federal government.
American Indian Population and Labor Force Report, 43,146 Bureau of Indian Affairs, 2005 Total population. This figure is reported for both “Tribal Enrollment” and “Eligible for Services”. BIA cautions that these two numbers should not be equal, given that some tribally enrolled members likely do not live on reservations. BIA services are only available to enrolled tribal members who reside on or near a reservation. This is the most recent BIA report available.
Pine Ridge Work Force Study, Pickering, 2005 24,614–32,710Total population. Estimate based on longitudinal data collected over four years from a random sample of 300 reservation homes. The lower figure derives from responses to a question asking how many currently live in the household. The higher figure derives from responses to a question asking the maximum number of household members within the past three years.
Economic impact of a private sector microfinancing 50,000 scheme in South Dakota, Benson et al., 2011 Presumed total population. Estimate based on Census data and Indian Health Service administrative records.
Indian Housing Block Grant Formula Data, US Department 33,935 of Housing and Urban Development, 2014 AIAN population only. Tribal enrollment reported as 43,146.
RESEARCH REPORT • February 20158/35
www.KirwanInstitute.osu.edu | www.policylink.org
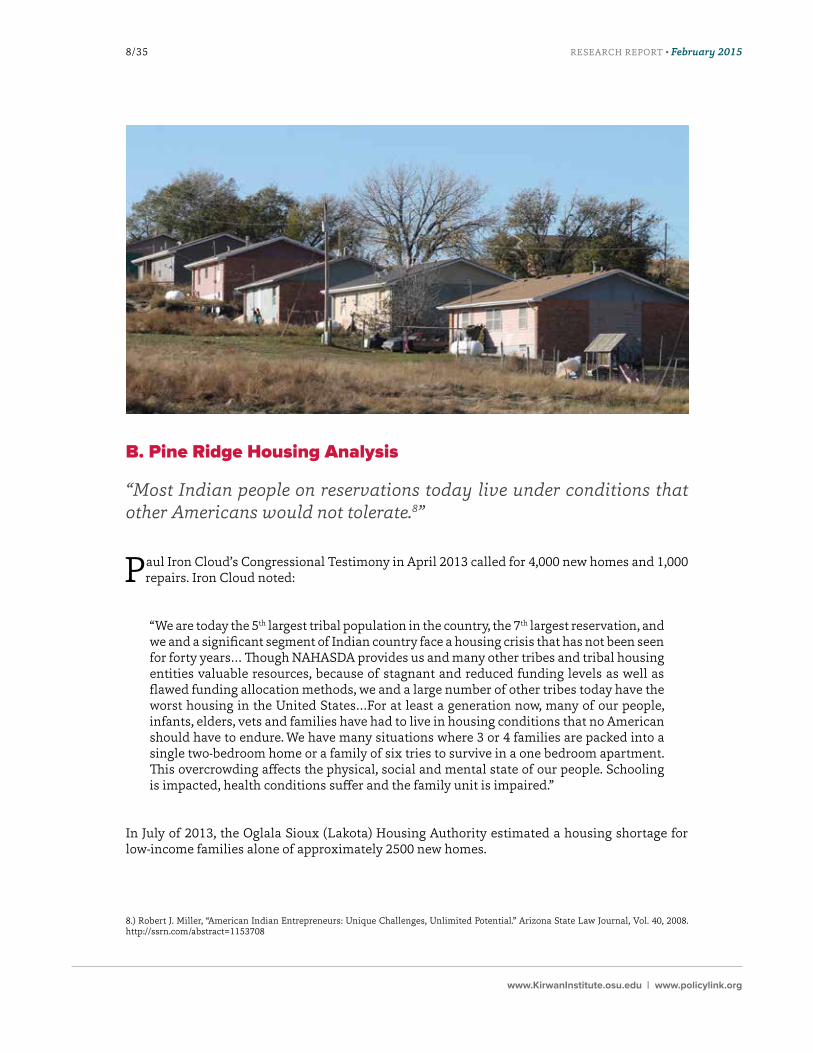
B. Pine Ridge Housing Analysis
“Most Indian people on reservations today live under conditions that other Americans would not tolerate.8”
P aul Iron Cloud’s Congressional Testimony in April 2013 called for 4,000 new homes and 1,000 repairs. Iron Cloud noted:
“We are today the 5th largest tribal population in the country, the 7th largest reservation, and we and a significant segment of Indian country face a housing crisis that has not been seen for forty years… Though NAHASDA provides us and many other tribes and tribal housing entities valuable resources, because of stagnant and reduced funding levels as well as flawed funding allocation methods, we and a large number of other tribes today have the worst housing in the United States…For at least a generation now, many of our people, infants, elders, vets and families have had to live in housing conditions that no American should have to endure. We have many situations where 3 or 4 families are packed into a single two-bedroom home or a family of six tries to survive in a one bedroom apartment. This overcrowding affects the physical, social and mental state of our people. Schooling is impacted, health conditions suffer and the family unit is impaired.”
In July of 2013, the Oglala Sioux (Lakota) Housing Authority estimated a housing shortage for low-income families alone of approximately 2500 new homes.
8.) Robert J. Miller, “American Indian Entrepreneurs: Unique Challenges, Unlimited Potential.” Arizona State Law Journal, Vol. 40, 2008. http://ssrn.com/abstract=1153708
RESEARCH REPORT • February 20159/35
www.KirwanInstitute.osu.edu | www.policylink.org
All sources point to a demonstrated, significant need for additional housing units at every income level, including the replacement or renovation of current stock. While exact numbers are difficult to pin down due to varying population estimates, the Kirwan Institute calculated the minimum number of additional housing units needed to house the reservation’s population at 875 three-bed-room homes9, an increase of 21.4% over existing housing stock.10
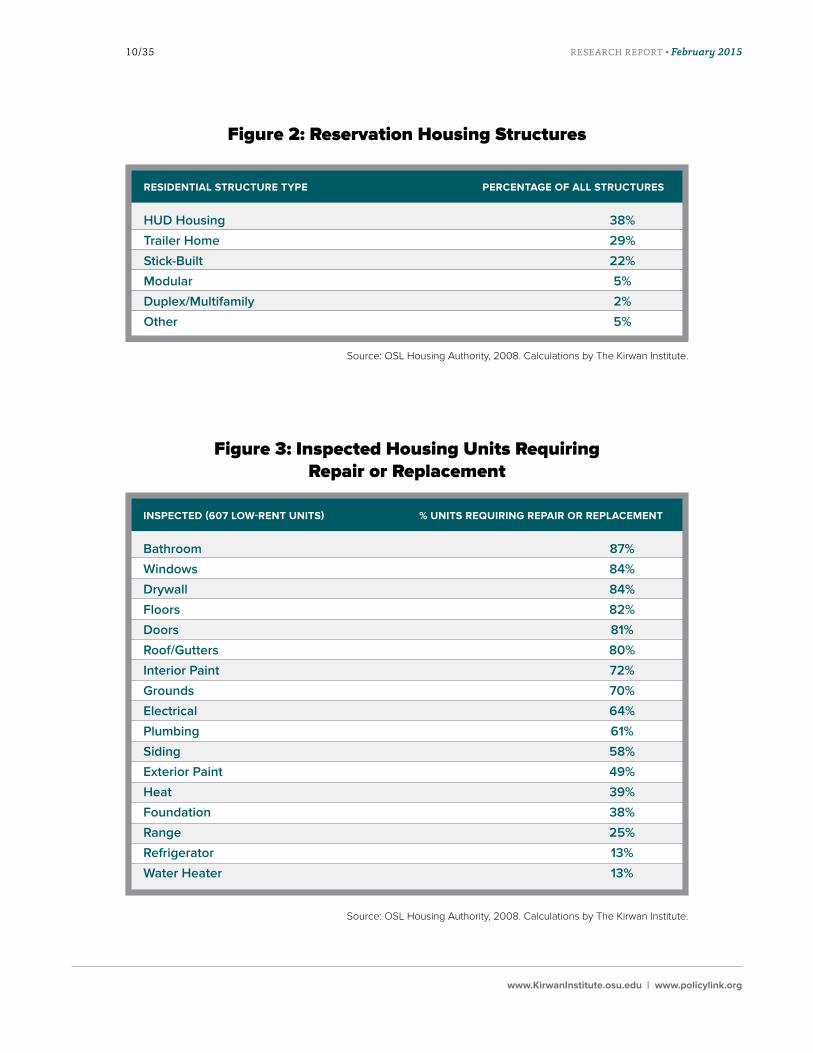
Not only are there too few units, much of the existing housing stock is substandard and in need of repair (FIGURE 3). Nearly 70% of all reservation housing is HUD housing or a trailer home (FIGURE 2). The median home value on the Reservation is $25,900—barely more than one-fifth the US average of $119,60011—the depressed values are due to the substandard quality of the housing stock and a lack of a widely accessible housing finance system for tribal land holdings. An EPA report on black mold in Pine Ridge housing states that mold has been found in 75% of tribal housing units, resulting in substantial health risks.12 Currently, the Housing Authority has inadequate inspec-tion capacity; and while current housing resources are directed at mold remediation, the level of resources is insufficient to address the scale of mold issues found. An additional challenge is the lack of places to house residents as renovations of their homes are taking place.
Reservation housing choice is currently very limited, due in part to the need to maintain existing stock and provide base-level shelter in the face of capacity shortages. And while current subsidies are directed at addressing the needs of low-income households, the reservation also lacks housing that would appeal to young Native American professionals (trained on or off the reservation) who would like to live on the reservation, but cannot. HUD and USDA are currently exploring ways to expand other housing assistance and development programs to Pine Ridge, such as the Section 502 Housing Loan Guarantee program that serves households earning up to 115% of median income, that can serve a broader spectrum of tribal members’ housing needs, and that can leverage more private resources into housing development.13
In addition to meeting housing needs, home construction would also contribute to the overall local economy. The National Association of Home Builders reported in 2009 that “the estimated one-year local impacts of building 100 single-family homes in a typical metro area include $21.1 million in local income, $2.2 million in taxes and other revenue for local governments, and 324 local jobs.”14
9.) This estimate (875 new housing units) does not contradict Director Iron Cloud’s testimony that Pine Ridge needs 4,000 new units of housing and repairs on 1,000 more. It only states how far short the current housing stock falls from providing the minimum total capacity needed to house the reservation’s Native American population, assuming that the current stock were 100% inhabitable. In the light of the deplorable condition of current stock, Director Iron Cloud’s estimate should be taken as the amount of housing needed to supplement the current housing stock and to replace a substantial amount of the current stock that is beyond repair.
10.) Details of the Kirwan analysis are in the Appendix.
11.) Oglala College 2012 Case Statement, page 17. Retrieved from Oglala Lakota College website on 11/14/2013 at: olc.edu/~jdudek/webfold-er/task.../case2.29.doc. (Document on file with author.)
12.) These impacts include chronic sinusitis, severe headaches, fungal skin infections, and upper and lower respiratory illnesses. National EPA – Tribal Science Council, National Tribal Science Priorities 2006: 17.
13.) For more from the perspective of the Housing Authority, please see Testimony of Paul Iron Cloud, Chief Executive Officer of The Oglala Sioux (Lakota) Housing Authority, Pine Ridge Reservation, South Dakota, before the Identifying Barriers to Indian Housing Development and Finding Solutions Oversight Hearing of The Committee on Indian Affairs, United States Senate. April 10, 2013
14,) NAHB, The Local Impact of Home Building in a Typical Metro Area: Income, Jobs, and Taxes Generated. Prepared by the Housing Policy Department, June 2009.
RESEARCH REPORT • February 201510/35
www.KirwanInstitute.osu.edu | www.policylink.org
Figure 2: Reservation Housing Structures
Figure 3: Inspected Housing Units Requiring Repair or Replacement
RESIDENTIAL STRUCTURE TYPE PERCENTAGE OF ALL STRUCTURES
HUD Housing 38%
Trailer Home 29%
Stick-Built 22%
Modular 5%
Duplex/Multifamily 2%
Other 5%
INSPECTED (607 LOW-RENT UNITS) % UNITS REQUIRING REPAIR OR REPLACEMENT
Bathroom 87%
Windows 84%
Drywall 84%
Floors 82%
Doors 81%
Roof/Gutters 80%
Interior Paint 72%
Grounds 70%
Electrical 64%
Plumbing 61%
Siding 58%
Exterior Paint 49%
Heat 39%
Foundation 38%
Range 25%
Refrigerator 13%
Water Heater 13%
Source: OSL Housing Authority, 2008. Calculations by The Kirwan Institute.
Source: OSL Housing Authority, 2008. Calculations by The Kirwan Institute.
RESEARCH REPORT • February 201511/35
www.KirwanInstitute.osu.edu | www.policylink.org
RECOMMENDATIONThe Oglala Sioux (Lakota) Housing Authority, HUD, USDA, reservation-based nonprofits (like Thunder Valley CDC, Mazaska, Oglala Sioux Tribe Partnership 4 Housing), The Lakota Funds, and area banks should develop a targeted range of housing production/rehab goals, financial prod-ucts, and subsidy resources that can address diverse income-levels’ housing needs. These target-ed resources should offer a mix of housing choices for current and potential reservation residents. Housing should meet the needs of low-income residents as well as provide opportunity for young professionals and other workers to live and work on the reservation. Financing products should work to serve rental and ownership properties on both tribally-held land and fee simple land within the reservation boundaries.
RECOMMENDATIONUtilize existing loan guarantee programs to further leverage formula grant programs, expanding offerings of affordable rental and home ownership opportunities.
• Use Title VI to leverage existing NAHASDA dollars for both rental and home ownership housing development.
• Maximize HUD Section 502 loan guarantee products by utilizing within the ICDBG program, further leveraging ICDBG funds.
RESEARCH REPORT • February 201512/35
www.KirwanInstitute.osu.edu | www.policylink.org
C. Pine Ridge Infrastructure Needs
Another key challenge to the expansion of quality, affordable housing on the Reservation is investment into the basic infrastructure that supports housing—roads, water, sewer and elec-
tricity. With parcels available for housing development scattered far apart, the costs of infrastruc-ture development are prohibitive to the production of lower-cost homes. A land assembly strategy, complemented by a comprehensive plan to provide cost-effective infrastructure to development clusters, will be necessary to implement housing development plans.
Currently, infrastructure financing faces nationwide challenges. Due to declining federal infrastruc-ture investment, 75% of all infrastructure is paid for by state and local governments.15 Financing is competitive and difficult to come by at the state and local level as generally, taxpayers must support tax increases to expand infrastructure financing.
While not entirely comparable, First Nations in Canada have found that the following factors fa-cilitated investment financing:
(1) Regularly updated strategic/community plans that have community involvement;
(2) Stability in community leadership—each had a Chief and the majority of councilors who had been on council over 25 years. This provides stability and comfort to the financing community;
(3) Development of long-term partnerships;
(4) Close relationship with their financial institution(s); and
(5) Own source of revenue.16
In a research report that promotes equity in infrastructure development, the World Bank suggests that stakeholders consider the following questions: (1) Who is providing the service and how? (2) Who is the provider accountable to—the policy maker (government), the client (the public utility) or the consumer? (3)… Who is gaining and who is loosing [sic] from the existing system, and how will the [investment partnership] affect equitable access to services?17
RECOMMENDATIONUtilize collaborative funding models to make strategic investments in basic infrastructure to support co-located housing developments. Create a leverage pool of public, philanthropy, and private funds that can be guaranteed by fee payments of users. Develop the capacity of Lakota leadership to pioneer creative infrastructure financing models that respond the unique status and needs of Reservation development, and to administer and manage the financing vehicles. Because the tribe does not do bonding, and because the County only taxes 14 percent of the land (thereby reducing bonding ability for infrastructure), Pine Ridge needs innovative sources of grants and loans to finance infrastructure (75% grant; 25% loan).
15.) The Urban Land Institute and Ernst & Young. Infrastructure 2013: Global Priorities, Global Insights.
16.) Case Studies of Four First Nations Who Have Levered Funding from Financial Institutions for Infrastructure and Other Economically-Re-lated Projects. For Community Infrastructure Branch, Innovation and Partnerships Directorate, Department of Indian Affairs and Northern Development. The GBC Group Inc. 2010.
17.) Public Private Partnerships, Infrastructure, Gender and Poverty. World Bank Institute Finance and Private Sector Development. Mary Jennings and Cathy Gaynor. June 2004.
RESEARCH REPORT • February 201513/35
www.KirwanInstitute.osu.edu | www.policylink.org
In a way, addressing the housing and infrastructure needs of the Reservation is similar to re-building after a natural disaster. All systems—roads, water, sewer, electricity, housing, grocery, schools—need to be repaired, upgraded, extended or rebuilt simultaneously. Areas devastated by nature can access unique disaster funding once a federal state of emergency is declared. It could be argued that a state of emergency exists on Pine Ridge and other reservations, with devastation on the scale of that seen in natural disasters—except the devastation on Pine Ridge is the result, not of natural forces, but of historic, deliberate policy choices (see Appendix A). Unfortunately, federal disaster funding is not available in such cases.
RESEARCH REPORT • February 201514/35
www.KirwanInstitute.osu.edu | www.policylink.org
D. Pine Ridge Reservation and Regional Economic Analysis
Job Type Mix On and Off Pine Ridge Reservation
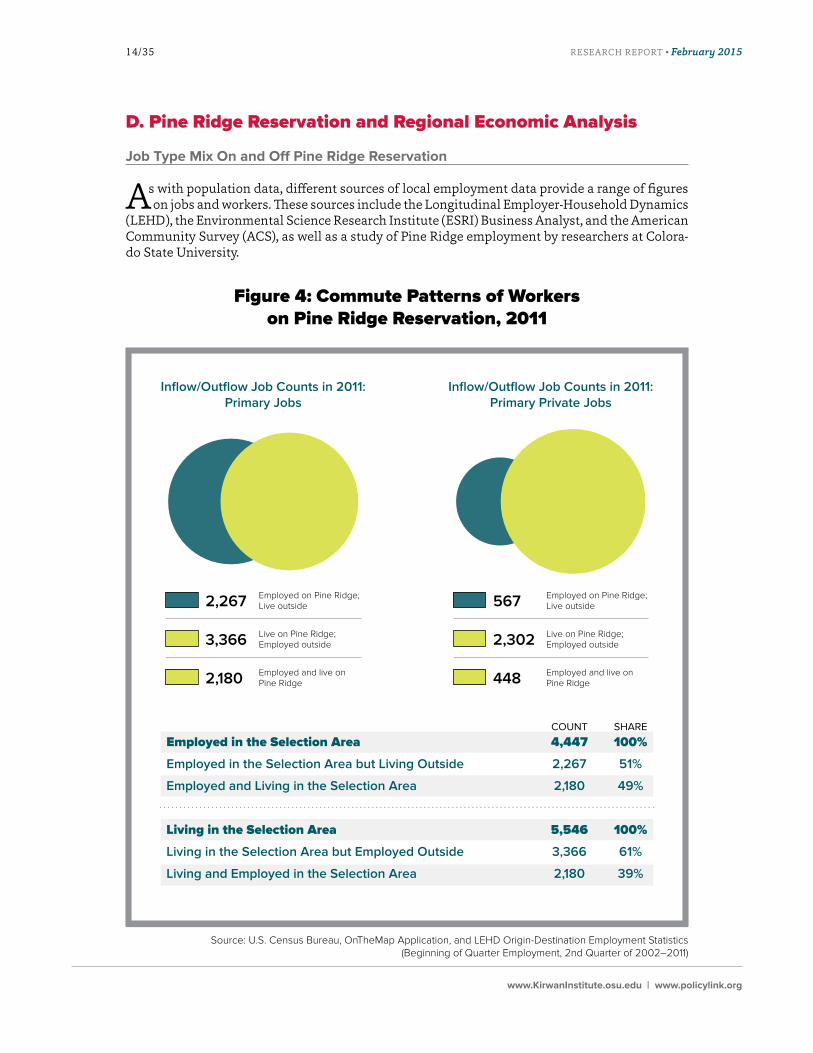
As with population data, different sources of local employment data provide a range of figures on jobs and workers. These sources include the Longitudinal Employer-Household Dynamics
(LEHD), the Environmental Science Research Institute (ESRI) Business Analyst, and the American Community Survey (ACS), as well as a study of Pine Ridge employment by researchers at Colora-do State University.
Figure 4: Commute Patterns of Workers on Pine Ridge Reservation, 2011
Source: U.S. Census Bureau, OnTheMap Application, and LEHD Origin-Destination Employment Statistics (Beginning of Quarter Employment, 2nd Quarter of 2002–2011)
Inflow/Outflow Job Counts in 2011: Primary Jobs
2,267
3,366
2,180
Employed on Pine Ridge; Live outside
Live on Pine Ridge; Employed outside
Employed and live on Pine Ridge
Inflow/Outflow Job Counts in 2011: Primary Private Jobs
567
2,302
448
Employed on Pine Ridge; Live outside
Live on Pine Ridge; Employed outside
Employed and live on Pine Ridge
COUNT SHARE
Employed in the Selection Area 4,447 100%
Employed in the Selection Area but Living Outside 2,267 51%
Employed and Living in the Selection Area 2,180 49%
Living in the Selection Area 5,546 100%
Living in the Selection Area but Employed Outside 3,366 61%
Living and Employed in the Selection Area 2,180 39%
RESEARCH REPORT • February 201515/35
www.KirwanInstitute.osu.edu | www.policylink.org
One of the most significant findings in the data is the spatial mismatch between place of residence and place of employment. FIGURE 4 characterizes the relationship between those who live and/or work on the Reservation (the “Selection Area” in the graphic), revealing that 51% of those who work on the Reservation live somewhere else, and 60% of those who live on the reservation work off-Reservation. The associated Figure in the Appendix provides further numerical break-down of resident workers and those employed on the Reservation.
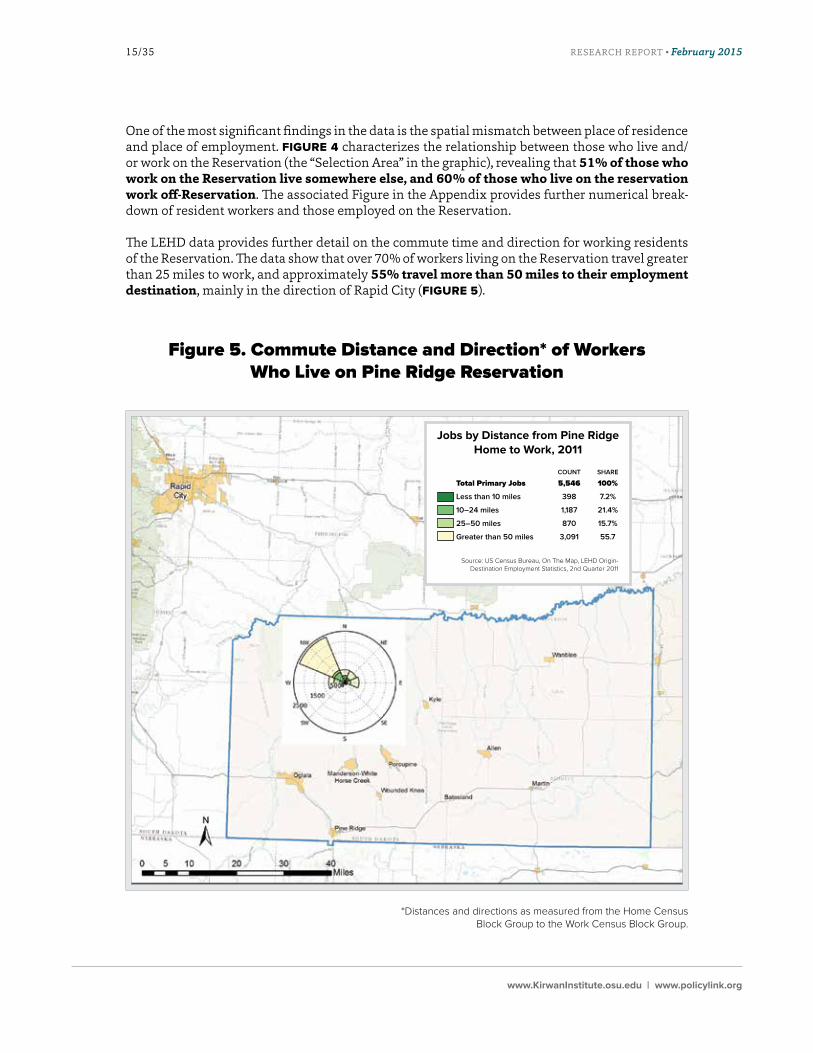
The LEHD data provides further detail on the commute time and direction for working residents of the Reservation. The data show that over 70% of workers living on the Reservation travel greater than 25 miles to work, and approximately 55% travel more than 50 miles to their employment destination, mainly in the direction of Rapid City (FIGURE 5).
Figure 5. Commute Distance and Direction* of Workers Who Live on Pine Ridge Reservation
*Distances and directions as measured from the Home Census Block Group to the Work Census Block Group.
COUNT SHARE
Total Primary Jobs 5,546 100%
Less than 10 miles 398 7.2%
10–24 miles 1,187 21.4%
25–50 miles 870 15.7%
Greater than 50 miles 3,091 55.7
Source: US Census Bureau, On The Map, LEHD Origin-Destination Employment Statistics, 2nd Quarter 2011
Jobs by Distance from Pine Ridge Home to Work, 2011
RESEARCH REPORT • February 201516/35
www.KirwanInstitute.osu.edu | www.policylink.org
Employment for those Living on the Reservation:
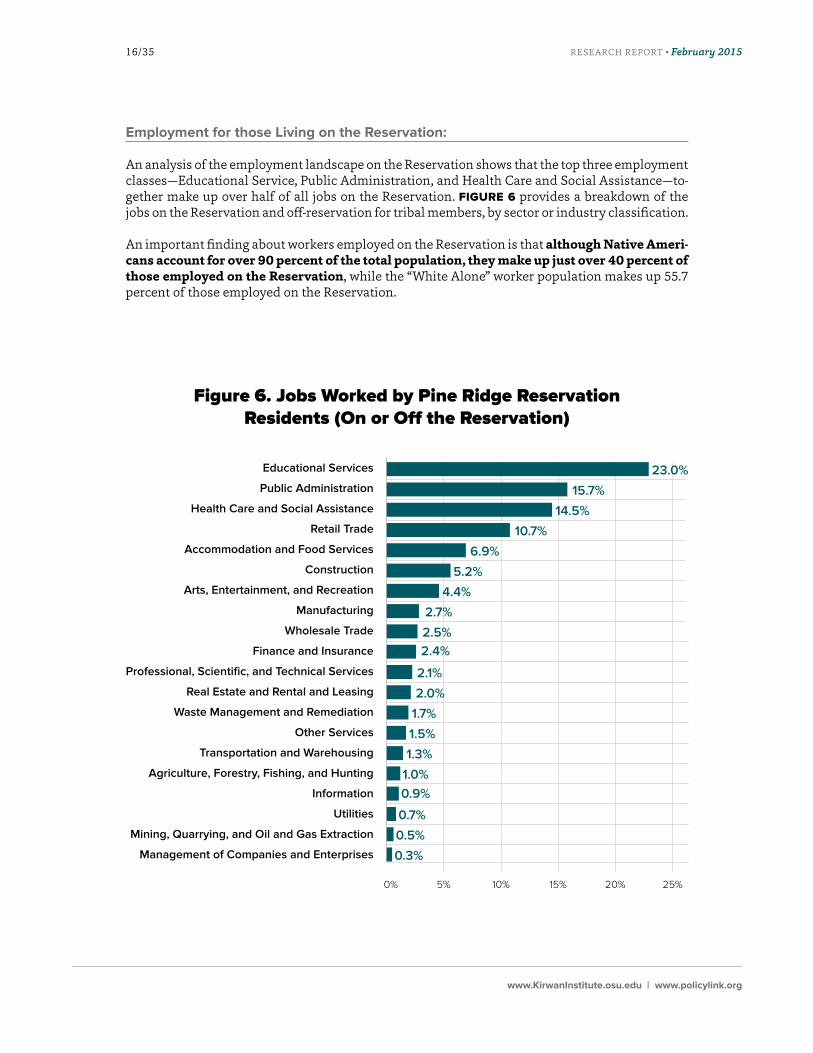
An analysis of the employment landscape on the Reservation shows that the top three employment classes—Educational Service, Public Administration, and Health Care and Social Assistance—to-gether make up over half of all jobs on the Reservation. FIGURE 6 provides a breakdown of the jobs on the Reservation and off-reservation for tribal members, by sector or industry classification.
An important finding about workers employed on the Reservation is that although Native Ameri-cans account for over 90 percent of the total population, they make up just over 40 percent of those employed on the Reservation, while the “White Alone” worker population makes up 55.7 percent of those employed on the Reservation.
Figure 6. Jobs Worked by Pine Ridge Reservation Residents (On or Off the Reservation)
Educational Services
Public Administration
Health Care and Social Assistance
Retail Trade
Accommodation and Food Services
Construction
Arts, Entertainment, and Recreation
Manufacturing
Wholesale Trade
Finance and Insurance
Professional, Scientific, and Technical Services
Real Estate and Rental and Leasing
Waste Management and Remediation
Other Services
Transportation and Warehousing
Agriculture, Forestry, Fishing, and Hunting
Information
Utilities
Mining, Quarrying, and Oil and Gas Extraction
Management of Companies and Enterprises
5%0% 10% 15% 20% 25%
23.0%
15.7%
14.5%
10.7%
6.9%
5.2%
4.4%
2.7%
2.5%2.4%
2.1%
2.0%
1.7%
1.5%
1.3%
1.0%0.9%
0.7%
0.5%
0.3%
RESEARCH REPORT • February 201517/35
www.KirwanInstitute.osu.edu | www.policylink.org
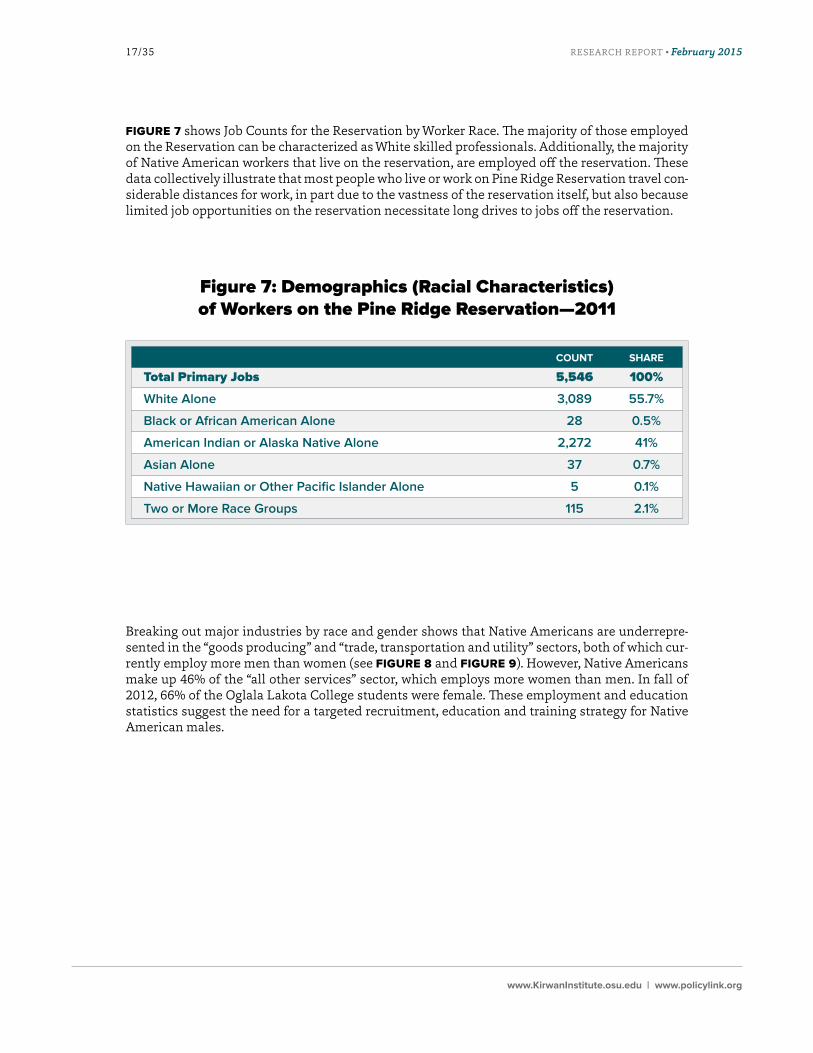
FIGURE 7 shows Job Counts for the Reservation by Worker Race. The majority of those employed on the Reservation can be characterized as White skilled professionals. Additionally, the majority of Native American workers that live on the reservation, are employed off the reservation. These data collectively illustrate that most people who live or work on Pine Ridge Reservation travel con-siderable distances for work, in part due to the vastness of the reservation itself, but also because limited job opportunities on the reservation necessitate long drives to jobs off the reservation.
Figure 7: Demographics (Racial Characteristics) of Workers on the Pine Ridge Reservation—2011
COUNT SHARE
Total Primary Jobs 5,546 100%
White Alone 3,089 55.7%
Black or African American Alone 28 0.5%
American Indian or Alaska Native Alone 2,272 41%
Asian Alone 37 0.7%
Native Hawaiian or Other Pacific Islander Alone 5 0.1%
Two or More Race Groups 115 2.1%
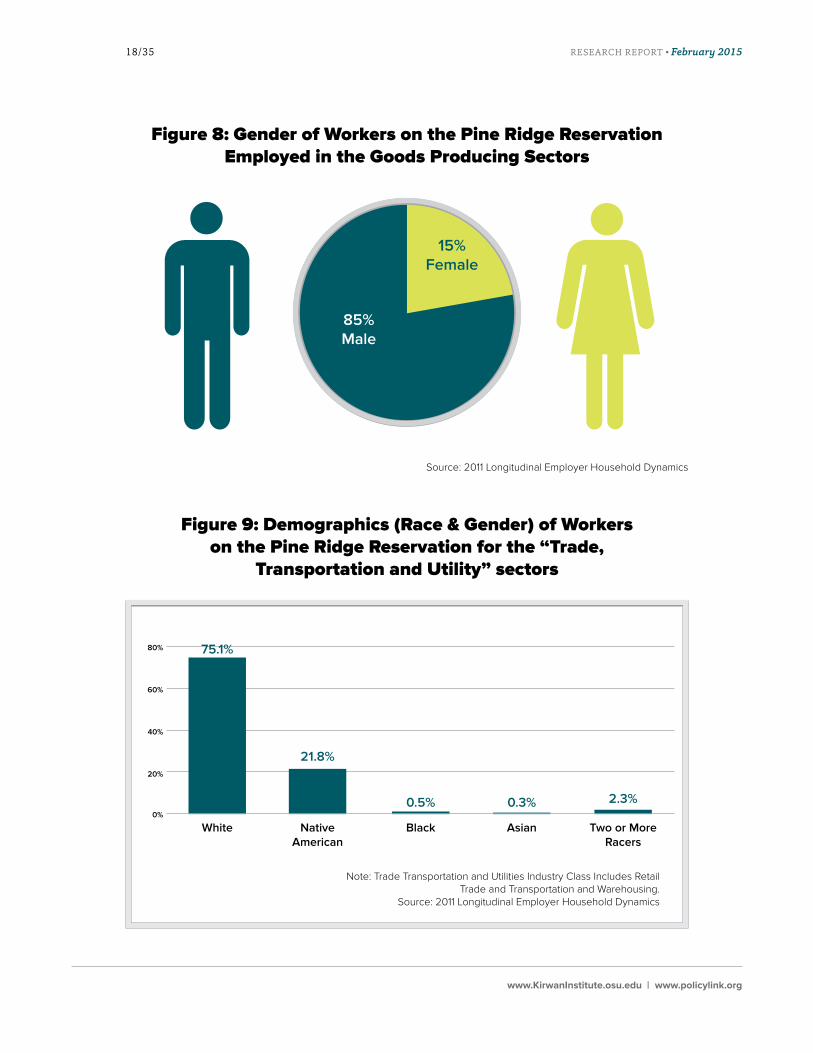
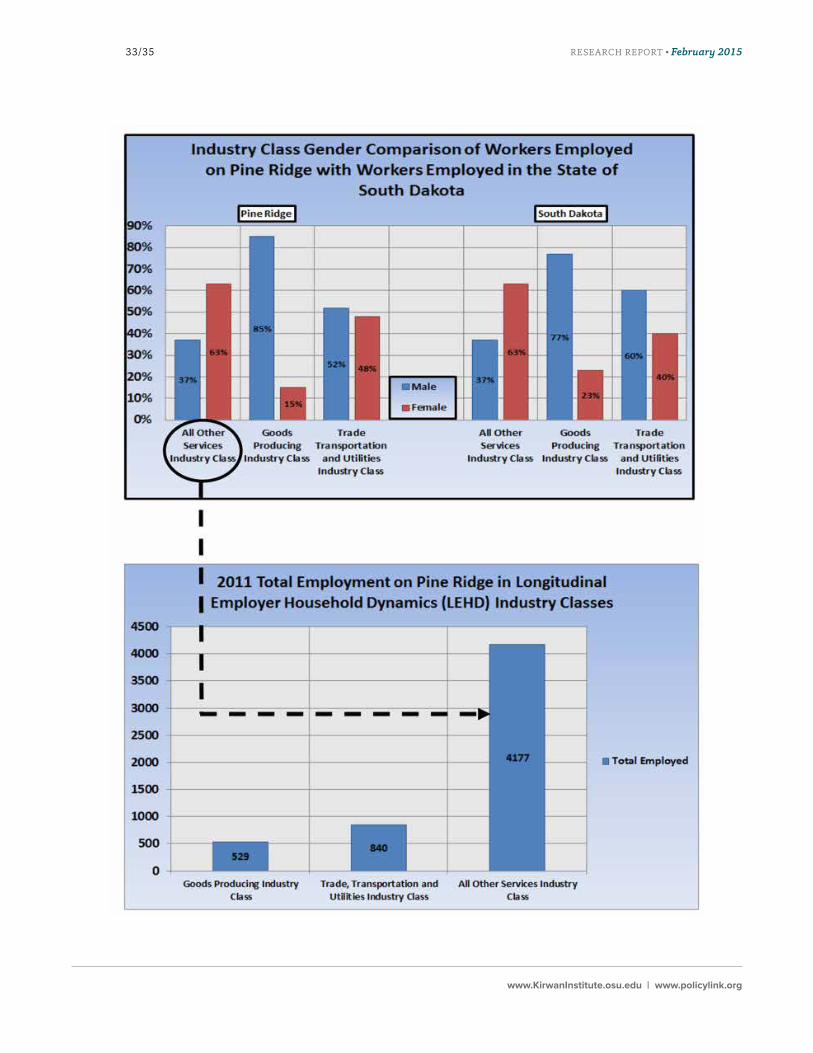
Breaking out major industries by race and gender shows that Native Americans are underrepre-sented in the “goods producing” and “trade, transportation and utility” sectors, both of which cur-rently employ more men than women (see FIGURE 8 and FIGURE 9). However, Native Americans make up 46% of the “all other services” sector, which employs more women than men. In fall of 2012, 66% of the Oglala Lakota College students were female. These employment and education statistics suggest the need for a targeted recruitment, education and training strategy for Native American males.
RESEARCH REPORT • February 201518/35
www.KirwanInstitute.osu.edu | www.policylink.org
80%
White Native American
Black Asian Two or More Racers
60%
40%
20%
0%
Figure 8: Gender of Workers on the Pine Ridge Reservation Employed in the Goods Producing Sectors
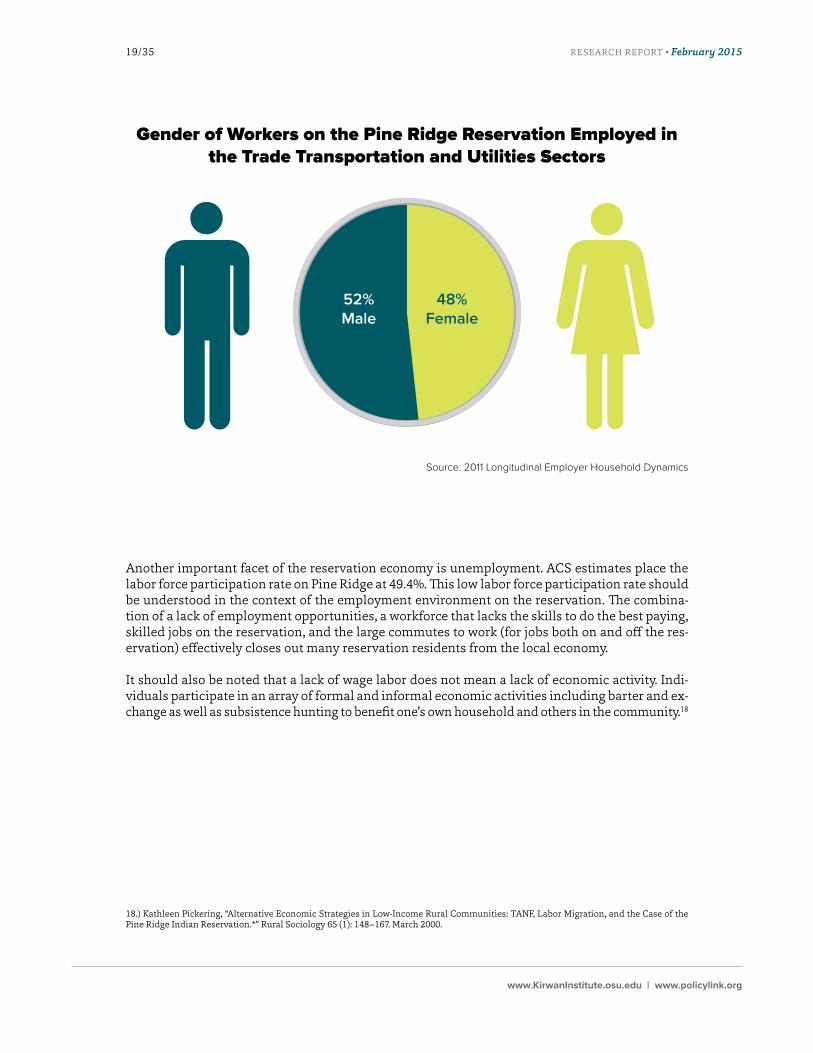
Figure 9: Demographics (Race & Gender) of Workers on the Pine Ridge Reservation for the “Trade,
Transportation and Utility” sectors
85%Male
15% Female
Source: 2011 Longitudinal Employer Household Dynamics
75.1%
21.8%
0.5% 0.3% 2.3%
Note: Trade Transportation and Utilities Industry Class Includes Retail Trade and Transportation and Warehousing.
Source: 2011 Longitudinal Employer Household Dynamics
RESEARCH REPORT • February 201519/35
www.KirwanInstitute.osu.edu | www.policylink.org
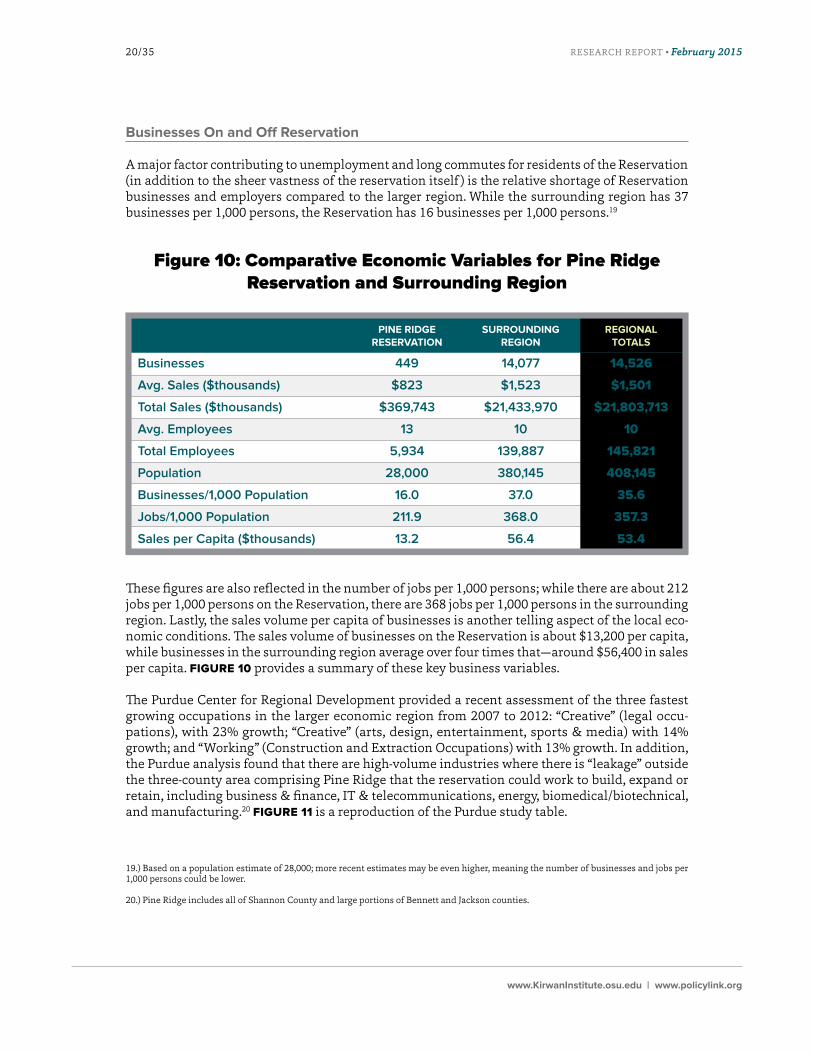
Another important facet of the reservation economy is unemployment. ACS estimates place the labor force participation rate on Pine Ridge at 49.4%. This low labor force participation rate should be understood in the context of the employment environment on the reservation. The combina-tion of a lack of employment opportunities, a workforce that lacks the skills to do the best paying, skilled jobs on the reservation, and the large commutes to work (for jobs both on and off the res-ervation) effectively closes out many reservation residents from the local economy.
It should also be noted that a lack of wage labor does not mean a lack of economic activity. Indi-viduals participate in an array of formal and informal economic activities including barter and ex-change as well as subsistence hunting to benefit one’s own household and others in the community.18
18.) Kathleen Pickering, “Alternative Economic Strategies in Low-Income Rural Communities: TANF, Labor Migration, and the Case of the Pine Ridge Indian Reservation.*” Rural Sociology 65 (1): 148–167. March 2000.
52%Male
48% Female
Source: 2011 Longitudinal Employer Household Dynamics
Gender of Workers on the Pine Ridge Reservation Employed in the Trade Transportation and Utilities Sectors
RESEARCH REPORT • February 201520/35
www.KirwanInstitute.osu.edu | www.policylink.org
Businesses On and Off Reservation
A major factor contributing to unemployment and long commutes for residents of the Reservation (in addition to the sheer vastness of the reservation itself ) is the relative shortage of Reservation businesses and employers compared to the larger region. While the surrounding region has 37 businesses per 1,000 persons, the Reservation has 16 businesses per 1,000 persons.19
These figures are also reflected in the number of jobs per 1,000 persons; while there are about 212 jobs per 1,000 persons on the Reservation, there are 368 jobs per 1,000 persons in the surrounding region. Lastly, the sales volume per capita of businesses is another telling aspect of the local eco-nomic conditions. The sales volume of businesses on the Reservation is about $13,200 per capita, while businesses in the surrounding region average over four times that—around $56,400 in sales per capita. FIGURE 10 provides a summary of these key business variables.
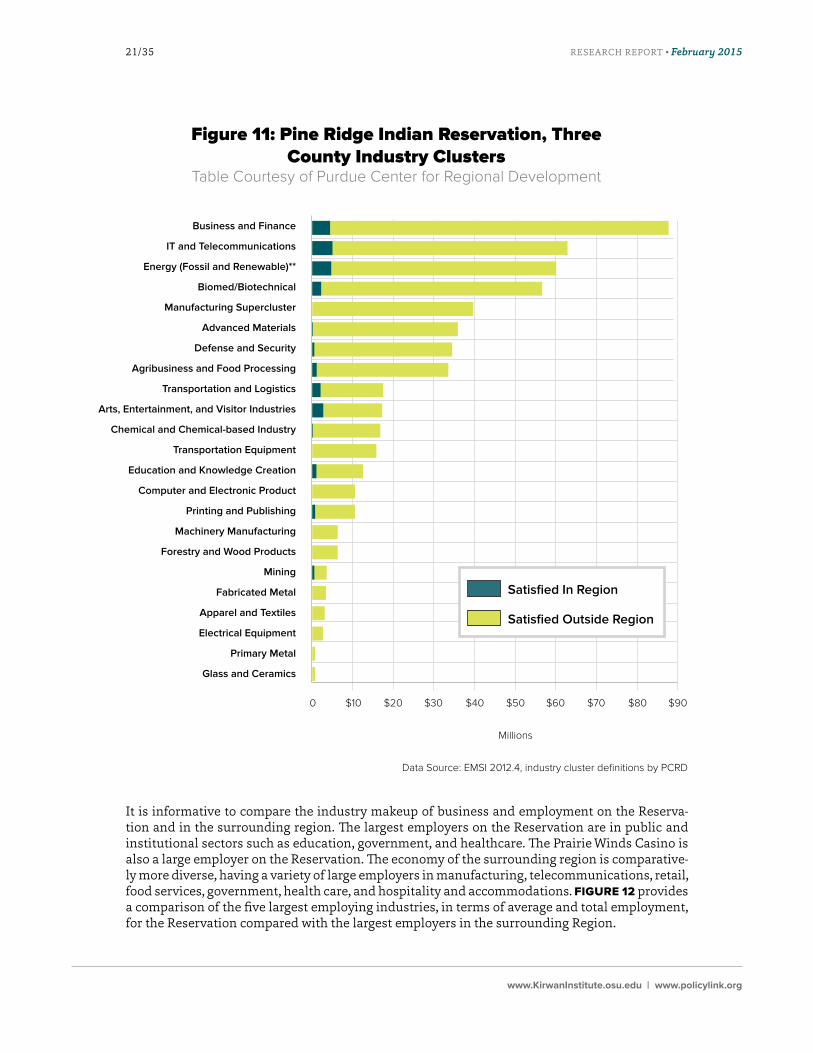
The Purdue Center for Regional Development provided a recent assessment of the three fastest growing occupations in the larger economic region from 2007 to 2012: “Creative” (legal occu-pations), with 23% growth; “Creative” (arts, design, entertainment, sports & media) with 14% growth; and “Working” (Construction and Extraction Occupations) with 13% growth. In addition, the Purdue analysis found that there are high-volume industries where there is “leakage” outside the three-county area comprising Pine Ridge that the reservation could work to build, expand or retain, including business & finance, IT & telecommunications, energy, biomedical/biotechnical, and manufacturing.20 FIGURE 11 is a reproduction of the Purdue study table.
19.) Based on a population estimate of 28,000; more recent estimates may be even higher, meaning the number of businesses and jobs per 1,000 persons could be lower.
20.) Pine Ridge includes all of Shannon County and large portions of Bennett and Jackson counties.
PINE RIDGE SURROUNDING REGIONAL RESERVATION REGION TOTALS
Businesses 449 14,077 14,526
Avg. Sales ($thousands) $823 $1,523 $1,501
Total Sales ($thousands) $369,743 $21,433,970 $21,803,713
Avg. Employees 13 10 10
Total Employees 5,934 139,887 145,821
Population 28,000 380,145 408,145
Businesses/1,000 Population 16.0 37.0 35.6
Jobs/1,000 Population 211.9 368.0 357.3
Sales per Capita ($thousands) 13.2 56.4 53.4
Figure 10: Comparative Economic Variables for Pine Ridge Reservation and Surrounding Region
RESEARCH REPORT • February 201521/35
www.KirwanInstitute.osu.edu | www.policylink.org
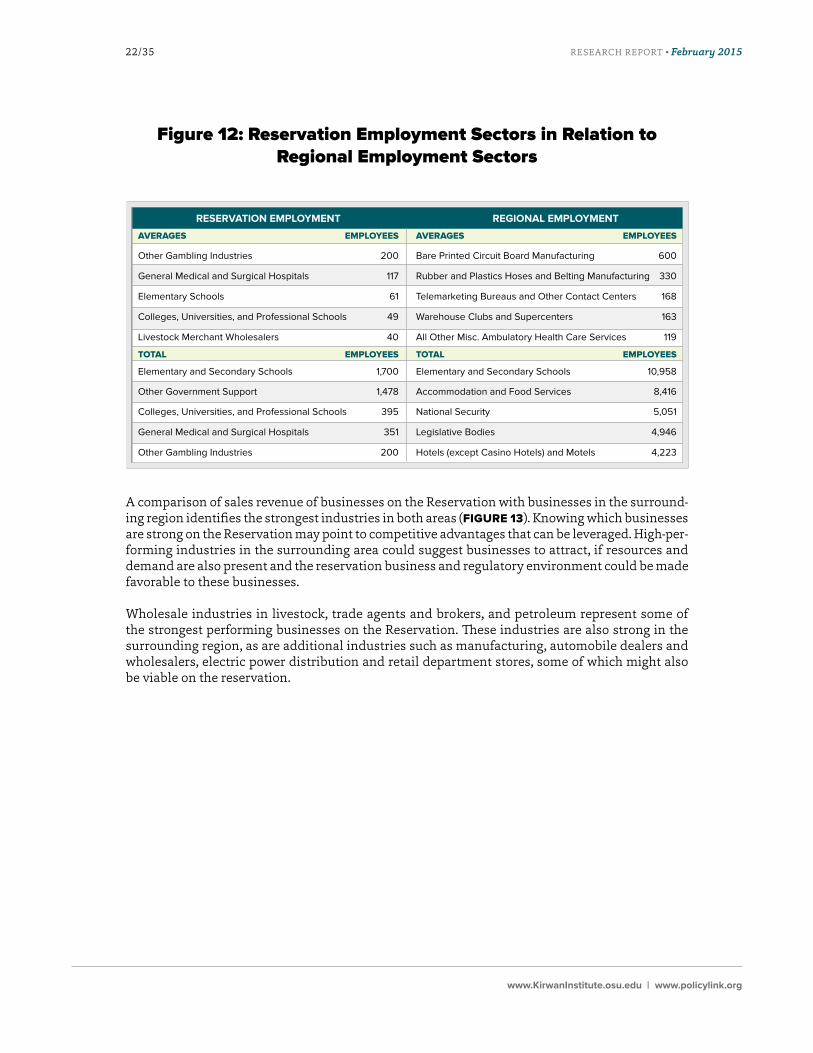
It is informative to compare the industry makeup of business and employment on the Reserva-tion and in the surrounding region. The largest employers on the Reservation are in public and institutional sectors such as education, government, and healthcare. The Prairie Winds Casino is also a large employer on the Reservation. The economy of the surrounding region is comparative-ly more diverse, having a variety of large employers in manufacturing, telecommunications, retail, food services, government, health care, and hospitality and accommodations. FIGURE 12 provides a comparison of the five largest employing industries, in terms of average and total employment, for the Reservation compared with the largest employers in the surrounding Region.
Figure 11: Pine Ridge Indian Reservation, Three County Industry Clusters
Table Courtesy of Purdue Center for Regional Development
Business and Finance
IT and Telecommunications
Energy (Fossil and Renewable)**
Biomed/Biotechnical
Manufacturing Supercluster
Advanced Materials
Defense and Security
Agribusiness and Food Processing
Transportation and Logistics
Arts, Entertainment, and Visitor Industries
Chemical and Chemical-based Industry
Transportation Equipment
Education and Knowledge Creation
Computer and Electronic Product
Printing and Publishing
Machinery Manufacturing
Forestry and Wood Products
Mining
Fabricated Metal
Apparel and Textiles
Electrical Equipment
Primary Metal
Glass and Ceramics
$100 $20 $30 $40 $50
Millions
$60 $70 $80 $90
Satisfied In Region
Satisfied Outside Region
Data Source: EMSI 2012.4, industry cluster definitions by PCRD
RESEARCH REPORT • February 201522/35
www.KirwanInstitute.osu.edu | www.policylink.org
Figure 12: Reservation Employment Sectors in Relation to Regional Employment Sectors
RESERVATION EMPLOYMENT REGIONAL EMPLOYMENT
AVERAGES EMPLOYEES AVERAGES EMPLOYEES
Other Gambling Industries 200 Bare Printed Circuit Board Manufacturing 600
General Medical and Surgical Hospitals 117 Rubber and Plastics Hoses and Belting Manufacturing 330
Elementary Schools 61 Telemarketing Bureaus and Other Contact Centers 168
Colleges, Universities, and Professional Schools 49 Warehouse Clubs and Supercenters 163
Livestock Merchant Wholesalers 40 All Other Misc. Ambulatory Health Care Services 119
TOTAL EMPLOYEES TOTAL EMPLOYEES
Elementary and Secondary Schools 1,700 Elementary and Secondary Schools 10,958
Other Government Support 1,478 Accommodation and Food Services 8,416
Colleges, Universities, and Professional Schools 395 National Security 5,051
General Medical and Surgical Hospitals 351 Legislative Bodies 4,946
Other Gambling Industries 200 Hotels (except Casino Hotels) and Motels 4,223
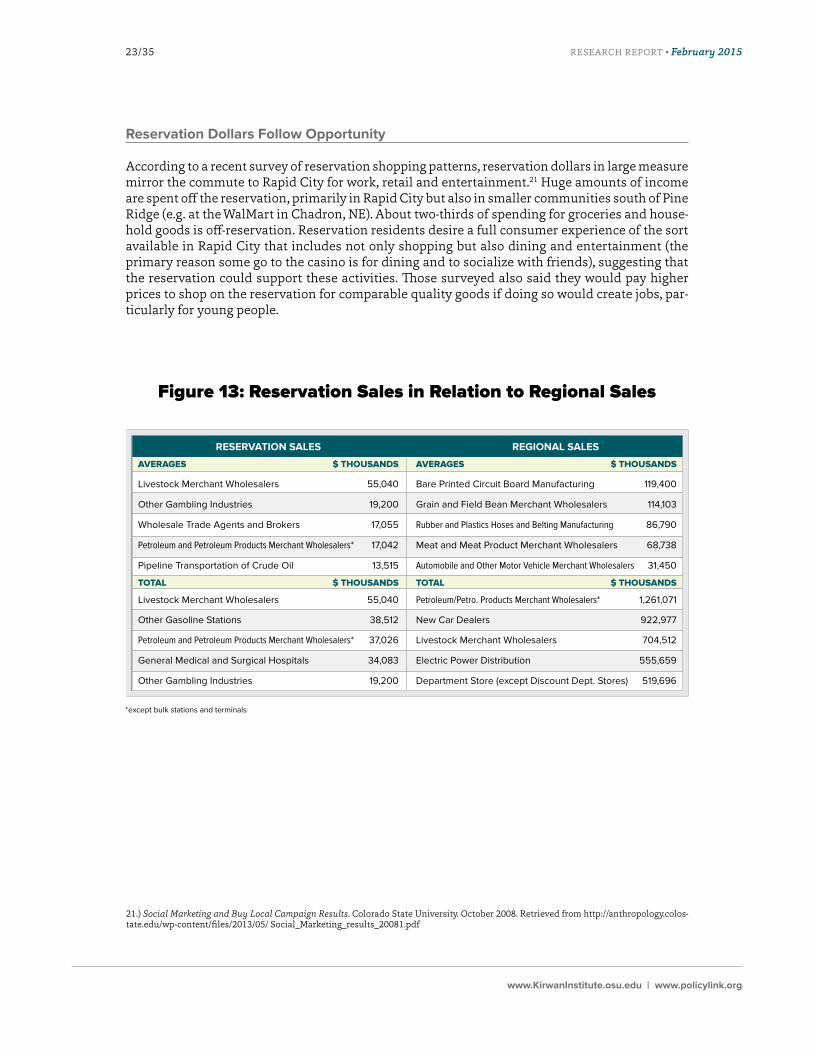
A comparison of sales revenue of businesses on the Reservation with businesses in the surround-ing region identifies the strongest industries in both areas (FIGURE 13). Knowing which businesses are strong on the Reservation may point to competitive advantages that can be leveraged. High-per-forming industries in the surrounding area could suggest businesses to attract, if resources and demand are also present and the reservation business and regulatory environment could be made favorable to these businesses.
Wholesale industries in livestock, trade agents and brokers, and petroleum represent some of the strongest performing businesses on the Reservation. These industries are also strong in the surrounding region, as are additional industries such as manufacturing, automobile dealers and wholesalers, electric power distribution and retail department stores, some of which might also be viable on the reservation.
RESEARCH REPORT • February 201523/35
www.KirwanInstitute.osu.edu | www.policylink.org
Reservation Dollars Follow Opportunity
According to a recent survey of reservation shopping patterns, reservation dollars in large measure mirror the commute to Rapid City for work, retail and entertainment.21 Huge amounts of income are spent off the reservation, primarily in Rapid City but also in smaller communities south of Pine Ridge (e.g. at the WalMart in Chadron, NE). About two-thirds of spending for groceries and house-hold goods is off-reservation. Reservation residents desire a full consumer experience of the sort available in Rapid City that includes not only shopping but also dining and entertainment (the primary reason some go to the casino is for dining and to socialize with friends), suggesting that the reservation could support these activities. Those surveyed also said they would pay higher prices to shop on the reservation for comparable quality goods if doing so would create jobs, par-ticularly for young people.
Figure 13: Reservation Sales in Relation to Regional Sales
RESERVATION SALES REGIONAL SALES
AVERAGES $ THOUSANDS AVERAGES $ THOUSANDS
Livestock Merchant Wholesalers 55,040 Bare Printed Circuit Board Manufacturing 119,400
Other Gambling Industries 19,200 Grain and Field Bean Merchant Wholesalers 114,103
Wholesale Trade Agents and Brokers 17,055 Rubber and Plastics Hoses and Belting Manufacturing 86,790
Petroleum and Petroleum Products Merchant Wholesalers* 17,042 Meat and Meat Product Merchant Wholesalers 68,738
Pipeline Transportation of Crude Oil 13,515 Automobile and Other Motor Vehicle Merchant Wholesalers 31,450
TOTAL $ THOUSANDS TOTAL $ THOUSANDS
Livestock Merchant Wholesalers 55,040 Petroleum/Petro. Products Merchant Wholesalers* 1,261,071
Other Gasoline Stations 38,512 New Car Dealers 922,977
Petroleum and Petroleum Products Merchant Wholesalers* 37,026 Livestock Merchant Wholesalers 704,512
General Medical and Surgical Hospitals 34,083 Electric Power Distribution 555,659
Other Gambling Industries 19,200 Department Store (except Discount Dept. Stores) 519,696
*except bulk stations and terminals
21.) Social Marketing and Buy Local Campaign Results. Colorado State University. October 2008. Retrieved from http://anthropology.colos-tate.edu/wp-content/files/2013/05/ Social_Marketing_results_20081.pdf
RESEARCH REPORT • February 201524/35
www.KirwanInstitute.osu.edu | www.policylink.org
Summary Findings
The data on worker commutes, employment, and industry performance reveal a few key factors for housing and economic development planning on the Reservation.
• Long commutes for reservation workers, for employment both off and on the reservation, mean increased travel costs to work for families already living on the margins and less time with family. More work opportunities on the Reservation could alleviate the com-muting burden for some families.
• The Reservation’s economy is less diverse than that of the surrounding region, making it more vulnerable and less sustainable.
• The distance/direction and industry commuting patterns suggest that the local labor force could support more local and diverse business ventures.
• A higher skilled Native American workforce could compete for jobs on the reservation that are currently held by non-Natives who commute onto the reservation for work. These higher skilled jobs would generate more revenue on the reservation and drive demand for goods and services, if adequate housing choices were made available to these workers.
• As more job opportunities are created on the Reservation, the demand for quality housing could be expected to increase as well.
• The Reservation could better support shopping, dining, and entertainment demand, as well as buying local, high-quality, products.
Economic Development Recommendations
Equity and opportunity will not be achieved in Indian communities if they are not compatible with Native values. For example, the Thunder Valley CDC community development plan foregrounds Native knowledge, culture and language, sharing, ecosystem protection, and support for vulnera-ble populations, including the elderly and youth.22 Economic development, land use planning, in-frastructure development, housing availability and affordability are critical, but they must align to contribute to a sustainable, supportive community.
The Pine Ridge Reservation can build on opportunities to improve the current economy and plan for sustainable, long-term economic development. Stakeholders can leverage local resources, in-cluding workforce, cultural identity, and natural resources (the latter, in sustainable and minimal-ly harmful ways). Efforts must focus on growing enterprises on the reservation to capture a larger share of Lakota spending within the tribal economy, and also support building cooperative and worker-owned companies as part of a community wealth-building strategies.
22.) Building a Regenerative Community. Thunder Valley Community, Pine Ridge Indian Reservation, South Dakota - Final Report July 15, 2013.
RESEARCH REPORT • February 201525/35
www.KirwanInstitute.osu.edu | www.policylink.org
This includes investments in:
Workforce development: The tribal anchor institutions (Oglala Sioux (Lakota) Tribe Housing Au-thority, Indian Health Service, and Public Schools) should collaborate with Oglala Lakota College (OLC) to train reservation youth for jobs currently being worked by off-reservation workers, partic-ularly in education, health care and government administration. The housing authority and non-profit housing developers could collaborate with OLC to create programs in applied science and trades on construction of housing and infrastructure. This partnership could also include Native construction firms to increase housing production and build capacity of the local workforce. The college also includes cultural awareness in its programming, not only to preserve Lakota culture but also to strengthen individual identity with the tribe and reservation. Building this identity helps to prevent “brain drain” from the reservation, encouraging graduates to stay and work for the benefit of the tribe. Reservation based non-profits and Oglala Lakota College need to continue to improve workforce development opportunities, so that local capacity is increased and jobs are created as more housing is developed.
Arts community: This industry is already in place on the reservation, but operates as a cottage industry, particularly for newer artists, who tend to lack dedicated studio space and business acumen. The arts community as a whole also lacks easy access to markets off the reservation, in-cluding Internet sales venues, that could provide fair pricing and greater profits for Pine Ridge artists. For example, artists who travel to Rapid City to sell their art must pay for gas, food and lodging, which lowers profit margins substantially. The arts industry on Pine Ridge could benefit from better organization of arts community resources and enhancement of its marketing and dis-tribution strategies.23 For example, the Thunder Valley model community development includes art spaces. These can be leveraged to enhance supply logistics and enable artists to benefit from one another’s marketing contacts and business experience.
Natural Resources & Tourism: The Oglala Sioux tribe will co-manage the South Unit of Badlands National Park and wishes to establish a tribal bison herd on the land, and possibly link to the South Unit bison herd buildup. Geographic location of the visitor center on the primary route from the interstate onto the reservation means it could serve as a “gateway” to Pine Ridge. The South Unit of Badlands National Park could become the first Tribal National Park—which is a tremendous opportunity, resulting in resources from federal sources that would be co-managed by the tribe. The first Tribal National Park represents an opportunity for tourism, cultural asset protection, and buffalo-based agricultural assets.
Access to capital and business training: Entrepreneurial success requires business acumen, mentors, capital, and investors willing to take a risk. While all have been historically lacking on Pine Ridge, the Lakota Fund plays a critical role in providing business training, access to credit and entrepreneurial coaching. A deeper analysis of key sectoral needs for reservation-based enter-prises can inform Lakota Funds, area banks, and philanthropic investments. Stakeholders should look to create a partnership with Lakota Funds, Mazaska Owecaso Otipi Financial, and OST Part-nership for Housing for workers on the reservation and for OLC students in training for reserva-tion-based jobs to receive housing finance counseling to prepare for reservation housing purchase. Lakota Federal Credit Union capacity needs to be expanded to grow its lending portfolio. Mazaska Owecaso Otipi Financial is a CDFI offering mortgages, but needs stronger ties to the secondary market for selling loans, so that more loans can be made.
23.) Establishing a Creative Economy: Art as an Economic Engine in Native Communities. First People’s Fund, Rapid City, SD, July 2013
RESEARCH REPORT • February 201526/35
www.KirwanInstitute.osu.edu | www.policylink.org
Housing construction: Encourage tribal college collaborations and other opportunities to provide vocational training in construction, leveraging opportunities in meeting reservation housing needs, North Dakota oil industry-driven housing demand, and Rapid City growth. This can provide living wages for reservation residents and build up the reservation workforce. Encourage development of housing-related manufacturing to bring more construction industry jobs onto the reservation, to meet reservation needs and also to potentially market construction products off-reservation.
Investing in housing construction meets the immediate need for housing and provides an oppor-tunity to train a sustainable workforce that would continue to build up the reservation’s housing stock. Currently, an innovative partnership between Oglala Lakota College Oglala Sioux College and Colorado State has students collaborating on novel, renewable indigenous housing designs. The building boom in North Dakota (linked to extraction from the Bakken oil shale reserve) could also provide a timely training ground for Native construction workers.
Manufacturing: Explore housing manufacturing models that could be viable on the reservation. Although in a different industry, the Tanka Bar plant provides a model for successful manufactur-ing and social entrepreneurship on the reservation. Tanka Bar leverages cultural identity (depen-dence on the buffalo, a Lakota recipe in its flagship product) with savvy social-networking market-ing and employment practices that “give back.” Manufacturing coupled with education presents a multigenerational approach to building the tribal workforce. Research suggests that when reser-vations have natural resources, those can fuel the tribal economy (e.g., timber, mining, and hydro-electricity have been sustainable on reservations that have those resources). When natural resourc-es are lacking, manufacturing is the only industry that showed any promise of providing revenue (though even manufacturing was insufficient, by itself, to sustain most reservations). Manufac-turing coupled with education results in a trained workforce that is able to make manufacturing viable—along the same lines that educating folks to work in casinos helps to bolster that industry.
Renewable energy: Invest in user-, community-, and utility-scale wind, solar, and/or geothermal energy. Wind presents an especially attractive option. South Dakota is one of the windiest states in the country, producing more wind energy than almost any other state.24 Indian Country already has this on their radar, having created a multi-tribe consortium to explore wind development. The Thunder Valley CDC includes renewables in its model community. Renewables also reflect tradi-tional values of linkage to the land and respect for it (as compared to uranium mining, oil and gas operations that often leave native lands polluted and uninhabitable). Considerations for wind and other renewable include:
• Land leasing, including turbine siting on agricultural lands (dual use)
• Maintaining an attractive viewshed (avoid impinging on the view near tourist areas, for example, by placement of turbines or solar arrays)
• Leasing of transmission lines, to sell back to the grid from either community- or utili-ty-scale production
• Training of reservation workers (e.g., in East LA a pilot program found that homeowners benefit from solar power by selling back excess generation, and that installers gain train-ing in an up-and-coming industry).
24.) South Dakota Wind Energy Association. http://www.sdwind.org/
RESEARCH REPORT • February 201527/35
www.KirwanInstitute.osu.edu | www.policylink.org
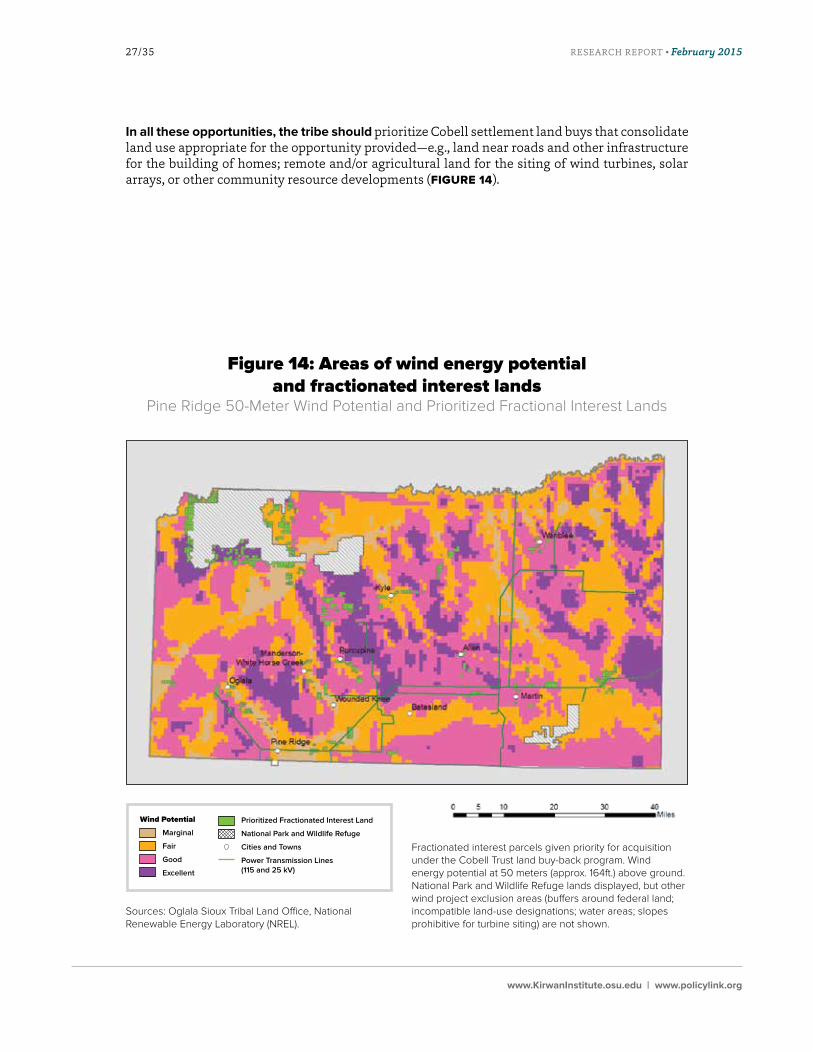
In all these opportunities, the tribe should prioritize Cobell settlement land buys that consolidate land use appropriate for the opportunity provided—e.g., land near roads and other infrastructure for the building of homes; remote and/or agricultural land for the siting of wind turbines, solar arrays, or other community resource developments (FIGURE 14).
Figure 14: Areas of wind energy potential and fractionated interest lands
Figure 14: Areas of wind energy potential and fractionated interest lands
Pine Ridge 50-Meter Wind Potential and Prioritized Fractional Interest Lands
Sources: Oglala Sioux Tribal Land Office, National Renewable Energy Laboratory (NREL).
Wind Potential
Marginal
Fair
Good
Excellent
Prioritized Fractionated Interest Land
National Park and Wildlife Refuge
Cities and Towns
Power Transmission Lines (115 and 25 kV)
Fractionated interest parcels given priority for acquisition under the Cobell Trust land buy-back program. Wind energy potential at 50 meters (approx. 164ft.) above ground. National Park and Wildlife Refuge lands displayed, but other wind project exclusion areas (buffers around federal land; incompatible land-use designations; water areas; slopes prohibitive for turbine siting) are not shown.
RESEARCH REPORT • February 201528/35
www.KirwanInstitute.osu.edu | www.policylink.org
Conclusion: Call to Action
T he Oyate Ominicye Plan and this complementary Pine Ridge Equity and Opportunity Assessment reflect the imperative for urgent and strategic focus. The tasks before stakeholders working to
strengthen the Pine Ridge tribal economy include:
• Grounding a system of housing finance and development to address the immediate, extreme housing crisis, including (1) enabling Lakota households to purchase or rent quality homes on the reservation, (2) encouraging housing developers to build quality housing developments across the reservation, and (3) ensuring that the local workforce participates in the housing development process.
• Assembling land parcels in ways that can support infrastructure investment to serve the quality development of housing and other community amenities. This can be achieved by targeting available funding for land purchasing strategies, streamlining and strength-ening lease processes to do housing development on trust lands, and doing acquisitions of fee simple lands.
• Developing a system of infrastructure finance that can serve new and existing commu-nity development. Strengthen and streamline reservation leasing processes so that tribal and trust lands can be accessed more easily. Consider a potential trust fund from the po-tential increased lease revenue related to the Cobell settlement.
• Aligning education, workforce development and reservation job sectors to grow the share of Lakota workers filling reservation-based jobs, thus creating a market for higher quality housing choices.
• Growing enterprises on the reservation to capture a larger share of Lakota spending within the tribal economy and to support building cooperative and worker-owned compa-nies as part of a community wealth-building strategy. Despite tremendous entrepreneur-ial potential, barriers to economic opportunity, such as land access, infrastructure limita-tions, and financing challenges stifle entrepreneurism on reservation.
• Attracting on- and off-reservation investments and consumer and tourist spending in reservation enterprises.
• Building innovative, collaborative, mutually enhancing relationships between the res-ervation and the larger region.
While many tribal agencies and associated institutions and nonprofits are already making headway on these efforts, state and federal agencies, regional businesses, regional financial institutions, and metropolitan planning organizations should also contribute their resources and talent to solving these challenges. Creative capital, development, and educational partnerships are needed to build bridges from the local resources to broader pools of investment capital.
RESEARCH REPORT • February 201529/35
www.KirwanInstitute.osu.edu | www.policylink.org
APPENDIX A
History of US Land Policy on Tribal Lands Impacts Current Opportunity Structures
“We must together recognize that there is an assault on our spirit.” – Oyate Omniciye/Oglala Lakota Plan
T he General Allotment Act of 1866, or the “Dawes Act,” granted the U.S. President the authority to allot, or divide and assign title to, individual parcels of land on reservations to Native Amer-
icans, who were then granted U.S. citizenship. At the time of the Dawes Act, many Indian tribes still practiced communal land stewardship, and their cultural, religious, and family structure re-volved around communal ownership. Therefore, allotment was a powerful means of attempting to forcibly alter the social and economic relationships of an already isolated and disenfranchised people. Between 1887 and 1934, Native Americans lost 90 million acres of land due to sales of “surplus” lands to white settlers.
Federal agents perceived the communal ownership of land and an extended, matrilineal, nomadic family structure as chaotic, resulting in the “improper” use of land. White “reformers” were especial-ly troubled by the lack of connection between marriage and land title, and the lack of patriarchal, inter-generational land transfer. The Eurocentric characterization of the reservation as a “failing” economic system, one in which there was no individual economic incentive, did not match the Native representation of a functioning economic system that made it a priority to protect the poor. Allotment and fixed housing was also intended to end the communal, mobile Native cultures of agriculture, hunting and war. The Dawes Act also provided an opening for federal agents to inter-vene into Native family life with, for example, a hunting ban to enforce allotment and the issuance of livestock shares to Indians who complied with White marriage practices.
The Dawes Act had important consequences for Native American territories and economies. In response to the extreme fractionation, and thus unprofitable and inefficient use of allotted land, Congress passed the Indian Land Consolidation Act (“ILCA”) in 1983. However, the U.S. Supreme Court has twice rejected it as an unconstitutional Fifth Amendment taking. Despite recent devel-opments, including the Indian Land Consolidation Program and the Cobell Settlement, tribes and the federal government are still struggling with the multiple legacies of forced allotment.
The unjust taking of Native land was part of a larger strategy to destroy a people. Therefore, land restitution and housing and community development needs to occur with the parallel intent of restoring a people. A restored Native society, economy and ecology can be the basis of sustainable, robust, diverse cultural and economic growth. New paradigms of community investment must continue to be explored both on and off reservations.
RESEARCH REPORT • February 201530/35
www.KirwanInstitute.osu.edu | www.policylink.org
APPENDIX B
1. Notes on Population Estimates in Figure 1.
Census (Census 2010: 18,834; ACS 2007-2011: 18,825): The US Census routinely undercounts the poor and people of color while overcounting non-Hispanic Whites. Evidence from surveys and administrative records (below) strongly suggests that both the decennial census and the Amer-ican Community Survey (ACS) significantly undercounted the Pine Ridge population. However, assuming that the undercount is systematic (i.e., it results from deficiencies in the collection of the data due to a variety of factors, which it affect not only the population count but also the other data collected through the ACS on household demographics, conditions, occupancy, etc.), derived statistics like percentages and ratios on the reservation should be reliable.
Bureau of Indian Affairs American Indian Population and Labor Force Report, 2005. (2005: Tribal Enrollment, 43,146) This report includes figures for “Tribal Enrollment” and “Eligible for Services.” BIA services are available only to enrolled tribal members who reside on or near reser-vations, and so, according to the BIA, these two numbers should be different. BIA raises a caution-ary flag if the “enrolled” and “eligible” numbers are the same, and this is the case for the population cited for Pine Ridge. Therefore, the 2005 report cannot be relied upon as an accurate representation of Pine Ridge population. (Note that The Bureau of Indian Affairs is required to issue a report of population and labor force statistics for Indian Country “no less than biennially.” The report draws from tribally compiled data reported on a BIA census form. BIA issued reports for data compiled in 1982, 1985 and then every two years until 2005. No reports have been issued since, including the latest for 2010 data, which was to have been issued in 2012. BIA chose not to release the report, citing problems “rooted in the survey methodology.”
Administrative records: Not available to us from either the tribe or the state. However, at least one study using census data and administrative records from the Indian Health Services places the Pine Ridge population at “about 50,000.”(Benson et al., 2011)
Kathleen Pickering, Pine Ridge Work Force Study (July 2005): 24,614 to 32,710. HUD: 28,787.
Indian Housing Block Grant Formula Data, 2014: The Department of Housing and Urban Devel-opment (HUD) derives their population figures for formula grant calculations from Census Bureau base-year data adjusted through what could be described as a modified “components of growth” model (“modified”, because it uses Indian Health Service projections based upon birth and death rate data but apparently does not explicitly include in- and out-migration). HUD accepts challenges to the data used in calculating their population figures. Tribal authorities may challenge the base year Census data or any of the components of population change. The Oglala Sioux challenged the census base year on the basis of the Sherman survey data, resulting, with annual percentage adjustments, in the 2014 formula figure.
RESEARCH REPORT • February 201531/35
www.KirwanInstitute.osu.edu | www.policylink.org
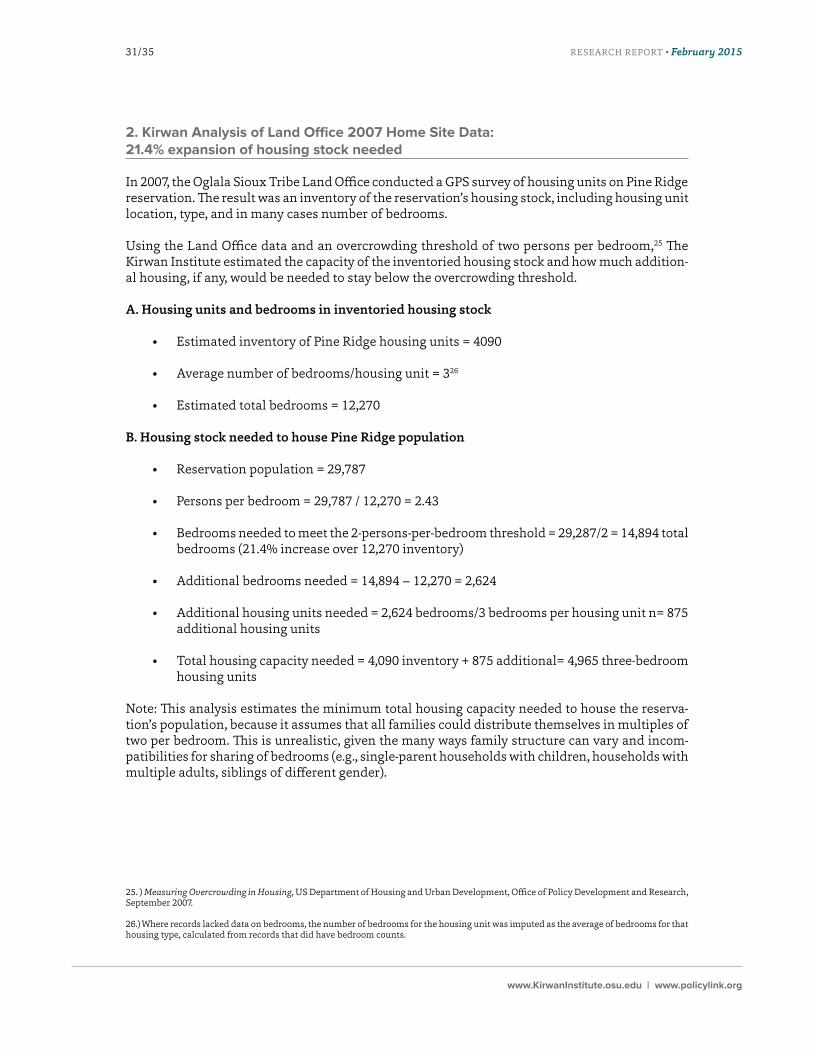
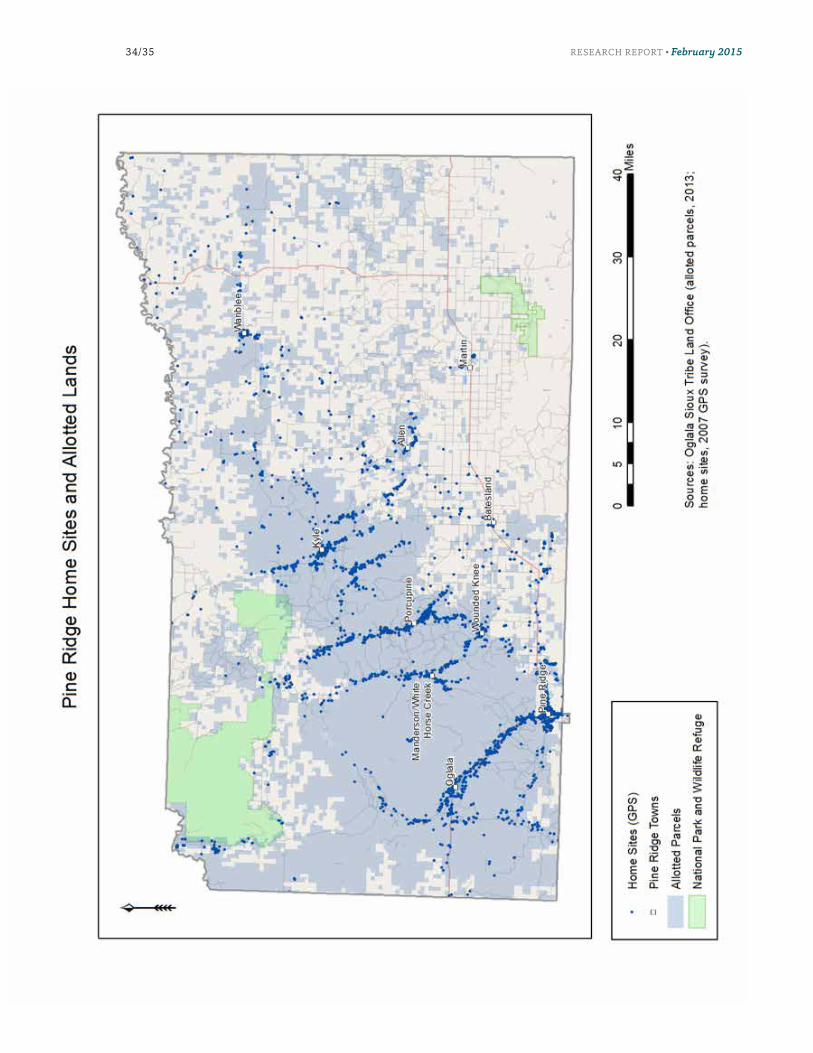
2. Kirwan Analysis of Land Office 2007 Home Site Data: 21.4% expansion of housing stock needed
In 2007, the Oglala Sioux Tribe Land Office conducted a GPS survey of housing units on Pine Ridge reservation. The result was an inventory of the reservation’s housing stock, including housing unit location, type, and in many cases number of bedrooms.
Using the Land Office data and an overcrowding threshold of two persons per bedroom,25 The Kirwan Institute estimated the capacity of the inventoried housing stock and how much addition-al housing, if any, would be needed to stay below the overcrowding threshold.
A. Housing units and bedrooms in inventoried housing stock
• Estimated inventory of Pine Ridge housing units = 4090
• Average number of bedrooms/housing unit = 326
• Estimated total bedrooms = 12,270
B. Housing stock needed to house Pine Ridge population
• Reservation population = 29,787
• Persons per bedroom = 29,787 / 12,270 = 2.43
• Bedrooms needed to meet the 2-persons-per-bedroom threshold = 29,287/2 = 14,894 total bedrooms (21.4% increase over 12,270 inventory)
• Additional bedrooms needed = 14,894 – 12,270 = 2,624
• Additional housing units needed = 2,624 bedrooms/3 bedrooms per housing unit n= 875 additional housing units
• Total housing capacity needed = 4,090 inventory + 875 additional= 4,965 three-bedroom housing units
Note: This analysis estimates the minimum total housing capacity needed to house the reserva-tion’s population, because it assumes that all families could distribute themselves in multiples of two per bedroom. This is unrealistic, given the many ways family structure can vary and incom-patibilities for sharing of bedrooms (e.g., single-parent households with children, households with multiple adults, siblings of different gender).
25. ) Measuring Overcrowding in Housing, US Department of Housing and Urban Development, Office of Policy Development and Research, September 2007.
26.) Where records lacked data on bedrooms, the number of bedrooms for the housing unit was imputed as the average of bedrooms for that housing type, calculated from records that did have bedroom counts.
RESEARCH REPORT • February 201532/35
www.KirwanInstitute.osu.edu | www.policylink.org
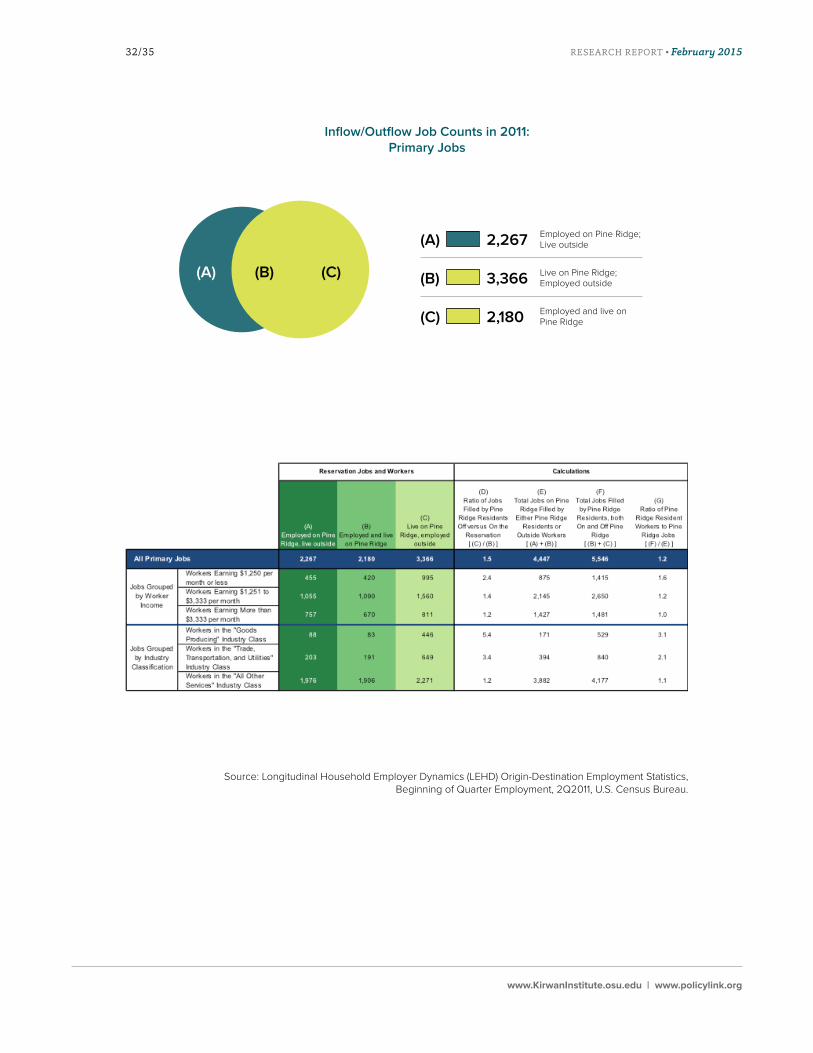
Source: Longitudinal Household Employer Dynamics (LEHD) Origin-Destination Employment Statistics, Beginning of Quarter Employment, 2Q2011, U.S. Census Bureau.
Inflow/Outflow Job Counts in 2011: Primary Jobs
2,267(A)
(B)
(C)
(C) 3,366
2,180
Employed on Pine Ridge; Live outside
Live on Pine Ridge; Employed outside
Employed and live on Pine Ridge
(A) (B)
RESEARCH REPORT • February 201533/35
www.KirwanInstitute.osu.edu | www.policylink.org
RESEARCH REPORT • February 201534/35
www.KirwanInstitute.osu.edu | www.policylink.org
For More InformationThe Kirwan Institute for the Study of Race and Ethnicity at The Ohio State University is known and respected nationally and deeply engaged in social issues. We are focused on projects that are integrated with sound research, strategic communication, and advocacy.
As a university-wide, interdisciplinary research institute, the Kirwan Institute works to deepen understanding of the causes of—and solutions to—racial and ethnic disparities worldwide and to bring about a society that is fair and just for all people.
Kirwan Institute research is designed to be actively used to solve problems in society. Its research and staff expertise are shared through an extensive network of colleagues and partners—ranging from other researchers, grassroots social justice advocates, policymakers, and community leaders nationally and globally, who can quickly put ideas into action.
The Ohio State University33 West 11th Avenue Columbus, Ohio 43201
Phone: (614) 688-5429Fax: (614) 688-5592www.KirwanInstitute.osu.edu
PolicyLink1438 Webster Street, Suite 303 Oakland, CA 94612
Phone: (510) 663 2333 Fax: (510) 663 9684 www. policylink.org
PolicyLink is a national research and action institute advancing economic and social equity by Lifting Up What Works®.