Embed Size (px)
Citation preview
MONETARY POLICY STATEMENT
STRENGTHENING THE MULTI-CURRENCY SYSTEM
FOR VALUE PRESERVATION & PRICE STABILITY
01 OCTOBER 2018

2
TABLE OF CONTENTS
SECTION 1: EXECTIVE SUMMARY. ................................................................................3
SECTION 2: ............................................................................................................................6
SECTION 3: CONCLUSION...............................................................................................13
ANNEXURE
SECTION 1: GLOBAL AND REGIONAL ECONOMIC DEVELOPMENTS ..............16
SECTION 2: DOMESTIC ECONOMIC DEVELOPMENTS ..........................................19
SECTION 3: MONETARY AND INFLATION DEVELOPMENTS...............................29
SECTION 4: FINANCIAL SECTOR DEVELOPMENTS ..............................................35
SECTION 5: DEVELOPMENTS ON NATIONAL PAYMENTS SYSTEM .................53

3
SECTION 1: EXECUTIVE SUMMARY
This Monetary Policy Statement is issued in terms of Section 46 of the Reserve Bank
of Zimbabwe Act [Chapter 22:15], which requires the Governor of the Reserve Bank to
produce a Statement of Monetary Policy giving an account of the monetary policy
measures pursued in the preceding six months and the new measures to be pursued in
the subsequent six months’ period. The Monetary Policy Statement thus gives the Bank
an opportunity to reflect on its past achievements and the basis to further fine-tune the
financial system in order to achieve the Bank’s mandate of maintaining price and
financial stability which is the bedrock for economic development.
The Statement comes at a time when the economy is expanding on account of high
consumer demand, increased business confidence within the national economy and
positive expectations following the peaceful completion of the electoral process and the
subsequent formation of a new lean cabinet led by His Excellency, President E. D.
Mnangagwa. The country showed strong resilience to adverse inflationary pressures
and speculative tendencies which characterized the run-up to the harmonized election
period. Moreover, the economy has also been resilient to the negative effects of
escalating foreign currency premiums, which have been a key driver of inflationary
pressures.
Developments during the first half of 2018 were encouraging. We are optimistic that
the economy will surpass the initial growth projection of 4.5%, and register growth of
around 5% this year. This optimism is underpinned by better-than-anticipated
performance across the key sectors of the economy, in particular agriculture, mining,
tourism and manufacturing during the first six months of the year. In agriculture,
tobacco outperformed initial projections to record output of 250 million kilograms in
2018. This is the highest tobacco output ever produced in Zimbabwe. This compensated
for the expected lower maize output due to poor rainfall patterns at the beginning of the
rainy season. In the first half of 2018, there was also significant growth realized in
respect of gold, platinum, chrome and coal, among other key minerals. The good

4
performance in agriculture and mining is expected to result in spillover effects in other
sectors of the economy, such as manufacturing, distribution and services, thus
cumulatively resulting in expanded national output in 2018.
The Bank has continued to work on efforts to improve the foreign currency situation
currently bedeviling the economy, while at the same time keeping in check the adverse
inflationary expectations emanating from the parallel market activities and multiple
pricing mechanisms which are a result of deep seated disparities within the economy.
The Reserve Bank has been working on supply-side measures to address some of the
disparities through the nostro stabilisation facilities, which saw some improvement in
the foreign currency situation in the economy. Demand pressures attributable to fiscal
imbalances have, however, continued to increase the supply of money within the
economy, thereby eroding the gains and putting too much pressure on prices and the
foreign currency market as evidenced by the thriving parallel market rates. Despite
these pressures, the Bank expects inflation to remain within the SADC healthy inflation
benchmark of not exceeding 7%.
The Bank is also encouraged by the quantum leap in the usage of plastic money,
electronic and mobile money payment systems, by the Zimbabwean public.
Specifically, the Bank’s plastic money policy thrust has been a resounding success as
shown by the unprecedented increases in value, volume, devices and access points,
which has seen the usage levels rising to above 95 percent of retail transactions - now
one of the highest in the region. Government will continue to invest heavily in
expanding the electronic payment infrastructure, as the economy continues to move
towards a cash-lite society.
The positive expectations under the new Administration provide an antidote for
anchoring the adverse inflationary expectations and negative investor perceptions,
which had characterized the economy in the past years in undermining the economy’s
growth potential. Indeed, the country is witnessing a paradigm shift both on the
economic policy and political fronts, which is critical in breathing a new growth impetus

5
to the economy. The package of reforms that have been put in place by Government
since November last year provides a strong springboard upon which the economy is
showing great signs of sustained recovery. Accordingly, this Monetary Policy
Statement seeks to cement these reforms, by putting in place measures to strengthen the
multi-currency system in order to safeguard financial and price stability which is
important for sustainable economic growth envisaged in Vision 2030 of becoming a
middle income country with a per capita income of US$3500 that equates to a Gross
Domestic Product (GDP) of around US$65 billion. Strengthening the multi-currency
system is also critical as the economic pre-requisites to contemplate currency reforms
are not yet in place.
It is against this background that the Bank shall continue with its supply-side efforts,
aimed primarily at increasing the productive capacity of the economy and foreign
currency generation, while continuing to advocate for the reduction of fiscal imbalances
as a panacea for right sizing or rebalancing the economy. Measures in this Monetary
Policy Statement would therefore need to be supported by a package of measures to
reduce fiscal imbalances that are exerting pressure on money supply and hence inflation
as a result of increased consumer spending which in turn requires increased foreign
currency inflows. The country needs to live within its means.
6
SECTION 2: POLICY MEASURES
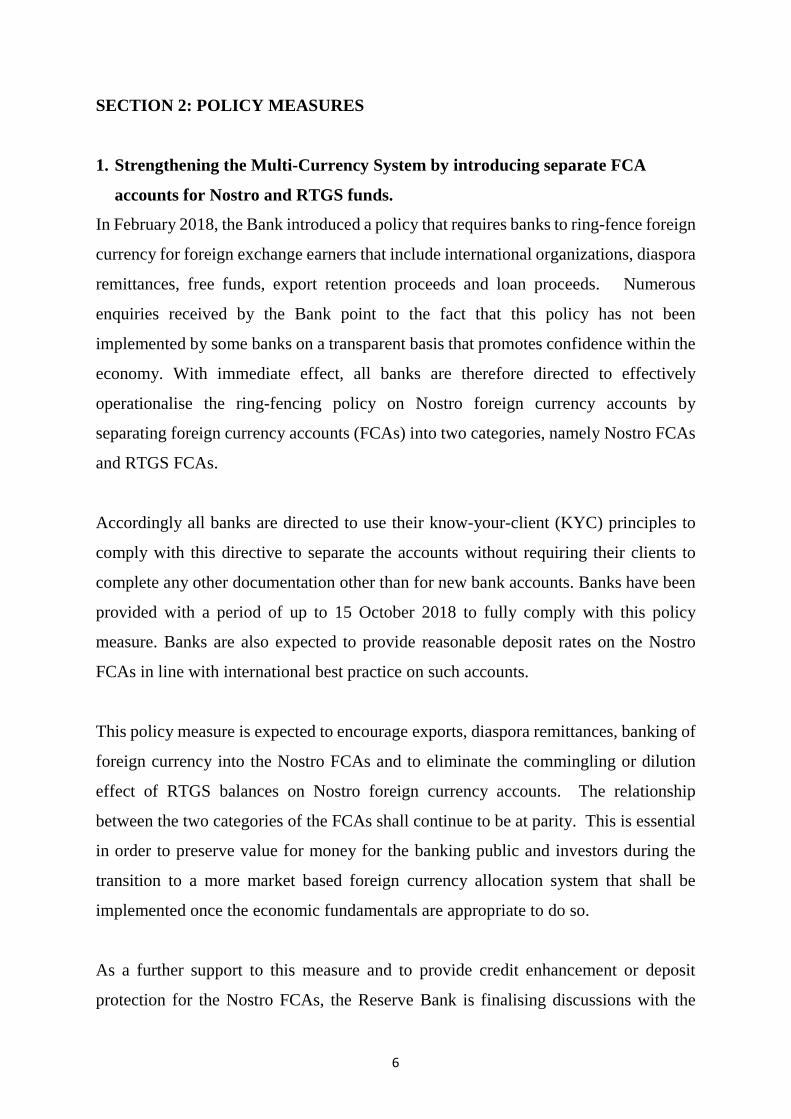
1. Strengthening the Multi-Currency System by introducing separate FCA
accounts for Nostro and RTGS funds.
In February 2018, the Bank introduced a policy that requires banks to ring-fence foreign
currency for foreign exchange earners that include international organizations, diaspora
remittances, free funds, export retention proceeds and loan proceeds. Numerous
enquiries received by the Bank point to the fact that this policy has not been
implemented by some banks on a transparent basis that promotes confidence within the
economy. With immediate effect, all banks are therefore directed to effectively
operationalise the ring-fencing policy on Nostro foreign currency accounts by
separating foreign currency accounts (FCAs) into two categories, namely Nostro FCAs
and RTGS FCAs.
Accordingly all banks are directed to use their know-your-client (KYC) principles to
comply with this directive to separate the accounts without requiring their clients to
complete any other documentation other than for new bank accounts. Banks have been
provided with a period of up to 15 October 2018 to fully comply with this policy
measure. Banks are also expected to provide reasonable deposit rates on the Nostro
FCAs in line with international best practice on such accounts.
This policy measure is expected to encourage exports, diaspora remittances, banking of
foreign currency into the Nostro FCAs and to eliminate the commingling or dilution
effect of RTGS balances on Nostro foreign currency accounts. The relationship
between the two categories of the FCAs shall continue to be at parity. This is essential
in order to preserve value for money for the banking public and investors during the
transition to a more market based foreign currency allocation system that shall be
implemented once the economic fundamentals are appropriate to do so.
As a further support to this measure and to provide credit enhancement or deposit
protection for the Nostro FCAs, the Reserve Bank is finalising discussions with the

7
African Export-Import Bank (Afreximbank) towards a US$500 million Nostro
Stabilisation Guarantee Facility (NSGF) to provide Nostro FCA holders with assurance
that foreign currency shall be available when required by the account holders. The
NSGF which will be similar to the AFTRADES Facility that guarantees interbank
trading in Zimbabwe is targeted to be in place by the end of October 2018.
For the avoidance of doubt, foreign currency in the Nostro FCAs pertains to free funds,
diaspora remittances, international organisations’ remittances, portfolio investment
inflows, loan proceeds and export retention proceeds. It is also essential to note that all
exporters retain 100% of their export proceeds with the exception of gold producers that
retain 30% of export proceeds; platinum, diamonds and chrome 35% and; 20% for
tobacco and cotton producers.
2. Credit Lines for Strategic Requirements
The Bank has finalised putting in place facilities in an amount of US$500 million to
cater for importation of strategic requirements that include fuel, electricity, cooking oil,
wheat, packaging, etc. The facilities are from Gemcorp US$250 million, Afreximbank
US$150 million and Afrigrain US$100 million. These facilities are over and above the
US$100 million from CDC/Standard Chartered Bank, US$100 million from Ecobank,
US$30 million from IDC of South Africa to Agribank and US$25 million from the
African Development Bank (AfDB) to CABS Building Society.
The Bank is also negotiating with a number of international financial institutions for
medium to long term financial facilities that are needed to continue to bring sanity in
the foreign exchange market and to assist in the sustainable recovery of the economy.
This is in addition to the external resource mobilisation programme being vigorously
pursued by Monetary Authorities to clear the country’s external debt arrears to various
creditors.

8
3. Foreign Payment Transactions.
In order to minimize incidents of externalization of foreign currency, the following
measures, which are in line with international best practice, have been put in place for
banks and the banking public to adhere to:-
(i) Use of Letters of Credit (LCs) for high value transactions.
(ii) All imports to be supported by invoices whose banking details match with
the payee’s name and bank account details.
(iii) Strict adherence by banks to customer due diligence (CDD).
(iv) Export proceeds to be remitted on a timely basis in line with existing rules
and regulations.
4. Purchase of Fuel in Zimbabwe by Foreign Truckers in Foreign Currency
It has come to the attention of the Bank that foreign truckers plying the Zimbabwean
routes are involved in foreign currency arbitrage activities in Zimbabwe by trading in
the parallel market of foreign currency and purchasing fuel in Zimbabwe at the official
rate of exchange. In order to deal with this rent seeking behaviour, with immediate
effect, all foreign truckers plying the Zimbabwean routes shall pay for their fuel in
Zimbabwe in foreign currency.
The same shall apply to foreign traders buying goods in Zimbabwe for sale in the
neighbouring countries.
5. Purchase of Gold by Jewelers in Foreign Currency.
The current policy provides that where a jeweler purchases gold from Fidelity Printers
and Refiners (FPR) using RTGS funds, upon export of the jewelry, the jeweler retains
35% of the gross export value for own use. The 65% balance is transferred to the
Reserve Bank Nostro account for national requirements.
In order to mitigate against arbitrage opportunities or abuse of this facility, with
immediate effect, all purchases of gold by Jewelers from FPR shall be in foreign
currency and that Jewelers shall retain 100% of their export proceeds.

9
6. Settlement of Capital Gains Tax in Foreign Currency when using Offshore
Funds.
In February 2018, the Bank introduced a policy that allows individuals, with
justification, to sell their immovable properties to buyers using offshore funds and, in
some instances, to retain the sale proceeds offshore provided prior Reserve Bank
approval is obtained. The policy has been well received by the real estate sector and the
Bank wishes to enhance the efficacy of this policy by ensuring that all sellers of
immovable property to buyers with offshore funds are required to pay Capital Gains
Tax from offshore sources into a ZIMRA Designated Nostro FCA. Evidence of
payment shall be required during ZIMRA interviews to enable issuance of tax clearance
certificate.
7. Cross Border Investment and Offshore Capital Raising Initiatives.
The Reserve Bank fully supports the presence of local businesses in the region and
across the globe for purposes of expanding markets and raising funds to support local
operations.
In order for the country to derive maximum benefits from offshore investments
undertaken by local entities, going forward, all offshore investments in the form of
offshore holding companies intending to dispose of part of their shares to foreign
investors shall be required to repatriate all the realized proceeds to Zimbabwe. In cases
where the offshore holding company intends to expand into other countries, a minimum
portion of raised capital equal to the level of dilution should be remitted to Zimbabwe
to support local operations.
8. Introduction of Statutory Reserve Requirement to mop up excess liquidity
Given the increased creation of money within the economy mainly as a result of fiscal
imbalances, the Bank shall be introducing the statutory reserves requirement with effect
from 1 November 2018 at a level of 5% on RTGS FCAs on a weekly compliance basis
in order to mop up excess liquidity from the market.

10
The AFTRADES window shall remain in place as a lender of last resort facility to cater
for financial institutions that require accommodation.
The Table below shows the statutory reserve requirement levels for some of the
countries in the region and beyond for comparison purposes.
Statutory Reserve Percentages for Selected Countries
Southern African Countries Reserve Ratio (%)
Angola 19.00
Malawi 15.50
Mauritius 9.00
Mozambique 15.00
Tanzania 8.00
Zambia 5.00
South Africa 2.50
Egypt 14.00
Ghana 10.00
Nigeria 22.50
Euro Zone 1.00
China 15.50
United States of America 3.00
9. Issuance of Treasury Bills (TBs) Through an Auction System.

11
In order to promote transparency in the issuance of TBs, with effect from 1 November
2018, the Bank shall be inviting tenders on behalf of Government, for investors to
participate in the auction system of TBs.
10. Continuation of RBZ Savings Bonds
The Bank shall continue to use Savings Bonds for mopping up excess liquidity from
the market. As at 31 August 2018 the Savings Bonds had raised $1.5 billion.
11. Construction Finance Facility.
The Reserve Bank has expanded the productive sector facilities to include the
establishment of a $50 million Construction Finance Facility for retooling and working
capital requirements for the construction industry in line with the growing economy.
This facility, like all other facilities, shall be disbursed through normal banking channels
with an all-inclusive interest rate of 10%.
12. Strengthening the Monetary Policy Committee
The Bank is in the process of strengthening the Monetary Policy Committee (MPC) to
provide an effective process for Monetary Policy in line with best practice.
13. Capitalisation of Banking Institutions
As the capital deadline approaches, banking institutions are required to revisit their
respective capitalisation plans to ensure compliance with their preferred strategic tier
capital requirements on the set date, and submit revised plans to the Reserve Bank by
30 June 2019. For the avoidance of doubt, the following minimum capital requirements
shall apply with effect from January 2020:

12
Minimum Capital Requirements
Segment
s
Type of Institution Capital Requirements Activities
Current Proposed
Tier I Large Indigenous
Commercial banks & all
foreign-owned banks
$25 million $100
million
Core banking activities
plus additional services
such as mortgage lending,
leasing & hire purchase.
Tier II Commercial banks,
Merchant banks,
Building societies,
Development banks,
Finance & Discount
houses
$25 million $25
million
Core banking activities
only
Tier III Deposit-taking
Microfinance banks
$5 million $7.5
million
Deposit-taking
Microfinance activities
Tier IV Credit-only MFIs $20,000 $50,000 Credit-only microfinance
business

13
SECTION 3: CONCLUSION
The policy measures proffered in this Statement are designed to boost confidence and
transparency in the foreign currency market and to rein in inflation by mitigating against
rent seeking behaviour and mopping up excess liquidity within the economy. The
measures are necessary as a starting point towards right sizing or rebalancing the
economy. Rebalancing the economy requires tough and painful measures to deal with
the root causes of the economic challenges facing the Zimbabwean economy. A
package of measures that includes reducing fiscal imbalances to manage high consumer
spending; increasing productivity and exports; fast-tracking the State Owned
Enterprises reform programme and enhancing access to foreign finance are the most
critical policy measures that are required to right sizing the economy. Currency reforms
without the implementation of these tough but necessary measures will be tantamount
to putting the cart before the horse which will produce undesirable unintended
consequences.
The Bank is therefore pleased that these monetary policy measures are coming at a time
when Government has made it a priority to deal with fiscal imbalances that continue to
put pressure on inflation, the financial sector and the foreign currency market.
Commitment by Government to deal with the adverse effects of fiscal deficit on the
economy is critical to contain the significant mismatches between the electronic money
balances and foreign currency reserves. This is quite urgent and essential because the
genesis of money creation and pressure on the currency is fiscal. Money creation is not
caused by mediums of exchange that include mobile banking platforms (Ecocash,
OneMoney, Telecash), internet banking, RTGS or bond notes. Mediums of exchange
are used to facilitate trade of goods and services or to withdraw or access money from
banks and other banking platforms. Mediums of exchange per se do not increase the
quantity or stock of money in an economy.
The Bank is encouraged by the positive response by exporters to the export
development initiatives that the Bank has put in place. The growth in export production

14
and exports has been significant. The same is true for the financial inclusion initiatives
that the Bank has been pursuing through timely provision of targeted empowerment
facilities to interest groups such as women, SMEs, the youth and the disabled. These
facilities have had significant impact in supporting broad-based and inclusive growth
for both local consumption and export generation. As part of the National Financial
Inclusion Strategy, the Women’s Microfinance Bank and Empower Bank are now
operational. These special banks will help in improving access to formal financial
services by women and youth, who fall under the country’s marginalised groups, and
hence the majority of the previously financially excluded population.
The Bank and the Ministry of Finance and Economic Development are continuing to
give priority to the re-engagement programme on the basis of the 2015 Lima, Peru,
arrangement for the clearance of external debt arrears which are a great hindrance to
accessing long term finance from the International Financial Institutions (IFIs) for
sustainable economic development. Detailed debt sustainable models and options are
being examined to ensure that in the short to medium term the arrears are settled.
I THANK YOU
JOHN PANONETSA MANGUDYA
GOVERNOR

15
ANNEXURE

16
SECTION 1: GLOBAL AND REGIONAL ECONOMIC DEVELOPMENTS
The global expansion that began about two years ago seems to have plateaued and become less
balanced, amid rising tensions over international trade, particularly between the US and its
biggest trading partner China. In the latest World Economic Outlook July 2018 update, the
International Monetary Fund (IMF) projects global growth rates at about 3.9 percent for both
2018 and 2019, but there is increased risk of worse outcomes for the near term.
GDP growth remains generally strong in advanced economies, but it has slowed in many of
them, including countries in the Euro area, Japan, and the United Kingdom. In contrast, the
United States GDP growth continues to grow faster than potential and job creation is still
robust, driven largely by recent tax cuts and increased government spending. Table 1 shows
global economic growth developments for selected regions and countries.
Table 1: Global Economic Growth & Outlook (%)
2015 2016
Estimate 2017
Projection 2018
Projection 2019
Projection
World Output 3.2 3.2 3.6 3.9 3.9
Advanced Economies 2.1 1.7 2.2 2.4 2.2
US 2.6 1.5 2.2 2.9 2.7
Euro Area 2.0 1.8 2.1 2.2 1.9
Japan 1.2 1.0 1.5 1.0 0.9
Emerging Market &
Developing Economies
4.1 4.3 4.6 4.9 5.1
China 6.9 6.7 6.8 6.6 6.4
India 7.6 7.1 6.7 7.3 7.5
Sub-Saharan Africa 3.4 1.4 2.6 3.4 3.8
Zimbabwe* 1.1 0.7 3.7 4.5 5.0
Latin America & the
Caribbean
0.1 -0.9 1.2 1.6 2.6

17
Source: IMF World Economic Outlook (October 2017), *Ministry of Finance and Economic
Development and RBZ projections
The projected global growth, particularly in advanced economies, is a positive development
for Zimbabwe, given that they constitute the largest proportion of the final destinations of the
country’s agricultural and mineral exports. Strong growth in emerging and sub-Saharan
African economies also presents additional opportunities for the country to diversify exports
and increase continental trade. Overall growth in sub-Saharan Africa is projected to exceed
that of population over the next couple of years, allowing per capita incomes to rise in many
countries. Despite some recovery in commodity prices, however, growth will still fall short of
the levels registered during the commodity boom of the 2000s, indicating unutilized potential
for growth in many countries.
Commodity Price Developments
Accelerating global growth with the attendant rising demand are driving broad-based price
increases for most commodities in 2018, as well as the forecast of higher commodities prices
in the medium term. This development bodes well for commodity exporters including
Zimbabwe, on the one hand, but may also signal increasing inflation pressures through
increased energy prices, particularly fuel, on the other.
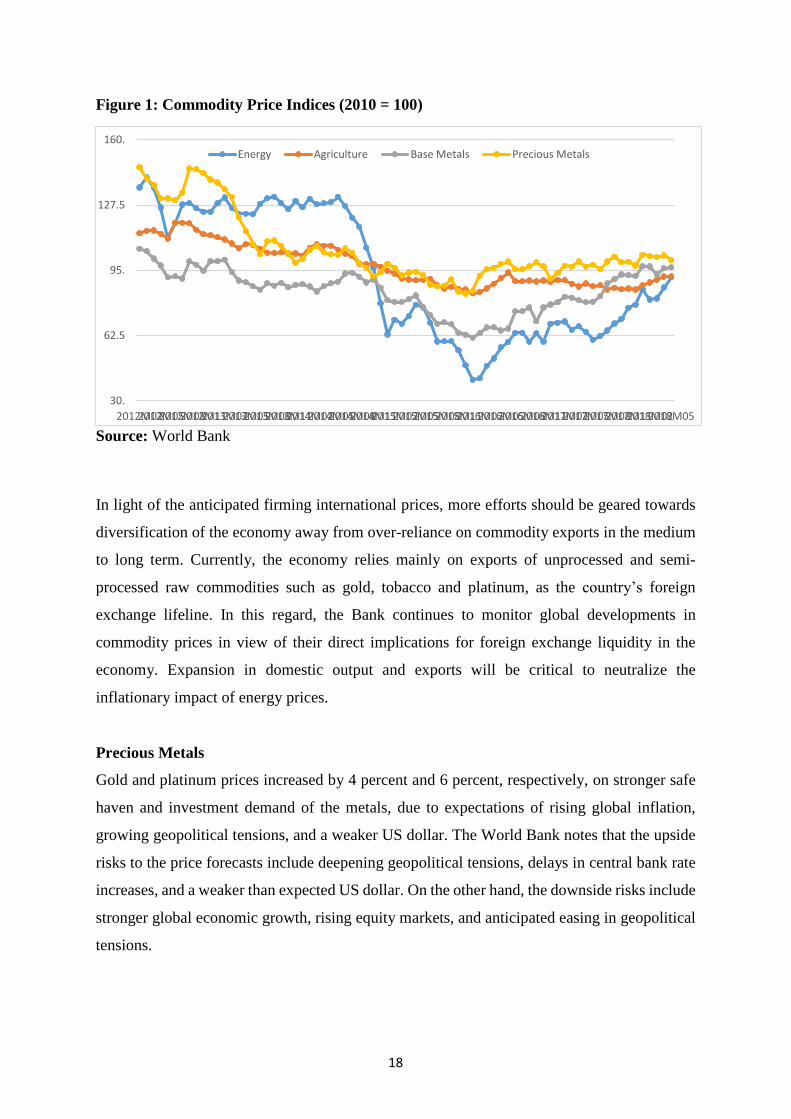
Commodity prices strengthened in first quarter of 2018, although they generally remained
below their 2011 peaks. More specifically, energy, base metals, precious metals and
agriculture surged between January and May 2018, largely due to strong demand, amid
tightening global supplies. Commodity price indices for the period from January 2012 to May
2018 are shown in the figure below.
18
Figure 1: Commodity Price Indices (2010 = 100)
Source: World Bank
In light of the anticipated firming international prices, more efforts should be geared towards
diversification of the economy away from over-reliance on commodity exports in the medium
to long term. Currently, the economy relies mainly on exports of unprocessed and semi-
processed raw commodities such as gold, tobacco and platinum, as the country’s foreign
exchange lifeline. In this regard, the Bank continues to monitor global developments in
commodity prices in view of their direct implications for foreign exchange liquidity in the
economy. Expansion in domestic output and exports will be critical to neutralize the
inflationary impact of energy prices.
Precious Metals
Gold and platinum prices increased by 4 percent and 6 percent, respectively, on stronger safe
haven and investment demand of the metals, due to expectations of rising global inflation,
growing geopolitical tensions, and a weaker US dollar. The World Bank notes that the upside
risks to the price forecasts include deepening geopolitical tensions, delays in central bank rate
increases, and a weaker than expected US dollar. On the other hand, the downside risks include
stronger global economic growth, rising equity markets, and anticipated easing in geopolitical
tensions.
30.
62.5
95.
127.5
160.
2012M022012M052012M082012M112013M022013M052013M082013M112014M022014M052014M082014M112015M022015M052015M082015M112016M022016M052016M082016M112017M022017M052017M082017M112018M022018M05
Energy Agriculture Base Metals Precious Metals

19
SECTION 3: DOMESTIC ECONOMIC DEVELOPMENTS
Developments during the first half of 2018 suggest that the economy will surpass the initial
growth projection of 4.5%, and register growth in excess of 5% this year. Better-than-
anticipated performance has been recorded across most key sectors of the economy such as
agriculture, mining and manufacturing, among others, during the first six months of the year.
Tobacco outperformed initial projections by 5%, with the output now expected to reach 250
million kilograms in 2018, well in excess of the previous all-time high of 235 million kilograms
achieved in 1999. Over the first six months of 2018, there was also significant expansion in
gold, chrome and coal, among other key minerals, which cumulatively warrant upward revision
of earlier economic projections.
As at 15th August 2018, cumulative tobacco output amounted to 248.2 million kilograms,
which is 35% higher than what was sold during the same period in 2017. The 2018 output raked
in a total of US$725.9 million, which is 30% higher than the US$547 million realized in 2017.
Table 2: Cumulative Tobacco Sales as at 15th August 2018
2018 2017 Variance (%)
Total Quantity Sold (million Kgs) 248.2 184.3 35
Total Value (US$ million) 725.9 547.0 33
Average Price (US$)/Kg 292 297 -1.4
Source: TIMB, 2018
The sterling performance in tobacco was on the back of an increase in the number of growers
in 2018, from below 100 000 farmers to more than 140 000 farmers in the current season;
increase in the number of players under the contract farming arrangements; and a positive
response to the export incentives offered by the Bank towards tobacco production.
In the mining sector, the first half of 2018 shows that gold has been performing well above
initial projections. Chrome and coal have also shown significant deviations above initial

20
projections, which further warrants an upward review of mining output growth projections for
2018.
Table 3: Mineral Production: Q2 2018 and 2017
Q2 2018 Q1 2018 Q2 2017 Variance Q2
2018 & Q2
2017 (%)
Cumulative
Jan-June
2018
2017
Outturn
Gold (kg) 10 373 7 741 5 784 79.3 18 113 26 494
Chrome (tonnes) 503 879 411 446 352 239 43.1 915 325 1 673 998
Coal (tonnes) 1 041 043 880 477 909 124 14.5 1921 520 2 928 038
Nickel (tonnes) 4 018 4 747 4 551 -11.7 8 765 16 617
Platinum (kg) 3 438 3 744 3 693 -6.9 7 182 14 258
Palladium (kg) 2 816 3 087 3 047 -7.6 5 903 11 822
Diamonds
(Carats)
1 001 851 902 616 820 752 22.1 1 904 468 2 507 862
Source: Ministry of Mines and Chamber of Mines, 2018
Figure 2: Quarterly Gold Output Trends: 2017-2018
Source: Fidelity Printers and Refineries, Ministry of Mines; Chamber of Mines 2018
1150.00
1200.00
1250.00
1300.00
1350.00
0
3000
6000
9000
12000
Q1 2017 Q2 2017 Q3 2017 Q4 2017 Q1 2018 Q2 2018
US$
/ o
un
ce
Ou
tpu
t (k
g)
Large Scale Producers(kg) Small Scale Producers (kg) Total Gold (kg)
Secondary Producers (Kg) Average Price (US$/ounce)

21
Gold Deliveries to Fidelity Printers & Refineries (FPR)
Joint efforts by Government and the Bank to increase gold production and mobilisation,
particularly from small scale miners are bearing fruit, as evidenced by the phenomenal growth
in gold deliveries to Fidelity Printers and Refineries (FPR), where 17.3 tonnes of gold were
delivered during the first half of the year, compared to about 10 tonnes over the same period in
2017. The interventions, through the US$150 million Gold Development Fund to assist small
scale gold miners, coupled with joint compliance monitoring by the Gold Monitoring
Committee, a collaborative effort between the Ministry of Mines and Mining Development,
Ministry of Home Affairs and the Reserve Bank of Zimbabwe.
Figure 3: Gold Purchases by Fidelity Printers and Refiners (kgs) – January to June
2018
Source: FPR, 2018
It is pleasing to note that small scale producers accounted for 64 percent of the delivered 17.3
tonnes of gold to FPR. On the back of performance displayed in this period, the country remains
on course to meet the target of 30 tonnes for the year 2018.
There was also significant increases in the output of diamond, chrome and coal, witnessed
during the first half of 2018. Diamond output during the first half of 2018 stood at 1.904
million carats, significantly higher than the 1.388 million carats produced during the first half
of 2017. Chrome ore output also increased to 503 879 tonnes in Q2 2018, from about 411 446
1160932 953 983
11831033
1399
1084
17821905
2217
26442559
2016
27352888
3399
3677
0
1000
2000
3000
4000
January February March April May June
Primary producers Small Scale producers Total Gold Purchased
22
tonnes in Q1 2018, and was 43% above the production realised during the same period in 2017.
In addition, coal output, at 1.041 million tonnes during the second quarter of 2018, was 14.5%
more than the 0.909 million tonnes produced in the comparable period of 2017. Cumulatively,
coal output in the first half of 2018, stood at 1.921 million tonnes, which is about 51% above
the 1.272 million tonnes registered during the same period in 2017.
There are notable positive developments in the manufacturing sector, characterized by setting
up of new plants by some companies, as well as expansions and resuscitation of production,
by others, especially in the foodstuffs, beverages, and metal and metal products sub-sectors.
This was largely in response to the thrust taken by Government, to open up the economy for
business in addition to increased throughput of raw materials from the agriculture sector,
following various funding and support mechanisms from Government.
Balance of Payments Developments
The country’s external sector position is showing signs of improvement on account of policy
measures being taken by the Reserve Bank to boost exports, while moderating imports into the
economy. Following these measures, the current account deficit to GDP ratio declined from a
peak of 20.4 percent in 2011 to about 1.8 percent in 2017, mainly on account of improved
export performance, coupled with slowdown in non-essential imports.
The export incentive scheme has continued to produce desired result of increasing exports
across all the sectors of the economy as shown in the Table below.

23
Table 4: Summary of all Incentives as from 2016 to 21 September 2018
Type Year 2016 Year 2017
Year 2018 Total
Export Incentive 51,845,778.30 84,838,993.35
79,297,301.34 215,982,072.99
of which: Mining 20,380,486.96 37,887,602.22
31,864,714.43 90,132,803.62
Manufacturing 7,439,413.87 10,577,553.25
11,838,030.58 29,854,997.71
Agriculture 8,854,618.58 12,453,960.22
15,588,097.03 36,896,675.84
Tourism 3,755,538.57 8,250,788.67
6,515,752.11 18,522,079.35
Transport 5,089,081.75 8,379,798.99
5,830,672.08 19,299,552.83
Services 5,407,871.96 6,350,433.05
6,895,683.58 18,653,988.59
Communication 607,918.59 546,228.77
294,883.38 1,449,030.74
Construction 3,564.43 1,087.87
5,625.00 10,277.29 Retail and
Distribution 307,283.58 391,540.29
463,843.14 1,162,667.02
Tobacco Export
Incentive 29,371,935.40 30,383,471.80
93,591,272.33 153,346,679.53
Diaspora Export
Incentive 8,148,766.34 33,355,806.66
21,765,757.95 63,270,330.95
Gold Export Incentive 11,205,386.79 55,744,624.70
243,676,015.08 310,626,026.57
Total Incentives 100,571,866.83 204,322,896.50
438,330,346.70 743,225,110.03
Total Foreign
Currency Receipts 2,996,013,682.68 4,615,660,107.87
4,985,005,805.08 12,596,679,595.64
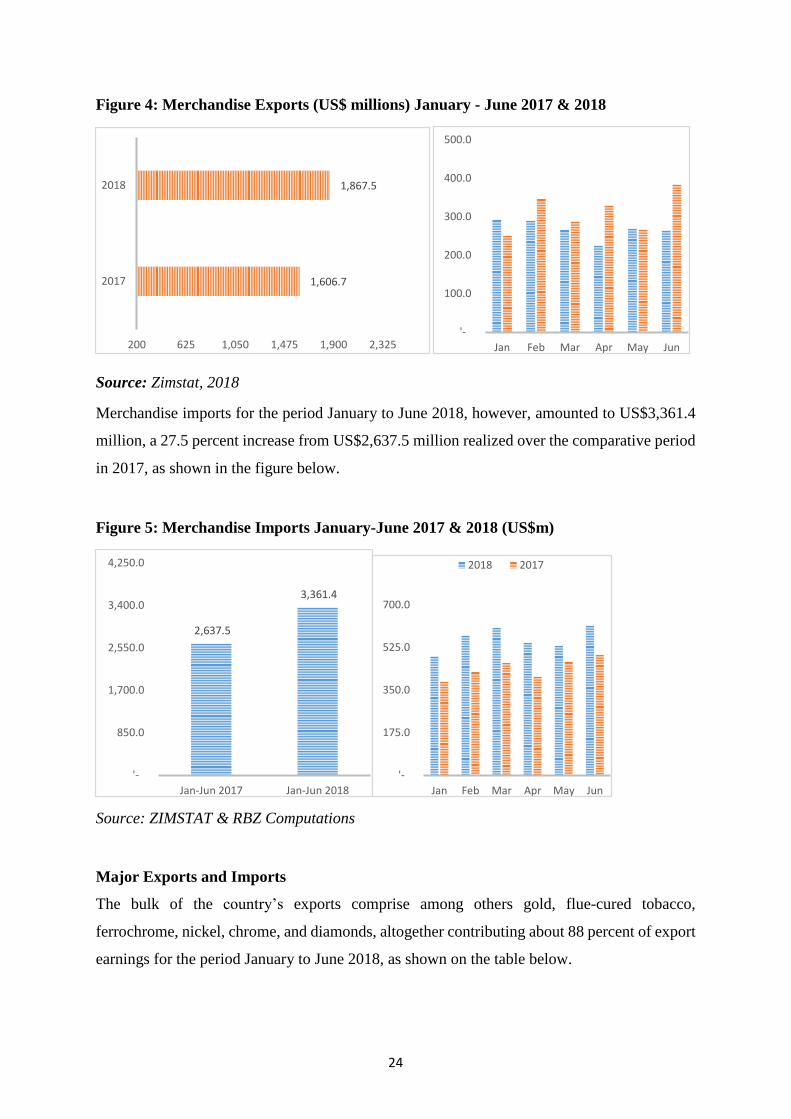
Through these efforts, merchandise exports for the first half of 2018 stood at US$2.47 billion,
a 36.5 percent increase from US$1.81 billion realized over the corresponding period in 2017.
The increase was underpinned by growth in gold, platinum, chrome and tobacco exports.
24
Figure 4: Merchandise Exports (US$ millions) January - June 2017 & 2018
Source: Zimstat, 2018
Merchandise imports for the period January to June 2018, however, amounted to US$3,361.4
million, a 27.5 percent increase from US$2,637.5 million realized over the comparative period
in 2017, as shown in the figure below.
Figure 5: Merchandise Imports January-June 2017 & 2018 (US$m)
Source: ZIMSTAT & RBZ Computations
Major Exports and Imports
The bulk of the country’s exports comprise among others gold, flue-cured tobacco,
ferrochrome, nickel, chrome, and diamonds, altogether contributing about 88 percent of export
earnings for the period January to June 2018, as shown on the table below.
1,867.5
1,606.7
200 625 1,050 1,475 1,900 2,325
2018
2017
'-
100.0
200.0
300.0
400.0
500.0
Jan Feb Mar Apr May Jun
2,637.5
3,361.4
'-
850.0
1,700.0
2,550.0
3,400.0
4,250.0
Jan-Jun 2017 Jan-Jun 2018
'-
175.0
350.0
525.0
700.0
Jan Feb Mar Apr May Jun
2018 2017

25
Table 5: Exports Classified by HS Code (US$) & Share of Total exports for January-
June 2018
Commodity Values (US$)
Jan-June Shares
Gold 692,286,241 28%
Platinum 566,935,332 23%
Nickel mattes 282,873,384 11%
Nickel ores and concentrates 207,132,142 8%
Flue-cured tobacco (Virginia) 178,243,087 7%
Ferro-chromium 135,651,190 5%
Chromium ores and concentrates 54,391,194 2%
Industrial diamonds 40,090,123 1%
Jewelry 34,347,587 1%
Black tea fermented 16,160,843 1%
Granite 14,462,307 1%
Coke and semi-coke of coal 13,774,235 1%
Others 229,225,188 9%
Total 2,465,572,493 100%
Source: Zimstat & RBZ Calculations
The bulk of the country’s imports were made up of fuel (24%), electricity (3%), maize (1%),
medicines (1%) and vehicles (1%) (See Table 6 below).

26
Table 6: Major Import Commodities: January - June 2018
Commodity Values (US$) Shares
Diesel 507,030,293 15%
Unleaded petrol 267,353,576 8%
Electrical energy 111,093,854 3%
Crude soya bean oil 64,657,839 2%
Rice 62,224,913 2%
Durum wheat 49,328,343 1%
Maize (Excluding Seed) 42,254,513 1%
Medicaments 40,666,809 1%
Vehicles 39,105,626 1%
Ammonium nitrate 34,690,001 1%
Aviation Spirit 32,495,502 1%
Urea 32,471,498 1%
Herbicides 30,911,784 1%
Others 2,047,115,448 61%
Total 3,361,400,000
Source: Zimstat & RBZ Computations
Current Account Developments
The current account deficit is estimated to have slightly improved from US$591 million in
2016, to US$316.1 million in 2017. The deficit is, however, expected to widen in 2018 as the
country absorbs more imports, particularly raw materials that are needed as feedstock for the
expanding economy and equipment to improve on competitiveness. The table below shows a
snapshot of the balance of payments developments from 2015 to 2018.

27
Table 7: A Snapshot of the Balance of Payments Developments (US$ million)
2015 2016 2017* 2018**
A. Current Account -1557.3 -591.3 -316.1 -636.1
Balance on goods -2402.6 -1500.0 -1306.9 -1612.8
Exports 3577.5 3662.9 4286.3 4685.6
Imports 5980.1 5162.9 5593.2 6298.4
Balance on services -1137.1 -867.1 -677.8 -538.4
Receipts 386.7 396.7 418.9 505.7
Payments 1523.8 1263.8 1096.7 1044.1
Balance on Primary Income -158.8 -178.3 -160.6 -136.4
Balance on Secondary Income 2141.1 1954.1 1829.3 1651.4
Secondary income: Receipts 2164.7 1979.7 1858.4 1681.5
o/w Workers Remittances 1253.2 1102.8 1013.4 1004.7
NPISHs 790.4 750.3 713.1 538.2
Secondary income: Payments 23.6 25.6 29.1 30.0
B. Capital Account 398.4 242.3 278.3 208.8
Net Lending(+)/Net Borrowing(-)(Balance
from CA & KA) -1158.9 -349.0 -37.7 -427.3
Net Lending(+)/Net Borrowing(-)(Balance
from FA)
-1643.4 -526.6 -332.3 -852.6
Direct Investment (Net) -399.2 -343.0 -246.0 -470.3
Portfolio Investment (Net) -122.8 80.1 100.9 -54.0
Other Investment: Loans (Net) -1075.5 -259.9 -174.8 -320.2
D. Net Errors and Omissions -484.5 -177.6 -294.6 -425.4
Source: RBZ, Ministry of Finance & Zimstat
‘* estimate; **projection

28
Financial Account Developments
The country’s current account deficit, though now less than US$1 billion, remains
unsustainable as it is being financed mostly by debt creating flows in the form of loans being
contracted by both the private and public sectors. On a net basis, the financial account shows
that the country continues to be a net borrower of foreign capital over the years. The country
has mainly been relying on offshore private sector lines of credit to finance its balance of
payments.

29
SECTION 2: MONETARY AND INFLATION DEVELOPMENTS
Monetary Developments
Broad money1 was estimated at $9 140.89 million, as at June 2018. The annual growth rate,
which had fallen significantly, from close to 50% in November 2017 to 32% in April 2018,
rose to 40.81% in June 2018. The growth reflected expansions in demand deposits, 93.31%;
and negotiable certificates of deposits (NCDs)2, 1.79%. Time deposits, however, declined by
5.18%. The stock of bond notes and coins in circulation also increased by 14.2% from $331.94
million in December 2017, to US$379.20 million by June 2018. This was in tandem with
increases in export earnings over the same period.
Figure 6: Money Supply
Source: Reserve Bank of Zimbabwe, 2018
In terms of composition, broad money was made up of demand deposits, 79.16%; time
deposits, 15.96%; currency in circulation, 4.15%; and negotiable certificates of deposits,
0.73%. The expansion in money supply was mainly explained by increases in domestic credit,
largely spurred by growth in credit to Government. Credit to the private sector has remained
relatively subdued as a result of the shortages of foreign exchange within the economy.
Developments in credit to Government continued to reflect persistent budget deficits and the
increased reliance by Government on domestic sources of financing, through Treasury bill
1 Beginning January 2017, broad money is redefined using IMF’s Monetary and Financial Statistics Manual of 2000. The
major change is the exclusion of Government deposits held by banks from broad money.
2 NCDs are also referred to as securities included in broad money.
-16
0
16
31
47
63
'-
3
5
8
10
41365 Oct-13 Apr-14 Oct-14 Apr-15 Oct-15 Apr-16 Oct-16 Apr-17 Oct-17 Apr-18%
US
US
$ B
ILL
ION
S
M3 M3 Annual Growth rate

30
issuances, as well as bank loans and advances. Net credit to Government from the banking
system has, therefore, expanded from $6 277.47 million in December 2017 to $7 703.13 million
in June 2018.
Stock Market Developments
During the period January 2018 to July 2018, the Zimbabwe Stock Exchange (ZSE)
experienced significant growth in trading activity, resulting in a 14.32% increase in the All-
Share Index (ASI), to 114.32 points at the end of July 2018. The Top 10 Index, gained 18.84%
to 118.84 points over the same period, as shown on the figure below.
Figure 7: ZSE All Share and Top 10 Indices
Source: Zimbabwe Stock Exchange 2018
The industrial and mining indices gained 15.38% and 15.16%, to 384.25 points and 163.99
points as at 31st July 2018, respectively, from their positions in December 2017. On a year-
on-year basis, the industrial and mining indices grew by 89.05% and 136.16 points,
respectively, as shown below.
50
65
80
95
110
125
140
2-Jan-18 22-Jan-18 09-Feb-18 02-Mar-1822-Mar-18 13-Apr-1807-May-1828-May-18 15-Jun-18 09-Jul-18
All Share Index Top 10 Index

31
Figure 8: Industrial and Mining Indices
Source: Zimbabwe Stock Exchange 2018
As a consequence of improved trading activity on the local bourse during the seven months to
July 2018, the ZSE capitalization gained by 14.51%, to $10.97 billion, from $9.58 billion as at
end of December 2017. This represented an increase of 90.45% over the year. These
developments are depicted in the figure below.
Figure 9: Market Capitalization
Source: Zimbabwe Stock Exchange 2018
Over the period January to July 2018, cumulative volume of shares traded grew by 54.4% to
1.5 billion shares, representing an increase of 206.14% to $427.11 million in value.
30.
63.75
97.5
131.25
165.
198.75
232.5
266.25
300.
0.
100.
200.
300.
400.
500.
600.1
9-F
eb-0
9
6-J
ul-
09
21-O
ct-0
9
2-F
eb-1
0
17-M
ay-1
0
27-A
ug
-10
6-D
ec-1
0
17-M
ar-1
1
1-J
ul-
11
12-O
ct-1
1
25-J
an-1
2
9-M
ay-1
2
21-A
ug
-12
28-N
ov
-12
13-M
ar-1
3
26-J
un
-13
15-O
ct-1
3
28-J
an-1
4
12-M
ay-1
4
22-A
ug
-14
1-D
ec-1
4
16-M
ar-1
5
29-J
un
-15
08-O
ct-1
5
20-J
an-1
6
04-M
ay-1
6
5-A
ug
-16
16-N
ov
-16
1-M
ar-1
7
15-J
un
-17
26-S
ept-
17
9-J
an-1
8
24-A
pr-
18
Min
ing
In
dex
Ind
ust
ria
l In
dex
Industrial Index Mining Index
4,000
17,000
1-Jun-10 27-Apr-11 22-Mar-12 20-Feb-13 22-Jan-14 16-Dec-14 13-Nov-15 12-Oct-16 12-Sept-17
Mill
ion
s

32
Figure 10: ZSE Market Turnover
Source: Zimbabwe Stock Exchange 2018
Foreign investor participation improved, as reflected by cumulative net inflows of $65.69
million, over the first seven months of 2018, compared to cumulative net outflows of $27.43
million during the same period last year. Foreign investors’ dominance on the ZSE was
underpinned by renewed confidence in the country’s economic prospects.
Inflation Developments
The annual headline inflation stood at 4.3% in July 2018, from levels below 3% since the
beginning of the year. During the seven months to July 2018, inflation averaged 3.11%,
compared to 0.19% in the same period in 2017, largely driven by both food and non-food
inflation. The continued shortages of foreign exchange in the economy, has continued to exert
pressure on the foreign currency market, leading to parallel market activities, which have pass-
through effects on prices.
0
125
250
375
500
0
275
550
825
Dec
-16
Jan
-17
Feb
-17
Mar
-17
Ap
r-17
May
-17
Jun-1
7
Jul-
17
Au
g-1
7
Sep
t-1
7
Oct
-17
No
v-1
7
Dec
-17
Jan
-18
Feb
-18
Mar
-18
Ap
r-18
May
-18
Jun-1
8
Jul-
18
Mill
ion
s
Mill
ion
s
Volume Value

33
Figure 11: Annual Inflation Profile (%)
Source: Zimstat, 2018
Annual food inflation, which had fallen to close to 4% at the beginning of 2018, surged to 6.35
% in July 2018, notwithstanding significant bumper harvests recorded in most food crops. A
general price increase was recorded for all food categories in July 2018, with the largest
contribution observed for meat, following cattle disease outbreaks in some parts of the country,
as well as cost push factors in poultry production. In addition, increases in the bread and cereals
could be attributed to the rise in international prices of wheat and consumables required in the
production processes of these products.
Month-on-month inflation increased from low levels of -2.5% in March 2018, to 3.8% in July
2018, also driven by both food and non-food factors. The increase in monthly food inflation in
July 2018, was largely due to increases in the prices of oils and fats, meat, and confectionery.
Non-food inflation also increased across many sub-categories, with the largest increases
recorded for education; restaurants and hotels; and recreation and culture. Despite the increase
in the annual inflation rate to 4.3% in July 2018, the country’s inflation remains within the
SADC health inflation benchmark of below 7%, required for macroeconomic convergence.
-6.1
-3.1
0.0
3.1
6.1
9.22
/29/1
6
3/3
1/1
6
4/3
0/1
6
5/3
1/1
6
6/3
0/1
6
7/3
1/1
6
8/3
1/1
6
9/3
0/1
6
10/3
1/1
6
11/3
0/1
6
12/3
1/1
6
1/3
1/1
7
2/2
8/1
7
3/3
1/1
7
4/3
0/1
7
5/3
1/1
7
6/3
0/1
7
7/3
1/1
7
8/3
1/1
7
9/3
0/1
7
10/3
1/1
7
11/3
0/1
7
12/3
1/1
7
1/3
1/1
8
2/2
8/1
8
3/3
1/1
8
4/3
0/1
8
5/3
1/1
8
6/3
0/1
8
7/3
1/1
8
Food Inflation Non-Food Inflation All Items

34
Table 8: Regional Annual Inflation Trends
Zimbabwe SA Botswana Mozambique Tanzania Zambia Malawi USA
Jul 2017 0.14 4.6 3.4 16.2 5.2 6.6 10.2 1.7
Aug 2017 0.14 4.8 3.4 14.4 5.0 6.3 9.3 1.9
Sep-2017 0.78 5.1 3.2 10.8 5.3 6.6 8.4 2.2
Oct-2017 2.2 4.8 3.0 8.4 5.1 6.4 8.3 2.0
Nov- 2017 3.0 4.6 2.9 7.2 4.4 6.3 7.7 2.2
Dec-2017 3.5 4.7 3.2 5.7 4.0 6.1 7.1 2.1
Jan-2018 3.5 4.4 3.1 3.8 4.0 6.2 8.1 2.1
Feb-2018 3.0 4.0 3.2 2.9 4.1 6.1 7.8 2.2
Mar-2018 2.7 3.8 2.8 3.1 3.9 7.1 9.9 2.4
Apr-2018 2.7 4.5 3.4 2.3 3.8 7.4 9.7 2.5
May-2018 2.7 4.4 3.3 3.3 3.6 7.8 8.9 2.8
Jun-2018 2.9 4.6 3.1 4.4 3.4 7.4 8.6 2.9
Jul-2018 4.3 5.1 3.1 4.7 3.3 7.8 9.0 2.9
Source: Country Central Bank Websites
Inflation Outlook
Measures being taken by Government to reduce fiscal imbalances which are exerting pressure
on both the financial sector and foreign currency market are expected to bear fruit in reducing
or tapering aggregate demand which is the main source of consumer spending. This together
with renewed market confidence and continuous concerted efforts by the Bank to secure lines
of credit to supplement foreign receipts from exports and diaspora remittances, are expected to
rebalance the economy and contain inflation with the regional acceptable range. The Bank
therefore inflation to remain below 7% for the rest of the year.

35
SECTION 3: FINANCIAL SECTOR DEVELOPMENTS
Financial institutions that were operating as at 30 June 2018 are shown in the table below.
Table 9: Architecture of the Banking Sector
Type of Institution Number
Commercial Banks 13
Building Societies 5
Savings Bank 1
Total Banking Institutions 19
Credit-only-MFIs 188
Deposit-taking MFIs 6
Development Financial Institutions (SMEDCO and IDBZ) 2
Two (2) deposit taking microfinance institutions (DTMFIs), the Zimbabwe Women’s
Microfinance Bank and Empower Bank Limited commenced operations during the period
under review bringing the total number of DTMFIs to six (6) as at 30 June 2018. These two
institutions are expected to significantly contribute to increased access to financial services by
target groups, including women and youth.
Performance of the Banking Sector
Condition and performance of the banking sector was considered satisfactory for the period
ended 30 June 2018, as reflected by adequate capitalisation, improved earnings performance
and asset quality. The table below shows trends in financial soundness indicators.

36
Table 10: Financial Soundness Indicators
Key Indicators Benchmar
k Jun-17 Dec-17 Mar-18 Jun-18
Total Assets - $9.65bn $11.25bn $10.95bn $12.35bn
Total Loans - $3.64bn $3.80bn $3.78bn $4.08bn
Net Capital Base - $1.38bn $1.58bn $1.61bn $1.61bn
Total Deposits - $6.99bn $8.48bn $8.24bn $9.53bn
Net Profit - $100.59m $241.94m $85.58m $176.09m
Return on Assets - 1.26% 2.61% 0.92% 1.75%
Return on Equity - 6.80% 15.48% 5.19% 11.16%
Capital Adequacy Ratio 12% 26.89% 27.63% 27.91% 26.32%
Loans to Deposits 70% 52.11% 44.81% 45.88% 43.53%
Non-Performing Loans Ratio 5% 7.95% 7.08% 7.06% 6.22%
Provisions to Adversely Classified
Loans - 126.29% 90.26% 106.96% 139.69%
Liquidity Ratio 30% 66.87% 62.62% 62.37% 68.45%
Cost to Income Ratio 72.50% 75.36% 68.58% 67.59%
Capitalisation
The banking sector aggregate core capital increased by 1.13%, from $1.37 billion as at 31
December 2017 to $1.38 billion as at 30 June 2018, on the back of improved earnings
performance. As at 30 June 2018, the banking sector remained adequately capitalised and
capital held by banking institutions was considered sufficient against risks, as reflected by

37
average tier 1 and capital adequacy ratios of 22.70% and 26.32%, respectively. All banking
institutions were in compliance with the prescribed minimum capital requirements as shown in
the Table below.
Table 11: Banking Sector Capitalisation (USD million)
Institution
Core Capital
as at 31
December 2017
Core Capital as
at 30 June 2018
Prescribed
Minimum
Capital
requirements CBZ Bank & Society 218.41 173.33 25
Stanbic Bank 135.52 135.89 25
Barclays Bank 79.22 96.02 25
Ecobank 73.95 90.83 25
BancABC 75.96 80.05 25
ZB Bank & Society 83.54 78.81 25
FBC Bank 70.37 77.57 25
Steward Bank 71.91 77.2 25
Standard Chartered Bank 71.34 76.29 25
NMB Bank 61.31 65.52 25
Nedbank Zimbabwe 54.52 58.18 25
Agribank 55.54 55.76 25
Metbank 44.99 44.86 25
BUILDING SOCIETIES
CABS Building Society 127.75 128.53 20
FBC Building Society 47.48 46.36 20
National Building Society 43.84 42.42 20
SAVINGS BANK
POSB 53.83 57.3 -
Total 1,369.48 1,384.94 -
Banking institutions are making significant progress towards meeting the 2020 minimum
capital requirements. In terms of the capitalisation plans submitted by banking institutions, all
locally owned commercial banking institutions have indicated plans to operate as tier 1 banking
institutions together with foreign-owned banking institutions which are required to maintain
minimum capital of $100 million. As at 30 June 2018, three (3) banking institutions were
already compliant with the 2020 minimum capital requirements.

38
Banking Sector Deposits
Total banking sector deposits amounted to $9.53 billion as at 30 June 2018, representing an
increase of 12.38%, from $8.48 billion reported as at 31 December 2017. The figure below
shows the trend of banking sector deposits over the period 31 December 2009 to 30 June 2018.

39
Figure 12: Trend of Banking Sector Deposits (USD)
The figure below shows the distribution of deposits across banking institutions as at 30 June
2018.
1,363.672,567.61
3,376.344,410.924,728.075,056.755,623.005,672.986,137.696,511.836,549.976,992.077,617.29
8,480.468,236.449,529.00
0.
2500.
5000.
7500.
10000.
12500.
31
-Dec-0
9
31
-Dec-1
0
31
-Dec-1
1
31
-Dec-1
2
31
-Dec-1
3
30-D
ec-14
31
-Dec-1
5
31
-Mar-1
6
30
-Sept-16
31
-Dec-1
6
31
-Mar-1
7
30
-Jun
-17
30
-Sept-17
31
-Dec-1
7
31
-Mar-1
8
30-Ju
n-18

40
Figure 13: Distribution of Deposits across Banking Institutions
The banking sector was predominantly funded by demand deposits which accounted for
64.47% of total deposits as at 30 June 2018. The composition of total banking sector deposits
as at 30 June 2018 is depicted in the figure below.
Figure 14: Composition of Deposits as at 30 June 2018
AGRIBANK1.63%
BANC ABC4.19%
BARCLAYS4.68%
CBZ Bank22.18%
ECOBANK6.30% FBC Bank
6.63%NEDBANK
3.24%METBANK
0.35%
NMB BANK3.75%
STANBIC13.21%
STANCHART7.61%
STEWARD Bank4.73%
ZB BANK4.14%
CABS12.51%
CBZ BS0.99%
FBC BS
1.23%
NBS0.71%
ZB BS0.24%
POSB1.68%
Demand Deposits
64.47%
Call Deposits
1.33%
Time Deposits
24.34%
Savings Deposits
4.76%Foreign Deposits
(Foreign Entity
Deposits)
1.60%
Foreign Deposits
(Foreign Lines)
2.19%
Other Deposits
1.32%

41
Loans and Advances
Total banking sector loans and advances increased by 7.37%, from $3.80 billion as at 31
December 2017 to $4.08 billion as at 30 June 2018. The figure below shows the trend of
banking sector loans and advances from 31 December 2014 to 30 June 2018.
Figure 15: Banking Sector Loans & Advances
As at 30 June 2018, productive sector lending constituted 66.88% of total loans as shown in
the diagram below.
Figure 16: Sectorial Distribution of loans as at 30 June 2018
3,471.89
3,701.11
4,060.00
3,942.94 3,999.35
3,872.39
3,729.77
3,649.30 3,688.46
3,590.91 3,643.46
3,733.15
3,798.36 3,778.95
4,078.50
3,150.00
3,325.00
3,500.00
3,675.00
3,850.00
4,025.00
4,200.00
De
c-12
De
c-13
Mar-1
5
Jun
-15
Sep
t-15
De
c-15
Jun
-16
Sep
t-16
De
c-16
Mar-1
7
Jun
-17
Sep
t-17
De
c-17
Mar-1
8
Jun
-18
CONSUMPTIVE
19.30%
OTHER
13.82%
AGRICULTURAL
15.68%
MANUFACTURING
8.49%
COMMERCIAL
9.14%MINING
3.64%
DISTRIBUTION
12.89%
CONSTRUCTION
2.20%
TRANSPORT
1.53%
COMMUNICATION
0.24%
FINANCIAL
7.10%
MORTGAGE
14.68%
Productive
66.88%
42
As the economy rebounds, banking institutions are urged to ensure that lending rates are
supportive of economic recovery to enhance productive sector lending.
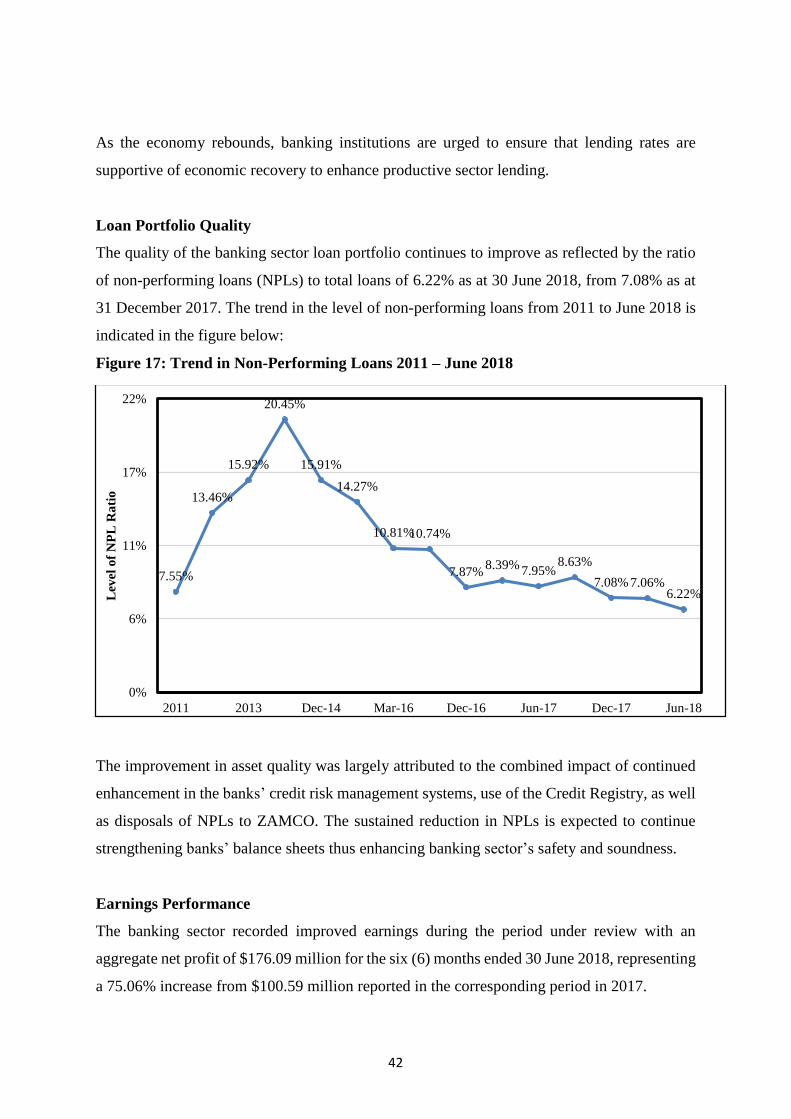
Loan Portfolio Quality
The quality of the banking sector loan portfolio continues to improve as reflected by the ratio
of non-performing loans (NPLs) to total loans of 6.22% as at 30 June 2018, from 7.08% as at
31 December 2017. The trend in the level of non-performing loans from 2011 to June 2018 is
indicated in the figure below:
Figure 17: Trend in Non-Performing Loans 2011 – June 2018
The improvement in asset quality was largely attributed to the combined impact of continued
enhancement in the banks’ credit risk management systems, use of the Credit Registry, as well
as disposals of NPLs to ZAMCO. The sustained reduction in NPLs is expected to continue
strengthening banks’ balance sheets thus enhancing banking sector’s safety and soundness.
Earnings Performance
The banking sector recorded improved earnings during the period under review with an
aggregate net profit of $176.09 million for the six (6) months ended 30 June 2018, representing
a 75.06% increase from $100.59 million reported in the corresponding period in 2017.
7.55%
13.46%
15.92%
20.45%
15.91%
14.27%
10.81%10.74%
7.87%8.39% 7.95%
8.63%
7.08% 7.06%6.22%
0%
6%
11%
17%
22%
2011 2013 Dec-14 Mar-16 Dec-16 Jun-17 Dec-17 Jun-18
Lev
el o
f N
PL
Ra
tio

43
Banking Sector Liquidity
The average prudential liquidity ratio for the banking sector was 68.45% as at 30 June 2018
against the minimum regulatory requirement of 30%, largely as a result of the cautious lending
approach adopted by most banks against the background of shortages of foreign currency
exchange. Excess creation of loans and advances in this foreign currency scarcity environment
exacerbate foreign exchange shortages.
Trend in the banking sector average prudential liquidity ratio since March 2015 is shown in the
figure below.
Figure 18: Prudential Liquidity Ratio Trend (%)
Deposit Insurance Payments
As at 30 June 2018, 11,845 out of 54,909 depositors by number had been compensated out of
the Deposit Insurance Fund (DPF), whilst in monetary terms about $3.27 million (51%) had
been paid against an exposure of $6.4 million. The table below provides a synopsis of deposit
insurance payments in respect of the six (6) failed contributory banking institutions (CBIs)
under liquidation.
36.6138.14
43.1345.43
49.6352.47
61.91
66.87
62.49 62.62 62.37
68.45
25.
36.25
47.5
58.75
70.
81.25
Mar-15 Jun-15 Sept-15 Dec-15 Mar-16 Jun-16 Dec-16 Jun-17 Sept-17 Dec-17 Mar-18 Jun-18

44
Table 12: Deposit Insurance Payments as at 30 June 2018
Name of
Institution
Total
Depositor
s
No. of
Deposit
ors
paid
Exposure
Deposits
payable at
$500($)
Value of
Depositors
paid ($)
% paid
to
exposure
Gross
Deposits
Royal Bank 5,453 3,107 472,207 357,054 76% 2,566,938
Trust Bank 2,958 418 328,516 147,675 45% 11,482,101
Genesis 86 62 11,810 8,821 75% 1,426,912
Allied Bank 9,228 1,535 1,248,307 535,994 43%
14,316,614
Interfin
Bank 13,021 691 918,814 263,767 29% 137,336,569
Afrasia 24,163 6,032 3,439,276 1,953,651 56% 18,559,590
Total 54,909 11,845 6,418,930 3,266,962 51% 185,688,727
All the failed institutions above are under final liquidation by the Deposit Protection
Corporation.
DEVELOPMENTS IN THE MICROFINANCE SECTOR
The microfinance sector registered improved performance during the period under review,
largely due to rationalisation of operations by some microfinance institutions and increased
efforts on deposit-mobilisation by some deposit-taking microfinance institutions (DTMFIs).
The trend in the key performance indicators in the microfinance industry over the year to June
2018 is shown in the table below.

45
Table 13: Key Microfinance Performance Indicators (June 2017 – June 2018)
Indicator Jun 17 Dec 17 Mar 18 June 18
Number of Licensed Institutions 187 183 190 194
Total Loans (US$m) 229.44 254.04 272.95 297.52
Total Assets (US$m) 297.85 333.27 360.46 412.29
Total Equity (US$m) 130.25 130.22 142.94 138.15
Net Profit (US$m) 13.98 21.64 9.08 13.67
Average Operational Self-Sufficiency (OSS) 150.49% 135.80% 142.92% 154.76%
Total Deposits (DTMFIs) (US$m) 6.62 6.41 11.84 15.34
Number of Savings Accounts (DTMFIs) 2,265 7,226 8,668 10,202
Portfolio at Risk (PaR>30 days) 6.46% 7.34% 9.55% 10.15%
Number of Active Loan Clients 322,728 323,286 282,024 276,660
Number of Outstanding Loans 372,837 415,979 296,544 297,843
Number of Branches 698 682 676 660
The microfinance industry registered a 29.67% year-on-year increase in total loans, from
$229.44 million as at 30 June 2017, to $297.52 million as at 30 June 2018, constituting 6.01%
of the total banking sector loans. The industry, however, registered a deterioration in portfolio
quality over the year with portfolio at risk (PaR) ratio of 10.15% as at 30 June 2018 up from
7.34% as at 31 December 2017, largely due to weak credit risk management within some MFIs.
Total loans for the DTMFI sub-sector amounted to $66.94 million, representing a market share
of 22.56% of the total microfinance sector loans as at 30 June 2018. As at 30 June 2018, female
borrowers accounted for 38.88% of the total microfinance active clients. The figure below
indicates the trends in access to microfinance loan by women borrowers.

46
Figure 19: Growth of Active & Women Clients
Distribution of Loans
As at 30 June 2018, loans to the productive sector of $226.61 million accounted for 76.16% of
the total sector loans, up from 54.18% as at 31 December 2017. The figure below shows the
trend in the distribution of loans from December 2014 to June 2018.
58325
96749
150188
205282 205940
322728 323286
282024 276660
1615931453
5462267536 71811
128337115690
107226 107565
'-
100,000
200,000
300,000
400,000
01-Jan-16 01-Jan-17 01-Jan-18 01-Jan-19 01-Jan-20 01-Jul-21 01-Jan-22 01-Apr-22 01-Jul-22
Number of total clients Number of female clients

47
Figure 20: Microfinance Industry – Distribution of Loans
Loans for educational and health purposes remained subdued, accounting for 8.97% and
0.01%, respectively, of the total microfinance sector loans.
Profitability
The microfinance industry registered a 1.65% marginal decrease in net profit over the year
from $13.98 million for period ended 30 June 2017, to $13.67 million for the period ended 30
June 2018. The average operational self-sufficiency ratio (OSS) improved to 154.76% as at 30
June 2018 from 150.49% as at 30 June 2017. The OSS ratio of 154.76% was above the break-
even point of 100%, indicating that the industry is still operationally sustainable.
Zimbabwe Women’s Microfinance Bank
The Zimbabwe Women’s Microfinance Bank Limited (ZWMB) was authorized to commence
deposit-taking microfinance business with effect from 31 May 2018. The primary target market
for the bank are women.
EmpowerBank Limited
EmpowerBank Limited, whose primary target market is the youth, was authorized to
commence deposit-taking microfinance business effective 5 July 2018. ZWMB and
53.30% 54.24%
26.61%
45.82%
33.02%
23.83%
46.70% 45.76%
73.39%
54.18%
66.98%
76.17%
1.40% 2.32% 2.35%5.00%
10.09% 8.97%
1.41% 2.21% 2.28%0.40% 0.83% 0.01%
0.00%
20.00%
40.00%
60.00%
80.00%
Dec 14 Dec 15 Dec 16 Dec 17 Mar 18 June 18
Consumptive Productive Education Health

48
EmpowerBank are expected to play a pivotal role in the economy through enhanced financial
deepening and financial inclusion.
The Credit Guarantee Scheme
In order to improve the capacity of Export Credit Guarantee Corporation (ECGC) to underwrite
more business and enhance its risk absorption capacity, an additional $10 million was injected
into ECGC as capital.
Update on Measures to Promote Financial Stability & Economic Growth
Financial Inclusion
Significant progress with regards to implementation of National Financial Inclusion Strategy
(NFIS) has been recorded in areas of financial literacy, consumer protection, delivery channels,
low cost bank accounts, loans to various segments, micro-insurance, financial services
exchange for MSMEs, micro-pensions, among others, as will be summarised below.
Level of Access to Financial Services
An improvement in the level of access to financial services continues to be recorded as reflected
in the financial inclusion indicators in the table below:
Table 14: Financial Inclusion Indicators – December 2016 to June 2018
Indicator Dec 2016 June 2017 Dec 2017 June 2018
Value of loans to SMEs $131.69 m $136.39 m $146.22 m $168.25m
Number of SMEs with bank accounts 71,730 79,484 76,524 81,369
Number of Women with Bank
Accounts 769,883 856,472 935,994 1,612,820
Value of Loans to Women $277.30 m $303.84 m $310.78 m $360.68m
Number of Loans to Youth 38,400 56,926 61,529 68,756
Value of Loans to Youth $58.41 m $77.09 m $138.93 m $126.64m
Total number of Bank Accounts
(including low cost accounts) 1.49 m 2.91 m 5.51 m 5.58m
Number of Low Cost Accounts 1.20 m 1.56 m 3.02 m 3.56m

49
The total number of bank accounts has continued to increase on the back of an increase in low
cost accounts as banks heed calls by the Reserve Bank to open low cost accounts with light
KYC requirements.
Financial Inclusion Empowerment Facilities
As at 16 August 2018, a total of $238.30 million had been disbursed under the $451.51 million
production and empowerment facilities. The table below shows utilisation of the facilities:
Table 15: Empowerment Facilities Utilisation
Loan Facility
Facility Limit
($) Total Utilisation ($) Utilization Level %
Business Linkages 10m 11.36m 113.63
Export Finance 100m 75.15m 75.15
Educational Loan 50m 1.17m 2.34
Horticulture Promotion 10m 4.36m 43.56
FPR Gold Support 150m 107.15m 71.71
Women Empowerment 15m 2.84m 18.96
Tobacco (TIMB) 70m 19.27m 27.53
Soya Beans Facility 25m 15.64m 72.74
Persons With Disability 5m 0 0
Zimbabwe Micro Finance 10m 1.0m 10.00
Youth Empowerment 10m 0.33m 3.35
Tourism Facility 15m 0.03m 0.20
Total 470m 238.3m 50.70

50
The facilities which are available at concessionary rates have had significant impact in
supporting production, reinvigorating various value chains particularly in agriculture and
boosting exports.
Banks are encouraged to continue innovating on products and services to serve the
marginalized sectors including partnering with providers of innovative funds such as Venture
Capitalists, Green Financiers and hybrid funders.
PRUDENTIAL CREDIT SYSTEMS
Sustainable Banking
I am pleased to advise that the Reserve Bank of Zimbabwe has been admitted to membership
of the Sustainability Standards and Certification Initiative (SSCI) Council with effect from 1
September 2018. The SSCI is responsible for developing policies and programmes aimed at
facilitating sustainable economic development and growth.
The Reserve Bank shall be issuing a framework to guide the financial sector on the adoption
of sustainability principles and sustainability indicators in financial reporting. Sustainability
principles require financial institutions to subscribe to the Triple Bottom Line concept – People,
Planet, Profit. Sustainable banking integrates environmental, social and governance (ESG)
criteria into traditional banking which entails meeting present day needs without compromising
those of future generations.
Credit Registry System
As at 31 July 2018, the Credit Registry held over 570,000 records of which 434,485 were active
loan accounts. Individual records represented 99.12% of the active loan records in the credit
registry database. Total subscribers were 158 as at 31 July 2018, comprising all banking
institutions, 135 MFIs (including SMEDCO), and 4 non-banking institutions.
The Credit Registry usage levels by subscribing institutions increased steadily to a cumulative
total of 287,525 reports as at 31 July 2018. Inquiries by banking institutions constituted 83.53%
of the inquiries conducted as at 31 July 2018. Following the stabilization of the credit registry
system, the Reserve Bank has entered Phase 2 of the implementation process where MFIs will

51
be able to submit credit data to the credit registry. It is anticipated that MFIs credit data will be
available in the live database by 31 March 2019.
As part of efforts to raise awareness on the various initiatives being implemented to improve
the credit environment in the country, the Reserve Bank has held stakeholder workshops across
the country.
Supervision of Credit Bureaus
The Reserve Bank is finalising regulatory and oversight framework to guide the operations of
credit bureaus. The regulations will ensure the institutions continue to contribute in a positive
manner to the improvement of the credit referencing environment and the stability of the
financial system.
Collateral Registry
Following the promulgation of the Movable Property Security Interest Act in July 2017, the
Reserve Bank is finalising operationalisation of the Collateral Registry.
Macro-Prudential Policy Framework
The Reserve Bank is implementing the Basel III capital and liquidity framework which is
designed to improve the quality, consistency and transparency of capital and reduce pro-
cyclicality, as well as, enhance liquidity management.
The Reserve Bank is also prioritising the development of financial stability assessment models
and early warning tools. These include macro-stress tests and inter-bank contagion models.
International Financial Reporting Standard (IFRS) 9
The implementation of International Financial Reporting Standard 9 (IFRS 9) has now been
concluded. In this regard, banking institutions were required to publish the June 2018 interim
financial statements which are based on IFRS9. It is envisaged that disclosure requirements
and expected credit loss approach embedded in IFRS 9 will enhance bank risk management
and reinforce market discipline.

52

53
SECTION 5: DEVELOPMENTS ON NATIONAL PAYMENTS SYSTEM
The growth in the use of electronic means of payment was phenomenal and aggregated to $64.7
billion for six months ended June 2018, representing 216% increase compared to the same
period in last year. In value terms, the Real Time Gross Settlement System (RTGS) constituted
the largest contribution at 58% whilst mobile payments constituted the bulk in volume terms
at 84% out of a total 856 million transactions. The significant usage of mobile banking and
internet platforms indicate that the banking public’s confidence in the usage of plastic money
which resonates very well with the Bank’s vision of a cash-lite society by 2020.
The payment system landscape continued to witness significant growth and development due
to the emergent role of information and communication technology innovations. This was
evidenced by the transactional activity increases for electronic payment channels in value and
volume terms during the first half of 2018. Aggregate transactions values and volumes
increased by 216% and 227% respectively as indicated in the table below;
Table 16: E-payment Streams:- Values and Volumes for the six months period ended
June 2017/8
PAYMENT
STREAMS 2017 January to
June 2018
Proportion of
Total June % Change
VALUES
RTGS 14,499,231,288.40 37,637,564,118.55 58.12% 159.58%
POS 1,583,489,239.03 4,151,729,138.56 6.41% 162.19%
ATMS 118,617,660.73 77,972,379.51 0.12% -34.27%
MOBILE 2,828,024,721.20 17,268,033,670.82 26.66% 510.60%
INTERNET 1,456,553,800.54 5,628,587,532.29 8.69% 286.43%
TOTAL VALUE 20,485,916,709.90 64,763,886,839.73 100.00% 216.14%
VOLUMES
RTGS 1,420,517 3,220,722 0.38% 126.73%
POS 47,685,061 130,085,342 15.20% 172.80%
ATMs 2,170,358 1,652,192 0.19% -23.87%
MOBILE 140,846,148 717,947,730 83.89% 409.74%
INTERNET 896,416 2,931,865 0.34% 227.07%
TOTAL
VOLUME 193,018,500 855,837,851 100.00% 343.40%
54
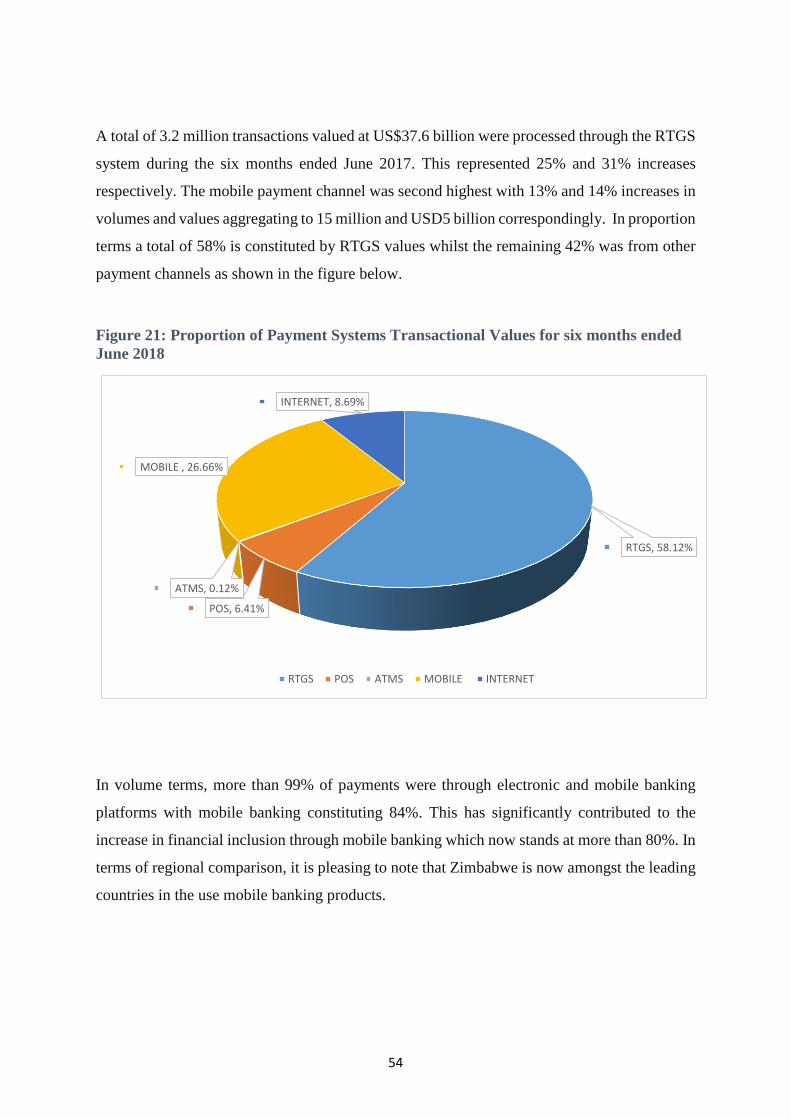
A total of 3.2 million transactions valued at US$37.6 billion were processed through the RTGS
system during the six months ended June 2017. This represented 25% and 31% increases
respectively. The mobile payment channel was second highest with 13% and 14% increases in
volumes and values aggregating to 15 million and USD5 billion correspondingly. In proportion
terms a total of 58% is constituted by RTGS values whilst the remaining 42% was from other
payment channels as shown in the figure below.
Figure 21: Proportion of Payment Systems Transactional Values for six months ended
June 2018
In volume terms, more than 99% of payments were through electronic and mobile banking
platforms with mobile banking constituting 84%. This has significantly contributed to the
increase in financial inclusion through mobile banking which now stands at more than 80%. In
terms of regional comparison, it is pleasing to note that Zimbabwe is now amongst the leading
countries in the use mobile banking products.
RTGS, 58.12%
POS, 6.41%
ATMS, 0.12%
MOBILE , 26.66%
INTERNET, 8.69%
RTGS POS ATMS MOBILE INTERNET

55
Payment Access and Devices
It tandem with the increase in both volume and value of plastic money transactions, the
economy continued to witness a sustained growth in payment systems devices and access
points as shown in the Table below.
Table 17: Payment Access and Devices for the period ended June 2018
PAYMENT SYSTEMS ACCESS POINTS
Description
Fourth
Quarter
ending
December
2016
First
Quarter
ending
March
2017
Second
Quarter
ending June
2017
Third Quarter
ending
September
2017
Quarter
ending
December
2017
Quarter
ending
March 2018
Mobile
Banking Agents
40,590 40,540 42,102 44,793 47,838 48,812
ATMs 569 557 562 563 561 563
POS 32,629 40,011 44,805 50,418 59,939 70,960
PAYMENT SYSTEMS ACCESS DEVICES
Debit Cards 3,127,153 3,359,455 3,780,389 4,186,957 4,281,683 4,471,819
Credit Cards 16,030 16,945 17,510 17,806 17,411 17,268
Prepaid Cards 43,288 46,593 52,384 62,517 63,987 68,180
Active Mobile
Banking Subscribers
3,279,049 3,214,001 3,353,916 3,821,865 4,611,608 4,907,500
Internet
Banking
Subscribers 168,339 177,920 205,104 250,681 277,674 286,222
Mobile banking agents increased to 48,812 in the first quarter ending 31 March 2018 from
47,838 reported in the fourth quarter ended 31 December 2017. Point of Sale (POS) population
increased to 70,960 from 59,939 in line with the promotion of electronic means of payment
and ATM population increased to 563 from 561. Out of 9.6 million registered mobile money
transfer, 4.9 million were active mobile financial services subscribers compared to 4.6 million
registered subscribers recorded in the previous quarter.

56
NPS Strategic Framework
The Reserve Bank is currently seized with reviewing the National Payment Strategic
Framework (NPSF) which is targeted for the next 10 years. In line with that, the Reserve Bank
envisions a payment services sector by 2030 with the following key features, characteristics
and capabilities:
i. Advanced payment systems infrastructure leveraging on new technological
developments;
ii. Cash-lite society characterized by digital financial services; and,
iii. A robust legal and regulatory framework benchmarked to international best practice
among others.
To this end, it is important to note that developments in payment, clearing and settlements
systems dovetail well with the government‘s policy of achieving a middle income economy by
year 2030.
Cyber Security Threat
Cyber security risk has emerged as a major recognised risk globally and our economy is no
exception. This is primarily due to the increasing reliance on information and communication
technology by businesses and the evolving sophistication of cybercrimes. Globally, the
frequency in the type and number of cyber related crimes, breaches, attempts, attacks and
intrusions continue to grow unabated.
The most common cybercrimes in Zimbabwe are card cloning, fraud, identity theft, money
laundering through electronic vandalism among others. A number of internet users have
encountered spam emails, phishing attempts and fake websites via malware and key-logger
attempts and even via USB sticks that may have been infected with viruses that once accessed
a defrauded person. Given the magnitude of the challenge at hand, it is imperative for all
stakeholders across the divide to collaborate with a view to addressing the cyber-security risk.
The Central Bank is of the view that the ethos of effective corporate governance supported by
appropriate information technology security risk management measures can be a strong
foundation towards successful protection against cybercrime. Refer to Annexure attached.
Migration to Euro Mastercard Visa (EMV) Technology
Linked to the cyber security concern, the Central Bank has been encouraging the market players
since 2016 to migrate to Euro MasterCard and Visa standards (EMV) which ensure enhanced

57
card security features. Payment service providers and the banking community have made
significant progress towards EMV migration following the project launched in November
2016. Notably, most institutions have completed the required processes and successfully
implemented the EMV technology and standards. The purpose of the migration from magnetic
strip cards to EMV cards is to enhance security for card payments and prevent any possible
cybercrime. The Central Bank urges those institutions, which have not yet complied to
expeditiously implement the requisite EMV standards to protect the customer and the entity
itself. It is therefore expected that all card infrastructure should be compliant with EMV
standards by 31 December, 2018.
Consumer Protection Agenda
Financial institutions are reminded that the Guideline for Retail Payment Systems and
Instruments issued to the market in August 2017, requires all regulated entities to uphold
consumer protection rights across all their payment systems services.
The Guideline explicitly require that consumers receive information that will allow them to
make informed decisions, are not subject to unfair and deceptive practices, and have access to
recourse mechanisms to resolve disputes. Providers are urged to avail the requisite training to
their staff members to ensure compliance with the Guideline in its entirety.
Payment System Capacity
The Central Bank has noted significant improvement in payment systems’ capacity
enhancements over the last six months in terms of infrastructure investment and development
though there are some existing glaring gaps. As Regulatory Authorities, we encourage the
financial institutions and payment systems providers’ management to continue investing and
leveraging on the new technological developments to maintain financial stability. More
importantly, system capacity is one of the cornerstones for effective risk management strategy
and as such should be pro-actively embedded in business processes rather than merely as a
regulatory formality. As volumes of transactions increase there is a need to have the requisite
system capacity to handle such positive developments.
Regional Payment Streams
The SADC Integrated Regional Electronic Settlement System (SIRESS) has made progress,
moving from single currency settlement system (Rand settlement) into a multicurrency
settlement system, with the US Dollar as the additional currency of settlement. Settlement in

58
US Dollars on the current platform is expected to go live in October 2018.The introduction of
the USD transactional channel on the SIRESS platform is an important milestone for the
country given the current multi-currency policy. This is expected to consolidate progress and
catalyze developments within the economy. The aggregate transactions increased by 29% to
ZAR 7.5 billion in value terms whilst volumes declined to 5454 transactions representing 21%
decrease during the six months ended June 2018. In view of the progress to date, the Reserve
Bank will continue to strengthen its supervisory capacity and cooperate with other regulators
in the region for the adoption of international best practices and ensuring that all cross border
financial entities are effectively supervised. We therefore continue to urge individuals and
companies to utilise the available infrastructure that bring the requisite efficiency and cost
reduction.