Embed Size (px)
Citation preview
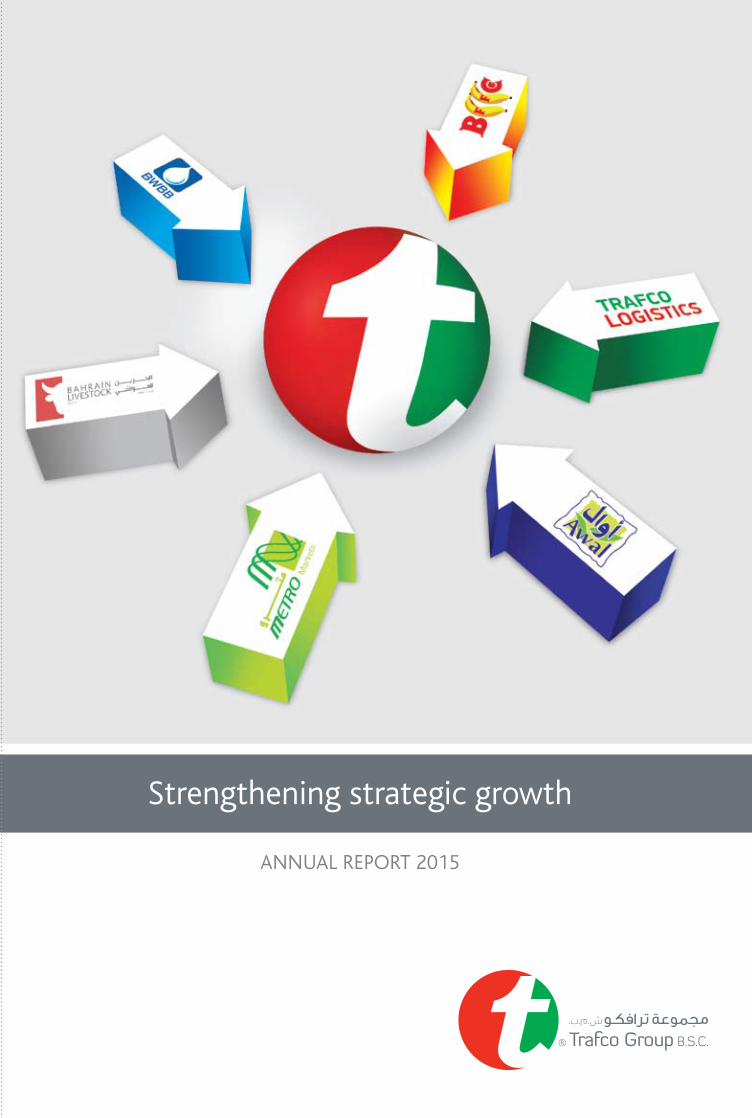
Strengthening strategic growth
ANNUAL REPORT 2015
P O Box 20202, Manama, Kingdom of Bahrain Telephone: 17 729000, Fax: 17 727380, www.trafco.com
Sustainable growth with synergy and perfect balance

His Royal Highness Prince Salman Bin Hamad Al KhalifaThe Crown Prince, Deputy Supreme Commander and First Deputy Prime Minister
His Royal MajestyKing Hamad Bin Isa Al KhalifaThe King of the Kingdom of Bahrain
His Royal HighnessPrince Khalifa Bin Salman Al KhalifaThe Prime Minister
ANNUAL REPORT 20152
Over 3 decades of exceptional service
Trafco Group B.S.C (TRAFCO) was incorporated in the year 1977 as a public joint stock company as part of an initiative to revolutionize and rejuvenate the food industry of the Kingdom of Bahrain. The Company was successfully turned into Public Share Holding Company with initial public offering in 1980 and was later listed in Bahrain Bourse. In the last 3 decades the company en route to success has achieved several milestones and has earned itself the reputation of being one among the best in the Fast Moving Consumer Goods (FMCG) industry. Born out of a vision to be at the forefront of the food industry, TRAFCO is today a household name synonymous with some of the finest food products in the world. Moreover, being one of the oldest food conglomerate in Bahrain, it has gained trust and admiration for its commitment to quality, value and service excellence.
Serving Bahrain with the best from across the globe
The core business of the parent Company is import & distribution of food & non-food products, and with group annual sales turnover of US$ 109 million, TRAFCO is one of the largest & biggest FMCG conglomerates in Bahrain with an extensive range of products comprising of canned, frozen & dry food and non-food products, general commodities, fresh fruits and vegetables as well as livestock, chilled & frozen meat imported from countries such as Australia, Brazil, Europe, the Far East, India, UK, USA, Pakistan, besides Arab and Middle East countries. With stringent and reliable quality control systems in place, TRAFCO continues to introduce many world renowned brands with the assurance of excellent quality and exceptional service.
Success through synergy
As part of its vision to become a dominant player in food industry, TRAFCO is propelling its expansion through organic and inorganic growth. TRAFCO has invested in developing the food industry of Bahrain by acquiring BWBB, BFFC, Metro Markets and has invested in Trafco Logistics Co. (TLC) and by owning majority stake in Awal Dairy Company W.L.L., BANZ Group and Bahrain Livestock Company. To serve Bahrain’s objective of economic integration among GCC countries, a fully owned Kuwait Bahrain Dairy Company was established in 1992. Awal Dairy exports its products to Kuwait, Saudi Arabia, UAE, Jordan, Iraq, Yemen and North & West Africa.
BWBB: Bahrain Water Bottling & Beverages, 100% subsidiary of TRAFCO has received HACCP certificate & ISO 22000:2005 from SGF Gulf UAE for the quality of water it produces, awarded by institutions specializing in water analysis supported by Saudi and the Gulf standards. BWBB is one among very few companies in Bahrain that are into manufacturing and bottling of mineral water with strict adherence to quality control. BWBB is the market leader in water bottling industry and TYLOS is the brand leader in the segment in addition to other brands like Salsabil. Apart from the private labeling business, the company is also manufacturing ‘metro’ brand in its production line which is marketed by Trafco. During the year the company added a new product line of 200ml under a new brand “Marwa”.
BFFC: Bahrain Fresh Fruits Company, a pioneer in food industry was acquired in the year 2009 and is 100% subsidiary of TRAFCO. The Company was incorporated in the year 1998 and with its state-of-the -art infrastructure along with a dedicated & committed workforce has become a dominant player in FMCG sector. BFFC is very active in two core food businesses - one being import and distribution of fresh fruits & vegetables and
the other, import and distribution of frozen, chilled & dry food and non-food products. Our fruits & vegetables division is one of the biggest in Bahrain with largest banana ripening chambers. Few of the brands to reckon with in FMCG division are Tilly-Sabco chicken, Frico cheese from Friesland, Bridel from Lactalies Europe, Delmonte and Chiquita & Frutia brand bananas, Coroli Oil and Alzook frozen products from Saudi Arabia. The company during the year added to its basket some new product lines of Unilever-India.
Metros: Metro Markets Co. is 100% owned and is the retail arm of TRAFCO. Spanning across various parts of Bahrain, Metro is undoubtedly one of the most rapidly expanding supermarket chains in the Kingdom. Metro known for their strict adherence to quality control and standards, have been over the years, patronized by discerning customers who value its superior products and services. The company is on the look out for new locations to open branches.
Trafco Logistics: Trafco Logistics Co. which commenced its operation from May 2010 is conveniently located in Galali. The US$ 14 million logistics complex is a wholly owned subsidiary of TRAFCO which is focusing on 3PL. This state-of-the-art logistic facility with sophisticated technology and exceeding 20,000 cubic meter space with Frozen, Chilled and Dry facilities located in close proximity to the Airport and the new Seaport has propelled TRAFCO into the elite group of logistic solution providers in Bahrain. The company is also looking for new avenues for expansion of the storage space since its customer- base is increasing including contracts with the government agencies.
Awal Dairy: The first dairy company in Bahrain to be incorporated in the year 1963, TRAFCO holds 51% shareholding in Awal Dairy. The Company is ISO 2200:2005 certified and adheres to international food and safety standards. Latest technology, innovative & excellent products, proficient manpower, sophisticated logistics and outstanding customer care have made Awal Dairy the market leader in Bahrain. Awal Dairy offers novel range of fruit juices and drinks, fresh milk under brand name “Noor”, UHT milk under brand name ”Awal” and ‘’Fabion” ice creams in addition to other value added products. Awal Dairy is the first in the Arabian Gulf and second in the world to invest in Tetra Brick Aseptic 1000ml slim pack with re-cap system. The Company with a workforce of around 300 people and with combined production capacity exceeding 200,000 metric tons is one among the biggest in the GCC region. During the year the company increased its export market share covering North & West Africa and Yemen in addition to its export to GCC countries, Jordan and Iraq.
BLSC: Bahrain Live Stock Company was established in the year 2000 and was fully responsible to provide red meat requirements of all Bahrain market on the government subsidized and price controlled basis. TRAFCO owns 36.3% and since 1st Oct 2015, when the policy of meat subsidy was discontinued, BLSC is now focusing on the free market trade and diversifying into more of chilled and frozen meat besides live stock. BLSC is the owner and operator of the main licensed slaughter house in the Kingdom of Bahrain.
Glimpse of the future
Success, as we all know, is not the destination but an on-going process. We, at TRAFCO, strongly believe in this philosophy. Reason why, the company is all set to expand further in the future, thus, underscoring the management’s objectives to serve not only the local market but also across the GCC region.
Company Profile
ANNUAL REPORT 2015 3
VisionTRAFCO to be recognized as a household name synonymous with finest food products in the GCC.
MissionTo ensure customer satisfaction by delivering superior quality products, the highest level of service and diverse range of world-leading brands at the most competitive prices.
Strategic GoalsBacked by strong financial stability, support of the stakeholders, team of professionals HR, IT, Finance, Storage and efficient fleet management system, TRAFCO group strives to enhance their business by diversifying into various segments in food category.
Key Business Plan• Diversifying into sectors of private labelling• Accelerate new product launches, brands, agencies, distributions• Expand management team in sales/marketing• Strengthen human resources functions• Seek new market segments in food category• Locate new corporate premises• Participating in trade shows and fairs• Develop overseas market entry plans• Expansion in the export market
T eamwork R el iabi l i ty A ccountabi l i ty F airness C ommitment O pt imum Value
ValuesThe company is guided by the following core values in its endeavour to realize its corporate vision:
SWOT AnalysisStrength• Over 3 decades of presence with infrastructure
facilities including logistics services.• Key Customer BaseWeakness• Dependability on few major brandsOpportunities• Access to all sources of vendors, manufacturers
and growers all over the world. • Scope to diversify into related market segments• Distribution channels seeking new productsThreats• Growing competition by small and medium
players in the same sector.• Price sensitive market
Aiming for global Excellence
ANNUAL REPORT 20154
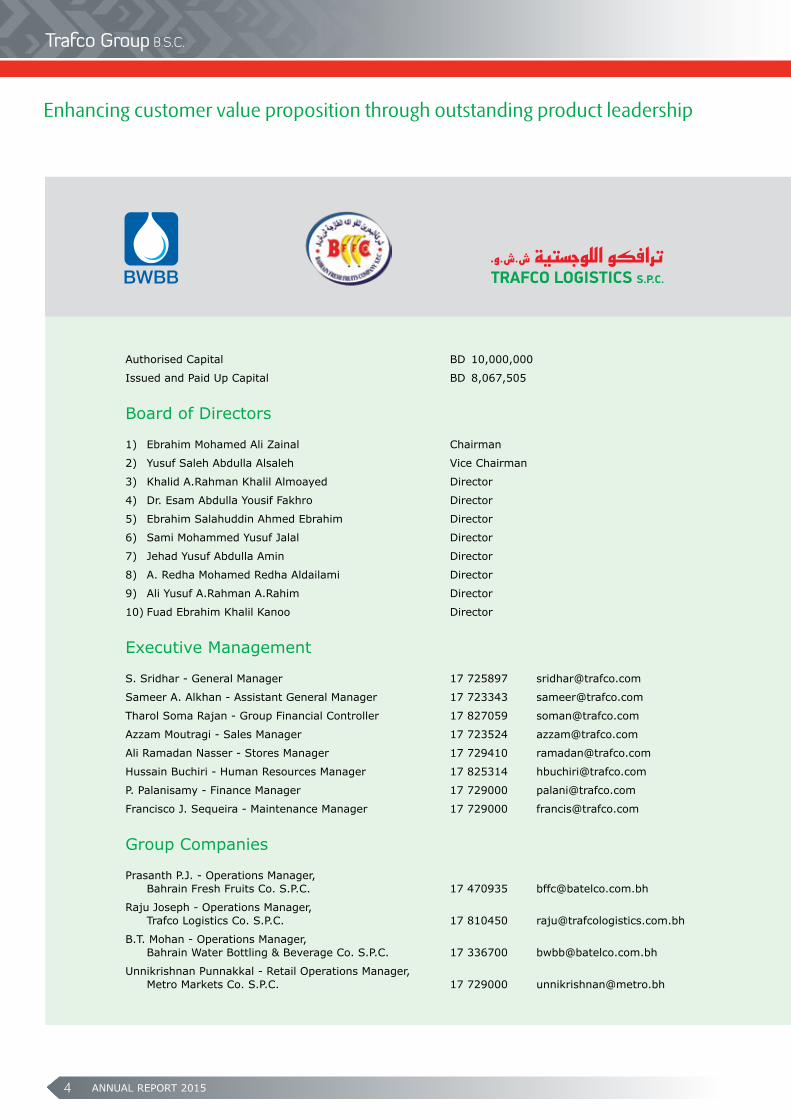
Authorised Capital BD 10,000,000
Issued and Paid Up Capital BD 8,067,505
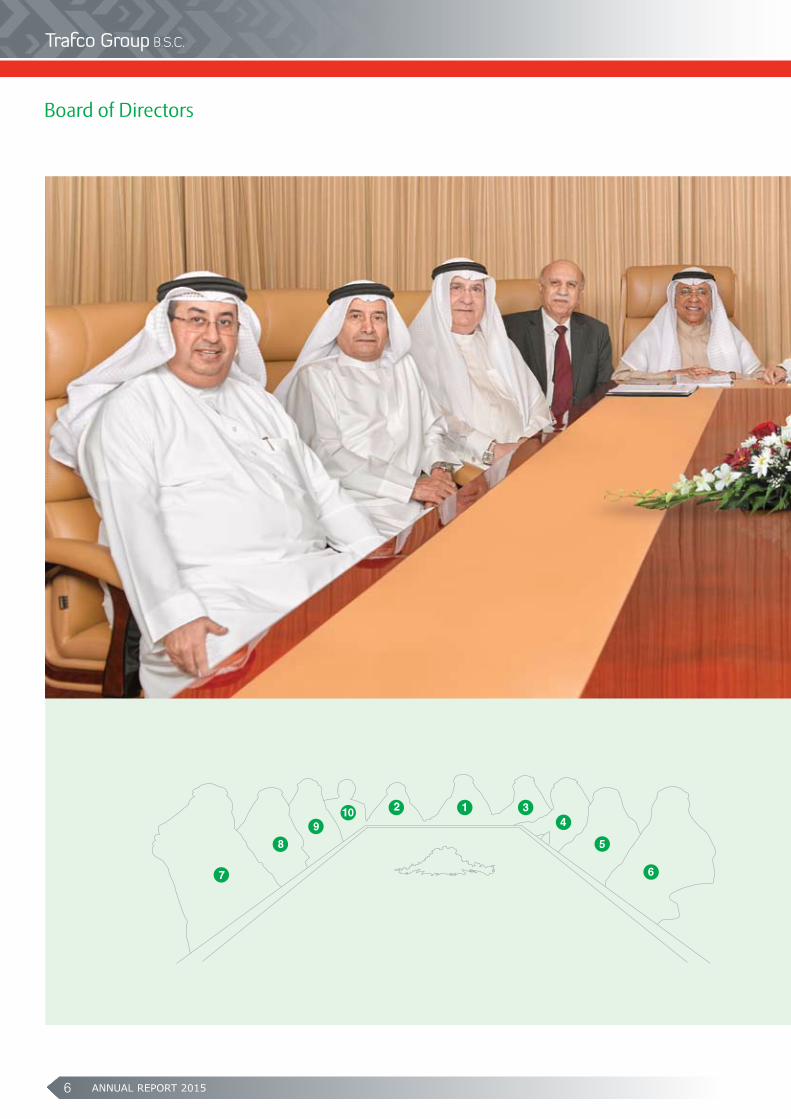
Board of Directors
1) Ebrahim Mohamed Ali Zainal Chairman
2) Yusuf Saleh Abdulla Alsaleh Vice Chairman
3) Khalid A.Rahman Khalil Almoayed Director
4) Dr. Esam Abdulla Yousif Fakhro Director
5) Ebrahim Salahuddin Ahmed Ebrahim Director
6) Sami Mohammed Yusuf Jalal Director
7) Jehad Yusuf Abdulla Amin Director
8) A. Redha Mohamed Redha Aldailami Director
9) Ali Yusuf A.Rahman A.Rahim Director
10) Fuad Ebrahim Khalil Kanoo Director
Executive Management
S. Sridhar - General Manager 17 725897 [email protected]
Sameer A. Alkhan - Assistant General Manager 17 723343 [email protected]
Tharol Soma Rajan - Group Financial Controller 17 827059 [email protected]
Azzam Moutragi - Sales Manager 17 723524 [email protected]
Ali Ramadan Nasser - Stores Manager 17 729410 [email protected]
Hussain Buchiri - Human Resources Manager 17 825314 [email protected]
P. Palanisamy - Finance Manager 17 729000 [email protected]
Francisco J. Sequeira - Maintenance Manager 17 729000 [email protected]
Group Companies
Prasanth P.J. - Operations Manager, Bahrain Fresh Fruits Co. S.P.C. 17 470935 [email protected]
Raju Joseph - Operations Manager, Trafco Logistics Co. S.P.C. 17 810450 [email protected]
B.T. Mohan - Operations Manager, Bahrain Water Bottling & Beverage Co. S.P.C. 17 336700 [email protected]
Unnikrishnan Punnakkal - Retail Operations Manager, Metro Markets Co. S.P.C. 17 729000 [email protected]
Enhancing customer value proposition through outstanding product leadership
ANNUAL REPORT 2015 5
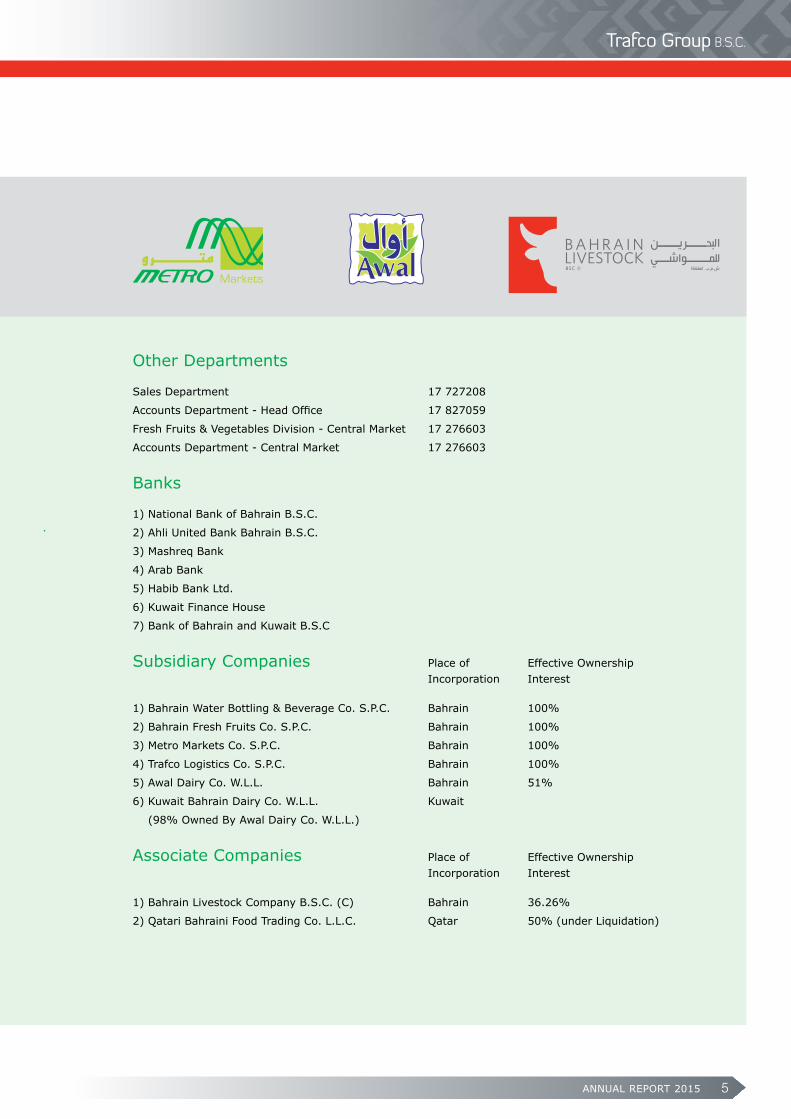
Other Departments
Sales Department 17 727208
Accounts Department - Head Office 17 827059
Fresh Fruits & Vegetables Division - Central Market 17 276603
Accounts Department - Central Market 17 276603
Banks
1) National Bank of Bahrain B.S.C.
2) Ahli United Bank Bahrain B.S.C.
3) Mashreq Bank
4) Arab Bank
5) Habib Bank Ltd.
6) Kuwait Finance House
7) Bank of Bahrain and Kuwait B.S.C
Subsidiary Companies Place of Effective Ownership Incorporation Interest
1) Bahrain Water Bottling & Beverage Co. S.P.C. Bahrain 100%
2) Bahrain Fresh Fruits Co. S.P.C. Bahrain 100%
3) Metro Markets Co. S.P.C. Bahrain 100%
4) Trafco Logistics Co. S.P.C. Bahrain 100%
5) Awal Dairy Co. W.L.L. Bahrain 51%
6) Kuwait Bahrain Dairy Co. W.L.L. Kuwait
(98% Owned By Awal Dairy Co. W.L.L.)
Associate Companies Place of Effective Ownership Incorporation Interest 1) Bahrain Livestock Company B.S.C. (C) Bahrain 36.26%
2) Qatari Bahraini Food Trading Co. L.L.C. Qatar 50% (under Liquidation)
ANNUAL REPORT 20156
Board of Directors
1 34
5
67
8
910 2
ANNUAL REPORT 2015 7
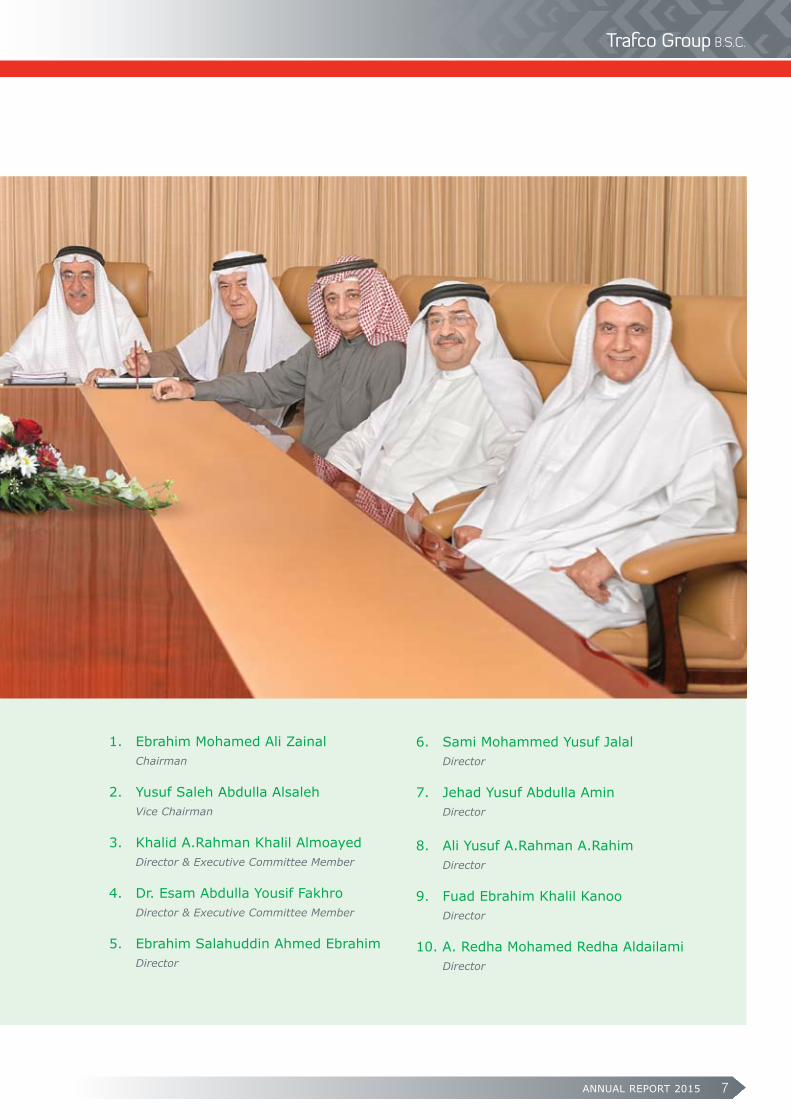
1. Ebrahim Mohamed Ali Zainal Chairman
2. Yusuf Saleh Abdulla Alsaleh Vice Chairman
3. Khalid A.Rahman Khalil Almoayed Director & Executive Committee Member
4. Dr. Esam Abdulla Yousif Fakhro Director & Executive Committee Member
5. Ebrahim Salahuddin Ahmed Ebrahim Director
6. Sami Mohammed Yusuf Jalal Director
7. Jehad Yusuf Abdulla Amin Director
8. Ali Yusuf A.Rahman A.Rahim Director
9. Fuad Ebrahim Khalil Kanoo Director
10. A. Redha Mohamed Redha Aldailami Director
ANNUAL REPORT 20158
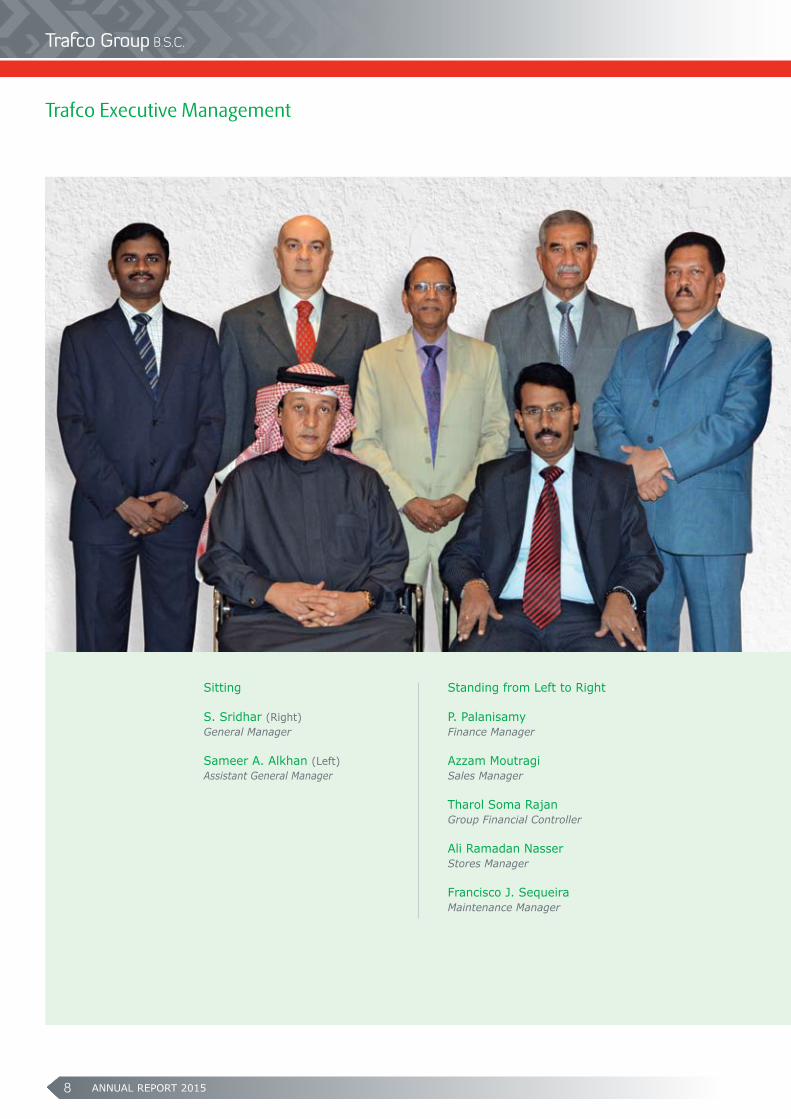
Sitting
S. Sridhar (Right) General Manager
Sameer A. Alkhan (Left)Assistant General Manager
Standing from Left to Right
P. PalanisamyFinance Manager
Azzam MoutragiSales Manager
Tharol Soma RajanGroup Financial Controller
Ali Ramadan NasserStores Manager Francisco J. SequeiraMaintenance Manager
Trafco Executive Management
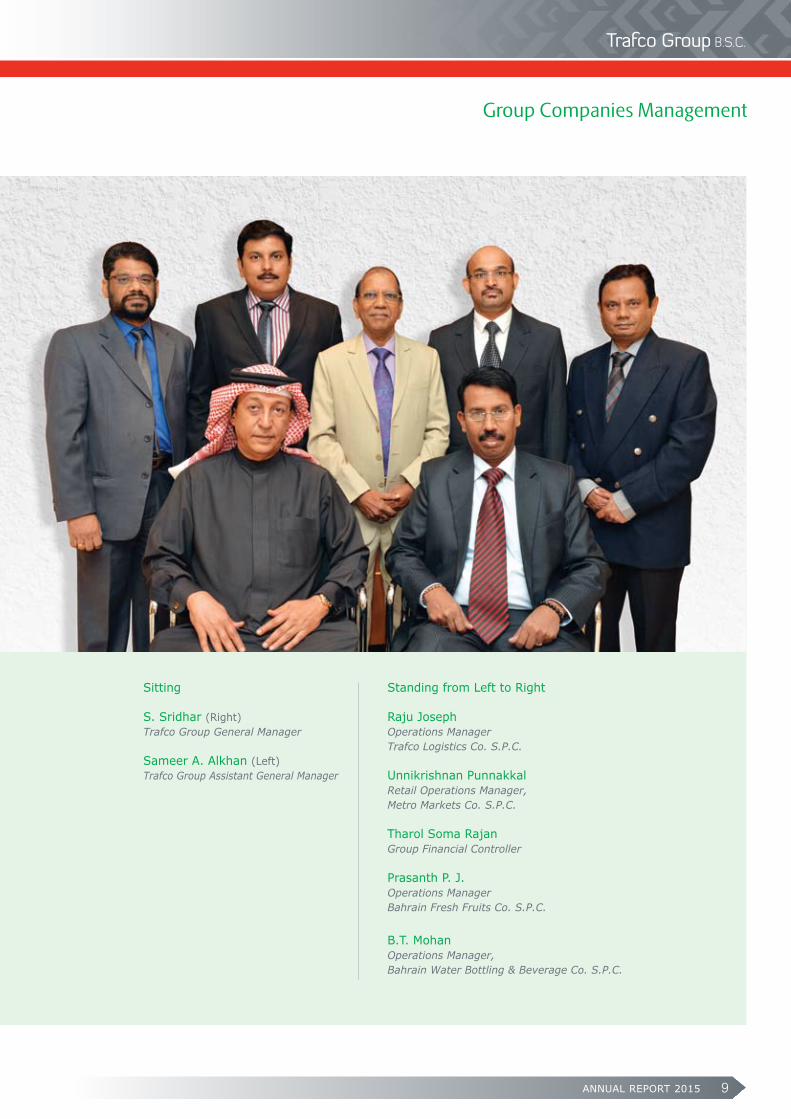
ANNUAL REPORT 2015 9
Sitting
S. Sridhar (Right)Trafco Group General Manager
Sameer A. Alkhan (Left)Trafco Group Assistant General Manager
Standing from Left to Right
Raju JosephOperations ManagerTrafco Logistics Co. S.P.C.
Unnikrishnan PunnakkalRetail Operations Manager,Metro Markets Co. S.P.C.
Tharol Soma RajanGroup Financial Controller
Prasanth P. J. Operations ManagerBahrain Fresh Fruits Co. S.P.C.
B.T. Mohan Operations Manager,Bahrain Water Bottling & Beverage Co. S.P.C.
Group Companies Management
ANNUAL REPORT 201510
Continued decline of fuel prices during 2015 had a direct impact on commodity prices and hence the year saw a steep downward trend of the food prices and in particular the items handled by the group such as dairy products, sugar, rice and vegetable oil. Further the drop of corn and poultry & livestock feed prices were the main cause for the fall of frozen chicken and meat prices. On the other hand the impact of oil prices were also visible on the cost of transportation and freight. Trafco Group achieved positive results during the year with the increase of group sales to BD 41 million as against previous year’s BD 40.2 million. The net profit was reported at BD 1.717 million with 7.9% growth over previous year’s BD 1.592 million. The group also achieved an improved performance in the core operation in addition to income from the investment portfolio.
Awal Dairy Company (ADC)
During the year, the company was able to achieve a total sales of over BD 13 million at par with the previous year, and in turn managed to increase its share in export market with the smooth flow of traffic in the King Fahad Causeway. This helped the company to regain some of the market that it had lost in the past years. The group and company’s participation in Gulf Food Exhibition-2015 at Dubai also opened up new opportunities in export to certain new markets like North & West Africa and Yemen, in addition to the company’s sales in GCC countries, Jordan and Iraq. As a result of the drop of prices of raw material and packing material used in the production of dairy products, the company witnessed improved performance in production resulting in achievement of better profit margin this year and we hope this positive performance continues in the coming year as well.
Bahrain Water Bottling and Beverage Co. (BWBB)
This fully owned subsidiary achieved BD 1.28 million sales this year compared to BD 1.16 million last year with an increase of 10%. The continued improvement in the performance minimized the losses from last year’s BD 90k to BD 44k this year, a drastic improvement of 51%. During the 2nd half of the year the company introduced a new brand under the name ‘marwa’ with 200ml size which gained remarkable acceptance by consumers. The company overcame all technical obstacles encountered in the previous years. Since 2015 is the last year of bearing the negative impact of large amount of depreciation on the obsolete machinery which is now fully depreciated, the management expects the results to be positive in the coming years according to the forecast submitted by them.
Bahrain Fresh Fruits Company (BFFC)
Though the company maintained same sales as of last year at BD 4.77 million, the bottom results were negative and recorded this year’s losses of BD 6k, compared to previous year’s profit of BD 38k as a direct result of losses incurred from the sales of some fresh fruits. The company will continue to diversify the sources and types of imported frozen foods and cheeses without relying fully on fruits and vegetables only.
Metro Markets Company (Metro)
This retail arm of the group with 6 outlets operating in the neighbourhood of the island appointed a new Operations Manager during the year. The company achieved sales of BD 2.7million at par with last year with a net profit of BD 42k, slightly dropping from last year’s BD 50k. The group continues to add new products to its basket of goods marketed under its own brand ‘metro’.
In the name of Allah, Most Gracious, Most Merciful
Report of The Board of Directors
ANNUAL REPORT 2015 11
Report of The Board of Directors
Trafco Logistics Company (TLC)
For the first time the company achieved a net profit of BD 73k after suffering losses continuously over the past years since its inception. The new Operation Manager appointed during the year secured new customers and signed new contract with government departments. Despite the intense competition in this sector, the demand for logistics and warehousing is still growing. The storage prices are likely to go up gradually bearing in mind the new electricity tariff that would come into force. Qatari Bahraini Food Trading Company (QBC)
As previously informed to the shareholders, the board constituted by both the partners took the decision to liquidate the company in view of the accumulated losses and the liquidation process was assigned to the Qatari partner. However they have not completed the formalities of liquidation so far and we are expecting our share of proceeds of some of the assets sold in the new financial year 2016. The group has taken all required financial provisions in subsequent financials and do not expect any further financial implication in the new year.
Bahrain Livestock Company (BLSC)
As recommended by the auditors, during the fiscal year the shareholders including the government owned Mumtalakat decided to distribute the treasury shares at 9% of the total holdings to individual holding of 3 shareholders proportionately. This allocation increased our stake from 33% to 36.26% in the equity of the company. As a direct result of the withdrawl of of meat subsidy by the government from Oct 2015, the company suffered losses in the 4th quarter of the fiscal year.
With falling selling prices in the market, the company was forced to reduce its selling price below cost in order to liquidate the large inventory of Australian live sheep. Hence the losses suffered in the 4th quarter wiped out all the profits made in nine months and our share in company’s fiscal year losses were included in the consolidated financials of the group. This associate company continues its operation with the new General Manager and restructured management with the focus on chilled and frozen meat from diversified sources than relying on imported livestock. The management is striving to accept new challenges with the hope of achieving profits in the coming year.
Issues related to corporate governance process
The company complies with all corporate governance requirements and the related committees and executive management follow these matters. The annual report clearly indicates all information with regard to the board and their participation in different committees. The board would like to inform the shareholders that members of the board have interest or own stake since long in companies that have some or all similar activities to the group. All transactions with related parties including board members or companies that they have interest in, are being made in full transparency and on normal commercial basis.
Financial results and recommendations on distribution of the profits
Audited Net Profit for the financial year ended 31 December 2015 amounted to BD 1,717,626 and with the addition of retained earnings carried from the previous year BD 1,661,336 and after transfer of statutory reserve of a subsidiary BD 24,190, the total net profit distributable will be BD 3,354,772. The board of directors recommends the distribution of these profits as follows:
• Statutory reserve BD 173,414
• General reserve BD 50,000
• Cash dividend to shareholders at 16% BD 1,235,510
Retained earnings carried to 2016 BD 1,895,848
• Allocation to donations and charity BD 40,000
• Directors’ remuneration BD 107,625
Total provision BD 147,625
The allocation for the directors’ remuneration and charitable donation provisions will be included in the accounts for the financial year 2016 subject to AGM approval.
ANNUAL REPORT 201512
On behalf of all shareholders, the Board of Directors is grateful to His Royal Majesty King Hamad Bin Isa Al Khalifa, King of the Kingdom of Bahrain, His Royal Highness Prince Khalifa bin Salman Al Khalifa, the Prime Minister and His Royal Highness Prince Salman Bin Hamad Al Khalifa, Crown Prince and Deputy Supreme Commander and First Deputy Prime Minister. We would also like to thank all the ministers and officials from the ministries and institutions of the Kingdom of Bahrain for their cooperation and the continued support and assistance to the company and its subsidiaries and associates.
We would also like to show our gratitude towards the administration and employees for their untiring efforts and dedication to work without whom the company could not have achieved this growth and good results.
We also like to sincerely thank our valued customers and our clients for their support who had a positive role in selling our products which resulted in gaining the customers’ confidence and trust in our products.
105: And say (O Muhammad saw) “Do Deeds, Allah Will See Your Deeds And (so will) His Messenger And The Believers”: Al Tawba, The Holy Qur’an.
Ebrahim Mohamed Ali ZainalChairmanBahrain, 20 February 2016
Acknowledgements
ANNUAL REPORT 2015 13
Auditors’ Report
Independent Auditors’ Report To The Shareholders Of Trafco Group B.S.C.Report on the consolidated financial statements We have audited the accompanying consolidated financial statements of Trafco Group B.S.C. (‘the Company’) and its subsidiaries (together ‘the Group’), which comprise the consolidated statement of financial position as at 31 December 2015, and the consolidated statements of income, other comprehensive income, cash flows and changes in equity for the year then ended, and a summary of significant accounting policies and other explanatory information.
Board of Directors’ responsibility for the consolidated financial statements
The Company’s Board of Directors is responsible for the preparation and fair presentation of these consolidated financial statements in accordance with International Financial Reporting Standards, and for such internal control as the Board of Directors determines is necessary to enable the preparation of consolidated financial statements that are free from material misstatement, whether due to fraud or error. Auditors’ responsibility Our responsibility is to express an opinion on these consolidated financial statements based on our audit. We conducted our audit in accordance with International Standards on Auditing. Those standards require that we comply with ethical requirements and plan and perform the audit to obtain reasonable assurance about whether the consolidated financial statements are free from material misstatement. An audit involves performing procedures to obtain audit evidence about the amounts and disclosures in the consolidated financial statements. The procedures selected depend on the auditors’ judgement, including the assessment of the risks of material misstatement of the consolidated financial statements, whether due to fraud or error. In making those risk assessments, the auditor considers internal control relevant to the entity’s preparation and fair presentation of the consolidated financial statements in order to design audit procedures that are appropriate in the circumstances, but not for the purpose of expressing an opinion on the effectiveness of the entity’s internal control. An audit also includes evaluating the appropriateness of accounting policies used and the reasonableness of accounting estimates made by the Company’s Board of Directors, as well as evaluating the overall presentation of the consolidated financial statements. We believe that the audit evidence we have obtained is sufficient and appropriate to provide a basis for our audit opinion.
Opinion In our opinion, the consolidated financial statements present fairly, in all material respects, the financial position of the Group as of 31 December 2015, its consolidated financial performance and its consolidated cash flows for the year then ended in accordance with International Financial Reporting Standards. Report on other regulatory requirements As required by the Bahrain Commercial Companies Law, we report that: a) the Company has maintained proper accounting records
and the consolidated financial statements are in agreement therewith; and
b) the financial information contained in the Report of Board of Directors is consistent with the consolidated financial statements.
We are not aware of any violations of the Bahrain Commercial Companies Law, the Central Bank of Bahrain (CBB) Rule Book (applicable provisions of Volume 6) and CBB directives, regulations and associated resolutions, rules and procedures of the Bahrain Bourse or the terms of the Company’s memorandum and articles of association during the year ended 31 December 2015 that might have had a material adverse effect on the business of the Company or on its consolidated financial position. Satisfactory explanations and information have been provided to us by the management in response to all of our requests.
Auditor’s Registration No. 115 20 February 2016 Manama, Kingdom of Bahrain
ANNUAL REPORT 201514
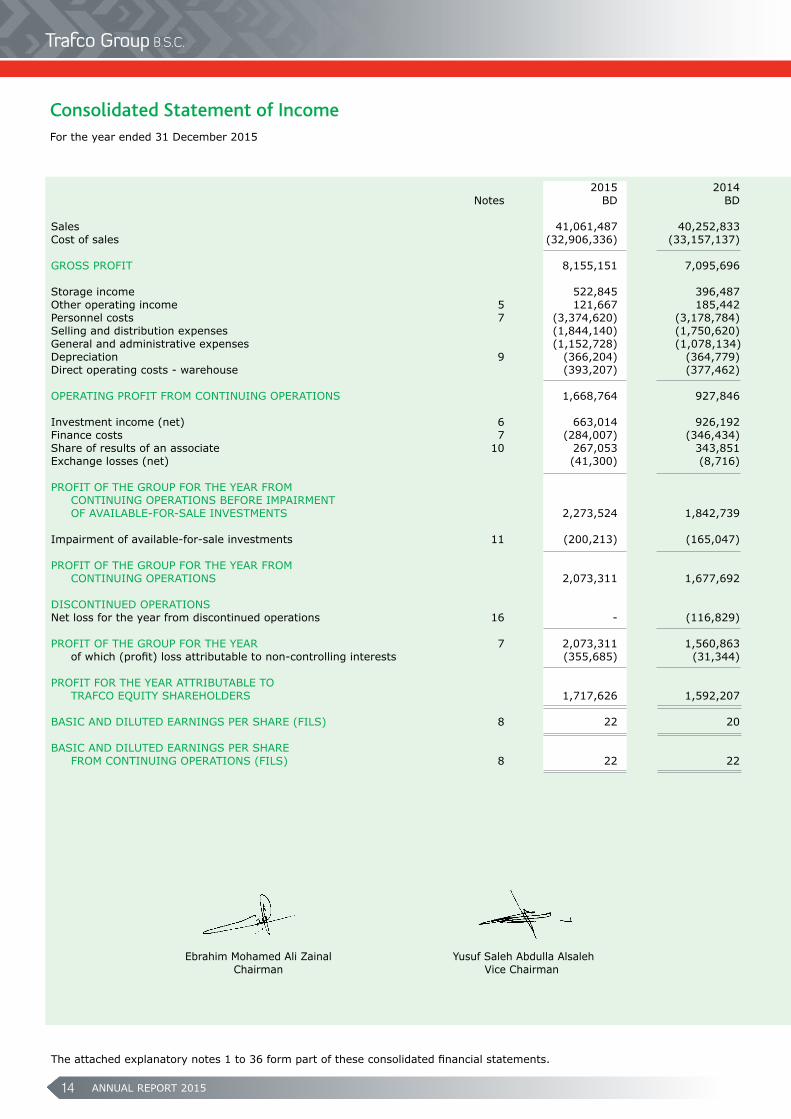
2015 2014 Notes BD BD Sales 41,061,487 40,252,833Cost of sales (32,906,336) (33,157,137)
GROSS PROFIT 8,155,151 7,095,696 Storage income 522,845 396,487Other operating income 5 121,667 185,442Personnel costs 7 (3,374,620) (3,178,784)Selling and distribution expenses (1,844,140) (1,750,620)General and administrative expenses (1,152,728) (1,078,134)Depreciation 9 (366,204) (364,779)Direct operating costs - warehouse (393,207) (377,462)
OPERATING PROFIT FROM CONTINUING OPERATIONS 1,668,764 927,846 Investment income (net) 6 663,014 926,192 Finance costs 7 (284,007) (346,434)Share of results of an associate 10 267,053 343,851Exchange losses (net) (41,300) (8,716) PROFIT OF THE GROUP FOR THE YEAR FROM CONTINUING OPERATIONS BEFORE IMPAIRMENT OF AVAILABLE-FOR-SALE INVESTMENTS 2,273,524 1,842,739
Impairment of available-for-sale investments 11 (200,213) (165,047)
PROFIT OF THE GROUP FOR THE YEAR FROM CONTINUING OPERATIONS 2,073,311 1,677,692 DISCONTINUED OPERATIONS Net loss for the year from discontinued operations 16 - (116,829)
PROFIT OF THE GROUP FOR THE YEAR 7 2,073,311 1,560,863 of which (profit) loss attributable to non-controlling interests (355,685) (31,344) PROFIT FOR THE YEAR ATTRIBUTABLE TO TRAFCO EQUITY SHAREHOLDERS 1,717,626 1,592,207
BASIC AND DILUTED EARNINGS PER SHARE (FILS) 8 22 20 BASIC AND DILUTED EARNINGS PER SHARE FROM CONTINUING OPERATIONS (FILS) 8 22 22
Ebrahim Mohamed Ali Zainal Yusuf Saleh Abdulla Alsaleh Chairman Vice Chairman
For the year ended 31 December 2015
Consolidated Statement of Income
The attached explanatory notes 1 to 36 form part of these consolidated financial statements.
ANNUAL REPORT 2015 15
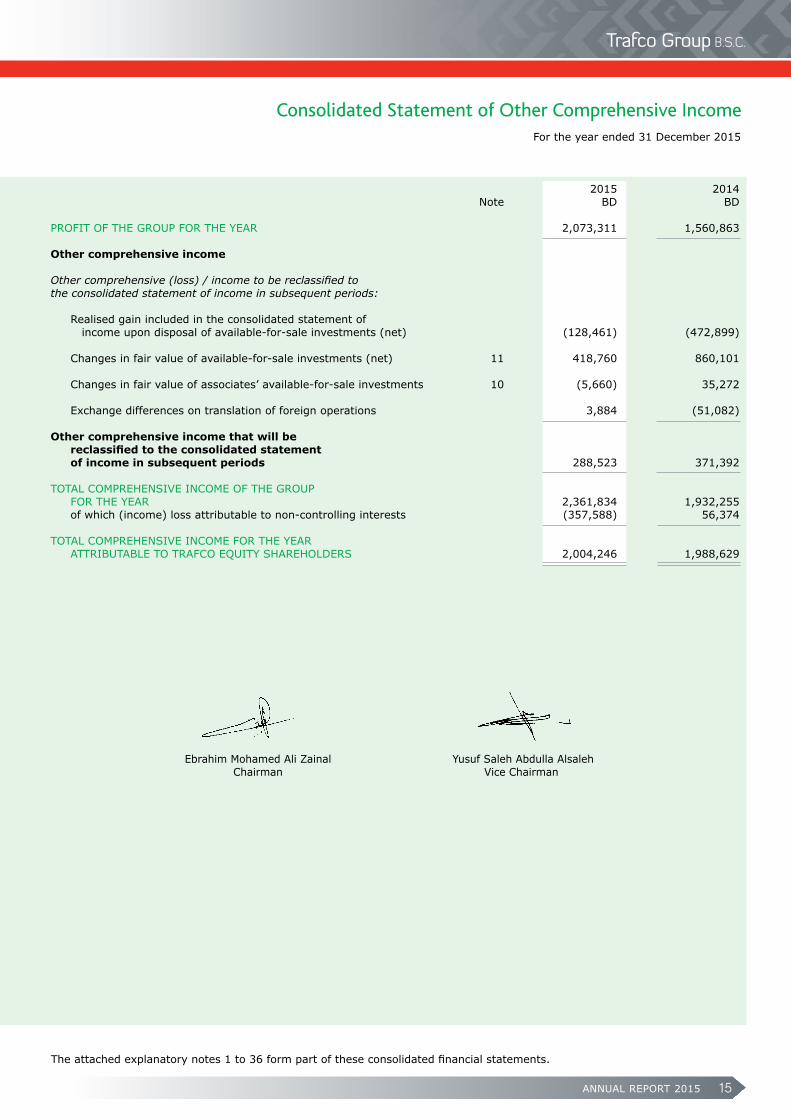
2015 2014 Note BD BD PROFIT OF THE GROUP FOR THE YEAR 2,073,311 1,560,863 Other comprehensive income Other comprehensive (loss) / income to be reclassified to the consolidated statement of income in subsequent periods: Realised gain included in the consolidated statement of income upon disposal of available-for-sale investments (net) (128,461) (472,899) Changes in fair value of available-for-sale investments (net) 11 418,760 860,101 Changes in fair value of associates’ available-for-sale investments 10 (5,660) 35,272 Exchange differences on translation of foreign operations 3,884 (51,082) Other comprehensive income that will be reclassifiedtotheconsolidatedstatement of income in subsequent periods 288,523 371,392 TOTAL COMPREHENSIVE INCOME OF THE GROUP FOR THE YEAR 2,361,834 1,932,255 of which (income) loss attributable to non-controlling interests (357,588) 56,374 TOTAL COMPREHENSIVE INCOME FOR THE YEAR ATTRIBUTABLE TO TRAFCO EQUITY SHAREHOLDERS 2,004,246 1,988,629
Ebrahim Mohamed Ali Zainal Yusuf Saleh Abdulla Alsaleh Chairman Vice Chairman
For the year ended 31 December 2015
Consolidated Statement of Other Comprehensive Income
The attached explanatory notes 1 to 36 form part of these consolidated financial statements.
ANNUAL REPORT 201516
For the year ended 31 December 2015
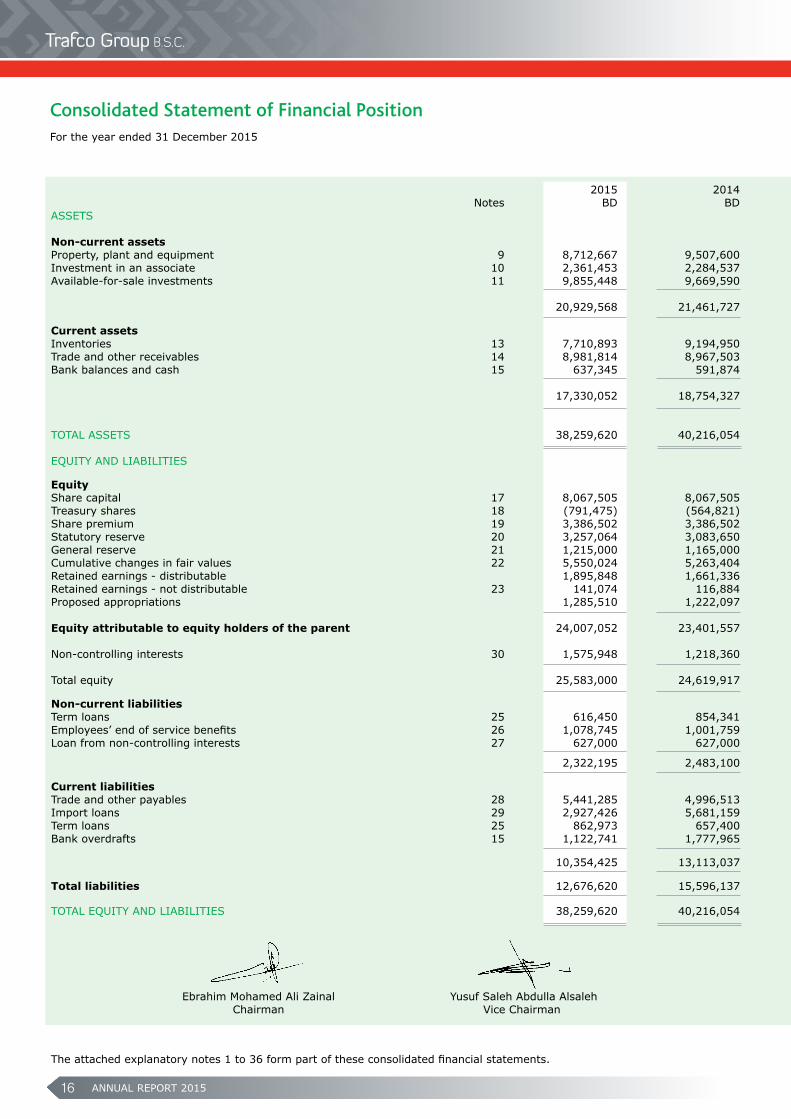
Consolidated Statement of Financial Position
The attached explanatory notes 1 to 36 form part of these consolidated financial statements.
2015 2014 Notes BD BDASSETS Non-current assets Property, plant and equipment 9 8,712,667 9,507,600Investment in an associate 10 2,361,453 2,284,537Available-for-sale investments 11 9,855,448 9,669,590 20,929,568 21,461,727 Current assets Inventories 13 7,710,893 9,194,950Trade and other receivables 14 8,981,814 8,967,503Bank balances and cash 15 637,345 591,874 17,330,052 18,754,327
TOTAL ASSETS 38,259,620 40,216,054
EQUITY AND LIABILITIES
Equity Share capital 17 8,067,505 8,067,505Treasury shares 18 (791,475) (564,821)Share premium 19 3,386,502 3,386,502Statutory reserve 20 3,257,064 3,083,650General reserve 21 1,215,000 1,165,000Cumulative changes in fair values 22 5,550,024 5,263,404Retained earnings - distributable 1,895,848 1,661,336 Retained earnings - not distributable 23 141,074 116,884Proposed appropriations 1,285,510 1,222,097 Equity attributable to equity holders of the parent 24,007,052 23,401,557 Non-controlling interests 30 1,575,948 1,218,360
Total equity 25,583,000 24,619,917 Non-current liabilities Term loans 25 616,450 854,341Employees’ end of service benefits 26 1,078,745 1,001,759Loan from non-controlling interests 27 627,000 627,000
2,322,195 2,483,100 Current liabilities Trade and other payables 28 5,441,285 4,996,513Import loans 29 2,927,426 5,681,159Term loans 25 862,973 657,400Bank overdrafts 15 1,122,741 1,777,965 10,354,425 13,113,037 Total liabilities 12,676,620 15,596,137 TOTAL EQUITY AND LIABILITIES 38,259,620 40,216,054
Ebrahim Mohamed Ali Zainal Yusuf Saleh Abdulla Alsaleh Chairman Vice Chairman
ANNUAL REPORT 2015 17
For the year ended 31 December 2015
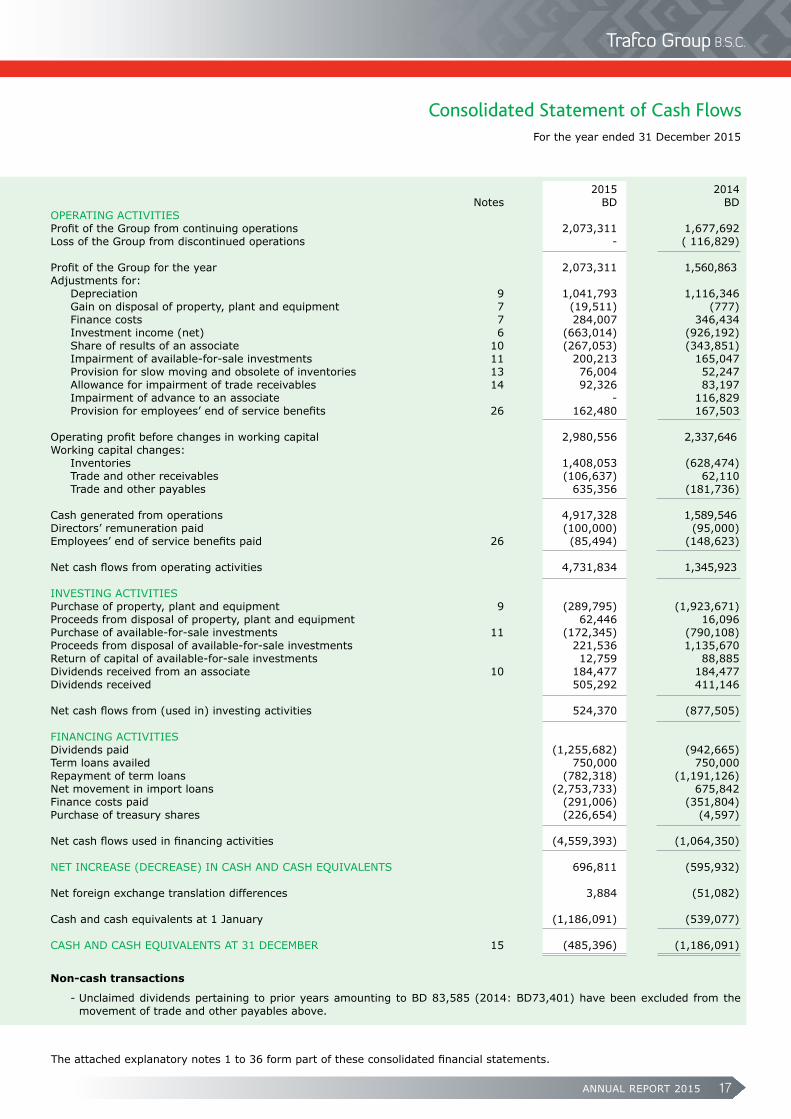
Consolidated Statement of Cash Flows
2015 2014 Notes BD BDOPERATING ACTIVITIES Profit of the Group from continuing operations 2,073,311 1,677,692 Loss of the Group from discontinued operations - ( 116,829) Profit of the Group for the year 2,073,311 1,560,863 Adjustments for: Depreciation 9 1,041,793 1,116,346 Gain on disposal of property, plant and equipment 7 (19,511) (777) Finance costs 7 284,007 346,434 Investment income (net) 6 (663,014) (926,192) Share of results of an associate 10 (267,053) (343,851) Impairment of available-for-sale investments 11 200,213 165,047 Provision for slow moving and obsolete of inventories 13 76,004 52,247 Allowance for impairment of trade receivables 14 92,326 83,197 Impairment of advance to an associate - 116,829 Provision for employees’ end of service benefits 26 162,480 167,503
Operating profit before changes in working capital 2,980,556 2,337,646 Working capital changes: Inventories 1,408,053 (628,474) Trade and other receivables (106,637) 62,110 Trade and other payables 635,356 (181,736) Cash generated from operations 4,917,328 1,589,546 Directors’ remuneration paid (100,000) (95,000) Employees’ end of service benefits paid 26 (85,494) (148,623) Net cash flows from operating activities 4,731,834 1,345,923 INVESTING ACTIVITIES Purchase of property, plant and equipment 9 (289,795) (1,923,671) Proceeds from disposal of property, plant and equipment 62,446 16,096 Purchase of available-for-sale investments 11 (172,345) (790,108) Proceeds from disposal of available-for-sale investments 221,536 1,135,670 Return of capital of available-for-sale investments 12,759 88,885 Dividends received from an associate 10 184,477 184,477 Dividends received 505,292 411,146
Net cash flows from (used in) investing activities 524,370 (877,505)
FINANCING ACTIVITIES Dividends paid (1,255,682) (942,665) Term loans availed 750,000 750,000 Repayment of term loans (782,318) (1,191,126) Net movement in import loans (2,753,733) 675,842 Finance costs paid (291,006) (351,804) Purchase of treasury shares (226,654) (4,597) Net cash flows used in financing activities (4,559,393) (1,064,350) NET INCREASE (DECREASE) IN CASH AND CASH EQUIVALENTS 696,811 (595,932) Net foreign exchange translation differences 3,884 (51,082) Cash and cash equivalents at 1 January (1,186,091) (539,077) CASH AND CASH EQUIVALENTS AT 31 DECEMBER 15 (485,396) (1,186,091) Non-cash transactions
- Unclaimed dividends pertaining to prior years amounting to BD 83,585 (2014: BD73,401) have been excluded from the movement of trade and other payables above.
The attached explanatory notes 1 to 36 form part of these consolidated financial statements.
ANNUAL REPORT 201518
For the year ended 31 December 2015
The attached explanatory notes 1 to 36 form part of these consolidated financial statements.
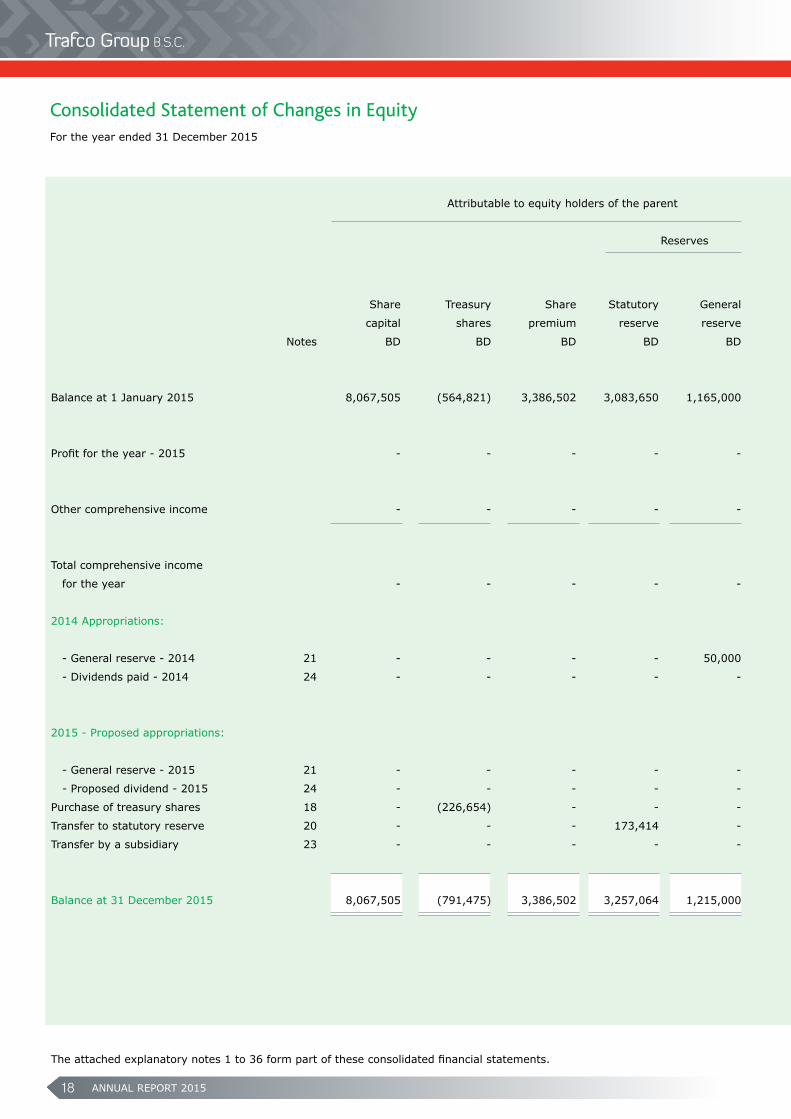
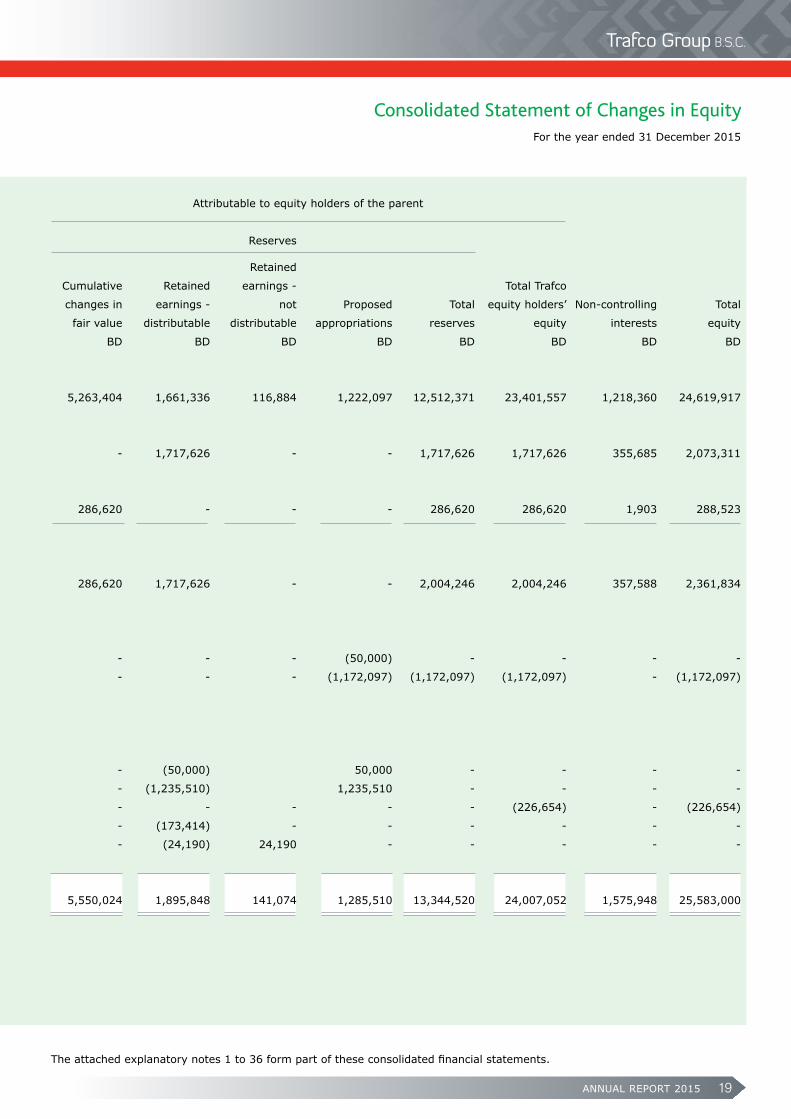
Attributable to equity holders of the parent Attributable to equity holders of the parent
Reserves Reserves
Retained
Cumulative Retained earnings - Total Trafco
Share Treasury Share Statutory General changes in earnings - not Proposed Total equity holders’ Non-controlling Total
capital shares premium reserve reserve fair value distributable distributable appropriations reserves equity interests equity
Notes BD BD BD BD BD BD BD BD BD BD BD BD BD
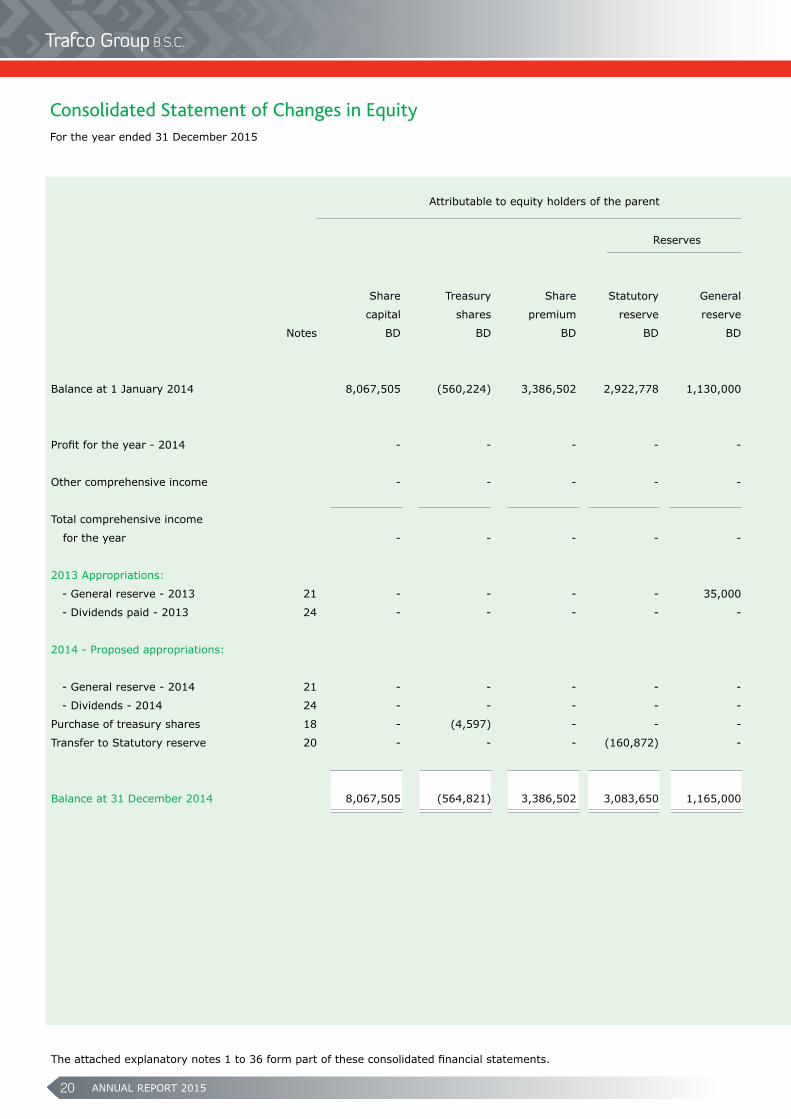
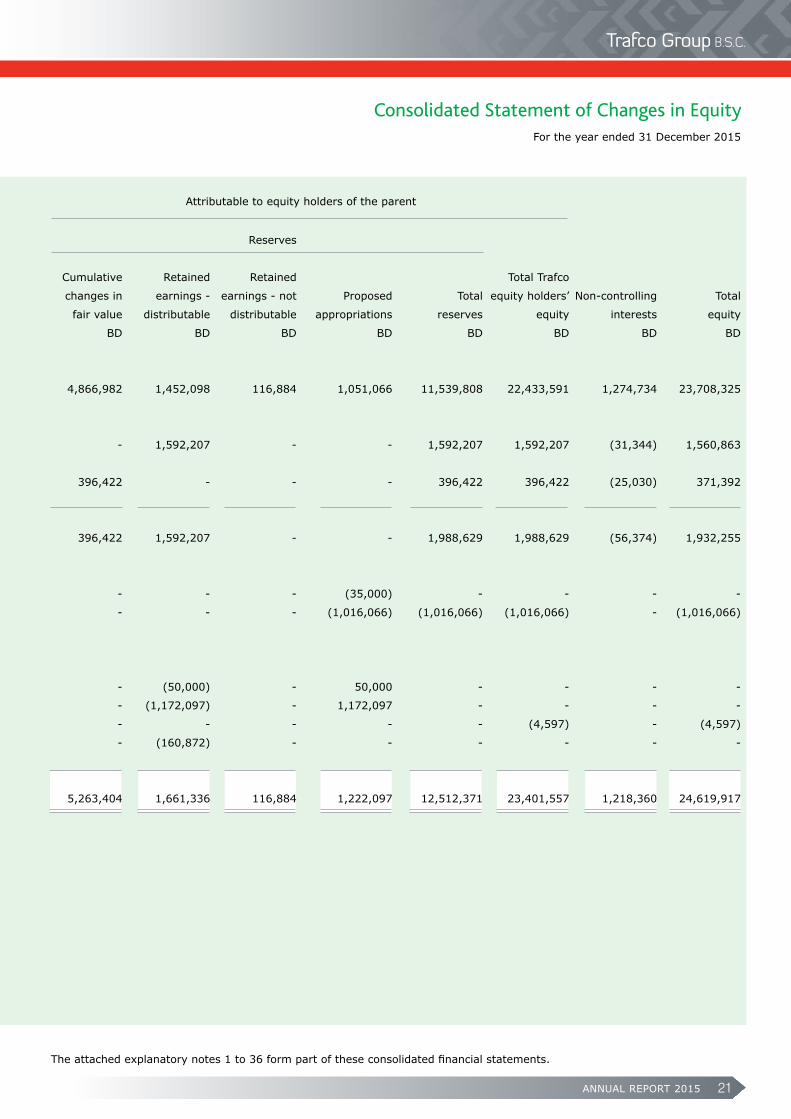
Balance at 1 January 2015 8,067,505 (564,821) 3,386,502 3,083,650 1,165,000 5,263,404 1,661,336 116,884 1,222,097 12,512,371 23,401,557 1,218,360 24,619,917
Profit for the year - 2015 - - - - - - 1,717,626 - - 1,717,626 1,717,626 355,685 2,073,311
Other comprehensive income - - - - - 286,620 - - - 286,620 286,620 1,903 288,523
Total comprehensive income
for the year - - - - - 286,620 1,717,626 - - 2,004,246 2,004,246 357,588 2,361,834
2014 Appropriations:
- General reserve - 2014 21 - - - - 50,000 - - - (50,000) - - - -
- Dividends paid - 2014 24 - - - - - - - - (1,172,097) (1,172,097) (1,172,097) - (1,172,097)
2015 - Proposed appropriations:
- General reserve - 2015 21 - - - - - - (50,000) 50,000 - - - -
- Proposed dividend - 2015 24 - - - - - - (1,235,510) 1,235,510 - - - -
Purchase of treasury shares 18 - (226,654) - - - - - - - - (226,654) - (226,654)
Transfer to statutory reserve 20 - - - 173,414 - - (173,414) - - - - - -
Transfer by a subsidiary 23 - - - - - - (24,190) 24,190 - - - - -
Balance at 31 December 2015 8,067,505 (791,475) 3,386,502 3,257,064 1,215,000 5,550,024 1,895,848 141,074 1,285,510 13,344,520 24,007,052 1,575,948 25,583,000
Consolidated Statement of Changes in Equity
ANNUAL REPORT 2015 19
For the year ended 31 December 2015
The attached explanatory notes 1 to 36 form part of these consolidated financial statements.
Attributable to equity holders of the parent Attributable to equity holders of the parent
Reserves Reserves
Retained
Cumulative Retained earnings - Total Trafco
Share Treasury Share Statutory General changes in earnings - not Proposed Total equity holders’ Non-controlling Total
capital shares premium reserve reserve fair value distributable distributable appropriations reserves equity interests equity
Notes BD BD BD BD BD BD BD BD BD BD BD BD BD
Balance at 1 January 2015 8,067,505 (564,821) 3,386,502 3,083,650 1,165,000 5,263,404 1,661,336 116,884 1,222,097 12,512,371 23,401,557 1,218,360 24,619,917
Profit for the year - 2015 - - - - - - 1,717,626 - - 1,717,626 1,717,626 355,685 2,073,311
Other comprehensive income - - - - - 286,620 - - - 286,620 286,620 1,903 288,523
Total comprehensive income
for the year - - - - - 286,620 1,717,626 - - 2,004,246 2,004,246 357,588 2,361,834
2014 Appropriations:
- General reserve - 2014 21 - - - - 50,000 - - - (50,000) - - - -
- Dividends paid - 2014 24 - - - - - - - - (1,172,097) (1,172,097) (1,172,097) - (1,172,097)
2015 - Proposed appropriations:
- General reserve - 2015 21 - - - - - - (50,000) 50,000 - - - -
- Proposed dividend - 2015 24 - - - - - - (1,235,510) 1,235,510 - - - -
Purchase of treasury shares 18 - (226,654) - - - - - - - - (226,654) - (226,654)
Transfer to statutory reserve 20 - - - 173,414 - - (173,414) - - - - - -
Transfer by a subsidiary 23 - - - - - - (24,190) 24,190 - - - - -
Balance at 31 December 2015 8,067,505 (791,475) 3,386,502 3,257,064 1,215,000 5,550,024 1,895,848 141,074 1,285,510 13,344,520 24,007,052 1,575,948 25,583,000
Consolidated Statement of Changes in Equity
ANNUAL REPORT 201520
For the year ended 31 December 2015
Consolidated Statement of Changes in Equity
The attached explanatory notes 1 to 36 form part of these consolidated financial statements.
Attributable to equity holders of the parent Attributable to equity holders of the parent
Reserves Reserves
Cumulative Retained Retained Total Trafco
Share Treasury Share Statutory General changes in earnings - earnings - not Proposed Total equity holders’ Non-controlling Total
capital shares premium reserve reserve fair value distributable distributable appropriations reserves equity interests equity
Notes BD BD BD BD BD BD BD BD BD BD BD BD BD
Balance at 1 January 2014 8,067,505 (560,224) 3,386,502 2,922,778 1,130,000 4,866,982 1,452,098 116,884 1,051,066 11,539,808 22,433,591 1,274,734 23,708,325
Profit for the year - 2014 - - - - - - 1,592,207 - - 1,592,207 1,592,207 (31,344) 1,560,863
Other comprehensive income - - - - - 396,422 - - - 396,422 396,422 (25,030) 371,392
Total comprehensive income
for the year - - - - - 396,422 1,592,207 - - 1,988,629 1,988,629 (56,374) 1,932,255
2013 Appropriations:
- General reserve - 2013 21 - - - - 35,000 - - - (35,000) - - - -
- Dividends paid - 2013 24 - - - - - - - - (1,016,066) (1,016,066) (1,016,066) - (1,016,066)
2014 - Proposed appropriations:
- General reserve - 2014 21 - - - - - - (50,000) - 50,000 - - - -
- Dividends - 2014 24 - - - - - - (1,172,097) - 1,172,097 - - - -
Purchase of treasury shares 18 - (4,597) - - - - - - - - (4,597) - (4,597)
Transfer to Statutory reserve 20 - - - (160,872) - - (160,872) - - - - - -
Balance at 31 December 2014 8,067,505 (564,821) 3,386,502 3,083,650 1,165,000 5,263,404 1,661,336 116,884 1,222,097 12,512,371 23,401,557 1,218,360 24,619,917
ANNUAL REPORT 2015 21
For the year ended 31 December 2015
Consolidated Statement of Changes in Equity
The attached explanatory notes 1 to 36 form part of these consolidated financial statements.
Attributable to equity holders of the parent Attributable to equity holders of the parent
Reserves Reserves
Cumulative Retained Retained Total Trafco
Share Treasury Share Statutory General changes in earnings - earnings - not Proposed Total equity holders’ Non-controlling Total
capital shares premium reserve reserve fair value distributable distributable appropriations reserves equity interests equity
Notes BD BD BD BD BD BD BD BD BD BD BD BD BD
Balance at 1 January 2014 8,067,505 (560,224) 3,386,502 2,922,778 1,130,000 4,866,982 1,452,098 116,884 1,051,066 11,539,808 22,433,591 1,274,734 23,708,325
Profit for the year - 2014 - - - - - - 1,592,207 - - 1,592,207 1,592,207 (31,344) 1,560,863
Other comprehensive income - - - - - 396,422 - - - 396,422 396,422 (25,030) 371,392
Total comprehensive income
for the year - - - - - 396,422 1,592,207 - - 1,988,629 1,988,629 (56,374) 1,932,255
2013 Appropriations:
- General reserve - 2013 21 - - - - 35,000 - - - (35,000) - - - -
- Dividends paid - 2013 24 - - - - - - - - (1,016,066) (1,016,066) (1,016,066) - (1,016,066)
2014 - Proposed appropriations:
- General reserve - 2014 21 - - - - - - (50,000) - 50,000 - - - -
- Dividends - 2014 24 - - - - - - (1,172,097) - 1,172,097 - - - -
Purchase of treasury shares 18 - (4,597) - - - - - - - - (4,597) - (4,597)
Transfer to Statutory reserve 20 - - - (160,872) - - (160,872) - - - - - -
Balance at 31 December 2014 8,067,505 (564,821) 3,386,502 3,083,650 1,165,000 5,263,404 1,661,336 116,884 1,222,097 12,512,371 23,401,557 1,218,360 24,619,917
ANNUAL REPORT 201522
At 31 December 2015
Notes to the Consolidated Financial Statements
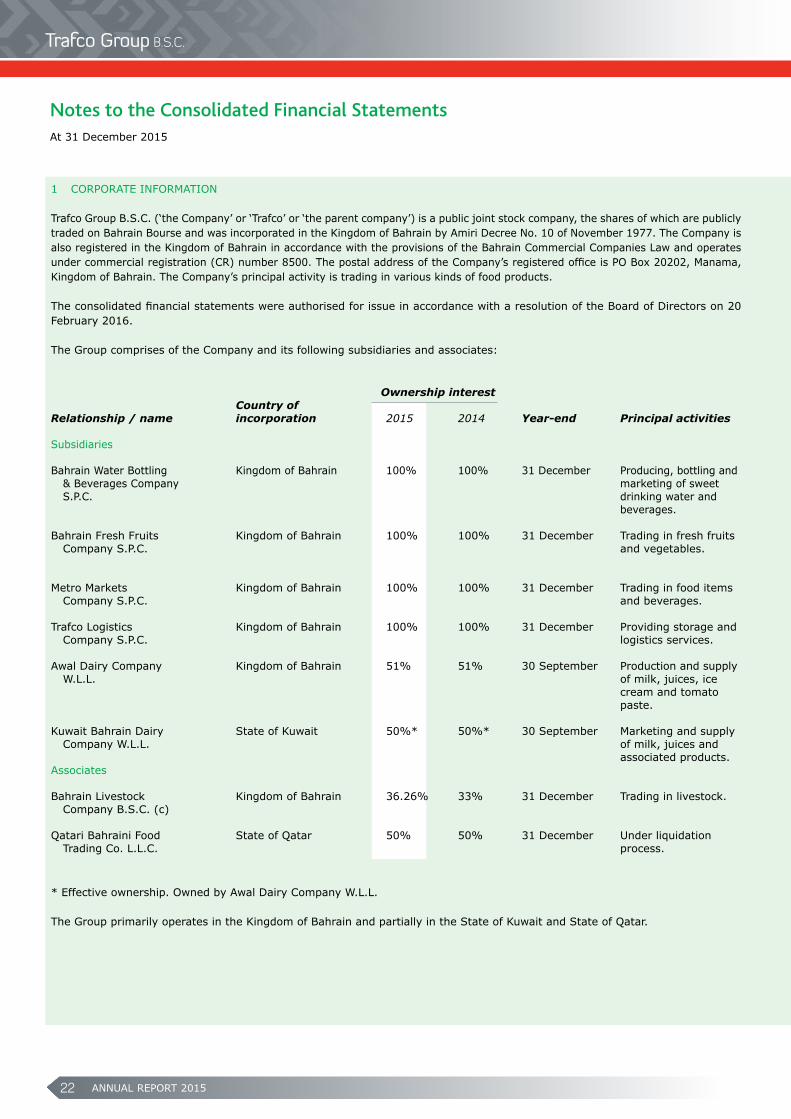
1 CORPORATE INFORMATION Trafco Group B.S.C. (‘the Company’ or ‘Trafco’ or ‘the parent company’) is a public joint stock company, the shares of which are publicly traded on Bahrain Bourse and was incorporated in the Kingdom of Bahrain by Amiri Decree No. 10 of November 1977. The Company is also registered in the Kingdom of Bahrain in accordance with the provisions of the Bahrain Commercial Companies Law and operates under commercial registration (CR) number 8500. The postal address of the Company’s registered office is PO Box 20202, Manama, Kingdom of Bahrain. The Company’s principal activity is trading in various kinds of food products. The consolidated financial statements were authorised for issue in accordance with a resolution of the Board of Directors on 20 February 2016. The Group comprises of the Company and its following subsidiaries and associates:
Ownership interest Country ofRelationship / name incorporation 2015 2014 Year-end Principal activities Subsidiaries Bahrain Water Bottling Kingdom of Bahrain 100% 100% 31 December Producing, bottling and & Beverages Company marketing of sweet S.P.C. drinking water and beverages. Bahrain Fresh Fruits Kingdom of Bahrain 100% 100% 31 December Trading in fresh fruits Company S.P.C. and vegetables. Metro Markets Kingdom of Bahrain 100% 100% 31 December Trading in food items Company S.P.C. and beverages. Trafco Logistics Kingdom of Bahrain 100% 100% 31 December Providing storage and Company S.P.C. logistics services. Awal Dairy Company Kingdom of Bahrain 51% 51% 30 September Production and supply W.L.L. of milk, juices, ice cream and tomato paste. Kuwait Bahrain Dairy State of Kuwait 50%* 50%* 30 September Marketing and supply Company W.L.L. of milk, juices and associated products. Associates Bahrain Livestock Kingdom of Bahrain 36.26% 33% 31 December Trading in livestock. Company B.S.C. (c) Qatari Bahraini Food State of Qatar 50% 50% 31 December Under liquidation Trading Co. L.L.C. process.
* Effective ownership. Owned by Awal Dairy Company W.L.L. The Group primarily operates in the Kingdom of Bahrain and partially in the State of Kuwait and State of Qatar.
ANNUAL REPORT 2015 23
At 31 December 2015
Notes to the Consolidated Financial Statements
2 SIGNIFICANT ACCOUNTING POLICIES Basis of preparation The consolidated financial statements are prepared under the historical cost basis, except for available-for-sale investments that have been measured at fair value. The consolidated financial statements have been presented in Bahraini Dinars (BD) which is the functional currency of the Company and the presentation currency of the Group. Statement of compliance The consolidated financial statements of the Group have been prepared in accordance with International Financial Reporting Standards (IFRS), as issued by the International Accounting Standards Board (IASB), and in conformity with the Bahrain Commercial Companies Law, the Central Bank of Bahrain (CBB) Rule Book (applicable provisions of Volume 6) and CBB directives, regulations and associated resolutions, rules and procedures of the Bahrain Bourse. Basis of consolidation The consolidated financial statements comprise the financial statements of the Company and its subsidiaries as at 31 December 2015. Control is achieved when the Group is exposed, or has rights, to variable returns from its involvement with the investee and has the ability to affect those returns through its power over the investee. Specifically, the Group controls an investee if and only if the Group has: - power over the investee (i.e. existing rights that give it the current ability to direct the relevant activities of the investee);
- exposure, or rights, to variable returns from its involvement with the investee; and
- the ability to use its power over the investee to affect its returns. Generally, there is a presumption that a majority of voting rights result in control. To support this presumption and when the Group has less than a majority of the voting or similar rights of an investee, the Group considers all relevant facts and circumstances in assessing whether it has power over an investee, including:
- the contractual arrangement with the other vote holders of the investee;
- rights arising from other contractual arrangements; and
- the Group’s voting rights and potential voting rights. The Group re-assesses whether or not it controls an investee if facts and circumstances indicate that there are changes to one or more of the three elements of control. Consolidation of a subsidiary begins when the Group obtains control over the subsidiary and ceases when the Group loses control of the subsidiary. Assets, liabilities, income and expenses of a subsidiary acquired or disposed of during the year are included in the consolidated financial statements from the date the Group obtains control until the date the Group ceases to control the subsidiary. Profit or loss and each component of other comprehensive income are attributed to the equity holders of the parent of the Group and to the non-controlling interests, even if this results in the non-controlling interests having a deficit balance. When necessary, adjustments are made to the financial statements of subsidiaries to bring their accounting policies into line with the Group’s accounting policies. All intra-group assets and liabilities, equity, income, expenses and cash flows relating to transactions between members of the Group are eliminated in full on consolidation. A change in the ownership interest of a subsidiary, without a loss of control, is accounted for as an equity transaction. If the Group losses control over a subsidiary, it derecognises the related assets (including goodwill), liabilities, non-controlling interest and other components of equity while any resultant gain or loss is recongised in the consolidated statement of income. Any investment retained is recognised at fair value.
New and amended standards and interpretations effective as of 1 January 2015 The accounting and reporting policies adopted in the preparation of these consolidated financial statements are consistent with those used in the previous year, except for certain new standards and interpretations and amendments to standards and interpretations adopted by the Group as of 1 January 2015 as set out below:
ANNUAL REPORT 201524
2 SIGNIFICANT ACCOUNTING POLICIES (continued) Annual improvements 2010-2012 Cycle These improvements are effective from 1 July 2014 and did not have a material impact on the Group. These improvements include: IFRS 3 Business Combinations The amendment is applied prospectively and clarifies that all contingent consideration arrangements classified as liabilities (or assets) arising from a business combination should be subsequently measured at fair value through profit or loss whether or not they fall within the scope of IAS 39. This is consistent with the Group’s current accounting policy and, thus, this amendment did not impact the Group’s accounting policy. IFRS 8 Operating Segments The amendments are applied retrospectively and clarifies that:
- an entity must disclose the judgements made by management in applying the aggregation criteria in paragraph 12 of IFRS 8, including a brief description of operating segments that have been aggregated and the economic characteristics (e.g., sales and gross margins) used to assess whether the segments are ‘similar’; and
- the reconciliation of segment assets to total assets is only required to be disclosed if the reconciliation is reported to the chief operating decision maker, similar to the required disclosure for segment liabilities.
IAS 16 Property, Plant and Equipment and IAS 38 Intangible Assets The amendment is applied retrospectively and clarifies in IAS 16 and IAS 38 that the asset may be revalued by reference to observable data by either adjusting the gross carrying amount of the asset to market value or by determining the market value of the carrying value and adjusting the gross carrying amount proportionately so that the resulting carrying amount equals the market value. In addition, the accumulated depreciation or amortisation is the difference between the gross and carrying amounts of the asset. The Group did not record any revaluation adjustments during the current year. IAS 24 Related Party Disclosures The amendment is applied retrospectively and clarifies that a management entity (an entity that provides key management personnel services) is a related party subject to the related party disclosures. In addition, an entity that uses a management entity is required to disclose the expenses incurred for management services. This amendment is not relevant for the Group as it does not receive any management services from other entities. Annual improvements 2011-2013 Cycle These improvements are effective from 1 July 2014 and did not have a material impact on the Group. These improvements include: IFRS 3 Business Combinations The amendment is applied prospectively and clarifies for the scope exceptions within IFRS 3 that:
- joint arrangements, not just joint ventures, are outside the scope of IFRS 3; and
- this scope exception applies only to the accounting in the financial statements of the joint arrangement itself.
The Group does not have a joint arrangement, and thus this amendment is not relevant for the Group and its subsidiaries.
IFRS 13 Fair Value Measurement The amendment is applied prospectively and clarifies that the portfolio exception in IFRS 13 can be applied not only to financial assets and financial liabilities, but also to other contracts within the scope of IAS 39. The Group does not apply the portfolio exception in IFRS 13. Several other new standards and amendments apply for the first time in 2015. However, they do not impact the consolidated financial statements of the Group. Foreign currency transactions The Group’s consolidated financial statements are presented in Bahraini Dinars (BD) which is also the parent company’s functional currency. For each entity the Group determines the functional currency and items included in the financial statements of each entity are measured using that functional currency. The Group uses the direct method of consolidation and has elected to recycle the gain or loss that arises from using this method.
At 31 December 2015
Notes to the Consolidated Financial Statements
ANNUAL REPORT 2015 25
2 SIGNIFICANT ACCOUNTING POLICIES (continued)
Foreign currency transactions (continued) Transactions and balances Transactions in foreign currencies are initially recorded at their respective functional currency spot rates at the date the transaction first qualifies for recognition. Monetary assets and liabilities denominated in foreign currencies are retranslated at the functional currency spot rate of exchange at the reporting date. All differences arising on settlement or translation of monetary items are taken to the consolidated statement of income. Non-monetary items that are measured in terms of historical cost in a foreign currency are translated using the exchange rates as at the dates of the initial transactions. Non-monetary items measured at fair value in a foreign currency are translated using the exchange rates at the date when the fair value is determined. The gain or loss arising on retranslation of non-monetary items is treated in line with the recognition of gain or loss on change in fair value of the item (i.e., translation differences on items whose fair value gain or loss is recognised in the consolidated statement of other comprehensive income or the consolidated statement of income is also recognised in the consolidated statement of other comprehensive income or the consolidated statement of income, respectively). Group companies On consolidation, the assets and liabilities of foreign operations are translated into Bahraini Dinars at the rate of exchange prevailing at the reporting date and their statements of income are translated at the weighted average exchange rates for the year. The exchange differences arising on the translation for consolidation are recognised in the consolidated statement of other comprehensive income. On disposal of a foreign operation, the component recognised in the consolidated statement of other comprehensive income relating to that particular foreign operation is recognised in the consolidated statement of income. Revenue recognitionRevenue is recognised to the extent that it is probable that the economic benefits will flow to the Group and the revenue can be reliably measured, regardless of when the payment is being made. Revenue is measured at the fair value of the consideration received or receivable, taking into account contractually defined terms of payment and excluding taxes or duty. The Group assesses its revenue arrangements against specific criteria in order to determine if it is acting as a principal or an agent. The Group has concluded that it is acting as a principal in all of its revenue arrangements. The following specific recognition criteria must also be met before revenue is recognised: Sale of goods Revenue from the sale of goods is recognised when the significant risks and rewards of ownership of the goods have passed to the buyer usually on delivery of the goods. Promotional offers are included as revenue with a corresponding charge to selling and distribution costs. Interest income Interest income is recorded using the effective interest rate (EIR) method, which is the rate that exactly discounts the estimated future cash payments or receipts through the expected life of the financial instrument or a shorter period, where appropriate, to the net carrying amount of the financial asset or liability. Dividend income Revenue is recognised when the Group’s right to receive the payment is established, which is generally when shareholders approve the dividend. Other revenue Other revenue is recognised on an accrual basis when income is earned. Property, plant and equipment Property, plant and equipment is stated at cost, net of accumulated depreciation and impairment in value, if any. Such cost includes the cost of replacing a part of the property, plant and equipment and borrowing costs for long-term construction projects if the recognition criteria are met. When significant parts of property, plant and equipment are required to be replaced at intervals, the Group recognises such parts as individual assets with specific useful lives and depreciates them accordingly. Likewise, when a major inspection is performed, its cost is recognised in the carrying amount of the property, plant and equipment as a replacement if the recognition criteria are satisfied. All other repair and maintenance costs are recognised in the consolidated statement of income when incurred.
At 31 December 2015
Notes to the Consolidated Financial Statements
ANNUAL REPORT 201526
2 SIGNIFICANT ACCOUNTING POLICIES (continued)
Property, plant and equipment (continued) Depreciation is calculated on a straight-line basis over the estimated useful lives of the assets, except for freehold land and capital work-in-progress, as follows: - Buildings on leasehold land lesser of 10 to 30 years or lease term - Plant, machinery and cold store equipment over 2 to 10 years - Furniture, fixtures and office equipment over 2 to 5 years - Motor vehicles over 4 to 12 years The carrying values of property, plant and equipment are reviewed for impairment when events or changes in circumstances indicate the carrying value may not be recoverable. If any such indication exists and where the carrying values exceed the estimated recoverable amount, the assets are written down to their recoverable amount, being the higher of their fair value less costs to sell and their value in use. An item of property, plant and equipment is derecognised upon disposal or when no future economic benefits are expected from its use or disposal. Any gain or loss arising on derecognition of the asset (calculated as the difference between the net disposal proceeds and the carrying amount of the asset) is recognised in the consolidated statement of income in the year the asset is derecognised. The assets’ residual values, useful lives and methods of depreciation are reviewed at each financial year-end and adjusted prospectively if appropriate. Inventories Inventories are stated at the lower of cost and net realisable value after making due provision for any obsolete or slow moving items. Costs are those expenses incurred in bringing each product to its present location and condition, and are accounted for as follows:
Raw materials, consumables, - landed costs on a weighted average basis. spare parts and other items Finished goods - costs of direct materials and labour and proportion of manufacturing overheads based on normal operating capacity Goods for sale - landed costs on a first-in, first-out basis. Net realisable value is based on estimated selling price in the ordinary course of business less estimated costs of completion and the estimated costs necessary to make the sale. Impairmentofnon-financialassets The Group assesses at each reporting date whether there is an indication that an asset may be impaired. If any indication exists, or when annual impairment testing for an asset is required, the Group estimates the asset’s recoverable amount. An asset’s recoverable amount is the higher of an asset’s or cash-generating unit’s (CGU) fair value less costs to sell and its value in use and is determined for an individual asset, unless the asset does not generate cash inflows that are largely independent of those from other assets or groups of assets. When the carrying amount of an asset or CGU exceeds its recoverable amount, the asset is considered impaired and is written down to its recoverable amount. In assessing value in use, the estimated future cash flows are discounted to their present value using a pre-tax discount rate that reflects current market assessments of the time value of money and the risks specific to the asset. In determining fair value less costs to sell, an appropriate valuation model is used. These calculations are corroborated by valuation multiples, quoted share prices or other available fair value indicators. The Group impairment calculation is based on detailed budgets and forecast calculations, which are prepared separately for each of the Group’s CGUs to which the individual assets are allocated. These budgets and forecast calculations generally cover a period of five years. For longer periods, a long-term growth rate is calculated and applied to project future cash flows after the fifth year. An assessment is made at each reporting date whether there is any indication that previously recognised impairment losses may no longer exist or may have decreased. If such indication exists, the Group estimates the asset’s or CGUs recoverable amount. A previously recognised impairment loss is reversed only if there has been a change in the assumptions used to determine the asset’s recoverable amount since the last impairment loss was recognised. The reversal is limited so that the carrying amount of the asset does not exceed its recoverable amount, nor exceed the carrying amount that would have been determined, net of depreciation, had no impairment loss been recognised for the asset in prior years. Such reversal is recognised in the consolidated statement of income.
At 31 December 2015
Notes to the Consolidated Financial Statements
ANNUAL REPORT 2015 27
2 SIGNIFICANT ACCOUNTING POLICIES (continued)
Investment in an associate An associate is an entity over which the Group has significant influence. Significant influence is the power to participate in the financial and operating policy decisions of the investee, but is not control or joint control over those policies. The considerations made in determining significant influence or joint control are similar to those necessary to determine control over subsidiaries. The Group’s investment in an associate is accounted for using the equity method.
Under the equity method, the investment in an associate is initially recognised at cost. The carrying amount of the investment is adjusted to recognise changes in the Group’s share of net assets of the associate since the acquisition date. Goodwill relating to the associate is included in the carrying amount of the investment and is neither amortised nor individually tested for impairment. The consolidated statement of income reflects the Group’s share of the results of operations of the associate. Any change in other comprehensive income of the investee is presented as part of the consolidated statement of other comprehensive income. In addition, when there has been a change recognised directly in the equity of the associate , the Group recognises its share of any changes, when applicable, in the consolidated statement of changes in equity. Unrealised gains and losses resulting from transactions between the Group and the associate are eliminated to the extent of the investment in the associate. The aggregate of the Group’s share of results of an associate is shown on the face of the consolidated statement of income outside operating profit and represents results after tax and non-controlling interests in the subsidiaries of the associate. The financial statements of the associate is prepared for the same reporting period as the Group. When necessary, adjustments are made to bring the accounting policies in line with those of the Group. After application of the equity method, the Group determines whether it is necessary to recognise an impairment loss on its investment in its associate. At each reporting date, the Group determines whether there is objective evidence that the investment in the associate is impaired. If there is such evidence, the Group calculates the amount of impairment as the difference between the recoverable amount of the associate and its carrying value, then recognises the loss as ‘share of results of associate’ in the consolidated statement of income. Upon loss of significant influence over the associate , the Group measures and recognises any retained investment at its fair value. Any difference between the carrying amount of the associate upon loss of significant influence and the fair value of the retained investment and proceeds from disposal is recognised in the consolidated statement of income. Currentversusnon-currentclassification The Group presents assets and liabilities in the consolidated statement of financial position based on a current/non-current classification. An asset is current when it is: - expected to be realised or intended to be sold or consumed in the normal operating cycle; - held primarily for the purpose of trading; - expected to be realised within twelve months after the reporting period; or - cash or cash equivalent unless restricted from being exchanged or used to settle a liability for at least twelve months after the reporting period. All other assets are classified as non-current. A liability is current when: - it is expected to be settled in the normal operating cycle; - it is held primarily for the purpose of trading; - it is due to be settled within twelve months after the reporting period; or - there is no unconditional right to defer the settlement of the liability for at least twelve months after the reporting period.
All other liabilities are classified as non-current.
At 31 December 2015
Notes to the Consolidated Financial Statements
ANNUAL REPORT 201528
2 SIGNIFICANT ACCOUNTING POLICIES (continued)
Financial instruments - initial recognition and subsequent measurement Financial assets Initial recognition and measurement Financial assets are classified, at initial recognition, as financial assets at fair value through profit or loss, loans and receivables, available-for-sale financial assets or held-to-maturity investments, as appropriate. The Group determines the classification of its financial assets at initial recognition. All financial assets are recognised initially at fair value plus transaction costs, except in the case of financial assets recorded at fair value through profit or loss.
Purchases or sales of financial assets that require delivery of assets within a time frame established by regulation or convention in the marketplace (regular way trades) are recognised on the trade date, i.e., the date that the Group commits to purchase or sell the asset.
The Group’s financial assets include available-for-sale investments, a certain portion of trade and other receivables and bank balances and cash.
Subsequent measurement The subsequent measurement of financial assets depends on their classification as follows: Available-for-sale investments Available-for-sale financial investments include investments in equity securities. Equity investments classified as available-for sale are those, which are neither classified as held-for-trading nor designated at fair value through profit or loss.
After initial measurement, available-for-sale investments are subsequently measured at fair value with unrealised gains or losses recognised in the consolidated statement of other comprehensive income and taken to cumulative changes in fair value reserve in the consolidated statement of changes in equity until the investment is derecognised, at which time the cumulative gain or loss is recognised in the consolidated statement of income, or determined to be impaired, at which time the cumulative loss is reclassified to the consolidated statement of income and removed from the cumulative changes in fair values reserve.
The Group evaluates whether the ability and intention to sell its available-for-sale financial assets in the near term is still appropriate. When, in rare circumstances, the Group is unable to trade these financial assets due to inactive markets, the Group may elect to reclassify these financial assets if the management has the ability and intention to hold the assets for foreseeable future or until maturity. For a financial asset reclassified from the available-for-sale category, the fair value carrying amount at the date of reclassification becomes its new amortised cost and any previous gain or loss on the asset that has been recognised in equity is amortised to the consolidated statement of income over the remaining life of the investment using the EIR. Any difference between the new amortised cost and the maturity amount is also amortised over the remaining life of the asset using the EIR. If the asset is subsequently determined to be impaired, then the amount recorded in equity is reclassified to the consolidated statement of income.
Loans and receivables Loans and receivables are non-derivative financial assets with fixed or determinable payments that are not quoted in an active market. After initial measurement, such financial assets are subsequently measured at amortised cost using the EIR, less any impairment in value. Amortised cost is calculated by taking into account any discount or premium on acquisition and fees or costs that are an integral part of the EIR. Gains and losses are recognised in the consolidated statement of income when the loans and receivables are derecognised or impaired, as well as through the amortisation process. Bad debts are written off in the consolidated statement of income when identified. A certain portion of trade and other receivables and bank balances and cash are classified as loans and receivables.
Cash and cash equivalents For the purpose of the consolidated statement of cash flows, cash and cash equivalents consist of cash on hand and bank balances, net of outstanding bank overdrafts.
Derecognitionoffinancialassets A financial asset (or, where applicable a part of a financial asset or part of a group of similar financial assets) is derecognised when: - the rights to receive cash flows from the asset have expired; or - the Group has transferred its rights to receive cash flows from the asset or has assumed an obligation to pay the received cash flows in full without material delay to a third party under a ‘pass-through’ arrangement; and either (a) the Group has transferred substantially all the risks and rewards of the asset, or (b) the Group has neither transferred nor retained substantially all the risks and rewards of the asset, but has transferred control of the asset.
At 31 December 2015
Notes to the Consolidated Financial Statements
ANNUAL REPORT 2015 29
2 SIGNIFICANT ACCOUNTING POLICIES (continued)
Financial instruments - initial recognition and subsequent measurement (continued) Financial assets (continued)Derecognitionoffinancialassets(continued)
When the Group has transferred its rights to receive cash flows from an asset or has entered into a pass-through arrangement, it evaluates if and to what extent it has retained the risks and rewards of ownership. When it has neither transferred nor retained substantially all of the risks and rewards of the asset, nor transferred control of the asset, the Group continues to recognise the transferred asset to the extent of the Group’s continuing involvement. In that case, the Group also recognises an associated liability. The transferred asset and the associated liability are measured on a basis that reflects the rights and obligations that the Group has retained. Continuing involvement that takes the form of a guarantee over the transferred asset is measured at the lower of the original carrying amount of the asset and the maximum amount of consideration that the Group could be required to repay. Impairmentoffinancialassets The Group assesses at each reporting date whether there is any objective evidence that a financial asset or a group of financial assets is impaired. A financial asset or a group of financial assets is deemed to be impaired if, and only if, there is objective evidence of impairment as a result of one or more events that has occurred after the initial recognition of the asset (an incurred ‘loss event’) and that loss event has an impact on the estimated future cash flows of the financial asset or the group of financial assets that can be reliably estimated. Evidence of impairment may include indications that the debtors or a group of debtors is experiencing significant financial difficulty, default or delinquency in interest or principal payments, the probability that they will enter bankruptcy or other financial reorganisation and where observable data indicate that there is a measurable decrease in the estimated future cash flows, such as changes in arrears or economic conditions that correlate with defaults. Available-for-sale investments For available-for-sale investments, the Group assesses at each reporting date whether there is objective evidence that an investment or a group of investments is impaired. In case of equity instruments classified as available-for-sale, objective evidence would include a “significant” or “prolonged” decline in the fair value of the investment below its cost. ‘Significant’ is evaluated against the original cost of the investment and ‘prolonged’ against the period in which the fair value has been below its original cost. Where there is evidence of impairment, the cumulative loss - measured as the difference between the acquisition cost and the current fair value, less any impairment loss on that investment previously recognised in the consolidated statement of income is removed from the consolidated statement of other comprehensive income and recognised in the consolidated statement of income. Impairment losses on investments in equity instruments are not reversed through the consolidated statement of income; increases in their fair value after impairment are recognised directly in the consolidated statement of other comprehensive income. The determination of what is ‘significant’ or ‘prolonged’ requires judgement. In making this judgement, the Group evaluates, among other factors, the duration or extent to which the fair value of an investment is less than its cost. Financial assets carried at amortised cost For financial assets carried at amortised cost, the Group first assesses whether objective evidence of impairment exists individually for financial assets that are individually significant, or collectively for financial assets that are not individually significant. If the Group determines that no objective evidence of impairment exists for an individually assessed financial asset, whether significant or not, it includes the asset in a group of financial assets with similar credit risk characteristics and collectively assesses them for impairment. Assets that are individually assessed for impairment and for which an impairment loss is, or continues to be, recognised are not included in a collective assessment of impairment. The amount of the loss is measured as the difference between the asset’s carrying amount and the present value of estimated future cash flows (excluding future expected credit losses that have not yet been incurred) and recognised in the consolidated statement of income. The present value of the estimated future cash flows is discounted at the financial asset’s original EIR. If an asset has a variable interest rate, the discount rate for measuring any impairment loss is the current EIR. The carrying amount of the asset is reduced through the use of an allowance account and the amount of the loss is recognised in the consolidated statement of income. Assets together with the associated allowance are written off when there is no realistic prospect of future recovery and all collateral has been realised or has been transferred to the Group. If, in a subsequent year, the amount of the estimated impairment loss increases or decreases because of an event occurring after the impairment was recognised, the previously recognised impairment loss is increased or reduced by adjusting the allowance account. If a future write-off is later recovered, the recovery is credited in the consolidated statement of income.
At 31 December 2015
Notes to the Consolidated Financial Statements
ANNUAL REPORT 201530
2 SIGNIFICANT ACCOUNTING POLICIES (continued)
Financial instruments - initial recognition and subsequent measurement (continued) Financial assets (continued)Impairmentoffinancialassets(continued)
Financial liabilities Initial recognition and measurement Financial liabilities are classified, at initial recognition, as financial liabilities at fair value through profit or loss or loans and borrowings, as appropriate. The Group determines the classification of its financial liabilities at initial recognition.
All financial liabilities are recognised initially at fair value and in the case of loans and borrowings and payables, net of directly attributable transaction costs.
The Group’s financial liabilities include term loans, loan from non-controlling interests, a certain portion of trade and other payables, import loans and bank overdrafts.
Subsequent measurement The measurement of financial liabilities depends on their classification, as follows:
Loans and borrowings After initial recognition, interest bearing loans and borrowings are subsequently measured at amortised cost using the EIR. Gains and losses are recognised in the consolidated statement of income when the liabilities are derecognised as well as through the EIR amortisation process.
All borrowing costs are expensed in the period they occur.
Trade and other payables Liabilities for trade and other payables are carried at cost, which is the fair value of the consideration to be paid in the future for goods and services received, whether or not billed to the Group.
Derecognitionoffinancialliabilities A financial liability is derecognised when the obligation under the liability is discharged or cancelled, or expires. When an existing financial liability is replaced by another from the same lender on substantially different terms, or the terms of an existing liability are substantially modified, such an exchange or modification is treated as the derecognition of the original liability and the recognition of a new liability. The difference in the respective carrying amounts is recognised in the consolidated statement of income.
Offsettingoffinancialinstruments Financial assets and financial liabilities are offset and the net amount reported in the consolidated statement of financial position if, and only if, there is a currently enforceable legal right to offset the recognised amounts and there is an intention to settle on a net basis, or to realise the assets and settle the liabilities simultaneously.
Income and expenses are offset in the consolidated statement of income when it reflects the substance of the transaction or other event.
Amortisedcostoffinancialinstruments Amortised cost is computed using the EIR less any allowance for impairment and principal repayment or reduction. The calculation takes into account any premium or discount on acquisition and includes transaction costs and fees that are an integral part of the EIR. Fair value measurement Fair value is the price that would be received to sell an asset or paid to transfer a liability in an orderly transaction between market participants at the measurement date. The fair value measurement is based on the presumption that the transaction to sell the asset or transfer the liability takes place either: - in the principal market for the asset or liability, or - in the absence of a principal market, in the most advantageous market for the asset or liability.
The principal or the most advantageous market must be accessible to the Group. The fair value of an asset or a liability is measured using the assumptions that market participants would use when pricing the asset or liability, assuming that market participants act in their economic best interest.
At 31 December 2015
Notes to the Consolidated Financial Statements

ANNUAL REPORT 2015 31
2 SIGNIFICANT ACCOUNTING POLICIES (continued)
Financial instruments - initial recognition and subsequent measurement (continued) Financial assets (continued)Fair value measurement (continued) A fair value measurement of a non-financial asset takes into account a market participant’s ability to generate economic benefits by using the asset in its highest and best use or by selling it to another market participant that would use the asset in its highest and best use. The Group uses valuation techniques that are appropriate in the circumstances and for which sufficient data are available to measure fair value, maximising the use of relevant observable inputs and minimising the use of unobservable inputs. All assets and liabilities for which fair value is measured or disclosed in the consolidated financial statements are categorised within the fair value hierarchy, described as follows, based on the lowest level input that is significant to the fair value measurement as a whole: - Level 1 — Quoted (unadjusted) market prices in active markets for identical assets or liabilities; - Level 2 — Valuation techniques for which the lowest level input that is significant to the fair value measurement is directly or indirectly observable; and - Level 3 — Valuation techniques for which the lowest level input that is significant to the fair value measurement is unobservable. For assets and liabilities that are recognised in the consolidated financial statements on a recurring basis, the Group determines whether transfers have occurred between Levels in the hierarchy by re-assessing categorisation (based on the lowest level input that is significant to the fair value measurement as a whole) at the end of each reporting period. Treasury shares Own equity instruments which are reacquired (treasury shares) are recognised at cost and deducted from equity. No gain or loss was recognised in the consolidated statement of income on the purchase, sale, issue or cancellation of the Company’s own equity instruments. Voting rights related to treasury shares are nullified for the Company and no dividends are allocated to them respectively. Provisions Provisions are recognised when the Group has a present obligation (legal or constructive) as a result of a past event, it is probable that an outflow of resources embodying economic benefits will be required to settle the obligation and a reliable estimate can be made of the amount of the obligation. Where the Group expects some or all of a provision to be reimbursed, for example under an insurance contract, the reimbursement is recognised as a separate asset but only when the reimbursement is virtually certain. The expense relating to any provision is presented in the consolidated statement of income, net of any reimbursement. Employees’endofservicebenefits The Group makes contributions to the Social Insurance Organisation (SIO), Bahrain for its Bahraini employees and Public Authority for Social Security, Kuwait for its Kuwaiti employees, calculated as a percentage of the employees’ salaries. The Group’s obligations are limited to these contributions, which are expensed when due. The Group also provides for end of service benefits for its expatriate employees. The entitlement to these benefits is based upon the employee’s final salary and length of service. The expected costs of these benefits are accrued over the period of employment. Leases The determination of whether an arrangement is, or contains a lease is based on the substance of the arrangement at inception date: whether fulfillment of the arrangement is dependent on the use of a specific asset or assets or the arrangement conveys a right to use the asset or assets and the arrangement conveys a right to use the asset or assets, even if that right is not explicitly specified in an arrangement. Operating leases - Group as a lessee Leases where the lessor retains substantially all the risks and benefits of ownership of the asset are classified as operating leases. Operating lease payments are recognised as an expense in the consolidated statement of income on a straight-line basis over the lease term.
At 31 December 2015
Notes to the Consolidated Financial Statements
ANNUAL REPORT 201532
3 SIGNIFICANT ACCOUNTING JUDGEMENTS, ESTIMATES AND ASSUMPTIONS The preparation of the Group’s consolidated financial statements requires management to make judgements, estimates and assumptions that affect the reported amounts of revenues, expenses, assets, liabilities and the disclosure of contingent liabilities, at the reporting date. However, uncertainty about these assumptions and estimates could result in outcomes that require a material adjustment to the carrying amount of the assets or liabilities affected in future periods. Judgements In the process of applying the Group’s accounting policies, management has made the following judgements, which have the most significant effect on the amounts recognised in the consolidated financial statements: Going concern The Group’s management has made an assessment of the Group’s ability to continue as a going concern and is satisfied that the Group has the resources to continue the business for the foreseeable future. Furthermore, management is not aware of any material uncertainties that may cast a significant doubt about the Group’s ability to continue as a going concern. Therefore, the consolidated financial statements continue to be prepared on a going concern basis. Classification of investments The Group’s management determines the classification of investments on initial recognition as “financial asset at fair value through profit or loss” or “available-for-sale”. The investments are classified as “financial asset at fair value through profit or loss” if they are acquired for the purpose of selling in the near term. All other investments are classified as “available-for-sale investments”. Operating lease – Group as lessee The Group has entered into commercial property leases for its office and warehouse buildings. The Group has determined, based on an evaluation of the terms and conditions of the arrangements that the lessor retains all the significant risks and rewards of ownership of the land and so accounts for the contracts as operating leases. Estimates The key assumptions concerning the future and other key sources of estimation uncertainty at the reporting date, that have a significant risk of causing a material adjustment to the carrying amounts of assets and liabilities within the next financial year, are described below. The Group based its assumptions and estimates on parameters available when the consolidated financial statements were prepared. Existing circumstances and assumptions about future developments, however, may change due to market changes or circumstances arising beyond the control of the Group.
Impairment of property, plant and equipment The Group assesses at each reporting date whether there is any indication that an asset may be impaired. If any such indication exists, or when annual impairment testing for an asset is required, the Group makes an estimate of the asset’s recoverable amount. An asset’s recoverable amount is higher of an asset’s or cash-generating unit’s (CGU) fair value less costs to sell and its value in use and is determined for an individual asset, unless the asset does not generate cash inflows that are largely independent of those from other assets or group of assets. Where the carrying amount of an asset exceeds its recoverable amount, the asset is considered impaired and is written down to its recoverable amount. In assessing value in use, the estimated future cash flows are discounted to their present value using a discount rate that reflects current market assessment of the time value of money and the risks specific to the assets. The Directors do not believe that there is any impairment of property, plant and equipment as at 31 December 2015 and 31 December 2014. Useful lives of property, plant and equipment The Group’s management determines the estimated useful lives of its property, plant and equipment for calculating depreciation. This estimate is determined after considering the expected usage of the asset or physical wear and tear. Management reviews the residual values and useful lives annually and future depreciation charges would be adjusted where management believes the useful lives differ from previous estimates. Impairment of available-for-sale investments For available-for-sale investments, the Group assesses at each reporting date whether there is objective evidence that an investment or a group of investments is impaired. In the case of equity investments classified as available-for-sale, objective evidence would include a ‘significant’ or ‘prolonged’ decline in the fair value of the investment below its cost. The determination of what is ‘significant’ or ‘prolonged’ requires judgement. In making this judgement, the Group evaluates, among other factors, historical share price movements and the duration or extent to which the fair value of an investment is below than its cost. The provision for impairment of available-for-sale investments amounted to BD 696,448 (2014: BD 551,618) as at 31 December 2015. In determining any impairment for the unquoted investments carried at cost, assumptions have been made regarding the expected future cash generation of the investments, discount rates to be applied and the expected period of benefits.
At 31 December 2015
Notes to the Consolidated Financial Statements

ANNUAL REPORT 2015 33
3 SIGNIFICANT ACCOUNTING JUDGEMENTS, ESTIMATES AND ASSUMPTIONS (continued)
Estimates (continued) Valuation of unquoted available-for-sale investments Management uses its best judgement in determining fair values of the unquoted private equity investments by reference to recent material arms’ length transactions involving third parties, indicative bid prices provided by the fund administrators, current fair values of another similar instrument or other appropriate valuation techniques. The management is also required to make judgement as to the comparability of other companies to an unquoted equity investment when determining the fair value of the investment. Management uses its best judgement, however, the actual amount realised in a future transaction may differ from the current estimate of fair value given the inherent uncertainty surrounding the valuation of unquoted private equity investments.
Provision for slow moving and obsolete inventories Inventories are held at the lower of cost and net realisable value. When inventories become old or obsolete, an estimate is made of their net realisable value. For individually significant amounts this estimation is performed on an individual basis. Amounts which are not individually significant, but which are old or obsolete, are assessed collectively and a provision applied according to the inventory type and the degree of ageing or obsolescence, based on historical selling prices.
At the reporting date, gross raw materials and consumables, spare parts and other items, finished goods and goods for sale amounted to BD 7,044,363 (2014: BD 8,337,050), with a provision for slow moving and obsolete inventories of BD 543,697 (2014: BD 571,964). Any difference between the amounts actually realised in future periods and the amounts expected will be recognised in the consolidated statement of income. Impairment of trade receivables An estimate of the collectible amount of trade receivables is made when collection of the full amount is no longer probable. For individually significant amounts, this estimation is performed on an individual basis. Amounts which are not individually significant, but which are past due, are assessed collectively and an allowance applied according to the length of time past due, based on historical recovery rates. At the reporting date, gross trade receivables were BD 8,832,265 (2014: BD 8,727,318), with an allowance for impairment of BD 500,923 (2014: BD 465,950). Any difference between the amounts actually collected in future periods and the amounts expected will be recognised in the consolidated statement of income.
4 STANDARDS AND INTERPRETATIONS ISSUED BUT NOT YET EFFECTIVE Standards issued but not yet effective up to the date of issuance of the Group’s consolidated financial statements are listed below. This listing is of standards and interpretations issued, which the Group reasonably expects to be applicable at a future date. The Group intends to adopt those standards (where applicable) when they become effective: IFRS 9 Financial Instruments: Classification and Measurement In July 2014, the IASB issued the final version of IFRS 9 Financial Instruments which reflects all phases of the financial instruments project and replaces IAS 39 Financial Instruments: Recognition and Measurement and all previous versions of IFRS 9. The standard introduces new requirements for classification and measurement, impairment, and hedge accounting. IFRS 9 is effective for annual periods beginning on or after 1 January 2018, with early application permitted. Retrospective application is required, but comparative information is not compulsory. Early application of previous versions of IFRS 9 (2009, 2010 and 2013) is permitted if the date of initial application is before 1 February 2015. The adoption of IFRS 9 will have an effect on the classification and measurement of the Group’s financial assets, but no impact on the classification and measurement of the Group’s financial liabilities. The Group is currently assessing the impact of IFRS 9 and plans to adopt the new standard on the required effective date. IFRS 15 Revenue from Contracts with Customers IFRS 15 was issued in May 2014 and establishes a new five-step model that will apply to revenue arising from contracts with customers. Under IFRS 15 revenue is recognised at an amount that reflects the consideration to which an entity expects to be entitled in exchange for transferring goods or services to a customer. The principles in IFRS 15 provide a more structured approach to measuring and recognising revenue.
At 31 December 2015
Notes to the Consolidated Financial Statements
ANNUAL REPORT 201534
4 STANDARDS AND INTERPRETATIONS ISSUED BUT NOT YET EFFECTIVE (continued)
IFRS 15 Revenue from Contracts with Customers (continued) The new revenue standard is applicable to all entities and will supersede all current revenue recognition requirements under IFRS. Either a full or modified retrospective application is required for annual periods beginning on or after 1 January 2018 with early adoption permitted. The Group is currently assessing the impact of IFRS 15 and plans to adopt the new standard on the required effective date.
IFRS 16 Leases The new standard brings most leases on to the consolidated statement of financial position for lessees under a single model, eliminating the distinction between operating and finance leases. Lessor accounting however remains largely unchanged and the distinction between operating and finance leases is retained. IFRS 16 supersedes IAS 17 ‘Leases’ and related interpretations and is effective for periods beginning on or after 1 January 2019, with earlier adoption permitted if IFRS 15 ‘Revenue from Contracts with Customers’ has also been applied. The Group is currently assessing the impact of IFRS 16 and plans to adopt the new standard on the required effective date. IAS 1 Presentation of Financial Statements: Disclosure Initiative The amendments to IAS 1 Presentation of Financial Statements clarify, rather than significantly change, existing IAS 1 requirements. The amendments clarify: - the materiality requirements; - that entities have flexibility as to the order in which they present the notes to the consolidated financial statements; - that specific line items in the consolidated statements of income, other comprehensive income and financial position may be disaggregated; and - that the share of other comprehensive income of associates and joint ventures accounted for using the equity method must be presented in aggregate as a single line item, and classified between those items that will or will not be subsequently reclassified to the consolidated statement of income. Furthermore, the amendments clarify the requirements that apply when additional subtotals are presented in the consolidated statements of financial position, income and other comprehensive income. These amendments are effective for annual periods beginning on or after 1 January 2016, with early adoption permitted. These amendments are not expected to have any impact on the Group’ consolidated financial statements. IAS 16 and IAS 38 (Amendments) - Clarification of acceptable methods of depreciation and amortisation The amendments clarify the principle in IAS 16 and IAS 38 that revenue reflects a pattern of economic benefits that are generated from operating a business (of which the asset is part) rather than the economic benefits that are consumed through use of the asset. As a result, a revenue-based method cannot be used to depreciate property, plant and equipment and may only be used in very limited circumstances to amortise intangible assets. The amendments are effective prospectively for annual periods beginning on or after 1 January 2016, with early adoption permitted. These amendments are not expected to have any impact to the Group given that the Group has not used a revenue-based method to depreciate its non-current assets. Amendments to IFRS 10 and IAS 28: Sale or Contribution of Assets between an Investor and its Associate or Joint Venture The amendments address the conflict between IFRS 10 and IAS 28 in dealing with the loss of control of a subsidiary that is sold or contributed to an associate or joint venture. The amendments clarify that the gain or loss resulting from the sale or contribution of assets that constitute a business, as defined in IFRS 3, between an investor and its associate or joint venture, is recognised in full. Any gain or loss resulting from the sale or contribution of assets that do not constitute a business, however, is recognised only to the extent of unrelated investors’ interests in the associate or joint venture. These amendments must be applied prospectively and are effective for annual periods beginning on or after 1 January 2016, with early adoption permitted. These amendments are not expected to have any impact on the Group’s consolidated financial statements.
IAS 27: Equity Method in Separate Financial Statements The amendments will allow entities to use the equity method to account for investments in subsidiaries, joint ventures and associates in their separate financial statements. Entities already applying IFRS and electing to change to the equity method in its separate financial statements will have to apply that change retrospectively. For first-time adopters of IFRS electing to use the equity method in its separate financial statements, they will be required to apply this method from the date of transition to IFRS. The amendments are effective for annual periods beginning on or after 1 January 2016, with early adoption permitted. This amendment will not have any impact on the Group’s consolidated financial statements.
At 31 December 2015
Notes to the Consolidated Financial Statements
ANNUAL REPORT 2015 35
4 STANDARDS AND INTERPRETATIONS ISSUED BUT NOT YET EFFECTIVE (continued)
IAS 27: Equity Method in Separate Financial Statements (continued)
Amendments to IFRS 10, IFRS 12 and IAS 28 Investment Entities: Applying the Consolidation Exception The amendments address issues that have arisen in applying the investment entities exception under IFRS 10. The amendments to IFRS 10 clarify that the exemption from presenting consolidated financial statements applies to a parent entity that is a subsidiary of an investment entity, when the investment entity measures all of its subsidiaries at fair value. Furthermore, the amendments to IFRS 10 clarify that only a subsidiary of an investment entity that is not an investment entity itself and that provides support services to the investment entity is consolidated. All other subsidiaries of an investment entity are measured at fair value. The amendments to IAS 28 allow the investor, when applying the equity method, to retain the fair value measurement applied by the investment entity associate or joint venture to its interests in subsidiaries. These amendments must be applied retrospectively and are effective for annual periods beginning on or after 1 January 2016, with early adoption permitted. These amendments are not expected to have any impact on the Group’s consolidated financial statements. Annual Improvements 2012-2014 Cycle These improvements are effective for annual periods beginning on or after 1 January 2016 and are not expected to have a material impact on the Group’s consolidated financial statements. These improvements include: IFRS 5 Non-current Assets Held for Sale and Discontinued Operations Assets (or disposal groups) are generally disposed of either through sale or distribution to owners. The amendment clarifies that changing from one of these disposal methods to the other would not be considered a new plan of disposal, rather it is a continuation of the original plan. There is, therefore, no interruption of the application of the requirements in IFRS 5. This amendment must be applied prospectively. IFRS 7 Financial Instruments: Disclosures (i) Servicing contracts The amendment clarifies that a servicing contract that includes a fee can constitute continuing involvement in a financial asset. An entity must assess the nature of the fee and the arrangement against the guidance for continuing involvement in IFRS 7 in order to assess whether the disclosures are required. The assessment of which servicing contracts constitute continuing involvement must be done retrospectively. However, the required disclosures would not need to be provided for any period beginning before the annual period in which the entity first applies the amendments. (ii) Applicability of the amendments to IFRS 7 to condensed interim financial statements The amendment clarifies that the offsetting disclosure requirements do not apply to condensed interim financial statements, unless such disclosures provide a significant update to the information reported in the most recent annual report. This amendment must be applied retrospectively.
IAS 34 Interim Financial Reporting The amendment clarifies that the required interim disclosures must either be in the interim financial statements or incorporated by cross-reference between the interim financial statements and wherever they are included within the interim financial report (e.g., in the management commentary or risk report). The other information within the interim financial report must be available to users on the same terms as the interim financial statements and at the same time. This amendment must be applied retrospectively. This amendment is not expected to have any impact on the Group. Other standards and interpretations that have been issued but not yet effective are not likely to have any significant impact on the consolidated financial statements of the Group in the period of their initial application.
At 31 December 2015
Notes to the Consolidated Financial Statements
ANNUAL REPORT 201536
5 OTHER OPERATING INCOME This represents income from rebates, gains on disposal of property, plant and equipment and other miscellaneous income of the Group.
6 INVESTMENT INCOME (NET) 2015 2014 BD BD Dividend income 505,292 411,146 Gain on disposal of available-for-sale investments (net) 157,722 515,046 663,014 926,192
7 PROFIT OF THE GROUP FOR THE YEAR
Profit of the Group for the year is stated after charging: 2015 2014 BD BD
Inventories recognised as an expense on sale of finished goods 32,432,611 32,693,498
Provision for slow moving and obsolete inventories (note 13) 76,004 52,247
Allowance for impairment of trade receivables (note 14) 92,326 83,197
Operating lease rentals 267,709 266,917
Gain on disposal of property, plant and equipment 19,511 777
2015 2014 BD BDFinance costs Interest on term loans, import loans and a loan from non-controlling interests 214,605 258,458Interest on bank overdrafts 52,455 73,531 Bank charges 16,947 14,445 284,007 346,434
2015 2014 BD BDStaff costs Salaries and wages 3,252,617 3,000,676 Contributions to Social Insurance Organization (SIO), Bahrain and Public Authority for Social Security, Kuwait 265,999 249,220 Employees’ end of service benefits (note 26) 162,480 167,503Other benefits 911,462 870,067 4,592,558 4,287,466
The staff costs have been allocated in the consolidated statement of income as follows: 2015 2014 BD BD Cost of sales 1,171,527 1,075,050Personnel costs 3,374,620 3,178,784Direct operating costs - warehouse 46,411 33,632 4,592,558 4,287,466
At 31 December 2015
Notes to the Consolidated Financial Statements
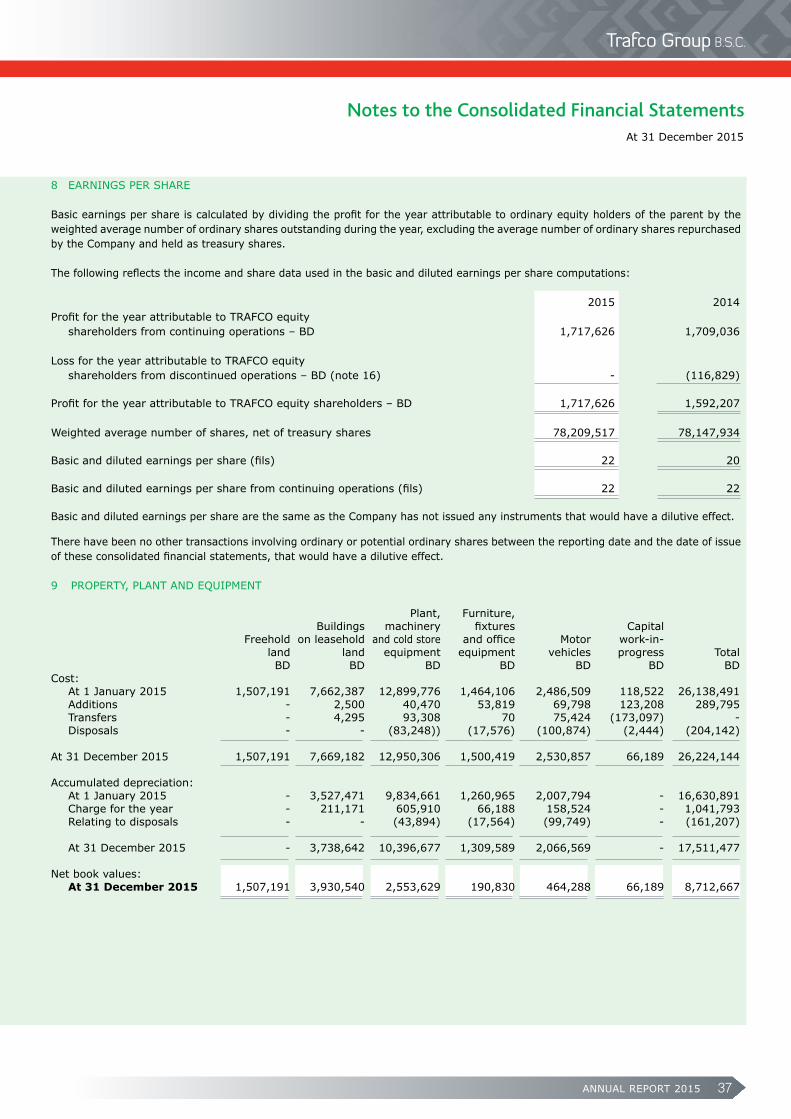
ANNUAL REPORT 2015 37
8 EARNINGS PER SHARE
Basic earnings per share is calculated by dividing the profit for the year attributable to ordinary equity holders of the parent by the weighted average number of ordinary shares outstanding during the year, excluding the average number of ordinary shares repurchased by the Company and held as treasury shares. The following reflects the income and share data used in the basic and diluted earnings per share computations: 2015 2014Profit for the year attributable to TRAFCO equity shareholders from continuing operations – BD 1,717,626 1,709,036
Loss for the year attributable to TRAFCO equity shareholders from discontinued operations – BD (note 16) - (116,829) Profit for the year attributable to TRAFCO equity shareholders – BD 1,717,626 1,592,207
Weighted average number of shares, net of treasury shares 78,209,517 78,147,934 Basic and diluted earnings per share (fils) 22 20 Basic and diluted earnings per share from continuing operations (fils) 22 22
Basic and diluted earnings per share are the same as the Company has not issued any instruments that would have a dilutive effect. There have been no other transactions involving ordinary or potential ordinary shares between the reporting date and the date of issue of these consolidated financial statements, that would have a dilutive effect.
9 PROPERTY, PLANT AND EQUIPMENT Plant, Furniture, Buildings machinery fixtures Capital Freehold on leasehold and cold store and office Motor work-in- land land equipment equipment vehicles progress Total BD BD BD BD BD BD BDCost: At 1 January 2015 1,507,191 7,662,387 12,899,776 1,464,106 2,486,509 118,522 26,138,491 Additions - 2,500 40,470 53,819 69,798 123,208 289,795 Transfers - 4,295 93,308 70 75,424 (173,097) - Disposals - - (83,248)) (17,576) (100,874) (2,444) (204,142) At 31 December 2015 1,507,191 7,669,182 12,950,306 1,500,419 2,530,857 66,189 26,224,144 Accumulated depreciation: At 1 January 2015 - 3,527,471 9,834,661 1,260,965 2,007,794 - 16,630,891 Charge for the year - 211,171 605,910 66,188 158,524 - 1,041,793 Relating to disposals - - (43,894) (17,564) (99,749) - (161,207) At 31 December 2015 - 3,738,642 10,396,677 1,309,589 2,066,569 - 17,511,477 Net book values: At 31 December 2015 1,507,191 3,930,540 2,553,629 190,830 464,288 66,189 8,712,667
At 31 December 2015
Notes to the Consolidated Financial Statements
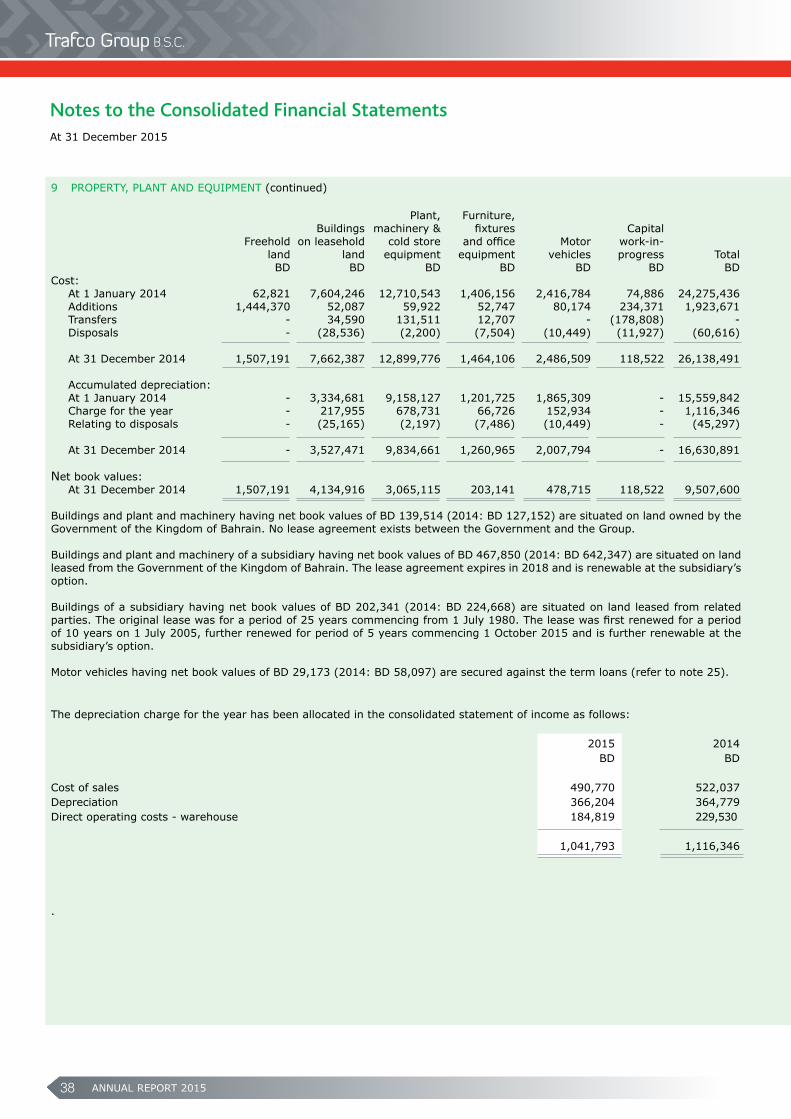
ANNUAL REPORT 201538
9 PROPERTY, PLANT AND EQUIPMENT (continued) Plant, Furniture, Buildings machinery & fixtures Capital Freehold on leasehold cold store and office Motor work-in- land land equipment equipment vehicles progress Total BD BD BD BD BD BD BDCost: At 1 January 2014 62,821 7,604,246 12,710,543 1,406,156 2,416,784 74,886 24,275,436 Additions 1,444,370 52,087 59,922 52,747 80,174 234,371 1,923,671 Transfers - 34,590 131,511 12,707 - (178,808) - Disposals - (28,536) (2,200) (7,504) (10,449) (11,927) (60,616) At 31 December 2014 1,507,191 7,662,387 12,899,776 1,464,106 2,486,509 118,522 26,138,491 Accumulated depreciation: At 1 January 2014 - 3,334,681 9,158,127 1,201,725 1,865,309 - 15,559,842 Charge for the year - 217,955 678,731 66,726 152,934 - 1,116,346 Relating to disposals - (25,165) (2,197) (7,486) (10,449) - (45,297)
At 31 December 2014 - 3,527,471 9,834,661 1,260,965 2,007,794 - 16,630,891 Net book values: At 31 December 2014 1,507,191 4,134,916 3,065,115 203,141 478,715 118,522 9,507,600
Buildings and plant and machinery having net book values of BD 139,514 (2014: BD 127,152) are situated on land owned by the Government of the Kingdom of Bahrain. No lease agreement exists between the Government and the Group. Buildings and plant and machinery of a subsidiary having net book values of BD 467,850 (2014: BD 642,347) are situated on land leased from the Government of the Kingdom of Bahrain. The lease agreement expires in 2018 and is renewable at the subsidiary’s option.
Buildings of a subsidiary having net book values of BD 202,341 (2014: BD 224,668) are situated on land leased from related parties. The original lease was for a period of 25 years commencing from 1 July 1980. The lease was first renewed for a period of 10 years on 1 July 2005, further renewed for period of 5 years commencing 1 October 2015 and is further renewable at the subsidiary’s option. Motor vehicles having net book values of BD 29,173 (2014: BD 58,097) are secured against the term loans (refer to note 25).
The depreciation charge for the year has been allocated in the consolidated statement of income as follows: 2015 2014 BD BD
Cost of sales 490,770 522,037Depreciation 366,204 364,779 Direct operating costs - warehouse 184,819 229,530 1,041,793 1,116,346 .
At 31 December 2015
Notes to the Consolidated Financial Statements
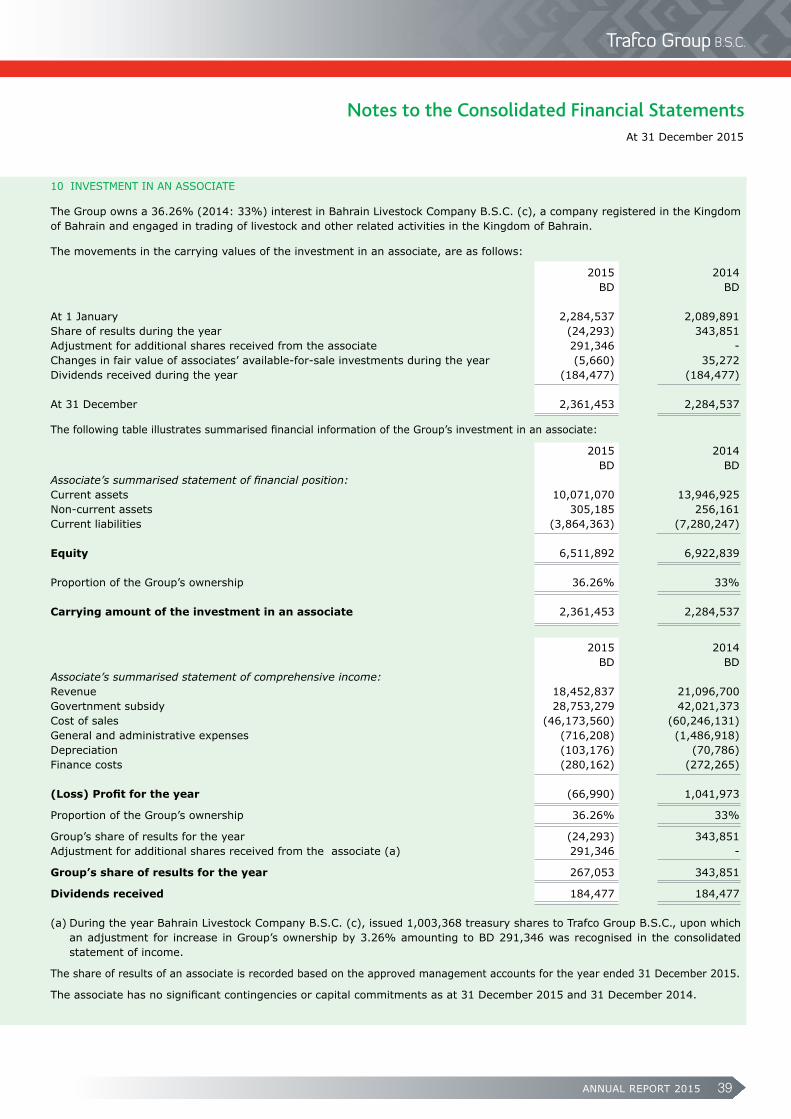
ANNUAL REPORT 2015 39
10 INVESTMENT IN AN ASSOCIATE
The Group owns a 36.26% (2014: 33%) interest in Bahrain Livestock Company B.S.C. (c), a company registered in the Kingdom of Bahrain and engaged in trading of livestock and other related activities in the Kingdom of Bahrain.
The movements in the carrying values of the investment in an associate, are as follows:
2015 2014 BD BD
At 1 January 2,284,537 2,089,891Share of results during the year (24,293) 343,851Adjustment for additional shares received from the associate 291,346 -Changes in fair value of associates’ available-for-sale investments during the year (5,660) 35,272Dividends received during the year (184,477) (184,477)
At 31 December 2,361,453 2,284,537 The following table illustrates summarised financial information of the Group’s investment in an associate:
2015 2014 BD BDAssociate’s summarised statement of financial position: Current assets 10,071,070 13,946,925Non-current assets 305,185 256,161Current liabilities (3,864,363) (7,280,247) Equity 6,511,892 6,922,839 Proportion of the Group’s ownership 36.26% 33% Carrying amount of the investment in an associate 2,361,453 2,284,537 2015 2014 BD BDAssociate’s summarised statement of comprehensive income: Revenue 18,452,837 21,096,700Govertnment subsidy 28,753,279 42,021,373 Cost of sales (46,173,560) (60,246,131)General and administrative expenses (716,208) (1,486,918)Depreciation (103,176) (70,786)Finance costs (280,162) (272,265) (Loss) Profitfortheyear (66,990) 1,041,973 Proportion of the Group’s ownership 36.26% 33%
Group’s share of results for the year (24,293) 343,851Adjustment for additional shares received from the associate (a) 291,346 -
Group’s share of results for the year 267,053 343,851 Dividends received 184,477 184,477 (a) During the year Bahrain Livestock Company B.S.C. (c), issued 1,003,368 treasury shares to Trafco Group B.S.C., upon which
an adjustment for increase in Group’s ownership by 3.26% amounting to BD 291,346 was recognised in the consolidated statement of income.
The share of results of an associate is recorded based on the approved management accounts for the year ended 31 December 2015.
The associate has no significant contingencies or capital commitments as at 31 December 2015 and 31 December 2014.
At 31 December 2015
Notes to the Consolidated Financial Statements
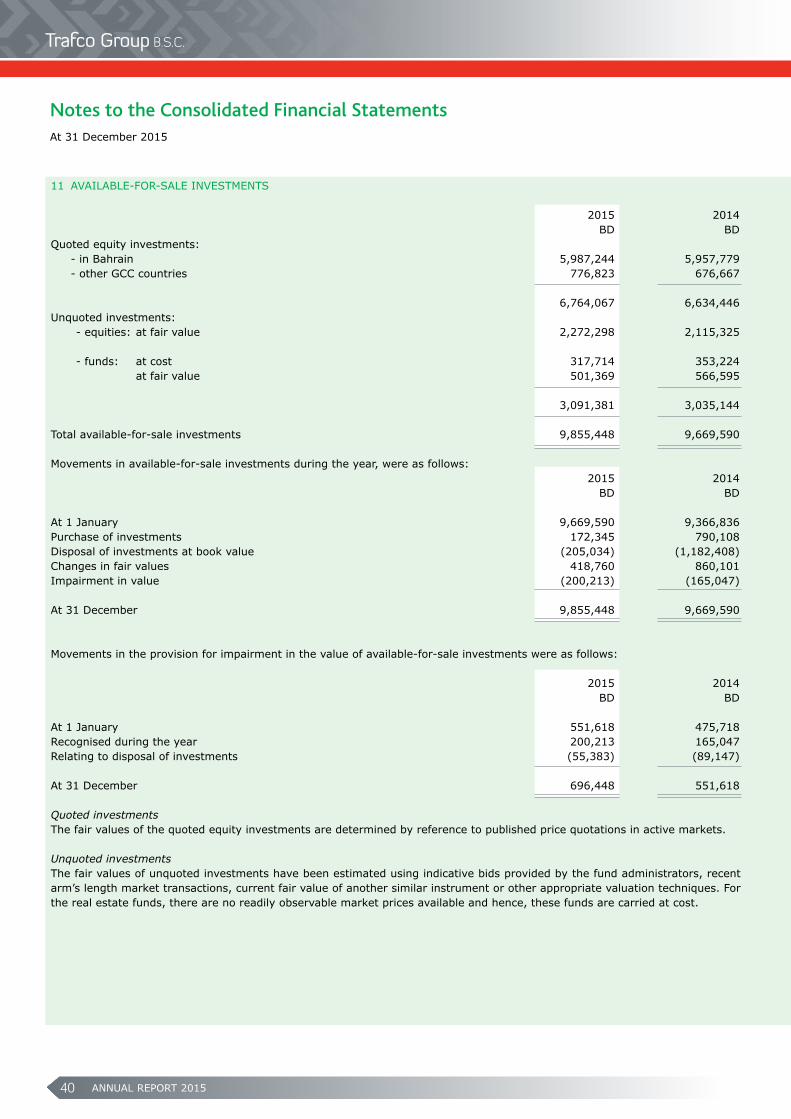
ANNUAL REPORT 201540
11 AVAILABLE-FOR-SALE INVESTMENTS 2015 2014 BD BDQuoted equity investments: - in Bahrain 5,987,244 5,957,779 - other GCC countries 776,823 676,667
6,764,067 6,634,446 Unquoted investments: - equities: at fair value 2,272,298 2,115,325 - funds: at cost 317,714 353,224 at fair value 501,369 566,595 3,091,381 3,035,144
Total available-for-sale investments 9,855,448 9,669,590
Movements in available-for-sale investments during the year, were as follows: 2015 2014 BD BD
At 1 January 9,669,590 9,366,836Purchase of investments 172,345 790,108Disposal of investments at book value (205,034) (1,182,408)Changes in fair values 418,760 860,101Impairment in value (200,213) (165,047) At 31 December 9,855,448 9,669,590 Movements in the provision for impairment in the value of available-for-sale investments were as follows: 2015 2014 BD BD At 1 January 551,618 475,718Recognised during the year 200,213 165,047Relating to disposal of investments (55,383) (89,147) At 31 December 696,448 551,618 Quoted investmentsThe fair values of the quoted equity investments are determined by reference to published price quotations in active markets.
Unquoted investments The fair values of unquoted investments have been estimated using indicative bids provided by the fund administrators, recent arm’s length market transactions, current fair value of another similar instrument or other appropriate valuation techniques. For the real estate funds, there are no readily observable market prices available and hence, these funds are carried at cost.
At 31 December 2015
Notes to the Consolidated Financial Statements
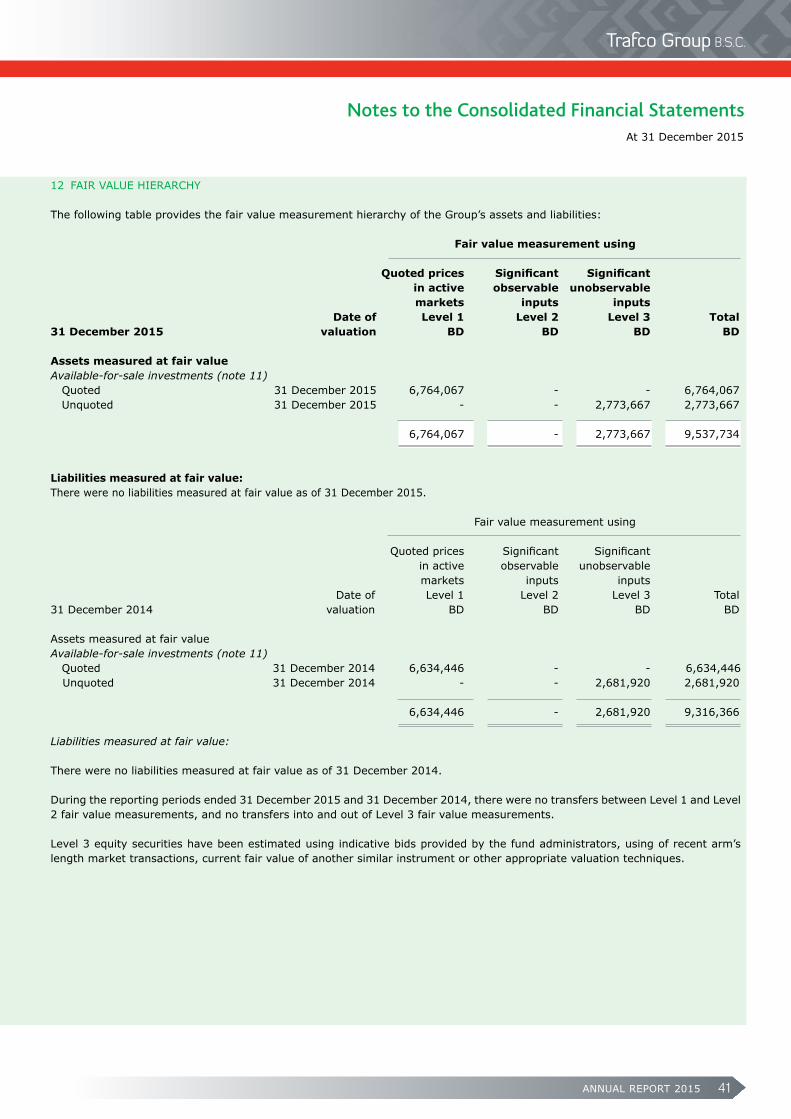
ANNUAL REPORT 2015 41
12 FAIR VALUE HIERARCHY
The following table provides the fair value measurement hierarchy of the Group’s assets and liabilities: Fair value measurement using
Quotedprices Significant Significant in active observable unobservable markets inputs inputs Date of Level 1 Level 2 Level 3 Total31 December 2015 valuation BD BD BD BD
Assets measured at fair value Available-for-sale investments (note 11) Quoted 31 December 2015 6,764,067 - - 6,764,067 Unquoted 31 December 2015 - - 2,773,667 2,773,667 6,764,067 - 2,773,667 9,537,734
Liabilities measured at fair value: There were no liabilities measured at fair value as of 31 December 2015.
Fair value measurement using
Quoted prices Significant Significant in active observable unobservable markets inputs inputs Date of Level 1 Level 2 Level 3 Total31 December 2014 valuation BD BD BD BD
Assets measured at fair value Available-for-sale investments (note 11) Quoted 31 December 2014 6,634,446 - - 6,634,446 Unquoted 31 December 2014 - - 2,681,920 2,681,920 6,634,446 - 2,681,920 9,316,366
Liabilities measured at fair value:
There were no liabilities measured at fair value as of 31 December 2014. During the reporting periods ended 31 December 2015 and 31 December 2014, there were no transfers between Level 1 and Level 2 fair value measurements, and no transfers into and out of Level 3 fair value measurements. Level 3 equity securities have been estimated using indicative bids provided by the fund administrators, using of recent arm’s length market transactions, current fair value of another similar instrument or other appropriate valuation techniques.
At 31 December 2015
Notes to the Consolidated Financial Statements
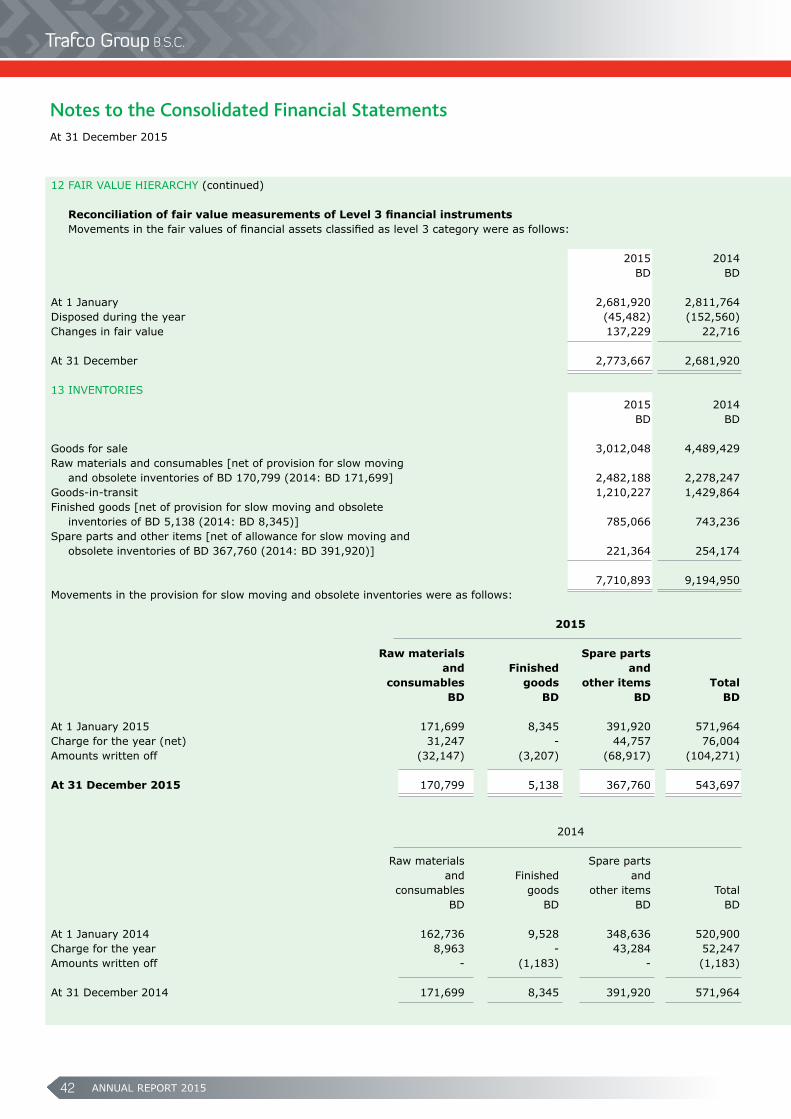
ANNUAL REPORT 201542
12 FAIR VALUE HIERARCHY (continued) ReconciliationoffairvaluemeasurementsofLevel3financialinstruments Movements in the fair values of financial assets classified as level 3 category were as follows: 2015 2014 BD BD
At 1 January 2,681,920 2,811,764Disposed during the year (45,482) (152,560)Changes in fair value 137,229 22,716 At 31 December 2,773,667 2,681,920 13 INVENTORIES 2015 2014 BD BD Goods for sale 3,012,048 4,489,429Raw materials and consumables [net of provision for slow moving and obsolete inventories of BD 170,799 (2014: BD 171,699] 2,482,188 2,278,247Goods-in-transit 1,210,227 1,429,864Finished goods [net of provision for slow moving and obsolete inventories of BD 5,138 (2014: BD 8,345)] 785,066 743,236Spare parts and other items [net of allowance for slow moving and obsolete inventories of BD 367,760 (2014: BD 391,920)] 221,364 254,174 7,710,893 9,194,950Movements in the provision for slow moving and obsolete inventories were as follows: 2015
Raw materials Spare parts and Finished and consumables goods other items Total BD BD BD BD
At 1 January 2015 171,699 8,345 391,920 571,964Charge for the year (net) 31,247 - 44,757 76,004Amounts written off (32,147) (3,207) (68,917) (104,271) At 31 December 2015 170,799 5,138 367,760 543,697
2014
Raw materials Spare parts and Finished and consumables goods other items Total BD BD BD BD
At 1 January 2014 162,736 9,528 348,636 520,900Charge for the year 8,963 - 43,284 52,247 Amounts written off - (1,183) - (1,183) At 31 December 2014 171,699 8,345 391,920 571,964
At 31 December 2015
Notes to the Consolidated Financial Statements
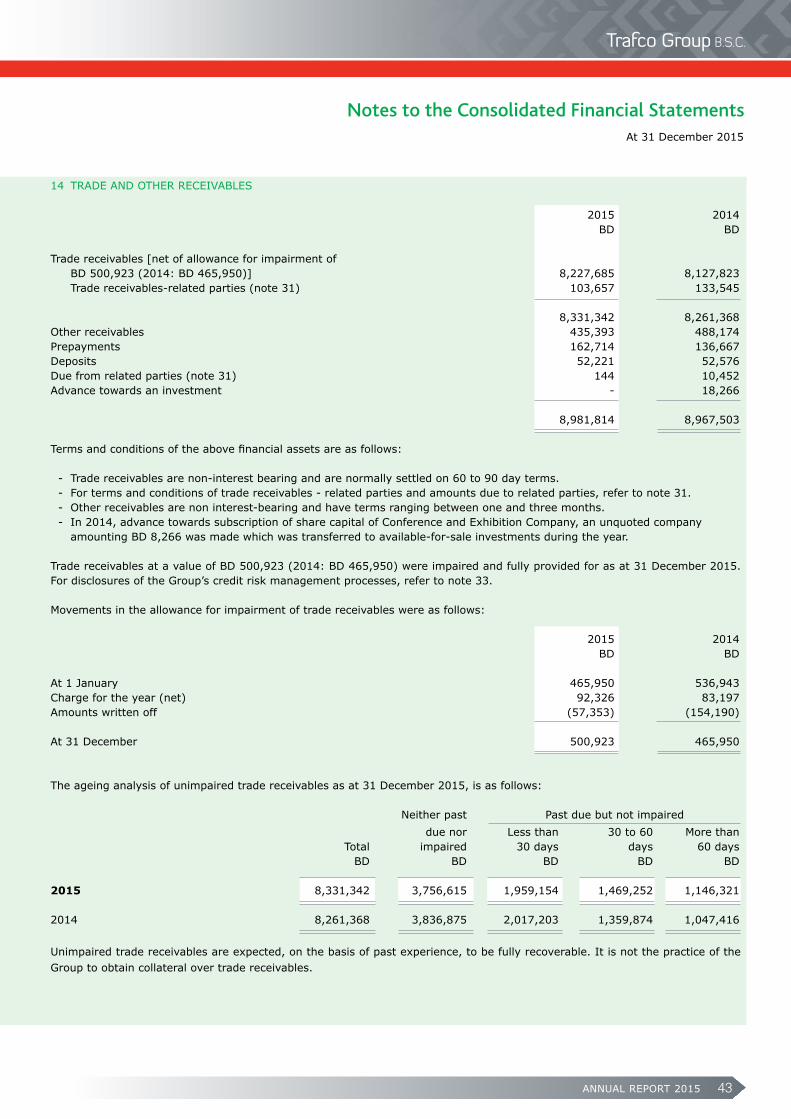
ANNUAL REPORT 2015 43
14 TRADE AND OTHER RECEIVABLES 2015 2014 BD BD Trade receivables [net of allowance for impairment of BD 500,923 (2014: BD 465,950)] 8,227,685 8,127,823 Trade receivables-related parties (note 31) 103,657 133,545 8,331,342 8,261,368Other receivables 435,393 488,174Prepayments 162,714 136,667Deposits 52,221 52,576Due from related parties (note 31) 144 10,452Advance towards an investment - 18,266 8,981,814 8,967,503 Terms and conditions of the above financial assets are as follows:
- Trade receivables are non-interest bearing and are normally settled on 60 to 90 day terms. - For terms and conditions of trade receivables - related parties and amounts due to related parties, refer to note 31. - Other receivables are non interest-bearing and have terms ranging between one and three months. - In 2014, advance towards subscription of share capital of Conference and Exhibition Company, an unquoted company amounting BD 8,266 was made which was transferred to available-for-sale investments during the year.
Trade receivables at a value of BD 500,923 (2014: BD 465,950) were impaired and fully provided for as at 31 December 2015. For disclosures of the Group’s credit risk management processes, refer to note 33. Movements in the allowance for impairment of trade receivables were as follows: 2015 2014 BD BD
At 1 January 465,950 536,943Charge for the year (net) 92,326 83,197Amounts written off (57,353) (154,190)
At 31 December 500,923 465,950
The ageing analysis of unimpaired trade receivables as at 31 December 2015, is as follows: Neither past Past due but not impaired due nor Less than 30 to 60 More than Total impaired 30 days days 60 days BD BD BD BD BD 2015 8,331,342 3,756,615 1,959,154 1,469,252 1,146,321
2014 8,261,368 3,836,875 2,017,203 1,359,874 1,047,416
Unimpaired trade receivables are expected, on the basis of past experience, to be fully recoverable. It is not the practice of the Group to obtain collateral over trade receivables.
At 31 December 2015
Notes to the Consolidated Financial Statements
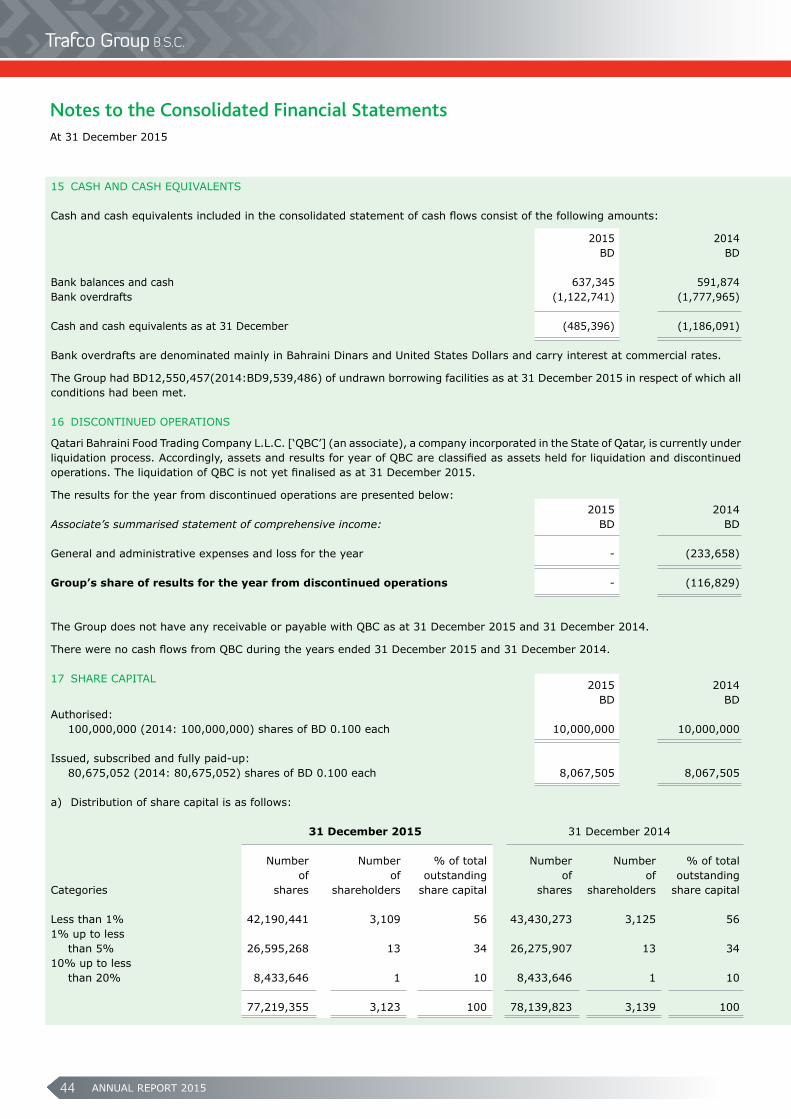
ANNUAL REPORT 201544
15 CASH AND CASH EQUIVALENTS Cash and cash equivalents included in the consolidated statement of cash flows consist of the following amounts: 2015 2014 BD BD Bank balances and cash 637,345 591,874Bank overdrafts (1,122,741) (1,777,965) Cash and cash equivalents as at 31 December (485,396) (1,186,091)
Bank overdrafts are denominated mainly in Bahraini Dinars and United States Dollars and carry interest at commercial rates. The Group had BD12,550,457(2014:BD9,539,486) of undrawn borrowing facilities as at 31 December 2015 in respect of which all conditions had been met. 16 DISCONTINUED OPERATIONS Qatari Bahraini Food Trading Company L.L.C. [‘QBC’] (an associate), a company incorporated in the State of Qatar, is currently under liquidation process. Accordingly, assets and results for year of QBC are classified as assets held for liquidation and discontinued operations. The liquidation of QBC is not yet finalised as at 31 December 2015. The results for the year from discontinued operations are presented below: 2015 2014Associate’s summarised statement of comprehensive income: BD BD
General and administrative expenses and loss for the year - (233,658) Group’s share of results for the year from discontinued operations - (116,829) The Group does not have any receivable or payable with QBC as at 31 December 2015 and 31 December 2014. There were no cash flows from QBC during the years ended 31 December 2015 and 31 December 2014. 17 SHARE CAPITAL 2015 2014 BD BDAuthorised: 100,000,000 (2014: 100,000,000) shares of BD 0.100 each 10,000,000 10,000,000 Issued, subscribed and fully paid-up: 80,675,052 (2014: 80,675,052) shares of BD 0.100 each 8,067,505 8,067,505
a) Distribution of share capital is as follows: 31 December 2015 31 December 2014 Number Number % of total Number Number % of total of of outstanding of of outstandingCategories shares shareholders share capital shares shareholders share capital Less than 1% 42,190,441 3,109 56 43,430,273 3,125 56 1% up to less than 5% 26,595,268 13 34 26,275,907 13 34 10% up to less than 20% 8,433,646 1 10 8,433,646 1 10 77,219,355 3,123 100 78,139,823 3,139 100
At 31 December 2015
Notes to the Consolidated Financial Statements
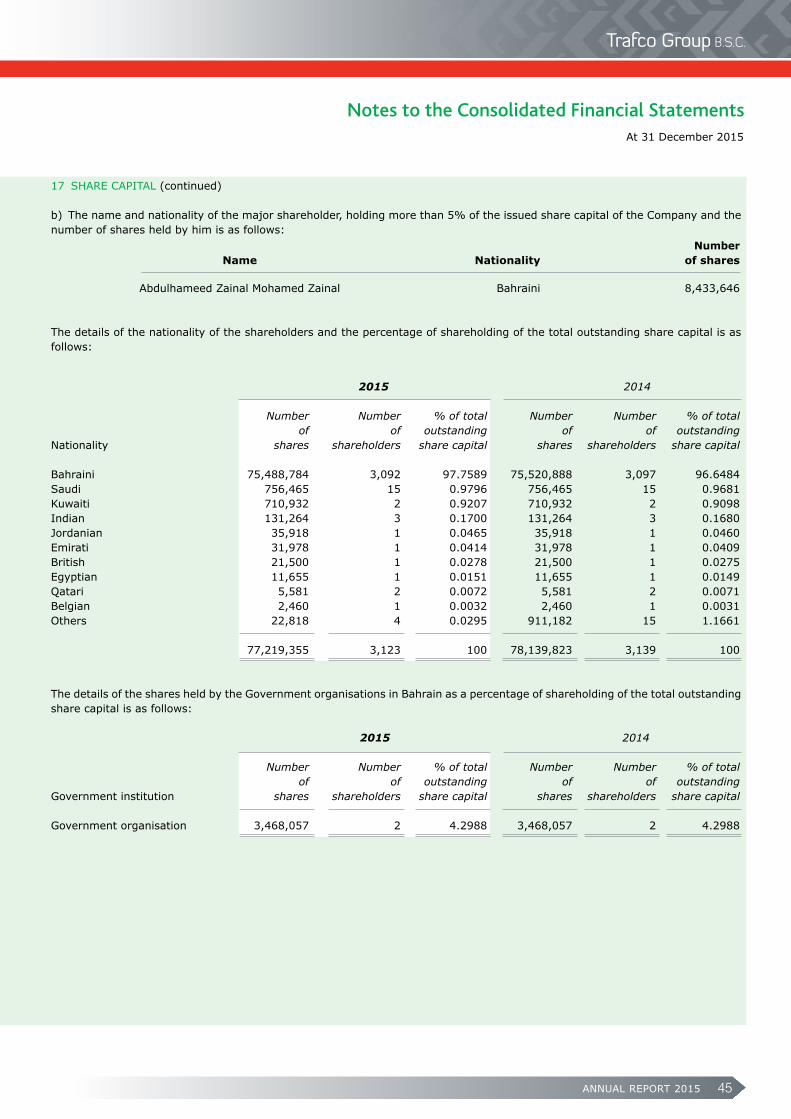
ANNUAL REPORT 2015 45
17 SHARE CAPITAL (continued) b) The name and nationality of the major shareholder, holding more than 5% of the issued share capital of the Company and the number of shares held by him is as follows: Number Name Nationality of shares Abdulhameed Zainal Mohamed Zainal Bahraini 8,433,646
The details of the nationality of the shareholders and the percentage of shareholding of the total outstanding share capital is as follows:
2015 2014 Number Number % of total Number Number % of total of of outstanding of of outstandingNationality shares shareholders share capital shares shareholders share capital Bahraini 75,488,784 3,092 97.7589 75,520,888 3,097 96.6484 Saudi 756,465 15 0.9796 756,465 15 0.9681 Kuwaiti 710,932 2 0.9207 710,932 2 0.9098Indian 131,264 3 0.1700 131,264 3 0.1680Jordanian 35,918 1 0.0465 35,918 1 0.0460Emirati 31,978 1 0.0414 31,978 1 0.0409British 21,500 1 0.0278 21,500 1 0.0275Egyptian 11,655 1 0.0151 11,655 1 0.0149Qatari 5,581 2 0.0072 5,581 2 0.0071Belgian 2,460 1 0.0032 2,460 1 0.0031Others 22,818 4 0.0295 911,182 15 1.1661
77,219,355 3,123 100 78,139,823 3,139 100
The details of the shares held by the Government organisations in Bahrain as a percentage of shareholding of the total outstanding share capital is as follows:
2015 2014 Number Number % of total Number Number % of total of of outstanding of of outstandingGovernment institution shares shareholders share capital shares shareholders share capital Government organisation 3,468,057 2 4.2988 3,468,057 2 4.2988
At 31 December 2015
Notes to the Consolidated Financial Statements
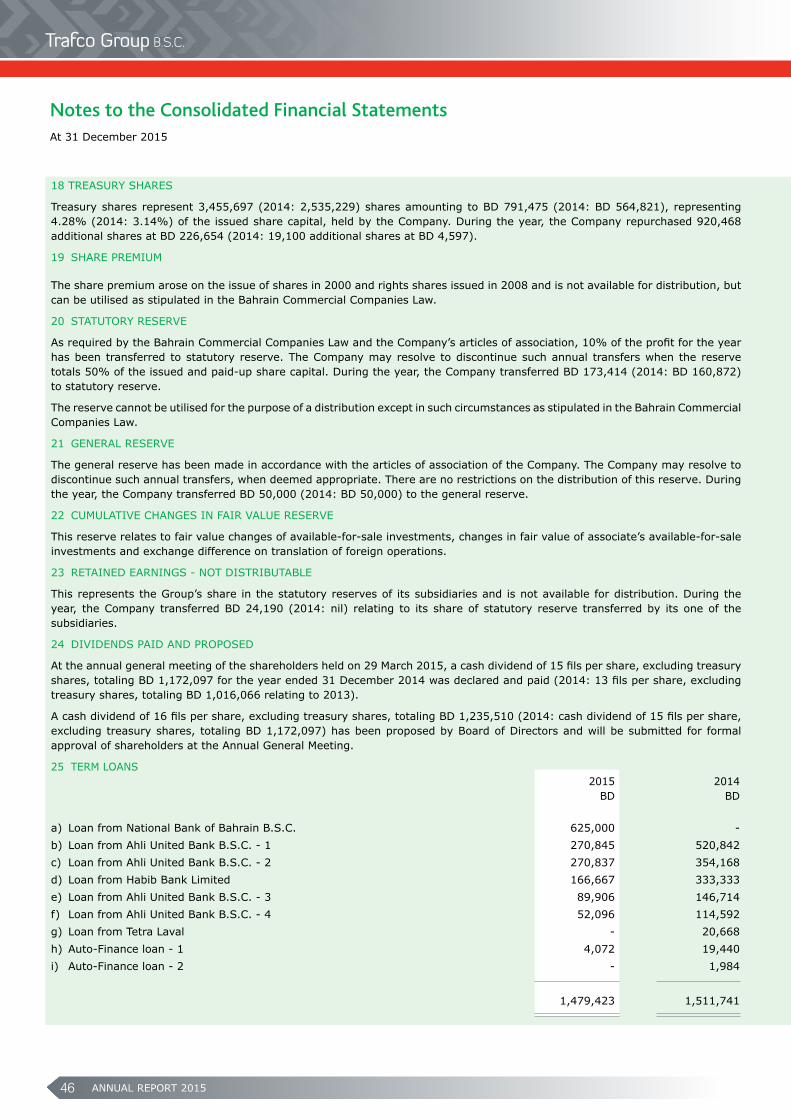
ANNUAL REPORT 201546
18 TREASURY SHARES
Treasury shares represent 3,455,697 (2014: 2,535,229) shares amounting to BD 791,475 (2014: BD 564,821), representing 4.28% (2014: 3.14%) of the issued share capital, held by the Company. During the year, the Company repurchased 920,468 additional shares at BD 226,654 (2014: 19,100 additional shares at BD 4,597).
19 SHARE PREMIUM
The share premium arose on the issue of shares in 2000 and rights shares issued in 2008 and is not available for distribution, but can be utilised as stipulated in the Bahrain Commercial Companies Law.
20 STATUTORY RESERVE
As required by the Bahrain Commercial Companies Law and the Company’s articles of association, 10% of the profit for the year has been transferred to statutory reserve. The Company may resolve to discontinue such annual transfers when the reserve totals 50% of the issued and paid-up share capital. During the year, the Company transferred BD 173,414 (2014: BD 160,872) to statutory reserve.
The reserve cannot be utilised for the purpose of a distribution except in such circumstances as stipulated in the Bahrain Commercial Companies Law.
21 GENERAL RESERVE
The general reserve has been made in accordance with the articles of association of the Company. The Company may resolve to discontinue such annual transfers, when deemed appropriate. There are no restrictions on the distribution of this reserve. During the year, the Company transferred BD 50,000 (2014: BD 50,000) to the general reserve.
22 CUMULATIVE CHANGES IN FAIR VALUE RESERVE
This reserve relates to fair value changes of available-for-sale investments, changes in fair value of associate’s available-for-sale investments and exchange difference on translation of foreign operations.
23 RETAINED EARNINGS - NOT DISTRIBUTABLE
This represents the Group’s share in the statutory reserves of its subsidiaries and is not available for distribution. During the year, the Company transferred BD 24,190 (2014: nil) relating to its share of statutory reserve transferred by its one of the subsidiaries.
24 DIVIDENDS PAID AND PROPOSED
At the annual general meeting of the shareholders held on 29 March 2015, a cash dividend of 15 fils per share, excluding treasury shares, totaling BD 1,172,097 for the year ended 31 December 2014 was declared and paid (2014: 13 fils per share, excluding treasury shares, totaling BD 1,016,066 relating to 2013).
A cash dividend of 16 fils per share, excluding treasury shares, totaling BD 1,235,510 (2014: cash dividend of 15 fils per share, excluding treasury shares, totaling BD 1,172,097) has been proposed by Board of Directors and will be submitted for formal approval of shareholders at the Annual General Meeting.
25 TERM LOANS 2015 2014 BD BD
a) Loan from National Bank of Bahrain B.S.C. 625,000 -b) Loan from Ahli United Bank B.S.C. - 1 270,845 520,842 c) Loan from Ahli United Bank B.S.C. - 2 270,837 354,168d) Loan from Habib Bank Limited 166,667 333,333e) Loan from Ahli United Bank B.S.C. - 3 89,906 146,714f) Loan from Ahli United Bank B.S.C. - 4 52,096 114,592g) Loan from Tetra Laval - 20,668 h) Auto-Finance loan - 1 4,072 19,440i) Auto-Finance loan - 2 - 1,984 1,479,423 1,511,741
At 31 December 2015
Notes to the Consolidated Financial Statements
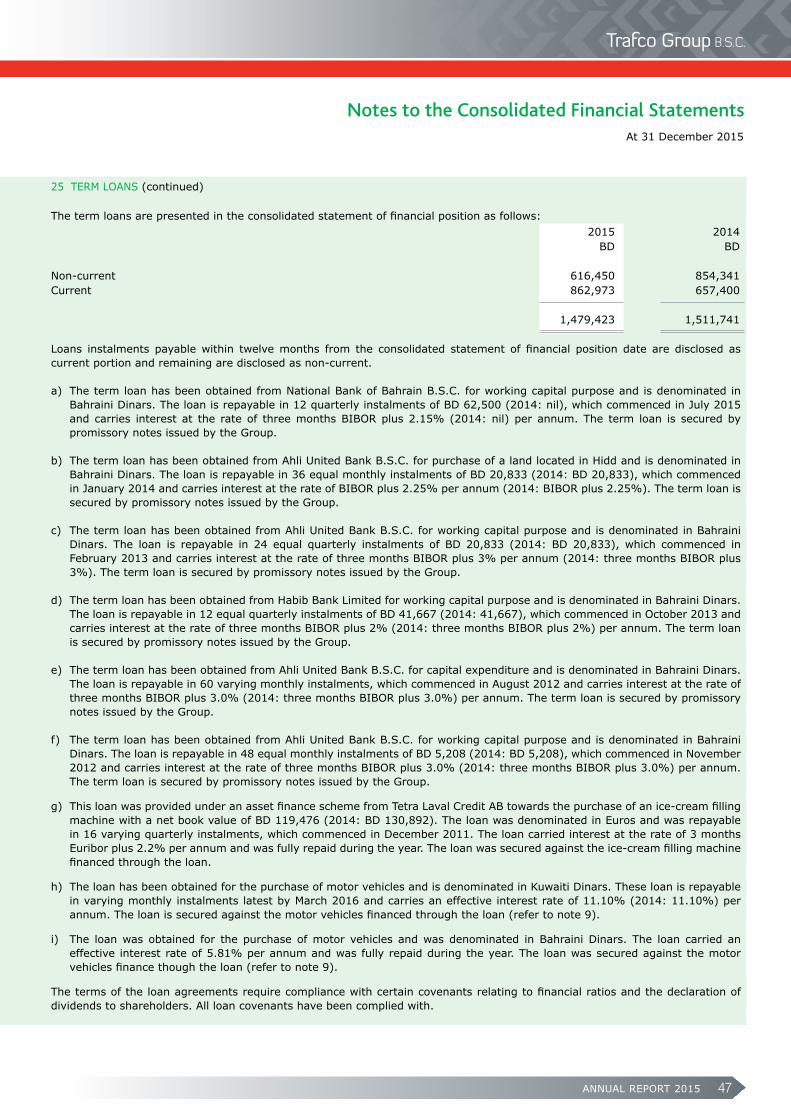
ANNUAL REPORT 2015 47
25 TERM LOANS (continued)
The term loans are presented in the consolidated statement of financial position as follows: 2015 2014 BD BD
Non-current 616,450 854,341Current 862,973 657,400 1,479,423 1,511,741
Loans instalments payable within twelve months from the consolidated statement of financial position date are disclosed as current portion and remaining are disclosed as non-current. a) The term loan has been obtained from National Bank of Bahrain B.S.C. for working capital purpose and is denominated in
Bahraini Dinars. The loan is repayable in 12 quarterly instalments of BD 62,500 (2014: nil), which commenced in July 2015 and carries interest at the rate of three months BIBOR plus 2.15% (2014: nil) per annum. The term loan is secured by promissory notes issued by the Group.
b) The term loan has been obtained from Ahli United Bank B.S.C. for purchase of a land located in Hidd and is denominated in
Bahraini Dinars. The loan is repayable in 36 equal monthly instalments of BD 20,833 (2014: BD 20,833), which commenced in January 2014 and carries interest at the rate of BIBOR plus 2.25% per annum (2014: BIBOR plus 2.25%). The term loan is secured by promissory notes issued by the Group.
c) The term loan has been obtained from Ahli United Bank B.S.C. for working capital purpose and is denominated in Bahraini
Dinars. The loan is repayable in 24 equal quarterly instalments of BD 20,833 (2014: BD 20,833), which commenced in February 2013 and carries interest at the rate of three months BIBOR plus 3% per annum (2014: three months BIBOR plus 3%). The term loan is secured by promissory notes issued by the Group.
d) The term loan has been obtained from Habib Bank Limited for working capital purpose and is denominated in Bahraini Dinars.
The loan is repayable in 12 equal quarterly instalments of BD 41,667 (2014: 41,667), which commenced in October 2013 and carries interest at the rate of three months BIBOR plus 2% (2014: three months BIBOR plus 2%) per annum. The term loan is secured by promissory notes issued by the Group.
e) The term loan has been obtained from Ahli United Bank B.S.C. for capital expenditure and is denominated in Bahraini Dinars.
The loan is repayable in 60 varying monthly instalments, which commenced in August 2012 and carries interest at the rate of three months BIBOR plus 3.0% (2014: three months BIBOR plus 3.0%) per annum. The term loan is secured by promissory notes issued by the Group.
f) The term loan has been obtained from Ahli United Bank B.S.C. for working capital purpose and is denominated in Bahraini
Dinars. The loan is repayable in 48 equal monthly instalments of BD 5,208 (2014: BD 5,208), which commenced in November 2012 and carries interest at the rate of three months BIBOR plus 3.0% (2014: three months BIBOR plus 3.0%) per annum. The term loan is secured by promissory notes issued by the Group.
g) This loan was provided under an asset finance scheme from Tetra Laval Credit AB towards the purchase of an ice-cream filling machine with a net book value of BD 119,476 (2014: BD 130,892). The loan was denominated in Euros and was repayable in 16 varying quarterly instalments, which commenced in December 2011. The loan carried interest at the rate of 3 months Euribor plus 2.2% per annum and was fully repaid during the year. The loan was secured against the ice-cream filling machine financed through the loan.
h) The loan has been obtained for the purchase of motor vehicles and is denominated in Kuwaiti Dinars. These loan is repayable
in varying monthly instalments latest by March 2016 and carries an effective interest rate of 11.10% (2014: 11.10%) per annum. The loan is secured against the motor vehicles financed through the loan (refer to note 9).
i) The loan was obtained for the purchase of motor vehicles and was denominated in Bahraini Dinars. The loan carried an effective interest rate of 5.81% per annum and was fully repaid during the year. The loan was secured against the motor vehicles finance though the loan (refer to note 9).
The terms of the loan agreements require compliance with certain covenants relating to financial ratios and the declaration of dividends to shareholders. All loan covenants have been complied with.
At 31 December 2015
Notes to the Consolidated Financial Statements
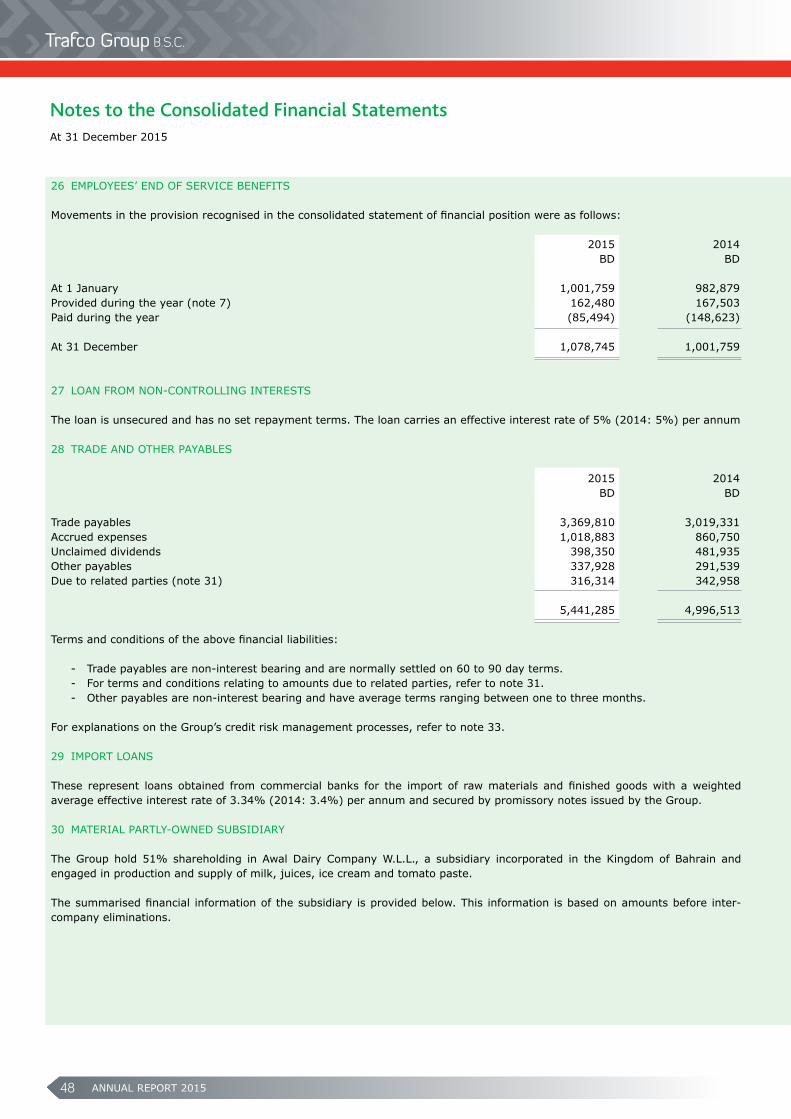
ANNUAL REPORT 201548
26 EMPLOYEES’ END OF SERVICE BENEFITS Movements in the provision recognised in the consolidated statement of financial position were as follows: 2015 2014 BD BD
At 1 January 1,001,759 982,879Provided during the year (note 7) 162,480 167,503Paid during the year (85,494) (148,623) At 31 December 1,078,745 1,001,759 27 LOAN FROM NON-CONTROLLING INTERESTS The loan is unsecured and has no set repayment terms. The loan carries an effective interest rate of 5% (2014: 5%) per annum
28 TRADE AND OTHER PAYABLES 2015 2014 BD BD Trade payables 3,369,810 3,019,331Accrued expenses 1,018,883 860,750Unclaimed dividends 398,350 481,935Other payables 337,928 291,539Due to related parties (note 31) 316,314 342,958 5,441,285 4,996,513 Terms and conditions of the above financial liabilities: - Trade payables are non-interest bearing and are normally settled on 60 to 90 day terms. - For terms and conditions relating to amounts due to related parties, refer to note 31. - Other payables are non-interest bearing and have average terms ranging between one to three months. For explanations on the Group’s credit risk management processes, refer to note 33. 29 IMPORT LOANS These represent loans obtained from commercial banks for the import of raw materials and finished goods with a weighted average effective interest rate of 3.34% (2014: 3.4%) per annum and secured by promissory notes issued by the Group. 30 MATERIAL PARTLY-OWNED SUBSIDIARY
The Group hold 51% shareholding in Awal Dairy Company W.L.L., a subsidiary incorporated in the Kingdom of Bahrain and engaged in production and supply of milk, juices, ice cream and tomato paste. The summarised financial information of the subsidiary is provided below. This information is based on amounts before inter-company eliminations.
At 31 December 2015
Notes to the Consolidated Financial Statements
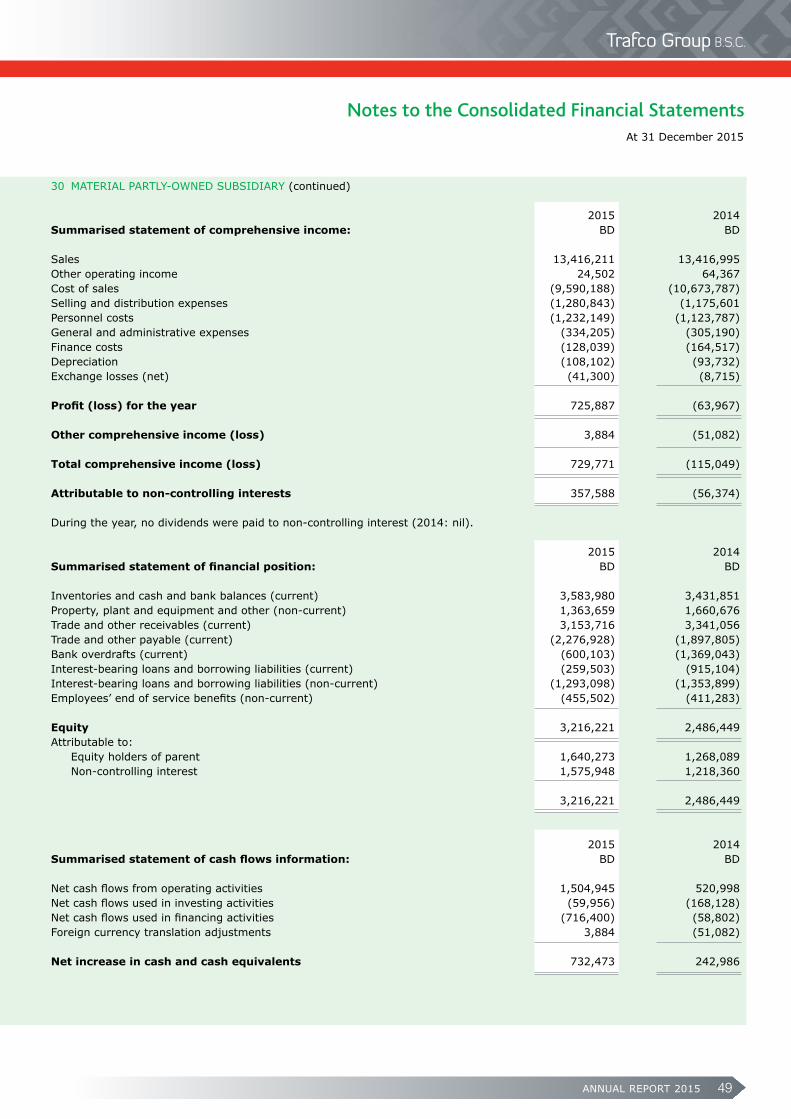
ANNUAL REPORT 2015 49
30 MATERIAL PARTLY-OWNED SUBSIDIARY (continued)
2015 2014 Summarised statement of comprehensive income: BD BD
Sales 13,416,211 13,416,995Other operating income 24,502 64,367Cost of sales (9,590,188) (10,673,787)Selling and distribution expenses (1,280,843) (1,175,601Personnel costs (1,232,149) (1,123,787)General and administrative expenses (334,205) (305,190) Finance costs (128,039) (164,517)Depreciation (108,102) (93,732)Exchange losses (net) (41,300) (8,715)
Profit(loss)fortheyear 725,887 (63,967)
Other comprehensive income (loss) 3,884 (51,082)
Total comprehensive income (loss) 729,771 (115,049)
Attributable to non-controlling interests 357,588 (56,374)
During the year, no dividends were paid to non-controlling interest (2014: nil).
2015 2014 Summarisedstatementoffinancialposition: BD BD Inventories and cash and bank balances (current) 3,583,980 3,431,851Property, plant and equipment and other (non-current) 1,363,659 1,660,676Trade and other receivables (current) 3,153,716 3,341,056Trade and other payable (current) (2,276,928) (1,897,805)Bank overdrafts (current) (600,103) (1,369,043)Interest-bearing loans and borrowing liabilities (current) (259,503) (915,104) Interest-bearing loans and borrowing liabilities (non-current) (1,293,098) (1,353,899)Employees’ end of service benefits (non-current) (455,502) (411,283)
Equity 3,216,221 2,486,449 Attributable to: Equity holders of parent 1,640,273 1,268,089 Non-controlling interest 1,575,948 1,218,360
3,216,221 2,486,449
2015 2014 Summarisedstatementofcashflowsinformation: BD BD Net cash flows from operating activities 1,504,945 520,998Net cash flows used in investing activities (59,956) (168,128)Net cash flows used in financing activities (716,400) (58,802)Foreign currency translation adjustments 3,884 (51,082)
Net increase in cash and cash equivalents 732,473 242,986
At 31 December 2015
Notes to the Consolidated Financial Statements
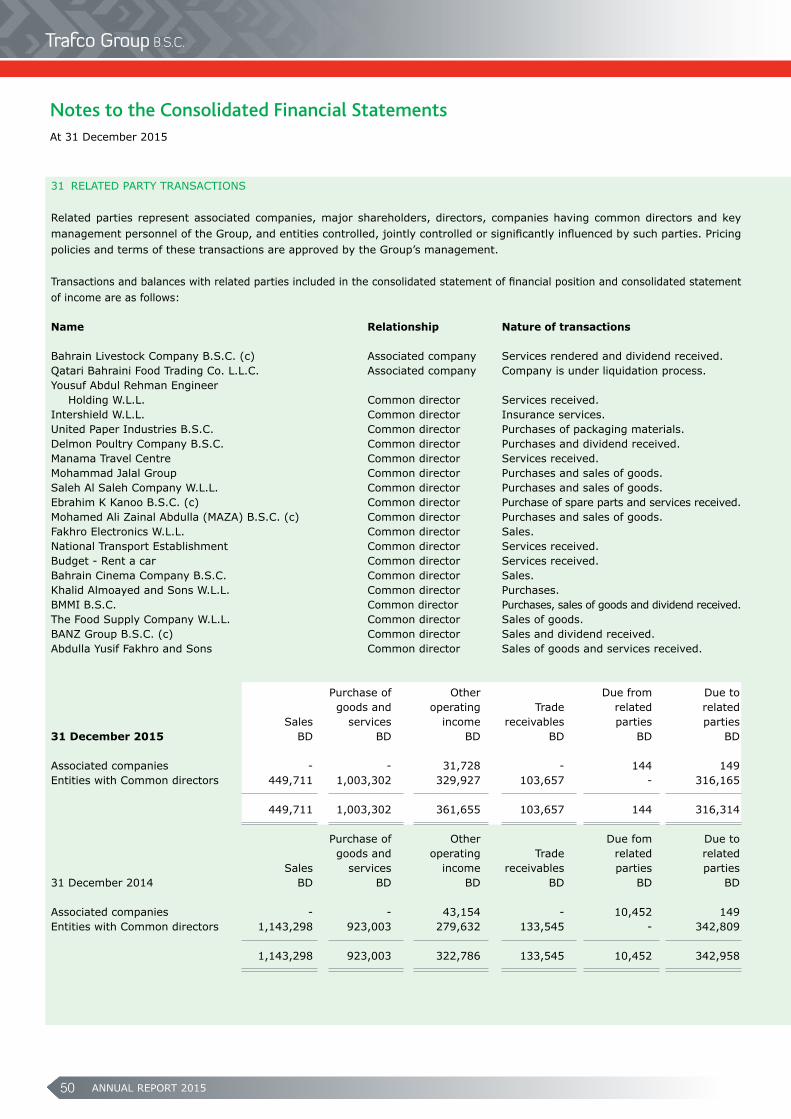
ANNUAL REPORT 201550
31 RELATED PARTY TRANSACTIONS Related parties represent associated companies, major shareholders, directors, companies having common directors and key management personnel of the Group, and entities controlled, jointly controlled or significantly influenced by such parties. Pricing policies and terms of these transactions are approved by the Group’s management.
Transactions and balances with related parties included in the consolidated statement of financial position and consolidated statement of income are as follows: Name Relationship Nature of transactions Bahrain Livestock Company B.S.C. (c) Associated company Services rendered and dividend received. Qatari Bahraini Food Trading Co. L.L.C. Associated company Company is under liquidation process. Yousuf Abdul Rehman Engineer Holding W.L.L. Common director Services received. Intershield W.L.L. Common director Insurance services. United Paper Industries B.S.C. Common director Purchases of packaging materials. Delmon Poultry Company B.S.C. Common director Purchases and dividend received. Manama Travel Centre Common director Services received. Mohammad Jalal Group Common director Purchases and sales of goods. Saleh Al Saleh Company W.L.L. Common director Purchases and sales of goods. Ebrahim K Kanoo B.S.C. (c) Common director Purchase of spare parts and services received. Mohamed Ali Zainal Abdulla (MAZA) B.S.C. (c) Common director Purchases and sales of goods. Fakhro Electronics W.L.L. Common director Sales. National Transport Establishment Common director Services received. Budget - Rent a car Common director Services received. Bahrain Cinema Company B.S.C. Common director Sales. Khalid Almoayed and Sons W.L.L. Common director Purchases. BMMI B.S.C. Common director Purchases, sales of goods and dividend received. The Food Supply Company W.L.L. Common director Sales of goods. BANZ Group B.S.C. (c) Common director Sales and dividend received. Abdulla Yusif Fakhro and Sons Common director Sales of goods and services received.
Purchase of Other Due from Due to goods and operating Trade related related Sales services income receivables parties parties31 December 2015 BD BD BD BD BD BD
Associated companies - - 31,728 - 144 149 Entities with Common directors 449,711 1,003,302 329,927 103,657 - 316,165
449,711 1,003,302 361,655 103,657 144 316,314
Purchase of Other Due fom Due to goods and operating Trade related related Sales services income receivables parties parties31 December 2014 BD BD BD BD BD BD
Associated companies - - 43,154 - 10,452 149 Entities with Common directors 1,143,298 923,003 279,632 133,545 - 342,809 1,143,298 923,003 322,786 133,545 10,452 342,958
At 31 December 2015
Notes to the Consolidated Financial Statements
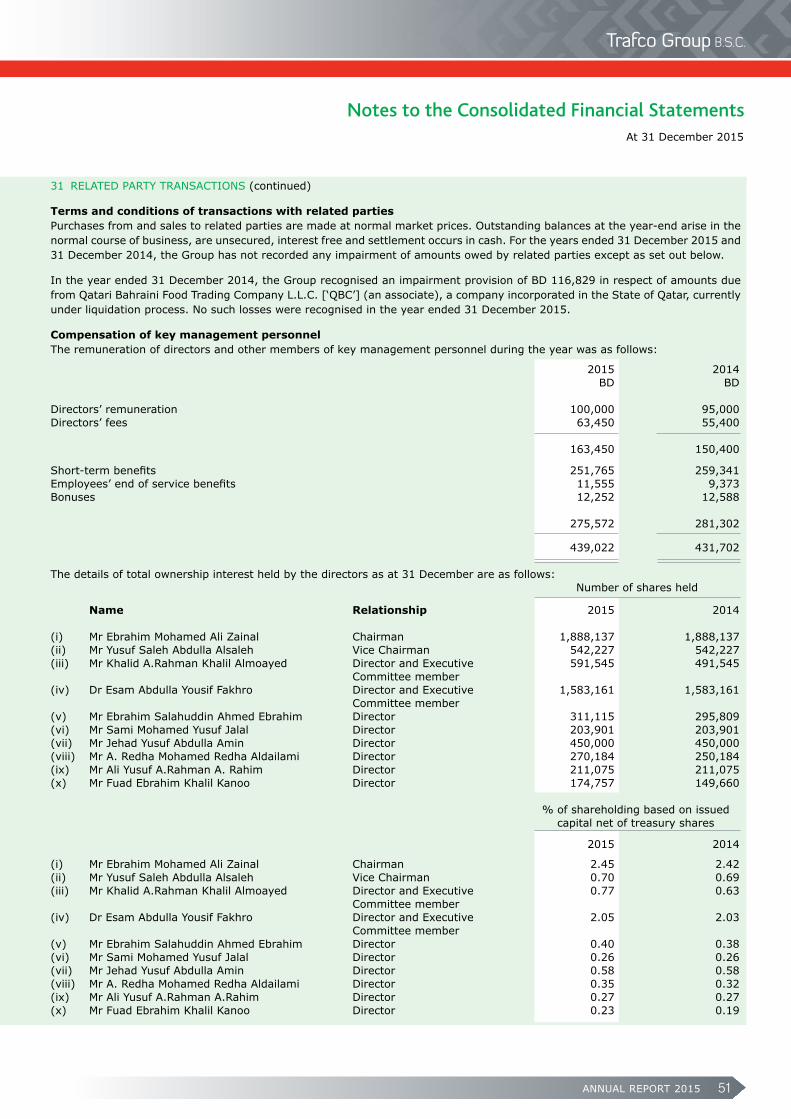
ANNUAL REPORT 2015 51
31 RELATED PARTY TRANSACTIONS (continued)
Terms and conditions of transactions with related parties Purchases from and sales to related parties are made at normal market prices. Outstanding balances at the year-end arise in the normal course of business, are unsecured, interest free and settlement occurs in cash. For the years ended 31 December 2015 and 31 December 2014, the Group has not recorded any impairment of amounts owed by related parties except as set out below. In the year ended 31 December 2014, the Group recognised an impairment provision of BD 116,829 in respect of amounts due from Qatari Bahraini Food Trading Company L.L.C. [‘QBC’] (an associate), a company incorporated in the State of Qatar, currently under liquidation process. No such losses were recognised in the year ended 31 December 2015.
Compensation of key management personnel The remuneration of directors and other members of key management personnel during the year was as follows: 2015 2014 BD BD
Directors’ remuneration 100,000 95,000 Directors’ fees 63,450 55,400 163,450 150,400
Short-term benefits 251,765 259,341Employees’ end of service benefits 11,555 9,373Bonuses 12,252 12,588
275,572 281,302 439,022 431,702
The details of total ownership interest held by the directors as at 31 December are as follows: Number of shares held Name Relationship 2015 2014
(i) Mr Ebrahim Mohamed Ali Zainal Chairman 1,888,137 1,888,137 (ii) Mr Yusuf Saleh Abdulla Alsaleh Vice Chairman 542,227 542,227 (iii) Mr Khalid A.Rahman Khalil Almoayed Director and Executive 591,545 491,545 Committee member (iv) Dr Esam Abdulla Yousif Fakhro Director and Executive 1,583,161 1,583,161 Committee member (v) Mr Ebrahim Salahuddin Ahmed Ebrahim Director 311,115 295,809(vi) Mr Sami Mohamed Yusuf Jalal Director 203,901 203,901 (vii) Mr Jehad Yusuf Abdulla Amin Director 450,000 450,000 (viii) Mr A. Redha Mohamed Redha Aldailami Director 270,184 250,184 (ix) Mr Ali Yusuf A.Rahman A. Rahim Director 211,075 211,075 (x) Mr Fuad Ebrahim Khalil Kanoo Director 174,757 149,660
% of shareholding based on issued capital net of treasury shares 2015 2014
(i) Mr Ebrahim Mohamed Ali Zainal Chairman 2.45 2.42(ii) Mr Yusuf Saleh Abdulla Alsaleh Vice Chairman 0.70 0.69(iii) Mr Khalid A.Rahman Khalil Almoayed Director and Executive 0.77 0.63 Committee member (iv) Dr Esam Abdulla Yousif Fakhro Director and Executive 2.05 2.03 Committee member (v) Mr Ebrahim Salahuddin Ahmed Ebrahim Director 0.40 0.38(vi) Mr Sami Mohamed Yusuf Jalal Director 0.26 0.26(vii) Mr Jehad Yusuf Abdulla Amin Director 0.58 0.58(viii) Mr A. Redha Mohamed Redha Aldailami Director 0.35 0.32(ix) Mr Ali Yusuf A.Rahman A.Rahim Director 0.27 0.27(x) Mr Fuad Ebrahim Khalil Kanoo Director 0.23 0.19
At 31 December 2015
Notes to the Consolidated Financial Statements
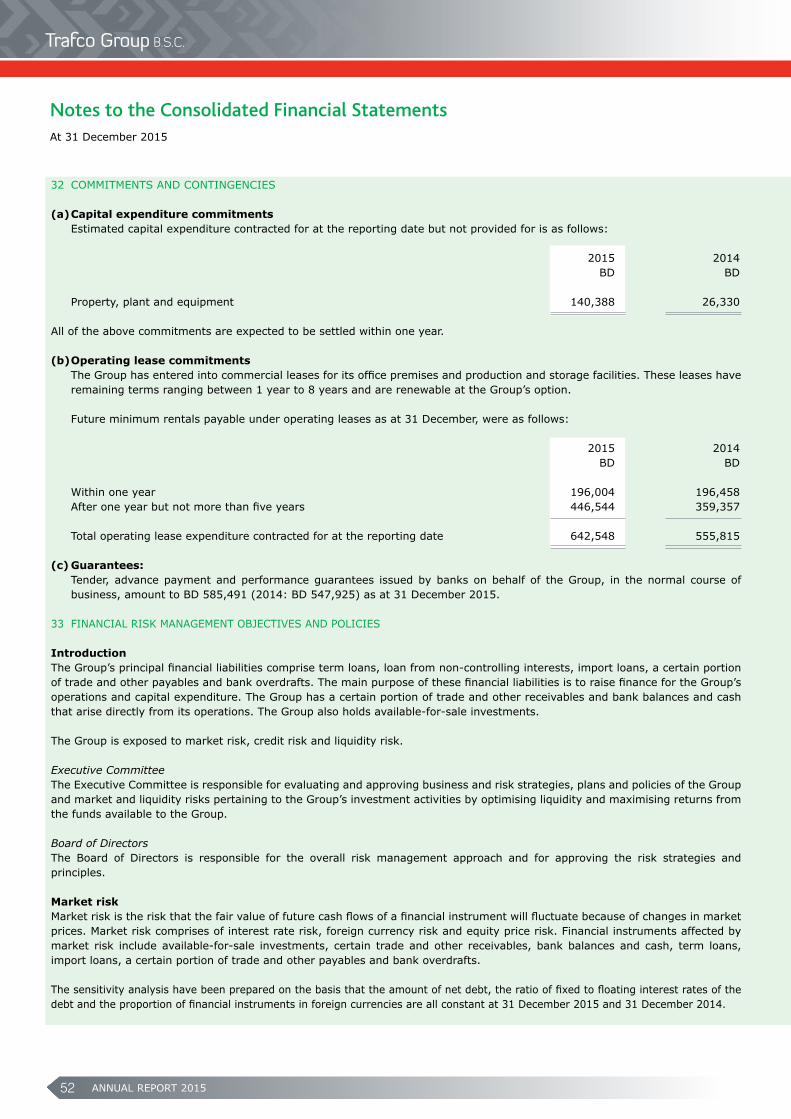
ANNUAL REPORT 201552
32 COMMITMENTS AND CONTINGENCIES (a) Capital expenditure commitments Estimated capital expenditure contracted for at the reporting date but not provided for is as follows: 2015 2014 BD BD
Property, plant and equipment 140,388 26,330 All of the above commitments are expected to be settled within one year. (b) Operating lease commitments The Group has entered into commercial leases for its office premises and production and storage facilities. These leases have remaining terms ranging between 1 year to 8 years and are renewable at the Group’s option. Future minimum rentals payable under operating leases as at 31 December, were as follows: 2015 2014 BD BD Within one year 196,004 196,458 After one year but not more than five years 446,544 359,357
Total operating lease expenditure contracted for at the reporting date 642,548 555,815 (c) Guarantees: Tender, advance payment and performance guarantees issued by banks on behalf of the Group, in the normal course of business, amount to BD 585,491 (2014: BD 547,925) as at 31 December 2015.
33 FINANCIAL RISK MANAGEMENT OBJECTIVES AND POLICIES Introduction The Group’s principal financial liabilities comprise term loans, loan from non-controlling interests, import loans, a certain portion of trade and other payables and bank overdrafts. The main purpose of these financial liabilities is to raise finance for the Group’s operations and capital expenditure. The Group has a certain portion of trade and other receivables and bank balances and cash that arise directly from its operations. The Group also holds available-for-sale investments. The Group is exposed to market risk, credit risk and liquidity risk.
Executive Committee The Executive Committee is responsible for evaluating and approving business and risk strategies, plans and policies of the Group and market and liquidity risks pertaining to the Group’s investment activities by optimising liquidity and maximising returns from the funds available to the Group.
Board of Directors The Board of Directors is responsible for the overall risk management approach and for approving the risk strategies and principles. Market risk Market risk is the risk that the fair value of future cash flows of a financial instrument will fluctuate because of changes in market prices. Market risk comprises of interest rate risk, foreign currency risk and equity price risk. Financial instruments affected by market risk include available-for-sale investments, certain trade and other receivables, bank balances and cash, term loans, import loans, a certain portion of trade and other payables and bank overdrafts.
The sensitivity analysis have been prepared on the basis that the amount of net debt, the ratio of fixed to floating interest rates of the debt and the proportion of financial instruments in foreign currencies are all constant at 31 December 2015 and 31 December 2014.
At 31 December 2015
Notes to the Consolidated Financial Statements
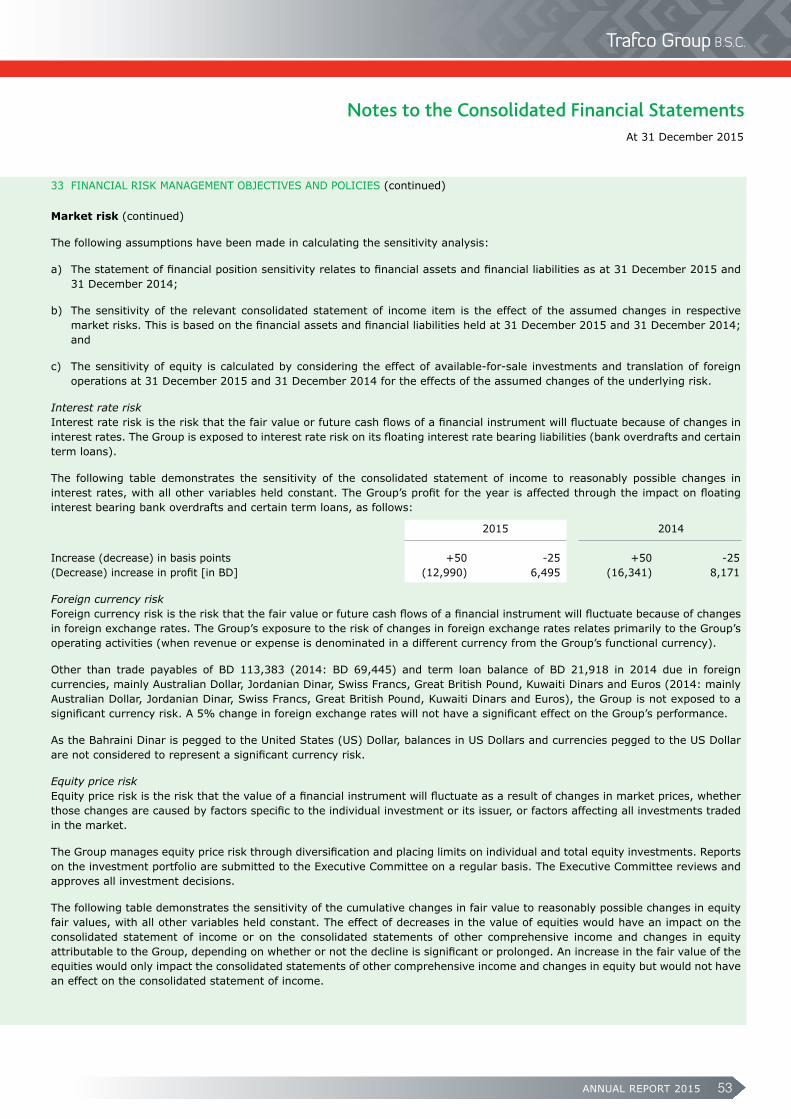
ANNUAL REPORT 2015 53
33 FINANCIAL RISK MANAGEMENT OBJECTIVES AND POLICIES (continued)
Market risk (continued) The following assumptions have been made in calculating the sensitivity analysis: a) The statement of financial position sensitivity relates to financial assets and financial liabilities as at 31 December 2015 and 31 December 2014; b) The sensitivity of the relevant consolidated statement of income item is the effect of the assumed changes in respective market risks. This is based on the financial assets and financial liabilities held at 31 December 2015 and 31 December 2014; and c) The sensitivity of equity is calculated by considering the effect of available-for-sale investments and translation of foreign operations at 31 December 2015 and 31 December 2014 for the effects of the assumed changes of the underlying risk. Interest rate risk Interest rate risk is the risk that the fair value or future cash flows of a financial instrument will fluctuate because of changes in interest rates. The Group is exposed to interest rate risk on its floating interest rate bearing liabilities (bank overdrafts and certain term loans). The following table demonstrates the sensitivity of the consolidated statement of income to reasonably possible changes in interest rates, with all other variables held constant. The Group’s profit for the year is affected through the impact on floating interest bearing bank overdrafts and certain term loans, as follows: 2015 2014
Increase (decrease) in basis points +50 -25 +50 -25(Decrease) increase in profit [in BD] (12,990) 6,495 (16,341) 8,171
Foreign currency risk Foreign currency risk is the risk that the fair value or future cash flows of a financial instrument will fluctuate because of changes in foreign exchange rates. The Group’s exposure to the risk of changes in foreign exchange rates relates primarily to the Group’s operating activities (when revenue or expense is denominated in a different currency from the Group’s functional currency). Other than trade payables of BD 113,383 (2014: BD 69,445) and term loan balance of BD 21,918 in 2014 due in foreign currencies, mainly Australian Dollar, Jordanian Dinar, Swiss Francs, Great British Pound, Kuwaiti Dinars and Euros (2014: mainly Australian Dollar, Jordanian Dinar, Swiss Francs, Great British Pound, Kuwaiti Dinars and Euros), the Group is not exposed to a significant currency risk. A 5% change in foreign exchange rates will not have a significant effect on the Group’s performance. As the Bahraini Dinar is pegged to the United States (US) Dollar, balances in US Dollars and currencies pegged to the US Dollar are not considered to represent a significant currency risk. Equity price risk Equity price risk is the risk that the value of a financial instrument will fluctuate as a result of changes in market prices, whether those changes are caused by factors specific to the individual investment or its issuer, or factors affecting all investments traded in the market. The Group manages equity price risk through diversification and placing limits on individual and total equity investments. Reports on the investment portfolio are submitted to the Executive Committee on a regular basis. The Executive Committee reviews and approves all investment decisions. The following table demonstrates the sensitivity of the cumulative changes in fair value to reasonably possible changes in equity fair values, with all other variables held constant. The effect of decreases in the value of equities would have an impact on the consolidated statement of income or on the consolidated statements of other comprehensive income and changes in equity attributable to the Group, depending on whether or not the decline is significant or prolonged. An increase in the fair value of the equities would only impact the consolidated statements of other comprehensive income and changes in equity but would not have an effect on the consolidated statement of income.
At 31 December 2015
Notes to the Consolidated Financial Statements
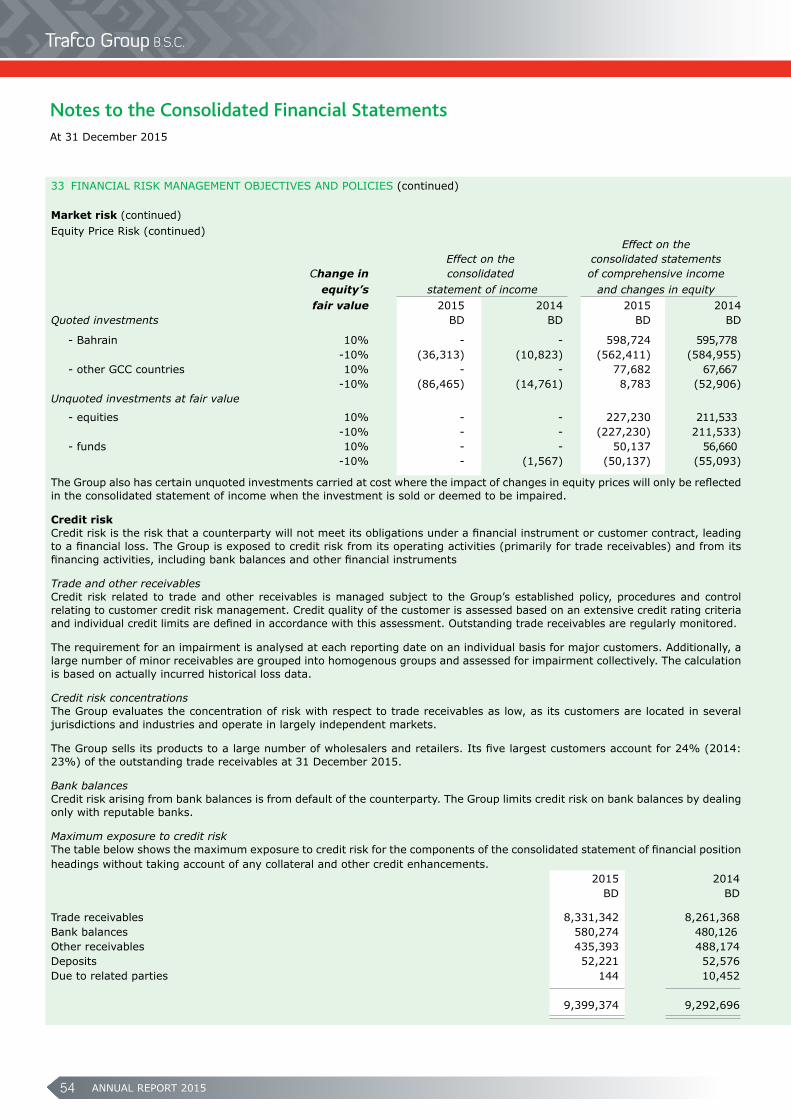
ANNUAL REPORT 201554
33 FINANCIAL RISK MANAGEMENT OBJECTIVES AND POLICIES (continued)
Market risk (continued) Equity Price Risk (continued) Effect on the Effect on the consolidated statements Change in consolidated of comprehensive income equity’s statement of income and changes in equity fair value 2015 2014 2015 2014Quoted investments BD BD BD BD - Bahrain 10% - - 598,724 595,778 -10% (36,313) (10,823) (562,411) (584,955) - other GCC countries 10% - - 77,682 67,667 -10% (86,465) (14,761) 8,783 (52,906)Unquoted investments at fair value
- equities 10% - - 227,230 211,533 -10% - - (227,230) 211,533) - funds 10% - - 50,137 56,660 -10% - (1,567) (50,137) (55,093) The Group also has certain unquoted investments carried at cost where the impact of changes in equity prices will only be reflected in the consolidated statement of income when the investment is sold or deemed to be impaired.
Credit risk Credit risk is the risk that a counterparty will not meet its obligations under a financial instrument or customer contract, leading to a financial loss. The Group is exposed to credit risk from its operating activities (primarily for trade receivables) and from its financing activities, including bank balances and other financial instruments
Trade and other receivablesCredit risk related to trade and other receivables is managed subject to the Group’s established policy, procedures and control relating to customer credit risk management. Credit quality of the customer is assessed based on an extensive credit rating criteria and individual credit limits are defined in accordance with this assessment. Outstanding trade receivables are regularly monitored.
The requirement for an impairment is analysed at each reporting date on an individual basis for major customers. Additionally, a large number of minor receivables are grouped into homogenous groups and assessed for impairment collectively. The calculation is based on actually incurred historical loss data.
Credit risk concentrations The Group evaluates the concentration of risk with respect to trade receivables as low, as its customers are located in several jurisdictions and industries and operate in largely independent markets.
The Group sells its products to a large number of wholesalers and retailers. Its five largest customers account for 24% (2014: 23%) of the outstanding trade receivables at 31 December 2015.
Bank balances Credit risk arising from bank balances is from default of the counterparty. The Group limits credit risk on bank balances by dealing only with reputable banks.
Maximum exposure to credit risk The table below shows the maximum exposure to credit risk for the components of the consolidated statement of financial position headings without taking account of any collateral and other credit enhancements. 2015 2014 BD BD Trade receivables 8,331,342 8,261,368 Bank balances 580,274 480,126 Other receivables 435,393 488,174 Deposits 52,221 52,576 Due to related parties 144 10,452
9,399,374 9,292,696
At 31 December 2015
Notes to the Consolidated Financial Statements
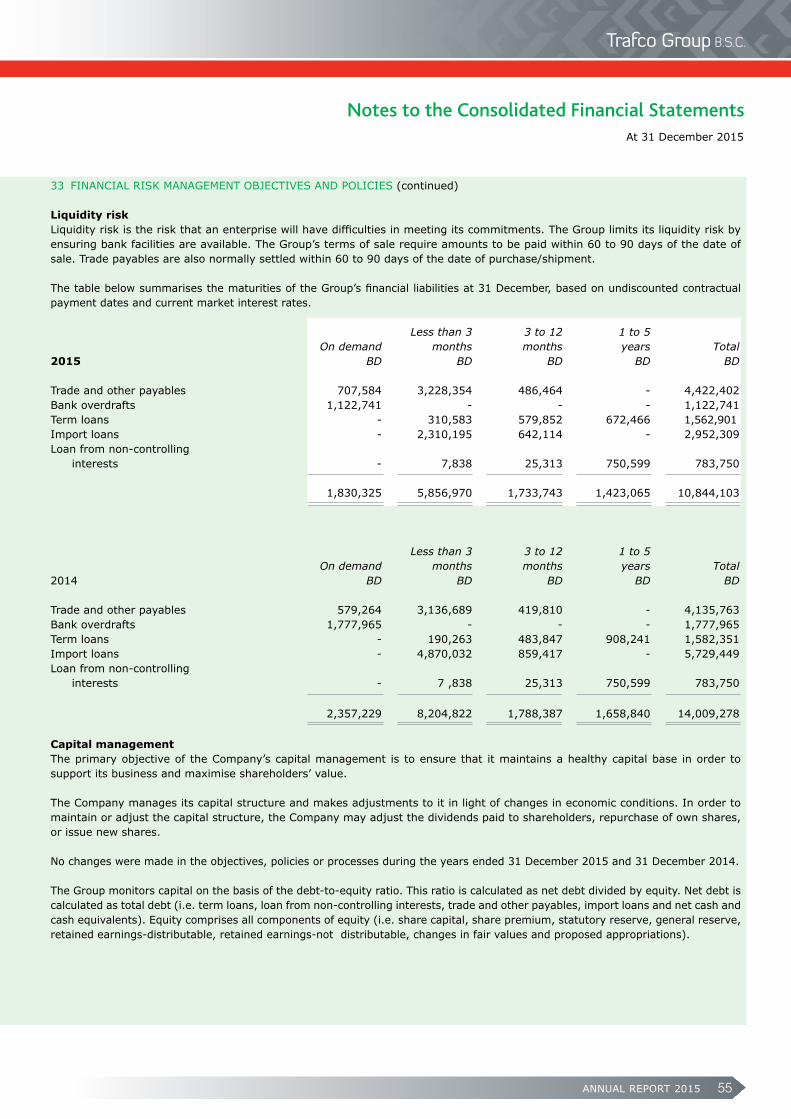
ANNUAL REPORT 2015 55
33 FINANCIAL RISK MANAGEMENT OBJECTIVES AND POLICIES (continued)
Liquidity risk Liquidity risk is the risk that an enterprise will have difficulties in meeting its commitments. The Group limits its liquidity risk by ensuring bank facilities are available. The Group’s terms of sale require amounts to be paid within 60 to 90 days of the date of sale. Trade payables are also normally settled within 60 to 90 days of the date of purchase/shipment.
The table below summarises the maturities of the Group’s financial liabilities at 31 December, based on undiscounted contractual payment dates and current market interest rates. Less than 3 3 to 12 1 to 5 On demand months months years Total2015 BD BD BD BD BD
Trade and other payables 707,584 3,228,354 486,464 - 4,422,402 Bank overdrafts 1,122,741 - - - 1,122,741 Term loans - 310,583 579,852 672,466 1,562,901 Import loans - 2,310,195 642,114 - 2,952,309 Loan from non-controlling interests - 7,838 25,313 750,599 783,750 1,830,325 5,856,970 1,733,743 1,423,065 10,844,103
Less than 3 3 to 12 1 to 5 On demand months months years Total2014 BD BD BD BD BD Trade and other payables 579,264 3,136,689 419,810 - 4,135,763Bank overdrafts 1,777,965 - - - 1,777,965 Term loans - 190,263 483,847 908,241 1,582,351 Import loans - 4,870,032 859,417 - 5,729,449Loan from non-controlling interests - 7 ,838 25,313 750,599 783,750 2,357,229 8,204,822 1,788,387 1,658,840 14,009,278
Capital management The primary objective of the Company’s capital management is to ensure that it maintains a healthy capital base in order to support its business and maximise shareholders’ value. The Company manages its capital structure and makes adjustments to it in light of changes in economic conditions. In order to maintain or adjust the capital structure, the Company may adjust the dividends paid to shareholders, repurchase of own shares, or issue new shares. No changes were made in the objectives, policies or processes during the years ended 31 December 2015 and 31 December 2014. The Group monitors capital on the basis of the debt-to-equity ratio. This ratio is calculated as net debt divided by equity. Net debt is calculated as total debt (i.e. term loans, loan from non-controlling interests, trade and other payables, import loans and net cash and cash equivalents). Equity comprises all components of equity (i.e. share capital, share premium, statutory reserve, general reserve, retained earnings-distributable, retained earnings-not distributable, changes in fair values and proposed appropriations).
At 31 December 2015
Notes to the Consolidated Financial Statements

ANNUAL REPORT 201556
33 FINANCIAL RISK MANAGEMENT OBJECTIVES AND POLICIES (continued)
Capital management (continued) 2015 2014 BD BD Term loans 1,479,423 1,511,741Loan from non-controlling interests 627,000 627,000 Trade and other payables 5,441,285 4,996,513Import loans 2,927,426 5,681,159Net bank overdrafts 485,396 1,186,091 Net debt 10,960,530 14,002,504 Total equity attributable to the owners of the parent 24,007,052 23,401,557
Debt-to-equity ratio 46% 60%
34 FAIR VALUES OF FINANCIAL INSTRUMENTS The fair values of the assets and liabilities are at the amounts at which the instrument could be exchanged in a current transaction between willing parties, other than in a forced or liquidation sale.
Fair value of financial instruments Fair value of financial instruments is estimated based on the following methods and assumptions:
a) Bank balances and cash, bank overdrafts, a certain portion of trade and other receivables and a certain portion of trade and other payables approximate their carrying amounts largely due to the short-term maturities of these instruments as at 31 December 2015 and 31 December 2014;
b) Term loans, loan from non-controlling interests, import loans are evaluated by the Group based on parameters such as interest rates. The carrying amounts are not materially different from their fair values as at 31 December 2015 and 31 December 2014; and
c) Fair value of quoted available-for-sale investments is derived from quoted market prices in active markets or in the case of unquoted available-for-sale investments, using appropriate valuation techniques.
Fair values of non-financial assets or liabilitiesThe Group does not have any non-financial assets or liabilities which have been measured at fair value as at 31 December 2015 and 31 December 2014.
Fair value hierarchyFor fair value hierarchy of the Group’s assets and liabilities refer to note 12.
Financial instruments by category Financial assets and financial liabilities are measured on an ongoing basis either at fair value or at amortised cost. The principal accounting policies in note 2 describe how the classes of financial instruments are measured, and how income and expenses, including fair value gains and losses, are recognised. The following table analyses the financial assets and liabilities in the consolidated statement of financial position by the class of financial instrument to which they are assigned, and therefore by the measurement basis. Financial assets Loans and receivables Available-for-sale investments Total
At 31 December 2015 BD BD BDAvailable-for-sale investments - 9,855,448 9,855,448 Trade and other receivables 8,819,100 - 8,819,100Bank balances and cash 637,345 - 637,345 9,456,445 9,855,448 19,311,893 Loans and receivables Available-for-sale investments TotalAt 31 December 2014 BD BD BDAvailable-for-sale investments - 9,669,590 9,669,590Trade and other receivables 8,812,570 - 8,812,570Bank balances and cash 591,874 - 591,874 9,404,444 9,669,590 19,074,034
At 31 December 2015
Notes to the Consolidated Financial Statements
ANNUAL REPORT 2015 57
34 FAIR VALUES OF FINANCIAL INSTRUMENTS (continued)
Financial liabilities at amortised cost 2015 2014 BD BD
Trade and other payables 4,422,402 4,135,763Import loans 2,927,426 5,681,159Term loans 1,479,423 1,511,741 Bank overdrafts 1,122,741 1,777,965Loan from non-controlling interests 627,000 627,000 10,578,992 13,733,62835 SEGMENT REPORTING For management purposes, the Group is organised into business units based on their products and services and has six reportable operating segments as follows:
Imported foodstuff - Wholesale Import and distribution of foodstuff.
Imported foodstuff - Retail Import and distribution of foodstuff through supermarkets.
Investments Investment in quoted and unquoted securities
(including investments in an associate).
Dairy products and beverages Production, processing and distribution of dairy products,
juices, ice-cream, bottling of water and other items.
Fruits and vegetables Import and distribution of fruits, vegetables and other food items.
Storage and logistics Providing storage and logistics services.
Discontinued operations Investment in an associate which is under liquidation. No operating segments have been aggregated to form the above reportable operating segments. Management monitors the operating results of its business units separately for the purpose of making decisions about resource allocation and performance assessment. Segment performance is evaluated based on operating profit or loss which in certain respects, as explained later in a table, is measured differently from operating profit or loss in the consolidated financial statements. Transfer prices between operating segments are on an arm’s length basis in a manner similar to transactions with third parties. The Group’s geographical segments are based on the location of the Group’s assets. Sales to external customers disclosed in geographical segments are based on the geographical location of its customers. Segment assets include all operating assets used by a segment and consist primarily of property, plant and equipment, inventories, trade and other receivables and bank balances and cash. Whilst the majority of the assets can be directly attributed to individual business segments, the carrying amounts of certain assets used jointly by two or more segments are allocated to the segments on a reasonable basis. Revenue from operations for the year ended 31 December 2015 in the State of Kuwait amounted to BD 2,184,974 (2014: BD 2,108,416) and loss for the year ended 31 December 2015 amounted to BD 418,941 (2014: BD 350,352). All remaining revenue and profit for the year is generated from the primary geographical segment in the Kingdom of Bahrain. Total assets in the State of Kuwait amounted to BD 936,282 (2014: BD 1,005,438) and total liabilities amounted to BD 853,140 (2014: BD 922,926). All remaining assets and liabilities arise from the primary geographical segment in the Kingdom of Bahrain. Inter-segment revenues, transactions, assets and liabilities are eliminated upon consolidation and reflected in the adjustment and eliminations column.
At 31 December 2015
Notes to the Consolidated Financial Statements
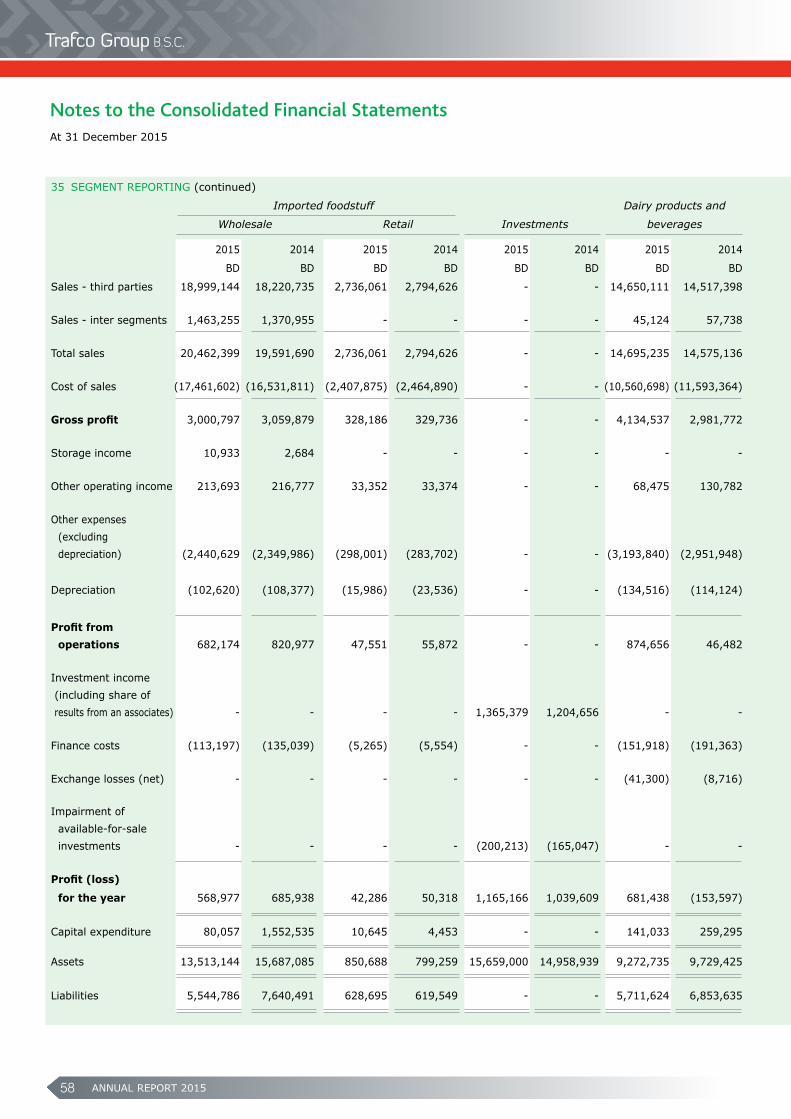
ANNUAL REPORT 201558
35 SEGMENT REPORTING (continued)
Imported foodstuff Dairy products and Fruits and Adjustments and
Wholesale Retail Investments beverages vegetables Storage and logistics Discontinued operations eliminations Total
2015 2014 2015 2014 2015 2014 2015 2014 2015 2014 2015 2014 2015 2014 2015 2014 2015 2014
BD BD BD BD BD BD BD BD BD BD BD BD BD BD BD BD BD BD
Sales - third parties 18,999,144 18,220,735 2,736,061 2,794,626 - - 14,650,111 14,517,398 4,676,171 4,720,074 - - - - - - 41,061,487 40,252,833
Sales - inter segments 1,463,255 1,370,955 - - - - 45,124 57,738 92,142 62,192 - - - - (1,600,521) (1,490,885) - -
Total sales 20,462,399 19,591,690 2,736,061 2,794,626 - - 14,695,235 14,575,136 4,768,313 4,782,266 - - - - (1,600,521) (1,490,885) 41,061,487 40,252,833
Cost of sales (17,461,602) (16,531,811) (2,407,875) (2,464,890) - - (10,560,698) (11,593,364) (4,076,682) (4,057,957) - - - - 1,600,521 1,490,885 (32,906,336) (33,157,137)
Grossprofit 3,000,797 3,059,879 328,186 329,736 - - 4,134,537 2,981,772 691,631 724,309 - - - - - - 8,155,151 7,095,696
Storage income 10,933 2,684 - - - - - - - - 663,947 527,629 - - (152,035) (133,826) 522,845 396,487
Other operating income 213,693 216,777 33,352 33,374 - - 68,475 130,782 8,203 1,475 21,369 33,795 - - (223,425) (230,761) 121,667 185,442
Other expenses (excluding depreciation) (2,440,629 (2,349,986) (298,001) (283,702) - - (3,193,840) (2,951,948) (577,207) (552,299) (454,266) (423,893) - - 199,248 176,828 (6,764,695) (6,385,000)
Depreciation (102,620) (108,377) (15,986) (23,536) - - (134,516) (114,124) (70,807) (76,727) (25,764) (25,504) - - (16,511) (16,511) (366,204) (364,779)
Profitfrom operations 682,174 820,977 47,551 55,872 - - 874,656 46,482 51,820 96,758 205,286 112,027 - - (192,723) (204,270) 1,668,764 927,846
Investment income (including share of results from an associates) - - - - 1,365,379 1,204,656 - - - - - - - (116,829) (435,312) 65,387 930,067 1,153,214
Finance costs (113,197) (135,039) (5,265) (5,554) - - (151,918) (191,363) (58,038) (58,773) (131,802) (143,464) - - 176,213 187,759 (284,007) (346,434)
Exchange losses (net) - - - - - - (41,300) (8,716) - - - - - - - - (41,300) (8,716)
Impairment of available-for-sale investments - - - - (200,213) (165,047) - - - - - - - - - - (200,213) (165,047)
Profit(loss)
for the year 568,977 685,938 42,286 50,318 1,165,166 1,039,609 681,438 (153,597) (6,218) 37,985 73,484 (31,437) - (116,829) (451,822) 48,876 2,073,311 1,560,863
Capital expenditure 80,057 1,552,535 10,645 4,453 - - 141,033 259,295 18,973 49,684 39,087 57,704 - - - - 289,795 1,923,671 Assets 13,513,144 15,687,085 850,688 799,259 15,659,000 14,958,939 9,272,735 9,729,425 2,953,958 2,677,721 4,213,529 4,376,609 - - (8,203,434) (8,012,984) 38,259,620 40,216,054
Liabilities 5,544,786 7,640,491 628,695 619,549 - - 5,711,624 6,853,635 2,176,686 1,877,721 3,377,300 3,613,866 - - (4,762,471) (5,009,125) 12,676,620 15,596,137
At 31 December 2015
Notes to the Consolidated Financial Statements
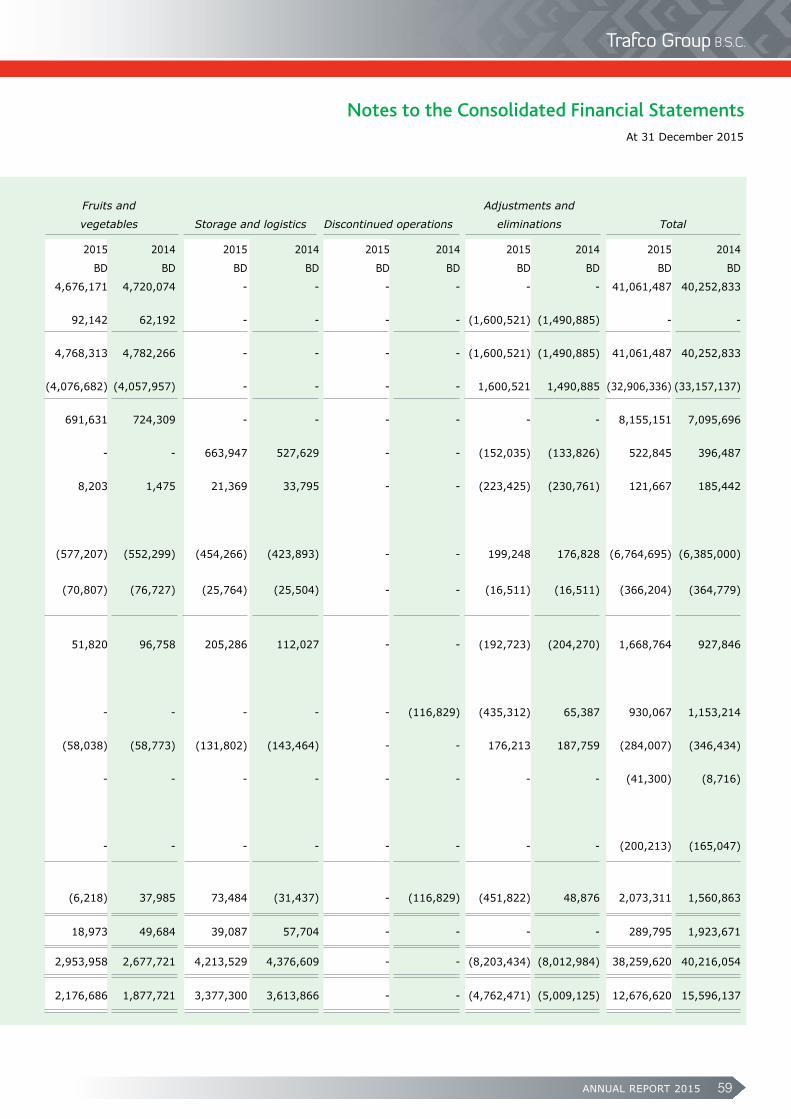
ANNUAL REPORT 2015 59
35 SEGMENT REPORTING (continued)
Imported foodstuff Dairy products and Fruits and Adjustments and
Wholesale Retail Investments beverages vegetables Storage and logistics Discontinued operations eliminations Total
2015 2014 2015 2014 2015 2014 2015 2014 2015 2014 2015 2014 2015 2014 2015 2014 2015 2014
BD BD BD BD BD BD BD BD BD BD BD BD BD BD BD BD BD BD
Sales - third parties 18,999,144 18,220,735 2,736,061 2,794,626 - - 14,650,111 14,517,398 4,676,171 4,720,074 - - - - - - 41,061,487 40,252,833
Sales - inter segments 1,463,255 1,370,955 - - - - 45,124 57,738 92,142 62,192 - - - - (1,600,521) (1,490,885) - -
Total sales 20,462,399 19,591,690 2,736,061 2,794,626 - - 14,695,235 14,575,136 4,768,313 4,782,266 - - - - (1,600,521) (1,490,885) 41,061,487 40,252,833
Cost of sales (17,461,602) (16,531,811) (2,407,875) (2,464,890) - - (10,560,698) (11,593,364) (4,076,682) (4,057,957) - - - - 1,600,521 1,490,885 (32,906,336) (33,157,137)
Grossprofit 3,000,797 3,059,879 328,186 329,736 - - 4,134,537 2,981,772 691,631 724,309 - - - - - - 8,155,151 7,095,696
Storage income 10,933 2,684 - - - - - - - - 663,947 527,629 - - (152,035) (133,826) 522,845 396,487
Other operating income 213,693 216,777 33,352 33,374 - - 68,475 130,782 8,203 1,475 21,369 33,795 - - (223,425) (230,761) 121,667 185,442
Other expenses (excluding depreciation) (2,440,629 (2,349,986) (298,001) (283,702) - - (3,193,840) (2,951,948) (577,207) (552,299) (454,266) (423,893) - - 199,248 176,828 (6,764,695) (6,385,000)
Depreciation (102,620) (108,377) (15,986) (23,536) - - (134,516) (114,124) (70,807) (76,727) (25,764) (25,504) - - (16,511) (16,511) (366,204) (364,779)
Profitfrom operations 682,174 820,977 47,551 55,872 - - 874,656 46,482 51,820 96,758 205,286 112,027 - - (192,723) (204,270) 1,668,764 927,846
Investment income (including share of results from an associates) - - - - 1,365,379 1,204,656 - - - - - - - (116,829) (435,312) 65,387 930,067 1,153,214
Finance costs (113,197) (135,039) (5,265) (5,554) - - (151,918) (191,363) (58,038) (58,773) (131,802) (143,464) - - 176,213 187,759 (284,007) (346,434)
Exchange losses (net) - - - - - - (41,300) (8,716) - - - - - - - - (41,300) (8,716)
Impairment of available-for-sale investments - - - - (200,213) (165,047) - - - - - - - - - - (200,213) (165,047)
Profit(loss)
for the year 568,977 685,938 42,286 50,318 1,165,166 1,039,609 681,438 (153,597) (6,218) 37,985 73,484 (31,437) - (116,829) (451,822) 48,876 2,073,311 1,560,863
Capital expenditure 80,057 1,552,535 10,645 4,453 - - 141,033 259,295 18,973 49,684 39,087 57,704 - - - - 289,795 1,923,671 Assets 13,513,144 15,687,085 850,688 799,259 15,659,000 14,958,939 9,272,735 9,729,425 2,953,958 2,677,721 4,213,529 4,376,609 - - (8,203,434) (8,012,984) 38,259,620 40,216,054
Liabilities 5,544,786 7,640,491 628,695 619,549 - - 5,711,624 6,853,635 2,176,686 1,877,721 3,377,300 3,613,866 - - (4,762,471) (5,009,125) 12,676,620 15,596,137
At 31 December 2015
Notes to the Consolidated Financial Statements
ANNUAL REPORT 201560
36 CORPORATE GOVERNANCE DISCLOSURES (i) Board, Board Members and Management Board and Directors’ Responsibilities The Board of Directors is accountable to shareholders for the proper and prudent investment and preservation of shareholder interests. The Board’s role and responsibilities include but are not limited to: - Monitoring the overall business performance; - Monitoring management performance and succession plan for Senior Management; - Monitoring conflicts of interest and preventing abusive related party transactions; - Accurate preparation of the year-end financial statements; - Convening and preparing for the shareholders meetings; - Recommend dividends to shareholders and ensure its execution; - Adapt, implement and monitor compliance with Trafco Code of Business Conduct; - Review the Company’s objectives and policies relating to social responsibilities; and - Select, interview and appoint General Manager and other selected members of the Senior Management. The Directors remain individually and collectively responsible for performing all of the Board of Director’s tasks. Material transactions requiring board approval The following material transactions require review of the Board of Directors, evaluation and approval:
- The Company strategy; - The Annual Budget; - Major resource allocations and capital investments; and - Management responsibilities and training, development and succession plan for Senior Management. Procedures for election or removal of Directors Election/re-election of the Directors take place every three years at the General Meeting of the shareholders. The last election of the directors was held on 26 March 2013. Removal of Directors mandate usually occurs by dismissal at the General Meeting of the shareholders or by the Director’s resignation from the Board.
Code of conduct and procedures adopted by the Board for monitoring compliance The Board of Directors and the Group’s employees are expected to maintain the highest level of corporate ethics and personal behavior. The Group has established a Trafco Code of Business Conduct (‘the Code’) which provides an ethical and legal framework for all employees in the conduct of its business. The Code defines how the Group relates to its employees, shareholders and the community in which the Group operates. The Board of Directors has adopted the Code and a Whistleblower Policy to monitor compliance with the ethical requirements of the Code. The Code provides clear directions on conducting business internationally, interacting with the governments entities, communities, business partners and general workplace behaviour having regard to the best practice of corporate governance models and ethics. The Code also sets out a behavioural framework for all employees in the context of a wide range of ethical and legal issues.
At 31 December 2015
Notes to the Consolidated Financial Statements
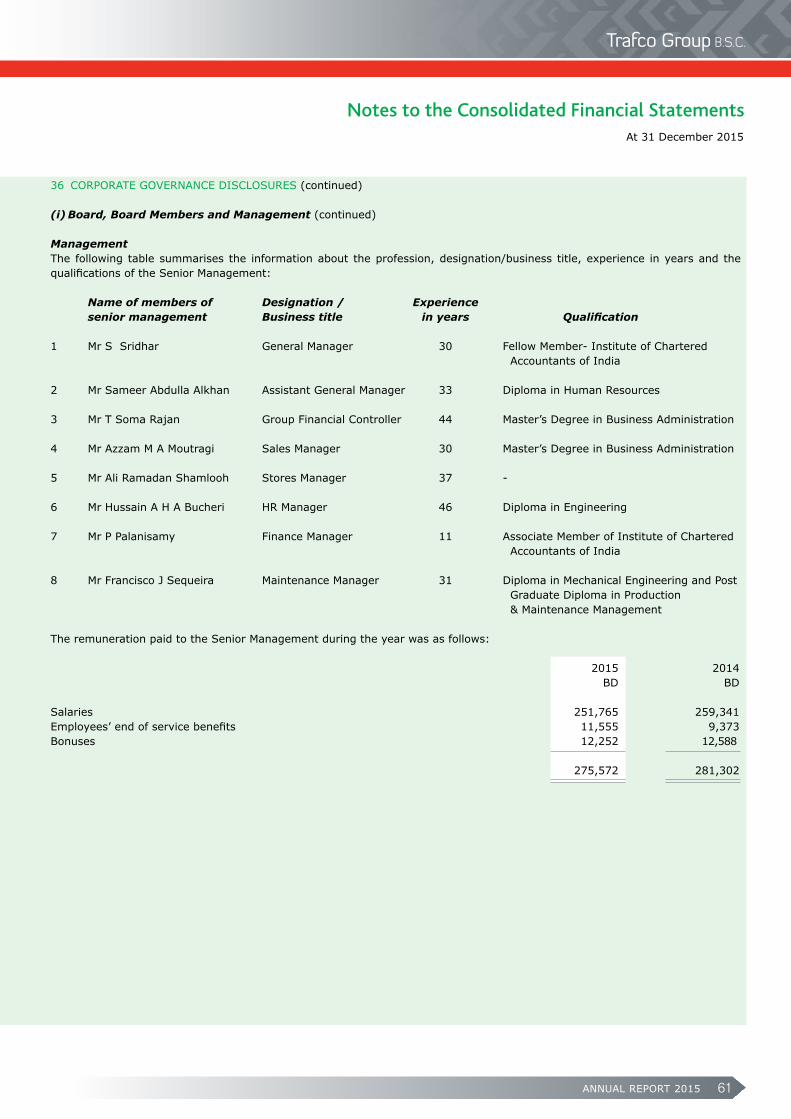
ANNUAL REPORT 2015 61
36 CORPORATE GOVERNANCE DISCLOSURES (continued) (i) Board, Board Members and Management (continued) Management The following table summarises the information about the profession, designation/business title, experience in years and the qualifications of the Senior Management:
Name of members of Designation / Experience seniormanagement Businesstitle inyears Qualification 1 Mr S Sridhar General Manager 30 Fellow Member- Institute of Chartered Accountants of India
2 Mr Sameer Abdulla Alkhan Assistant General Manager 33 Diploma in Human Resources 3 Mr T Soma Rajan Group Financial Controller 44 Master’s Degree in Business Administration 4 Mr Azzam M A Moutragi Sales Manager 30 Master’s Degree in Business Administration 5 Mr Ali Ramadan Shamlooh Stores Manager 37 - 6 Mr Hussain A H A Bucheri HR Manager 46 Diploma in Engineering 7 Mr P Palanisamy Finance Manager 11 Associate Member of Institute of Chartered Accountants of India 8 Mr Francisco J Sequeira Maintenance Manager 31 Diploma in Mechanical Engineering and Post Graduate Diploma in Production & Maintenance Management The remuneration paid to the Senior Management during the year was as follows: 2015 2014 BD BD
Salaries 251,765 259,341 Employees’ end of service benefits 11,555 9,373Bonuses 12,252 12,588 275,572 281,302
At 31 December 2015
Notes to the Consolidated Financial Statements
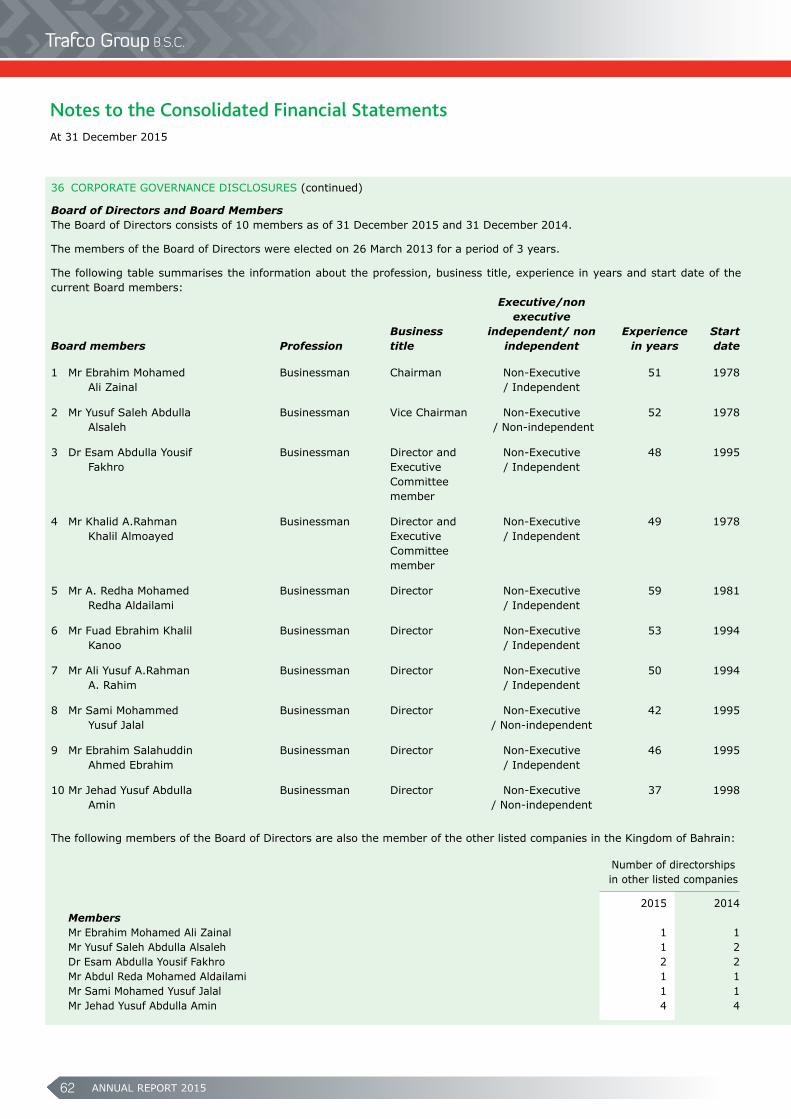
ANNUAL REPORT 201562
36 CORPORATE GOVERNANCE DISCLOSURES (continued)
Board of Directors and Board MembersThe Board of Directors consists of 10 members as of 31 December 2015 and 31 December 2014. The members of the Board of Directors were elected on 26 March 2013 for a period of 3 years.
The following table summarises the information about the profession, business title, experience in years and start date of the current Board members: Executive/non executive Business independent/ non Experience StartBoard members Profession title independent in years date
1 Mr Ebrahim Mohamed Businessman Chairman Non-Executive 51 1978 Ali Zainal / Independent
2 Mr Yusuf Saleh Abdulla Businessman Vice Chairman Non-Executive 52 1978 Alsaleh / Non-independent
3 Dr Esam Abdulla Yousif Businessman Director and Non-Executive 48 1995 Fakhro Executive / Independent Committee member
4 Mr Khalid A.Rahman Businessman Director and Non-Executive 49 1978 Khalil Almoayed Executive / Independent Committee member
5 Mr A. Redha Mohamed Businessman Director Non-Executive 59 1981 Redha Aldailami / Independent
6 Mr Fuad Ebrahim Khalil Businessman Director Non-Executive 53 1994 Kanoo / Independent
7 Mr Ali Yusuf A.Rahman Businessman Director Non-Executive 50 1994 A. Rahim / Independent
8 Mr Sami Mohammed Businessman Director Non-Executive 42 1995 Yusuf Jalal / Non-independent
9 Mr Ebrahim Salahuddin Businessman Director Non-Executive 46 1995 Ahmed Ebrahim / Independent
10 Mr Jehad Yusuf Abdulla Businessman Director Non-Executive 37 1998 Amin / Non-independent
The following members of the Board of Directors are also the member of the other listed companies in the Kingdom of Bahrain:
Number of directorships in other listed companies 2015 2014 Members Mr Ebrahim Mohamed Ali Zainal 1 1 Mr Yusuf Saleh Abdulla Alsaleh 1 2 Dr Esam Abdulla Yousif Fakhro 2 2 Mr Abdul Reda Mohamed Aldailami 1 1 Mr Sami Mohamed Yusuf Jalal 1 1 Mr Jehad Yusuf Abdulla Amin 4 4
At 31 December 2015
Notes to the Consolidated Financial Statements
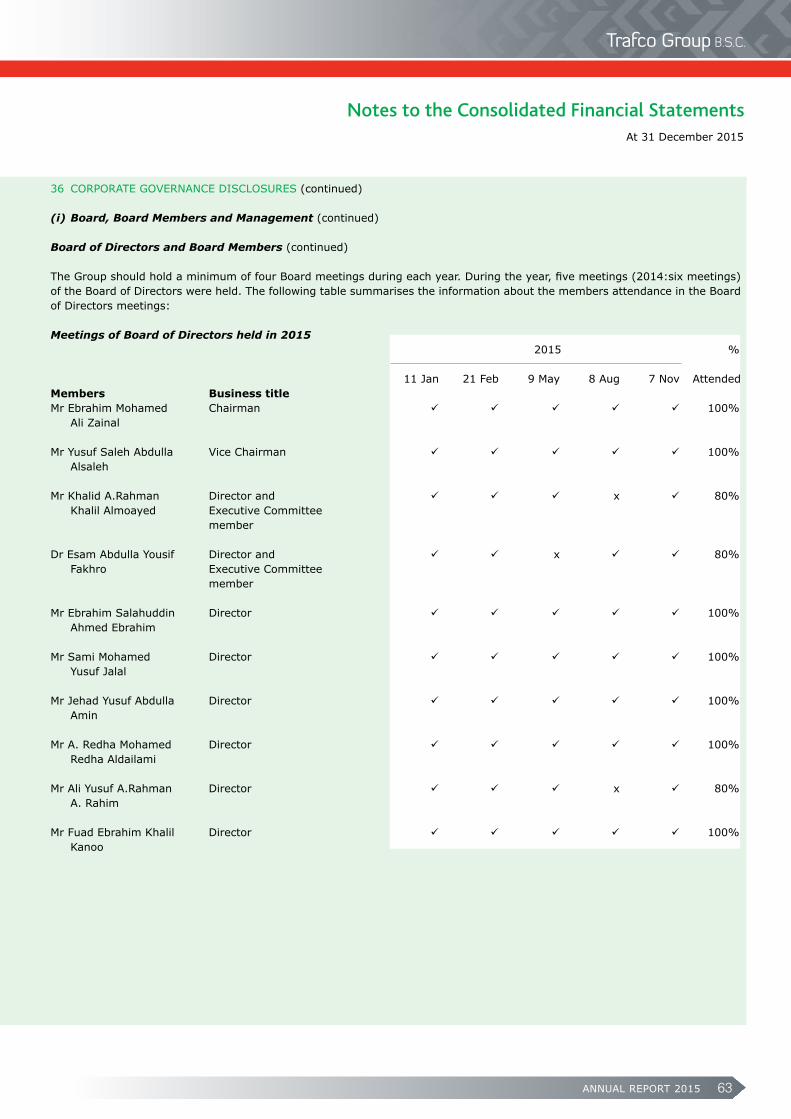
ANNUAL REPORT 2015 63
36 CORPORATE GOVERNANCE DISCLOSURES (continued) (i) Board, Board Members and Management (continued) Board of Directors and Board Members (continued) The Group should hold a minimum of four Board meetings during each year. During the year, five meetings (2014:six meetings)of the Board of Directors were held. The following table summarises the information about the members attendance in the Board of Directors meetings: Meetings of Board of Directors held in 2015 2015 % 11 Jan 21 Feb 9 May 8 Aug 7 Nov AttendedMembers Business title Mr Ebrahim Mohamed Chairman 100% Ali Zainal Mr Yusuf Saleh Abdulla Vice Chairman 100% Alsaleh Mr Khalid A.Rahman Director and x 80% Khalil Almoayed Executive Committee member Dr Esam Abdulla Yousif Director and x 80% Fakhro Executive Committee member Mr Ebrahim Salahuddin Director 100% Ahmed Ebrahim Mr Sami Mohamed Director 100% Yusuf Jalal Mr Jehad Yusuf Abdulla Director 100% Amin Mr A. Redha Mohamed Director 100% Redha Aldailami Mr Ali Yusuf A.Rahman Director x 80% A. Rahim Mr Fuad Ebrahim Khalil Director 100% Kanoo
At 31 December 2015
Notes to the Consolidated Financial Statements
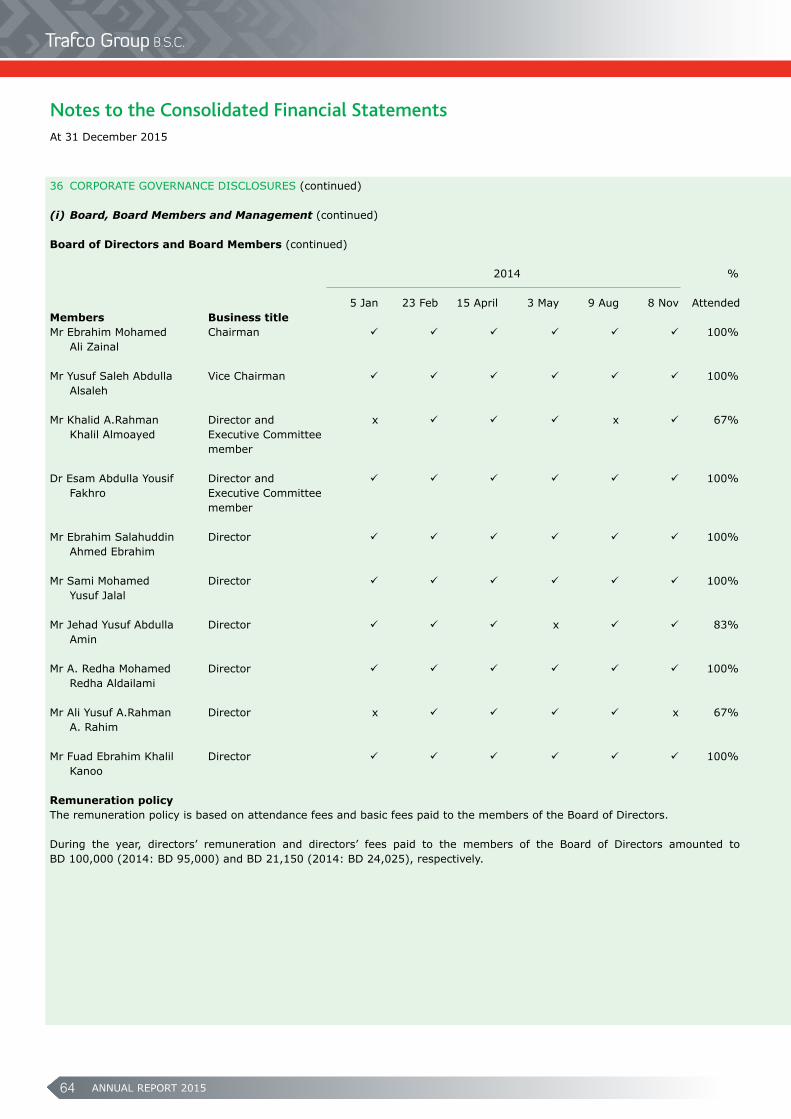
ANNUAL REPORT 201564
36 CORPORATE GOVERNANCE DISCLOSURES (continued) (i) Board, Board Members and Management (continued) Board of Directors and Board Members (continued) 2014 % 5 Jan 23 Feb 15 April 3 May 9 Aug 8 Nov AttendedMembers Business title Mr Ebrahim Mohamed Chairman 100% Ali Zainal Mr Yusuf Saleh Abdulla Vice Chairman 100% Alsaleh Mr Khalid A.Rahman Director and x x 67% Khalil Almoayed Executive Committee member Dr Esam Abdulla Yousif Director and 100% Fakhro Executive Committee member Mr Ebrahim Salahuddin Director 100% Ahmed Ebrahim Mr Sami Mohamed Director 100% Yusuf Jalal Mr Jehad Yusuf Abdulla Director x 83% Amin Mr A. Redha Mohamed Director 100% Redha Aldailami Mr Ali Yusuf A.Rahman Director x x 67% A. Rahim Mr Fuad Ebrahim Khalil Director 100% Kanoo
Remuneration policy The remuneration policy is based on attendance fees and basic fees paid to the members of the Board of Directors.
During the year, directors’ remuneration and directors’ fees paid to the members of the Board of Directors amounted to BD 100,000 (2014: BD 95,000) and BD 21,150 (2014: BD 24,025), respectively.
At 31 December 2015
Notes to the Consolidated Financial Statements
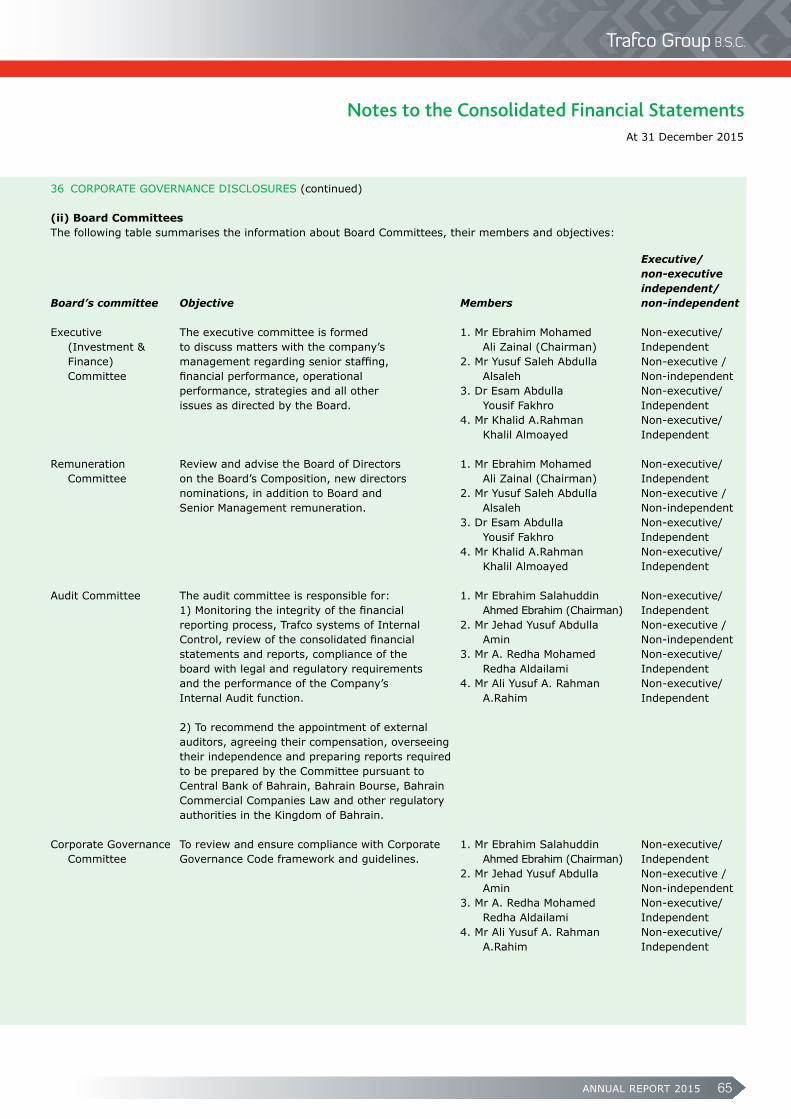
ANNUAL REPORT 2015 65
36 CORPORATE GOVERNANCE DISCLOSURES (continued) (ii) Board Committees The following table summarises the information about Board Committees, their members and objectives:
Executive/ non-executive independent/ Board’s committee Objective Members non-independent Executive The executive committee is formed 1. Mr Ebrahim Mohamed Non-executive/ (Investment & to discuss matters with the company’s Ali Zainal (Chairman) Independent Finance) management regarding senior staffing, 2. Mr Yusuf Saleh Abdulla Non-executive / Committee financial performance, operational Alsaleh Non-independent performance, strategies and all other 3. Dr Esam Abdulla Non-executive/ issues as directed by the Board. Yousif Fakhro Independent 4. Mr Khalid A.Rahman Non-executive/ Khalil Almoayed Independent
Remuneration Review and advise the Board of Directors 1. Mr Ebrahim Mohamed Non-executive/ Committee on the Board’s Composition, new directors Ali Zainal (Chairman) Independent nominations, in addition to Board and 2. Mr Yusuf Saleh Abdulla Non-executive / Senior Management remuneration. Alsaleh Non-independent 3. Dr Esam Abdulla Non-executive/ Yousif Fakhro Independent 4. Mr Khalid A.Rahman Non-executive/ Khalil Almoayed Independent
Audit Committee The audit committee is responsible for: 1. Mr Ebrahim Salahuddin Non-executive/ 1) Monitoring the integrity of the financial Ahmed Ebrahim (Chairman) Independent reporting process, Trafco systems of Internal 2. Mr Jehad Yusuf Abdulla Non-executive / Control, review of the consolidated financial Amin Non-independent statements and reports, compliance of the 3. Mr A. Redha Mohamed Non-executive/ board with legal and regulatory requirements Redha Aldailami Independent and the performance of the Company’s 4. Mr Ali Yusuf A. Rahman Non-executive/ Internal Audit function. A.Rahim Independent
2) To recommend the appointment of external auditors, agreeing their compensation, overseeing their independence and preparing reports required to be prepared by the Committee pursuant to Central Bank of Bahrain, Bahrain Bourse, Bahrain Commercial Companies Law and other regulatory authorities in the Kingdom of Bahrain.
Corporate Governance To review and ensure compliance with Corporate 1. Mr Ebrahim Salahuddin Non-executive/ Committee Governance Code framework and guidelines. Ahmed Ebrahim (Chairman) Independent 2. Mr Jehad Yusuf Abdulla Non-executive / Amin Non-independent 3. Mr A. Redha Mohamed Non-executive/ Redha Aldailami Independent 4. Mr Ali Yusuf A. Rahman Non-executive/ A.Rahim Independent
At 31 December 2015
Notes to the Consolidated Financial Statements
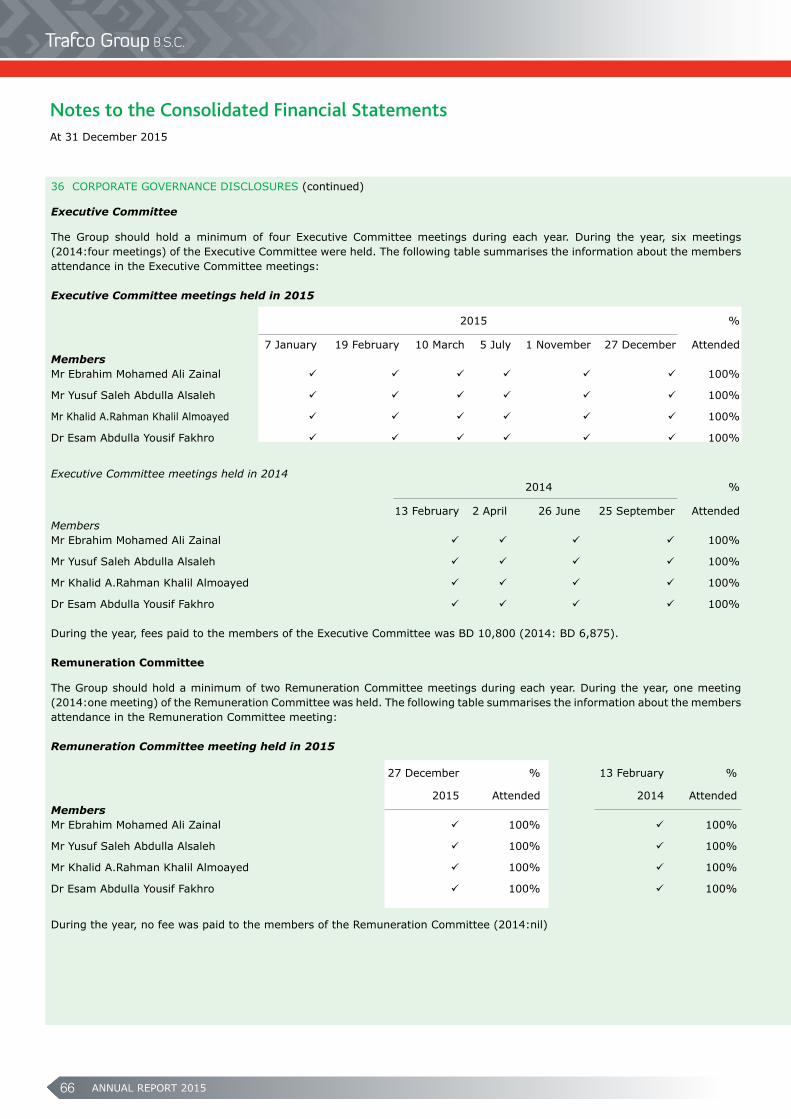
ANNUAL REPORT 201566
36 CORPORATE GOVERNANCE DISCLOSURES (continued) Executive Committee The Group should hold a minimum of four Executive Committee meetings during each year. During the year, six meetings (2014:four meetings) of the Executive Committee were held. The following table summarises the information about the members attendance in the Executive Committee meetings:
Executive Committee meetings held in 2015 2015 % 7 January 19 February 10 March 5 July 1 November 27 December AttendedMembersMr Ebrahim Mohamed Ali Zainal 100% Mr Yusuf Saleh Abdulla Alsaleh 100% Mr Khalid A.Rahman Khalil Almoayed 100% Dr Esam Abdulla Yousif Fakhro 100%
Executive Committee meetings held in 2014 2014 % 13 February 2 April 26 June 25 September AttendedMembers Mr Ebrahim Mohamed Ali Zainal 100% Mr Yusuf Saleh Abdulla Alsaleh 100% Mr Khalid A.Rahman Khalil Almoayed 100% Dr Esam Abdulla Yousif Fakhro 100% During the year, fees paid to the members of the Executive Committee was BD 10,800 (2014: BD 6,875).
Remuneration Committee The Group should hold a minimum of two Remuneration Committee meetings during each year. During the year, one meeting (2014:one meeting) of the Remuneration Committee was held. The following table summarises the information about the members attendance in the Remuneration Committee meeting: Remuneration Committee meeting held in 2015 27 December % 13 February %
2015 Attended 2014 AttendedMembers Mr Ebrahim Mohamed Ali Zainal 100% 100% Mr Yusuf Saleh Abdulla Alsaleh 100% 100% Mr Khalid A.Rahman Khalil Almoayed 100% 100% Dr Esam Abdulla Yousif Fakhro 100% 100%
During the year, no fee was paid to the members of the Remuneration Committee (2014:nil)
At 31 December 2015
Notes to the Consolidated Financial Statements
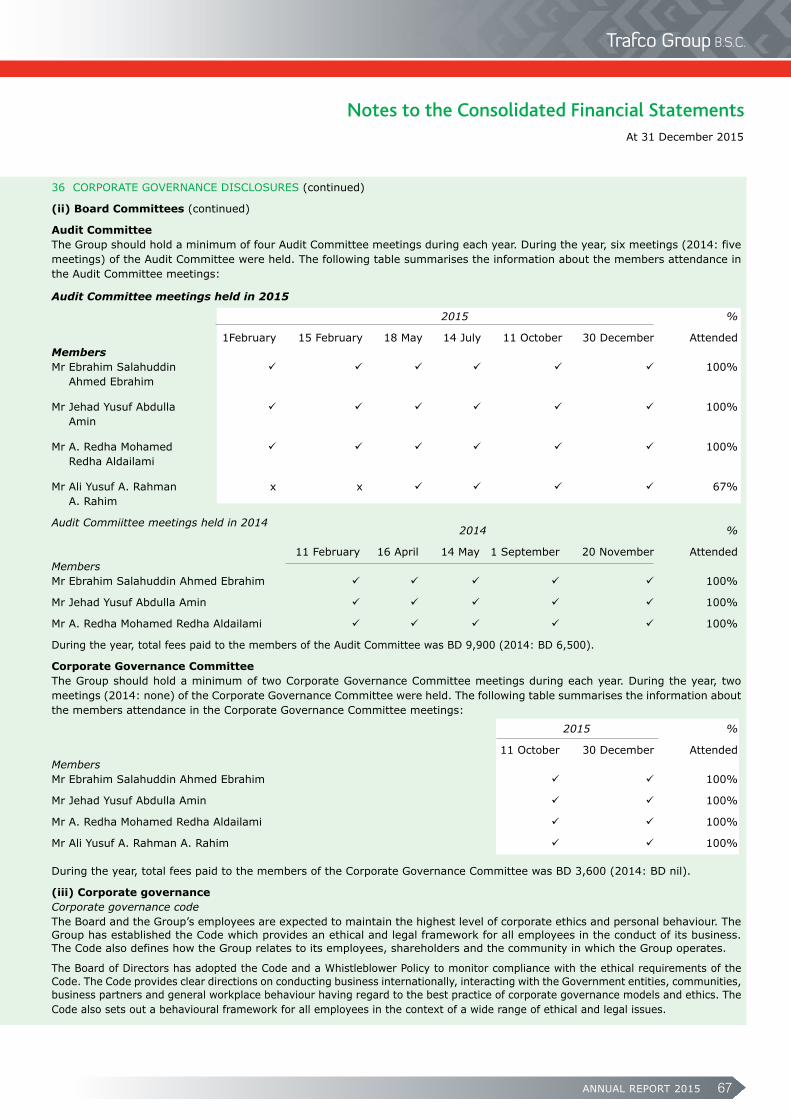
ANNUAL REPORT 2015 67
36 CORPORATE GOVERNANCE DISCLOSURES (continued) (ii) Board Committees (continued) Audit Committee The Group should hold a minimum of four Audit Committee meetings during each year. During the year, six meetings (2014: five meetings) of the Audit Committee were held. The following table summarises the information about the members attendance in the Audit Committee meetings:
Audit Committee meetings held in 2015
2015 %
1February 15 February 18 May 14 July 11 October 30 December AttendedMembers Mr Ebrahim Salahuddin 100% Ahmed Ebrahim
Mr Jehad Yusuf Abdulla 100% Amin
Mr A. Redha Mohamed 100% Redha Aldailami
Mr Ali Yusuf A. Rahman x x 67% A. Rahim Audit Commiittee meetings held in 2014 2014 %
11 February 16 April 14 May 1 September 20 November AttendedMembers Mr Ebrahim Salahuddin Ahmed Ebrahim 100% Mr Jehad Yusuf Abdulla Amin 100% Mr A. Redha Mohamed Redha Aldailami 100% During the year, total fees paid to the members of the Audit Committee was BD 9,900 (2014: BD 6,500).
Corporate Governance Committee The Group should hold a minimum of two Corporate Governance Committee meetings during each year. During the year, two meetings (2014: none) of the Corporate Governance Committee were held. The following table summarises the information about the members attendance in the Corporate Governance Committee meetings:
2015 %
11 October 30 December AttendedMembers Mr Ebrahim Salahuddin Ahmed Ebrahim 100% Mr Jehad Yusuf Abdulla Amin 100% Mr A. Redha Mohamed Redha Aldailami 100% Mr Ali Yusuf A. Rahman A. Rahim 100%
During the year, total fees paid to the members of the Corporate Governance Committee was BD 3,600 (2014: BD nil). (iii) Corporate governance Corporate governance code The Board and the Group’s employees are expected to maintain the highest level of corporate ethics and personal behaviour. The Group has established the Code which provides an ethical and legal framework for all employees in the conduct of its business. The Code also defines how the Group relates to its employees, shareholders and the community in which the Group operates. The Board of Directors has adopted the Code and a Whistleblower Policy to monitor compliance with the ethical requirements of the Code. The Code provides clear directions on conducting business internationally, interacting with the Government entities, communities, business partners and general workplace behaviour having regard to the best practice of corporate governance models and ethics. The Code also sets out a behavioural framework for all employees in the context of a wide range of ethical and legal issues.
At 31 December 2015
Notes to the Consolidated Financial Statements
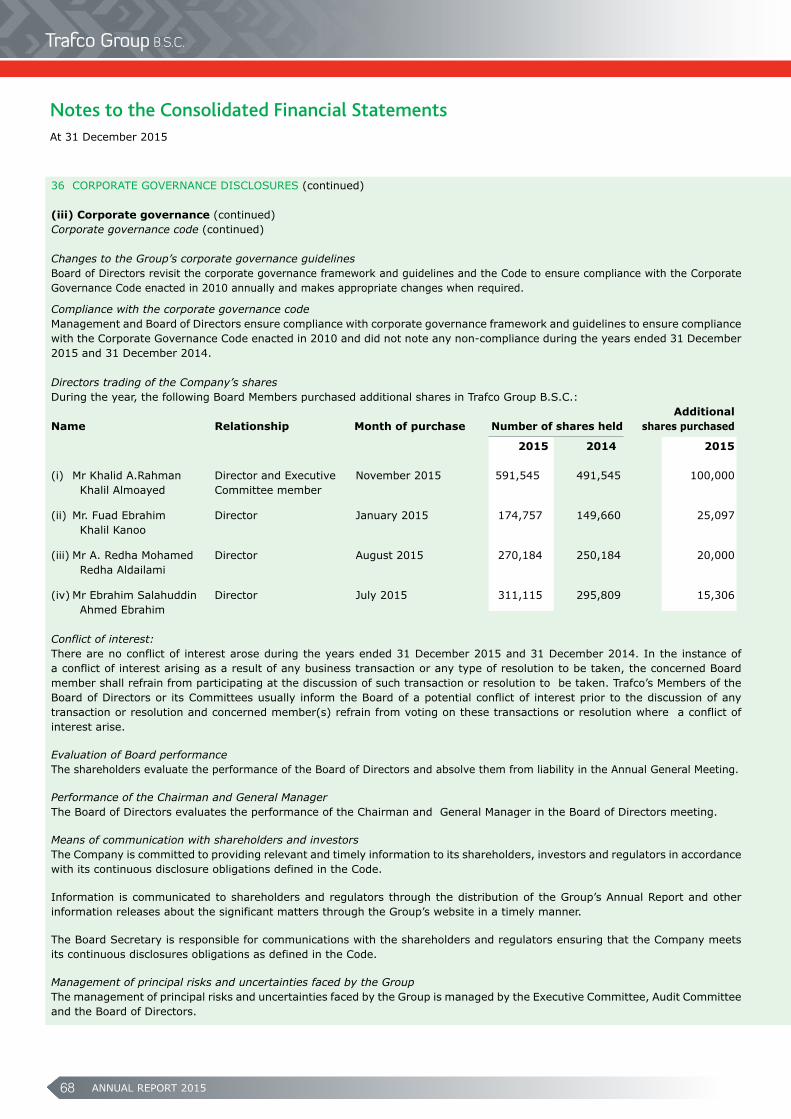
ANNUAL REPORT 201568
36 CORPORATE GOVERNANCE DISCLOSURES (continued) (iii) Corporate governance (continued)Corporate governance code (continued)
Changes to the Group’s corporate governance guidelines Board of Directors revisit the corporate governance framework and guidelines and the Code to ensure compliance with the Corporate Governance Code enacted in 2010 annually and makes appropriate changes when required.
Compliance with the corporate governance code Management and Board of Directors ensure compliance with corporate governance framework and guidelines to ensure compliance with the Corporate Governance Code enacted in 2010 and did not note any non-compliance during the years ended 31 December 2015 and 31 December 2014.
Directors trading of the Company’s shares During the year, the following Board Members purchased additional shares in Trafco Group B.S.C.: AdditionalName Relationship Month of purchase Number of shares held shares purchased
2015 2014 2015 (i) Mr Khalid A.Rahman Director and Executive November 2015 591,545 491,545 100,000 Khalil Almoayed Committee member
(ii) Mr. Fuad Ebrahim Director January 2015 174,757 149,660 25,097 Khalil Kanoo
(iii) Mr A. Redha Mohamed Director August 2015 270,184 250,184 20,000 Redha Aldailami
(iv) Mr Ebrahim Salahuddin Director July 2015 311,115 295,809 15,306 Ahmed Ebrahim
Conflict of interest: There are no conflict of interest arose during the years ended 31 December 2015 and 31 December 2014. In the instance of a conflict of interest arising as a result of any business transaction or any type of resolution to be taken, the concerned Board member shall refrain from participating at the discussion of such transaction or resolution to be taken. Trafco’s Members of the Board of Directors or its Committees usually inform the Board of a potential conflict of interest prior to the discussion of any transaction or resolution and concerned member(s) refrain from voting on these transactions or resolution where a conflict of interest arise. Evaluation of Board performance The shareholders evaluate the performance of the Board of Directors and absolve them from liability in the Annual General Meeting. Performance of the Chairman and General Manager The Board of Directors evaluates the performance of the Chairman and General Manager in the Board of Directors meeting. Means of communication with shareholders and investors The Company is committed to providing relevant and timely information to its shareholders, investors and regulators in accordance with its continuous disclosure obligations defined in the Code. Information is communicated to shareholders and regulators through the distribution of the Group’s Annual Report and other information releases about the significant matters through the Group’s website in a timely manner. The Board Secretary is responsible for communications with the shareholders and regulators ensuring that the Company meets its continuous disclosures obligations as defined in the Code. Management of principal risks and uncertainties faced by the Group The management of principal risks and uncertainties faced by the Group is managed by the Executive Committee, Audit Committee and the Board of Directors.
At 31 December 2015
Notes to the Consolidated Financial Statements